The French REITs - GFR Finance, Groupe de … · The French REITs First Results about the New SIIC...
34
The French REITs First Results about the New SIIC Regime Laurent BATSCH Roland CHOUILLOU Philippe TANNENBAUM Centre de Recherche sur la Gestion (CEREG) (CNRS team 7088) Paris-Dauphine University Working Paper n° 2005-05 1
Transcript of The French REITs - GFR Finance, Groupe de … · The French REITs First Results about the New SIIC...

The French REITs First Results about the New SIIC Regime
Laurent BATSCH
Roland CHOUILLOU
Philippe TANNENBAUM
Centre de Recherche sur la Gestion (CEREG)
(CNRS team 7088)
Paris-Dauphine University
Working Paper n° 2005-05
1

2
TABLE OF CONTENTS
I. BEFORE THE REFORM …
The reform of SIIC status (a reminder)
A typology of listed property companies
Expected effects of SIIC status
II. MARKETS’ REACTION
Quotations
A European comparison
III. LIQUIDITY
Evolution of exchanged volumes
Required time to reach a position
Float evolution
Size of Bid/Ask differential
IV. DISCOUNT
Determination of the type of net assets to be taken into account
NAV calculation
Non-transparent taxation, a factor of discount
Exemption evolution after the reform
Existence of a premium
V. THE FINANCIAL POLICY OF PROPERTY COMPANIES
Evolution of dividends
Property companies indebtedness
Issue of shares
Operations on property companies

3
I. BEFORE THE REFORM...
1. The status reform (a reminder)
1.1 Judicial framework
Reminder. The status of Société d’Investissement Immobilier Côtée (SIIC) is applied
under the following conditions. 1) These companies must be listed : The status is
meant to reactivate the property companies segment on Paris financial market ; 2)
the status is accessible to companies having a capital of at least 15 million euros, a
rather low investment; 3) the companies eligible to the status are real estate
investment trusts and not service trusts, hence the necessity for property companies
having service activities to undergo internal reorganization to drop these from their
service activities; 4) the companies must also be listed in France and the assets
must be located in France, which may be an incentive for the foreign property
companies to join the Paris listing as a SIIC (but without creating a French listed
subsidiary) ; 5) to benefit from the preferential tax system dividend distribution must
be in n+1 of 85% of the rent results and 50% of transfer gains in n+1 and n+2 ; 6) the
status of SIIC is an optional and irrevocable system ; 7) Access to the status is
subject to the payment of a 16.5% exit tax on potential gains payable in 4 annuities ;
in the accounts ; 8) the choice of status had to be made before September 30, 2003
to become effective in 2003 and for the following years before the end of the fiscal
year n to become operative on January 1 n. 9) there is no particular threshold of
floatting stocks.
The two key-dates have been the passing of the 2003 finance law by a vote of the
National Assemby on November 21, 2002 and the publication of the executive order
On July 11, 20031.
1 References: article 11 of the finance law 2002 (JO 31/12/2002), executive order 11 july 2003 (JO July 13 2003), article 208 C of the Code Général des impôts. Available on www.legifrance.gouv.fr

4
1.2 Towards a revival of externalization ?
A measure adopted by the Senate in December 2004 might give a new impetus to
property companies (appliable since 01/01/2005 to 31/12/2007). Indeed, real estate
asset holders would take advantage of preferential taxation, in case of transfer of
property against equities. Which amounts to encouraging groups to make partial
contributions of real estate assets as counterpart for investment with degree of
control in property companies. This measure might encourage some groups to form
their own property company and then turn it into a SIIC. It is already the case of
Carrefour group.
Insérer comparative des différents statuts
1.3 The property companies that have opted for the SIIC regime
From fiscal year 2003 :
Affine ( exit tax = 10.5 M€)
EMGP (35 M€)
Foncière des Régions (37.8 M€)
Gecina (573.2 M€)
Klepierre (119.8 M€)
Silic (100 M€)
Société Foncière Lyonnaise SFL (103 M€)
Sophia (66 M€)
Unibail (382 M€)
A total of some1 430 million euros for 2003 payable in 4 years.
From fiscal year 2004 :
Bail Investissement (64,6 M€)
SIIC de Paris (ex Immobanque) ( 18.3 M€)
Foncière des Régions (2nd perimeter – 8.5 M€)
Foncière des Pimonts (5.9 M€)
An amount close to 100 million euros for the year 2004.
5
In two years exit tax will have enriched the public treasury by 1.5 billion euros, an
amount whose payment will be scaled down over 4 years.
Several subsidiaries of foreign property companies have joined Paris quotation to
take advantage of SIIC status : Hammerson (UK) in December 2003, Wereldhave
(NL) in March 2004, Rodamco in April 2004 (for around 30% of the assets in France,
320 M€), Corio since January 2005 (assets value of 886 M€, exit tax of 28 M€),
VastNed Retail decided to be listed in Paris and Amsterdam, WDP got listed too with
the aim of getting the SIIC regime.
.
2. A typology of listed property companies
2.1 According to the size of financial assets
- the « leaders » : Unibail (7 513 M€), Gecina (7 100 M€), Klepierre (4 600 M€) ;
- the « midcaps » : SFL (2 220 M€), Foncière des Régions (1 430 M€), SILIC (1 420
M€), Bail Investissement (1 410 M€)
- the « minor players » : Pimonts (766 M€), SIIC de Paris (387 M€), EMGP (666 M€).
2.2 According to shareholdership
- Unibail’s shareholdership makes it different from its competitors: it has no
controlling shareholder, floating capital is predominant, it is a managerial control type
but with a strong financial culture.
- In some SIICs you find a majority group with several reference shareholders in it :
SFL, Foncière des Régions, Gecina, SIIC de Paris (the last two have the same
controlling shareholder distribution). But, some of the shareholders of these groups
are likely to sell their stocks (AGF). Other investors could enforce their assets in the
sector (Axa).
- Finally some SIICs are under the total contol of one shareholder: Foncière des
Pimonts, EMGP, Baille Investissement, Klepierre, SILIC, Affine.

6
2.3 According to activity
- The “diversified” : tertiary sector+housing. Three SIICs belong to this category:
Gecina (which took over SIMCO in 2003), Foncière des Régions and SFL.
- The “specialized” : Strong dominance of a tertiary division which is the case of
Klepierre in shopping centers and of Financière des Pimonts in office premises.
- The “differentiated” : two or more tertiary divisions , shopping centers, exhibition
halls, warehouses, parking lots) : SILIC, Bail Investissement, Unibail.
In conclusion, Unibail stands out because of its size and of a largely spread out
shareholdership. Gecina is remarkable for its size and the significant share of
housing in its portfolio. Klepierre is marked by its strategy of trade specialization in
an internationalized space.
Four big financial sectors have a share in the capital of French Property companies.
BNP Paribas is the reference shareholder of Klepierre. The group AGF/Azur-
GMF/Crédit Agricole controls Gecina and Paris SIIC. The Caisse des dépôts et
consignations manages EMGP and Foncière des Pimonts.
Lastly, Groupama holds absolute majority in Silic but its withdrawal is often alluded
to.
3. The expected effects of SIIC status
3.1 A favorable market reaction
- Price effect : The adoption of the status by the legislator and the choice of this
status by every property company must immediately entail a valuation of the price in
reaction to the event around these key dates. It will be necessary to wait till after the
event and compare the price of SIICs mid term with the property companies that
have never opted for this status or with the ones that have already taken advantage
of it. It will also be useful to keep an eye on the evolution of real estate UCITS.
- Value effect : strictly speaking , the price increase is supposed to reflect an increase
of the fundamental value equal to the current value of future fiscal savings (minus
exit tax).

7
Liquidity effect : the volume of transactions reflects the attraction of every security
and here again can be weighed against that of property companies that do not take
advantage of or already take advantage of the fiscal transparency system.
Niche effect: compared to direct ownership of real estate, SIICs lose their fiscal
handicap, they accumulate advantages for they offer three major advantages in
addition to direct holding: Securities liquidity, management professionalism as well as
a risk decrease thanks to park diversification.
Windfall effect :It would be logical if The SIIC fiscal status gave rise to some
particular attraction and brought forth the revival of dormant property companies or
created new ones. New entrants are thus expected.
Porfolio effect : SIICs’ better returns should reinforce their attractiveness for
institutional investors and real estate share should become more prevalent in the
allocation of assets by portfolio managers.
Market effect : The attractiveness of real estate investment on Paris market
should consequently be reinforced comparatively to other markets that do not yet
take advantage of such a status.
3.2 Evolution of the financial policy of property companies
- Of course, the distribution policy moves a step forward, the pay-out ratio must grow
significantly.
- Investors also expected the famous discount of property companies to be mopped
up2.
- The immediate valorization of price should facilitate market demand for capital
(whose increase is favored by a price and capitalization rise). With the new tax
regime, there is no more tax shield provided by debt. So that the financial advantage
for debt disappears. Even if the level of the interest rates should still imply some
bonds issues.
2 Here we speak of the market value exemption of real estate investment against market value capitalization plus the financial debt of the property company

8
- Some property companies might want to stress their yield value potential. They
would be sought because of their generous payouts, their likely growth would be
financed by external inputs, the price would normally be stable.
- Other property companies aim at remaining capable of offering both yield value and
growth value. They maintain that dividend distribution does not absorb all self
financing and that a good management of assets helps in their valorization. Thus
dividends and prices could increase at the same time.
- A revaluation of results is implicit in the new status as a consequence of the exit tax
on potential capital gains that requires a declaration of property value. But in any
case IFRS 40 norm on investment buildings to be enforced from fiscal year 2005
made this move unavoidable.
- Tax suppression entailed that of tax credit ipso facto but here again the extinction
of the tax credit regime concerned all companies in France from 2004 onwards.
3.3 Evolution of the investment policy of property companies
- Logically the change of tax system should facilitate arbitration and accelerate the
turnover of listed property company assets.
- The improvement of the profit-earning capacity of asset management (henceforth
tax-free) widens the gap between the latter and the cost of the debt and reduces
leverage risk.
- In so far as fiscal transparency stimulates the activity of property companies, it
might have an induced acceleration effect on the externalization movement of their
real estate exploitation by groups.
- It does exit an international competition for the assets allocation. French property
companies used to calculate their performances in relation to the profit tax, not their
US, Belgian or Dutch competitors. While the new tax regime let expect higher of
returns.
.
II. Market reaction
1.The prices
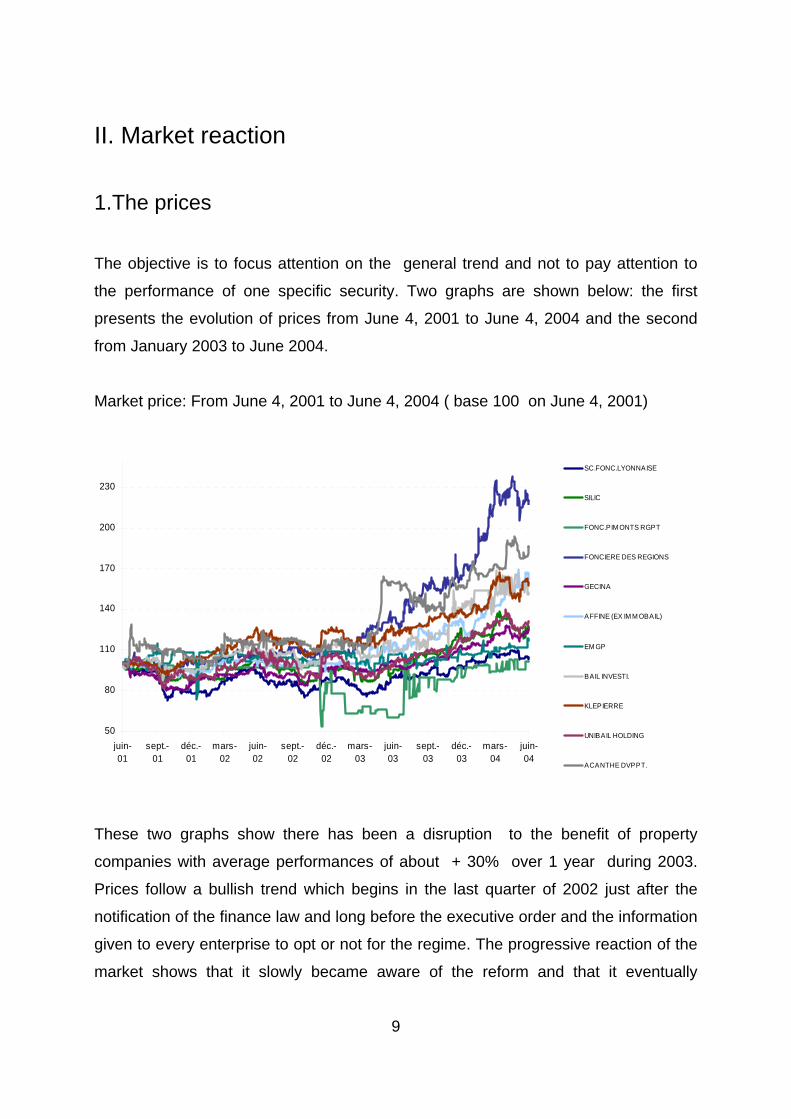
The objective is to focus attention on the general trend and not to pay attention to
the performance of one specific security. Two graphs are shown below: the first
presents the evolution of prices from June 4, 2001 to June 4, 2004 and the second
from January 2003 to June 2004.
Market price: From June 4, 2001 to June 4, 2004 ( base 100 on June 4, 2001)
50
80
110
140
170
200
230
juin-01
sept.-01
déc.-01
mars-02
juin-02
sept.-02
déc.-02
mars-03
juin-03
sept.-03
déc.-03
mars-04
juin-04
SC.FONC.LYONNAISE
SILIC
FONC.PIM ONTS RGPT
FONCIERE DES REGIONS
GECINA
AFFINE (EX IM M OBAIL)
EM GP
BAIL INVESTI.
KLEPIERRE
UNIBAIL HOLDING
ACANTHE DVPPT.
These two graphs show there has been a disruption to the benefit of property
companies with average performances of about + 30% over 1 year during 2003.
Prices follow a bullish trend which begins in the last quarter of 2002 just after the
notification of the finance law and long before the executive order and the information
given to every enterprise to opt or not for the regime. The progressive reaction of the
market shows that it slowly became aware of the reform and that it eventually
9

convinced itself that the various actors of the sector would opt for the exemption
regime.
Market price: from 01/01/03 to 04/06/04 ( base 100 on 01/01/03)
70
100
130
160
190
220
janv.-03 avr.-03 juil.-03 oct.-03 janv.-04 avr.-04
SC.FONC.LYONNAISE
SILIC
FONC.PIM ONTS RGPT
FONCIERE DES REGIONS
GECINA
AFFINE (EX IM M OBAIL)
EM GP
BAIL INVESTI.
KLEPIERRE
UNIBAIL HOLDING
ACANTHE DVPPT.
Table 1. Increase of the prices of various property companies
from01/01/02
To 12/31/02
From01/01/03
To 12/31/03
From01/01/04
To 05/31/04
Capitalization
12/31/03
Unibail 18.84% 9.66% 8.94% 3 391.37 M€
Gécina 10.38% 15.45% 10.21% 3 153.57 M€
Klépierre 20.30% 10.85% 18.76% 2 135.04 M€
SF Lyonnaise 9.18% 16.46% 2.77% 1 226.65 M€
Silic 9.39% 23.37% 4.63% 909.58 M€
F. des Régions 7.99% 59.66% 30.48% 509.5 M€
EMGP 0.62% -2.14% 4.84% 333.27 M€
Acanthe Develpt 11.80% 45.00% 6.32% 230.57 M€
F. des Pimonts -18.18% 24.07% 4.48% 221.97 M€
Affine 5.69% 21.79% 36.00% 109.46 M€
It is interesting to note that the property companies with the highest capitalization
had high performances in 2002 and the very same property companies under-
performed in 2003 (table 1).
10

2. A European comparison
A comparison of the performances of property companies in different European
countries may enable us to study the question from a different angle on the basis of
the EPRA indices of French. Belgian. German and English markets and of the global
European index. The time scale we kept here is relatively long (beginning January 1.
2001) for a better perception of the reform impact.
40
60
80
100
120
140
160
180
200
01/01
/01
01/07
/01
01/01
/02
01/07
/02
01/01
/03
01/07
/03
01/01
/04
01/07
/04
01/01
/05
EXUK Index
EPRA Index
EPGR Index
EPUK Index
EPBL Index
EPFR Index
This graph highlights the over-performance of the EPRA France index compared to
other European indices. In November 2002 a 15% price difference clearly appears in
France that does not exist in other countries. For the rest of the time the evolution is
almost identical. As for the English market. its performances are good because of
speculations over the adoption of a fiscal transparency status in the coming years.
However this graph does not show the complete reality of the evolution of French
property companies. as small French property companies are not included in the
EPRA index.
11

III. Liquidity
For investors liquidity is a crucial stake. Reselling non-liquid securities may result in
significant discounts. Several French property companies are relatively small and the
number of exchanged securities per day is relatively weak. But due to the reform and
an increased interest of investors in those enterprises. their liquidity should have
increased. Moreover the SIIC status forces them to have an over 10% floating
capital. a very low figure compared to other types of REITs in the world.
Thus we are going to study four key points:
-Evolution of exchanged volumes during a session.
-Necessary time for acquisition (or transfer) of a line of 1.5 million euros.
-Evolution of property companies floating capital.
-Average size of Bid/Offer differential per day
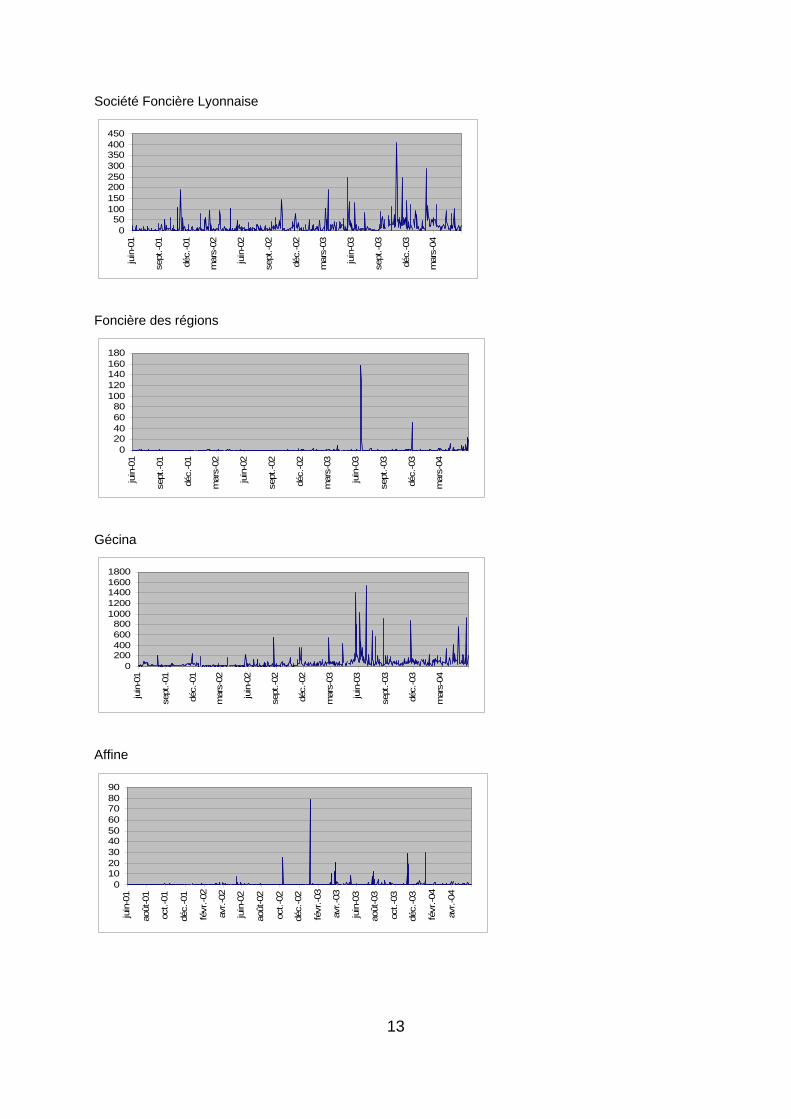
1. Evolution of session exchanged volumes
The graphs below recap the evolution of the number of securities exchanged per
session for the different property companies. The number of securities exchanged
are in thousands. It will be noted that scales vary on every graph. Results are given
for the January 2001 to June 2004 period and have been corrected when a division
of authorized capital took place.
Silic
0100200300400500
juin
-01
sept
.-01
déc.
-01
mar
s-02
juin
-02
sept
.-02
déc.
-02
mar
s-03
juin
-03
sept
.-03
déc.
-03
mar
s-04
12
Société Foncière Lyonnaise
050
100150200250300350400450
juin
-01
sept
.-01
déc.
-01
mar
s-02
juin
-02
sept
.-02
déc.
-02
mar
s-03
juin
-03
sept
.-03
déc.
-03
mar
s-04
Foncière des régions
020406080
100120140160180
juin
-01
sept
.-01
déc.
-01
mar
s-02
juin
-02
sept
.-02
déc.
-02
mar
s-03
juin
-03
sept
.-03
déc.
-03
mar
s-04
Gécina
0200400600800
10001200140016001800
juin
-01
sept
.-01
déc.
-01
mar
s-02
juin
-02
sept
.-02
déc.
-02
mar
s-03
juin
-03
sept
.-03
déc.
-03
mar
s-04
Affine
0102030405060708090
juin
-01
août
-01
oct.-
01
déc.
-01
févr
.-02
avr.-
02
juin
-02
août
-02
oct.-
02
déc.
-02
févr
.-03
avr.-
03
juin
-03
août
-03
oct.-
03
déc.
-03
févr
.-04
avr.-
04
13

EMGP
0
0,5
1
1,5
2
2,5ju
in-0
1
août
-01
oct.-
01
déc.
-01
févr
.-02
avr.-
02
juin
-02
août
-02
oct.-
02
déc.
-02
févr
.-03
avr.-
03
juin
-03
août
-03
oct.-
03
déc.
-03
févr
.-04
avr.-
04
Bail investissement
0
50
100
150
200
250
300
juin
-01
sept
.-01
déc.
-01
mar
s-02
juin
-02
sept
.-02
déc.
-02
mar
s-03
juin
-03
sept
.-03
déc.
-03
mar
s-04
Klépierre
0200400600800
1000120014001600
juin
-01
sept
.-01
déc.
-01
mar
s-02
juin
-02
sept
.-02
déc.
-02
mar
s-03
juin
-03
sept
.-03
déc.
-03
mar
s-04
Unibail
0
500
1000
1500
2000
2500
juin
-01
sept
.-01
déc.
-01
mar
s-02
juin
-02
sept
.-02
déc.
-02
mar
s-03
juin
-03
sept
.-03
déc.
-03
mar
s-04
14
Acanthe Développement
0
20
40
60
80
100
120ju
in-0
1
sept
.-01
déc.
-01
mar
s-02
juin
-02
sept
.-02
déc.
-02
mar
s-03
juin
-03
sept
.-03
déc.
-03
mar
s-04
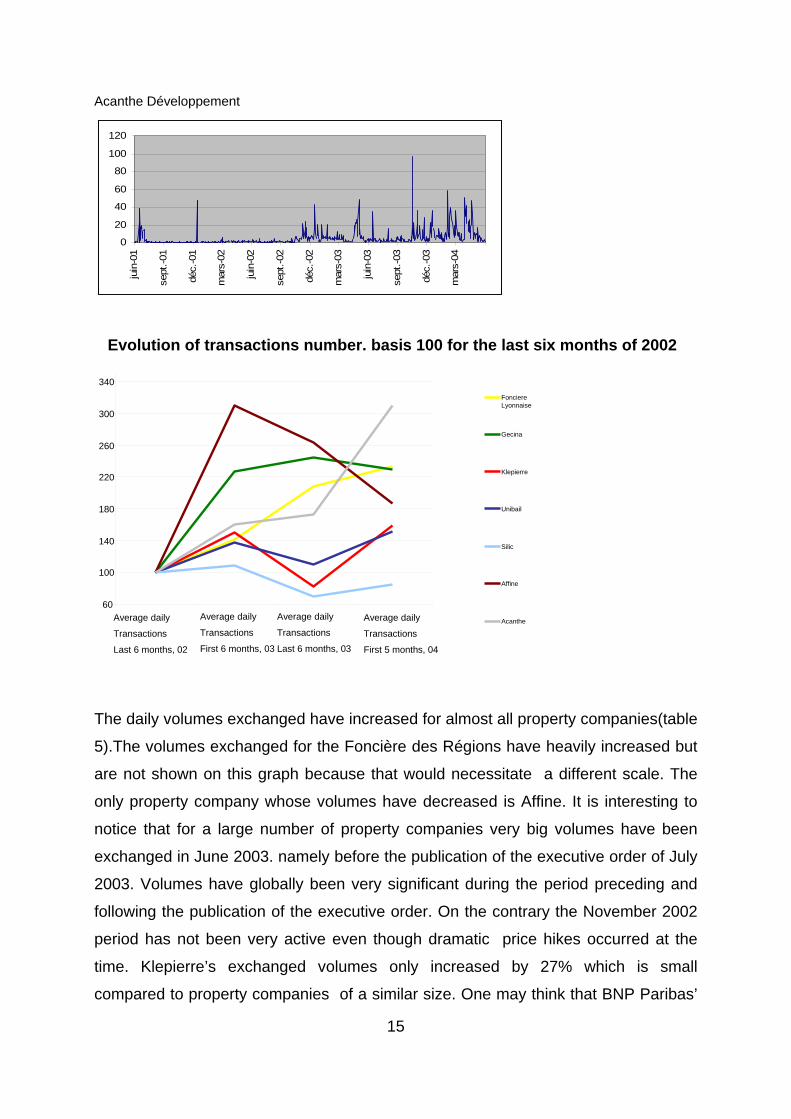
Evolution of transactions number. basis 100 for the last six months of 2002
340 Fonciere
300 Lyonnaise
Gecina
260
220 Klepierre
180 Unibail
140 Silic
100 Affine
60 Average daily Average daily Average daily Average daily Acanthe
Transactions
15
The daily volumes exchanged have increased for almost all property companies(table
5).The volumes exchanged for the Foncière des Régions have heavily increased but
are not shown on this graph because that would necessitate a different scale. The
only property company whose volumes have decreased is Affine. It is interesting to
notice that for a large number of property companies very big volumes have been
exchanged in June 2003. namely before the publication of the executive order of July
2003. Volumes have globally been very significant during the period preceding and
following the publication of the executive order. On the contrary the November 2002
period has not been very active even though dramatic price hikes occurred at the
time. Klepierre’s exchanged volumes only increased by 27% which is small
compared to property companies of a similar size. One may think that BNP Paribas’
Transactions
Last 6 months, 02 First 6 months, 03 Transactions Transactions Last 6 months, 03 First 5 months, 04

16
participation in the capital as a major shareholder reduces liquidity (the security
nominal value having been divided by three to increase liquidity). Unibail whose
volumes were already very high has a small percentage increase. Some property
companies such as Affine. la Foncière des Pimonts. la Foncière des Régions and
Silic have signed liquidity contracts with banks so as to ensure the continuous
quotation of securities. Silic has divided by 4 the nominal value of its shares to
increase liquidity.
Table 5. Evolution of the number of exchanged securities
SFL Gecina Klepierre Unibail Régions Silic Affine Acanthe
Nb daily transactions
average last 6 months 02 14 517 46 646 40 229 103391 150 11 928 443 3 627
Daily transactions (k€)
401.13 2193.91 1 590.83 6216.84 3.37 494.72 17.165 12.58
Nb daily transactions
average last six months 03 20 541 106 096 60 625 141 831 2 692 12 917 1 378 5 805
Daily transactions (k€) 576.17 5411.09 2 508.58 583.10 70.97 534.67 54.581 24.27
Nb daily transactions
average last six months 03 30 171 113 905 32 629 113 724 741 8 187 1 165 6 254
Daily transactions (k€) 967.2 6 044.50 1 499.53 7 823.62 24.79 403.82 56.27 29.84
Nb daily transactions
average 5 first months 04 33 789 106 818 63 969 156 270 1 390 10 132 825 11 242
Daily transactionss (k€) 1 049.73 6 633.02 3 441.20 12 582.07 63.9 556.34 45.52 61.29
2. Time necessary for the acquisition of a position
Here we’ll study the case of an institutional investor (asset management firm)
wishing to take or undo a position in a property company. This type of reasoning is all
the more justified as some property companies are part of indices and because
managers make regular use of benchmarked management. We examine the
acquisition or the transfer of a value line worth 1.5 M. a relatively small amount in the
world of management. The objective is to quantify the average time a property
company takes to acquire or resell this line. We will study the case of all the
securities available on the market. then the case of the purchase of 30% of the
securities available on the market. The first case is not very realistic because it would

lead to a significant difference of market prices. the second is closer to reality. The
table below recaps the results for four distinct time periods: last semester of 2002.
the two semesters of 2003 and the 5 first months of 2004 (table 6).
Table 6. Evolution of the number of necessary time
SF
Lyonnaise Gécina Klépierre Unibail
F des
regions Silic Affine Acanthe
Nb of daily transactions Average for last six months 2002 14 517 46 646 40 229 103 391 150 11 928 443 3 627
Daily transactions in K€ 401.13 2 193.91 1 590.83 6 216.84 3.37 494.72 17.165 12.58 Nb of days to obtain a line of 1.5 M€
-if 100% of acquired transactions 3.74 0.68 0.94 0.24 445.10 3.03 87.39 119.24
- If 30% of acquired transactions 12.46 2.28 3.14 0.80 1 483.68 10.11 291.29 397.46 Nb of daily transactions
Average first six months 03 2 0541 106 096 60 625 141 831 2 692 12 917 1 378 5 805 Daily transactions in K€ 576.17 5 411.09 2 508.58 8 583.1 70.97 534.67 54.581 24.27
Nb of days to obtain a line of 1.5 M€ -if 100% of acquired transactions 2.60 0.28 0.60 0.17 21.14 2.81 27.48 61.80
- if 30% of acquired transactions 8.68 0.92 1.99 0.58 70.45 9.35 91.61 206.02 Nb of daily transactions
Average last six months 03 30 171 113 905 32.629 113 724 741 8 187 1 165 6 254 Daily transactions in K€ 967.2 6 044.5 1 499.53 7 823.62 24.79 403.82 56.27 29.84
Nb of days to obtain a line of 1.5 M€ - If 100% of acquired transactions 1.55 0.25 1.00 0.19 60.51 3.71 26.66 50.27
- If 30% of acquired transactions 5.17 0.83 3.33 0.64 201.69 12.38 88.86 167.56 Nb of daily transactions
Average 5 first months 04 33 789 106 818 63.969 156 270 1 390 10 132 825 11 242 Daily transactions in K€ 1 049.73 6 633.02 3 441.2 12 582.07 63.9 556.34 45.52 61.29
Nb of days to obtain a line of 1.5 M€ - if 100% of acquired transactions 1.43 0.23 0.44 0.12 23.47 2.70 32.95 24.47
-If 30% of acquired transactions 4.76 0.75 1.45 0.40 78.25 8.99 109.84 81.58
These results reflect the diversity of property companies. Indeed whereas for Unibail
a line can be made up very rapidly (less than a day in any case) for building
companies like Acanthe or the Foncière des Régions it takes much longer (over 80
days if you take into consideration the purchase of 30% of securities). Thus it
appears unrealistic for a trust to buy securities in these companies.
The time needed decreases significantly for the various study periods. Between the
last semester of 2002 and the first semester of 2004 it was divided by two or three.
Only four property companies seem capable of attracting institutional investors (of the
asset manager type) into their capital: Société foncière Lyonnaise. Gécina. Unibail et
Klépierre. Silic might join this quartet relatively soon if its liquidity improves.
17

18
It is interesting to note that the liquidity contracts for Silic. Affine. the Foncière des
Pimonts and the Foncière des Régions are conceived to allow for transactions every
quotation day. But that is not enough to increase liquidity sufficiently to enable
institutionals to acquire securities lines. These contracts are mainly aimed at
individual shareholders who would like to resell a small quantity of securities easily.
Indeed waiting a week to resell a position may worry some small shareholders.
3. Evolution of floating capital
The liquidity of an enterprise is also linked to its floating capital. The presence of
heavy majority shareholders tends to result in a lack of liquidity linked to problems of
asymmetric information between majority and minority shareholders.
The floating capital of property companies has globally increased since 2001 but this
has nothing to do really with the reform. The Foncière des Pimonts with 10%. is just
above the legal threshold (for all types of companies. not only SIIC) and the Foncière
des Régions with 16% is not very far either. These low floating levels explain some of
the lack of liquidity for these securities (table 7).
Table 7. Evolution of the floating capital of property companies 2001 2002 2003
Acanthe Développement - - 28.57%
Foncière des Pimonts 10% 10% 10%
Silic 44.18% 40.9% 43.50%
SF Lyonnaise 26% 26% 35%
Gécina 40.50% 38% 50%
Affine 25.67% 32.4% 39.9%
Bail Investissement - 53.3% 59.6%
Unibail 100% 100% 100%
Fonciere des Régions 7% 14% 16%
Klépierre 33.6 40.8% 45.80%
4. Size of the Bid/Ask differential

The size of the differential in percentage is defined by (Ask-Bid)/bid. It is an indicator
of liquidity inasmuch as it represents the cost of a round turn on the value. It would be
risky to invest in a property company whose difference would only amount to . say
5% of the share price. A classic hypothesis about the difference is to assume that it
decreases with the market capitalization of enterprises.. capitalization and liquidity
being two strongly correlated elements. Here we use the bid and ask of the end of
the session.
Size of the Bid/Ask differential for the main property companies
0,00%
0,50%
1,00%
1,50%
2,00%
2,50%
3,00%
3,50%
4,00%
4,50%
5,00%
5,50%
6,00%
Octobre
02
Novem
bre 02
Decem
bre 02
Janv
ier 03
Fevri
er 03
Mars 03
Avril 0
3Mai
03
Juin
03
Juille
t 03
Aout 0
3
Septem
bre 03
Octobre
03
Novem
bre 03
dece
mbre 03
Janv
ier 04
Fevri
er 04
Mars 04
Avril 0
4Mai
04
Juin
04
SFL
Silic
F des Regions
Gecina
Affine
Klepierre
Unibail
Acanthe
The property companies with the strongest market capitalizations like Gécina and
Unibail are also the ones that have the lowest Bid/Ask spread. Then come SFL.
Klépierre and Silic with spreads which remain relatively weak. The smaller property
companies whose securities are less liquid can have differences of over 2% or 3%.
Over the study period it has also become obvious that the differential globally
narrows for this class of property companies. Several other building societies . like
the Foncière des Pimonts or FMGP are no longer to be found in the graph; indeed
transactions having become too rare on these values. the data are not sufficient to
allow for a coherent graph. However data show the differential is generally 10% and
sometimes higher.
19
20
IV. Discount
Property companies have long experienced a discount against their Net Asset Value.
most of the time ascribed to the impact of tax on transfer gains. Thus the transition to
SIIC status should modify this discount.
1. Determination of the net asset to be taken into account
Property companies. as companies holding and managing real estate property. have
specific characteristics allowing for reassessment of their assets periodically and
calculation of the theoretical value of the company. Within the framework of
accountancy in historical cost. the accounting net asset is defined by the asset net
value minus debts. As buildings enter the balance-sheet at their acquisition cost.
then undergo amortization which is disconnected from their resale market value. the
notion of net accounting asset cannot be used.
It is therefore appropriate to use the notion of Net Asset Value (NAV). Assets and
liabilities have to be reassessed in market value. However some different types of
NAV may exist.
NAV can be estimated according to its replacement value . transfer taxes included. It
is a restoration value representing what an investor should spend to rebuild the
company’s property. Reassessments are calculated from block sales (sale of a
whole block) or lot sales (sale per apartment for example). Selling in lots is more
profitable but requires condominium structures that do not exist since property
companies usually own whole buildings. Therefore a block strategy is used.
NAV liquidation used by financial analysts. is the amount that would result from the
resale of the assets of the property company with no tax on gains. To this type of
NAV Anglo-Saxons add the revaluation of financial debts to their market value. (it is
the “Triple-Net Asset Value”.

21
2. NAV calculation
How to measure the reliability of estimations and where do real resale prices stand
compared to estimations? Revaluations are made by independent expert firms.
Several assessment methods exist : comparison with the latest transactions.
comparison of operating ratios. updating of future flows etc...
The study of the annual reports of property companies shows some of the
weaknesses of reassessment. Indeed resale values may differ a lot from the ones
given by experts.
Property companies say they resort to arbitraging. reselling low-yield assets to buy
assets with a higher yield or having a high growth potential. For example in 2003 the
Société Foncière Lyonnaise sold over 380 million euros of assets. some 15.6% of its
capital. Compared to December 31. 2002 expertise values. the differentials for every
type of resold property are: 7.61% for block resales and12.94% for lots.
As for Klépierre they resold 175.9 million euros of assets at a price 6% higher than
their expertise value and Unibail tells us that all the assets yielded in 2003 have been
resold at prices above their expertise value.
3. Fiscal non-transparency. a discount factor
Property companies had to pay a 331/3% tax on their current result and all real estate
gains being characterized on the short term. their tax rate was also 331/3%.
The difference between net book value and NAV was very high. the amounts to be
paid colossal in the event of gain claiming. For example Unibail: a 4.781 M euros
NBV And a 7.550 M euros NAV. so a potential gain of 2.769 M euros. that is to say
a 923 M euros tax.
However property companies have always resorted to some techniques to reduce
paying taxes. By creating a company per asset and by selling participation securities
the tax rate is only 19%.
So the change to SIIC status has significantly reduced the discount for property
companies. Other factors could induce a discount for property companies like

security liquidity. the presence of minor shareholders. diversification... But the impact
of these factors is difficult to quantify (except for liquidity).
4. Evolution of discount after the reform
Discount has evolved a great deal over the years. To have a reference system about
the current period. we will proceed with a European comparison.
Evolution of discount in Europe
Source : UBS
By the end of 2002 the discount of French property companies was about 20%. The
situation was identical in Great-Britain. As for Belgian property companies fiscally
transparent. they held a premium against their NAV. Today discount has completely
disappeared for French property companies whereas it has modestly reappeared for
their Belgian counterparts. British and Italian property companies which are not tax-
transparent keep having to cope with a discount of roughly 20% against their NAV.
Although this statement is based on a relatively short observation period. it tends to
show how successful the reform is. Discount decrease and liquidity increase should
encourage property companies to change their relation with the market and to
become an attractive sector for investors looking for high-yield values.
22

23
5. Existence of a premium
Why is it possible for property companies to have a premium against their NAV (apart
from a sectorial bubble effect that is always possible)? We have seen that the
property yielded by property companies was generally resold at prices higher than
expertise value. This asset turnover following the reform has accelerated. On the one
hand it means making gains that were not to made before. on the other hand it is a
new management style. From now on property companies assert themselves as
actors capable of arbitraging the market by reselling low-yield assets to buy higher-
yield ones. So for the same NAV. the perspectives of future results are higher which
justifies an increase of the company value for investors.
24
V. The financial policy of property companies
1. Evolution of dividends
The obligation property companies have to allocate 85% of the result of their renting
activities is no new financial problem for them. The dividends allocated before the
reform were already higher than the minimum amount required by the new status.
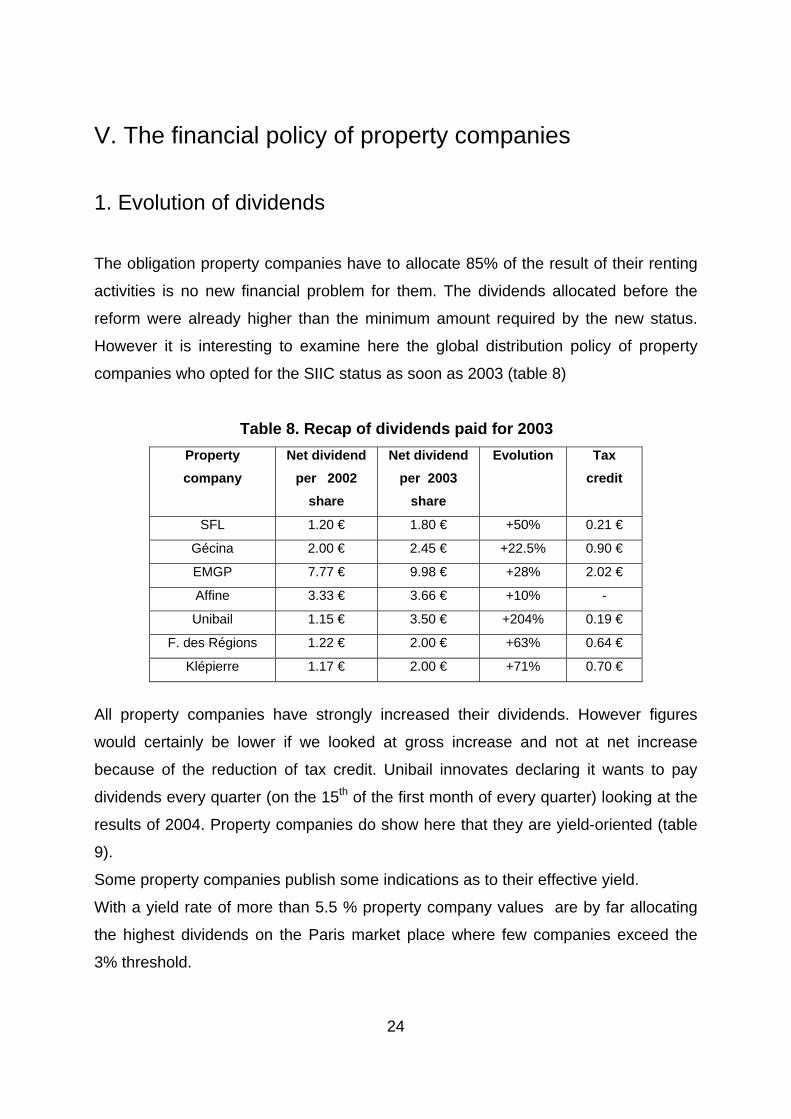
However it is interesting to examine here the global distribution policy of property
companies who opted for the SIIC status as soon as 2003 (table 8)
Table 8. Recap of dividends paid for 2003 Property company
Net dividend per 2002
share
Net dividend per 2003
share
Evolution Tax credit
SFL 1.20 € 1.80 € +50% 0.21 €
Gécina 2.00 € 2.45 € +22.5% 0.90 €
EMGP 7.77 € 9.98 € +28% 2.02 €
Affine 3.33 € 3.66 € +10% -
Unibail 1.15 € 3.50 € +204% 0.19 €
F. des Régions 1.22 € 2.00 € +63% 0.64 €
Klépierre 1.17 € 2.00 € +71% 0.70 €
All property companies have strongly increased their dividends. However figures
would certainly be lower if we looked at gross increase and not at net increase
because of the reduction of tax credit. Unibail innovates declaring it wants to pay
dividends every quarter (on the 15th of the first month of every quarter) looking at the
results of 2004. Property companies do show here that they are yield-oriented (table
9).
Some property companies publish some indications as to their effective yield.
With a yield rate of more than 5.5 % property company values are by far allocating
the highest dividends on the Paris market place where few companies exceed the
3% threshold.

25
Table 9. Yield rate of property companies Property company Gross dividend
2003 Price 31/12/03 Yield
SFL 2.01 € 34.35 € 5.85 %
Gécina 3.35 € 58.30 € 5.74 %
EMGP 12.00 € 334.9 € 3.58 %
Affine 3.66 € 47.50 € 7.70 %
Unibail 3.69 € 74.35 € 4.96 %
F. des Régions 2.64 € 36.02 € 7.32 %
Klépierre 2.70 € 47.70 € 5.66 %
2. Property company indebtedness
The discount decrease must allow property companies to turn to the market.
Following the reform there should be a certain number of capital increases aimed at
financing new investments. Some property companies have increased their capital
since the reform. The others have taken advantage of the all time low rate to
restructure their debt. The majority of property companies which have not yet
reached their maximum debt ratio have favored this type of financing.
2.1 Evolution of ratios
The different property companies show a great disparity in their financial structure
(table 10). Thus for Silic the debt/asset market value ratio is only 20.2 % whereas for
the Foncière des Régions it reaches 57%. These ratios reflect the policy adapted for
2003. In the case of Gécina for example. after the merger with Simco. the managers
focused on debt reduction. For the Foncière des Régions on the contrary. the high
increase of the debt is linked to its growth policy with a move from 58 M euros of
assets in 2000 to about 1.4 billion euros of assets by the end of 2003. During the last
quarter of 2003. the Foncière des Régions purchased 846 M euros of EDF and
France Télécom assets. which had before been purchased in partnership with
Morgan Stanley. The size of the group has thus been multiplied by 2.4.

26
The ratio operating surplus / financial costs shows the capacity property companies
have to cover their financial costs. Looking at this table closely you can see there is a
certain lack of connection between debt growth and ratio evolution.
Table 10. Indebtedness ratios 2002 and 2003 Property companies Debt/Property
2002 Debt/property
2003 Operating
surplus/financial costs 2002
Operating surplus/financial
costs 2003 Silic 18.9% 20.2% 12.5x 8.1x
SFL 40.3% 30.4% 2.7x 2.7x
Gécina 47.7% 35.3% 3.01x 2.54x
EMGP 36.9% 35.9% 5.1x 4.1x
Unibail 41% 44% 2.8x 3.4x
F. des Régions 37% 57% 5.4x 5.45x
Klepierre 44.7% 46.4% 3.1x 2.8x
2.2 Debt restructuration
During 2003 property companies have restructured their debt. trying to diversify
counterparts and maturity dates. The different types of resources are bank loans.
mortgaged and syndicated loans. commercial paper issue. Euro Medium Term Note
issue.bond issue. security issue.
Debt diversification depends on the size of the property company. As smaller
property companies do not have access to the bond market the larger part of the
debt will take the shape of bank loans.
Little information is available on the matter of the bank debt. mortgaged or
syndicated debt. However the decrease of market rates has led property companies
to renegotiate this type of debt with their counterparts.
Several operations took place on bond markets. Some are relatively classic: EMTM
issues or fixed-rate bond issues. others are less frequent like the security issue
operated by Unibail on Coeur Défense.
27
EMTN issues
- Unibail 200 M euros. maturity 2008; 362 M euros issued as private investment and
with a 3 months to 2 years maturity.
- Gecina: 250 M euros. maturity 2007.
Bond issues :
- Gecina :500 M euros of bonds. Maturity seven years. Plus 100 M more on the same
line two months later.
- Klépierre : In July 2004 an issue of 600 M euros of 7 year bonds. The emission was
largely oversubscribed and the investment concerned about ten European
countries.
Issue of bonds reimbursable with shares:
- Affine: Issue of 20 M euros of ORA. 20 year maturity
- EMGP: Issue of 40 M euros of ORA. six year maturity
Securitization
Unibail has refinanced Coeur Défence for an amount of 820 million euros by
securitization of the mortgaged loan tied to the building. Four tranches have been
issued at a variable rate with a 6.3 year maturity. The spread was at euribor + 67.5
base points.
Resorting to bond markets is thus limited to some property companies. The ORA
issue operated by Affine is a sign of the superior risk investors believe Affine takes
compared to property companies like Unibail or Gecina. The refinancing of Coeur
Défence by means of a securitization of the mortgage loan contracted beforehand is
an operation likely to take place on other assets in the coming years. The possibility
to securitize mortgaged loans also shows investors’trust in property companies.
securitization being a recent activity mainly practised by banks.
28
3. Share issues
The Foncière des régions operated a share issue during the last quarter of 2003
when it acquired 846 million euros of EDF and France Telecom assets. The financing
of this operation was achieved thanks to a 158.6 M euros increase of capital in cash
and the issue of new shares remunerating 32.5 million euros of contributions. The
increase of the property company market price made it easier to resort to the share
market. The Eiffel Tower company also raised a hundred M euros within the
framework of an accelerated growth strategy. The Masséna property company
increased its capital by 20 million euros to finance the acquisition of commercial
space from Carrefour group.
4. Operations on property companies
Since the announcement of the tax reform. the property building sector has
witnessed a certain number of financial operations. Here are the main ones.
- Sophia : Take-over bid by the Société Foncière Lyonnaise on Sophia and
eventually higher bid and acquisition of Sophia by GE Real Estate (November 2003).
Sophia was squeezed out of quotation in December 2004. GE does not pay taxes in
France...
- Société foncière Lyonnaise : Successful take-over bid of Immobiliaria Colonial
(Espagne) on SFL (June 2004).
- Foncière des Régions : Take-over bid of Foncière des Régions on Bail
Investissement (December 2004) squeeze out of the same on Foncière des Murs
which in the mean time merged with Ferrand and Renaud (listed on Premier Marché)
in December 2004.
- Altarea : Acquisition by Altarea. an unlisted property company. of Imaffine. a listed
property company bound to opt for the SIIC status.
- The Tour Eiffel company (Awon group) has been reactivated with a hundred M
euros capital increase in 2004.
- The Paris SIIC (former Immobanque ) has decided to accelerate its evolution
towards property company activity and to put an end to its own activity.
29
- Other initiatives have been announced. A group of professionals ( Juliard. Papaz.
Heurteux...) has just created a SIIC. Dock Lyonnais has increased its capital to reach
the threshold required by SIIC status.. The Socim has been emptied out of its
substance and reoriented towards tertiary real estate as Foncière Masséna. The
Mines de la Lucette. a small property company also thinks of its transformation.
To sum it all up. the sector has followed two major trends :
- The arrival of new actors in the sector: Immobiliaria Colonial. Altarea and investors
(Awon. Juliard and Alii etc...)
- The pursuit of an old concentration process (absortion of Ferrand and Renaud. of
the Foncière des Murs. of Imaffine. of Sophia).
30
Conclusion
Property companies have evolved greatly since their adoption of SIIC status. Prices
have significantly risen and discount has disappeared. Property companies have
outperformed against their European competitors (tax-transparent or not).
Price reaction has been straight firstly when the legal change occurred ; then. the
increase followed a progressive way: large property companies like Gécina or Unibail
have been the first to benefit from the change. This phenomenon is certainly due to
their increased visibility when compared to other property companies.
Security liquidity has improved. Some companies’ securities like the Foncière des
Pimonts are far from being liquid enough to attract asset managers looking for a
position in the market. Companies’capital is more and more open, the float of several
property companies being bigger and bigger.
Fiscal transparency has meant discount disappearance which can be partly
explained by the updating of future tax savings. The arbitrations made by property
companies question the way property companies are traditionally assessed through
their NAV. Studying the discount phenomenon becomes somewhat meaningless
when adopting this point of view.
Revaluation of property company real estate assets did not entail a decrease of their
cash flows as was assumed when the reform was announced. The possibility to
spread the payment of exit tax over 4 years was a windfall for property companies.
In fact the amount of exit tax to be paid is comparable to the saved company taxes.
Property companies did not have to make transfers nor to make new loans to finance
the cost of exit tax.
Distribution obligations linked to the reform are less constraining than what had been
envisaged. Property companies already paid amounts higher than those made
mandatory by the reform before the adoption of the new status. Nevertheless all

31
property companies have increased their level of paid dividends. putting forward their
status of yield value. This trend is also a global trend of the share market this year.
Unibail appears as a forerunner wishing to pay quarterly dividends.
Property companies took advantage of a decrease in rates to refinance themselves.
Financing sources vary with property company size. The smallest property
companies do not resort to the bond market. Unibail operated a securitization to
refinance Coeur Défense. This type of operation should be more and more frequent
in the years to come.
Capital increases have been made to finance the huge growth of small property
companies like the Foncière des Régions and Tour Eiffel. Even if resorting to the
market is not directly connected with discount decrease it has certainly been made
easier by price valuation.
New actors have appeared on the market. Their growth policies may be very rapid.
Tour Eiffel aims at acquiring 300 M euros this year and to have a billion euro property
in 3 years from now. The arrival of new actors is very positive as the number of
property companies on the market has kept decreasing these past years.
The big property companies have not. as for them. led very aggressive growth
policies. Of course. this is related to the trend of the prices on the property markets.
But. it is generally admitted that the optimum size for a property company would be a
7 or 8 billion euros real estate property. These property companies have focused
their activity on the restructuration of their assets. Gecina for example sold low-yield
assets. like Haussmannian apartments to reinvest in offices or shopping malls.
Big public or private French property companies have externalized their real estate
property. Among them EDF. France Télécom. Altstom and Canal Plus...
The second text adopted about the SIIC can explain this externalization trend. This
text is part of the year 2004 finance law. It allows industrial and financial companies
to transfer real estate assets to a SIIC by paying a 16.5% exit tax on potential capital
gains. The company taking advantage of the assets contribution promises to keep

32
the acquired building for at least three years. The exit-tax rate is similar to the one
that prevailed when property companies became SIICs. The objective of this second
reform is to double the number of assets managed by SIICs in three years by
bringing new contributions( estimated at 1 billion euros) to the state. while allowing
companies to get rid of their assets more easily.
This second stage of the reform is highly significant and will certainly continue to
open up new perspectives for the sector of French property companies.
33
References
Data Datastream
Bloomberg data
EPRA
Brokers and analysts papers Nouveaux acteurs. nouvelles valorisations. Benoit Faure-Jarrosson. Fideuram
Wargny. 28/04/04
Global Real Estate Analyser. UBS. Juin 2004
European Real Estate Analyser. UBS. Juillet 2004
Annual reports Gécina: 2001. 2002 et 2003
Unibail: 2001. 2002 et 2003
Klépierre: 2001. 2002 et 2003
Société Foncière Lyonnaise: 2001.2002 et 2003
Foncière des Régions: 2001. 2002 et 2003
Bail Investissement: 2002 et 2003
Affine: 2001. 2002 et 2003
Foncière des Pimonts: 2001. 2002 et 2003
Silic: 2001. 2002 et 2003
Internet sites www.senat.fr
www.legifrance.gouv.fr
www.boursorama.com
www.acanthedeveloppement.fr
www.minesdelalucette.com
Financial news services
Bloomberg

34
Research working papers Risk and Return of Open-end Real-Estate Funds : The German Case. Johann
Wolfgang Goethe-Universitat Frankfurt am main working paper series. Raimond
Maurer / Frank Reiner / Ralph Rogalla
An Evaluation of Property Discounts in Europe. Dr Shaun A. Bond and Professor
James D. Shilling. Working Paper. March 2004
Tax Transparency for Europe: a comparison of different REIT regimes in Europe
(Belgiun. France. the Netherlands and the USA). EPRA-REIT-SURVEY
Corporate Real Estate: A data driven Model. working paper. Linda Tay