The Fluorescence Intensity Ratio (FIR): A NewWay … · 1 The Fluorescence Intensity Ratio (FIR): A...
21
1 The Fluorescence Intensity Ratio (FIR): A New Way of Assessing the Efficiency of Oil Dispersion. J.B.C. Bugden 1 , P.E.Kepkay 2 and B.D. Johnson 2 1 Bedford Institute of Oceanography Fisheries and Oceans Canada P.O. Box 1006, Dartmouth, Nova Scotia Canada B2Y 4A2 2 Pro-Oceanus Systems Inc. 80 Pleasant Street Bridgewater, Nova Scotia Canada B4V 1N1 Abstract Ultraviolet fluorescence spectroscopy (UVFS) has been used to generate the excitation- emission matrices (EEM) of thirteen crude oils dispersed in seawater. The oils, with a wide range of dynamic viscosities (4 to 14,470 cP), were dispersed in seawater alone or by using the chemical dispersant Corexit 9500 at dispersant to oil ratios (DORs) of 1:10, 1:20 or 1:40. The matrices were simplified down to fluorescence intensity ratios (FIRs) obtained from two emission peaks at 340 and 445nm (with excitation fixed at 280nm), and the ratios compared to the solvent extracted concentrations of dispersed oil. When the dispersed oil concentrations were expressed as percent of oil dispersed (also known as the dispersion efficiency), FIRs of less than 4 were associated with efficiencies of greater than 40% while FIRs greater than 4 were characteristic of oils dispersed with efficiencies of 20% or less. Given that a FIR of 4 is a threshold between low and high dispersion efficiency, FIR fluorometry could be used as first-response tool to track marine oil dispersion.
Transcript of The Fluorescence Intensity Ratio (FIR): A NewWay … · 1 The Fluorescence Intensity Ratio (FIR): A...

1
The Fluorescence Intensity Ratio (FIR): A NewWay of Assessing theEfficiency of Oil Dispersion.
J.B.C. Bugden1, P.E.Kepkay2 and B.D. Johnson2
1Bedford Institute of OceanographyFisheries and Oceans Canada
P.O. Box 1006, Dartmouth, Nova ScotiaCanada B2Y 4A2
2Pro-Oceanus Systems Inc.80 Pleasant Street
Bridgewater, Nova ScotiaCanada B4V 1N1
Abstract
Ultraviolet fluorescence spectroscopy (UVFS) has been used to generate the excitation-
emission matrices (EEM) of thirteen crude oils dispersed in seawater. The oils, with a
wide range of dynamic viscosities (4 to 14,470 cP), were dispersed in seawater alone or
by using the chemical dispersant Corexit 9500 at dispersant to oil ratios (DORs) of 1:10,
1:20 or 1:40. The matrices were simplified down to fluorescence intensity ratios (FIRs)
obtained from two emission peaks at 340 and 445nm (with excitation fixed at 280nm),
and the ratios compared to the solvent extracted concentrations of dispersed oil. When
the dispersed oil concentrations were expressed as percent of oil dispersed (also known as
the dispersion efficiency), FIRs of less than 4 were associated with efficiencies of greater
than 40% while FIRs greater than 4 were characteristic of oils dispersed with efficiencies
of 20% or less. Given that a FIR of 4 is a threshold between low and high dispersion
efficiency, FIR fluorometry could be used as first-response tool to track marine oil
dispersion.

2
Introduction
Oil released into marine ecosystems can cause serious environmental damage if not
remediated (NRC, 1985). A number of mechanical remediation techniques such as
booming and vacuuming can be employed, but are often not practical due to the tendency
of spilled oil to spread as slicks over large swathes of the sea surface (NRC, 2005). Other
non-mechanical methods such as in situ burning and chemical dispersion have also been
tested, with dispersant application being the most practical technique in the majority of
marine environments (NRC, 2005, with references).
Oil will disperse naturally through the action of wave energy to create suspensions of
small droplets that can then be diluted by mixing and currents to concentrations below
toxic thresholds (Li and Garrett, 1998). When chemical dispersants are applied to an oil
slick, the formation of small droplets is accelerated, removing oil from the surface and
preventing it from stranding onshore (Fiocco and Lewis, 1999). In addition, the
generation of quasi-stable suspensions of small droplets by dispersants makes the oil
more accessible to natural populations of hydrocarbon-degrading bacteria in the water
column (Fiocco and Lewis, 1999; Lessard and Demarco, 2000; Venosa and Zhu, 2003,
with references).
It is important to know how well a slick has been dispersed after treatment with a
dispersant. Laboratory studies quantify this as dispersant effectiveness or dispersion
efficiency, which is defined as the amount of oil in the water column (measured after
extraction by a solvent) divided by the total amount of oil spilled (Sorial, et al., 2004).
The assessment of dispersion efficiency currently requires the collection, extraction and
analysis of a sample. What is needed is a less involved method to rapidly assess
efficiency.

3
A consortium of government agencies has developed the SMART (Special Monitoring of
Applied Response Technologies) program (www.response.restoration.noaa.gov/smart) to
better assess dispersion efficiency during and after a spill. Given the ever changing
conditions encountered during dispersant operations and the need to monitor a number of
key processes, the SMART program includes three levels (or tiers) of monitoring: Tier I
is the simplest and is based on visual observations at sea and in the air. Tier II combines
visual monitoring with single-depth monitoring in the water column and sample
collection for later analysis. Tier III expands on Tier II, with sampling at multiple depths
and the possible redeployment of resources to address specific problems.
A key component of Tier II and III monitoring is the deployment of fluorometers to
determine if oil has been dispersed down into the water column. The utilization of ultra-
violet fluorescence spectrometry (UVFS) to identify and characterize hydrocarbons is
well documented (Bugden, et al., 2008, with references). The strength of this method is
that it does not require the extraction and concentration procedures required of many
other spectroscopic techniques (Patra and Mishra, 2002). Bugden, et al. (2008) have
already described how UVFS can be used to distinguish between oil and chemically
dispersed oil in seawater. They have also shown how complex excitation-emission
matrix spectra (EEM spectra) can be simplified down to a fluorescence intensity ratio
(FIR) that can be used as an index of how well oil is dispersed. Even though FIRs have
been used to characterize oil (Higashi and Hagiwara, 1980; Thruston and Knight, 1971),
crude petroleum (Sotelo et al., 2008) and oil quality (Markova, et al., 2007), as well as
estimate the API gravity of oils (Horvitz, 1986; Ryder, 2002), Bugden et al. (2008) have
pointed out that very little attention has been paid to the application of FIR fluorometry to
oil dispersion. They have also highlighted the main advantage of the FIR concept: Ratios

4
are dimensionless and can be determined rapidly without having to calibrate a
fluorometer (Genders, 1988; Hurford et al., 1989; Chapman et al., 2007) with
independent measurements of oil concentration.
In response, we have reapplied the fluorescence intensity ratio (FIR) technique to thirteen
reference oils with a wide range of dynamic viscosities at three dispersant-to-oil ratios
(1:10, 1:20, and 1:40). These treatments, applied to suspensions of oil in seawater
maintained in baffled flasks at constant agitation (equivalent to an eddy diffusivity of 0.1
m2 s-3 under spilling breaking waves) have been shown to be more representative of
mixing at sea than other techniques (Venosa et al., 2002; Kaku, et al., 2006). This results
in reproducible determinations of dispersion efficiency (Sorial, et al., 2004) and better
approximations of natural wave conditions than those employed by Bugden et al, (2008).
One of the objectives of the work reported here has been to determine whether the FIR
concept holds true for oils under these more realistic regimes of turbulent energy and
over a range of dispersant to oil ratios. More importantly, the objective has been to
determine if fluorescence intensity ratios (FIRs) are accurate indices of dispersion
efficiencies. This would allow FIRs to be used in a first response (SMART, Tier II or III)
scenario to provide immediate feedback on how well a spill has been dispersed.
Methods
Thirteen reference oils from the Emergencies Science and Technology Division of
Environment Canada were selected to cover a wide range of viscosity (Table 1), and
include approximately equal numbers of low, medium and high-viscosity oils. The oil-
dispersant treatments were randomly organized into a block of experiments such that
each treatment (with oil and dispersant) and each oil-only control was included once in

5
the block. Individual blocks of experiments were repeated three times, with the
treatments within each block randomly shuffled.
Approximately 100-µL of oil was added to a 250-mL baffled flask containing 120 mL of
0.45-µm filtered seawater from Bedford Basin, Nova Scotia (salinity 30-32 ppt), and
placed, prior to the addition of the oil/dispersant, on an OS-500 orbital shaker with an
orbital diameter of 2cm set at 200 rpm (VWR International/Henry Troemner LLC,
Thorofare, NJ). Approximately 300-µL of oil was aspirated into a 1-mL syringe (Becton
Dickinson, Franklin Lakes, NJ), and the plunger displaced to the 100-µL mark. If the oil
was of low viscosity, a 26 gauge needle was placed on the end of the syringe to prevent
oil from leaking from the tip. The oil and syringe were then weighed and the contents of
the syringe (approximately 100 µL of oil) dispensed onto the surface of the seawater in
the baffled flask; the syringe was then re-weighed. The volume of oil added was
calculated from the measured weight and density (available from the Environment
Canada database). This allowed the correct amount of dispersant (Corexit 9500) to be
dispensed and provide the required dispersant to oil ratios (DOR) of 1:10, 1:20 and 1:40.
Following the procedure of Soriel, et al. (2004), Corexit was then added as a drop to the
surface of the oil using a 20-µL Pipet-Plus Pipetman (Gilson). The
oil/dispersant/seawater was allowed to mix for ten minutes at an agitation rate equivalent
to an eddy diffusivity of 0.1 m2 s-3 under spilling breaking waves. Approximately 3 mL
of the dispersed oil/seawater mixture was then dispensed through a spigot located near
the bottom of the flask into a 4.5-mL UV-grade quartz cuvette (10 mm light path -
Hellma (Canada) Limited, Concord, Ontario) for ultra-violet fluorescence spectroscopy
(UVFS) scans on a Shimadzu 5301-PC UV-fluorometer (following the procedure
described by Bugden et al., 2008).

6
About 30 mL (the exact volume being recorded) was then drawn into a 50-mL graduated
cylinder fitted for Total Petroleum Hydrocarbon (TPH) analysis (Li et al, 2008a). Care
was taken to prevent the transfer of non-dispersed (slick) oil through the flask spigot.
The sample was then transferred into a 100 mL amber bottle with a tin-foil-lined screw
cap. The graduated cylinder was rinsed three times with di-chloro-methane (DCM); two
times with 10 mL and once with 20 mL. The graduated cylinder was stoppered after each
rinse, the contents shaken (with the stopper removed after every few shakes to release
pressure built up in the cylinder), and the contents transferred to an amber bottle which
was then placed in a refrigerator at 4oC; DCM was then allowed to settle for a minimum
of 24 hours. After this extraction period, the oil-in-DCM extract was transferred to a 40
mL glass vial using a lime glass pipette and glass syringe, and adjusted to a final volume
of 10 mL with DCM. The samples were scanned on a Genesys 20 spectrophotometer at
340, 370 and 400nm (Thermo Fisher Scientific Inc., Waltham, MA, U.S.A), using the
same quartz cuvette employed for UVFS measurements.
Calibration curves were generated from stock solutions by adding 1 mL of oil (dispensed
by mass) to a 10 mL volumetric flask containing DCM. Dispersant was added to achieve
the appropriate DOR using a 20 !L Rainin pipet"plus with a 20 !L tip. For each
dispersant-to-oil ratio (DOR), 7 standards were made up in a 10 mL volumetric flask with
DCM at the following stock volumes: 10, 20, 40, 100, 200, 400, and 500 !L. The
standards and samples were run on the same day, and under the same conditions to
eliminate variation due to changes in UV-bulb intensity over time. Absorbance and
percent transmission were recorded and the data were entered into a spreadsheet to
calculate sample concentration. Some samples needed to be diluted by up to 100 mL to
obtain a signal that could be read on the spectrophotometer. Dispersion efficiency was
7
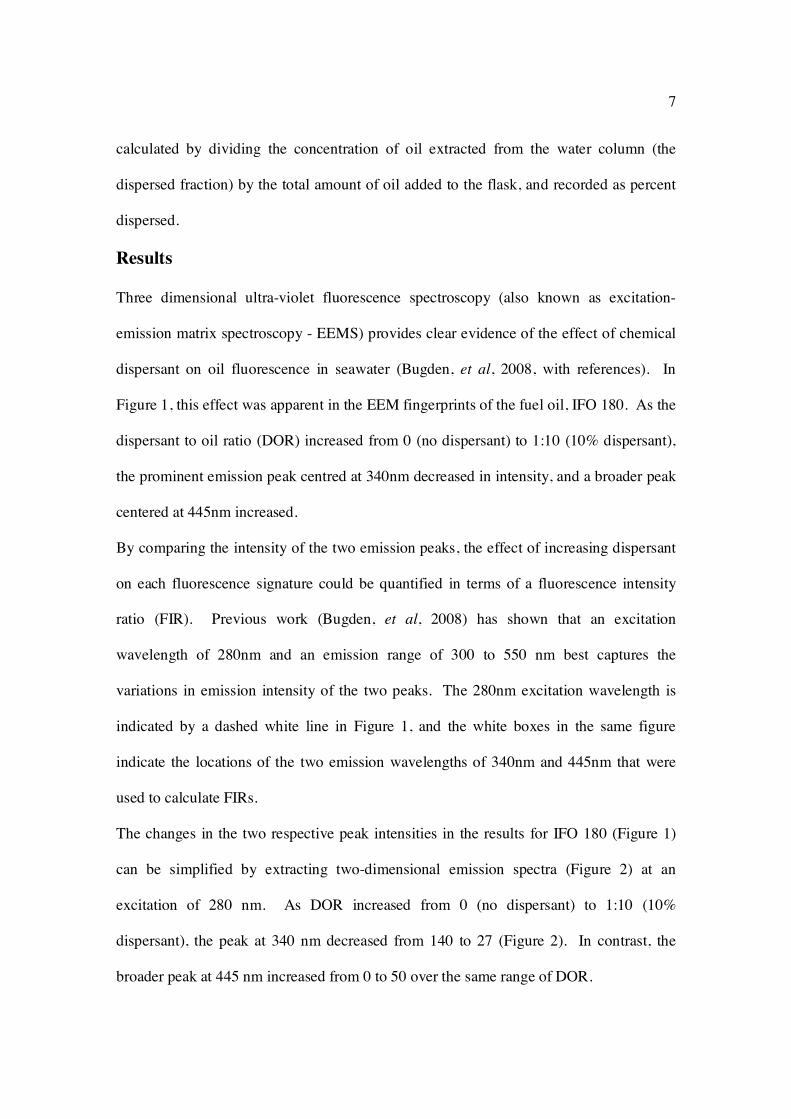
calculated by dividing the concentration of oil extracted from the water column (the
dispersed fraction) by the total amount of oil added to the flask, and recorded as percent
dispersed.
Results
Three dimensional ultra-violet fluorescence spectroscopy (also known as excitation-
emission matrix spectroscopy - EEMS) provides clear evidence of the effect of chemical
dispersant on oil fluorescence in seawater (Bugden, et al, 2008, with references). In
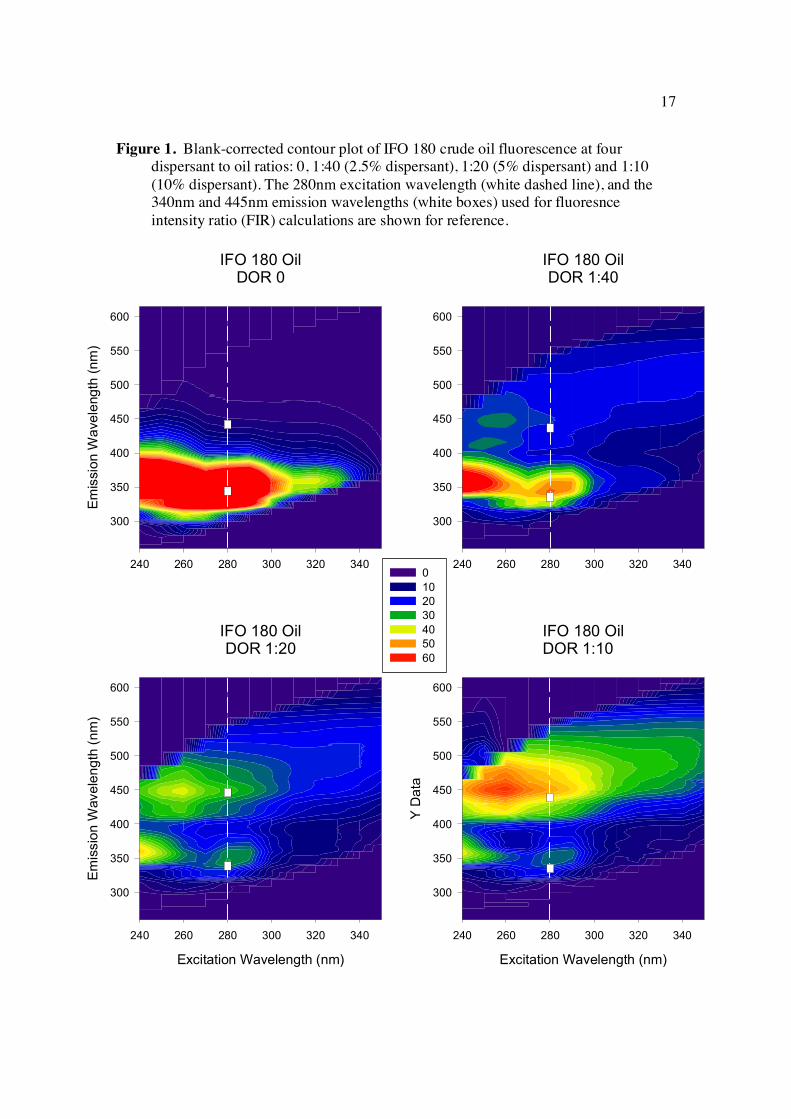
Figure 1, this effect was apparent in the EEM fingerprints of the fuel oil, IFO 180. As the
dispersant to oil ratio (DOR) increased from 0 (no dispersant) to 1:10 (10% dispersant),
the prominent emission peak centred at 340nm decreased in intensity, and a broader peak
centered at 445nm increased.
By comparing the intensity of the two emission peaks, the effect of increasing dispersant
on each fluorescence signature could be quantified in terms of a fluorescence intensity
ratio (FIR). Previous work (Bugden, et al, 2008) has shown that an excitation
wavelength of 280nm and an emission range of 300 to 550 nm best captures the
variations in emission intensity of the two peaks. The 280nm excitation wavelength is
indicated by a dashed white line in Figure 1, and the white boxes in the same figure
indicate the locations of the two emission wavelengths of 340nm and 445nm that were
used to calculate FIRs.
The changes in the two respective peak intensities in the results for IFO 180 (Figure 1)
can be simplified by extracting two-dimensional emission spectra (Figure 2) at an
excitation of 280 nm. As DOR increased from 0 (no dispersant) to 1:10 (10%
dispersant), the peak at 340 nm decreased from 140 to 27 (Figure 2). In contrast, the
broader peak at 445 nm increased from 0 to 50 over the same range of DOR.
8
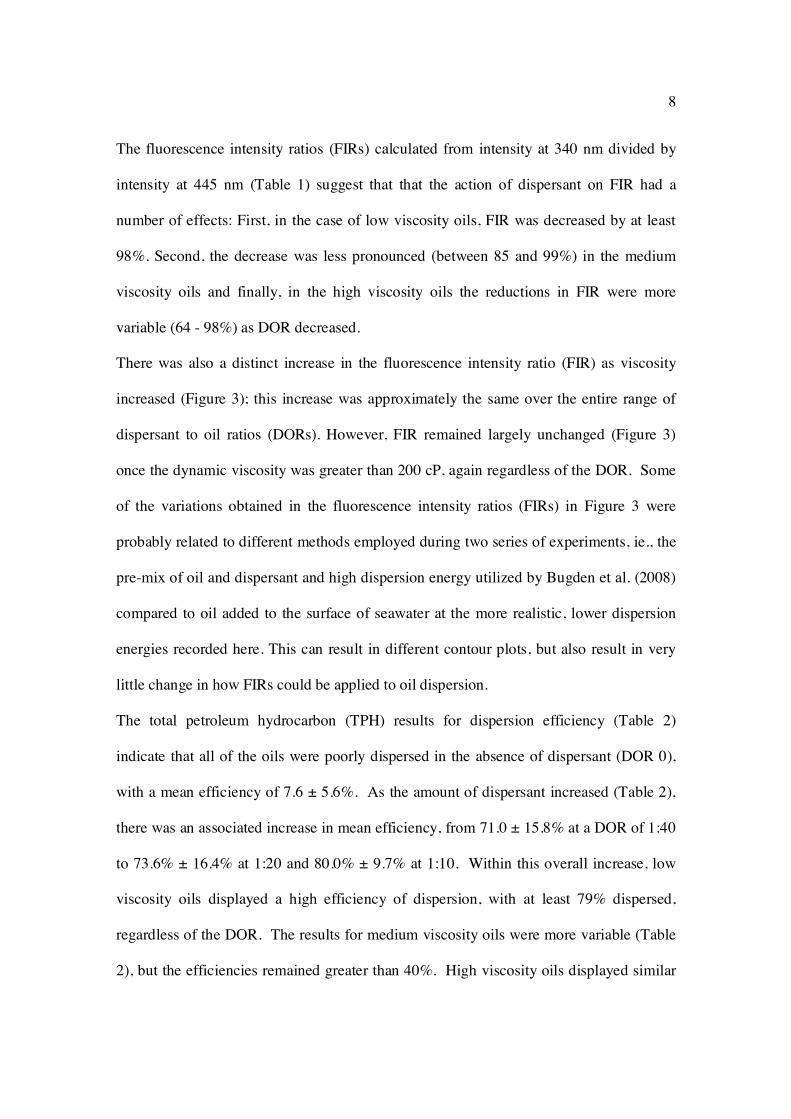
The fluorescence intensity ratios (FIRs) calculated from intensity at 340 nm divided by
intensity at 445 nm (Table 1) suggest that that the action of dispersant on FIR had a
number of effects: First, in the case of low viscosity oils, FIR was decreased by at least
98%. Second, the decrease was less pronounced (between 85 and 99%) in the medium
viscosity oils and finally, in the high viscosity oils the reductions in FIR were more
variable (64 - 98%) as DOR decreased.
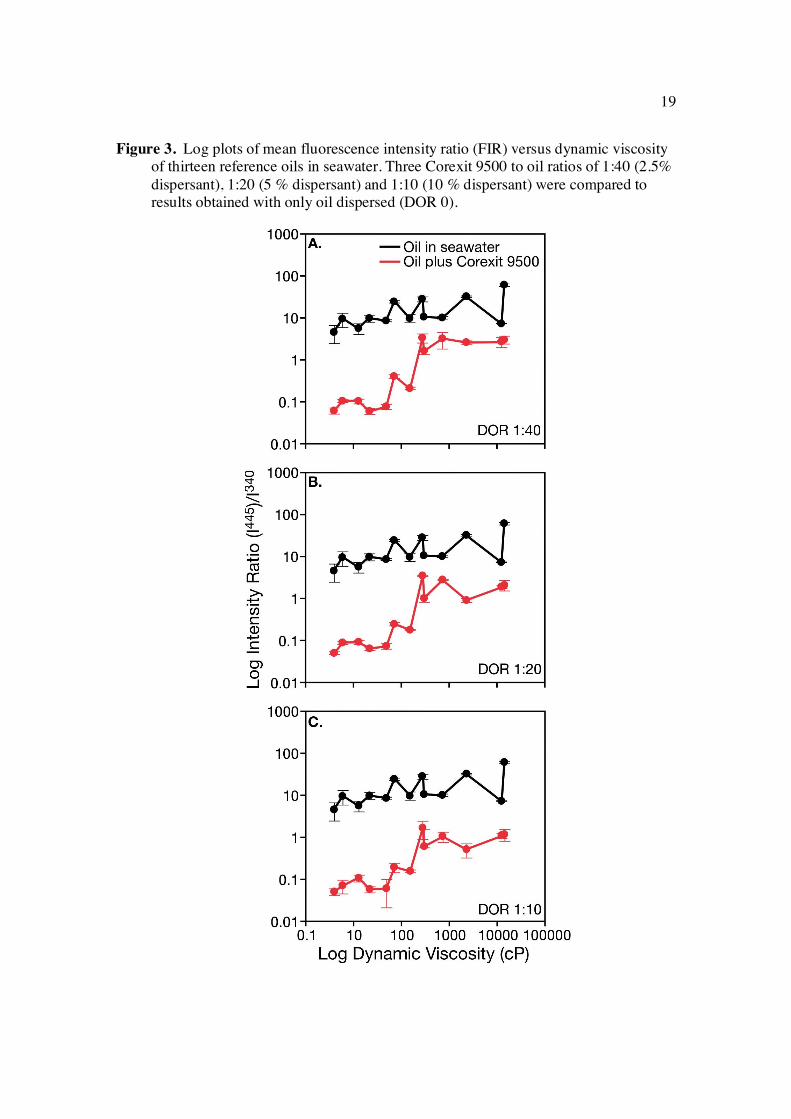
There was also a distinct increase in the fluorescence intensity ratio (FIR) as viscosity
increased (Figure 3); this increase was approximately the same over the entire range of
dispersant to oil ratios (DORs). However, FIR remained largely unchanged (Figure 3)
once the dynamic viscosity was greater than 200 cP, again regardless of the DOR. Some
of the variations obtained in the fluorescence intensity ratios (FIRs) in Figure 3 were
probably related to different methods employed during two series of experiments, ie., the
pre-mix of oil and dispersant and high dispersion energy utilized by Bugden et al. (2008)
compared to oil added to the surface of seawater at the more realistic, lower dispersion
energies recorded here. This can result in different contour plots, but also result in very
little change in how FIRs could be applied to oil dispersion.
The total petroleum hydrocarbon (TPH) results for dispersion efficiency (Table 2)
indicate that all of the oils were poorly dispersed in the absence of dispersant (DOR 0),
with a mean efficiency of 7.6 ± 5.6%. As the amount of dispersant increased (Table 2),
there was an associated increase in mean efficiency, from 71.0 ± 15.8% at a DOR of 1:40
to 73.6% ± 16.4% at 1:20 and 80.0% ± 9.7% at 1:10. Within this overall increase, low
viscosity oils displayed a high efficiency of dispersion, with at least 79% dispersed,
regardless of the DOR. The results for medium viscosity oils were more variable (Table
2), but the efficiencies remained greater than 40%. High viscosity oils displayed similar

9
variations (Table 2) but only IFO 300, the highest-viscosity oil tested (with a DV of
14470 cP), dispersed with an efficiency of less than 47% (at a DOR of 1:10).
When the fluorescence intensity ratio (FIR) was plotted versus dispersion efficiency
(Figure 4), the effect of dispersant was readily apparent, with two distinct clusters of
results: Dispersion efficiencies of 40% or more were associated with the application of
dispersant, and efficiencies of 20% or less were evident in the oil-only treatments (Figure
4A). In order to establish a threshold FIR that could define “effective” versus “non-
effective” dispersion, the FIR scale of 0 – 70 in Figure 4A was expanded to 0 -10 (Figure
4B). In this expanded cluster plot, a FIR of four delineated between well dispersed and
poorly dispersed oils, with a ratio less than 4 associated with sufficient (> 40 %)
dispersion and a ratio greater than 4 characteristic of poor (< 20%) dispersion.
Discussion
Even though dispersion efficiency is normally determined with bench-scale tests based on
solvent extraction to measure dispersed oil concentration (Sorial et al., 2004a), new
methods are needed to provide rapid feedback on the dispersion of oil slicks during a
spill. Bugden et al, (2008) have demonstrated that a 3-D excitation-emission matrix
(EEM) can be simplified down to a fluorescence intensity ratio (FIR). The major
advantage of this approach is that results can be obtained quickly. All that is required is a
fluorometer that can excite at 280nm and read emission peaks at 340 and 445 nm. As
Bugden et al, (2008) have already pointed out, FIRs calculated from the two emission
peak intensities can provide rapid feedback on how well a slick has been dispersed. This
would give first responders operating under the monitoring protocols of the SMART
program (www.response.restoration.noaa.gov/smart) the chance to make informed
decisions early on in a spill remediation.

10
The effect of dispersant on fluorescence intensity ratio (FIR) is summarized in Figure 3
and Table 2. The FIRs of low viscosity oils dropped by at least 98%, regardless of the
dispersant to oil ratio (DOR). This decrease in FIR was more variable as viscosity
increased (Figure 3), but was still 85 - 94% for the case of medium viscosity oils and 64 -
98% for high viscosities (Table 2). However, the results obtained with high viscosity oils
provide the clearest indication of the effect of DOR on FIR. When mean percent
reductions were calculated from the data in Table 2, the values for FIR reduction
increased from 71% at a DOR of 1:40 to 74% at 1:20 and 80% at 1:10.
As can be seen in Figure 4, < 20% of a given oil was mixed into the water column in the
absence of chemical dispersant, yet a wide range of FIRs was measured (Figure 4A), with
all of the FIRs greater than 4 (Figure 4B). These dispersant-free FIRs did not correlate in
any discernible way with dynamic viscosity which is not in agreement with earlier work.
However, the earlier studies were not carried out at 280 nm excitation, and utilized either
oil of non-defined composition (Ryder, 2002) or oil that was pre-dissolved in an organic
solvent (Thruston and Knight, 1971; Horvitz, 1986).
Addition of dispersant to suspensions of oil resulted in a drop in the fluorescence
intensity ratio (FIR) and an increase in dispersion efficiency by 40 - 99% (Figure 4A),
resulting in more oil mixed down into the seawater as small droplets (Lessard and
Demarko, 2000; Page et al, 2000). Even though the data in Figure 4A can be interpreted
as a curve of decreasing FIR and an exponential function can be fitted to the data, the
equation derived from the fit does not accurately define dispersion efficiency in relation
to FIR, especially at low ratios. Instead, it is probably more realistic to treat the data in
Figure 4A as a cluster plot. This means that FIRs may be better utilized in terms of a
threshold index of whether oil has been dispersed sufficiently (Figure 4B). With a FIR
11
above 4, additional treatment with dispersant would be needed to ensure the dispersion
was above 40% and if the FIR was below 4, the oil would be sufficiently dispersed (at an
efficiency already > 40%).
At this point it should be stressed that, even though these experiments have been
performed under well controlled conditions in baffled flasks, there are limitations
inherent in this approach. The data obtained from flask experiments are more
representative of the dispersion of relatively high oil concentrations early on during a
spill, but they do not take the transport and dilution of oil into account as the spill
progresses (NRC, 2005). Recent experiments in a wave tank have been reported which
include the effects of oil transport and dilution on measurements of dispersion efficiency
(Li et al., 2008; Li et al., 2012 in press). More work of this type is required to better link
FIR and dispersion using the transport and dilution effects that are more typical of late
spill conditions.
In conclusion, fluorescence intensity ratios (FIRs) could be used as a rapid, on site
method to provide information on the state of oil slick dispersion. The calculation of a
FIR would provide a basic, dimensionless assessment of the extent of oil dispersion
without having to measure oil concentration. However, instead of being used to estimate
a discrete value of dispersion efficiency, the FIR would be better utilized as a screening
tool at the high oil concentrations found early on during a spill. Employed in this way, a
FIR value of less or greater than a threshold of 4 would act as a “yes/no” index of
sufficient oil dispersion.
12
References
Bugden, J. B. C., C. W. Yeung, P. E. Kepkay, and K. Lee. 2008. Application of
ultraviolet fluorometry and excitation-emission matrix spectroscopy (EEMS) to
fingerprint oil and chemically dispersed oil in seawater. Marine Pollution Bulletin.
56, 677-685.
Chapman, H., K. Purnell, R. J. Law, amd M. F. Kirby. 2007. The use of chemical
dispersants to combat oil spills at sea: A review of practice and research needs in
Europe. Marine Pollution Bulletin. 54, 827-838.
Fiocco, R.J, and A. Lewis. 1999. Oil spill dispersants. Pure Appl. Chem., 71(1), 27-42.
Genders, S., 1988. In-situ detection and tracking of oil in the water column. Oil &
Chemical Pollution 4, 113-126.
Higashi, K., and K. Hagiwara. 1980. Characterization of spilled oils by measuring
fluorescence emission spectra of fractions separated by high-speed gel-permeation
chromatography. Fresenius Z. Anal. Chem. 302, 281-285.
Horvitz, L., 1976. Hydrocarbon geochemical exploration after fifty years. In
Unconventional methods in exploration for petroleum and natural gas IV. Southern
Methodist University Press, Dallas.
Hurford, N., I. Buchanan, R.J. Law, and P.M. Hudson. 1989. Comparison of two
fluorometers for measuring oil concentrations in the sea. Oil & Chemical Pollution 5,
379-389.
Kaku, V. J., M. C. Boufadel, A. D. Venosa, and J. Weaver. 2006. Flow dynamics in
eccentrically rotating flasks used for dispersant effectiveness testing. Environ. Fluid.
Mech. 6, 385-406.
13
Lessard, R. R., and G. Demarco. 2000. The significance of oil spill dispersants. Spill
Science & Technology Bull. 6, 59-68.
Li, M., and C. Garrett. 1998. The relationship between oil droplet size and upper ocean
turbulence. Marine Pollution Bulletin. 36, 961-970.
Li, Z., K. Lee, T. King, M.C. Boufadel, and A.D. Venosa. 2008. Assessment of chemical
dispersant effectiveness in a wave tank under regular non-breaking and breaking
wave conditions. Marine Pollution Bulletin. 56, 903-912.
Li, Z., K. Lee, T. King, M.C. Boufadel, and A.D. Venosa. 2012. Evaluating crude oil
chemical dispersion efficacy in a flow-through wave tank under regular non-breaking
wave and breaking wave conditions. Marine Pollution Bulletin. In press.
National Research Council, 1985. National Research Council: Oil in the sea: Inputs,
fates and effects. National Academy Press, Washington, DC.
National Research Council, 2005. National Research Council: Understanding oil spill
dispersants: Efficacy and effects. National Academy Press, Washington, DC.
Patra, D. & A. K. Mishra. 2002. Total synchronous fluorescence scan spectra of
petroleum products. Anal. Bioanal Chem. 373, 304-309.
Ryder, A. G. 2002. Quantitative analysis of crude oils by fluorescence lifetime and
steady state measurements using 380-nm excitation. Appl. Spectrosc. 56 (1), 107-116.
Special Monitoring of Applied Response Technologies (SMART).
http://response.restoration.noaa.gov/smart
Sorial, G.A., M. Asce; A.D. Venosa, K.M. Koran, E. Holder, and D.W. King. 2004. Oil
spill dispersant effectiveness protocol. I: Impact of operational variables. J. Environ.
Engineering, 130(10), 1073-1084.
14
Sotelo, F.F, P. A. Pantoja, J. Lopez-Gejo, G.A.C. Le Roux, F.H. Quina, and C. A. O
Nascimento. 2008. Application of fluorescence spectroscopy for spectral
discrimination of crude oil samples. Brazilian J. Petroleum and Gas. 2(2), 9-17.
Thruston, A.D., and R.W. Knight. 1971. Characterization of Crude and residual-type oils
by fluorescence spectroscopy. Environ. Sci & Technology. 5(1), 64-69.
Venosa AD, Zhu X. 2003. Biodegradation of crude oil contaminating marine shorelines
and freshwater wetlands. Spill Science and Technology Bull. 8, 163-178.
Venosa, A.D., D.W. King, and G.A. Sorial. 2002. The baffled flask test for dispersant
effectiveness: A round robin evaluation of reproducibility and repeatability. Spill Sci.
& Technol. Bull. 7(5&6), 299-308.
Von der Dick, H. & W. Kalkreuth. 1985. Synchronous excitation and three-dimensional
fluorescence spectroscopy applied to organic geochemistry. Adv. Org. Geochem. 10,
633-639.
Wakeman, S. 1977. Synchronous fluorescence spectroscopy and its application to
indigenous and petroleum-derived hydrocarbons in lacustrine sediments. Environ. Sci
& Technology. 11(3), 272-276.

15
Table 1. Dynamic viscosity (DV), fluorescence intensity ratio (FIR), and the reduction inFIR of thirteen crude oils when dispersed in seawater (SW) in the presence of Corexit9500. The change in FIR was calculated by dividing the FIR of chemically dispersedoil (DOR 1:10, 1:20, and 1:40) by the FIR of oil dispersed in seawater alone (DOR 0)to obtain the fraction or percent reduction.
Oil DV SW (DOR 0) SW + Corexit (DOR 1:10) SW + Corexit (DOR 1:20) SW + Corexit (DOR 1:40)(cP) FIR FIR % Reduction FIR % Reduction FIR % Reduction
Low -- Dynamic Viscosity between 1 and 50cPFederated 4 4.515 0.050 98.9 0.050 98.9 0.061 98.6Brent Blend 6 9.398 0.070 99.3 0.088 99.1 0.104 98.9Gullfaks 13 5.609 0.106 98.1 0.091 98.4 0.102 98.2Terra Nova 22 9.733 0.057 99.4 0.064 99.3 0.059 99.4Hibernia 49 8.510 0.060 99.3 0.073 99.1 0.076 99.1
Medium -- Dynamic Viscosity between 51 and 400cPVasconia 72 24.081 0.192 99.2 0.244 99.0 0.399 98.3Lago 153 9.767 0.155 98.4 0.178 98.2 0.209 97.9Maya 280 27.836 1.653 94.1 3.446 87.6 3.313 88.1
Santa Clara 304 10.523 0.604 94.3 1.007 90.4 1.616 84.6High -- Dynamic Viscosity between 401 and 14470cP
Hondo 735 10.050 1.030 89.8 2.760 72.5 3.150 68.7IFO 180 2324 31.860 0.510 98.4 0.900 97.2 2.560 92.0Belridge 12610 7.300 1.080 85.2 1.850 74.7 2.650 63.7IFO 300 14470 60.081 1.163 98.1 2.086 96.5 2.990 95.0

16
Table 2. Dispersion efficiency (% dispersed) of thirteen oils, calculated by dividingdispersed oil concentration (measured as total petroleum hydrocarbon - TPH) dividedby the amount of oil added during each treatment and expressed as a percentage.
Oil DOR%
Dispersed%
Dispersed Oil DOR%
Dispersed%
Dispersed(Mean) (St.Dev.) (Mean) (St.Dev.)
Federated 10 88.9 3.2
LowViscosity
Oils
Brent 10 91.0 7.6Federated 20 89.0 7.8 Brent 20 93.4 1.7Federated 40 91.8 3.4 Brent 40 80.3 12.7Federated 0 6.6 2.6 Brent 0 9.6 5.2
Gulfaks 10 88.5 5.3 Terra Nova 10 90.1 6.7Gulfaks 20 88.9 0.3 Terra Nova 20 87.0 6.5Gulfaks 40 88.4 8.7 Terra Nova 40 86.3 2.4Gulfaks 0 16.6 4.8 Terra Nova 0 6.3 2.3
Hibernia 10 79.3 6.7Hibernia 20 85.5 2.6Hibernia 40 79.4 10.3Hibernia 0 9.6 2.3
Medium
ViscosityOils
Vasconia 10 76.8 10.9 Lago 10 82.7 9.5Vasconia 20 40.8 0.7 Lago 20 66.0 2.9Vasconia 40 41.9 0.9 Lago 40 74.0 15.8Vasconia 0 2.2 0.6 Lago 0 10.0 3.8
Maya 10 68.8 10.1 Santa Clara 10 85.1 2.2Maya 20 58.7 16.6 Santa Clara 20 85.2 2.8Maya 40 55.8 10.1 Santa Clara 40 75.5 3.5Maya 0 2.1 0.3 Santa Clara 0 12.3 3.8
High
ViscosityOils
Hondo 10 78.3 5.9 IFO180 10 80.6 4.5Hondo 20 73.5 2.3 IFO180 20 68.5 11.3Hondo 40 63.4 0.9 IFO180 40 77.6 3.0Hondo 0 1.2 0.9 IFO180 0 3.3 0.8
Belridge 10 73.8 5.1 IFO300 10 56.7 4.4Belridge 20 69.0 7.8 IFO300 20 51.3 9.9Belridge 40 61.5 9.5 IFO300 40 47.2 15.4Belridge 0 17.3 5.6 IFO300 0 1.4 0.6
17
Figure 1. Blank-corrected contour plot of IFO 180 crude oil fluorescence at fourdispersant to oil ratios: 0, 1:40 (2.5% dispersant), 1:20 (5% dispersant) and 1:10(10% dispersant). The 280nm excitation wavelength (white dashed line), and the340nm and 445nm emission wavelengths (white boxes) used for fluoresnceintensity ratio (FIR) calculations are shown for reference.
IFO 180 OilDOR 1:20
Excitation Wavelength (nm)
240 260 280 300 320 340
EmissionWavelength(nm)
300
350
400
450
500
550
600
IFO 180 OilDOR 1:10
Excitation Wavelength (nm)
240 260 280 300 320 340
YData
300
350
400
450
500
550
600
IFO 180 OilDOR 0
240 260 280 300 320 340
EmissionWavelength(nm)
300
350
400
450
500
550
600
0102030405060
IFO 180 OilDOR 1:40
240 260 280 300 320 340
300
350
400
450
500
550
600

18
Figure 2. Fluorescence emission spectra of IFO 180 crude oil at an excitationwavelength of 280nm for various dispersant to oil ratios (DOR). The arrowsindicate the position of the 340 and 445 nm emission peaks used in the fluorescenceintensity ratio (FIR) calculation.
19
Figure 3. Log plots of mean fluorescence intensity ratio (FIR) versus dynamic viscosityof thirteen reference oils in seawater. Three Corexit 9500 to oil ratios of 1:40 (2.5%dispersant), 1:20 (5 % dispersant) and 1:10 (10 % dispersant) were compared toresults obtained with only oil dispersed (DOR 0).

20
Figure 4. Cluster plot (A) of fluorescence intensity ratio (FIR) versus the percentdispersion efficiency in seawater (as determined from total petroleum hydrocarbonmeasurements) for the 13 reference oils. The lower graph (B) expands the 0 to 10scale of FIR, and the black dashed line indicates the threshold ratio (FIR = 4),below which oil is dispersed with an efficiency of at least 40%.
A
B

21
Acknowledgements:
We gratefully acknowledge Encana Corporation for their financialsupport of this research