The First Year - mufg.jp · Standard & Poor’s (Long Term) BBB BBB 60,000 40,000 20,000 0 Loans...
144
ANNUAL REPORT 2002 Year ended March 31, 2002 The First Year • Goals • Commitments • Actions Accelerating the pace of progress !
Transcript of The First Year - mufg.jp · Standard & Poor’s (Long Term) BBB BBB 60,000 40,000 20,000 0 Loans...

ANNUAL REPORT 2002 Year ended March 31, 2002
The First Year
• Goals
• Commitments
• Actions
Accelerating the pace of progress !

The First YearUFJ—LEVERAGING DISTINCTIVE SKILLS TO REACH STRATEGIC GOALS
The UFJ Group was formed in April 2001 upon the establishment of UFJ Holdings, inte-
grating Sanwa Bank, Tokai Bank and Toyo Trust. The central objective is to become a
leading comprehensive financial group in Japan, offering banking, trust, securities, asset
management, credit card and many other services from a unified platform.
To realize this goal, the UFJ Group has been aggressively building a framework capa-
ble of supporting a broad range of financial services. In January 2002, UFJ Bank was
established through the merger of Sanwa Bank and Tokai Bank, and Toyo Trust was
renamed UFJ Trust. Integrations of other group companies are proceeding smoothly as
well. These actions are making the UFJ brand synonymous with quality, competitive ser-
vices in all sectors of the financial marketplace.
As the UFJ Group makes progress toward its strategic goal, numerous actions are
being taken to improve profitability. In this regard, the group is focusing on three critical
areas: building on strengths in the core retail and medium-sized corporate markets;
restoring asset quality; and maximizing integration benefits.
Combining a clear strategic focus with a commitment to producing concrete results,
the UFJ Group is determined to lead the way in creating a new paradigm in Japan for the
provision of financial services.
Financial Highlights • 4
Commitments:
Message from the President • 6
Actions: Accelerating Progress
in Building a Profitable Operating Base • 9
Management’s Discussion and Analysis • 23
The UFJ Group Management System • 44
Internal Control Systems of the UFJ Group • 46
Corporate Citizenship • 70
Corporate Data • 72
Financial Section • 81
Further Information • 140
CONTENTS
1
Toward the New Financial Services
Goals
April • UFJ Holdings is established.
• Asset management companies are integrated to form UFJ Partners
Asset Management and UFJ Asset Management.
• IT operations are unified in newly formed company called UFIT.
July • Securities subsidiaries are merged to form
UFJ Capital Markets Securities.
January • Sanwa Bank and Tokai Bank are merged to form UFJ Bank.
• Toyo Trust is renamed UFJ Trust.
• Financial One Card and Million Card Service are merged to form
UFJ Card.
• Venture capital companies are merged to form UFJ Capital.
April • SRIC Corporation (Sanwa Research Institute) and Tokai Research
& Consulting are merged to form UFJ Institute.
June • UFJ Capital Markets Securities and TSUBASA Securities are
merged to form UFJ Tsubasa Securities.
July • Sanwa Business Credit and Central Factors are merged to
form UFJ Business Finance.
2001
2002

Actions
Solutions—Excellence in customer service demands
a powerful infrastructure and the ability to approach
issues from many angles. The UFJ Group’s solutions for
customers encompass financing, restructuring , e-busi-
ness platforms and much more.
IT Infrastructure—The UFJ Group is
investing aggressively in IT, retaining a tight
focus on structuring systems and software that
will contribute most to making the group more
competitive.
Action:
The UFJ Group made much progress in developing
a new mainframe system that excels in terms of flexi-
bility, performance and efficiency. The new system
can easily accommodate new businesses and
alliances with partners, making it well suited to sup-
porting a comprehensive line of financial services.
Group Integration—Just over one year after the
group’s formation, a unified framework is in place for all
core businesses. The UFJ Group can now channel all its
energy toward becoming a comprehensive financial group.
Restructuring—In terms of the number of offices, work-
force reductions and many other areas, the post-integration
restructuring of the UFJ Group has been implemented with
speed and efficiency.
System Integration—Banking IT systems
were integrated in January 2002, when Sanwa
Bank and Tokai Bank merged to form UFJ Bank.
A first in Japan’s banking industry, this feat
enabled all branches of the new bank to extend an
identical line up of products and services.
INNOVATION
SPEED
Action:
The UFJ Group offers advanced solutions such
as global cash management, payroll and other
settlement-related services for corporate clients.
In addition to such services, our solutions
encompass credit enhancement, streamlined
clerical tasks, authentication for e-commerce.
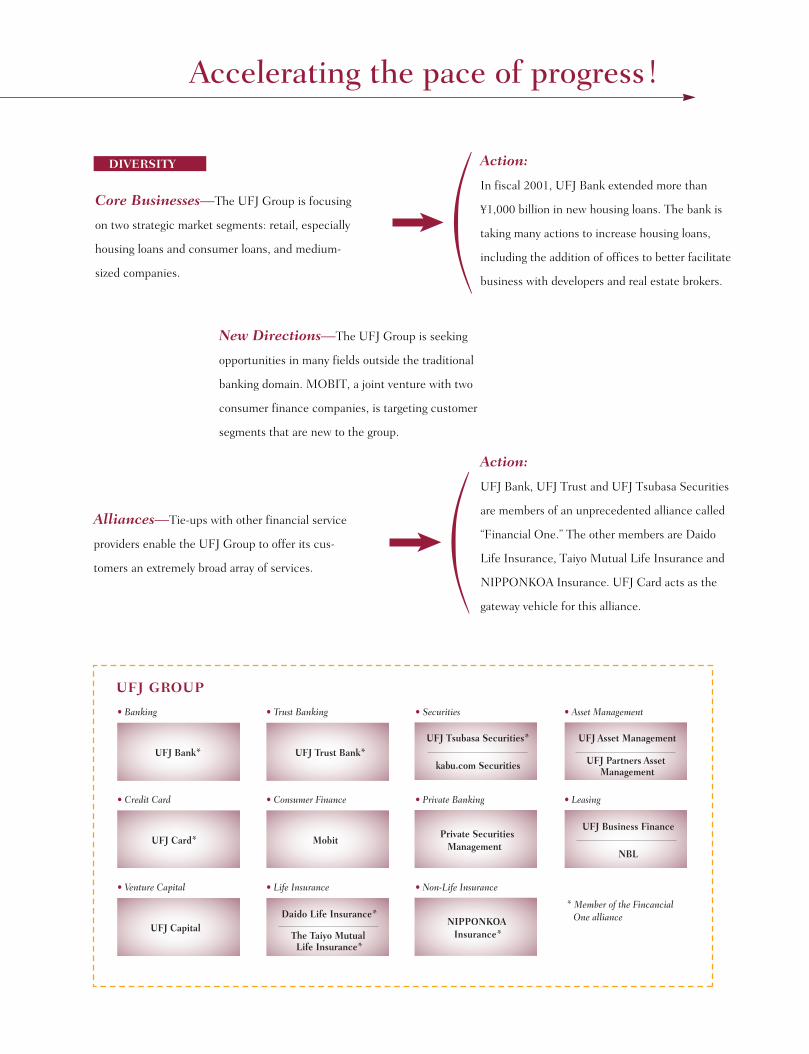
• Banking • Trust Banking • Securities • Asset Management
UFJ Bank*
UFJ GROUP
UFJ Trust Bank*UFJ Tsubasa Securities*
• Credit Card • Consumer Finance • Private Banking • Leasing
UFJ Card* MobitUFJ Business Finance
NBL
Private Securities Management
kabu.com Securities
UFJ Asset Management
UFJ Partners Asset Management
• Venture Capital • Life Insurance • Non-Life Insurance
* Member of the Fincancial One alliance
UFJ CapitalThe Taiyo Mutual Life Insurance*
Daido Life Insurance*NIPPONKOA
Insurance*
Accelerating the pace of progress !
Action:
In fiscal 2001, UFJ Bank extended more than
¥1,000 billion in new housing loans. The bank is
taking many actions to increase housing loans,
including the addition of offices to better facilitate
business with developers and real estate brokers.
Core Businesses—The UFJ Group is focusing
on two strategic market segments: retail, especially
housing loans and consumer loans, and medium-
sized companies.
Action:
UFJ Bank, UFJ Trust and UFJ Tsubasa Securities
are members of an unprecedented alliance called
“Financial One.” The other members are Daido
Life Insurance, Taiyo Mutual Life Insurance and
NIPPONKOA Insurance. UFJ Card acts as the
gateway vehicle for this alliance.
New Directions—The UFJ Group is seeking
opportunities in many fields outside the traditional
banking domain. MOBIT, a joint venture with two
consumer finance companies, is targeting customer
segments that are new to the group.
Alliances—Tie-ups with other financial service
providers enable the UFJ Group to offer its cus-
tomers an extremely broad array of services.
DIVERSITY
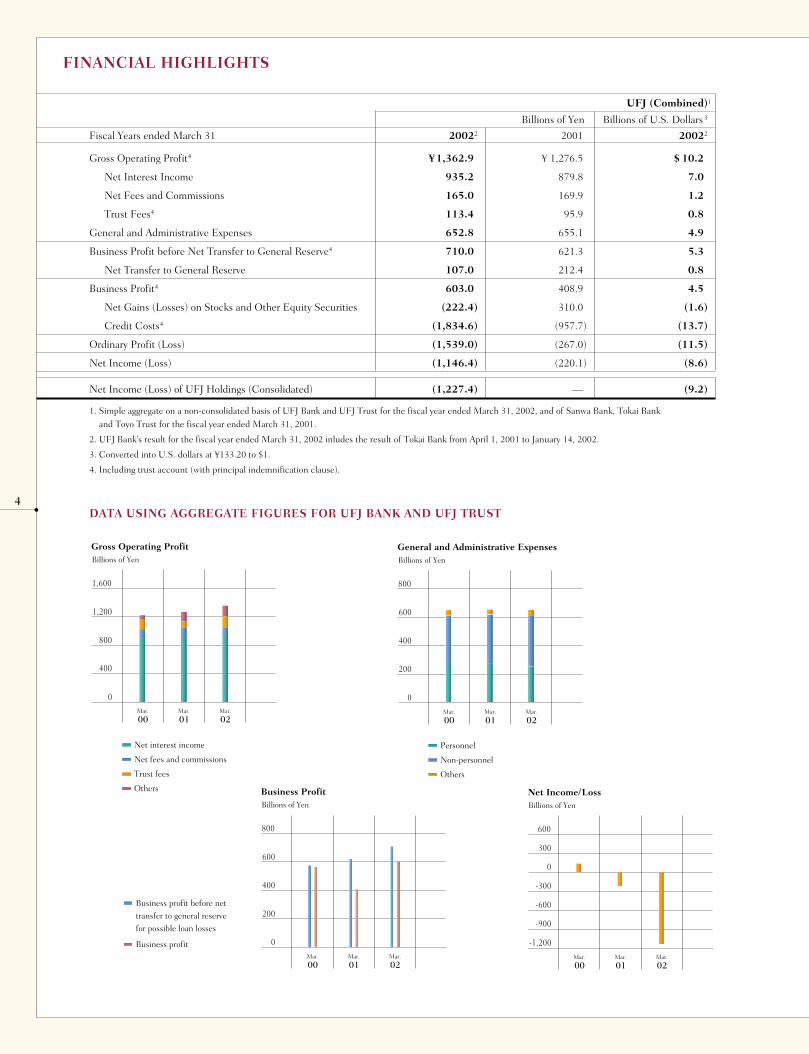
FINANCIAL HIGHLIGHTS
1. Simple aggregate on a non-consolidated basis of UFJ Bank and UFJ Trust for the fiscal year ended March 31, 2002, and of Sanwa Bank, Tokai Bankand Toyo Trust for the fiscal year ended March 31, 2001.
2. UFJ Bank’s result for the fiscal year ended March 31, 2002 inludes the result of Tokai Bank from April 1, 2001 to January 14, 2002.
3. Converted into U.S. dollars at ¥133.20 to $1.
4. Including trust account (with principal indemnification clause).
DATA USING AGGREGATE FIGURES FOR UFJ BANK AND UFJ TRUST
1,600
800
1,200
400
0
Gross Operating ProfitBillions of Yen
00Mar.
01Mar.
02Mar.
Net interest income
Net fees and commissions
Trust fees
Others
800
400
600
200
0
General and Administrative Expenses Billions of Yen
00Mar.
01Mar.
02Mar.
Personnel
Non-personnel
Others
600
-300
0
-600
-1,200
Net Income/Loss
300
-900
Billions of Yen
00Mar.
01Mar.
02Mar.
800
400
600
200
0
Business ProfitBillions of Yen
00Mar.
01Mar.
02Mar.
Business profit before net
transfer to general reserve
for possible loan losses
Business profit
UFJ (Combined)1
Billions of Yen Billions of U.S. Dollars3
Fiscal Years ended March 31 20022 2001 20022
Gross Operating Profit4 ¥1,362.9 ¥ 1,276.5 $ 10.2
Net Interest Income 935.2 879.8 7.0
Net Fees and Commissions 165.0 169.9 1.2
Trust Fees4 113.4 95.9 0.8
General and Administrative Expenses 652.8 655.1 4.9
Business Profit before Net Transfer to General Reserve4 710.0 621.3 5.3
Net Transfer to General Reserve 107.0 212.4 0.8
Business Profit4 603.0 408.9 4.5
Net Gains (Losses) on Stocks and Other Equity Securities (222.4) 310.0 (1.6)
Credit Costs4 (1,834.6) (957.7) (13.7)
Ordinary Profit (Loss) (1,539.0) (267.0) (11.5)
Net Income (Loss) (1,146.4) (220.1) (8.6)
Net Income (Loss) of UFJ Holdings (Consolidated) (1,227.4) — (9.2)
4
CREDIT RATINGS
UFJ Bank UFJ Trust
Moody’s (Long Term) A3 Baa1
Standard & Poor’s (Long Term) BBB BBB
60,000
40,000
20,000
0
Loans and Bills Discounted Billions of Yen
00Mar.
01Mar.
02Mar.
60,000
40,000
20,000
0
Deposits and Trust Account Products Billions of Yen
00Mar.
01Mar.
02Mar.
15
10
5
0
Capital Ratios (Consolidated)%
Capital ratio
Tier 1 ratio
00Mar.
01Mar.
02Mar.
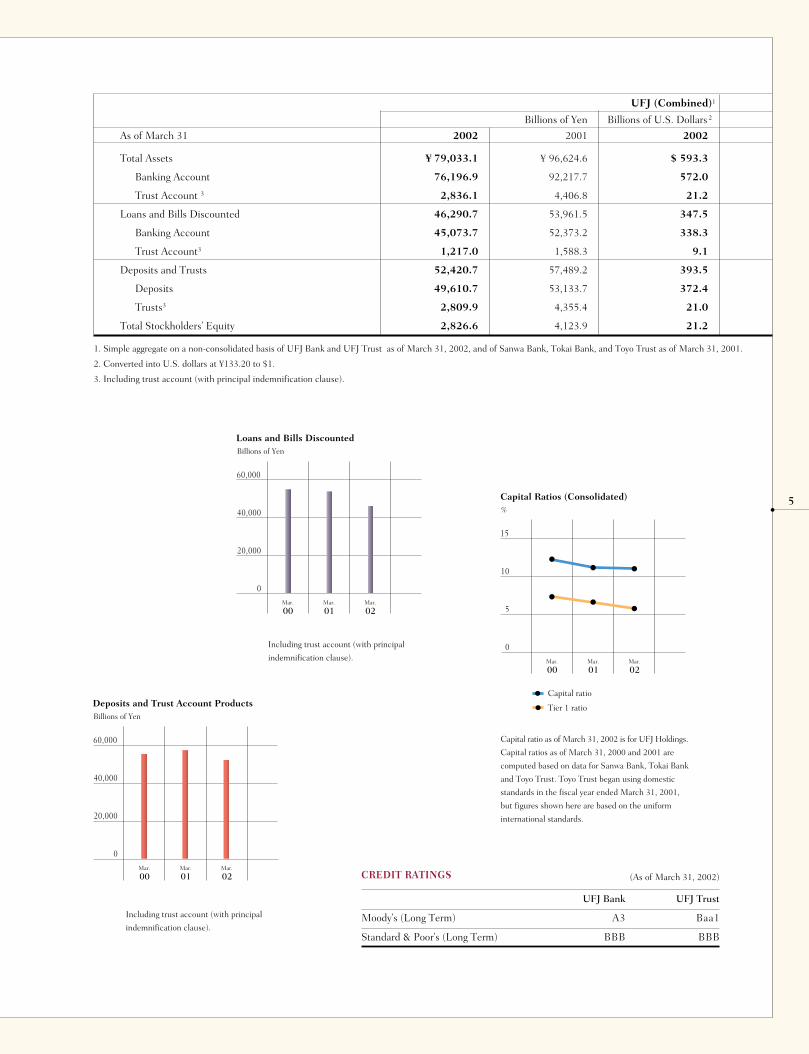
1. Simple aggregate on a non-consolidated basis of UFJ Bank and UFJ Trust as of March 31, 2002, and of Sanwa Bank, Tokai Bank, and Toyo Trust as of March 31, 2001.
2. Converted into U.S. dollars at ¥133.20 to $1.
3. Including trust account (with principal indemnification clause).
5
Including trust account (with principal
indemnification clause).
Including trust account (with principal
indemnification clause).
(As of March 31, 2002)
UFJ (Combined)1
Billions of Yen Billions of U.S. Dollars 2
As of March 31 2002 2001 2002
Total Assets ¥ 79,033.1 ¥ 96,624.6 $ 593.3
Banking Account 76,196.9 92,217.7 572.0
Trust Account 3 2,836.1 4,406.8 21.2
Loans and Bills Discounted 46,290.7 53,961.5 347.5
Banking Account 45,073.7 52,373.2 338.3
Trust Account3 1,217.0 1,588.3 9.1
Deposits and Trusts 52,420.7 57,489.2 393.5
Deposits 49,610.7 53,133.7 372.4
Trusts3 2,809.9 4,355.4 21.0
Total Stockholders’ Equity 2,826.6 4,123.9 21.2
Capital ratio as of March 31, 2002 is for UFJ Holdings.
Capital ratios as of March 31, 2000 and 2001 are
computed based on data for Sanwa Bank, Tokai Bank
and Toyo Trust. Toyo Trust began using domestic
standards in the fiscal year ended March 31, 2001,
but figures shown here are based on the uniform
international standards.

6
In our first year of operations, we surpassed our initial goals in many respects, despite facing extremely
challenging economic conditions in Japan. Perhaps most noteworthy were the numerous actions we
took to quickly reap the benefits of the April 2001 integration that formed the UFJ Group. In January
2002, Sanwa Bank and Tokai Bank merged to create UFJ Bank, and Toyo Trust was renamed UFJ Trust;
two moves that greatly increased the visibility of the UFJ brand. Other actions were branch consolida-
tions, workforce reductions and various steps to improve customer services while streamlining our
infrastructure. We also took decisive actions that bring within sight an end to the problem loan issue.
Collectively, our first-year accomplishments give us a solid base for reaching our goal of becoming a
comprehensive financial group offering services that are both innovative and highly sophisticated. As
this year’s annual report states, we are accelerating the pace of progress.
PROGRESS AMID INSTABILITY AND UNCERTAINTY
Our first year was a tumultuous period in economic terms. Japan’s economy was weakened by declining corporate earn-
ings and deflationary forces, as well as the U.S. slowdown. Deregulation and advances in IT created a more unrestricted
operating environment for us, but these developments have also led to more intense competition in the financial ser-
vices market. Furthermore, we witnessed a series of large-scale bankruptcies. This prompted special inspections of
Japanese banks by the Financial Services Agency and put the problem loan issue in the headlines for much of the year.
As these events unfolded, the UFJ Group integrated its operations in a speedy manner. Exemplifying this was the
January 2002 merger that formed UFJ Bank. We completed all computer system integration processes immediately prior
to this merger, a feat unmatched by any other Japanese bank. To improve profitability, we focused on reaping economies
of scale created by the formation of UFJ Group while also drawing on our much broader resource base to enhance
customer services. These efforts enabled us to secure solid core earnings in the past fiscal year. But our decision to
achieve the final resolution of the problem loan issue led to ¥2 trillion in credit-related expenses, causing UFJ Holdings
to report a net loss of more than ¥1.2 trillion.
Due to this loss, the difficult decision was made to suspend the common stock dividend for the year. This move
reflects our belief that limiting outflows of capital and preserving a sound financial position are in the best interests of
shareholders in this time of uncertainty.
EARNING THE TRUST OF CUSTOMERS AND SOCIETY
The UFJ Group’s vision is “to be an innovative financial group with deep commitments to society, growing together with
customers.” To translate this vision into concrete actions and be the customers’ preferred financial group, we are con-
centrating on the following three issues.
6
Commitments:M E S S A G E F R O M T H E P R E S I D E N T

● A Financial Group That Is a Responsible Corporate Citizen
Above all, we must improve our financial strength and stability to earn the trust of customers. As a provider of banking,
trust and other financial services, financial soundness is, of course, essential to fulfilling our social obligations, as well as
to gaining a reputation that makes us the first choice of customers.
An exceptional arrangement that protected the entire amount of all deposits under the Deposit Insurance
Corporation of Japan partially expired at the end of March 2002. This change caused the public to take a much closer
look at the financial condition of banks. The UFJ Group is addressing this issue from many angles: bold actions regard-
ing loans to troubled large borrowers; decisive steps aimed at resolving the entire problem loan issue; sales of stock to
reduce exposure to market risk; workforce reductions, branch consolidations and other actions to cut costs that are well
ahead of our initial revitalization plan target; a program to improve interest rate spreads on loans to strengthen our profit
structure; and a drive to increase non-interest income. We are also enhancing our disclosure activities to make our
strategies and operations as transparent and easy to understand as possible.
● A Financial Group That Grows Alongside Its Customers
Developing and prospering hand in hand with our customers is a central tenet of our corporate vision. This is why we
are looking beyond conventional boundaries of banking and trust services. Our goal is to make full use of our position as
a comprehensive financial group, supplying an array of solutions that span the broadest possible range of issues in our
7
Takeshi Sugihara
President and
Chief Executive Officer
7
customers’ personal lives and businesses. We want to offer these solutions with the optimal content, timing and service
channels. This is how we intend to become our customers’ first choice for financial services such as fund procurement
and asset management products, for pension, real estate and other trust services, and for a variety of sophisticated finan-
cial tools ranging from securitization to derivatives. Through this stance, we plan to establish the UFJ brand as a symbol
of excellence to all customers, with particular emphasis on our two strategic market sectors: services for individuals and
for small and medium-sized companies.
● A Group That Takes a Long-Term Perspective
We must always think innovatively. Our activities must reflect a visionary approach that is not limited by the bounds of
traditional banking, but instead aim to create a new paradigm in financial services. The UFJ Group will always seek new
heights in convenience, value and creativity in ways to serve customers. As one way to accomplish this, we will remain
open-minded about alliances with various non-bank financial companies outside the group. The result will be the ability
to offer our customers greater value. Ultimately, we want to position the UFJ Group as one of Japan’s preeminent
providers of a comprehensive line of financial services.
● More Progress in Our Second Year and Beyond
In June 2002, I became president of UFJ Holdings, succeeding Hideo Ogasawara. I pledge to carry on with the same
forceful actions to achieve the financial goals that Mr. Ogasawara set in motion during our first year. As I outlined earli-
er in this letter, two key words are guiding our actions: speed and innovation. The difficulties faced by the UFJ Group
and many other Japanese banks have been well publicized. On the other hand, the considerable strengths of the UFJ
Group tend to be overlooked sometimes. This year’s annual report is structured to present a balanced view of our
group—it covers both pressing issues and the reasons we are confident about the future. I firmly believe that the many
achievements of our first year bode well for the long-term prospects of every member of the UFJ Group.
Takeshi Sugihara
President and Chief Executive Officer
UFJ Holdings, Inc.
September 2002
8
9
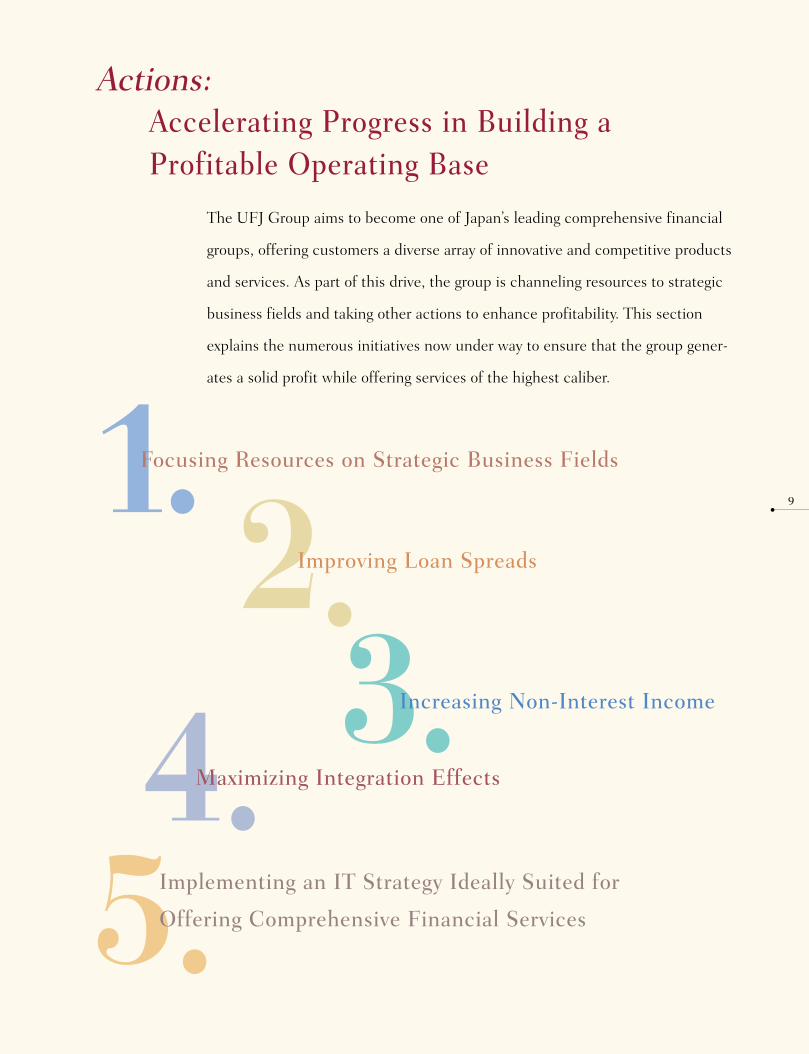
Actions:Accelerating Progress in Building a Profitable Operating Base
The UFJ Group aims to become one of Japan’s leading comprehensive financial
groups, offering customers a diverse array of innovative and competitive products
and services. As part of this drive, the group is channeling resources to strategic
business fields and taking other actions to enhance profitability. This section
explains the numerous initiatives now under way to ensure that the group gener-
ates a solid profit while offering services of the highest caliber.
1.Focusing Resources on Strategic Business Fields
2.Improving Loan Spreads
3.Increasing Non-Interest Income
4.Maximizing Integration Effects
5.Implementing an IT Strategy Ideally Suited for
Offering Comprehensive Financial Services
Actions:
1.10
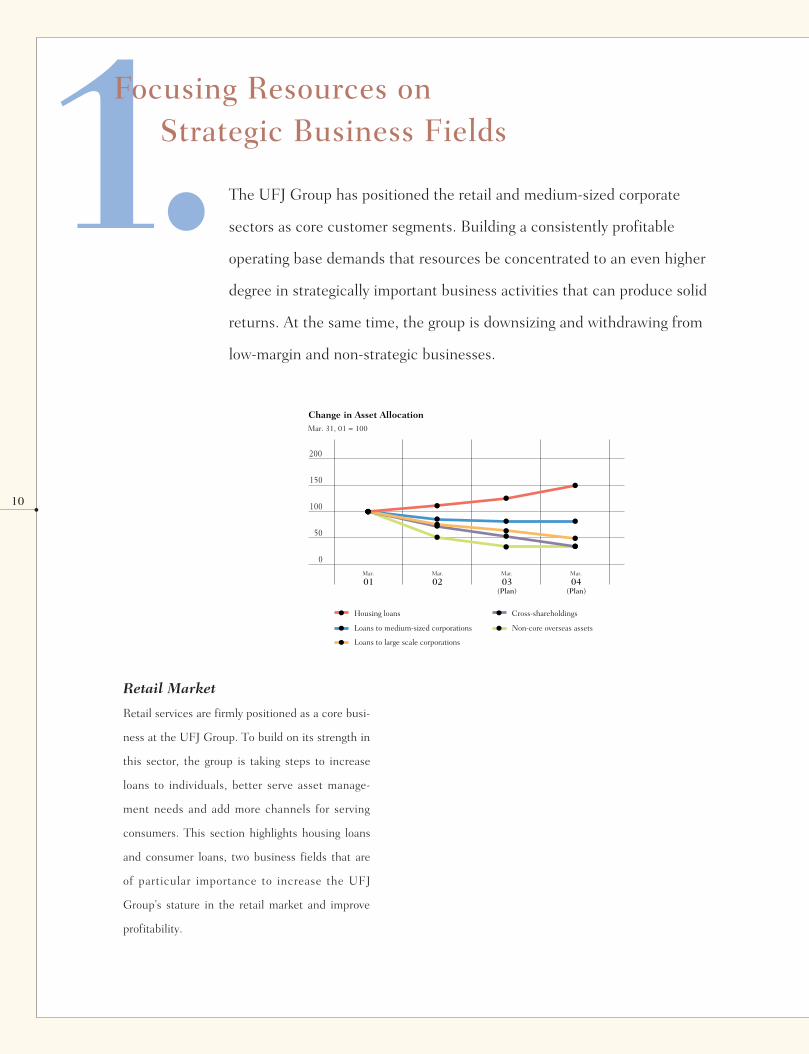
Focusing Resources on Strategic Business Fields
The UFJ Group has positioned the retail and medium-sized corporate
sectors as core customer segments. Building a consistently profitable
operating base demands that resources be concentrated to an even higher
degree in strategically important business activities that can produce solid
returns. At the same time, the group is downsizing and withdrawing from
low-margin and non-strategic businesses.
Retail Market
Retail services are firmly positioned as a core busi-
ness at the UFJ Group. To build on its strength in
this sector, the group is taking steps to increase
loans to individuals, better serve asset manage-
ment needs and add more channels for serving
consumers. This section highlights housing loans
and consumer loans, two business fields that are
of particular importance to increase the UFJ
Group’s stature in the retail market and improve
profitability.
200
100
50
0
Change in Asset AllocationMar. 31, 01 = 100
150
Housing loans
Loans to medium-sized corporations
Loans to large scale corporations
Cross-shareholdings
Non-core overseas assets
01Mar.
03(Plan)
Mar.
04(Plan)
Mar.
02Mar.

11
• Housing Loans
Already a core strength of UFJ Bank, housing loans are positioned as a key driver
of growth in retail services, providing a reliable source of long-term income. The
goal is to be Japan’s leading provider of housing loans. One initiative is deepening
and increasing relationships with developers and real estate brokers, through
whom customers apply for UFJ Bank’s housing loans. About three-quarters of
UFJ Bank’s new housing loans come through these companies. To serve cus-
tomers better, the time required for the loan application process has been signifi-
cantly shortened by increasing the efficiency of the credit investigation process
and by improving the auto-scoring model. Due to these efforts, UFJ Bank booked
more than ¥1,000 billion in new housing loans during the fiscal year ended
March 2002, recording a net increase in housing loans of ¥440.5 billion to
¥5,439.0 billion.
There is still more room for growth. The downsizing of the Government
Housing Loan Corporation may result in more demand for private sector funding.
UFJ Bank is responding aggressively by introducing new types of products, such
as a 30-year fixed rate housing loan, and increasing the number of housing loan
offices to build more ties with developers and real estate brokers. Additionally,
steps to streamline administrative tasks at housing loan offices are giving sales
personnel more time to reinforce relationships with more developers and real
estate brokers. Through these measures, UFJ Bank expects to increase both
housing loans outstanding and its market share.
THE UFJ GROUP’S STRENGTHS IN HOUSING
LOANS
● Strong ties with developers and real estate brokers
● Quick response to loan applications
● Diverse loan line up
6,000
3,000
4,500
1,500
0
Housing Loans
Billions of Yen
01Mar.
02Mar.
01Sept.

12
MOBIT—A NEW KIND OF CONSUMER FINANCE
COMPANY
● Targeting new market segments not served by banks and
consumer finance companies.
● Offering unsurpassed convenience; allows customers to
apply for loans by phone, fax, the Internet and automated
loan contract machines; allows customers to receive cash
and make loan payments at the nationwide ATM network
of UFJ Bank.
● Combining consumer finance company expertise and the
trusted UFJ brand.
• Consumer Loans
Along with housing loans, consumer loans are positioned as a growing retail business
at the UFJ Group. Offering comparatively high returns and the advantage of spread-
ing risk over many borrowers, consumer loans represent an opportunity for the UFJ
Group to increase profitability.
Our main growth engine in this field is MOBIT Co., Ltd., which was formed
with consumer finance companies Promise Co., Ltd. and Aplus Co., Ltd. Operations
began in September 2000. Backed by the specialized skills of the two partner con-
sumer finance companies and the UFJ brand, MOBIT has grown steadily. As of
March 31, 2002, there were 113,000 customer accounts and total loans of ¥64.1 bil-
lion. MOBIT also guarantees consumer loans of regional banks. By the end of
March 2002, this company had guaranteed ¥5.9 billion of loans at eight regional
banks. Adding another service channel, MOBIT in May 2002 began installation of
automated loan contract machines at UFJ Bank ATM service locations.
80
40
60
20
0
120
60
90
30
0
Loans and Accounts at MOBIT Billions of Yen Thousands
Loans (left scale)
Accounts (right scale)
01Mar.
02Mar.
01Sept.

13
STRATEGIC ACTIVITIES
● Assist large corporations procure funds by such means as syndicated loans, management buyouts
and securitization.
● Offer various services targeting the asset management needs of individuals; enhance product line-
ups, such as in foreign-currency deposits and investment trusts; reinforce sales personnel at
branches, including the posting of specialists in serving high-net-worth individuals.
● Improve service channels to make more of UFJ Bank’s services available at any time and location;
actions include enhancing the convenience at conventional branches, the more efficient allocation
of ATM and other automated facilities, and the use of other direct means of customer contact
such as the Internet.
NON-STRATEGIC ACTIVITIES
The selective focus of resources on strategic fields also entails moving assets out of low-return invest-
ments and activities that are inconsistent with long-term strategies. The following are a few examples.
● Restructure the portfolio of overseas loans to non-Japanese borrowers (UFJ Bank sold its banking
subsidiary in California in March 2002).
● Reduce cross-shareholdings, freeing up capital for use in strategic, high-return activities and mak-
ing the balance sheet more productive.
Medium-Sized Corporate Market
The UFJ Group has been focusing on the needs of medium-sized and smaller companies,
which rely more on bank loans than do large corporations. In addition to loans, the group
offers payment and settlement services, foreign exchange services, and other support for day-
to-day business activities. Expertise extends to support for entering overseas markets.
Overseas, the UFJ Group is placing emphasis on assisting medium-sized and small
Japanese companies, including their local subsidiaries and affiliates, especially in their activi-
ties in Asia. Potential is particularly great in China, which recently joined the World Trade
Organization. UFJ Bank has five branches and one representative office in China (excluding
Hong Kong), which help customers expand their business activities in this market by providing
high-grade services and information that has been gathered and analyzed through an effective,
well-balanced service network.
Other Actions to Allocate Resources Strategically

14
2.The UFJ Group is moving quickly on many fronts to improve the perfor-
mance of its loan business, the largest source of its revenue. Insufficient
spreads on loans relative to risks are the main cause of the low level of
profitability at Japanese banks. Correcting this problem is therefore one of
the UFJ Group’s highest priorities.
Improving Loan Spreads
TARGETS FOR LOAN SPREAD INCREASES
● Spreads for ¥12 trillion of loans to 22,000 borrowers, where spreads are currently below
the standard, are to be increased by an average of 50 bp (basis points) from the present
100 bp to about 150 bp by the end of March 2004.
● With 50 bp improvement for targeted ¥12 trillion of loans, the average spread for the
entire corporate loan portfolio is to be increased by 20 bp (excluding loans to sub-standard
borrowers and lower, public and financial institutions, and large troubled borrowers).
Actions Toward Achieving Targeted Loan Spread
Although the UFJ Group banks have long been addressing the issue of
improving loan profitability, low interest rate spreads continue to hold back
group earnings. Recently, however, market conditions have become more
conducive to improving interest rate spreads. The decline in the number of
banks through mergers is alleviating the over-supply problem. Additionally,
borrowers are becoming more receptive to the idea that loan spreads should
cover credit risk and other costs of banks.
To capitalize on this opportunity, UFJ Bank is taking broad-based
actions to fundamentally alter how loan operations are conducted. Targets
have been set for loans where spreads are currently insufficient, and the
bank is conducting negotiations with the applicable borrowers. To make this
process go smoothly and increase transparency, UFJ Bank, in April 2002,
began disclosing its internal credit ratings to borrowers, providing one more
way to implement appropriate interest rates.
15
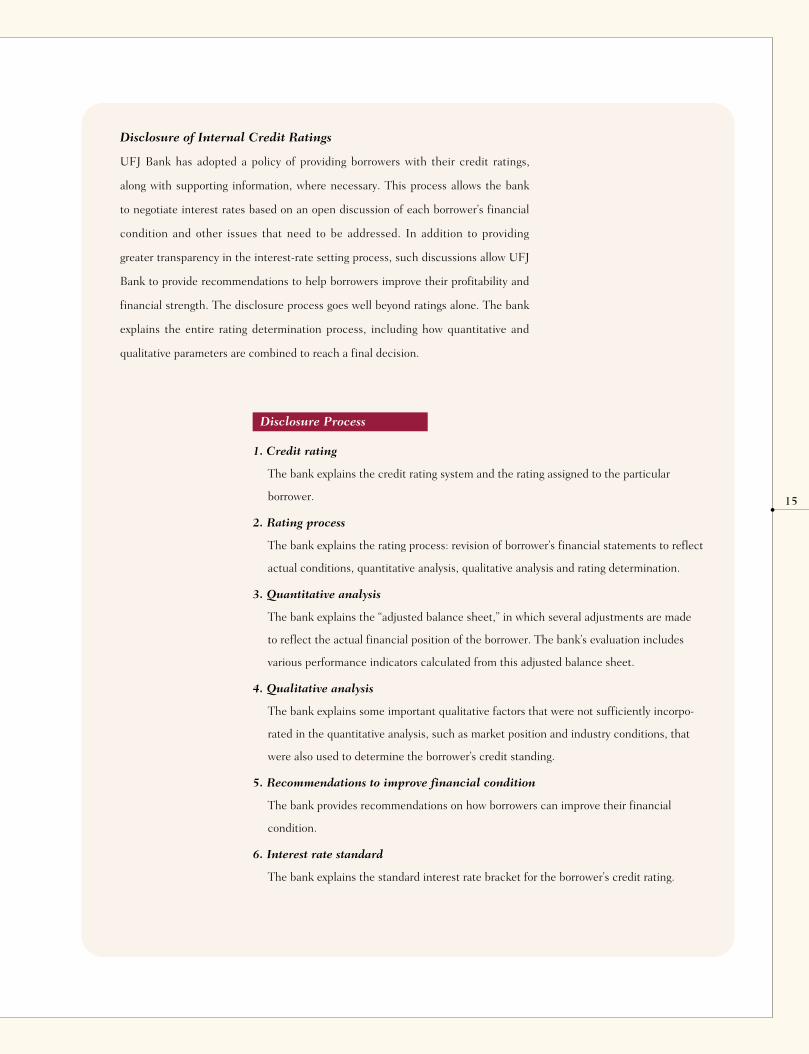
Disclosure of Internal Credit Ratings
UFJ Bank has adopted a policy of providing borrowers with their credit ratings,
along with supporting information, where necessary. This process allows the bank
to negotiate interest rates based on an open discussion of each borrower’s financial
condition and other issues that need to be addressed. In addition to providing
greater transparency in the interest-rate setting process, such discussions allow UFJ
Bank to provide recommendations to help borrowers improve their profitability and
financial strength. The disclosure process goes well beyond ratings alone. The bank
explains the entire rating determination process, including how quantitative and
qualitative parameters are combined to reach a final decision.
1. Credit rating
The bank explains the credit rating system and the rating assigned to the particular
borrower.
2. Rating process
The bank explains the rating process: revision of borrower’s financial statements to reflect
actual conditions, quantitative analysis, qualitative analysis and rating determination.
3. Quantitative analysis
The bank explains the “adjusted balance sheet,” in which several adjustments are made
to reflect the actual financial position of the borrower. The bank’s evaluation includes
various performance indicators calculated from this adjusted balance sheet.
4. Qualitative analysis
The bank explains some important qualitative factors that were not sufficiently incorpo-
rated in the quantitative analysis, such as market position and industry conditions, that
were also used to determine the borrower’s credit standing.
5. Recommendations to improve financial condition
The bank provides recommendations on how borrowers can improve their financial
condition.
6. Interest rate standard
The bank explains the standard interest rate bracket for the borrower’s credit rating.
Disclosure Process
16
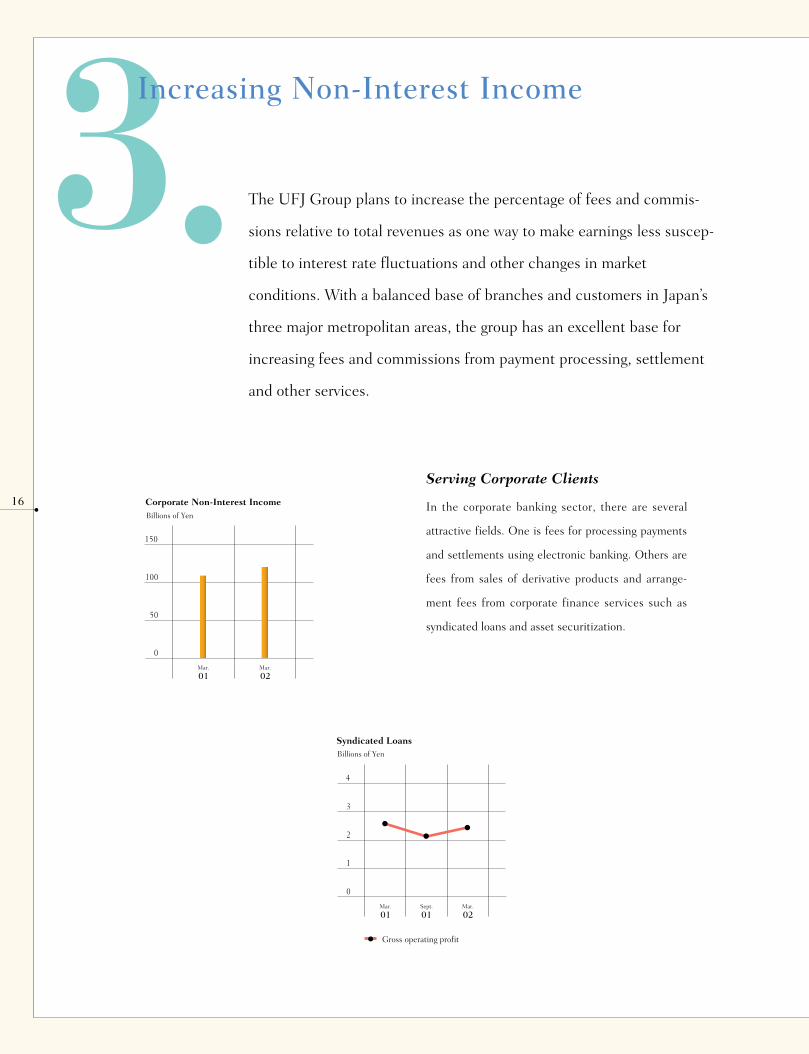
3.Increasing Non-Interest Income
The UFJ Group plans to increase the percentage of fees and commis-
sions relative to total revenues as one way to make earnings less suscep-
tible to interest rate fluctuations and other changes in market
conditions. With a balanced base of branches and customers in Japan’s
three major metropolitan areas, the group has an excellent base for
increasing fees and commissions from payment processing, settlement
and other services.
Serving Corporate Clients
In the corporate banking sector, there are several
attractive fields. One is fees for processing payments
and settlements using electronic banking. Others are
fees from sales of derivative products and arrange-
ment fees from corporate finance services such as
syndicated loans and asset securitization.
150
100
50
0
Corporate Non-Interest IncomeBillions of Yen
01Mar.
02Mar.
4
2
3
1
0
Syndicated Loans
Gross operating profit
01Mar.
02Mar.
01Sept.
Billions of Yen
17
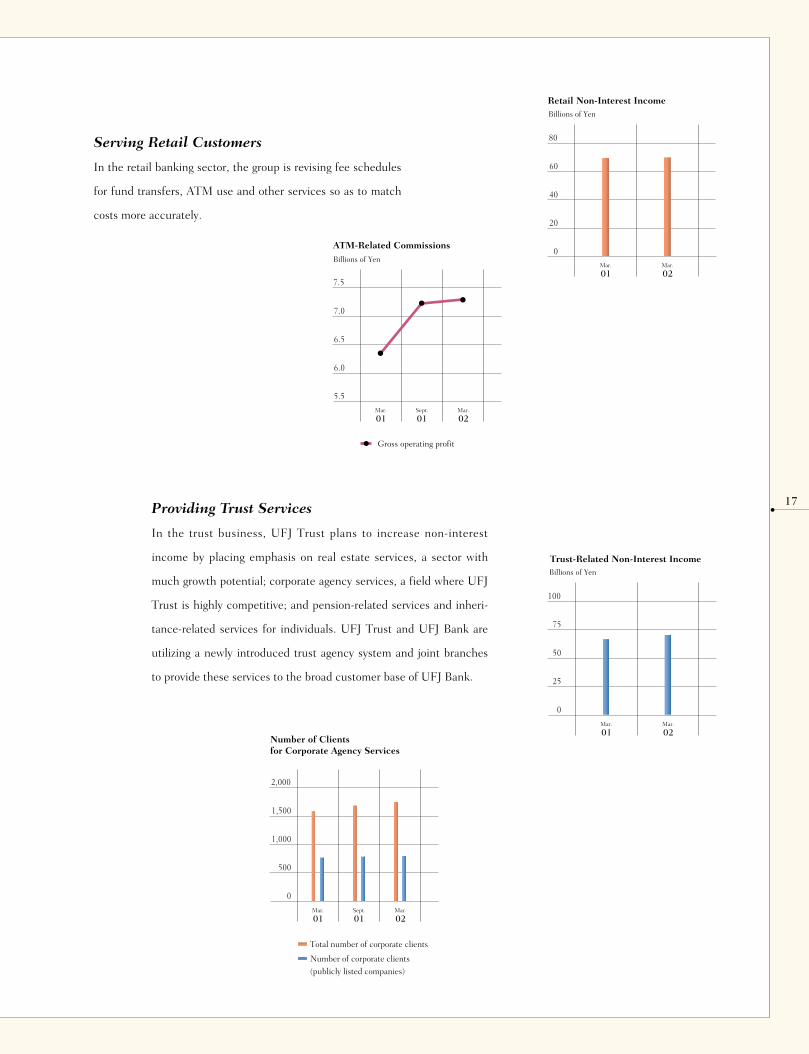
Serving Retail Customers
In the retail banking sector, the group is revising fee schedules
for fund transfers, ATM use and other services so as to match
costs more accurately.
Providing Trust Services
In the trust business, UFJ Trust plans to increase non-interest
income by placing emphasis on real estate services, a sector with
much growth potential; corporate agency services, a field where UFJ
Trust is highly competitive; and pension-related services and inheri-
tance-related services for individuals. UFJ Trust and UFJ Bank are
utilizing a newly introduced trust agency system and joint branches
to provide these services to the broad customer base of UFJ Bank.
100
50
25
0
Trust-Related Non-Interest Income
75
Billions of Yen
01Mar.
02Mar.
2,000
1,000
1,500
500
0
Number of Clients for Corporate Agency Services
01Mar.
02Mar.
01Sept.
Total number of corporate clients
Number of corporate clients
(publicly listed companies)
80
40
60
20
0
Retail Non-Interest IncomeBillions of Yen
01Mar.
02Mar.
7.5
6.5
7.0
6.0
5.5
ATM-Related CommissionsBillions of Yen
01Mar.
02Mar.
01Sept.
Gross operating profit

18
4.Maximizing Integration Effects The key aims of the integration that formed the UFJ Group were
enhancing customer services by offering a comprehensive line of finan-
cial sources and becoming more efficient through economies of scale
and scope. Only one year after the integration, the group is already
reaping benefits that exceed initial targets in many respects. The group
will continue to concentrate on obtaining the greatest possible integra-
tion benefits as quickly as possible.
Make the Most Efficient Use of
Resources
Combining the resources of the original
three banks is enabling the UFJ Group to
provide the high volume and caliber of ser-
vices from a leaner, more efficient base.
RESTRUCTURING INITIATIVES
Due to restructuring initiatives, both personnel and non-person-
nel expenses for the fiscal year ended March 31, 2002 were lower
than the targets in the Revitalization Plan reported to the
Financial Services Agency. More cost savings are projected.
● Consolidate overlapping branch offices; the number of branch-
es will be reduced from 517 for the fiscal year ended March
31, 2002 to 406 by March 2003, the schedule was moved up
six months from the original target in the Revitalization Plan.
● Downsize workforce from 24,205 as of March 31, 2002 to less
than 20,000 by March 2005, a reduction of 1,000 more than
the UFJ Group’s original target in the Revitalization Plan.
600
400
200
0
Domestic Branches
98Mar.
03(Plan)
Mar.
02Mar.
30,000
20,000
10,000
0
Number of Employees
98Mar.
05(Plan)
Mar.
02Mar.

19
OTHER INTEGRATION-RELATED GAINS IN EFFICIENCY
AND SYNERGIES
● Joint branches in the Tokyo, Osaka and Nagoya areas and other
forms of cooperation between UFJ Bank and UFJ Trust allow for
the efficient provision of trust services to retail customers.
● UFJ Bank began serving as an agent for UFJ Trust in March 2002;
as of July 31, 2002, 68 UFJ Bank branches were offering trust bank-
ing services for corporate customers. More moves are planned to
promote UFJ Trust’s services to customers of UFJ Bank.
Integration Effects
The integration had a net negative impact of about ¥40 billion on earn-
ings in the UFJ Group’s first year due to one-time integration costs. The
negative figure for the fiscal year ended March 31, 2002 included
expenses for integrating the systems of Sanwa Bank and Tokai Bank,
and the consolidation of branch offices. However, a rapid improvement
is projected, with the integration expected to produce its first positive
impact in the fiscal year ending in March 2004. And during the six-year
period ending in March 2007, the UFJ Group estimates that the inte-
gration will add a total of about ¥290 billion to its earnings.
300
100
200
0
-100
Integration EffectsBillions of Yen
Positive
Integration Effects
Integration Costs
Earnings synergies
Reduction in personnel expenses
Reduction in non-personnel expenses
Consolidation costs for branches
Systems integration costs
Other integration costs
Net integration effects (cumulative)
05(Plan)
Mar.
04(Plan)
Mar.
03(Plan)
Mar.
02Mar.
06(Plan)
Mar.
07(Plan)
Mar.

20
5.Implementing an IT Strategy
Ideally Suited for Offering Comprehensive Financial Services
In recent years, information technology has become vital to the competitive-
ness of financial institutions. The UFJ Group is constructing IT infrastructure
with the strategic capabilities required to deliver innovative and distinctive
services.
Speedy Integration of Banking
Systems Produces Many Advantages
Sanwa Bank and Tokai Bank accomplished the
complete integration of their respective IT
infrastructures upon their merger in January
2002. Most significant was the fact that no
intermediary, or “bridging,” system was needed.
This was the fastest integration at any newly
merged bank in Japan, giving the UFJ Group
numerous competitive advantages.
ADVANTAGES
● Unified system supports a diverse and consistent line of
products and services at all UFJ Bank branches.
● With no more system integration expenses needed, the
bank can now make investments targeting new products
and services, as well as technology to increase internal
productivity.
● Unified system facilitates the speedy consolidation of
branch networks and improvements in other customer ser-
vice channels.
Using IT to Make the UFJ Group
More Competitive
The UFJ Group’s integrated IT system fea-
tures many sophisticated capabilities that
enable the group to compete more effectively.
The new mainframe system and branch opera-
tion systems give the group a key competitive
edge over other financial groups in Japan.
21
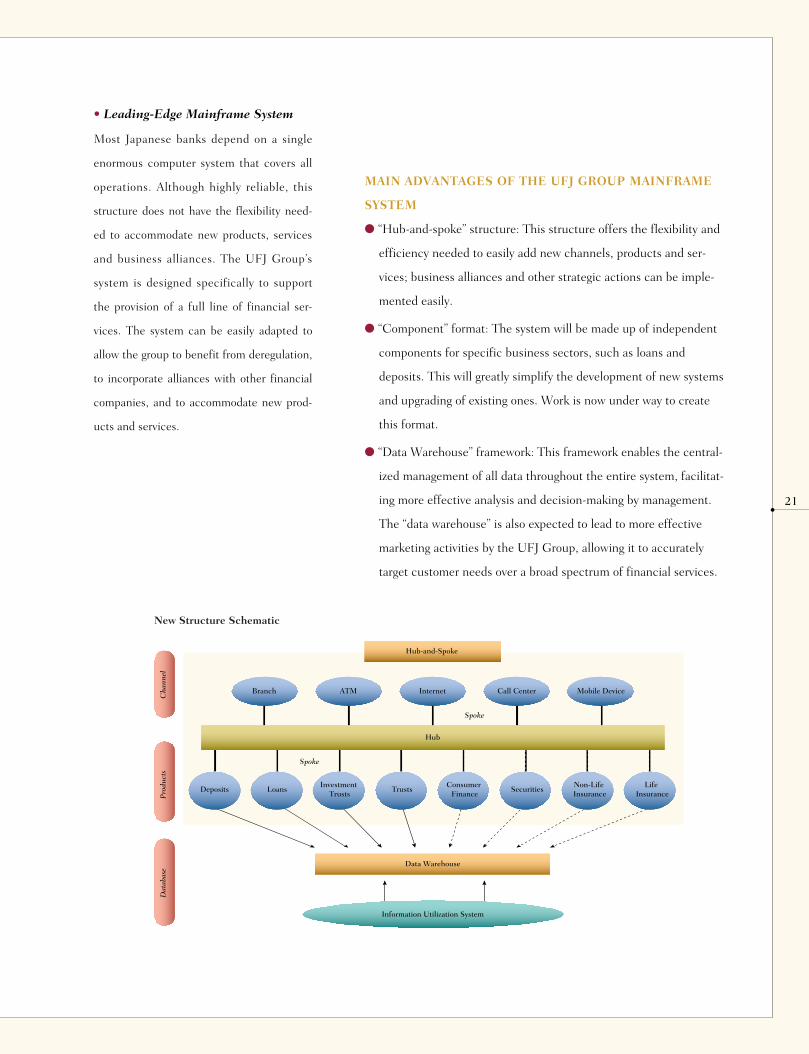
• Leading-Edge Mainframe System
Most Japanese banks depend on a single
enormous computer system that covers all
operations. Although highly reliable, this
structure does not have the flexibility need-
ed to accommodate new products, services
and business alliances. The UFJ Group’s
system is designed specifically to support
the provision of a full line of financial ser-
vices. The system can be easily adapted to
allow the group to benefit from deregulation,
to incorporate alliances with other financial
companies, and to accommodate new prod-
ucts and services.
MAIN ADVANTAGES OF THE UFJ GROUP MAINFRAME
SYSTEM
● “Hub-and-spoke” structure: This structure offers the flexibility and
efficiency needed to easily add new channels, products and ser-
vices; business alliances and other strategic actions can be imple-
mented easily.
● “Component” format: The system will be made up of independent
components for specific business sectors, such as loans and
deposits. This will greatly simplify the development of new systems
and upgrading of existing ones. Work is now under way to create
this format.
● “Data Warehouse” framework: This framework enables the central-
ized management of all data throughout the entire system, facilitat-
ing more effective analysis and decision-making by management.
The “data warehouse” is also expected to lead to more effective
marketing activities by the UFJ Group, allowing it to accurately
target customer needs over a broad spectrum of financial services.
Hub-and-Spoke
Internet Call Center
Spoke
Hub
Data Warehouse
Information Utilization System
Spoke
Deposits LoansInvestment
TrustsTrusts
Consumer Finance
SecuritiesNon-Life Insurance
Life Insurance
Mobile DeviceATMBranch
Cha
nnel
Pro
duct
sD
atab
ase
New Structure SchematicNew Structure Schematic
22
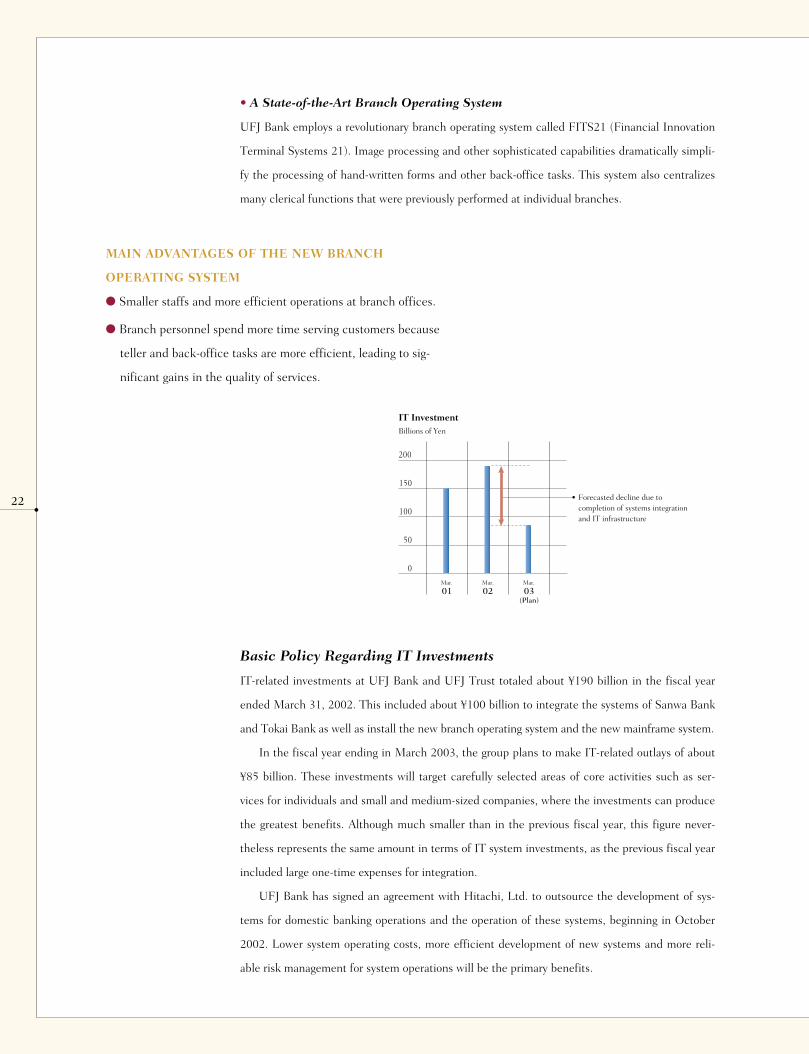
• A State-of-the-Art Branch Operating System
UFJ Bank employs a revolutionary branch operating system called FITS21 (Financial Innovation
Terminal Systems 21). Image processing and other sophisticated capabilities dramatically simpli-
fy the processing of hand-written forms and other back-office tasks. This system also centralizes
many clerical functions that were previously performed at individual branches.
200
100
150
50
0
IT InvestmentBillions of Yen
Forecasted decline due to completion of systems integration and IT infrastructure
01Mar.
03(Plan)
Mar.
02Mar.
Basic Policy Regarding IT Investments
IT-related investments at UFJ Bank and UFJ Trust totaled about ¥190 billion in the fiscal year
ended March 31, 2002. This included about ¥100 billion to integrate the systems of Sanwa Bank
and Tokai Bank as well as install the new branch operating system and the new mainframe system.
In the fiscal year ending in March 2003, the group plans to make IT-related outlays of about
¥85 billion. These investments will target carefully selected areas of core activities such as ser-
vices for individuals and small and medium-sized companies, where the investments can produce
the greatest benefits. Although much smaller than in the previous fiscal year, this figure never-
theless represents the same amount in terms of IT system investments, as the previous fiscal year
included large one-time expenses for integration.
UFJ Bank has signed an agreement with Hitachi, Ltd. to outsource the development of sys-
tems for domestic banking operations and the operation of these systems, beginning in October
2002. Lower system operating costs, more efficient development of new systems and more reli-
able risk management for system operations will be the primary benefits.
MAIN ADVANTAGES OF THE NEW BRANCH
OPERATING SYSTEM
● Smaller staffs and more efficient operations at branch offices.
● Branch personnel spend more time serving customers because
teller and back-office tasks are more efficient, leading to sig-
nificant gains in the quality of services.
23
M A N A G E M E N T ’ S D I S C U S S I O N
A N D A N A L Y S I S
• Measures to Resolve Top Managerial Issues
• Analysis of Operations and Financial Position for
Fiscal Year Ended March 31, 2002
• Merger Accounting Upon Establishment of UFJ Bank
• Transfer of Statutory Reserve to Retained Earnings
• Problem Loans
24
3635
3429
MEASURES TO RESOLVE TOP MANAGERIAL ISSUES
As efforts to increase earnings continue, the UFJ Group is taking forceful actions to resolve a num-
ber of issues that stand in the way of progress toward fulfilling long-term objectives. Priority is
being placed on problem loans, exposure to market risk and capital adequacy to build an operating
base consistent with the group’s strategies and vision. This section explains in concrete terms how
the group is addressing each of these issues
MEASURES TO ACHIEVE A FINAL RESOLUTION OF THE PROBLEM LOAN ISSUE
—IMPROVEMENTS IN THE QUALITY OF THE LOAN PORTFOLIO
Japanese banks have been grappling with problem loans since the end of the “bubble economy” in the early 1990s. A
decade later, a final resolution to this issue remains elusive. Progress has been hindered by new problem loans caused by
corporate failures amid Japan’s protracted economic downturn and the falling value of real estate used as collateral.
Dealing with problem loans has been positioned as a matter of the highest priority at the UFJ Group.
Resolving the problem loan issue demands both actions to deal with existing problem loans as well as efforts from a
medium- to long-term perspective aimed at improving the quality of the loan portfolio. Based on lessons learned in the
past, UFJ Bank and UFJ Trust have been taking various steps in this regard. One theme is conducting credit analysis by
focusing on the creditworthiness of each loan applicant without undue reliance on the value of collateral. Each loan is
examined with emphasis on the use of funds, repayment period and other conditions. Currently, the banks are focusing
on two high-priority issues to upgrade the overall quality of their loan portfolios: setting loan interest rates at levels that
accurately reflect credit risk and eliminating excessive concentrations of credit risk in a single borrower and a group of
companies. The UFJ Group also places priority on better responding to changes in the operations and financial position
of borrowers, providing assistance for the restructuring and rehabilitation of borrowers, and accelerating the final resolu-
tion of problem loans.
Setting Loan Interest Rates to Reflect Associated Credit Risks
As the provision of loans entails the assumption of credit risk, there will inevitably be some non-performing loans. To
structure a loan portfolio that generates a suitable level of earnings, banks must set interest rates that reflect credit risk so
as to cover credit-related expenses. Present interest rates, however, do not always achieve this goal. The UFJ Group must
take immediate action to earn an appropriate return on its loan portfolio.
The UFJ Group manages earnings by using a profitability indicator called RACAR, which stands for risk and cost
adjusted return. RACAR helps the group banks calculate suitable interest rates for each borrower and loan. Furthermore,
UFJ Bank began disclosing its internal credit ratings to corporate borrowers in April 2002 to promote better mutual
understanding when negotiating interest rates. (Please refer to page 15 for details on the disclosure of internal credit rat-
ings.)
24
Elimination of Excessive Concentrations of Credit Risk
The concentration of credit risk in particular industries and borrowers has been a major reason that problem loans grew to
the current level. Banks use past default data and other factors to set aside reserves for future losses. In recent years, the
deterioration in the financial condition at a number of large borrowers exceeded these reserves, resulting in substantial
losses.
To prevent the reoccurrence of this problem, the UFJ Group has established, and strictly enforces, credit limit rules
designed to minimize losses resulting from loans, guarantees and other forms of credit extended to a particular borrower
and a particular group of companies. The rules put a cap on credit extensions to individual borrowers and corporate
groups in accordance with their individual internal credit rating. Enforcing these rules will allow the UFJ Group to build
a balanced loan portfolio in which risks are spread among many types of borrowers.
Preventing the Occurrence of New Problem Loans
Branch offices, the Credit Administration Department, and other head office departments cooperate to assist borrowers
when needed to formulate plans to improve and restructure their operations and financial position. UFJ Bank has a sys-
tem under which problems are identified early so that support can be supplied quickly. The first step is formulation of a
First Action Plan, whereby UFJ Bank openly discusses problems with the borrower. This leads to recommendations and
concrete support for improving the borrower’s financial condition and business activities. Where necessary, a manage-
ment consulting company is also brought in to help achieve the needed improvements.
Assisting Customers to Revitalize Their Operations and Finances
A central role of any bank is to grow along with customers by extending the financial support they need to fulfill their
objectives. In this spirit, the UFJ Group takes very seriously the task of helping revitalize the operations of customers.
Such assistance is extended to companies that, despite serious financial problems, have a sound core business that allows
the company to regain its strength through business restructuring and financial support. The UFJ Group is taking steps to
extend support in an even more aggressive and broad-based manner.
For large and medium-sized companies, a head office department specializing in corporate revitalization programs
takes leading charge. UFJ Solution Consulting Co., Ltd., established with Merrill Lynch & Co., Inc. in April 2002, also
plays an active role. Among the many restructuring options considered are debt-equity swaps, debt forgiveness, manage-
ment buyouts, mergers and spin-offs. The programs incorporate both financial support and steps to restructure business
activities. For smaller companies, specialized offices extend detailed support by closely working with these customers.
25
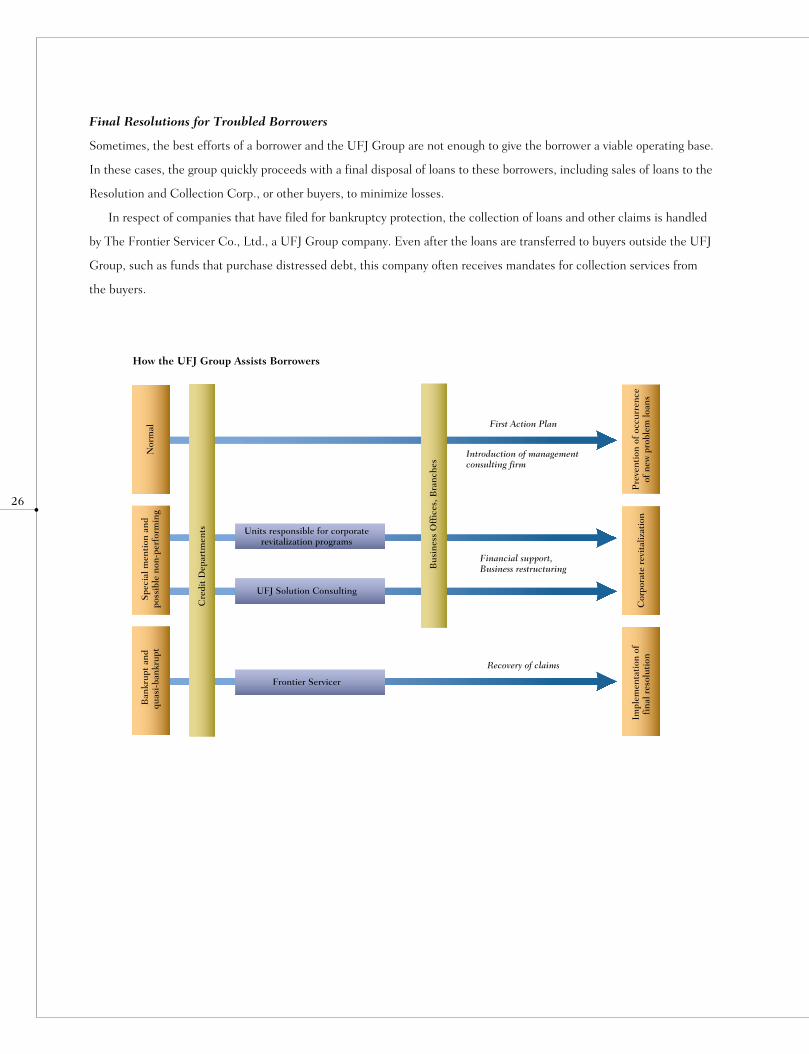
Final Resolutions for Troubled Borrowers
Sometimes, the best efforts of a borrower and the UFJ Group are not enough to give the borrower a viable operating base.
In these cases, the group quickly proceeds with a final disposal of loans to these borrowers, including sales of loans to the
Resolution and Collection Corp., or other buyers, to minimize losses.
In respect of companies that have filed for bankruptcy protection, the collection of loans and other claims is handled
by The Frontier Servicer Co., Ltd., a UFJ Group company. Even after the loans are transferred to buyers outside the UFJ
Group, such as funds that purchase distressed debt, this company often receives mandates for collection services from
the buyers.
26
Pre
vent
ion
of o
ccur
renc
e of
new
pro
blem
loan
s C
orpo
rate
rev
ital
izat
ion
Impl
emen
tati
on o
f fi
nal r
esol
utio
n
Nor
mal
Cre
dit
Dep
artm
ents
Bus
ines
s O
ffic
es, B
ranc
hes
Spe
cial
men
tion
and
po
ssib
le n
on-p
erfo
rmin
g B
ankr
upt
and
quas
i-ba
nkru
pt
First Action Plan
Introduction of management consulting firm
Financial support, Business restructuring
Recovery of claims
UFJ Solution Consulting
Units responsible for corporate revitalization programs
Frontier Servicer
How the UFJ Group Assists Borrowers

27
PROGRESS IN REDUCING STOCK INVESTMENTS
The UFJ Group has been selling investments in stocks to improve its financial position and efficiently use assets. The
stock holdings of Japanese banks have always represented an enormous source of market risk. This risk became more
apparent in 2001 with the adoption of market-value accounting and impairment accounting, which became effective from
the interim period ended September 30, 2001. Share price movements now directly affect net income and stockholders’
equity, increasing the urgency of reducing market risk. Furthermore, a law promulgated in November 2001 mandates that
banks hold the balance of stock holdings with a market value below their Tier 1 capital, beginning September 30, 2004.
The UFJ Group further views the reduction of equity investments as an essential step in redeploying assets strategically
to increase returns.
During the past fiscal year, sales of stock holdings by UFJ Bank and UFJ Trust totaled ¥1,480.0 billion. This reduced
investments in stocks with a market value to ¥4.4 trillion, while Tier 1 capital as of March 31, 2002 was ¥2.8 trillion. The
two banks plan to reduce their stock investments by about the same amount during the fiscal year ending March 31, 2003.
At this pace, the banks will bring their stock investments below Tier 1 capital prior to the September 2004 deadline.
Plans call for continuing sales of stocks even after the requirement is met.
Risks Associated With Cross-Shareholdings
The UFJ Group places priority on managing risks associated with its stock investments. To manage market risk, VaR
(value at risk) is calculated daily and fluctuations in the market value of all equities are monitored in relation to the level
of net assets. Risk management committees of the group and other units monitor the reductions in cross-shareholdings to
bolster the management of risks associated with these investments.
8
6
4
2
0Mar.
02Mar.
01Mar.
00Sept.
04
Investments in Stocks* (UFJ Bank and UFJ Trust combined, non-consolidated) Trillions of Yen
Adoption of market-value accounting, impairment accounting
Stocks with market value
* Book value
Must be below Tier 1 capital

CAPITAL ADEQUACY
The UFJ Group is taking many steps to maintain an adequate level of capital. During the past fiscal year, UFJ Bank
issued US$2.0 billion in subordinated bonds in overseas markets and ¥218.0 billion of preferred securities in Japan. To
reduce risk-weighted assets, the group accelerated the final disposal of problem loans and sales of investments in equi-
ties. In addition, UFJ Bank sold its entire interest in United California Bank in the past fiscal year. Due to these and
other actions, UFJ Holdings consolidated BIS capital adequacy ratio was 11.04% as of March 31, 2002, well above inter-
national standards.
28
* Capital ratios as of March 31, 2000 and 2001 are computed
based on data for Sanwa Bank, Tokai Bank and Toyo Trust.
Toyo Trust began using domestic standards in the fiscal year
ended March 31, 2001, but figures shown here are based on
the uniform international standards.
15
10
5
0
Capital Ratios* %
Capital ratio
Tier 1 ratio
02Mar.
01Mar.
00Mar.

29
SUMMARY OF CONSOLIDATED RESULTS
In the fiscal year ended March 31, 2002, UFJ Holdings posted a consolidated gross operating profit of ¥1,647.5 billion.
Net interest income accounted for ¥1,044.5 billion of this amount. Credit-related expenses, which include net transfer to
the general reserve and trust account write-offs, totaled ¥2,083.0 billion as UFJ Bank and UFJ Trust took decisive actions
to deal with problem loans. Due to these expenses, there was an ordinary loss of ¥1,603.7 billion and a net loss of
¥1,227.4 billion. The net loss was ¥80.9 billion higher than the sum of the non-consolidated net losses of UFJ Bank and
UFJ Trust. The difference is due primarily to expenses resulting from the accelerated pace of dealing with problem loans
at loan guarantee subsidiaries.
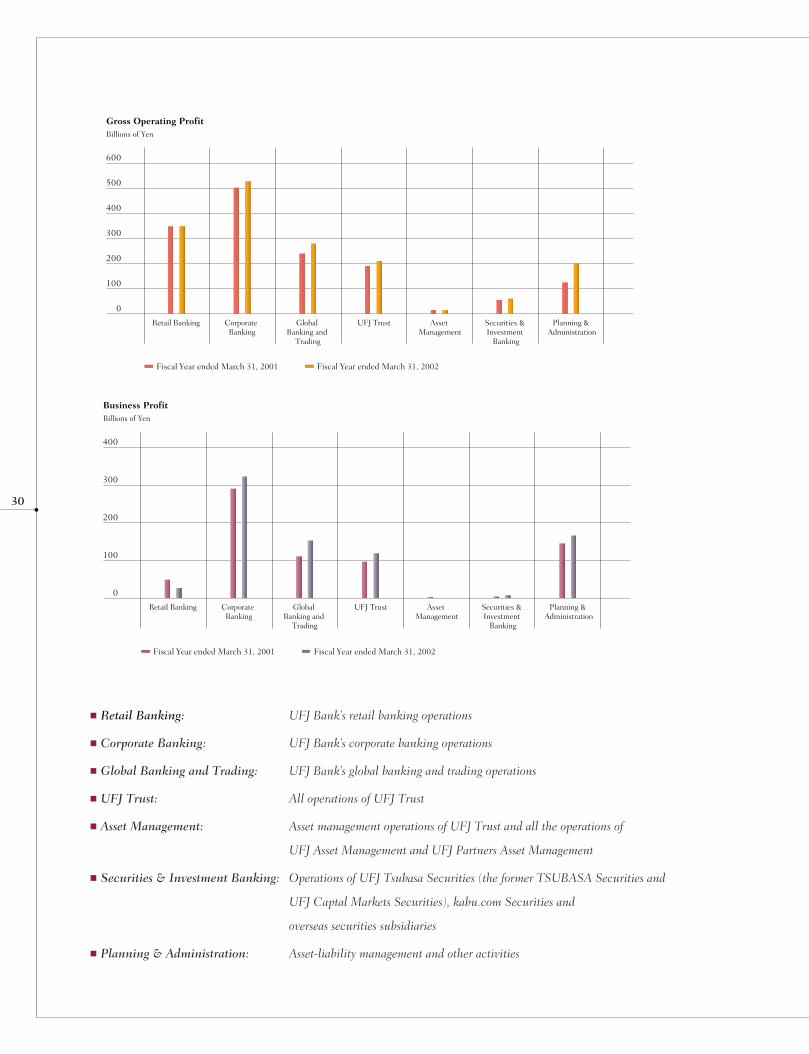
RESULTS BY BUSINESS UNIT
In Retail Banking, gross operating profit was ¥349.4 billion about the same as in the previous fiscal year.* Income from
loans improved as the balance of housing loans continued to grow, but income from deposits was impacted by the low
level of interest rates in Japan. Expenses rose ¥22.5 billion to ¥321.9 billion. Although personnel expenses were lower,
there was an increase in IT investments associated with the merger of Sanwa Bank and Tokai Bank. The net effect of
these items was a ¥21.9 billion decline in business profit to ¥27.4 billion.
In Corporate Banking, a decline in the balance of loans brought down net interest income, but domestic fees and
commissions, mainly those related to settlements, continued to grow. Earnings from syndicated loans and other invest-
ment banking activities were higher. The result was gross operating profit of ¥528.2 billion, an increase of ¥25.7 billion.
Business profit increased ¥32.3 billion to ¥322.8 billion.
In Global Banking and Trading, gross operating profit improved by ¥39.9 billion to ¥280.3 billion due to a strong per-
formance by investment activities in the banking account, and business profit increased ¥42.3 billion to ¥153.2 billion.
At UFJ Trust, growth in trust fees and other factors caused gross operating profit to climb ¥19.7 billion to ¥210.4 bil-
lion and business profit before trust account write-offs was up ¥22.1 billion to ¥119.3 billion.
In Asset Management, a downturn in investment trust assets at UFJ Partners Asset Management Co., Ltd. due to the
stock market’s weakness caused gross operating profit to decline ¥0.5 billion to ¥15.8 billion and business profit to
decline ¥2.5 billion to ¥0.8 billion.
In Securities & Investment Banking, gross operating profit rose ¥5.5 billion to ¥61.5 billion. The slumping stock mar-
ket caused customer assets and stock brokerage commissions at TSUBASA Securities Co., Ltd. to fall. Offsetting this
decline were strong performances by corporate finance operations at UFJ Capital Markets Securities Co., Ltd. and trad-
ing activities at overseas securities subsidiaries. The net result was a ¥3.5 billion improvement in business profit to ¥8.0
billion.
* Figures for the previous fiscal year are aggregate of consolidated results of Sanwa Bank, Tokai Bank and Toyo Trust.
ANALYSIS OF OPERATIONS AND FINANCIAL POSITION FOR
FISCAL YEAR ENDED MARCH 31, 2002
600
500
400
300
200
100
0
Gross Operating ProfitBillions of Yen
Retail Banking Corporate Banking
Global Banking and
Trading
UFJ Trust Asset Management
Securities & Investment
Banking
Planning & Administration
Fiscal Year ended March 31, 2001 Fiscal Year ended March 31, 2002
30
Retail Banking: UFJ Bank’s retail banking operations
Corporate Banking: UFJ Bank’s corporate banking operations
Global Banking and Trading: UFJ Bank’s global banking and trading operations
UFJ Trust: All operations of UFJ Trust
Asset Management: Asset management operations of UFJ Trust and all the operations of
UFJ Asset Management and UFJ Partners Asset Management
Securities & Investment Banking: Operations of UFJ Tsubasa Securities (the former TSUBASA Securities and
UFJ Captal Markets Securities), kabu.com Securities and
overseas securities subsidiaries
Planning & Administration: Asset-liability management and other activities
400
300
200
100
0
Business Profit Billions of Yen
Retail Banking Corporate Banking
Global Banking and
Trading
UFJ Trust Asset Management
Securities & Investment
Banking
Planning & Administration
Fiscal Year ended March 31, 2001 Fiscal Year ended March 31, 2002

31
RESULTS OF OPERATIONS OF UFJ BANK AND UFJ TRUST (NON-CONSOLIDATED)
The figures in this section are the sum of the non-consolidated results of operations of UFJ Bank and UFJ Trust. UFJ
Bank’s statement of operations does not include the operations of Tokai Bank prior to January 15, 2002, the date this
bank and Sanwa Bank merged to form UFJ Bank. However, the figures in this section include Tokai Bank’s operations for
the period from April 1, 2001 through January 14, 2002 to permit direct comparisons with prior fiscal years.
Gross operating profit of UFJ Bank and UFJ Trust increased ¥86.3 billion to ¥1,362.9 billion. Net interest income
increased ¥55.4 billion to ¥935.2 billion. This was mainly attributable to higher interest income from investments in for-
eign bonds, a change in the recognition of dividend income due to the adoption of new accounting standards for financial
instruments, and a decline in interest expenses as UFJ Bank repaid subordinated loans, which carried comparatively high
interest rates.
General and administrative expenses declined ¥2.3 billion to ¥652.8 billion. Personnel expenses were down by ¥17.7
billion because of workforce reductions, lower bonus payments and other measures to streamline the banks’ cost struc-
ture. However, non-personnel expenses increased ¥13.9 billion, largely the result of higher investments in IT systems and
other facilities. The net result was a small decrease in general and administrative expenses.
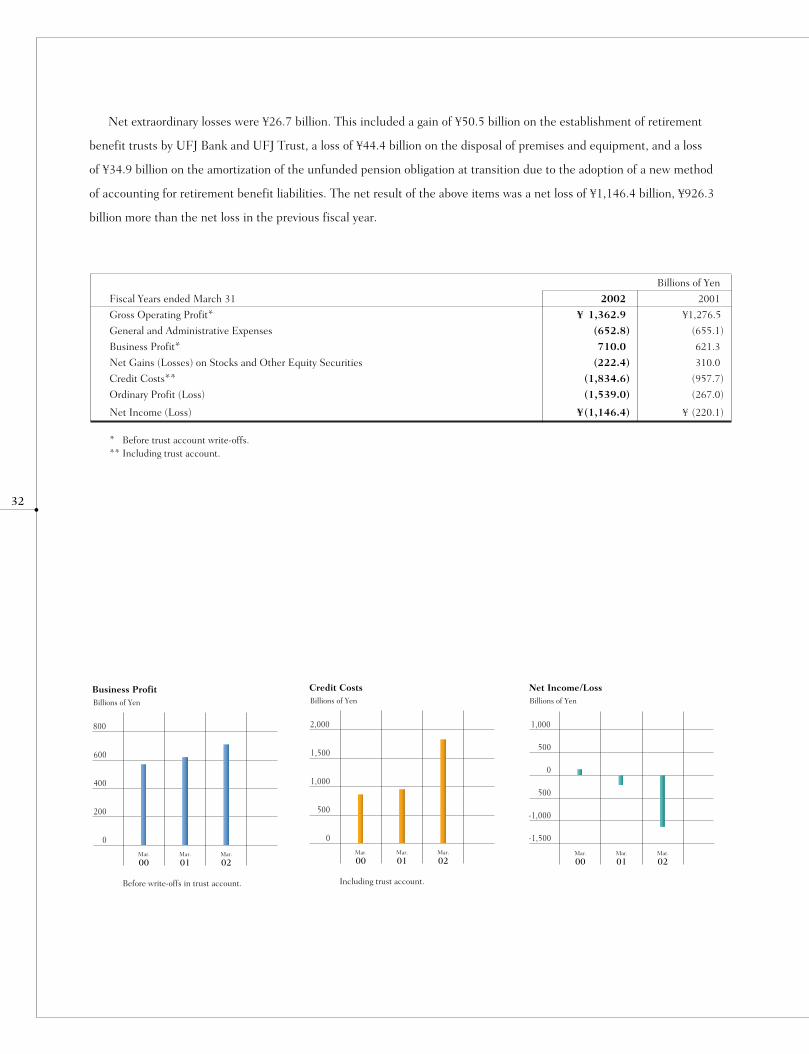
Due to these factors, business profit before net transfer to the general reserve and trust account write-offs increased
¥88.7 billion to ¥710.0 billion. Business profit after net general reserve transfer but prior to trust account write-offs
increased ¥194.0 billion to ¥603.0 billion.
Net other expenses totaled ¥2,142.1 billion, including a net loss of ¥222.4 billion on stocks and other equity securi-
ties. There were gains of ¥417.1 billion on sales of stocks, including the gain from the sale of UFJ Bank’s U.S. banking
subsidiary. Losses on sales of stocks totaled ¥174.2 billion. Furthermore, there was an expense of ¥465.3 billion to write
down the carrying value of stock investments because of a sharp decline in market prices. Credit costs, including in the
trust account, increased ¥876.8 billion to ¥1,834.6 billion as the two banks took decisive actions to restructure and reha-
bilitate large troubled borrowers. Together with the ¥107.0 billion net transfer to the general reserve, credit-related
expenses totaled ¥1,941.7 billion. After these expenses, the two banks had a combined ordinary loss of ¥1,539.0 billion,
¥1,272.0 billion more than the loss in the previous fiscal year.
32
Net extraordinary losses were ¥26.7 billion. This included a gain of ¥50.5 billion on the establishment of retirement
benefit trusts by UFJ Bank and UFJ Trust, a loss of ¥44.4 billion on the disposal of premises and equipment, and a loss
of ¥34.9 billion on the amortization of the unfunded pension obligation at transition due to the adoption of a new method
of accounting for retirement benefit liabilities. The net result of the above items was a net loss of ¥1,146.4 billion, ¥926.3
billion more than the net loss in the previous fiscal year.
800
400
600
200
0
Business ProfitBillions of Yen
Before write-offs in trust account.
01Mar.
00Mar.
02Mar.
2,000
1,000
1,500
500
0
Credit CostsBillions of Yen
Including trust account.
01Mar.
00Mar.
02Mar.
1,000
500
500
0
-1,000
-1,500
Net Income/LossBillions of Yen
01Mar.
00Mar.
02Mar.
Earnings by Division (Non-Consolidated)
Billions of Yen
Fiscal Years ended March 31 2002 2001
Gross Operating Profit* ¥ 1,362.9 ¥1,276.5
General and Administrative Expenses (652.8) (655.1)
Business Profit* 710.0 621.3
Net Gains (Losses) on Stocks and Other Equity Securities (222.4) 310.0
Credit Costs** (1,834.6) (957.7)
Ordinary Profit (Loss) (1,539.0) (267.0)
Net Income (Loss) ¥(1,146.4) ¥ (220.1)
* Before trust account write-offs.** Including trust account.
33
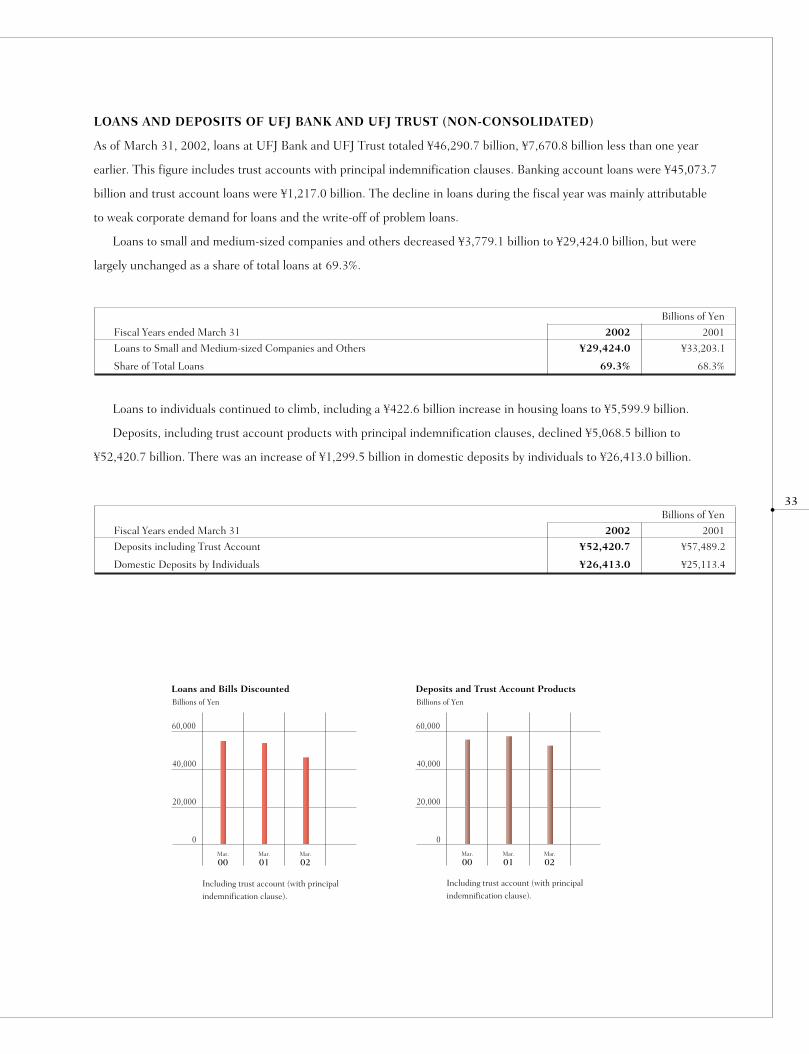
LOANS AND DEPOSITS OF UFJ BANK AND UFJ TRUST (NON-CONSOLIDATED)
As of March 31, 2002, loans at UFJ Bank and UFJ Trust totaled ¥46,290.7 billion, ¥7,670.8 billion less than one year
earlier. This figure includes trust accounts with principal indemnification clauses. Banking account loans were ¥45,073.7
billion and trust account loans were ¥1,217.0 billion. The decline in loans during the fiscal year was mainly attributable
to weak corporate demand for loans and the write-off of problem loans.
Loans to small and medium-sized companies and others decreased ¥3,779.1 billion to ¥29,424.0 billion, but were
largely unchanged as a share of total loans at 69.3%.
Loans to individuals continued to climb, including a ¥422.6 billion increase in housing loans to ¥5,599.9 billion.
Deposits, including trust account products with principal indemnification clauses, declined ¥5,068.5 billion to
¥52,420.7 billion. There was an increase of ¥1,299.5 billion in domestic deposits by individuals to ¥26,413.0 billion.
Earnings by Division (Non-Consolidated)
Billions of Yen
Fiscal Years ended March 31 2002 2001
Loans to Small and Medium-sized Companies and Others ¥29,424.0 ¥33,203.1
Share of Total Loans 69.3% 68.3%
Earnings by Division (Non-Consolidated)
Billions of Yen
Fiscal Years ended March 31 2002 2001
Deposits including Trust Account ¥52,420.7 ¥57,489.2
Domestic Deposits by Individuals ¥26,413.0 ¥25,113.4
60,000
40,000
20,000
0
Loans and Bills Discounted Billions of Yen
Including trust account (with principal
indemnification clause).
01Mar.
00Mar.
02Mar.
60,000
40,000
20,000
0
Deposits and Trust Account ProductsBillions of Yen
Including trust account (with principal
indemnification clause).
01Mar.
00Mar.
02Mar.
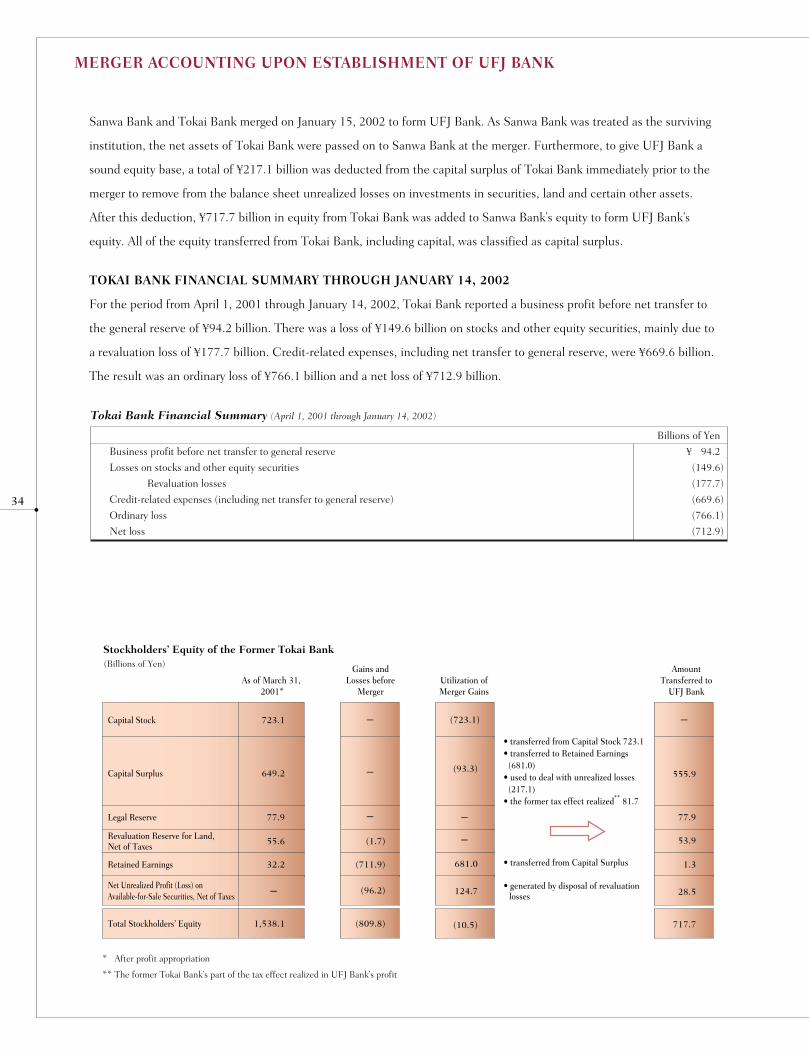
Sanwa Bank and Tokai Bank merged on January 15, 2002 to form UFJ Bank. As Sanwa Bank was treated as the surviving
institution, the net assets of Tokai Bank were passed on to Sanwa Bank at the merger. Furthermore, to give UFJ Bank a
sound equity base, a total of ¥217.1 billion was deducted from the capital surplus of Tokai Bank immediately prior to the
merger to remove from the balance sheet unrealized losses on investments in securities, land and certain other assets.
After this deduction, ¥717.7 billion in equity from Tokai Bank was added to Sanwa Bank’s equity to form UFJ Bank’s
equity. All of the equity transferred from Tokai Bank, including capital, was classified as capital surplus.
TOKAI BANK FINANCIAL SUMMARY THROUGH JANUARY 14, 2002
For the period from April 1, 2001 through January 14, 2002, Tokai Bank reported a business profit before net transfer to
the general reserve of ¥94.2 billion. There was a loss of ¥149.6 billion on stocks and other equity securities, mainly due to
a revaluation loss of ¥177.7 billion. Credit-related expenses, including net transfer to general reserve, were ¥669.6 billion.
The result was an ordinary loss of ¥766.1 billion and a net loss of ¥712.9 billion.
34
MERGER ACCOUNTING UPON ESTABLISHMENT OF UFJ BANK
723.1 (723.1)
649.2
77.9
55.6
32.2
1,538.1
(1.7)
(711.9)
(93.3)
(10.5)
(96.2)
(809.8)
- -
-
-
-
-
-
681.0
124.7
555.9
53.9
77.9
1.3
28.5
717.7
Capital Stock
(Billions of Yen)
• transferred from Capital Surplus
• generated by disposal of revaluation losses
Capital Surplus
Legal Reserve
Revaluation Reserve for Land,Net of Taxes
Retained Earnings
Net Unrealized Profit (Loss) on Available-for-Sale Securities, Net of Taxes
Total Stockholders’ Equity
Stockholders’ Equity of the Former Tokai Bank
As of March 31, 2001*
Gains andLosses before
MergerUtilization ofMerger Gains
AmountTransferred to
UFJ Bank
* After profit appropriation
** The former Tokai Bank’s part of the tax effect realized in UFJ Bank’s profit
• transferred from Capital Stock 723.1• transferred to Retained Earnings (681.0) • used to deal with unrealized losses (217.1) • the former tax effect realized** 81.7
Tokai Bank Financial Summary (April 1, 2001 through January 14, 2002)
Billions of Yen
Business profit before net transfer to general reserve ¥ 94.2
Losses on stocks and other equity securities (149.6)
Revaluation losses (177.7)
Credit-related expenses (including net transfer to general reserve) (669.6)
Ordinary loss (766.1)
Net loss (712.9)

UFJ Holdings
UFJ Holdings has drawn down ¥1,000 billion of its capital surplus and transferred this amount to retained earnings. This
action did not alter total equity. The purpose of this transfer was to achieve a sufficient level of retained earnings. This
will permit the acquisition of treasury stock, giving UFJ Holdings more flexibility to rebuild a group structure capable of
providing comprehensive financial services. UFJ Holdings plans to use treasury stock purchases mainly to acquire UFJ
Holdings stock held by subsidiaries, acquire stock that can be used to increase holdings in group companies through
exchanges of stock, and purchase odd-lot holdings from stockholders.
UFJ Holdings used this treasury stock system to purchase 33,633 shares of UFJ Holdings common stock from UFJ
Bank, a banking subsidiary, on May 27, 2002 at a cost of ¥10.4 billion. This represented 0.69% of total shares issued by
UFJ Holdings as of May 24, 2002. These shares are to be used for an exchange of stock to acquire the minority interest
of UFJ Partners Asset Management, raising UFJ Holdings’ ownership from 78.51% to 100%.
UFJ Bank
Of the ¥717.7 billion in equity transferred to UFJ Bank from Tokai Bank, ¥555.9 billion was classified as capital surplus.
When added to the capital surplus of Sanwa Bank, this transfer gave UFJ Bank capital surplus of ¥1,290.5 billion. UFJ
Bank then drew down ¥629.6 billion of its statutory reserves (capital surplus of ¥445.0 billion and legal reserve of ¥184.6
billion) and transferred this amount to retained earnings. There was no change in total equity. This draw-down of statuto-
ry reserves was conducted to facilitate actions to deal with problem loans and ensure a stable base for procuring capital in
the future.
During the fiscal year ended March 31, 2002, UFJ Bank, including Tokai Bank prior to January 15, 2002, incurred
credit-related expenses, including net transfers to the general reserve, of ¥1,744.2 billion. Despite these expenses, UFJ
Bank had retained earnings of ¥509.4 billion as of March 31, 2002 due to the above transfer to retained earnings.
35
TRANSFER OF STATUTORY RESERVE TO RETAINED EARNINGS
+ + =
843.6
734.6
106.6
137.3
181.7
2,003.8
555.9
77.9
53.9
1.3
28.5
717.7
- -
- -
-
- -
- -
-
--
-
- -
(445.0)
(184.6)
629.6 (74.0) (229.2)
(72.5)
106.8
(194.9)(74.0)
843.6
845.5
118.4
509.4
135.3
2,452.4
Capital Stock
(Billions of Yen)
Capital Surplus
Legal Reserve
Revaluation Reserve for Land,Net of Taxes
Retained Earnings
Net Unrealized Profit (Loss) onAvailable-for-Sale Securities, Net of Taxes
Total Stockholders' Equity
Stockholders' Equity of UFJ Bank
As of March 31, 2001*
Amount Transferredfrom Tokai Bank
Amount ofDraw Down
Amount of Interim
DividendsPaid
FinancialResults of
FY March 31,2002
As of March 31, 2002
* Balance of Sanwa Bank as of March 31, 2001 after profit appropriation
PROBLEM LOANS
Problem loans remain the most pressing issue at the UFJ Group. This section provides an overview
of the problem loans and credit-related expenses of UFJ Bank and UFJ Trust for the year ended
March 31, 2002.
CREDIT-RELATED EXPENSES FOR THE YEAR ENDED MARCH 31, 2002
(UFJ Bank and UFJ Trust combined, non-consolidated)
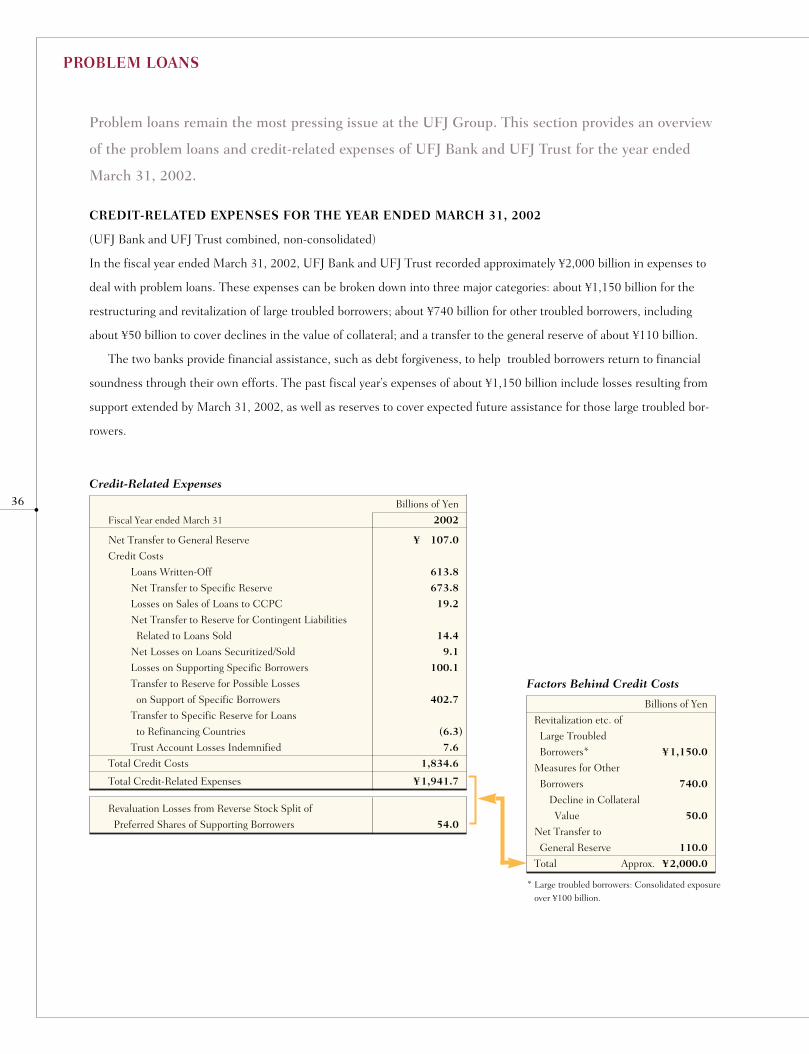
In the fiscal year ended March 31, 2002, UFJ Bank and UFJ Trust recorded approximately ¥2,000 billion in expenses to
deal with problem loans. These expenses can be broken down into three major categories: about ¥1,150 billion for the
restructuring and revitalization of large troubled borrowers; about ¥740 billion for other troubled borrowers, including
about ¥50 billion to cover declines in the value of collateral; and a transfer to the general reserve of about ¥110 billion.
The two banks provide financial assistance, such as debt forgiveness, to help troubled borrowers return to financial
soundness through their own efforts. The past fiscal year’s expenses of about ¥1,150 billion include losses resulting from
support extended by March 31, 2002, as well as reserves to cover expected future assistance for those large troubled bor-
rowers.
36Credit-Related Expenses
Billions of Yen
Fiscal Year ended March 31 2002
Net Transfer to General Reserve ¥ 107.0
Credit Costs
Loans Written-Off 613.8
Net Transfer to Specific Reserve 673.8
Losses on Sales of Loans to CCPC 19.2
Net Transfer to Reserve for Contingent Liabilities
Related to Loans Sold 14.4
Net Losses on Loans Securitized/Sold 9.1
Losses on Supporting Specific Borrowers 100.1
Transfer to Reserve for Possible Losses
on Support of Specific Borrowers 402.7
Transfer to Specific Reserve for Loans
to Refinancing Countries (6.3)
Trust Account Losses Indemnified 7.6
Total Credit Costs 1,834.6
Total Credit-Related Expenses ¥1,941.7
Factors Behind Credit Costs
Billions of Yen
Revitalization etc. of
Large Troubled
Borrowers* ¥1,150.0
Measures for Other
Borrowers 740.0
Decline in Collateral
Value 50.0
Net Transfer to
General Reserve 110.0
Total Approx. ¥2,000.0
Revaluation Losses from Reverse Stock Split of
Preferred Shares of Supporting Borrowers 54.0
* Large troubled borrowers: Consolidated exposureover ¥100 billion.
PROBLEM LOANS OUTSTANDING AS OF MARCH 31, 2002
(UFJ Bank and UFJ Trust combined, non-consolidated)
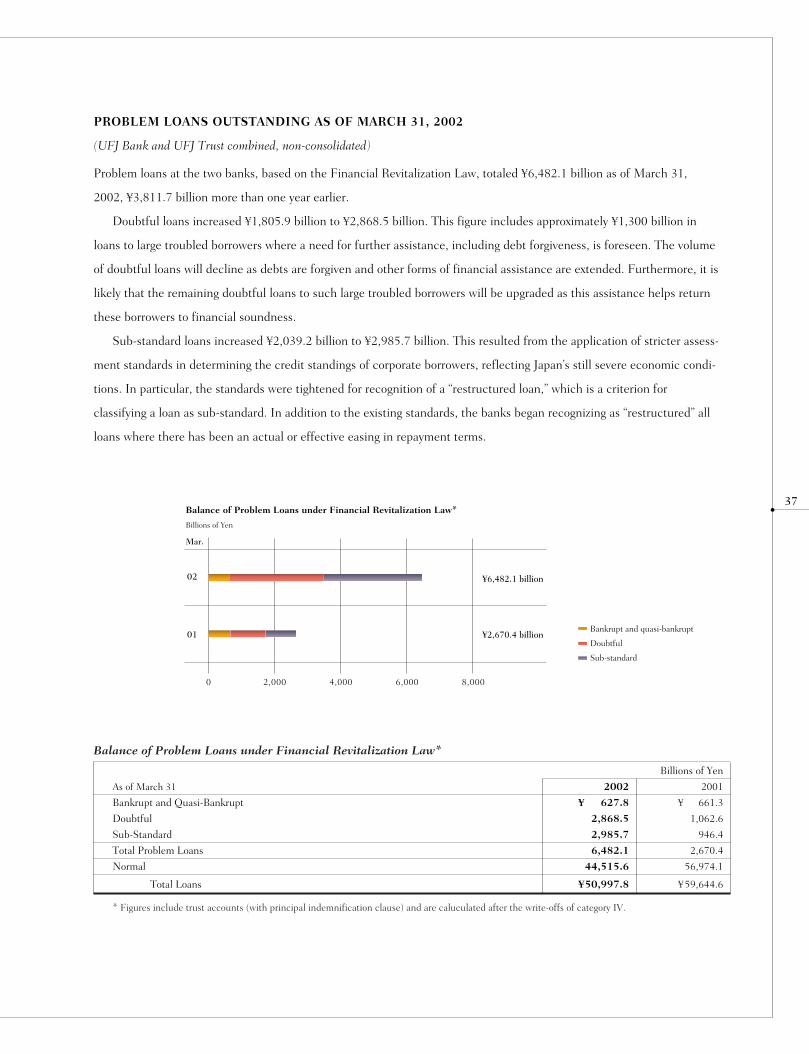
Problem loans at the two banks, based on the Financial Revitalization Law, totaled ¥6,482.1 billion as of March 31,
2002, ¥3,811.7 billion more than one year earlier.
Doubtful loans increased ¥1,805.9 billion to ¥2,868.5 billion. This figure includes approximately ¥1,300 billion in
loans to large troubled borrowers where a need for further assistance, including debt forgiveness, is foreseen. The volume
of doubtful loans will decline as debts are forgiven and other forms of financial assistance are extended. Furthermore, it is
likely that the remaining doubtful loans to such large troubled borrowers will be upgraded as this assistance helps return
these borrowers to financial soundness.
Sub-standard loans increased ¥2,039.2 billion to ¥2,985.7 billion. This resulted from the application of stricter assess-
ment standards in determining the credit standings of corporate borrowers, reflecting Japan’s still severe economic condi-
tions. In particular, the standards were tightened for recognition of a “restructured loan,” which is a criterion for
classifying a loan as sub-standard. In addition to the existing standards, the banks began recognizing as “restructured” all
loans where there has been an actual or effective easing in repayment terms.
37
0 2,000 6,0004,000 8,000
Billions of Yen
01
02
Mar.
Balance of Problem Loans under Financial Revitalization Law*
Bankrupt and quasi-bankrupt
Doubtful
Sub-standard
¥6,482.1 billion
¥2,670.4 billion
* Figures include trust accounts (with principal indemnification clause) and are caluculated after the write-offs of category IV.
Balance of Problem Loans under Financial Revitalization Law*
Billions of Yen
As of March 31 2002 2001
Bankrupt and Quasi-Bankrupt ¥ 627.8 ¥ 661.3
Doubtful 2,868.5 1,062.6
Sub-Standard 2,985.7 946.4
Total Problem Loans 6,482.1 2,670.4
Normal 44,515.6 56,974.1
Total Loans ¥50,997.8 ¥59,644.6
COVERAGE AND RESERVES FOR PROBLEM LOANS
(UFJ Bank and UFJ Trust, non-consolidated)
The coverage and reserve ratios for problem loans of the two banks as of March 31, 2002 are shown in the following table.
In the past fiscal year, the UFJ Group altered its reserve policy for the portion of doubtful loans not covered by collat-
eral or guarantees. The new policy divides the doubtful loans into two categories. The first is loans where reserves are
determined based on estimates of losses according to a restructuring or financial assistance plan, a planned sale of the
loan or some other reason. For these loans, the reserve ratio was 51.62% as of March 31, 2002. The second category is all
other loans. Here, the two banks set aside reserves based on historical loss experience. This policy resulted in a reserve
ratio of 67.12% for these loans. Under the previous policy, reserves were generally provided for at 70% of all uncovered
exposure.
Due to this new policy, the reserve ratio for doubtful loans declined 13.55 percentage points to 59.39% and the cover-
age ratio declined 12.79 percentage points to 72.35%. During the fiscal year ending in March 2003, restructuring and
The following table shows the balance of domestic loans and risk monitored loans by industry. Risk monitored loans
are problem loans based on classifications under the Banking Law, which consist of bankrupt, delinquent, past due 3
months or more, and restructured. (Details of these categories are provided on page 43.)
38
* Including Principal Indemnified Trust Accounts of UFJ Trust (excluding IBF Transactions).
Balance of Domestic Loans and Risk Monitored Loans by Industry
Billions of Yen
As of March 31 2002 2001
Domestic Loans* ¥42,466.5 ¥ 48,646.8
Risk Monitored Loans 6,247.7 2,479.1
Manufacturing 5,424.6 6,601.0
Risk Monitored Loans 542.3 229.8
Agriculture/ Forestry/ Fishery/ Mining 177.8 198.3
Risk Monitored Loans 11.8 4.6
Construction 1,682.8 2,127.2
Risk Monitored Loans 478.3 287.1
Utilities 242.1 479.1
Risk Monitored Loans 0.5 0.6
Transportation & Communication 2,211.8 2,308.5
Risk Monitored Loans 343.3 49.1
Wholesale & Retail 6,257.2 7,408.3
Risk Monitored Loans 792.5 305.4
Finance & Insurance 3,609.2 4,629.4
Risk Monitored Loans 310.0 96.3
Real Estate 6,560.3 7,216.6
Risk Monitored Loans 2,509.1 848.2
Services 5,198.1 6,360.2
Risk Monitored Loans 721.2 382.4
Local Government 511.6 514.3
Risk Monitored Loans – –
Others 10,590.5 10,803.4
Risk Monitored Loans ¥ 538.2 ¥ 275.1
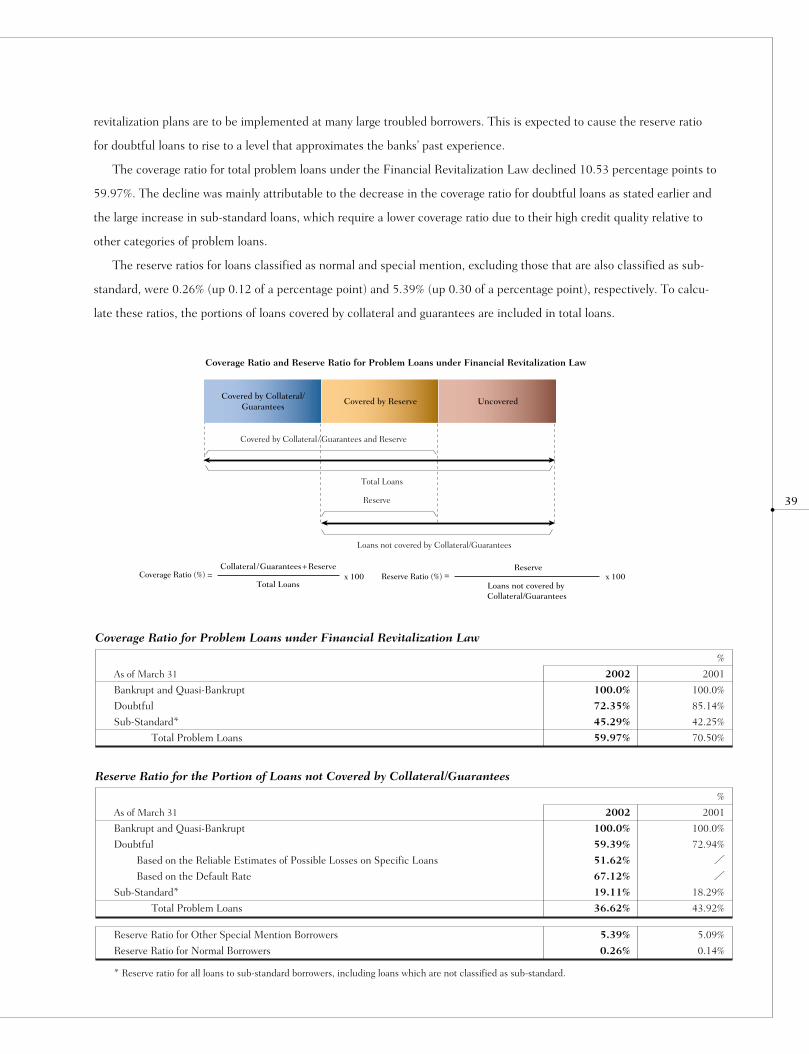
39
revitalization plans are to be implemented at many large troubled borrowers. This is expected to cause the reserve ratio
for doubtful loans to rise to a level that approximates the banks’ past experience.
The coverage ratio for total problem loans under the Financial Revitalization Law declined 10.53 percentage points to
59.97%. The decline was mainly attributable to the decrease in the coverage ratio for doubtful loans as stated earlier and
the large increase in sub-standard loans, which require a lower coverage ratio due to their high credit quality relative to
other categories of problem loans.
The reserve ratios for loans classified as normal and special mention, excluding those that are also classified as sub-
standard, were 0.26% (up 0.12 of a percentage point) and 5.39% (up 0.30 of a percentage point), respectively. To calcu-
late these ratios, the portions of loans covered by collateral and guarantees are included in total loans.
Coverage Ratio and Reserve Ratio for Problem Loans under Financial Revitalization Law
Covered by Collateral/Guarantees
Covered by Reserve
Covered by Collateral /Guarantees and Reserve
Total Loans
Reserve
Loans not covered by Collateral/Guarantees
Uncovered
Coverage Ratio (%) =Collateral /Guarantees+Reserve
Total Loans x 100 Reserve Ratio (%)
Reserve
Loans not covered by Collateral/Guarantees
= x 100
* Reserve ratio for all loans to sub-standard borrowers, including loans which are not classified as sub-standard.
Coverage Ratio for Problem Loans under Financial Revitalization Law
%
As of March 31 2002 2001
Bankrupt and Quasi-Bankrupt 100.0% 100.0%
Doubtful 72.35% 85.14%
Sub-Standard* 45.29% 42.25%
Total Problem Loans 59.97% 70.50%
Reserve Ratio for the Portion of Loans not Covered by Collateral/Guarantees
%
As of March 31 2002 2001
Bankrupt and Quasi-Bankrupt 100.0% 100.0%
Doubtful 59.39% 72.94%
Based on the Reliable Estimates of Possible Losses on Specific Loans 51.62% /Based on the Default Rate 67.12% /
Sub-Standard* 19.11% 18.29%
Total Problem Loans 36.62% 43.92%
Reserve Ratio for Other Special Mention Borrowers 5.39% 5.09%
Reserve Ratio for Normal Borrowers 0.26% 0.14%

PROGRESS TOWARD A FINAL RESOLUTION
Emergency economic measures announced by the Japanese government in April 2001 call for banks to eliminate problem
loans in accordance with a strict schedule. All loans classified as possible non-performing or lower under the self-assess-
ment criteria (doubtful or bankrupt and quasi-bankrupt under the Financial Revitalization Law) as of September 30,
2000 are to be off-balanced or upgraded by March 31, 2003. Loans newly placed in one of these categories after
September 30, 2000 are to be off-balanced or upgraded within three years of the following fiscal year-end. In this context,
off-balancing includes write-offs and recoveries. Upgrading refers to the reclassification of loans to a higher category due
to an improvement in creditworthiness of borrowers. The UFJ Group is making steady progress toward the final resolu-
tion of problem loans in accordance with this schedule.
40
1,968.0
315.0 (43% off-balanced)
317.7 (40% off-balanced)
689.3 (65% off-balanced)
556.5
534.5
2,174.3
Billions of Yen
Classified before1st half of FY2000
Classified in 2nd half of FY2000
Classified in 1st half of FY2001
Classified in 2nd half of FY2001
Final Disposal of Problem Loans
Mar. 01 02 03 04 05

FRAMEWORK FOR MANAGING CREDIT EXPOSURE
UFJ Bank and UFJ Trust periodically conduct reviews of internal credit ratings of borrowers and self-assessments of
assets. These ratings and self-assessments are the basis for decisions regarding reserve transfers, write-offs and other
actions.
Internal Ratings—Credit rating assignments begin with two steps. First is the revision of a borrower’s financial
statements to reflect actual conditions. Second is a quantitative analysis of the financial statements. Statistical methods
are employed to analyze the borrower’s stability, profitability, cash flows, ability to repay loans and other measures of
financial health. This process is followed by a qualitative evaluation that factors in the operating base, market conditions
and other items that are not sufficiently accounted for by a quantitative evaluation. A credit rating is then assigned using
this combination of quantitative and qualitative factors. UFJ Bank and UFJ Trust employ the same rating system, which
uses a scale of one to ten. There are 16 ratings in total, including subdivisions. These ratings are used as part of the credit
approval and credit risk management systems as well as in conjunction with self-assessments of asset quality.
Self-Assessments—The banks use the internal credit rating system to conduct self-assessments of loans and cer-
tain other assets. This process is performed in accordance with self-assessment standards prepared by the banks in con-
formity with the financial inspection manual of Japan’s Financial Services Agency. Borrowers are placed in one of five
categories depending on factors such as the condition of their financial position and businesses. Assets are placed in one
of four categories depending on collateral, guarantees and other factors affecting the likelihood that obligations can be
recovered. UFJ Bank and UFJ Trust use the same standards for performing self-assessments.
Reserve Transfers and Write-Offs—Based on the classification of assets through the self-assessment process,
additions to reserves (to prepare for possible future write-offs), write-offs (removal of assets from the balance sheet) and
other actions are taken in accordance with the probability of recovery. The resulting costs are reflected in the statement
of operations. Problem loan balances and other asset-related figures as well as coverage and reserve information are
released together with the banks’ interim and year-end financial statements.
41

Internal Rating:
Ratings are assigned based on the credit risks of each borrower.
Self-Assessment:
Borrower Category
Each borrower is placed in one of five categories according to its financial condition, cash flows, profitability and other
parameters.
Normal: Borrowers whose performance is sound and for whom there are no specific concerns regard-
ing their financial situation.
Special Mention: Borrowers whose loan terms and conditions have been eased or whose loan repayment per-
formance is poor.
Borrowers posting a loss, or whose performance is sluggish or unstable.
Possible Non-Performing: Borrowers who are not bankrupt at present, but where the possibility of bankruptcy in the
near future is high.
Quasi Non-Performing: Borrowers who are essentially bankrupt. Although there is no legal or formal evidence of
bankruptcy, the borrower is in serious financial difficulties and there is no prospect of revi-
talization.
Non-Performing: Borrowers who are legally or formally bankrupt, including borrowers in the process of
bankruptcy procedures, liquidation, reorganization, suspension of banking business or simi-
lar actions.
42
Internal Rating Self-Assessment Classification under the Classification under the
Borrower Category Asset Classification Financial Revitalization Law Risk Monitored Loans
1A1B Excellent1C
2 Prime3 Good Normal Category I Normal4 Above Standard5 Standard6 Below Standard7 Acceptable
8A Special Mention II8B Past Due 1 Month or More Special Mention8C Past Due 3 Months or More
Sub-StandardRestructured
8D Restructured Past Due 3 Months or More
9 Possible Non-Performing Possible Non-Performing III DoubtfulDelinquent
10A Quasi Non-Performing Quasi Non-Performing IV Bankrupt and
10B Non-Performing Non-Performing Quasi-Bankrupt Bankrupt
Credit Rating System
Credits other than L
oans and Bills D
iscounted (for acceptances and guarantees, etc.)
Problem Loans
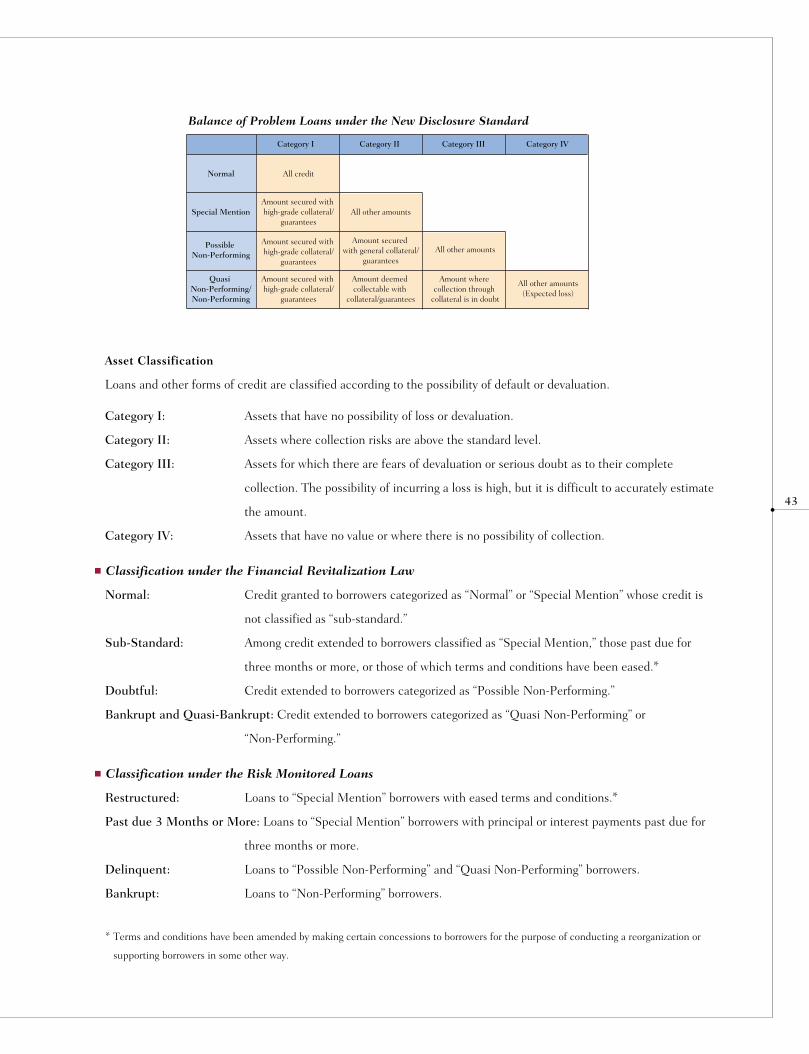
Asset Classification
Loans and other forms of credit are classified according to the possibility of default or devaluation.
Category I: Assets that have no possibility of loss or devaluation.
Category II: Assets where collection risks are above the standard level.
Category III: Assets for which there are fears of devaluation or serious doubt as to their complete
collection. The possibility of incurring a loss is high, but it is difficult to accurately estimate
the amount.
Category IV: Assets that have no value or where there is no possibility of collection.
Classification under the Financial Revitalization Law
Normal: Credit granted to borrowers categorized as “Normal” or “Special Mention” whose credit is
not classified as “sub-standard.”
Sub-Standard: Among credit extended to borrowers classified as “Special Mention,” those past due for
three months or more, or those of which terms and conditions have been eased.*
Doubtful: Credit extended to borrowers categorized as “Possible Non-Performing.”
Bankrupt and Quasi-Bankrupt: Credit extended to borrowers categorized as “Quasi Non-Performing” or
“Non-Performing.”
Classification under the Risk Monitored Loans
Restructured: Loans to “Special Mention” borrowers with eased terms and conditions.*
Past due 3 Months or More: Loans to “Special Mention” borrowers with principal or interest payments past due for
three months or more.
Delinquent: Loans to “Possible Non-Performing” and “Quasi Non-Performing” borrowers.
Bankrupt: Loans to “Non-Performing” borrowers.
* Terms and conditions have been amended by making certain concessions to borrowers for the purpose of conducting a reorganization or
supporting borrowers in some other way.
43
Category I
Normal
Special Mention
Possible Non-Performing
Quasi Non-Performing/Non-Performing
All credit
Amount secured with high-grade collateral/
guarantees
Amount secured with high-grade collateral/
guarantees
Amount secured with high-grade collateral/
guarantees
All other amounts
Amount secured with general collateral/
guarantees
Amount deemed collectable with
collateral/guarantees
All other amounts
Amount where collection through
collateral is in doubt
All other amounts(Expected loss)
Category II Category III Category IV
Balance of Problem Loans under the New Disclosure Standard

The UFJ Group has a holding company structure with UFJ Holdings as the nucleus, which is highly con-
ducive to both fair and transparent corporate governance and effective management.
FRAMEWORK OF CORPORATE GOVERNANCE AND MANAGEMENT
At the UFJ Group, responsibilities for decision-making and management oversight are separated from those for the exe-
cution of business activities to maintain fairness and transparency. The Board of Directors, half of which is made up of
external directors, refines and approves or rejects proposals from the management. The board is also charged with moni-
toring the management of UFJ Holdings and motivating executives to improve operating results and increase stockholder
value by using its power to make appointments and set remuneration. The Board of Directors has three sub-committees.
The Nomination Committee and the Compensation Committee, which are both made up entirely of external directors,
ensure that appointments of directors and executive officers, as well as the determination of their compensation, are per-
formed in a fair and transparent manner. The third sub-committee, the Group Audit Committee, assists the Board of
Directors in their duty to oversee the activities of the group’s management. This committee is made up entirely of exter-
nal directors and highly trained professionals from outside the group, including attorneys.
The UFJ Group has adopted a system in which executive officers are responsible for the management of business
activities. At the same time, a Group Management Committee was established to provide assistance to the president.
This system facilitates the rapid execution of management functions within the group.
In June 2002, the UFJ Group decided to adopt a stock option program. The purpose is to promote a management
approach that reflects the importance of raising market valuations and stockholder value.
44
Shareholders’ Meeting
Management
Executive Officers
Group Management Committee
Other Executive Officers*
Cor
pora
te A
udit
ors/
Boa
rd o
f C
orpo
rate
Aud
itor
s
Nomination Committee
Compensation Committee
Group Audit Committee
Board of Directors (8 members)
External Directors (4)
* Also attend Group Management Committee when certain topics are discussed.
President and Representative
Director
Director and
Executive Officer
Director (President, UFJ Bank)*
Director (President, UFJ Trust)*
T H E U F J G R O U P M A N A G E M E N T S Y S T E M
BUSINESS UNIT MANAGEMENT
The UFJ Group has six business units: Retail Banking, Corporate Banking, Global Banking & Trading, Trust, Asset
Management and Securities & Investment Banking. UFJ Holdings allocates resources to the companies that conduct
each of these activities: UFJ Bank (retail banking, corporate banking, global banking & trading), UFJ Trust (trust), and
the group’s asset management and securities companies. UFJ Holdings also sets performance targets and policies for
these group companies. This holding company also monitors and evaluates the operations of each business for the pur-
pose of managing the group, with the ultimate aim of increasing stockholder value.
An executive officer from UFJ Holdings is assigned to serve as a non-executive director of each major group company
to ensure management and supervisory functions are carried out more effectively.
INDICATORS FOR MANAGING GROUP ACTIVITIES
To heighten the fairness and objectivity of group management functions, three clearly defined management indicators
have been established: Risk and Cost Adjusted Return (RACAR), Risk-Adjusted Profit Ratio and Economic Profit. These
indicators are used to monitor the profitability of individual businesses and ensure the group’s business portfolio manage-
ment fully reflects the associated risks and costs.
■ Risk and Cost Adjusted Return (RACAR)
Maximizing returns compared with risk
This figure represents earnings after adjustments for expenses and credit risk costs. The UFJ Group uses RACAR to max-
imize returns in relation to risks.
■ Risk-Adjusted Profit Ratio (similar to ROE)
Pursuing the efficient use of capital
The Risk-Adjusted Profit Ratio, which is similar to ROE, is obtained by dividing RACAR by the applicable risk capital. By
using this indicator, the UFJ Group strives to conduct business activities efficiently in relation to the amount of risk capi-
tal allocated from the holding company.
■ Economic Profit
Creating and maximizing corporate value
Economic Profit is the amount of value created from the standpoint of stockholders. This figure is obtained by deducting
the cost of capital, which is calculated by multiplying equity and shareholders’ expected return, from net income. Using
this indicator, the UFJ Group will create and maximize corporate value by conducting business activities in a manner that
reflects the cost of capital.
45

I N T E R N A L C O N T R O L S Y S T E M S O F T H E U F J G R O U P
In providing a broad range of financial services, the UFJ Group takes on various forms of risk in pursuit of maximizing
corporate value. To control risk exposure in an appropriate manner, a risk management framework based on a consistent
philosophy is essential. Furthermore, the UFJ Group conducts a compliance program that ensures fairness and trans-
parency in its business activities to conform to acceptable social standards of conduct as well as to laws, regulations and
the group’s internal rules.
Based on this concept, UFJ Holdings positions risk management and compliance as the primary means of internal
control for the purpose of conducting the group’s business activities properly. Also internal audits are used to evaluate
internal control systems, including risk management and compliance, to verify that these systems are appropriate and
effective.
The UFJ Holdings’ Board of Directors, which functions as a decision-making and management supervisory body,
approves fundamental guidelines governing all risk management, compliance and internal audit activities. Based on
these policies, internal control is clearly positioned as the most important activity in the day-to-day management of the
UFJ Group. To heighten the effectiveness of these control functions, a Group Audit Committee has been established as
a sub-committee of the Board of Directors. This committee is charged with monitoring the status of the group’s internal
control systems.
Each UFJ Group company maintains and refines its respective risk management and compliance frameworks, which
are structured to reflect the unique nature of each company’s activities, while complying with the key policies and guide-
lines set by UFJ Holdings. Companies must first consult with UFJ Holdings with regard to items of particular impor-
tance, such as those that have a material impact on the operations of the group. Group companies regularly submit
reports on their risk exposure and compliance issues to UFJ Holdings.
46
Compliance System (page 47)
Risk Management System (page 50) Internal Control Systems
Internal Auditing System (page 68)
Group Philosophy for Compliance Culture
“Transparency and Fairness”
UFJ GROUP’S APPROACH TO COMPLIANCE
The UFJ Group understands that fulfilling its social responsibilities as a highly trusted financial organization is vital to
realizing the group’s management vision: “To be an innovative financial group with a deep commitment to society, grow-
ing together with customers.” To earn the trust of society, the group adopts a broad view of compliance, applying this
activity to ensure strict observance of laws, rules and social standards. Compliance is also conducted to build a reputation
for the UFJ Group as a financial services provider that meets high standards of fairness and transparency.
The UFJ Group conducts many compliance activities to establish a culture throughout the group in which the con-
cept of “transparency and fairness” is the basis for the actions of all its employees.
BASIC COMPLIANCE POLICY
The UFJ Group has established the following basic policy to guide compliance activities and strictly enforce compliance
guidelines.
BASIC COMPLIANCE POLICY AND CODE OF CONDUCT FOR EMPLOYEES
Conducting yourself in a spirit of transparency and fairness by strictly adhering to this basic policy is essential
to realizing the UFJ Group’s management vision.
1. At all times, be aware of the social responsibility and the mission of the UFJ Group as a financial services
group. Work to earn the unconditional trust of society by properly conducting business operations.
2. Maintain solid lines of communication with the public, in particular through the consistent and fair disclo-
sure of accurate information regarding operations. The goal is to earn a reputation among the public as an
organization with highly transparent management.
3. Strictly observe all laws and regulations, conduct business activities that are sincere, fair and comply with
accepted ethical standards of behavior.
4. Contribute to local and global economies and societies by fulfilling the UFJ Group’s mission as a responsi-
ble corporate citizen that upholds high ethical standards which prevail in the global society.
5. Reject all anti-social influences that are disruptive or pose a threat to society.
47
■ COMPLIANCE ACTIVITIES AT THE UFJ GROUP
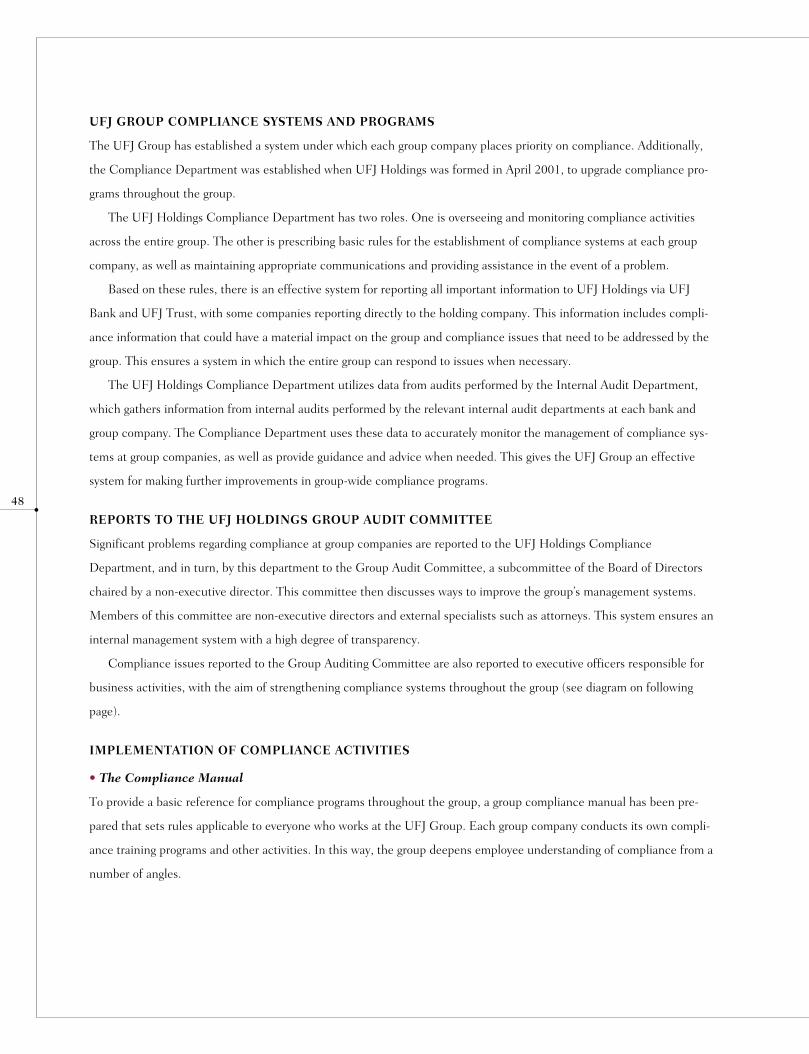
UFJ GROUP COMPLIANCE SYSTEMS AND PROGRAMS
The UFJ Group has established a system under which each group company places priority on compliance. Additionally,
the Compliance Department was established when UFJ Holdings was formed in April 2001, to upgrade compliance pro-
grams throughout the group.
The UFJ Holdings Compliance Department has two roles. One is overseeing and monitoring compliance activities
across the entire group. The other is prescribing basic rules for the establishment of compliance systems at each group
company, as well as maintaining appropriate communications and providing assistance in the event of a problem.
Based on these rules, there is an effective system for reporting all important information to UFJ Holdings via UFJ
Bank and UFJ Trust, with some companies reporting directly to the holding company. This information includes compli-
ance information that could have a material impact on the group and compliance issues that need to be addressed by the
group. This ensures a system in which the entire group can respond to issues when necessary.
The UFJ Holdings Compliance Department utilizes data from audits performed by the Internal Audit Department,
which gathers information from internal audits performed by the relevant internal audit departments at each bank and
group company. The Compliance Department uses these data to accurately monitor the management of compliance sys-
tems at group companies, as well as provide guidance and advice when needed. This gives the UFJ Group an effective
system for making further improvements in group-wide compliance programs.
REPORTS TO THE UFJ HOLDINGS GROUP AUDIT COMMITTEE
Significant problems regarding compliance at group companies are reported to the UFJ Holdings Compliance
Department, and in turn, by this department to the Group Audit Committee, a subcommittee of the Board of Directors
chaired by a non-executive director. This committee then discusses ways to improve the group’s management systems.
Members of this committee are non-executive directors and external specialists such as attorneys. This system ensures an
internal management system with a high degree of transparency.
Compliance issues reported to the Group Auditing Committee are also reported to executive officers responsible for
business activities, with the aim of strengthening compliance systems throughout the group (see diagram on following
page).
IMPLEMENTATION OF COMPLIANCE ACTIVITIES
• The Compliance Manual
To provide a basic reference for compliance programs throughout the group, a group compliance manual has been pre-
pared that sets rules applicable to everyone who works at the UFJ Group. Each group company conducts its own compli-
ance training programs and other activities. In this way, the group deepens employee understanding of compliance from a
number of angles.
48
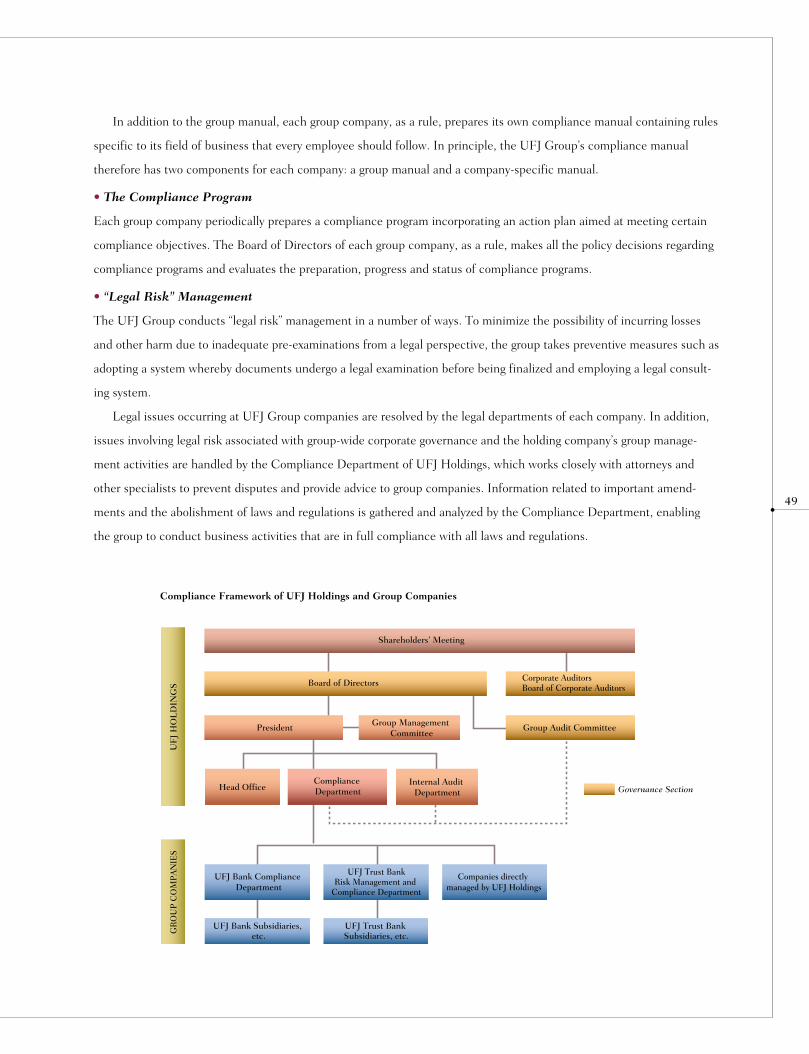
In addition to the group manual, each group company, as a rule, prepares its own compliance manual containing rules
specific to its field of business that every employee should follow. In principle, the UFJ Group’s compliance manual
therefore has two components for each company: a group manual and a company-specific manual.
• The Compliance Program
Each group company periodically prepares a compliance program incorporating an action plan aimed at meeting certain
compliance objectives. The Board of Directors of each group company, as a rule, makes all the policy decisions regarding
compliance programs and evaluates the preparation, progress and status of compliance programs.
• “Legal Risk” Management
The UFJ Group conducts “legal risk” management in a number of ways. To minimize the possibility of incurring losses
and other harm due to inadequate pre-examinations from a legal perspective, the group takes preventive measures such as
adopting a system whereby documents undergo a legal examination before being finalized and employing a legal consult-
ing system.
Legal issues occurring at UFJ Group companies are resolved by the legal departments of each company. In addition,
issues involving legal risk associated with group-wide corporate governance and the holding company’s group manage-
ment activities are handled by the Compliance Department of UFJ Holdings, which works closely with attorneys and
other specialists to prevent disputes and provide advice to group companies. Information related to important amend-
ments and the abolishment of laws and regulations is gathered and analyzed by the Compliance Department, enabling
the group to conduct business activities that are in full compliance with all laws and regulations.
49
UF
J H
OL
DIN
GS
GR
OU
P C
OM
PA
NIE
S
Shareholders’ Meeting
Compliance Framework of UFJ Holdings and Group Companies
Board of Directors
President Group Management Committee
Head Office
UFJ Bank Compliance Department
UFJ Trust BankRisk Management and
Compliance Department
UFJ Bank Subsidiaries, etc.
UFJ Trust Bank Subsidiaries, etc.
Companies directly managed by UFJ Holdings
Compliance Department
Internal Audit Department
Group Audit Committee
Governance Section
Corporate AuditorsBoard of Corporate Auditors

50
As a purveyor of a broad range of financial services, the UFJ Group, in the process of conducting its business activities in
pursuit of maximizing corporate value, takes on various forms of risk, namely credit risk, market risk, funding liquidity risk
and operational risk. The UFJ Group’s objective is not to avoid exposure to risk, but rather to control risk exposure in an
appropriate and efficient manner. From this standpoint, the UFJ Group’s philosophy regarding risk management is to estab-
lish an effective internal control framework and identify, control and manage individual as well as aggregate risks appropri-
ately so as to improve the overall soundness of the group’s management and to promote the group’s operating efficiency.
To achieve these objectives, the UFJ Group has developed its risk management framework with a view not only to the
sophistication of the approach but also to the consistency and integrity of the framework throughout the group. It has for-
mulated a consistent risk management policy and procedure framework for all types of risk for the purpose of suitably
identifying, measuring and managing risk. The policies and procedures are then communicated to all group companies to
secure the same view on risks and on risk management.
The group also places priority on the adoption of more sophisticated risk management methodologies such as value-
at-risk and the risk capital management framework. In this manner, the UFJ Group aims to contribute to the establish-
ment of a global standard for risk management.
Key features of the UFJ Group’s risk management framework are described as follows.
RISK FACTORS
The UFJ Group defines “risk” as “factors that potentially cause unexpected financial losses and cause losses to the capital
of the group.” Depending on the different features of those factors, UFJ Group classifies and defines risk factors as follows.
Type of Risk Definition
Credit Risk
Market Risk
Funding Liquidity Risk
Operational Risk
Processing Risk
System Risk
Human Resources Risk
Tangible Asset Risk
Regulatory Risk
Reputational Risk
Credit risk refers to the risk of financial losses in credit assets caused by deterioration in the credit conditions of anycounterparty. This category also includes settlement risk, which refers to the risk of financial losses that a firm incurswhen it does not receive funds or instruments from its counterparties at the expected time.
Market risk refers to the risk of financial losses in the value of a financial position held or executed due to an adversefinancial market movement.
Funding liquidity risk refers to the risk of insolvency in financing assets held or the risk of financial losses caused from ahigher interest rate of funding due to a deterioration of funding ability. This category also includes settlement risk, whichrefers to the risk of financial losses incurred when a company does not receive funds or instruments from its counterpar-ties at the expected time.
Operational risk refers to the risk of direct and indirect losses resulting from inadequate or failed internal processes, peo-ple and systems, or from external events. Due to the different causes of operational risk, it is subdivided into the follow-ing sub-factors.
Processing risk refers to the risk of financial losses from failed processing due to mistakes, negligence, accidents or fraudby directors, staff and other personnel within the organization.
System risk refers to the risk of financial losses due to systems and telecommunications failure, including temporary sys-tems shutdown, system malfunctions, system hacking and system disruptions caused by external events.
Human resources risk refers to the risk of financial losses due to the loss of key personnel or failure to maintain staffmorale.
Tangible asset risk refers to the risk of financial loss arising from loss or damage to tangible assets or from degradation ofthe working environment caused by natural disasters or facility management failures. Tangible assets refer to self-owned/rented real estate/movables such as land, buildings and accompanying equipment or fixtures/fittings.
Regulatory risk refers to the risk of financial losses due to a change of regulatory environment, including tax systems,accounting systems or regulatory treatment.
Reputational risk refers to the risk of financial losses from the adverse impact upon reputation among customers or themarket due to untrue rumors.
■ RISK MANAGEMENT AT THE UFJ GROUP

51
This table lists generic risk factors. There are more risks that the UFJ Group identifies, which are either sub-categories of
the generic risks or composite risks of multiple generic risk factors. For example, the UFJ Group manages interest rate
risk, which is a sub-category of market risk. Another example is settlement risk, which is the composite risk of credit risk
and funding liquidity risk.
RISK MANAGEMENT ORGANIZATION
To ensure the proper implementation of risk management activities throughout the group, the UFJ Group has established
a risk management organization and functions, and assigned particular roles and responsibilities for each type of risk man-
agement. The following organizations and functions have been established at UFJ Holdings, UFJ Bank, UFJ Trust and
the group’s other core companies.
Executive Officer Responsible for Risk Management
The executive officer in charge of risk management is responsible for identifying and monitoring individual and total risks
taken on by each group company, as well as for the appropriate management of that risk. This officer is also responsible
for submitting risk reports to senior management and, as necessary, making risk management recommendations.
Providing information on the management of risk capital is another role of this officer.
Risk Management Committee
Risk Management Committees, at each group company, are established to provide advice to the executive officer for risk
management so as to ensure the identification and appropriate management of risks. At UFJ Holdings, for example,
Group Risk Management Committee is held to discuss risk management issues at the group level.
Risk Management Department
At UFJ Holdings, the Risk Management Department monitors and manages all types of risk, including credit risk, market
risk, funding liquidity risk and operational risk, at the group level. It has responsibility to articulate the risk management
framework, policy and procedures for group-wide risk management activities. The Public Relations Department is respon-
sible for managing reputational risk because this risk is closely tied to public relations activities.
At UFJ Bank, the Risk Management Department supervises and coordinates risk management activities for the bank,
while there are risk management units dedicated to manage each type of risk.
At UFJ Trust, the Risk Management and Compliance Department oversees all types of risks and manages risks asso-
ciated with UFJ Trust’s fiduciary duty as trustee for trust assets.
52
CRISIS MANAGEMENT
In addition to normal risk management activities, the UFJ Group identifies “crisis management” separately. A “crisis” is
regarded as an extreme case of relevant risk events that can potentially cause critical damage to the operations of the UFJ
Group, financially and physically. The UFJ Group has established a core policy and set clear standards to deal with crisis
situations. The crisis management framework designed to minimize the impact of a crisis on customers and markets.
It also intends to minimize business disruptions and to implement effective contingency planning. Crisis management
oversight at the group level is the responsibility of the Group Crisis Management Committee at UFJ Holdings.
Risk Management Framework of the UFJ Group
Allocation of risk capitalApproval of risk management strategyApproval of risk management methods
Board of Directors
Group Audit Committee
Group Crisis Management Committee
Group Risk Management Committee
President and CEO
Public Relations Department
Reputational Risk Operational Risk Credit Risk Market Risk Funding Liquidity Risk
Group Management Committee
Executive Officer responsible for Risk Management
Risk Management Department
Group-Wide Risk Management
Discussion of risk management strategy, policies and procedures Capital adequacy assessment Monitoring of risk
Formulation of risk capital allocation plan Quarterly risk assessments Formulation of adjustments to risk capital allocations
Group Planning DepartmentPublic Relations Department Risk Management Department Compliance Department
53
INTEGRATED MANAGEMENT OF RISK AND RETURN
The UFJ Group utilizes an integrated management framework for the purpose of maintaining the proper balance between
the risks and returns associated with its business activities. The risk capital management framework is implemented in a
uniform manner at the UFJ Group based on the “Risk Capital Management Policy.”
Risk Capital Management
Risk capital management is used to control the scale of specific business activities that entail risk by allocating a suitable
amount of risk capital.
The amount of allocated risk capital is determined based on the maximum expected loss that could result from the
risk factors associated with each business. As a key index to integrate risk and return, risk capital calculation provides the
basis for a variety of management information. Specifically, capital adequacy is verified by comparing the sum of utilized
risk capital and the allocated risk capital with the actual available shareholders’ equity. The usage of risk capital by each
business unit is monitored against the allocated risk capital. These performance indicators are reported periodically to
management. By allocating risk capital to each business unit, the UFJ Group ensures that the scale of each business unit
remains within the scope of the group’s financial resources and that each unit seeks to generate earnings that are com-
mensurate with the associated risks, thus securing the capital adequacy of the group.
Allocation of Risk Capital and Profitability Indicators
Risk capital also provides the basis for calculating business unit performance indicators such as the economic profit. In
this manner, risk capital calculation plays a key role in the performance evaluation process of business activities.
CREDIT RISK MANAGEMENT
The UFJ Group conducts credit risk management not simply for the purpose of avoiding credit risk, but to take on risk
while managing credit risk at a suitable level in relation to the group’s financial strength and maintaining adequate mitiga-
tions and profitability relative to the level of risk. Based on this policy, the group conducts credit risk management and
improvement of its organization for the purpose of controlling credit risk and maximizing risk adjusted returns.
Organization and Framework
Credit risk management and monitoring at the group level is performed by UFJ Holdings. The results of monitoring activ-
ities are reported periodically to the Board of Directors, the Group Management Committee and senior management.
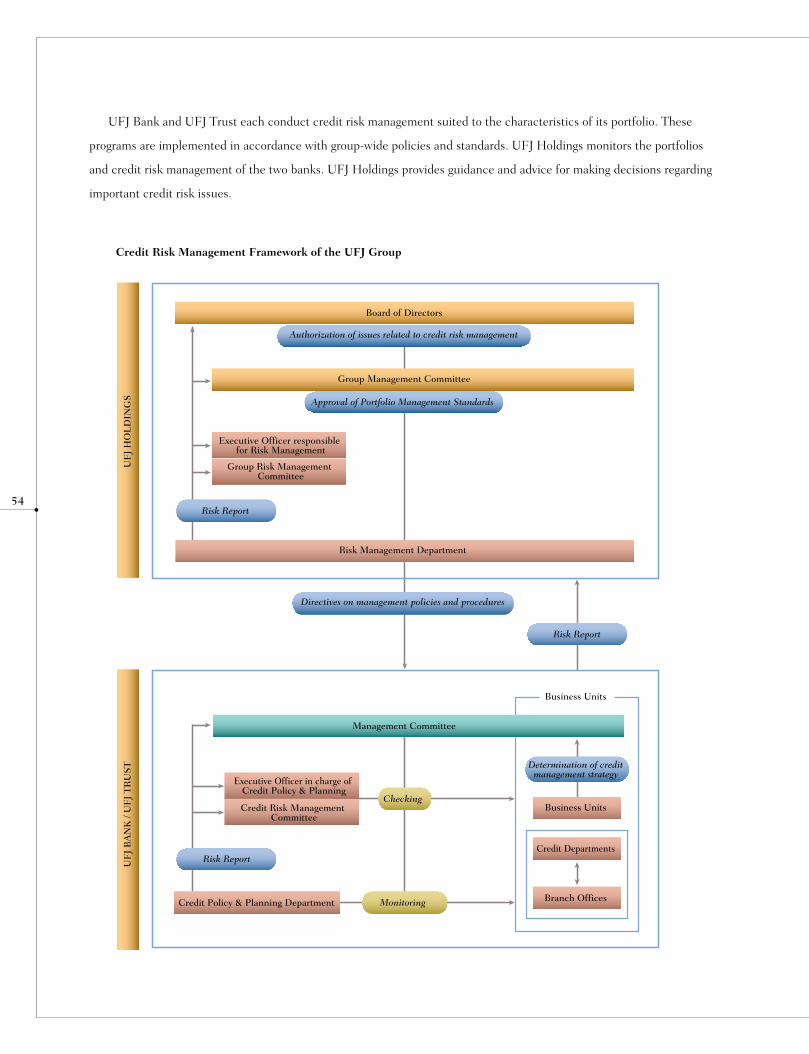
54
UFJ Bank and UFJ Trust each conduct credit risk management suited to the characteristics of its portfolio. These
programs are implemented in accordance with group-wide policies and standards. UFJ Holdings monitors the portfolios
and credit risk management of the two banks. UFJ Holdings provides guidance and advice for making decisions regarding
important credit risk issues.
Board of Directors
Authorization of issues related to credit risk management
Group Management Committee
Approval of Portfolio Management Standards
Risk Management Department
Directives on management policies and procedures
Management Committee
Checking
Determination of credit management strategy
Business Units
Business Units
Credit Departments
Branch Offices Monitoring Credit Policy & Planning Department
Risk Report
Credit Risk Management Committee
Executive Officer in charge of Credit Policy & Planning
Risk Report
Risk Report
Group Risk Management Committee
Executive Officer responsible for Risk Management
UF
J H
OL
DIN
GS
UF
J B
AN
K /
UF
J T
RU
ST
Credit Risk Management Framework of the UFJ Group

55
Through this process, the entire UFJ Group can maintain a consistent and uniform risk management system while
enabling the two banks to conduct credit risk management as required by their respective business activities. A similar
risk management system has been established for other major companies within the UFJ Group.
Credit Risk Management Policy Framework
UFJ Holdings has established a Credit Risk Management Policy to create a framework for the management of credit risk
at the UFJ Group. Based on this policy, the two UFJ Group banks establish their own policies, standards and detailed
rules for credit risk management. The two UFJ Group banks have a unified credit policy and standards for credit rating,
country rating, credit risk quantification methodology and self-assessment.
• Credit Rating Framework
The credit rating framework is the basis for all credit risk management activities. Under this framework, the financial sta-
tus of current and prospective borrowers is evaluated from three perspectives. First is safety, which includes the equity
ratio, retained earnings to total assets ratio, debt to total assets and room for more finance. Second is profitability, which
includes EBT ratio and EBITA ratio. Third is the ability to repay debts and the years to repay debts. In addition to these
quantitative measures, credit ratings include qualitative items such as business basis and the condition of the entire
industry. The result is the assignment of a credit rating on a scale of one to ten. Including subdivisions, there are 16 rat-
ings in total. Ratings undergo an annual ordinary review as well as additional reviews depending on changes in a borrow-
er’s status. This system makes it possible to monitor the current status of individual borrowers and strengthen credit
assessment capabilities, both of which are crucial for credit risk management. Furthermore, the credit rating system is
the foundation for management systems that utilize the quantification of credit risk.
• Country Rating Framework
Country rating measures the risk of a change in the status of credit caused by political, economic or social developments
in a country. Such changes in status include the inability to remit funds, foreign exchange losses, defaults, interest-rate
reductions, debt forgiveness and other events. There are eight grades in country rating, and ten altogether, including sub-
divisions. Country rating is an important risk measuring system at the UFJ Group for managing the concentration of cred-
it risk, establishing country ceilings based on credit rating and monitoring and analyzing the quality of the overall
non-Japanese portfolio.

• Self-Assessment Framework
Self-assessments of credit approvals are conducted twice each year and the results are reported to senior management.
The primary assessment is performed by operating bases and head office divisions engaged in credit-related activities.
Self-assessments are further examined by the Internal Audit Department, which is independent of departments engaged
in the extension and approval of loans.
• Credit Risk Measurement
The UFJ Group employs the internal rating framework to quantify credit risk for use in credit risk management.
Quantifying risk entails the use of statistical analysis of the loan portfolio to calculate expected future losses, which corre-
spond to the risk exposure, related to the inability of borrowers to meet their obligations. Using historical financial data
about borrowers to obtain a default probability for each credit-rating category, the distribution of probable losses is then
calculated based on simulations. From these computations, the group obtains two figures expressing the total risk of the
portfolio. One is the average expected loss, which represents the average expected loss that may be incurred over a one-year
period. The other is the maximum loss, which is the largest expected loss that may occur over the same one-year period.
These estimates cover loans, guarantees, foreign exchange assets, off-balance-sheet transactions, bonds and other
items. Furthermore, they are applicable to domestic and foreign corporations, individuals and financial institutions. The
main advantage of this quantification process is the ability to determine the precise effects of concentrating and diversify-
ing credit risk.
56
Rating Borrower Category Classification under the Financial Revitalization Law
1A1B Excellent1C
2 Prime3 Good Normal Normal4 Above Standard5 Standard6 Below Standard7 Acceptable
8A Special Mention8B Past Due 1 Month or More
Special Mention8C Past Due 3 Months or MoreSub-Standard8D Restructured
9 Possible Non-Performing Possible Non-Performing Doubtful
10A Quasi Non-Performing Quasi Non-PerformingBankrupt and Quasi-Bankrupt
10B Non-Performing Non-Performing
Credit Rating System

Portfolio Risk Management
Under this system, risk exposure is evaluated as a single portfolio. This makes it possible to search for any excessive con-
centration of risk based on such parameters as individual borrowers, industries and regions. To prevent such concentra-
tions and diversify credit risk, the UFJ Group establishes credit limits for each borrower, industry and country.
Risk and Cost Adjusted Return
Risk and Cost Adjusted Return (RACAR) is calculated for each loan and customer by deducting the credit risk cost,
which is the average expected loss, and other operational costs from the apparent revenues. RACAR is then used to set
lending rates that account for the associated risks and cost of each loan.
Credit Risk Capital Management
The average expected loss, a figure that should be covered by revenues, is deducted from the maximum loss to yield the
credit risk exposure, or “unexpected loss,” that should be covered by capital. This exposure is then monitored so as to
remain within the allocated credit risk capital under the risk capital management framework described above.
57
Quantifying and Managing Credit Risk
The Quantification Process
Example of the Diversification of Losses in a Sample Credit Portfolio
Exposure Recovery rate
Credit rating migrationDefault probability
Industry correlationIndustry weighting
Change in value upon default or credit rating change
Correlation
Stress loss
Larger loss Smaller loss
Fre
quen
cy Maximum loss Average loss
Past data are employed to calculate probable losses over the following year using a statistical technique.
The default probability is based on past financial data.
The portfolio loss depends on which borrowers default. Therefore, the probabilities of portfolio losses are calculated based on a simulation using 100,000 scenarios for all borrowers.
Separate recovery rates are established for each type of collateral.
Average loss: Weighted average of all projected losses
Maximum loss: Highest probable loss (99% level)
Stress loss: Losses exceeding the assumptions used for quantification
Credit risk management places priority on controlling the difference between the average and maximum losses.
Simulation and quantification of risk exposure
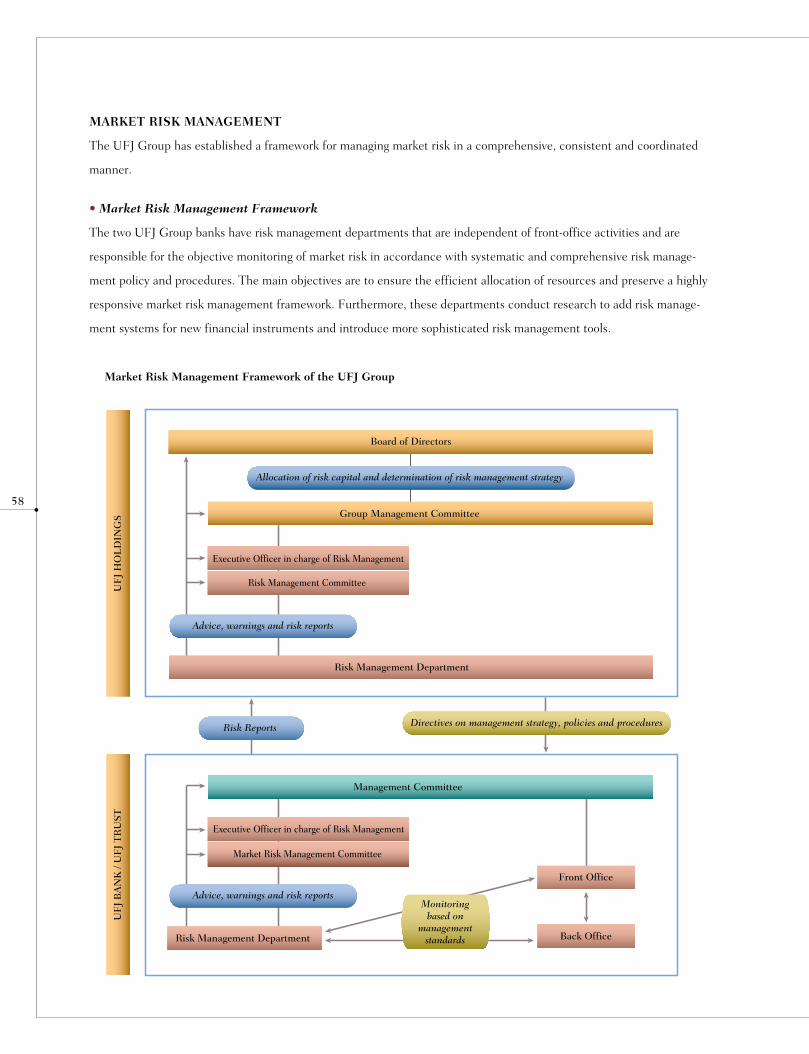
MARKET RISK MANAGEMENT
The UFJ Group has established a framework for managing market risk in a comprehensive, consistent and coordinated
manner.
• Market Risk Management Framework
The two UFJ Group banks have risk management departments that are independent of front-office activities and are
responsible for the objective monitoring of market risk in accordance with systematic and comprehensive risk manage-
ment policy and procedures. The main objectives are to ensure the efficient allocation of resources and preserve a highly
responsive market risk management framework. Furthermore, these departments conduct research to add risk manage-
ment systems for new financial instruments and introduce more sophisticated risk management tools.
58
Board of Directors
Group Management Committee
Allocation of risk capital and determination of risk management strategy
Executive Officer in charge of Risk Management
Risk Management Committee
Advice, warnings and risk reports
Risk Management Department
Directives on management strategy, policies and proceduresRisk Reports
Front Office
Back Office Risk Management Department
Advice, warnings and risk reports
Market Risk Management Committee
Executive Officer in charge of Risk Management
Management Committee
Monitoring based on
management standards
UF
J H
OL
DIN
GS
UF
J B
AN
K /
UF
J T
RU
ST
Market Risk Management Framework of the UFJ Group
• Market Risk Management Methodology
Market risk at all UFJ Group companies is managed as required in accordance with the scale, nature, complexity and
other characteristics of the applicable risks.
Establishment and Monitoring of Limit Structure
The UFJ Group has established limits for market risk exposure and losses. Managing these limits enables the group to
keep market risk exposure and possible unexpected losses within the amount of applicable risk capital.
In addition to these market risk limits, a warning-line guideline (Management Alert Limit) with regard to the perfor-
mance of equity holdings and other investment activities in the banking book has been established and is monitored daily
at UFJ Group banks. This guideline is created to deal with the risk of a decline in the group’s equity to a level that would
hinder operations in the subsequent six months. At the group level, UFJ Holdings monitors a similar guideline called the
“Group Trigger Limit” for the same purpose. This creates a mechanism whereby a warning can be sent to senior management
when needed.
Reporting
Risk exposure, performance and other items related to the market risk monitoring process are reported on a daily basis by
the Risk Management Department to the UFJ Holdings Executive Officer in charge of risk management. The risk man-
agement-related committees of UFJ Holdings and the two banks discuss market risk management activities and imple-
ment specific measures to ensure the effectiveness of these frameworks.
Value at Risk (VaR)
The UFJ Group employs VaR – a means of calculating the maximum expected loss with a one-day holding period, and one-
tailed confidence interval of 99% as its common yardstick to measure market risk in the trading book. To supplement VaR
methodology, the group performs a variety of other forms of risk analysis. Among them are stress tests that assume extreme
market volatility, interest rate sensitivity analysis, scenario analysis and earnings-at-risk (EaR) measurements for ALM.
Measurement of Value at Risk
Two methods are employed to measure VaR at the UFJ Group. With the historical simulation method, VaR is calculated
by performing simulations based on past market volatility data. With the variance-covariance method, VaR is calculated
based on the assumption that the markets will fluctuate in relation to its statistical standard deviation. UFJ Bank employs
the historical simulation method, while UFJ Trust employs the variance-covariance method. Risk exposure in all markets
was calculated using the following methods, based on the common group yardstick (one-day holding period, one-tailed
confidence interval of 99%).
59
(April 2, 2001 to January 11, 2002)
Holding Period Calculation Method
Sanwa Bank One Year Variance/Covariance
Tokai Bank Two Years Historical Simulation
Toyo Trust Two Years Variance/Covariance
(January 15, 2002 to March 29, 2002)
Holding Period Calculation Method
UFJ Bank Two Years Historical Simulation
UFJ Trust Bank Two Years Variance/Covariance
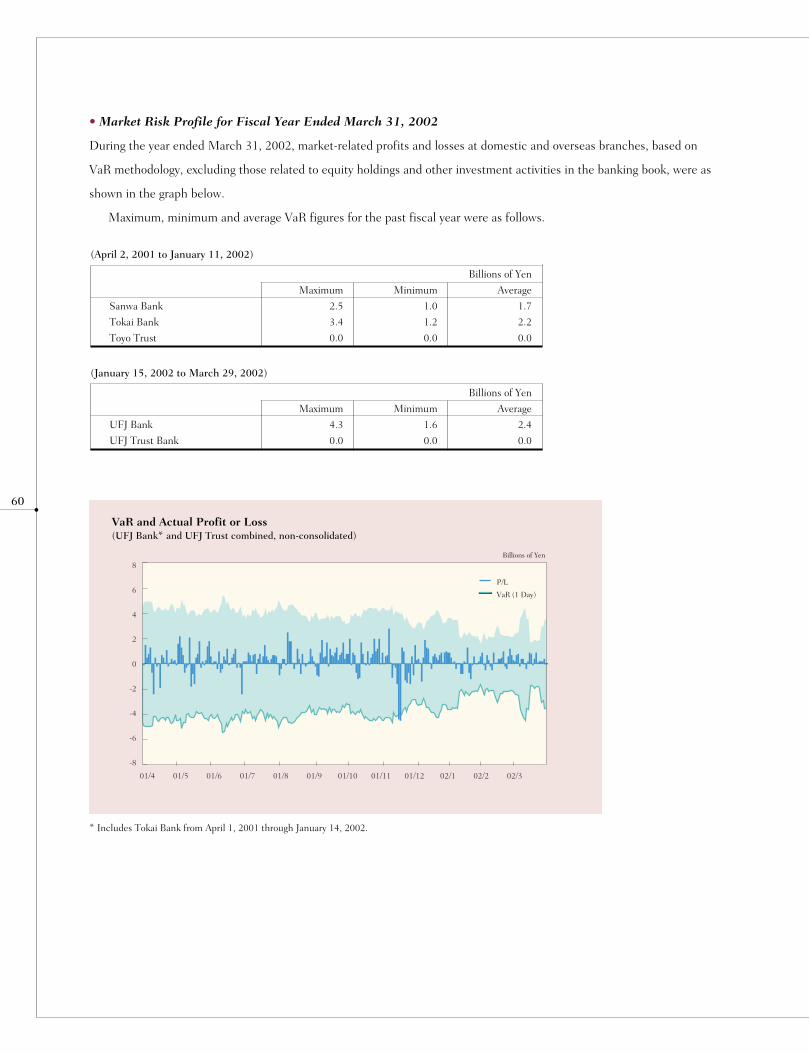
01/4
0
-2
-4
-6
-8
2
4
6
8
01/5 01/6 01/7 01/8 01/9 01/10 01/11 01/12 02/1 02/2 02/3
Billions of Yen
P/L
VaR (1 Day)
• Market Risk Profile for Fiscal Year Ended March 31, 2002
During the year ended March 31, 2002, market-related profits and losses at domestic and overseas branches, based on
VaR methodology, excluding those related to equity holdings and other investment activities in the banking book, were as
shown in the graph below.
Maximum, minimum and average VaR figures for the past fiscal year were as follows.
60
(January 15, 2002 to March 29, 2002)
Billions of Yen
Maximum Minimum Average
UFJ Bank 4.3 1.6 2.4
UFJ Trust Bank 0.0 0.0 0.0
VaR and Actual Profit or Loss (UFJ Bank* and UFJ Trust combined, non-consolidated)
* Includes Tokai Bank from April 1, 2001 through January 14, 2002.
(April 2, 2001 to January 11, 2002)
Billions of Yen
Maximum Minimum Average
Sanwa Bank 2.5 1.0 1.7
Tokai Bank 3.4 1.2 2.2
Toyo Trust 0.0 0.0 0.0

• Backtesting
Backtesting is used to evaluate the accuracy of risk calculations by comparing the VaR with actual gains and losses over a
specific period. The reliability of the risk measurement model can be verified if the number of times gains and losses
exceed VaR is within the forecast range.
The graphs below show daily fluctuations in VaR and gains and losses in market value. Dots below the diagonal lines
represent values that exceed VaR. During the year ended March 31, 2002, there were losses that exceeded VaR on one
occasion at Sanwa Bank and two occasions at Tokai Bank. In mid-November a sudden and unexpected rise in U.S. dollar
interest rates caused losses at both banks to exceed VaR. And in mid-December another rise in U.S. dollar interest rates
caused losses at Tokai Bank to exceed VaR. This frequency of exceeding VaR demonstrates that the risk measurement
model (one-tailed confidence interval of 99%) is sufficiently accurate to measure market risk exposure.
0
-2.5
-5.0
5.02.5
2.5
5.0
0
-2.5
-5.0
5.02.5
2.5
5.0
0
-2.5
-5.0
5.02.5
2.5
5.0
VaRP/L
VaRP/L
VaRP/L
VaRP/L
Actual Profit or Loss
0
-0.025
-0.05
0.050.025
0.025
0.05
Back-Tested Profit or Loss
Actual Profit or Loss Actual Profit or Loss
Billions of Yen (April 2, 2001 to January 11, 2002)
Sanwa BankBillions of Yen (April 2, 2001 to January 11, 2002)
Tokai Bank
Billions of Yen (January 15, 2002 to March 29, 2002)
UFJ BankBillions of Yen (April 2, 2001 to March 29, 2002)
UFJ Trust
61
VaR and Actual Profit or Loss
• Stress Testing
As described earlier, VaR is the maximum expected loss estimated using the 99th percentile. However, this is an estimated
value when the normal market assumption stands. So, the UFJ Group must still consider the possibility that sudden,
abnormal movements in factors affecting markets could lead to significant losses that are not predictable by VaR calcula-
tions. The group therefore supplements VaR with stress testing. Stress testing uses historical market data and hypothetical
scenarios to measure potential losses in the event of extreme market movements. The group conducts constant safety
checks through both VaR and stress testing, allowing the group to ensure that losses under any conditions stay within the
scope of shareholders’ equity.
FUNDING LIQUIDITY RISK MANAGEMENT
The UFJ Group regards the implementation of a suitable funding liquidity risk management program as essential to the
sound management of the entire group. As such, the group has a comprehensive framework for funding liquidity risk
management, both for Japanese yen and foreign currencies.
Based on the fundamental policy of preserving the stability of fund procurement activities, all related departments,
led by risk management-related departments, work together to ensure the suitable management of funding liquidity risk.
This stance allows the group to conduct business activities with confidence in fund procurement activities in yen or for-
eign currencies.
Risk Phase
To create a unified risk management framework for the entire group, the UFJ Group has categorized the environment for
fund procurement into four risk phases – normal, possible, tight and crisis – depending on the probability that risks will
actually materialize. Each UFJ Group bank has established clear management methods, including contingency plans, for
each of these risk phases.
Preservation of Stable Cash Flows
The UFJ Group establishes limits for the estimated volume of funds that will need to be procured on the following busi-
ness day, and for other related items. These limits prevent the group from developing an over-reliance on short-term
funding. The group also preserves consistently adequate cash flows and liquidity by holding a sufficient volume of
Japanese government bonds, U.S. treasuries and other highly liquid instruments for fund procurement in the event of a
crisis.
62

• Funding Liquidity Risk Management Framework
The UFJ Group banks have separate liquidity management departments for yen and foreign currency procurement activi-
ties. Risk management-related departments are responsible for the comprehensive management of funding liquidity risk.
Action plans are in place to respond to changes in market conditions and other events. Contingency plans are
activated in the event of instability in financial systems or other unforeseen problems, enabling the group to respond to a
liquidity crisis immediately. In all, the group is adequately prepared for rapid changes in the operating environment.
The UFJ Group responded in a unified manner to turmoil in U.S. dollar funding liquidity caused by the September
2001 terrorist attacks in the U.S. With the coordinated efforts of the relevant departments to share information, to sup-
port affected operating units and provide management with sufficient information to appropriately judge the situation, the
group addressed the crisis in a suitable fashion.
• Funding Liquidity Risk Management Monitoring
Departments responsible for funding liquidity risk management monitor liquidity on a daily basis to confirm strict compli-
ance to rules (liquidity risk limits and others). Risk management-related committees periodically monitor funding liquidi-
ty risk, discuss necessary policies and submit reports to management.
OPERATIONAL RISK MANAGEMENT
Operational risk management at financial institutions is becoming increasingly important due to the diversification in
their products and services and the growing use of IT systems and networks. The UFJ Group is constantly taking steps to
make its operational risk management framework more comprehensive and sophisticated.
Management of Processing and System Risk
• Structure of Operational Risk Management Framework
In establishing its operational risk management framework, the UFJ Group has chosen a combination of qualitative
assessment and quantitative approaches consistently throughout the entire group. Proprietary tools such as “Processing
Workflow Charts” and “System Risk Evaluation Sheets” are developed and implemented to identify the area, type and
size of operational risk within the group. The result of the risk assessment helps, in the form of an integrated scoring
system, to identify the area where weakness lies in terms of operational risk. This assessment process enables the UFJ
Group to take immediate action to control and mitigate the applicable risks in the problem area. It also becomes the basis
of the quantitative approach described above.
Information gathered, along with risk indicators at major group companies, such as processing errors and IT system
malfunctions, are reported periodically to senior management.
63

• Quantification of Operational Risk
The UFJ Group began efforts to measure its operational risk exposure quantitatively in 1998, firstly with processing risk
and system risk. The UFJ Group is currently improving the method used to quantify processing risk and system risk. The
method incorporates historical loss experience in the occurrence of processing errors, accidents and computer
malfunctions. It also formulates scenarios by evaluating the nature of each processing and IT system based on the assess-
ment by Processing Workflow Charts and System Risk Evaluation Sheets described above. Combining the internal loss
data and the scenario-based loss possibilities, the UFJ Group calculates the operational risk amount by VaR methodology.
Results of these quantitative analyses are also used to calculate the operational risk capital, to efficiently allocate
resources among the group’s operating activities.
64
Reports
Monitoring status of risk
Directives on actions to take
Preparation and enactment of risk reduction measures
Enactment of risk reduction measures
Processing errors
IT system malfunctions
Risk indicators
Processing of data
External database
Internal database
Analysis and storage
Reports
Allocation of capital and evaluation of results
Reports
Risk exposure
Preparation of scenarios
Monitoring items requiring improvement
“Processing Workflow Charts”
“System Risk Evaluation Sheets”
Verification
Sen
ior
Man
agem
ent
Dep
artm
ents
whe
re
oper
atio
nal r
isk
exis
ts
Ris
k M
anag
emen
t-R
elat
ed D
epar
tmen
ts
Operational Risk Management Framework of the UFJ Group
Reputational Risk Management
UFJ Holdings and all UFJ Group banks have formulated a Reputational Risk Management Policy. To ensure that the
group quickly learns of information affecting its reputation and takes suitable actions, The Practice of Public Relations
and other means are employed to make all employees of the UFJ Group aware of reputational risk. Responsibility for
managing reputational risk is centralized in the Public Relations Department of UFJ Holdings.
Other Types of Operational Risk
In addition to the risks described above, the UFJ Group defines tangible asset risk, human resources risk and regulatory
risk as types of operational risk. The group is currently assembling frameworks for the management of these risks.
RESPONSE TO PROPOSED NEW BIS REGULATIONS
The Basel Committee on Banking Supervision of the Bank for International Settlements sets BIS guidelines that pre-
scribe capital adequacy standards for all internationally active banks.
In January 2001, this committee issued a proposal for a New Basel Capital Accord. The proposal has three core ele-
ments: required regulatory capital in line with the risks at each financial institution; supervisory reviews by national bank-
ing regulators, and market discipline through the disclosure of information. The Committee believes that these three
“pillars” will collectively ensure the stability and soundness of financial systems.
The new regulations themselves will reflect the nature of risks at banks more closely. To calculate the regulatory
required capital, the Committee has offered a menu of options from which banks can choose not only for market risk,
where the menu approach has been implemented since 1998, but also for credit risk and operational risk in the proposed
framework. Under this framework, banks can choose to calculate their own required regulatory capital based on their own
risk profiles and risk management methodology.
The Committee, in discussions with the industry, is currently finalizing the proposal. The new regulations are expect-
ed to become effective in 2006.
As an internationally active financial group, the UFJ Group is playing an active role in the process of revising BIS reg-
ulations. The group believes that the proposed menu approach will contribute to improve risk management practices in
the financial services industry. Accordingly, the UFJ Group has started work to conform to the proposed regulations. This
includes the selection of a more advanced approach in the proposed menu in line with the group’s risk profiles.
Furthermore, the group is actively submitting comments regarding the proposal through banking organizations in Japan
and overseas to play a part in this new development in the global financial industry.
65
■ ASSET-LIABILITY MANAGEMENT (ALM)
ALM is conducted primarily to strategically manage interest rate risk and funding liquidity risk associated with deposits
and loans. The main objectives are to maintain a sound financial position and increase profitability. The UFJ Group
regards ALM as a vital tool for preserving stability in the event of rapid financial and economic shifts.
The UFJ Group’s overall ALM policy is formulated at the Group Management Committee of UFJ Holdings, and
material risks and profits associated with the ALM activities of each core subsidiary are monitored by the Risk
Management Department. ALM policies at core subsidiaries, namely UFJ Bank and UFJ Trust, are discussed and formu-
lated by their respective management committees. These committees take into consideration all items affecting ALM
operations, including the financial and economic outlook, profit and funding plans, hedging policies and other factors.
Relevant departments within UFJ Bank and UFJ Trust are responsible for conducting ALM operations. Results of these
operations, namely the associated risks and profits, are overseen by the respective risk management departments. To
respond quickly to sudden market movements, the results of this monitoring are reported to senior management on a
daily basis. ALM operations undergo monthly inspections by senior management at risk management committees so that
policies can be revised as necessary.
INTEREST RATE RISK
As net interest income is the largest source of earnings at the UFJ Group, operating results are susceptible to fluctuations
in market interest rates. To eliminate the potential negative impact of these fluctuations on the earnings of each business
unit, the management of bank-wide interest rate risk at UFJ Bank and UFJ Trust has been transferred to a centralized
department within each of these two banks. This specialist department is charged with controlling interest rate risk to
ensure that losses never exceed preset limits. To accomplish this, interest rate risk is quantified using interest rate gap
analysis, Value at Risk, Earnings at Risk and other methods. The department also forecasts and analyzes the potential
medium- and long-term impact on earnings of interest rate movements. This analysis is not limited to financial and eco-
nomic parameters. A variety of other factors that could affect earnings, such as the adoption of new accounting standards
for financial instruments and other changes in rules and regulations affecting the UFJ Group, are also examined.
66

FUNDING LIQUIDITY RISK
Funding liquidity risk primarily represents the risk that funding operations could be insufficient to cover the UFJ Group’s
payment obligations, as well as the risk that market turmoil could prevent the group from procuring funds when needed
or at an appropriate cost. The UFJ Group’s fundamental policy is to constantly maintain a level of liquidity needed to
ensure the smooth operation of its business activities. Specialized departments at UFJ Bank and UFJ Trust monitor liq-
uidity on a daily basis so that each bank’s exposure to liquidity risk can be controlled. Furthermore, medium- and long-
term funding liquidity risk is measured through such means as maturity gap management and scenario analysis. The
results of this analysis are used not only to keep risk within preset limits at all times, but also to formulate fund procure-
ment and other plans.
UFJ Bank and UFJ Trust are chiefly dependent on deposits from customers and other savings and asset-management
products. Liquidity at each bank is supplemented by a portfolio of securities with high credit ratings that can be quickly
converted into cash at any time. Each bank has also formulated a contingency plan to be prepared for instability in the
financial system or other unforeseeable events affecting its ability to procure funds.
67
PURPOSE OF INTERNAL AUDITS
At the UFJ Group, internal audits are conducted for the purpose of contributing to the soundness and fairness of the
management of the UFJ Group in order to gain the confidence of customers and markets, and maximize the value of the
group through the process of verification and evaluation from an independent standpoint. Internal audits are used to eval-
uate internal control systems, including compliance and risk management, to verify that these systems are appropriate
and effective. Based on these internal audits, reports and recommendations are submitted to the group’s management,
including managers in charge of corporate governance and senior executives who directly oversee operations. As such, the
UFJ Group regards internal audits as one of the most important management systems.
SUMMARY OF GROUP INTERNAL AUDIT ORGANIZATION
• UFJ Holdings
UFJ Holdings has an Internal Audit Department that is overseen by an executive officer who is responsible for no other
divisions. This department is responsible for the coordination, management and monitoring of internal audits throughout
the group, including audits of the departments and offices of UFJ Holdings. Representatives of this department partici-
pate as members of the Audit & Compliance Committee of each core company, conducting audits as required.
• Core Companies
Each core company has its own Internal Audit Department that is overseen by a director or an executive officer who is
responsible for no other divisions. These departments are charged with auditing the respective companies’ head offices,
operating bases, subsidiaries and other components of their organizations. The internal audit departments are also
responsible for checking the status of credit ratings, self-assessments of assets, and loan write-offs and reserves. The
departments also confirm that all rules and procedures are being strictly followed. At UFJ Bank, effective internal audit
systems are also in place outside Japan. The UFJ Group has such organizations in London, Singapore, Hong Kong and
New York that directly report to UFJ Bank’s Internal Audit Department.
• Other Group Companies
At other group companies, internal audit units have been formed as required by the business activities, scale and types of
risk at each company.
QUALITY IMPROVEMENT OF INTERNAL AUDIT ACTIVITIES
Internal audit departments at the UFJ Group are constantly working to further improve the quality of their internal audit-
ing activities in accordance with/by conducting appropriate risk assessments. Specifically, efforts are made to conduct
audits having a cycle and depth that reflect the nature and degree of risk of each audit, as well as to conduct more effi-
cient and effective audits by improving auditing methods and programs.
68
■ INTERNAL AUDITING SYSTEMS OF THE UFJ GROUP
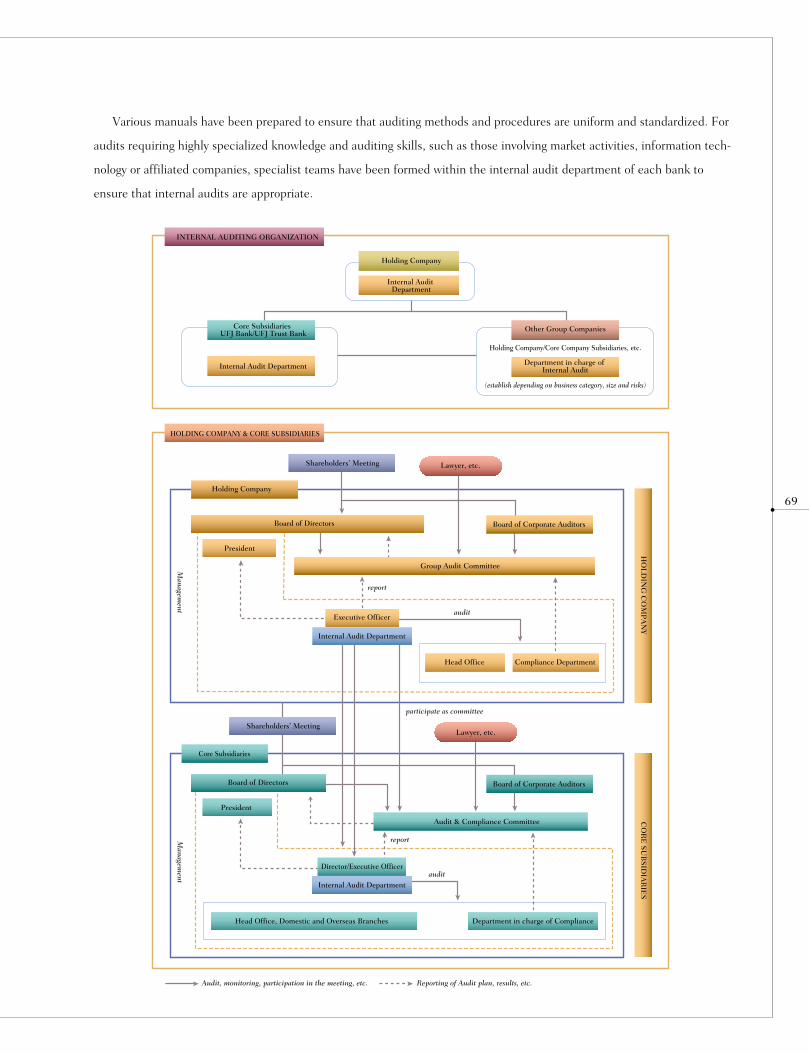
INTERNAL AUDITING ORGANIZATION
HOLDING COMPANY & CORE SUBSIDIARIES
HO
LD
ING
CO
MP
AN
Y C
OR
E S
UB
SID
IAR
IES
Holding Company
Shareholders’ Meeting
Shareholders’ Meeting
Core Subsidiaries
Lawyer, etc.
Lawyer, etc.
Holding Company
Board of Directors
Board of Directors
President
President
Group Audit Committee
Executive Officer
Director/Executive Officer
Internal Audit Department
Department in charge of ComplianceHead Office, Domestic and Overseas Branches
Internal Audit Department
Head Office Compliance Department
Board of Corporate Auditors
Board of Corporate Auditors
Audit & Compliance Committee
Internal Audit Department
Core Subsidiaries UFJ Bank/UFJ Trust Bank
Internal Audit Department
Other Group Companies
Holding Company/Core Company Subsidiaries, etc.
Department in charge of Internal Audit
(establish depending on business category, size and risks)
report
report
Reporting of Audit plan, results, etc.Audit, monitoring, participation in the meeting, etc.
audit
audit
participate as committee
Managem
entM
anagement
69
Various manuals have been prepared to ensure that auditing methods and procedures are uniform and standardized. For
audits requiring highly specialized knowledge and auditing skills, such as those involving market activities, information tech-
nology or affiliated companies, specialist teams have been formed within the internal audit department of each bank to
ensure that internal audits are appropriate.
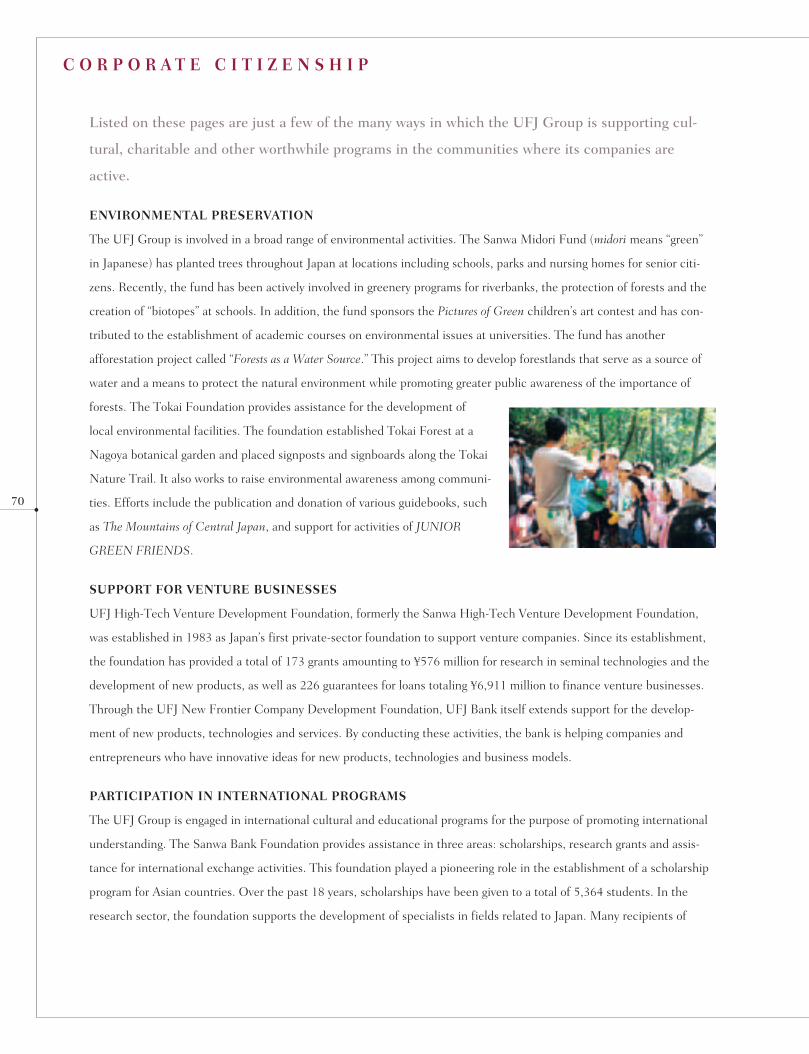
Listed on these pages are just a few of the many ways in which the UFJ Group is supporting cul-
tural, charitable and other worthwhile programs in the communities where its companies are
active.
ENVIRONMENTAL PRESERVATION
The UFJ Group is involved in a broad range of environmental activities. The Sanwa Midori Fund (midori means “green”
in Japanese) has planted trees throughout Japan at locations including schools, parks and nursing homes for senior citi-
zens. Recently, the fund has been actively involved in greenery programs for riverbanks, the protection of forests and the
creation of “biotopes” at schools. In addition, the fund sponsors the Pictures of Green children’s art contest and has con-
tributed to the establishment of academic courses on environmental issues at universities. The fund has another
afforestation project called “Forests as a Water Source.” This project aims to develop forestlands that serve as a source of
water and a means to protect the natural environment while promoting greater public awareness of the importance of
forests. The Tokai Foundation provides assistance for the development of
local environmental facilities. The foundation established Tokai Forest at a
Nagoya botanical garden and placed signposts and signboards along the Tokai
Nature Trail. It also works to raise environmental awareness among communi-
ties. Efforts include the publication and donation of various guidebooks, such
as The Mountains of Central Japan, and support for activities of JUNIOR
GREEN FRIENDS.
SUPPORT FOR VENTURE BUSINESSES
UFJ High-Tech Venture Development Foundation, formerly the Sanwa High-Tech Venture Development Foundation,
was established in 1983 as Japan’s first private-sector foundation to support venture companies. Since its establishment,
the foundation has provided a total of 173 grants amounting to ¥576 million for research in seminal technologies and the
development of new products, as well as 226 guarantees for loans totaling ¥6,911 million to finance venture businesses.
Through the UFJ New Frontier Company Development Foundation, UFJ Bank itself extends support for the develop-
ment of new products, technologies and services. By conducting these activities, the bank is helping companies and
entrepreneurs who have innovative ideas for new products, technologies and business models.
PARTICIPATION IN INTERNATIONAL PROGRAMS
The UFJ Group is engaged in international cultural and educational programs for the purpose of promoting international
understanding. The Sanwa Bank Foundation provides assistance in three areas: scholarships, research grants and assis-
tance for international exchange activities. This foundation played a pioneering role in the establishment of a scholarship
program for Asian countries. Over the past 18 years, scholarships have been given to a total of 5,364 students. In the
research sector, the foundation supports the development of specialists in fields related to Japan. Many recipients of
70
C O R P O R A T E C I T I Z E N S H I P

these grants from the United States, Europe and Australia have advanced to prominent positions in academic, political
and business fields. The Tokai Bank Foundation also provides assistance for international exchange. During its 19 years,
the foundation has invited 106 students from 17 countries to Japan for short-term academic programs. The foundation
also sponsors a painting exhibition called “Asia Drawn by Children.” Other support is extended to the preservation of
ancient ruins in Cambodia, lectures and concerts.
SUPPORT FOR REFUGEES
• Assistance for the UNHCR
The UJF Group banks offer customers in Japan a special savings account that automatically sets aside a portion of the
interest earned for donation to the Office of the United Nations High Commissioner for Refugees (UNHCR).
IN THE COMMUNITY
• UFJ Money Museum
The UFJ Money Museum, which opened in 1961, has on display approximately 10,000 rare coins from around the world,
with related information on each one. It is renowned for having the largest private coin collection in Japan. The collection
includes rare items that illustrate the history of money, such as the largest gold
coin in the world, the world’s oldest coin (made of a sea shell), and coins from
ancient Greece and Rome. The museum also houses illustrious Japanese artist
Hiroshige Utagawa’s collection of Ukiyoe paintings known as “The Fifty-three
Stages of the Tokaido.”
• UFJ Trust Cultural Foundation
The UFJ Trust Cultural Foundation was formed in November 1989 to commemorate the 30th anniversary of UFJ Trust,
formerly Toyo Trust. The foundation extends financial assistance to various organizations in all regions of Japan involved
in music, art, theater and traditional arts. Since its establishment, 601 organizations in all 47 Japanese prefectures have
received a total of ¥379 million.
71
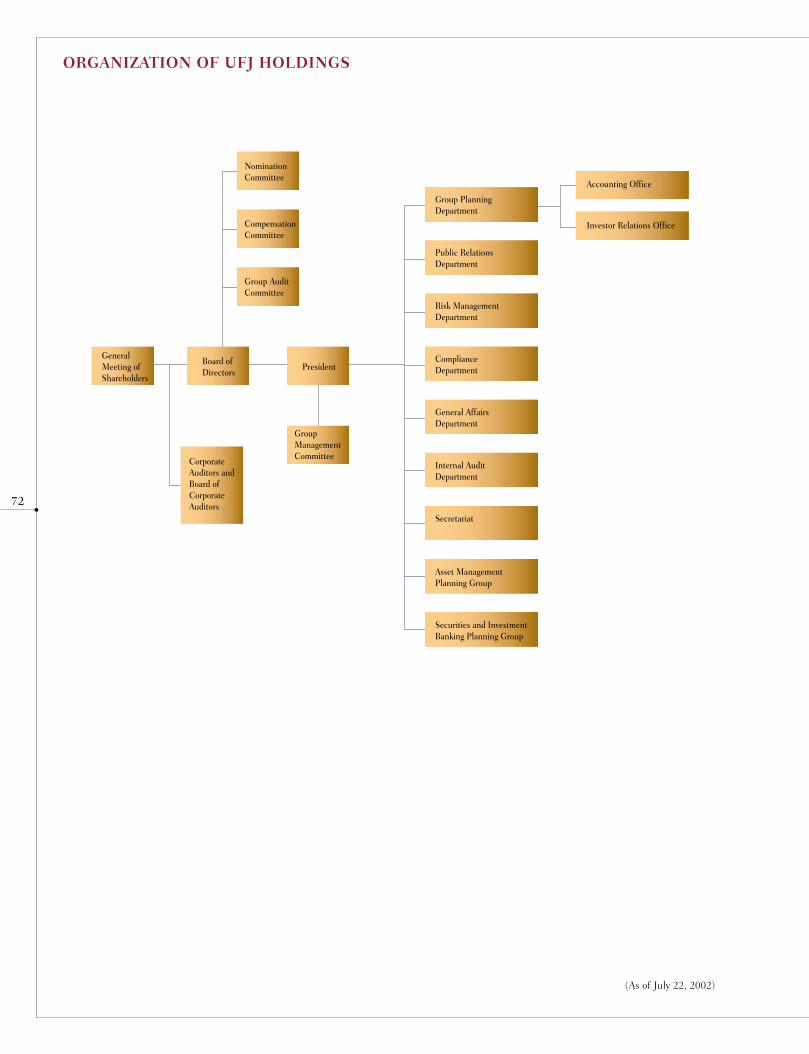
ORGANIZATION OF UFJ HOLDINGS
72
(As of July 22, 2002)
President
Group Management Committee
Board of Directors
Corporate Auditors and Board of Corporate Auditors
Group Audit Committee
Compensation Committee
Nomination Committee
Group Planning Department
Accounting Office
Investor Relations Office
Public Relations Department
Risk Management Department
Compliance Department
General Affairs Department
Internal Audit Department
Secretariat
Asset Management Planning Group
Securities and Investment Banking Planning Group
General Meeting of Shareholders

73
(As of July 22, 2002)
BOARD OF DIRECTORS
CORPORATE AUDITORS
EXECUTIVE OFFICERS
Directors
Iwao IsomuraVice Chairman, TOYOTA MOTOR CORPORATION
Makoto UtsumiPresident, JAPAN CENTER FOR INTERNATIONAL FINANCE
Hiroshi HamadaChairman and CEO, RICOH COMPANY, LTD.
Shosaku YasuiChairman, TEIJIN LIMITED
President and CEO
Takeshi Sugihara
Director and Senior Executive
Officer
Toshihide Mizuno
Directors and Executive
Officers of Subsidiaries
Masashi TeranishiPresident and CEO, UFJ Bank Limited
Yasukuni DoiPresident, UFJ Trust Bank Limited
Nobuo Sugie
Akio Imanishi
Kanji Nakatsuka
Kanji KobayashiSenior Advisor, Nippon Life Insurance Company
Yoshiharu HayakawaRepresentative, KASUMI EMPOWERMENT RESEARCHINSTITUTE
Senior Executive Officer
Katsunori Konishi
Executive Officers
Toshiyuki Tada
Hirokazu Ando
Fumiyasu Mori
Takashi Hara
Katsuyoshi Narumiya
MANAGEMENT
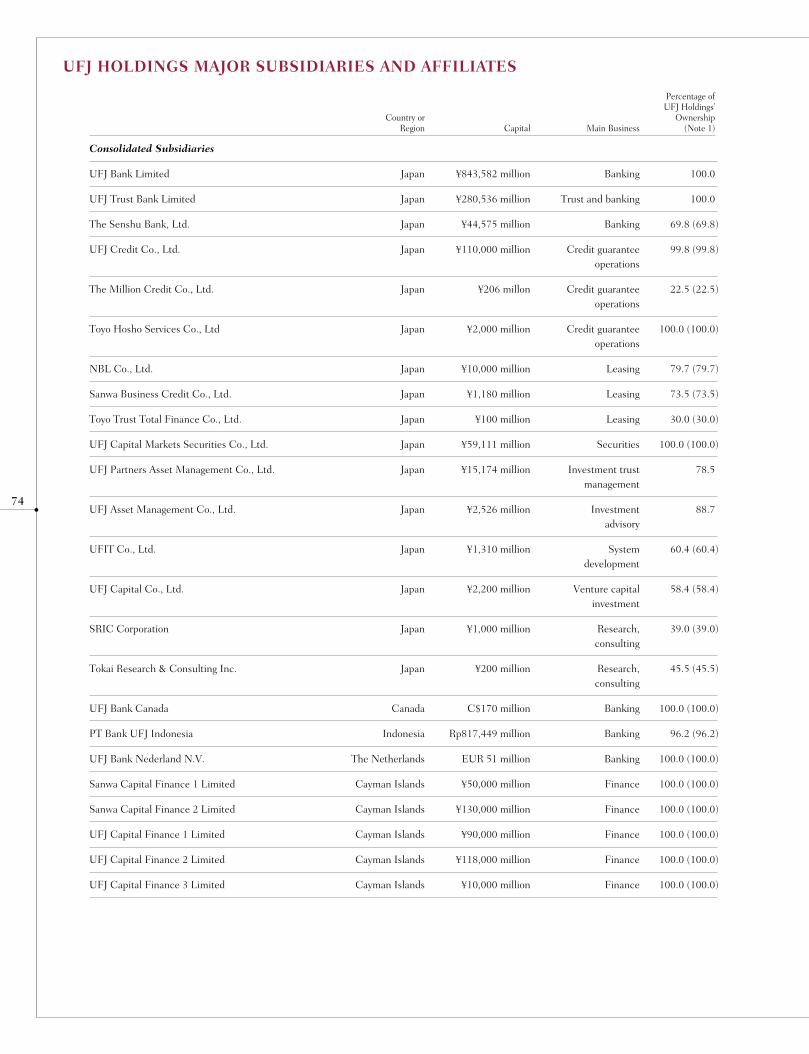
74
UFJ HOLDINGS MAJOR SUBSIDIARIES AND AFFILIATES
Consolidated Subsidiaries
UFJ Bank Limited Japan ¥843,582 million Banking 100.0
UFJ Trust Bank Limited Japan ¥280,536 million Trust and banking 100.0
The Senshu Bank, Ltd. Japan ¥44,575 million Banking 69.8 (69.8)
UFJ Credit Co., Ltd. Japan ¥110,000 million Credit guarantee 99.8 (99.8)operations
The Million Credit Co., Ltd. Japan ¥206 millon Credit guarantee 22.5 (22.5)operations
Toyo Hosho Services Co., Ltd Japan ¥2,000 million Credit guarantee 100.0 (100.0)operations
NBL Co., Ltd. Japan ¥10,000 million Leasing 79.7 (79.7)
Sanwa Business Credit Co., Ltd. Japan ¥1,180 million Leasing 73.5 (73.5)
Toyo Trust Total Finance Co., Ltd. Japan ¥100 million Leasing 30.0 (30.0)
UFJ Capital Markets Securities Co., Ltd. Japan ¥59,111 million Securities 100.0 (100.0)
UFJ Partners Asset Management Co., Ltd. Japan ¥15,174 million Investment trust 78.5management
UFJ Asset Management Co., Ltd. Japan ¥2,526 million Investment 88.7advisory
UFIT Co., Ltd. Japan ¥1,310 million System 60.4 (60.4)development
UFJ Capital Co., Ltd. Japan ¥2,200 million Venture capital 58.4 (58.4)investment
SRIC Corporation Japan ¥1,000 million Research, 39.0 (39.0)consulting
Tokai Research & Consulting Inc. Japan ¥200 million Research, 45.5 (45.5)consulting
UFJ Bank Canada Canada C$170 million Banking 100.0 (100.0)
PT Bank UFJ Indonesia Indonesia Rp817,449 million Banking 96.2 (96.2)
UFJ Bank Nederland N.V. The Netherlands EUR 51 million Banking 100.0 (100.0)
Sanwa Capital Finance 1 Limited Cayman Islands ¥50,000 million Finance 100.0 (100.0)
Sanwa Capital Finance 2 Limited Cayman Islands ¥130,000 million Finance 100.0 (100.0)
UFJ Capital Finance 1 Limited Cayman Islands ¥90,000 million Finance 100.0 (100.0)
UFJ Capital Finance 2 Limited Cayman Islands ¥118,000 million Finance 100.0 (100.0)
UFJ Capital Finance 3 Limited Cayman Islands ¥10,000 million Finance 100.0 (100.0)
Percentage ofUFJ Holdings’
Country or OwnershipRegion Capital Main Business (Note 1)
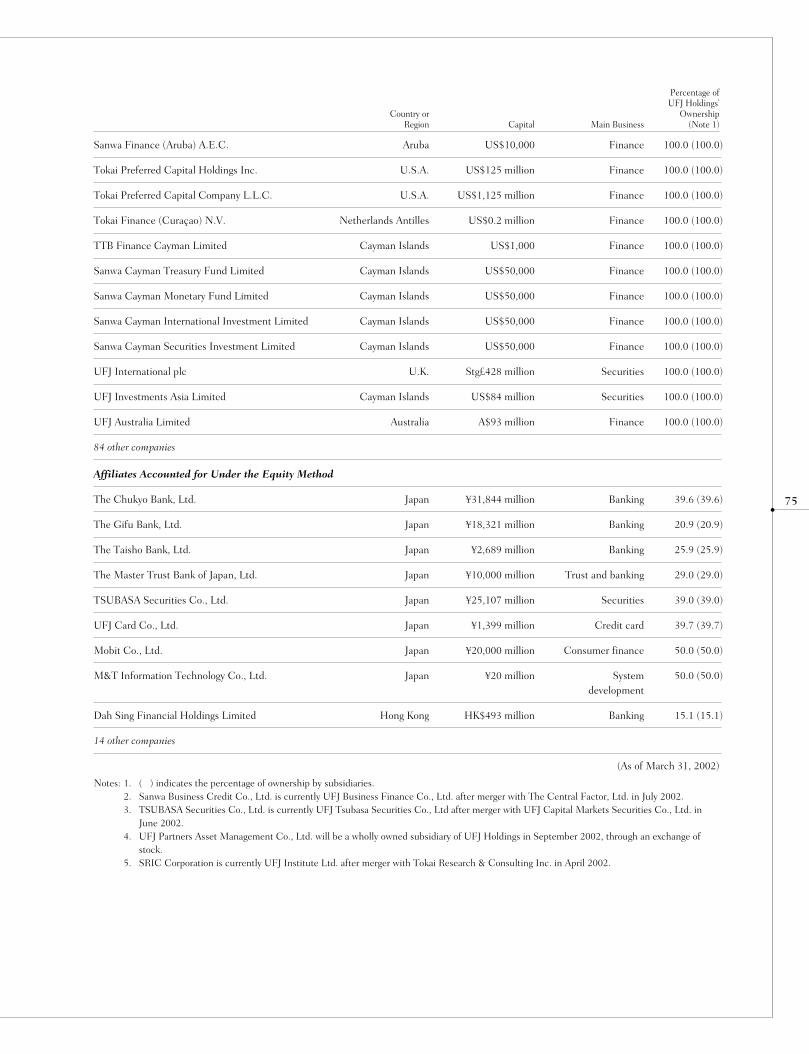
75
Sanwa Finance (Aruba) A.E.C. Aruba US$10,000 Finance 100.0 (100.0)
Tokai Preferred Capital Holdings Inc. U.S.A. US$125 million Finance 100.0 (100.0)
Tokai Preferred Capital Company L.L.C. U.S.A. US$1,125 million Finance 100.0 (100.0)
Tokai Finance (Curaçao) N.V. Netherlands Antilles US$0.2 million Finance 100.0 (100.0)
TTB Finance Cayman Limited Cayman Islands US$1,000 Finance 100.0 (100.0)
Sanwa Cayman Treasury Fund Limited Cayman Islands US$50,000 Finance 100.0 (100.0)
Sanwa Cayman Monetary Fund Limited Cayman Islands US$50,000 Finance 100.0 (100.0)
Sanwa Cayman International Investment Limited Cayman Islands US$50,000 Finance 100.0 (100.0)
Sanwa Cayman Securities Investment Limited Cayman Islands US$50,000 Finance 100.0 (100.0)
UFJ International plc U.K. Stg£428 million Securities 100.0 (100.0)
UFJ Investments Asia Limited Cayman Islands US$84 million Securities 100.0 (100.0)
UFJ Australia Limited Australia A$93 million Finance 100.0 (100.0)
84 other companies
Affiliates Accounted for Under the Equity Method
The Chukyo Bank, Ltd. Japan ¥31,844 million Banking 39.6 (39.6)
The Gifu Bank, Ltd. Japan ¥18,321 million Banking 20.9 (20.9)
The Taisho Bank, Ltd. Japan ¥2,689 million Banking 25.9 (25.9)
The Master Trust Bank of Japan, Ltd. Japan ¥10,000 million Trust and banking 29.0 (29.0)
TSUBASA Securities Co., Ltd. Japan ¥25,107 million Securities 39.0 (39.0)
UFJ Card Co., Ltd. Japan ¥1,399 million Credit card 39.7 (39.7)
Mobit Co., Ltd. Japan ¥20,000 million Consumer finance 50.0 (50.0)
M&T Information Technology Co., Ltd. Japan ¥20 million System 50.0 (50.0)development
Dah Sing Financial Holdings Limited Hong Kong HK$493 million Banking 15.1 (15.1)
14 other companies
(As of March 31, 2002)
Notes: 1. ( ) indicates the percentage of ownership by subsidiaries.2. Sanwa Business Credit Co., Ltd. is currently UFJ Business Finance Co., Ltd. after merger with The Central Factor, Ltd. in July 2002.3. TSUBASA Securities Co., Ltd. is currently UFJ Tsubasa Securities Co., Ltd after merger with UFJ Capital Markets Securities Co., Ltd. in
June 2002.4. UFJ Partners Asset Management Co., Ltd. will be a wholly owned subsidiary of UFJ Holdings in September 2002, through an exchange of
stock.5. SRIC Corporation is currently UFJ Institute Ltd. after merger with Tokai Research & Consulting Inc. in April 2002.
Percentage ofUFJ Holdings’
Country or OwnershipRegion Capital Main Business (Note 1)

76
U.S.A.
New York BranchPark Avenue Plaza 55 East 52nd Street,New York, NY 10055, U.S.A.Tel: 1-212-339-6300Fax: 1-212-754-1851
Chicago Branch10 South Wacker Drive Suite 1825,Chicago, IL 60606, U.S.A.Tel: 1-312-368-3000Fax: 1-312-346-6677
Houston Representative Office1200 Smith Street, Houston, TX 77002, U.S.A.Tel: 1-713-654-9970Fax: 1-713-654-1462
Los Angeles Branch601 South Figueroa Street, Los Angeles, CA 90017, U.S.A.Tel: 1-213-896-7407Fax: 1-213-623-4912
San Francisco BranchOne Front Street, Suite 1800, San Francisco, CA 94111, U.S.A.Tel: 1-415-597-5200Fax: 1-415-788-5459
Kentucky Representative Office7310 Turfway Road, Suite 210 Florence,KT 41042, U.S.A.Tel: 1-859-746-1800Fax: 1-859-746-1799
UFJ Futures L.L.C.141 West Jackson Boulevard, Suite 1755,Chicago, IL 60604, U.S.A.Tel: 1-312-341-6530Fax: 1-312-922-7194http://www.ufjfutures.com/
UFJ Trust Company of New York666 Fifth Avenue, 33rd Floor, New York, NY 10103-3395, U.S.A.Tel: 1-212-307-3450Fax: 1-212-307-3498 Swift: TTNY US 33
CANADA
UFJ Bank Canada Toronto Head OfficeBCE Place, Canada Trust Tower, P.O.Box 525, Suite 4400, 161 Bay Street, Toronto, Ontario M5J 2S1, CanadaTel: 1-416-366-2583Fax: 1-416-366-8599
BRAZIL
Banco Bradesco S.A.Predio Novissimo 4° Andar Cidade de Deus,s/n Vila Yara CEP 06029-900 osasco,SP, Federative Republic of BrazilTel: 55-11-3684-9546Fax: 55-11-3684-9039http://www.bradesco.com/index_eng.html
UNITED KINGDOM
London BranchP.O. Box 36, City Place House, 55 Basinghall Street, London EC2V 5DL,United KingdomTel: 44-20-7330-5000Fax: 44-20-7330-5555
UFJ International plcOne Exchange Square, London EC2A 2JL, United KingdomTel: 44-20-7638-6030 Fax: 44-20-7588-5875http://www.ufji.com
UFJ Deutsche Asset ManagementLimitedOne Appold Street, London EC2A 2UU, United KingdomTel: 44-20-7545-0565 Fax: 44-20-7545-0552
UFJ Baillie Gifford AssetManagement Limited1 Rutland Court, Edinburgh EH3 8EY, United KingdomTel: 44-131-222-4000 Fax: 44-131-222-4487
THE NETHERLANDS
UFJ Bank Nederland N.V.Keizersgracht 452, 1016 GD, Amsterdam, The NetherlandsTel: 31-20-627-1616 Fax: 31-20-624-1872
GERMANY
Düsseldorf Branch3rd Floor, Wehrhahn Center, Oststrasse 10, 40211 Düsseldorf, Federal Republic of GermanyTel: 49-211-160000Fax: 49-211-359703
Frankfurt Representative OfficeBockenheimer Landstrasse 51-53, 60325 Frankfurt/Main, Federal Republic of GermanyTel: 49-69-1700950Fax: 49-69-17009522
UFJ Leasing Deutschland GmbHWehrhahn Center, Oststrasse 10,40211 Düsseldorf, Federal Republic of GermanyTel: 49-211-1600037Fax: 49-211-35-9703
SWITZERLAND
UFJ Bank (Schweiz) AGBadenerstrasse 6, 8004 Zürich, SwitzerlandTel: 41-1-296-1400 Fax: 41-1-296-1494
Hong Kong Representative Office6th Floor, The Hong Kong Club Building, 3A Chater Road, Central, Hong KongTel: 852-2971-2100 Fax: 852-2877-0538
IRAN
Tehran Representative Office4th Floor of a Building Registered under No. 6933/6985, No. 34/1 Haghani Expressway, Tehran, The Islamic Republic of IranTel: 98-21-879-1105Fax: 98-21-879-1106
EUROPE AND THE MIDDLE EAST
THE AMERICAS
UFJ GROUP OVERSEAS NETWORK

77
HONG KONG
Hong Kong BranchFairmont House, 8 Cotton Tree Drive,Central, Hong KongTel: 852-2843-3888 Fax: 852-2840-0730
Kowloon Sub-BranchRoom 1701, Miramar Tower, 132 Nathan Road, Tsimshatsui, Kowloon, Hong KongTel: 852-2378-5111 Fax: 852-2730-3566
UFJ International Finance Asia Limited6th Floor, The Hong Kong Club Building,3A Chater Road, Central, Hong KongTel: 852-2533-4300 Fax: 852-2845-3518http://www.ufjifal.com.hk
UFJ Investments Asia Limited28/F Alexandra House, 16-20 Chater Road, Central, Hong KongTel: 852-2978-6888 Fax: 852-2840-0069
Dah Sing Financial Holdings Limited36th Floor, Dah Sing Financial Centre,108 Gloucester Road, Hong KongTel: 852-2507-8866 Fax: 852-2598-5052http://www.dahsing.com.hk/dsb/index_e.html
Asia Commercial Bank Ltd.Asia Financial Centre, 120, Des Voeux Road, Central, Hong KongTel: 852-2541-9222 Fax: 852-2541-0009
CHINA
Shanghai Branch16th Floor, Marine Tower, No.1, Pudong Avenue, Shanghai, The People’s Republic of ChinaTel: 86-21-5879-3818 Fax: 86-21-5879-3816~7
Tianjin BranchRoom 811, Tianjin International Building,75 Nanjing Lu, Tianjin, The People’s Republic of ChinaTel: 86-22-2330-4852 Fax: 86-22-2330-4660
Beijing BranchRoom 410, Office Tower 2, Henderson Centre, 18 Jianguomennei Dajie, Beijing, The People’s Republic of ChinaTel: 86-10-6518-2780 Fax: 86-10-6518-2770
Dalian Branch13th Floor, Senmao Building, 147 Zhongshan Road, Dalian, The People’s Republic of ChinaTel: 86-411-360-3111 Fax: 86-411-360-3377
Shenzhen Branch17th Floor, Shenzhen International Financial Building,2022 Jian She Road, Shenzhen,Guangdong Province, The People’s Republic of ChinaTel: 86-755-220-2202 Fax: 86-755-222-8135, 225-2255
Guangzhou Representative OfficeRoom No. 510, China Hotel Office Tower,Liu Hua Lu, Guangzhou, The People’s Republic of ChinaTel: 86-20-8667-7731 Fax: 86-20-8667-7720
Industrial & CommercialInternational Leasing Co., Ltd.Room No. 2728, Dongfang Hotel,1 Liu Hua Lu, Guangzhou,The People’s Republic of ChinaTel: 86-20-8666-6248Fax: 86-20-8666-6148
United Leasing Company, LimitedRoom 2007, 20th Floor, Union Building,100 Yanan Road (East), Shanghai, The People’s Republic of ChinaTel: 86-21-6328-7295 Fax: 86-21-6320-2813
TAIWAN
Taipei Branch32 & 33F, No. 66, Section 1, Chung-Hsiao West Road, Taipei, TaiwanTel: 886-2-2371-8888 Fax: 886-2-2371-8000
UFJ Finance Taiwan Limited3F, 145, Section 2, Chien Kuo North Road, Taipei, TaiwanTel: 886-2-2516-5332 Fax: 886-2-2505-6044
UFJ Auto Leasing Taiwan Limited3F, 145, Section 2, Chien Kuo North Road, Taipei, TaiwanTel: 886-2-2516-5332 Fax: 886-2-2505-6044
REPUBLIC OF KOREA
Seoul BranchLotte Building, 22nd Floor, 1 Sogong-Dong, Chung-ku, Seoul, Republic of Korea, C.P.O.Box 4698Tel: 82-2-752-7321 Fax: 82-2-754-3870
SINGAPORE
Singapore Branch6 Raffles Quay, #24-01 John Hancock Tower, Singapore 048580, Republic of SingaporeTel: 65-538-4838, 535-8222Fax: 65-538-4636, 532-5453
ASIA & OCEANIA
■ UFJ Bank’s operations appear in black and UFJ Trust’s operations appear in blue.

■ UFJ Bank’s operations appear in black and UFJ Trust’s operations appear in blue.
78
MARAYSIA
Labuan BranchLevel 10(D) Main Office Tower, Financial Park Labuan, IOFC Jalan Merdeka, 87000, Federal Territory of Labuan, MalaysiaTel: 60-87-419200~1, 411203Fax: 60-87-419202, 410204
Kuala Lumpur Marketing OfficeLevel 11, Menara Dion 27, Jalan Sultan Ismail,50250 Kuala Lumpur, MalaysiaTel: 60-3-2032-4722, 2031-5234Fax: 60-3-2032-4733, 2031-5239
Bumiputra-Commerce Bank Berhad22nd Floor, 6 Jalan Tun Perak, 50050 Kuala Lumpur, MalaysiaTel: 60-3-2693-1722 Fax: 60-3-2693-3136http://www.bcb.com.my/
Commerce International MerchantBankers Berhad10-12th Floors, Commerce Square, Jalan Semantan, Damansara Heights,50490 Kuala Lumpur, MalaysiaTel: 60-3-253-4645 Fax: 60-3-253-4976http://www.cimb.com.my/
Am Bank Berhad18th Floor, Manara Dion, Jalan Sultan Ismail, 50250 Kuala Lumpur,MalaysiaTel: 60-3-206-3939 Fax: 60-3-206-6270
THAILAND
Bangkok International BankingFacility179/117-119 28th Floor, Bangkok City Tower, South Sathorn Road,Thungmahamek, Sathorn, Bangkok 10120,Kingdom of ThailandTel: 66-2684-0900, 66-2287-3411Fax: 66-2287-3412
Bangkok UFJ Limited179/117-119 28th Floor, Bangkok City Tower, South Sathorn Road,Thungmahamek, Sathorn, Bangkok 10120,Kingdom of ThailandTel: 66-2-684-0999 Fax: 66-2-287-3374
SCB Leasing Company Limited15th & 27th Floor,130-132 Sindhorn Building Tower 3,Wittayu Road, Lumpini, Patumwan,Bangkok 10330, Kingdom of ThailandTel: 66-2263-2990Fax: 66-2263-2991
Bangkok Central Leasing Co., Ltd.16th Floor, Sethiwan Tower, 139 Pan Road, Silom, Bangkok, Kingdom of ThailandTel: 66-2-266-6040 Fax: 66-2-237-4492
Siam Commercial Bank Public Company Limited9 Rutchadapisek Road, Ladyao, Jatujak,Bangkok 10900, Kingdom of ThailandTel: 66-2-544-3041~2, 3046 Fax: 66-2-544-3114http://www.scb.co.th/
VIETNAM
Ho Chi Minh City Representative OfficeSuite E, 9th Floor, OSIC Building No.8,Nguyen Hue Street, District 1, Ho Chi Minh City, Socialist Republic of VietnamTel: 84-8-8242-230 Fax: 84-8-8241-962
INDONESIA
PT Bank UFJ Indonesia Bank Bali Building, 4th & 5th Floors, Jl. Jend. Sudirman Kav. 27, Jakarta 12920, Republic of IndonesiaTel: 62-21-250-0401 Fax: 62-21-250-0410
Bekasi Sub-BranchEJIP Center, EJIP Industrial Park,Lemahabang, Bekasi 17550, Republic of IndonesiaTel: 62-21-897-5148 Fax: 62-21-897-5159
MM2100 Industrial Town Sub-BranchRuko Mega Mall D-12, MM2100 Industrial Town,Cibitung, Bekasi 17520, Republic of IndonesiaTel: 62-21-898-1167 Fax: 62-21-898-1168
Karawang Sub-BranchGraha KIIC, Kawasan Industri KIIC, Jl. Permata Raya Lot C 1B, Karawang 41361, Republic of IndonesiaTel: 62-21-8910-8288 Fax: 62-21-8910-8289
Surabaya BranchGedung Bumi Mandiri, 8th Floor, Jl. Basuki Rakhmat 129-137, Surabaya 60271, Republic of IndonesiaTel: 62-31-531-9135 Fax: 62-31-531-9144
PT UFJ-BRI Finance Wisma 46, 6th Floor, Kota BNI, Jl. Jend. Sudirman Kav. 1, Jakarta 10220, Republic of IndonesiaTel: 62-21-574-5333, 4545, 5454 Fax: 62-21-574-5444
Surabaya Branch6th Floor, Bumi Mandiri, Jl. Basuki Rakhmat 129-137, Surabaya 60271, Republic of IndonesiaTel: 62-31-531-9121 Fax: 62-31-531-6756
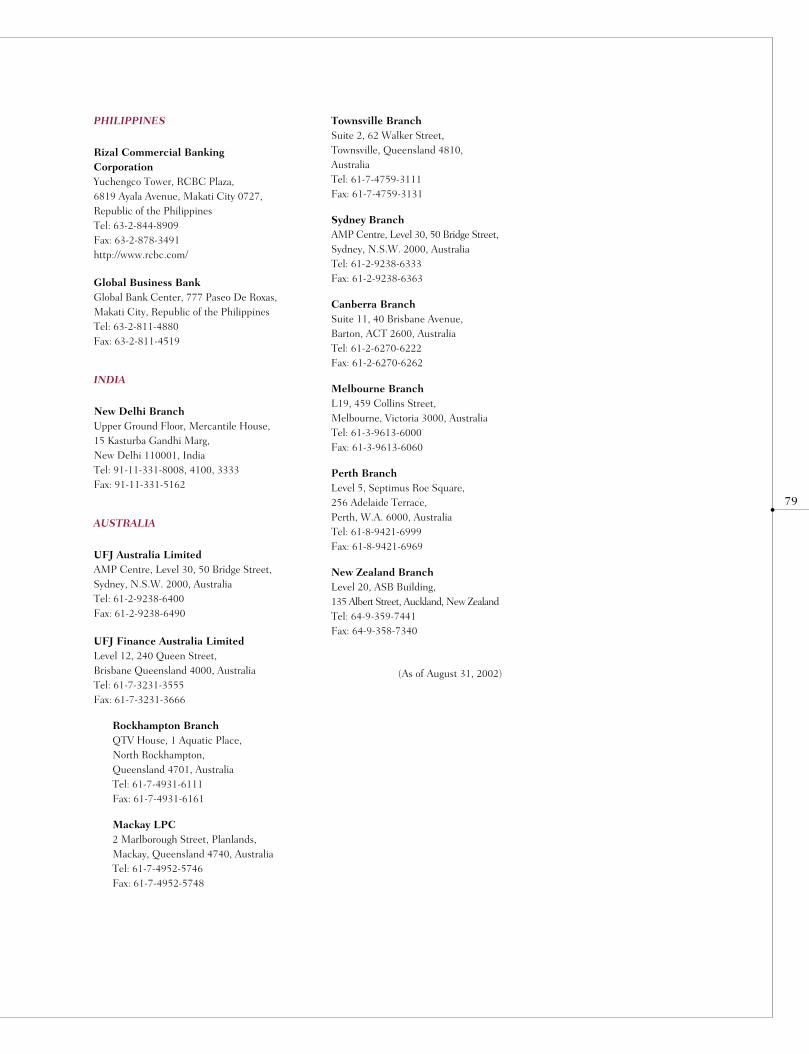
79
PHILIPPINES
Rizal Commercial BankingCorporationYuchengco Tower, RCBC Plaza, 6819 Ayala Avenue, Makati City 0727,Republic of the PhilippinesTel: 63-2-844-8909 Fax: 63-2-878-3491http://www.rcbc.com/
Global Business BankGlobal Bank Center, 777 Paseo De Roxas,Makati City, Republic of the PhilippinesTel: 63-2-811-4880 Fax: 63-2-811-4519
INDIA
New Delhi BranchUpper Ground Floor, Mercantile House,15 Kasturba Gandhi Marg, New Delhi 110001, IndiaTel: 91-11-331-8008, 4100, 3333Fax: 91-11-331-5162
AUSTRALIA
UFJ Australia LimitedAMP Centre, Level 30, 50 Bridge Street,Sydney, N.S.W. 2000, AustraliaTel: 61-2-9238-6400 Fax: 61-2-9238-6490
UFJ Finance Australia LimitedLevel 12, 240 Queen Street, Brisbane Queensland 4000, AustraliaTel: 61-7-3231-3555 Fax: 61-7-3231-3666
Rockhampton BranchQTV House, 1 Aquatic Place, North Rockhampton, Queensland 4701, AustraliaTel: 61-7-4931-6111 Fax: 61-7-4931-6161
Mackay LPC2 Marlborough Street, Planlands,Mackay, Queensland 4740, AustraliaTel: 61-7-4952-5746 Fax: 61-7-4952-5748
Townsville BranchSuite 2, 62 Walker Street, Townsville, Queensland 4810,AustraliaTel: 61-7-4759-3111 Fax: 61-7-4759-3131
Sydney BranchAMP Centre, Level 30, 50 Bridge Street,Sydney, N.S.W. 2000, AustraliaTel: 61-2-9238-6333 Fax: 61-2-9238-6363
Canberra BranchSuite 11, 40 Brisbane Avenue, Barton, ACT 2600, AustraliaTel: 61-2-6270-6222 Fax: 61-2-6270-6262
Melbourne BranchL19, 459 Collins Street, Melbourne, Victoria 3000, AustraliaTel: 61-3-9613-6000 Fax: 61-3-9613-6060
Perth BranchLevel 5, Septimus Roe Square, 256 Adelaide Terrace, Perth, W.A. 6000, AustraliaTel: 61-8-9421-6999 Fax: 61-8-9421-6969
New Zealand BranchLevel 20, ASB Building, 135 Albert Street, Auckland, New ZealandTel: 64-9-359-7441 Fax: 64-9-358-7340
(As of August 31, 2002)

80
UFJ GROUP NETWORK
Branches & Sub-Branches 652
ATM Locations 1,444
Tokyo Metropolitan Area
Branches & Sub-Branches 259
ATM Locations 570
Osaka Area
Branches & Sub-Branches 177
ATM Locations 248
Nagoya Area
Branches & Sub-Branches 191
ATM Locations 623
Europe
Branches 3
Representative Offices 2
Subsidiaries 6
Total 11
Asia
Branches 12
Sub-Branches 2
Representative Offices 3
Subsidiaries 10
Total 27
The Americas
Branches 3
Sub-Branches 3
Representative Offices 1
Subsidiaries 3
Total 10
EUROPE 11 ASIA 27 THE AMERICAS 10
● DOMESTIC
● OVERSEAS
(As of March 31, 2002)
81
• AUDITED FINANCIAL STATEMENTS
Report of Independent Accountants. . . . . 82
Consolidated Balance Sheet. . . . . 83
Consolidated Statement of Operations. . . . . 84
Consolidated Statement of Changes in Stockholders’ Equity. . . . . 85
Consolidated Statement of Cash Flows. . . . . 86
Notes to the Consolidated Financial Statements. . . . . 88
• SUPPLEMENTARY INFORMATION
UFJ Bank
Non-Consolidated Balance Sheets. . . . . 128
Non-Consolidated Statements of Operations. . . . . 129
UFJ Trust
Non-Consolidated Balance Sheets. . . . . 130
Non-Consolidated Statements of Operations. . . . . 131
Non-Consolidated Balance Sheets (Trust Account). . . . . 132
Capital Adequacy. . . . . 133
F I N A N C I A L S E C T I O N
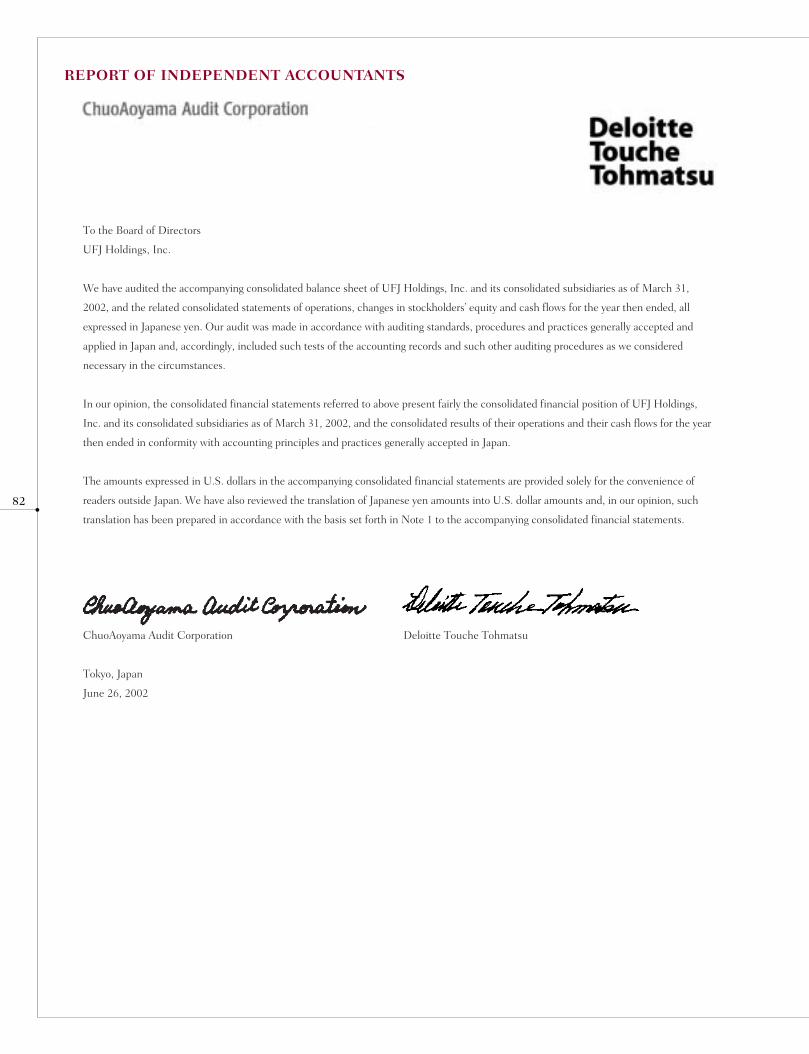
82
REPORT OF INDEPENDENT ACCOUNTANTS
To the Board of Directors
UFJ Holdings, Inc.
We have audited the accompanying consolidated balance sheet of UFJ Holdings, Inc. and its consolidated subsidiaries as of March 31,
2002, and the related consolidated statements of operations, changes in stockholders’ equity and cash flows for the year then ended, all
expressed in Japanese yen. Our audit was made in accordance with auditing standards, procedures and practices generally accepted and
applied in Japan and, accordingly, included such tests of the accounting records and such other auditing procedures as we considered
necessary in the circumstances.
In our opinion, the consolidated financial statements referred to above present fairly the consolidated financial position of UFJ Holdings,
Inc. and its consolidated subsidiaries as of March 31, 2002, and the consolidated results of their operations and their cash flows for the year
then ended in conformity with accounting principles and practices generally accepted in Japan.
The amounts expressed in U.S. dollars in the accompanying consolidated financial statements are provided solely for the convenience of
readers outside Japan. We have also reviewed the translation of Japanese yen amounts into U.S. dollar amounts and, in our opinion, such
translation has been prepared in accordance with the basis set forth in Note 1 to the accompanying consolidated financial statements.
ChuoAoyama Audit Corporation Deloitte Touche Tohmatsu
Tokyo, Japan
June 26, 2002

83
Millions ofU.S. Dollars
Millions of Yen (Note 1)As of March 31, 2002 2002 2002
ASSETS:
Cash and Due from Banks (Notes 9, 33 and 34) ¥ 6,404,825 $ 48,084 Call Loans 383,919 2,882Receivables under Resale Agreements 614,314 4,612Monetary Receivables Bought (Note 34) 127,674 958Trading Assets (Notes 3, 9 and 34) 2,680,244 20,122Money Held in Trust (Note 34) 111,429 837Securities (Notes 4, 9 and 34) 15,606,367 117,165Loans and Bills Discounted (Notes 5 and 9) 46,024,625 345,530Foreign Exchanges (Note 6) 551,005 4,137Other Assets (Notes 7 and 9) 3,584,120 26,908Premises and Equipment (Notes 8 and 9) 770,063 5,781Deferred Tax Assets (Note 31) 1,458,282 10,948Goodwill 21,534 162Customers’ Liabilities for Acceptances and Guarantees (Note 17) 3,106,505 23,322Reserve for Credit Losses (1,671,269) (12,547)Reserve for Losses on Securities (663) (5)
Total Assets ¥79,772,980 $598,896
LIABILITIES, MINORITY INTERESTS AND STOCKHOLDERS’ EQUITY:
Liabilities:Deposits (Notes 9 and 10) ¥57,159,888 $429,128 Call Money (Note 9) 3,561,500 26,738Payables under Repurchase Agreements (Note 9) 504,186 3,785Commercial Paper (Note 9) 575,262 4,319Trading Liabilities (Note 11) 1,743,440 13,089Borrowed Money (Notes 9 and 12) 1,355,518 10,176Foreign Exchanges (Note 13) 167,519 1,258Bonds and Notes (Note 14) 2,672,663 20,065Borrowed Money from Trust Account 1,692,839 12,709Other Liabilities (Notes 9 and 15) 3,294,490 24,733Reserve for Employee Bonus 20,425 153Reserve for Retirement Benefits (Note 30) 8,599 65Reserve for Contingent Liabilities Related to Loans Sold 56,716 426Reserve for Losses on Supports of Specific Borrowers 579,157 4,348Other Reserves (Note 16) 82 1Deferred Tax Liabilities (Note 31) 1,992 15Deferred Tax Liabilities for Revaluation Reserve for Land 83,936 630Acceptances and Guarantees (Note 17) 3,106,505 23,322
Total Liabilities 76,584,726 574,960
Minority Interests:Minority Interests 587,474 4,411
Stockholders’ Equity:Capital Stock (Note 20) 1,000,000 7,507Capital Surplus (Note 20) 1,266,626 9,509Revaluation Reserve for Land, Net of Taxes 130,638 981Retained Earnings 254,225 1,909Net Unrealized Gain (Loss) on Available-for-sale Securities, Net of Taxes (Note 34) 60,110 451Foreign Currency Translation Adjustments (37,834) (284)Treasury Stock (208) (2)Parent Company Stock Held by Subsidiaries (72,779) (546)
Total Stockholders’ Equity 2,600,779 19,525
Total Liabilities, Minority Interests and Stockholders’ Equity ¥79,772,980 $598,896
UFJ Holdings, Inc. and Consolidated Subsidiaries
CONSOLIDATED BALANCE SHEET
The accompanying notes are an integral part of these consolidated financial statements.
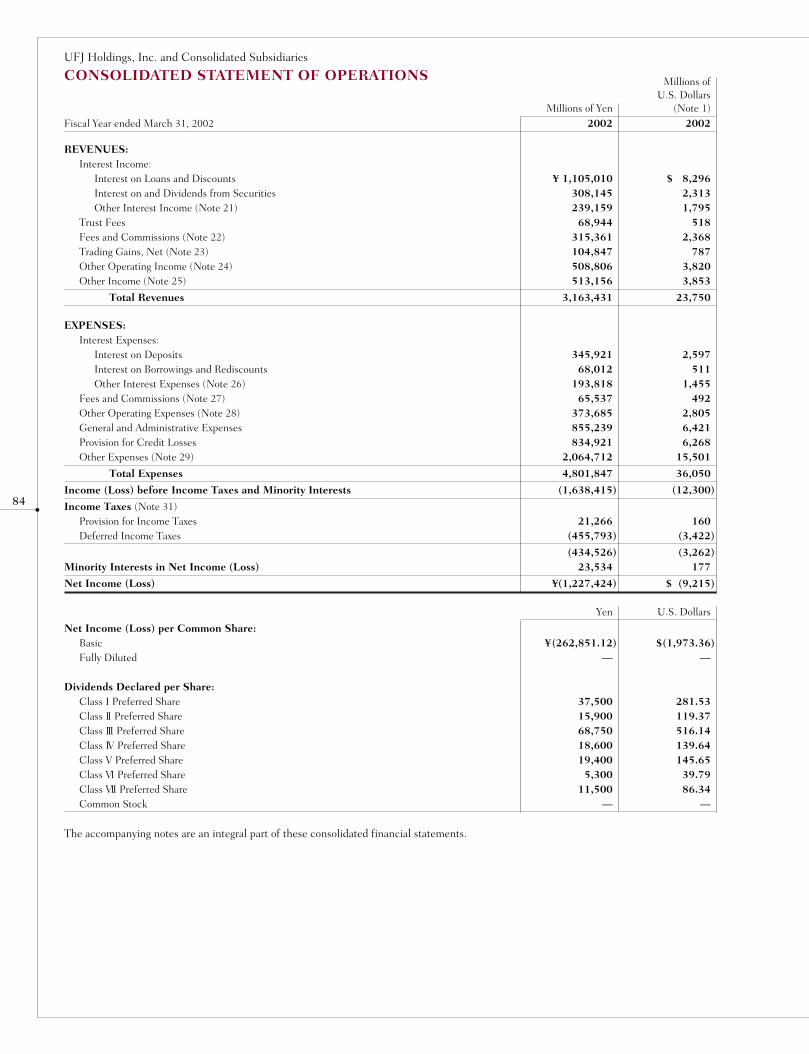
84
Millions ofU.S. Dollars
Millions of Yen (Note 1)Fiscal Year ended March 31, 2002 2002 2002
REVENUES:Interest Income:
Interest on Loans and Discounts ¥ 1,105,010 $ 8,296Interest on and Dividends from Securities 308,145 2,313Other Interest Income (Note 21) 239,159 1,795
Trust Fees 68,944 518Fees and Commissions (Note 22) 315,361 2,368Trading Gains, Net (Note 23) 104,847 787Other Operating Income (Note 24) 508,806 3,820Other Income (Note 25) 513,156 3,853
Total Revenues 3,163,431 23,750
EXPENSES:Interest Expenses:
Interest on Deposits 345,921 2,597 Interest on Borrowings and Rediscounts 68,012 511Other Interest Expenses (Note 26) 193,818 1,455
Fees and Commissions (Note 27) 65,537 492Other Operating Expenses (Note 28) 373,685 2,805General and Administrative Expenses 855,239 6,421Provision for Credit Losses 834,921 6,268Other Expenses (Note 29) 2,064,712 15,501
Total Expenses 4,801,847 36,050
Income (Loss) before Income Taxes and Minority Interests (1,638,415) (12,300)
Income Taxes (Note 31)Provision for Income Taxes 21,266 160Deferred Income Taxes (455,793) (3,422)
(434,526) (3,262)Minority Interests in Net Income (Loss) 23,534 177
Net Income (Loss) ¥(1,227,424) $ (9,215)
Yen U.S. Dollars
Net Income (Loss) per Common Share:Basic ¥(262,851.12) $(1,973.36)Fully Diluted — —
Dividends Declared per Share:Class I Preferred Share 37,500 281.53Class II Preferred Share 15,900 119.37Class III Preferred Share 68,750 516.14Class IV Preferred Share 18,600 139.64Class V Preferred Share 19,400 145.65Class VI Preferred Share 5,300 39.79Class VII Preferred Share 11,500 86.34Common Stock — —
UFJ Holdings, Inc. and Consolidated Subsidiaries
CONSOLIDATED STATEMENT OF OPERATIONS
The accompanying notes are an integral part of these consolidated financial statements.

85
Millions ofU.S. Dollars
Millions of Yen (Note 1)Fiscal Year ended March 31, 2002 2002 2002
Capital Stock:
Balance, at Beginning of the Fiscal Year ¥ 1,000,000 $ 7,507
Issuance — —
Balance, at End of the Fiscal Year ¥ 1,000,000 $ 7,507
Capital Surplus:
Balance, at Beginning of the Fiscal Year ¥ 2,483,709 $18,646
Merger Related Revaluation (217,082) (1,630)
Transfer to Retained Earnings (1,000,000) (7,507)
Balance, at End of the Fiscal Year ¥ 1,266,626 $ 9,509
Revaluation Reserve for Land, Net of Taxes:
Balance, at Beginning of the Fiscal Year ¥ 204,303 $ 1,534
Reversal of Revaluation Reserve for Land (72,875) (547)
Transfer to Deferred Tax Liabilities for Revaluation Reserve for Land (789) (6)
Balance, at End of the Fiscal Year ¥ 130,638 $ 981
Retained Earnings:
Balance, at Beginning of the Fiscal Year ¥ 417,025 $ 3,131
Transfer from Capital Surplus 1,000,000 7,507
Reversal of Revaluation Reserve for Land 72,875 547
Net Loss (1,227,424) (9,215)
Cash Dividends (8,246) (61)
Bonuses to Directors (5) (0)
Balance, at End of the Fiscal Year ¥ 254,225 $ 1,909
Net Unrealized Gain (Loss) on Available-for-sale Securities, Net of Taxes:
Balance, at Beginning of the Fiscal Year ¥ — $ —
Change in Accounting Standard for Financial Instruments 60,110 451
Balance, at End of the Fiscal Year ¥ 60,110 $ 451
Foreign Currency Translation Adjustments:
Balance, at Beginning of the Fiscal Year ¥ — $ —
Net Change during the Fiscal Year (37,834) (284)
Balance, at End of the Fiscal Year ¥ (37,834) $ (284)
Treasury Stock:
Balance, at Beginning of the Fiscal Year ¥ — $ —
Acquire of Treasury Stock (6,882) (52)
Sales of Treasury Stock 6,674 50
Balance, at End of the Fiscal Year ¥ (208) $ (2)
Parent Company Stock Held by Subsidiaries:
Balance, at Beginning of the Fiscal Year ¥ (157,587) $ (1,183)
Sales of Parent Company Stock 84,807 637
Balance, at End of the Fiscal Year ¥ (72,779) $ (546)
UFJ Holdings, Inc. and Consolidated Subsidiaries
CONSOLIDATED STATEMENT OF CHANGES IN STOCKHOLDERS’ EQUITY
The accompanying notes are an integral part of these consolidated financial statements.

86
Millions ofU.S. Dollars
Millions of Yen (Notes 1)Fiscal Year ended March 31, 2002 2002 2002
CASH FLOWS FROM OPERATING ACTIVITIES:
Income (Loss) before Income Taxes and Minority Interests ¥(1,638,415) $(12,300)
Depreciation 36,881 277
Amortization of Goodwill 4,018 30
Equity in Earnings of Affiliates 18,893 142
Increase in Reserve for Credit Losses 348,911 2,619
(Decrease) in Reserve for Losses on Securities (2,859) (21)
(Decrease) in Reserve for Contingent Liabilities Related to Loans Sold (67,870) (510)
Increase in Reserve for Losses on Supports of Specific Borrowers 579,157 4,348
Increase in Reserve for Retirement Benefits 84,214 632
Increase in Reserve for Employee Bonus 2,740 21
Interest Income (1,652,315) (12,405)
Interest Expenses 607,751 4,563
Net Loss on Securities 134,618 1,011
Net (Gain) on Money Held in Trust (477) (4)
Net (Gain) on Foreign Currency Translation (197,505) (1,483)
Net Loss on Sales of Premises and Equipment 45,539 342
(Gain) from Contribution of Securities to Employee Retirement Benefit Trust (50,527) (379)
Net Decrease in Trading Assets 1,707,746 12,821
Net (Decrease) in Trading Liabilities (424,210) (3,185)
Net Decrease in Loans and Bills Discounted 7,193,312 54,004
Net (Decrease) in Deposits (3,496,130) (26,247)
Net (Decrease) in Negotiable Certificates of Deposit (3,434,516) (25,785)
Net (Decrease) in Borrowed Money (Non-Subordinated) (327,183) (2,456)
Net Decrease in Due from Banks other than Due from Central Banks 2,642,773 19,841
Net (Increase) in Call Loans and Monetary Receivables Bought (557,760) (4,187)
Net (Increase) in Collateral Deposits on Securities Borrowed (152,345) (1,144)
Net (Decrease) in Call Money and Other Funding Related to Operating Activities (2,649,806) (19,893)
Net (Decrease) in Commercial Paper (257,448) (1,933)
Net (Decrease) in Collateral Deposits on Securities Loaned (2,111,371) (15,851)
Net Decrease in Foreign Exchange Assets 78,387 588
Net Increase in Foreign Exchange Liabilities 31,233 234
Net Increase in Corporate Bonds and Notes (Non-Subordinated)
from Issuance, Redemption and Repurchase 661,810 4,969
Net (Decrease) in Borrowed Money from Trust Account (1,097,385) (8,239)
Interest Received 1,890,309 14,191
Interest Paid (715,095) (5,369)
Other, Net (118,958) (893)
Subtotal (2,883,885) (21,651)
Income Taxes Paid (29,317) (220)
Net Cash Used in Operating Activities (2,913,202) (21,871)
UFJ Holdings, Inc. and Consolidated Subsidiaries
CONSOLIDATED STATEMENT OF CASH FLOWS

87
Millions ofU.S. Dollars
Millions of Yen (Notes 1)Fiscal Year ended March 31, 2002 2002 2002
CASH FLOWS FROM INVESTING ACTIVITIES:
Purchases of Securities ¥(41,899,542) $(314,561)
Proceeds from Sales of Securities 30,910,908 232,064
Proceeds from Maturities of Securities 16,183,009 121,494
Increase in Money Held in Trust (86,784) (652)
Decrease in Money Held in Trust 132,833 997
Purchases of Premises and Equipment (101,535) (762)
Proceeds from Sales of Premises and Equipment 147,440 1,107
Proceeds from Sales of Consolidated Subsidiaries 250,298 1,879
Other, Net (188) (1)
Net Cash Provided by Investing Activities 5,536,440 41,565
CASH FLOWS FROM FINANCING ACTIVITIES:
Proceeds from Issuance of Subordinated Debts 162,000 1,216
Repayment of Subordinated Debts (237,500) (1,783)
Proceeds from Issuance of Subordinated Bonds and Notes 637,331 4,785
Redemption and Repurchase of Subordinated Bonds and Notes (606,304) (4,552)
Proceeds from Issuance of Capital Stocks to Minority Interests 219,845 1,651
Dividends Paid (8,246) (62)
Dividends Paid to Minority Interests (7,811) (59)
Acquisition of Treasury Stock (6,882) (52)
Proceeds from Sales of Treasury Stock 6,564 49
Proceeds from Sales of Parent Company’s Stock Held by Consolidated Subsidiaries 86,265 648
Net Cash Provided by Financing Activities 245,261 1,841
Effect of Exchange Rate Changes on Cash and Cash Equivalents 11,763 88
Net Increase in Cash and Cash Equivalents 2,880,262 21,623
Cash and Cash Equivalents at Beginning of the Fiscal Year 1,497,781 11,245
Decrease in Cash and Cash Equivalents Due to Exclusion of Consolidated Subsidiaries (1) (0)
Cash and Cash Equivalents at End of the Fiscal Year ¥ 4,378,042 $ 32,868
The accompanying notes are an integral part of these consolidated financial statements.
88
UFJ Holdings, Inc. and Consolidated Subsidiaries
NOTES TO THE CONSOLIDATED FINANCIAL STATEMENTS
1. BASIS OF PRESENTATION
The accompanying consolidated financial statements include the
accounts of UFJ Holdings, Inc. (“UFJ Holdings”) and its consolidated
subsidiaries (together the “UFJ Group”) after the elimination of all
material intercompany transactions. These statements have been
prepared in conformity with accounting principles and practices
generally accepted in Japan, including the statements and guide-
lines issued by the Accounting Standards Board of Japan and the
Business Accounting Council, Financial Statements Regulation and
Consolidated Financial Statements Regulation issued by the
Cabinet Office, and industry practices for banks in Japan.
On April 2, 2001, UFJ Holdings was established by The Sanwa
Bank, Limited (“Sanwa Bank”), The Tokai Bank, Limited (“Tokai
Bank”) and The Toyo Trust and Banking Company, Limited (“Toyo
Trust”) (collectively, the “Subsidiary Banks”) through concurrent
share transfers (kabushiki-iten), and became the holding company
for the Subsidiary Banks.
Accounting principles and practices generally accepted in Japan
are different from International Accounting Standards in certain
respects as to application and disclosure requirements. Accordingly,
the accompanying consolidated financial statements are not intended
to present the consolidated financial position, results of operations
and cash flows in accordance with accounting principles and practices
generally accepted in countries and jurisdictions other than Japan.
The accompanying consolidated balance sheet, the related con-
solidated statement of operations and cash flows have been compiled
from the consolidated financial statements, which were filed with the
Financial Services Agency as required by the Securities and Exchange
Law of Japan. The consolidated statement of changes in stockholders’
equity is not required as a part of the basic financial statements in
Japan and is prepared solely for the benefit of readers outside Japan.
For the convenience of readers outside Japan, certain items
presented in the consolidated financial statements filed with the
Financial Services Agency have been reclassified. Furthermore,
certain Japanese yen balances are converted into U.S. dollars at
¥133.20 to $1, the effective exchange rate prevailing as of March
31, 2002. This conversion, however, should not be construed as
implying that the Japanese yen amounts have been, or could have
been, translated, realized, or settled in U.S. dollars at that or any
other exchange rate.
The amounts in Japanese yen are presented in millions of yen by
rounding down figures. Accordingly, the sum of each amount appearing
in the accompanying consolidated financial statements and the notes
thereto may not be equal to the sum of the individual account balances.
2. SUMMARY OF SIGNIFICANT ACCOUNTING POLICIES
(a) Accounting for Share Transfer
Currently, there are two accounting standards and practices in
Japan related to business combinations; accounting standards related
to consolidation and accounting practices related to mergers.
The share transfer by the Subsidiary Banks in connection with
the formation of UFJ Holdings on April 2, 2001 was, in substance,
similar to a merger utilizing a holding company because Sanwa Bank
and Tokai Bank would be merged to create UFJ Bank Limited
(“UFJ Bank”), and the banking business of Toyo Trust would be
combined with UFJ Bank under the common control of UFJ
Holdings. Furthermore, the share transfer by the Subsidiary Banks
was legally deemed to be a quasi-merger under the Japanese
Commercial Code.
Based on the legal aspects and the substance of the transaction,
the share transfer by the Subsidiary Banks in connection with the
formation of UFJ Holdings was similar to a merger, and was
accounted for under the accounting practices related to mergers. As
such, the consolidated financial statements of the Subsidiary Banks
have been combined at respective book value on the consummation
of the share transfer.
(b) Consolidation
(i) Scope of consolidation
The scope of consolidation is determined based on UFJ Holdings’
control and influence over the decision-making body of investees as
well as its voting shares as described below:
Subsidiaries
Subsidiaries are, in general, companies in which UFJ Holdings holds
(1) directly and/or indirectly, more than 50% of the voting shares, or
(2) directly and/or indirectly, 40% or more of the voting shares and has
effective control over the decision making body responsible for the
business policies and financial and operating matters through person-
nel, finance, and other relationships, unless evidence to the contrary
exists which shows that UFJ Holdings does not have such control.
The number of subsidiaries as of March 31, 2002 was 215, of
which 120 subsidiaries were consolidated, and 95 were not consoli-
dated and accounted for at cost.
All 95 non-consolidated subsidiaries were not consolidated
based on Article 5 Paragraph 1 Item 2 of the Consolidated Financial
Statements Regulation. Such subsidiaries are special purpose com-
panies organized solely for entering into lease transactions, and their
assets and profits/losses substantially belonged to the investors who
invested in the leased assets.
89
Major consolidated subsidiaries were:
UFJ Bank (Japan)
UFJ Trust Bank Limited (“UFJ Trust”) (Japan)
UFJ Partners Asset Management Co., Ltd. (Japan)
The Senshu Bank, Ltd. (Japan)
UFJ Capital Markets Securities Co., Ltd. (Japan)
UFJ International plc (United Kingdom)
On January 15, 2002, Tokai Bank merged with and into
Sanwa Bank and, on the consummation of the merger,
Sanwa Bank changed its name to UFJ Bank Limited. On
the same date, Toyo Trust changed its name to UFJ Trust
Bank Limited.
In addition, on June 1, 2002, UFJ Capital Markets
Securities Co., Ltd. merged with and into TSUBASA
Securities Co., Ltd. and, on the consummation of the
merger, TSUBASA Securities Co., Ltd. changed its name to
UFJ Tsubasa Securities Co., Ltd.
Affiliates
Affiliates are companies other than subsidiaries in which UFJ
Holdings holds (1) directly and/or indirectly, 20% or more of the
voting shares, or (2) directly and/or indirectly, 15% or more of voting
shares and is able to influence to a significant degree decision making
through personnel, finance, and other relationships, unless evidence
to the contrary exists which shows that UFJ Holdings does not have
such influence.
As of March 31, 2002, the number of affiliates was 29, of which
23 affiliates were accounted for under the equity method, and 6 non-
material affiliates were carried at cost, less amounts written off, if any.
Major affiliates accounted for under the equity method were:
TSUBASA Securities Co., Ltd. (Japan)
The Chukyo Bank, Limited. (Japan)
Dah Sing Financial Holdings Limited (Hong Kong)
As of March 31, 2002, investments in non-consolidated sub-
sidiaries and affiliates not accounted for under the equity method
were ¥1,251 million ($9 million). These investments are included in
“Securities” and “Other Assets” in the accompanying consolidated
balance sheet.
The number of subsidiaries and affiliates as of March 31, 2002
was as follows:2002
Consolidated subsidiaries 120
Non-consolidated subsidiaries 95
Affiliates (accounted for under the equity method) 23
Affiliates (not accounted for under the equity method) 6
(ii) Balance Sheet Date of Subsidiaries
The accompanying consolidated financial statements include the
accounts of consolidated subsidiaries, some of which have fiscal
year ends other than March 31. The fiscal year ends of such sub-
sidiaries are principally December 31, and the accounts of these
subsidiaries have been included after making appropriate adjust-
ments for any material transactions during the period between
January 1 and March 31.
(iii) Goodwill
Goodwill associated with the acquisition of The Senshu Bank, Ltd.
is amortized over 5 years, and other goodwill is charged generally to the
consolidated statement of operations in the fiscal year of acquisition.
(iv) Translation of financial statements of overseas subsidiaries
Financial statements of overseas subsidiaries denominated in
foreign currencies are generally translated into Japanese yen using
the exchange rate prevailing at each subsidiary’s balance sheet date,
except for items in “Stockholders’ Equity” which are translated at
historical rates. The resulting differences are recorded in foreign
currency translation adjustments accounts in “Minority Interests”
and “Stockholders’ Equity.”
(c) Foreign Currency Translation and Revaluation
UFJ Holdings’ consolidated domestic banking subsidiaries maintain
their accounting records in Japanese yen. Assets and liabilities
denominated in foreign currencies are translated into Japanese yen
using the exchange rates prevailing at each balance sheet date,
except for certain accounts translated at historical rates.
In accordance with the Japanese Institute of Certified Public
Accountants (“JICPA”) Industry Audit Committee Report No. 20,
the deferral method or fair value method of hedge accounting may
be used on investments in affiliates and Available-for-sale Securities
denominated in foreign currencies (other than debt securities). To
qualify for hedge accounting, investments in affiliates and Available-
for-sale Securities must be designated as hedged items at inception,
and spot or forward exchange rate exposure of the liabilities be suffi-
cient to offset the acquisition cost of the securities denominated in
foreign currencies.
For funding related swap transactions, the principal equivalent
of lending and borrowing are translated into Japanese yen using the
exchange rates at the balance sheet date, and the net amount is
recognized on the balance sheet. Differences between spot and for-
ward exchange rates in the funding related swap transactions are
recorded as interest income or expense on an accrual basis over the
period from the settlement date of spot foreign exchange contract to
the settlement date of forward foreign exchange contract.
The funding related swap transaction consists of a spot foreign
exchange contract and a forward foreign exchange contract. Such
contracts are originated for the purpose of hedging the foreign
exchange risk of funding transactions in different currencies. The
principal amounts of lending and borrowing are equal to the
amounts of foreign exchange contracts bought or sold as spot
transactions. The amount of future payments for and proceeds from
borrowing and lending with contractual interest payments or
receipts denominated in foreign currencies are equal to the amount
of foreign exchange contracts bought or sold as forward transactions.
90
UFJ Holdings’ consolidated domestic banking subsidiary utilizes
currency swap transactions originated for the purpose of hedging
foreign exchange risk on borrowing or lending in different currencies.
If the amounts payable or receivable at the maturity date are equal
to amounts receivable or payable at the contract date, and the rates
applied to principal and interest are reasonable, the principal equiv-
alent of assets and liabilities are translated into Japanese yen using
the exchange rates at the balance sheet date, and the net amount is
recognized on the balance sheet. Differences between spot and for-
ward rates in the currency swap transactions are amortized over the
life of the swap contract, and recorded as interest income or
expense on an accrual basis.
(d) Cash and Cash Equivalents
For the purpose of preparing consolidated statement of cash flows,
“Cash and Cash Equivalents” consist of cash and due from central
banks included in “Cash and Due from Banks” in the consolidated
balance sheet.
A reconciliation between “Cash and Cash Equivalents” and
“Cash and Due from Banks” is as follows:
Millions of Millions ofYen U.S. Dollars
2002 2002
Cash and Due from Banks ¥ 6,404,825 $ 48,084
Less: Due from Banks other
than Central Banks (2,026,783) (15,216)
Cash and Cash Equivalents ¥ 4,378,042 $ 32,868
(e) Transactions for Trading Purposes
Transactions for trading purposes are those seeking to capture gains
arising from short-term market movements or from the differences
between markets, interest rates or currency exchange rates. Such
transactions are reported as “Trading assets” and “Trading liabilities”
in the consolidated balance sheet on a trade date basis. Gains and
losses on the transactions for trading purposes are shown as
“Trading Gains, Net” or “Trading Losses, Net” in the consolidated
statement of operations on a trade date basis.
Trading account securities, monetary receivables and other
financial instruments held for trading purposes are stated at market
value at the fiscal year end. Trading-related financial derivatives
such as swaps, futures and options are valued on the assumption
that they were settled at the fiscal year end.
In the case of securities, monetary receivables and other finan-
cial instruments held for trading purposes, “Trading Gains, Net” and
“Trading Losses, Net” include interest received and paid, and valua-
tion gains and losses during the fiscal year. For trading-related
financial derivatives, “Trading Gains, Net” and “Trading Losses,
Net” include interest received and paid and valuation gains and
losses based on the assumption that transactions were settled at the
fiscal year end.
Transactions entered into by consolidated subsidiaries for trading
purposes are accounted for principally in a similar manner as
described above.
(f) Financial Instruments
(i) Securities
Securities other than those classified as trading securities and equity
securities of affiliates accounted for under the equity method are
classified into three categories: “Held-to-maturity Debt Securities,”
“Investments in Non-consolidated Subsidiaries and Affiliates that
are not accounted for under the equity method,” and “Available-for-sale
Securities,” as defined in the Accounting Standard for Financial
Instruments issued by the Business Accounting Council.
Held-to-maturity Debt Securities are carried at amortized cost,
using the moving-average method. Investments in non-consolidated
subsidiaries and affiliates that are not accounted for under the equity
method are carried at moving average cost, less any amounts written-
off. Available-for-sale Securities with market quotations are carried
at market value and the net unrealized gains and losses are reported
as Net Unrealized Gain (Loss) on Available-for-sale Securities, Net
of Taxes on the consolidated balance sheet. Available-for-sale Securities
without market quotations are stated at moving average cost or
amortized cost. Securities included in money held in trust primarily
for the purpose of investing in securities are carried at market value.
(ii) Derivative Financial Instruments and Hedge Accounting
Derivative financial instruments are carried at market value, with
changes in market value included in the statement of operations of
the period in which they arise, except for derivatives that are desig-
nated as hedging instruments and qualify for hedge accounting.
UFJ Holdings’ consolidated domestic banking subsidiaries utilize
a macro hedging strategy, using derivatives to manage the overall interest
rate risk arising from various financial assets and liabilities, such as
loans and deposits. The macro hedging strategy is a risk management
method described in the “Temporary Treatment for Accounting and
Auditing of Application of Accounting Standard for Financial Instru-
ments in Banking Industry” (JICPA Industry Audit Committee Report
No. 15) as “the Risk Adjusted Approach” under which the deferral
method of hedge accounting is used. Hedge effectiveness is assessed
by monitoring: (1) that the total market risk amount on derivative
instruments used for hedging purposes is within the established risk
limit as set out in the risk management policies, and (2) that total
interest rate risk amount from hedged items has been mitigated.
For certain other assets and liabilities, UFJ Holdings’ consoli-
dated domestic banking subsidiaries apply the deferral method of
hedge accounting or an accrual method specifically allowed for
certain interest swaps under the Accounting Standards for
Financial Instruments. Under the deferral method of hedge
accounting, the recognition of income or expense arising from a
hedging instrument is deferred until expense or income arising from
the hedged item is recognized.
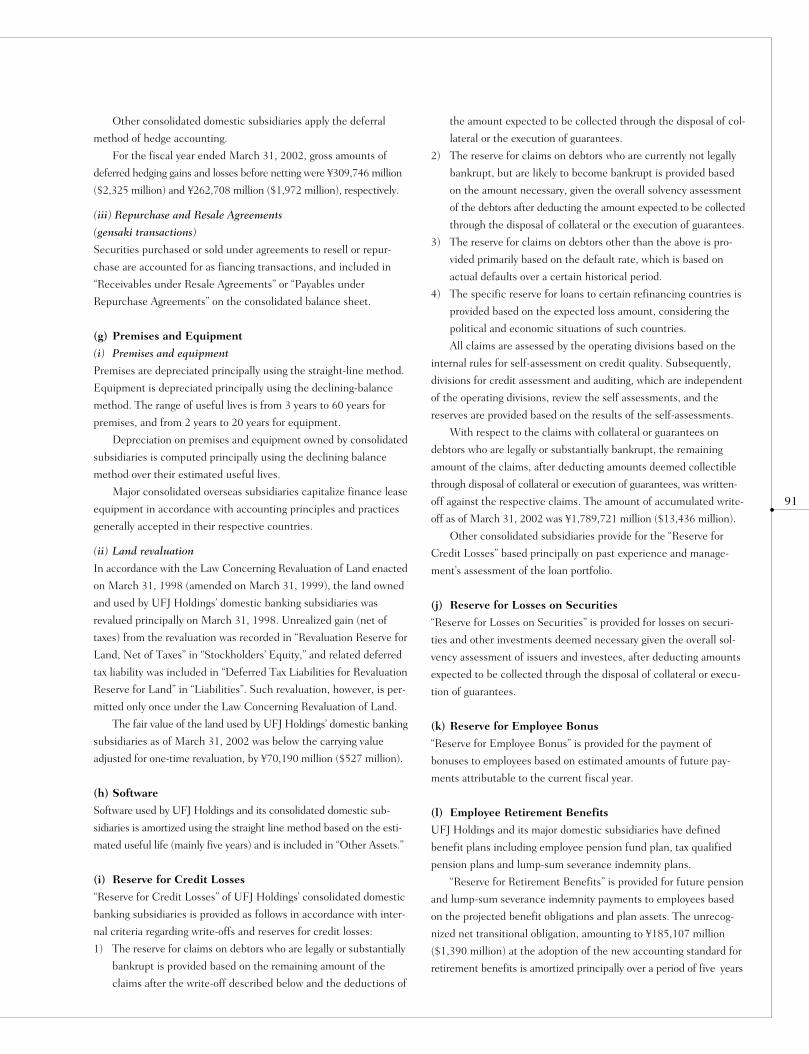
91
Other consolidated domestic subsidiaries apply the deferral
method of hedge accounting.
For the fiscal year ended March 31, 2002, gross amounts of
deferred hedging gains and losses before netting were ¥309,746 million
($2,325 million) and ¥262,708 million ($1,972 million), respectively.
(iii) Repurchase and Resale Agreements
(gensaki transactions)
Securities purchased or sold under agreements to resell or repur-
chase are accounted for as fiancing transactions, and included in
“Receivables under Resale Agreements” or “Payables under
Repurchase Agreements” on the consolidated balance sheet.
(g) Premises and Equipment
(i) Premises and equipment
Premises are depreciated principally using the straight-line method.
Equipment is depreciated principally using the declining-balance
method. The range of useful lives is from 3 years to 60 years for
premises, and from 2 years to 20 years for equipment.
Depreciation on premises and equipment owned by consolidated
subsidiaries is computed principally using the declining balance
method over their estimated useful lives.
Major consolidated overseas subsidiaries capitalize finance lease
equipment in accordance with accounting principles and practices
generally accepted in their respective countries.
(ii) Land revaluation
In accordance with the Law Concerning Revaluation of Land enacted
on March 31, 1998 (amended on March 31, 1999), the land owned
and used by UFJ Holdings’ domestic banking subsidiaries was
revalued principally on March 31, 1998. Unrealized gain (net of
taxes) from the revaluation was recorded in “Revaluation Reserve for
Land, Net of Taxes” in “Stockholders’ Equity,” and related deferred
tax liability was included in “Deferred Tax Liabilities for Revaluation
Reserve for Land” in “Liabilities”. Such revaluation, however, is per-
mitted only once under the Law Concerning Revaluation of Land.
The fair value of the land used by UFJ Holdings’ domestic banking
subsidiaries as of March 31, 2002 was below the carrying value
adjusted for one-time revaluation, by ¥70,190 million ($527 million).
(h) Software
Software used by UFJ Holdings and its consolidated domestic sub-
sidiaries is amortized using the straight line method based on the esti-
mated useful life (mainly five years) and is included in “Other Assets.”
(i) Reserve for Credit Losses
“Reserve for Credit Losses” of UFJ Holdings’ consolidated domestic
banking subsidiaries is provided as follows in accordance with inter-
nal criteria regarding write-offs and reserves for credit losses:
1) The reserve for claims on debtors who are legally or substantially
bankrupt is provided based on the remaining amount of the
claims after the write-off described below and the deductions of
the amount expected to be collected through the disposal of col-
lateral or the execution of guarantees.
2) The reserve for claims on debtors who are currently not legally
bankrupt, but are likely to become bankrupt is provided based
on the amount necessary, given the overall solvency assessment
of the debtors after deducting the amount expected to be collected
through the disposal of collateral or the execution of guarantees.
3) The reserve for claims on debtors other than the above is pro-
vided primarily based on the default rate, which is based on
actual defaults over a certain historical period.
4) The specific reserve for loans to certain refinancing countries is
provided based on the expected loss amount, considering the
political and economic situations of such countries.
All claims are assessed by the operating divisions based on the
internal rules for self-assessment on credit quality. Subsequently,
divisions for credit assessment and auditing, which are independent
of the operating divisions, review the self assessments, and the
reserves are provided based on the results of the self-assessments.
With respect to the claims with collateral or guarantees on
debtors who are legally or substantially bankrupt, the remaining
amount of the claims, after deducting amounts deemed collectible
through disposal of collateral or execution of guarantees, was written-
off against the respective claims. The amount of accumulated write-
off as of March 31, 2002 was ¥1,789,721 million ($13,436 million).
Other consolidated subsidiaries provide for the “Reserve for
Credit Losses” based principally on past experience and manage-
ment’s assessment of the loan portfolio.
(j) Reserve for Losses on Securities
“Reserve for Losses on Securities” is provided for losses on securi-
ties and other investments deemed necessary given the overall sol-
vency assessment of issuers and investees, after deducting amounts
expected to be collected through the disposal of collateral or execu-
tion of guarantees.
(k) Reserve for Employee Bonus
“Reserve for Employee Bonus” is provided for the payment of
bonuses to employees based on estimated amounts of future pay-
ments attributable to the current fiscal year.
(l) Employee Retirement Benefits
UFJ Holdings and its major domestic subsidiaries have defined
benefit plans including employee pension fund plan, tax qualified
pension plans and lump-sum severance indemnity plans.
“Reserve for Retirement Benefits” is provided for future pension
and lump-sum severance indemnity payments to employees based
on the projected benefit obligations and plan assets. The unrecog-
nized net transitional obligation, amounting to ¥185,107 million
($1,390 million) at the adoption of the new accounting standard for
retirement benefits is amortized principally over a period of five years
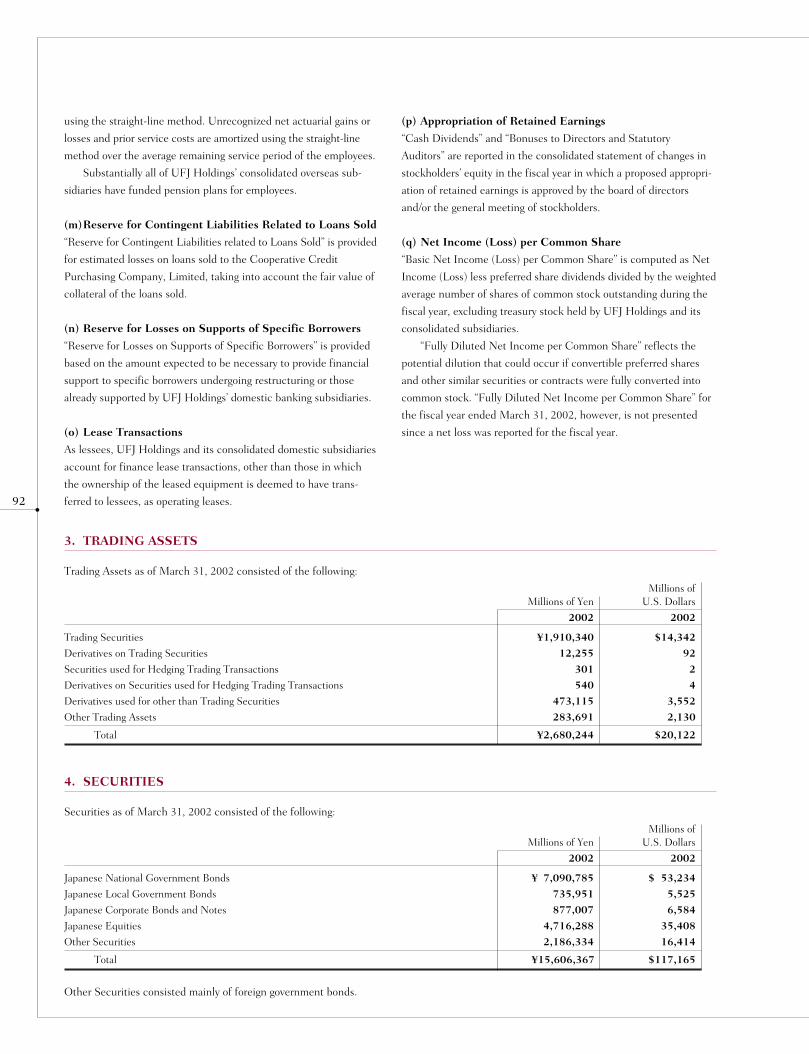
92
using the straight-line method. Unrecognized net actuarial gains or
losses and prior service costs are amortized using the straight-line
method over the average remaining service period of the employees.
Substantially all of UFJ Holdings’ consolidated overseas sub-
sidiaries have funded pension plans for employees.
(m)Reserve for Contingent Liabilities Related to Loans Sold
“Reserve for Contingent Liabilities related to Loans Sold” is provided
for estimated losses on loans sold to the Cooperative Credit
Purchasing Company, Limited, taking into account the fair value of
collateral of the loans sold.
(n) Reserve for Losses on Supports of Specific Borrowers
“Reserve for Losses on Supports of Specific Borrowers” is provided
based on the amount expected to be necessary to provide financial
support to specific borrowers undergoing restructuring or those
already supported by UFJ Holdings’ domestic banking subsidiaries.
(o) Lease Transactions
As lessees, UFJ Holdings and its consolidated domestic subsidiaries
account for finance lease transactions, other than those in which
the ownership of the leased equipment is deemed to have trans-
ferred to lessees, as operating leases.
(p) Appropriation of Retained Earnings
“Cash Dividends” and “Bonuses to Directors and Statutory
Auditors” are reported in the consolidated statement of changes in
stockholders’ equity in the fiscal year in which a proposed appropri-
ation of retained earnings is approved by the board of directors
and/or the general meeting of stockholders.
(q) Net Income (Loss) per Common Share
“Basic Net Income (Loss) per Common Share” is computed as Net
Income (Loss) less preferred share dividends divided by the weighted
average number of shares of common stock outstanding during the
fiscal year, excluding treasury stock held by UFJ Holdings and its
consolidated subsidiaries.
“Fully Diluted Net Income per Common Share” reflects the
potential dilution that could occur if convertible preferred shares
and other similar securities or contracts were fully converted into
common stock. “Fully Diluted Net Income per Common Share” for
the fiscal year ended March 31, 2002, however, is not presented
since a net loss was reported for the fiscal year.
3. TRADING ASSETS
Trading Assets as of March 31, 2002 consisted of the following:
Millions ofMillions of Yen U.S. Dollars
2002 2002
Trading Securities ¥1,910,340 $14,342
Derivatives on Trading Securities 12,255 92
Securities used for Hedging Trading Transactions 301 2
Derivatives on Securities used for Hedging Trading Transactions 540 4
Derivatives used for other than Trading Securities 473,115 3,552
Other Trading Assets 283,691 2,130
Total ¥2,680,244 $20,122
4. SECURITIES
Securities as of March 31, 2002 consisted of the following:
Millions ofMillions of Yen U.S. Dollars
2002 2002
Japanese National Government Bonds ¥ 7,090,785 $ 53,234
Japanese Local Government Bonds 735,951 5,525
Japanese Corporate Bonds and Notes 877,007 6,584
Japanese Equities 4,716,288 35,408
Other Securities 2,186,334 16,414
Total ¥15,606,367 $117,165
Other Securities consisted mainly of foreign government bonds.
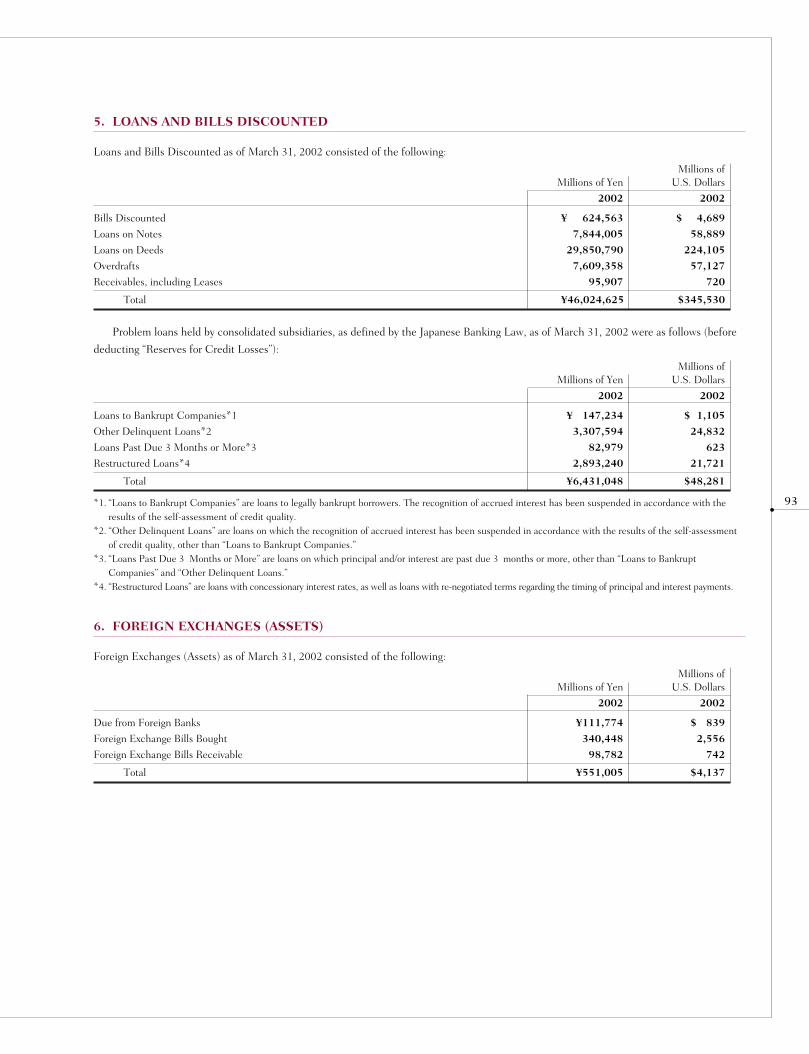
93
5. LOANS AND BILLS DISCOUNTED
Loans and Bills Discounted as of March 31, 2002 consisted of the following:
Millions ofMillions of Yen U.S. Dollars
2002 2002
Bills Discounted ¥ 624,563 $ 4,689
Loans on Notes 7,844,005 58,889
Loans on Deeds 29,850,790 224,105
Overdrafts 7,609,358 57,127
Receivables, including Leases 95,907 720
Total ¥46,024,625 $345,530
Problem loans held by consolidated subsidiaries, as defined by the Japanese Banking Law, as of March 31, 2002 were as follows (before
deducting “Reserves for Credit Losses”):
Millions ofMillions of Yen U.S. Dollars
2002 2002
Loans to Bankrupt Companies*1 ¥ 147,234 $ 1,105
Other Delinquent Loans*2 3,307,594 24,832
Loans Past Due 3 Months or More*3 82,979 623
Restructured Loans*4 2,893,240 21,721
Total ¥6,431,048 $48,281
*1. “Loans to Bankrupt Companies” are loans to legally bankrupt borrowers. The recognition of accrued interest has been suspended in accordance with theresults of the self-assessment of credit quality.
*2. “Other Delinquent Loans” are loans on which the recognition of accrued interest has been suspended in accordance with the results of the self-assessmentof credit quality, other than “Loans to Bankrupt Companies.”
*3. “Loans Past Due 3 Months or More” are loans on which principal and/or interest are past due 3 months or more, other than “Loans to BankruptCompanies” and “Other Delinquent Loans.”
*4. “Restructured Loans” are loans with concessionary interest rates, as well as loans with re-negotiated terms regarding the timing of principal and interest payments.
6. FOREIGN EXCHANGES (ASSETS)
Foreign Exchanges (Assets) as of March 31, 2002 consisted of the following:
Millions ofMillions of Yen U.S. Dollars
2002 2002
Due from Foreign Banks ¥111,774 $ 839
Foreign Exchange Bills Bought 340,448 2,556
Foreign Exchange Bills Receivable 98,782 742
Total ¥551,005 $4,137
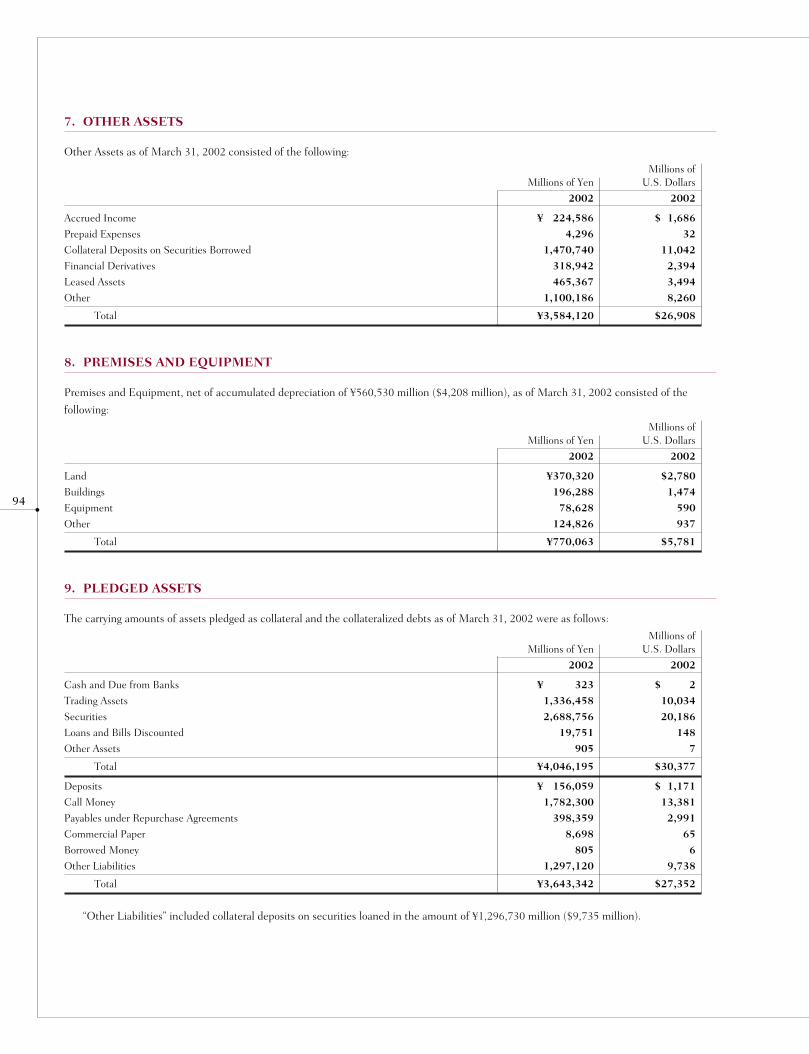
94
7. OTHER ASSETS
Other Assets as of March 31, 2002 consisted of the following:
Millions ofMillions of Yen U.S. Dollars
2002 2002
Accrued Income ¥ 224,586 $ 1,686
Prepaid Expenses 4,296 32
Collateral Deposits on Securities Borrowed 1,470,740 11,042
Financial Derivatives 318,942 2,394
Leased Assets 465,367 3,494
Other 1,100,186 8,260
Total ¥3,584,120 $26,908
8. PREMISES AND EQUIPMENT
Premises and Equipment, net of accumulated depreciation of ¥560,530 million ($4,208 million), as of March 31, 2002 consisted of the
following:
Millions ofMillions of Yen U.S. Dollars
2002 2002
Land ¥370,320 $2,780
Buildings 196,288 1,474
Equipment 78,628 590
Other 124,826 937
Total ¥770,063 $5,781
9. PLEDGED ASSETS
The carrying amounts of assets pledged as collateral and the collateralized debts as of March 31, 2002 were as follows:
Millions ofMillions of Yen U.S. Dollars
2002 2002
Cash and Due from Banks ¥ 323 $ 2
Trading Assets 1,336,458 10,034
Securities 2,688,756 20,186
Loans and Bills Discounted 19,751 148
Other Assets 905 7
Total ¥4,046,195 $30,377
Deposits ¥ 156,059 $ 1,171
Call Money 1,782,300 13,381
Payables under Repurchase Agreements 398,359 2,991
Commercial Paper 8,698 65
Borrowed Money 805 6
Other Liabilities 1,297,120 9,738
Total ¥3,643,342 $27,352
“Other Liabilities” included collateral deposits on securities loaned in the amount of ¥1,296,730 million ($9,735 million).
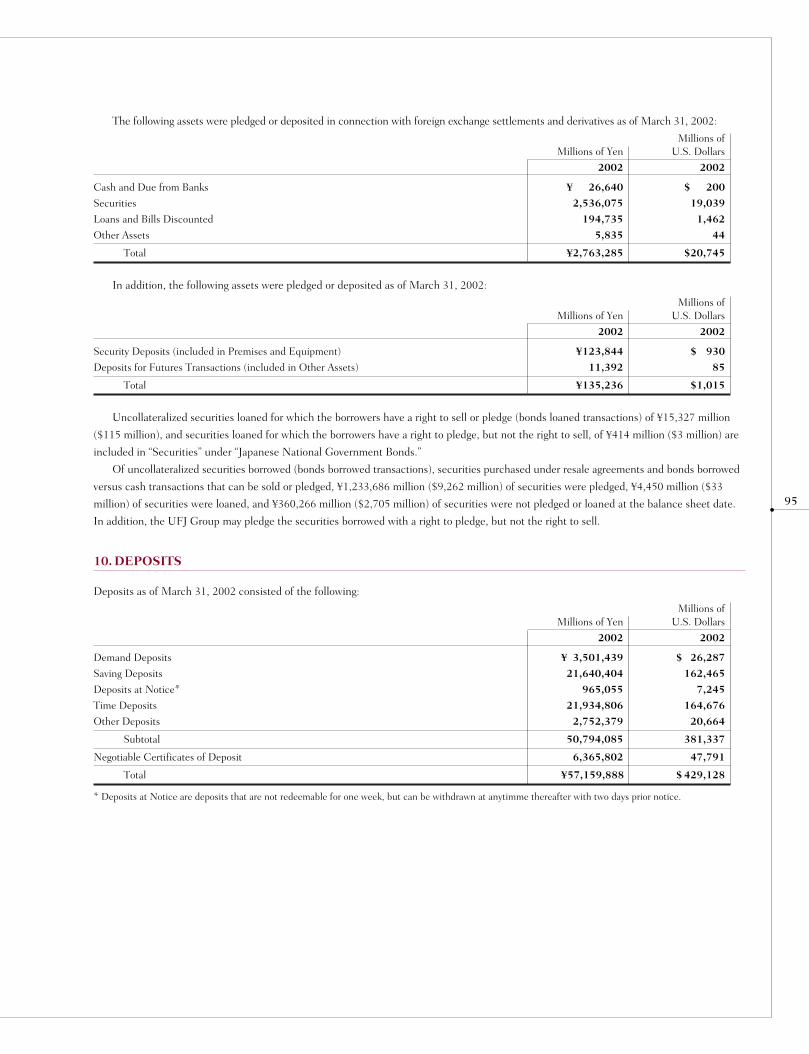
95
The following assets were pledged or deposited in connection with foreign exchange settlements and derivatives as of March 31, 2002:
Millions ofMillions of Yen U.S. Dollars
2002 2002
Cash and Due from Banks ¥ 26,640 $ 200
Securities 2,536,075 19,039
Loans and Bills Discounted 194,735 1,462
Other Assets 5,835 44
Total ¥2,763,285 $20,745
In addition, the following assets were pledged or deposited as of March 31, 2002:
Millions ofMillions of Yen U.S. Dollars
2002 2002
Security Deposits (included in Premises and Equipment) ¥123,844 $ 930
Deposits for Futures Transactions (included in Other Assets) 11,392 85
Total ¥135,236 $1,015
Uncollateralized securities loaned for which the borrowers have a right to sell or pledge (bonds loaned transactions) of ¥15,327 million
($115 million), and securities loaned for which the borrowers have a right to pledge, but not the right to sell, of ¥414 million ($3 million) are
included in “Securities” under “Japanese National Government Bonds.”
Of uncollateralized securities borrowed (bonds borrowed transactions), securities purchased under resale agreements and bonds borrowed
versus cash transactions that can be sold or pledged, ¥1,233,686 million ($9,262 million) of securities were pledged, ¥4,450 million ($33
million) of securities were loaned, and ¥360,266 million ($2,705 million) of securities were not pledged or loaned at the balance sheet date.
In addition, the UFJ Group may pledge the securities borrowed with a right to pledge, but not the right to sell.
10. DEPOSITS
Deposits as of March 31, 2002 consisted of the following:
Millions ofMillions of Yen U.S. Dollars
2002 2002
Demand Deposits ¥ 3,501,439 $ 26,287
Saving Deposits 21,640,404 162,465
Deposits at Notice* 965,055 7,245
Time Deposits 21,934,806 164,676
Other Deposits 2,752,379 20,664
Subtotal 50,794,085 381,337
Negotiable Certificates of Deposit 6,365,802 47,791
Total ¥57,159,888 $ 429,128
* Deposits at Notice are deposits that are not redeemable for one week, but can be withdrawn at anytimme thereafter with two days prior notice.
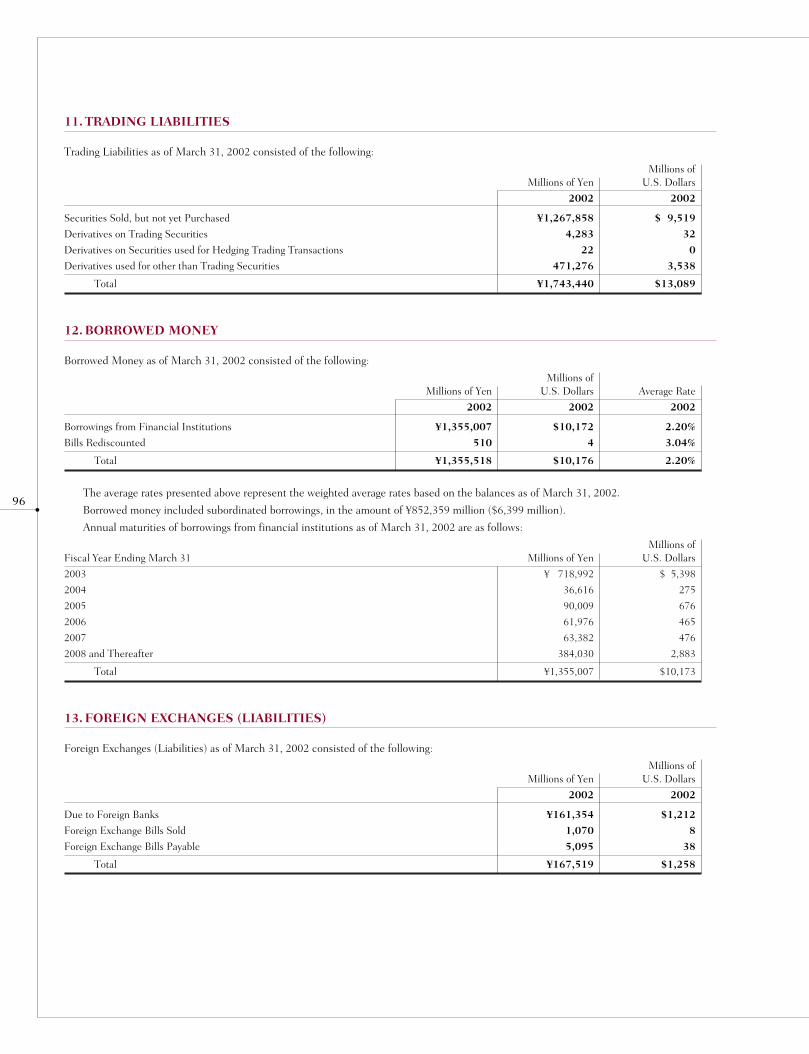
96
11. TRADING LIABILITIES
Trading Liabilities as of March 31, 2002 consisted of the following:
Millions ofMillions of Yen U.S. Dollars
2002 2002
Securities Sold, but not yet Purchased ¥1,267,858 $ 9,519
Derivatives on Trading Securities 4,283 32
Derivatives on Securities used for Hedging Trading Transactions 22 0
Derivatives used for other than Trading Securities 471,276 3,538
Total ¥1,743,440 $13,089
12. BORROWED MONEY
Borrowed Money as of March 31, 2002 consisted of the following:
Millions ofMillions of Yen U.S. Dollars Average Rate
2002 2002 2002
Borrowings from Financial Institutions ¥1,355,007 $10,172 2.20%
Bills Rediscounted 510 4 3.04%
Total ¥1,355,518 $10,176 2.20%
The average rates presented above represent the weighted average rates based on the balances as of March 31, 2002.
Borrowed money included subordinated borrowings, in the amount of ¥852,359 million ($6,399 million).
Annual maturities of borrowings from financial institutions as of March 31, 2002 are as follows:
Millions ofFiscal Year Ending March 31 Millions of Yen U.S. Dollars
2003 ¥ 718,992 $ 5,398
2004 36,616 275
2005 90,009 676
2006 61,976 465
2007 63,382 476
2008 and Thereafter 384,030 2,883
Total ¥1,355,007 $10,173
13. FOREIGN EXCHANGES (LIABILITIES)
Foreign Exchanges (Liabilities) as of March 31, 2002 consisted of the following:
Millions ofMillions of Yen U.S. Dollars
2002 2002
Due to Foreign Banks ¥161,354 $1,212
Foreign Exchange Bills Sold 1,070 8
Foreign Exchange Bills Payable 5,095 38
Total ¥167,519 $1,258
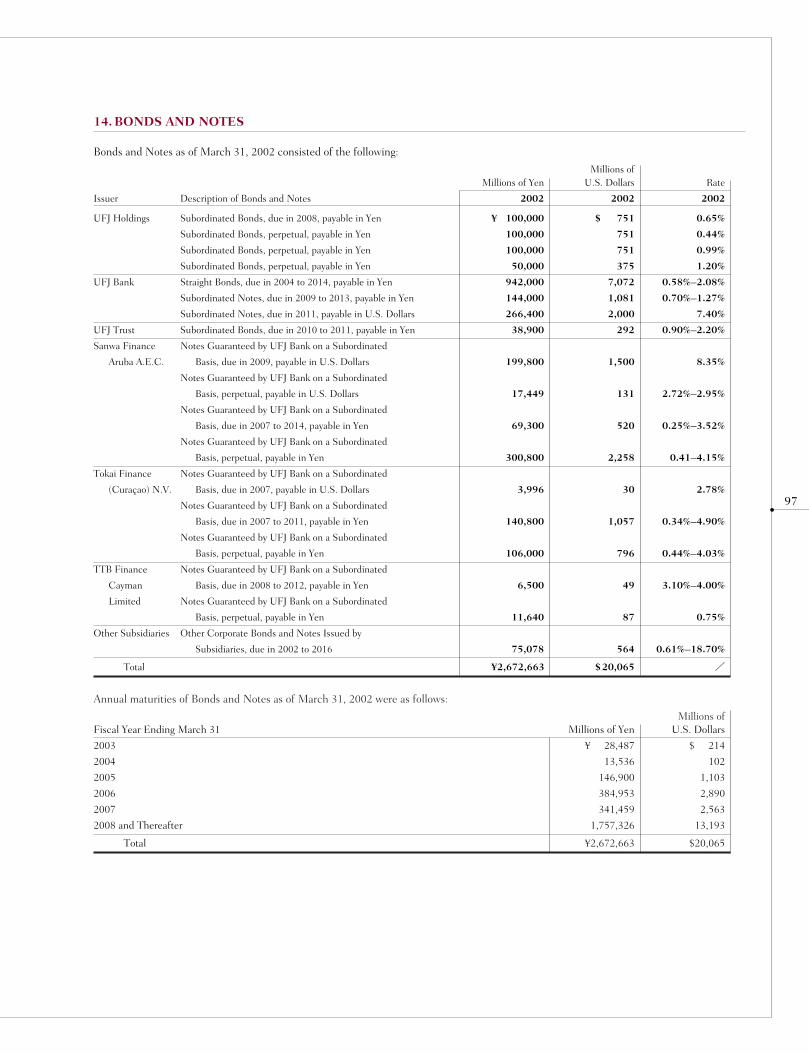
97
14. BONDS AND NOTES
Bonds and Notes as of March 31, 2002 consisted of the following:
Millions ofMillions of Yen U.S. Dollars Rate
Issuer Description of Bonds and Notes 2002 2002 2002
UFJ Holdings Subordinated Bonds, due in 2008, payable in Yen ¥ 100,000 $ 751 0.65%
Subordinated Bonds, perpetual, payable in Yen 100,000 751 0.44%
Subordinated Bonds, perpetual, payable in Yen 100,000 751 0.99%
Subordinated Bonds, perpetual, payable in Yen 50,000 375 1.20%
UFJ Bank Straight Bonds, due in 2004 to 2014, payable in Yen 942,000 7,072 0.58%–2.08%
Subordinated Notes, due in 2009 to 2013, payable in Yen 144,000 1,081 0.70%–1.27%
Subordinated Notes, due in 2011, payable in U.S. Dollars 266,400 2,000 7.40%
UFJ Trust Subordinated Bonds, due in 2010 to 2011, payable in Yen 38,900 292 0.90%–2.20%
Sanwa Finance Notes Guaranteed by UFJ Bank on a Subordinated
Aruba A.E.C. Basis, due in 2009, payable in U.S. Dollars 199,800 1,500 8.35%
Notes Guaranteed by UFJ Bank on a Subordinated
Basis, perpetual, payable in U.S. Dollars 17,449 131 2.72%–2.95%
Notes Guaranteed by UFJ Bank on a Subordinated
Basis, due in 2007 to 2014, payable in Yen 69,300 520 0.25%–3.52%
Notes Guaranteed by UFJ Bank on a Subordinated
Basis, perpetual, payable in Yen 300,800 2,258 0.41–4.15%
Tokai Finance Notes Guaranteed by UFJ Bank on a Subordinated
(Curaçao) N.V. Basis, due in 2007, payable in U.S. Dollars 3,996 30 2.78%
Notes Guaranteed by UFJ Bank on a Subordinated
Basis, due in 2007 to 2011, payable in Yen 140,800 1,057 0.34%–4.90%
Notes Guaranteed by UFJ Bank on a Subordinated
Basis, perpetual, payable in Yen 106,000 796 0.44%–4.03%
TTB Finance Notes Guaranteed by UFJ Bank on a Subordinated
Cayman Basis, due in 2008 to 2012, payable in Yen 6,500 49 3.10%–4.00%
Limited Notes Guaranteed by UFJ Bank on a Subordinated
Basis, perpetual, payable in Yen 11,640 87 0.75%
Other Subsidiaries Other Corporate Bonds and Notes Issued by
Subsidiaries, due in 2002 to 2016 75,078 564 0.61%–18.70%
Total ¥2,672,663 $20,065 /
Annual maturities of Bonds and Notes as of March 31, 2002 were as follows:
Millions ofFiscal Year Ending March 31 Millions of Yen U.S. Dollars
2003 ¥ 28,487 $ 214
2004 13,536 102
2005 146,900 1,103
2006 384,953 2,890
2007 341,459 2,563
2008 and Thereafter 1,757,326 13,193
Total ¥2,672,663 $20,065
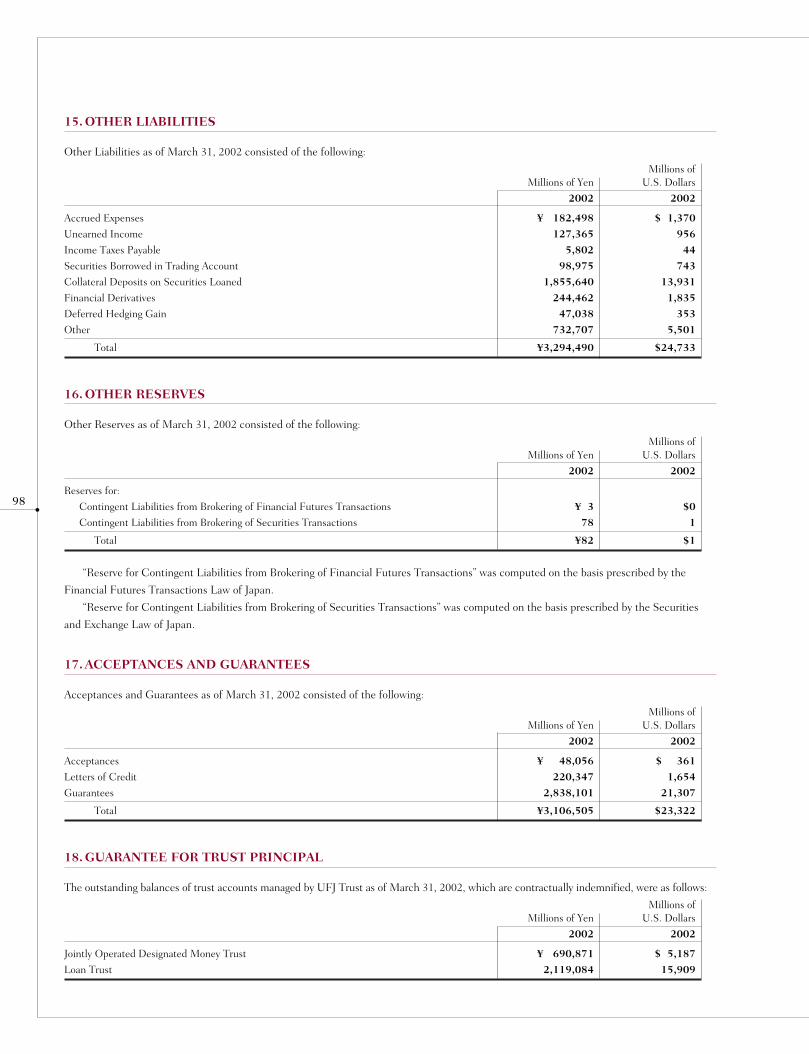
98
15. OTHER LIABILITIES
Other Liabilities as of March 31, 2002 consisted of the following:
Millions ofMillions of Yen U.S. Dollars
2002 2002
Accrued Expenses ¥ 182,498 $ 1,370
Unearned Income 127,365 956
Income Taxes Payable 5,802 44
Securities Borrowed in Trading Account 98,975 743
Collateral Deposits on Securities Loaned 1,855,640 13,931
Financial Derivatives 244,462 1,835
Deferred Hedging Gain 47,038 353
Other 732,707 5,501
Total ¥3,294,490 $24,733
16. OTHER RESERVES
Other Reserves as of March 31, 2002 consisted of the following:
Millions ofMillions of Yen U.S. Dollars
2002 2002
Reserves for:
Contingent Liabilities from Brokering of Financial Futures Transactions ¥ 3 $0
Contingent Liabilities from Brokering of Securities Transactions 78 1
Total ¥82 $1
“Reserve for Contingent Liabilities from Brokering of Financial Futures Transactions” was computed on the basis prescribed by the
Financial Futures Transactions Law of Japan.
“Reserve for Contingent Liabilities from Brokering of Securities Transactions” was computed on the basis prescribed by the Securities
and Exchange Law of Japan.
17. ACCEPTANCES AND GUARANTEES
Acceptances and Guarantees as of March 31, 2002 consisted of the following:
Millions ofMillions of Yen U.S. Dollars
2002 2002
Acceptances ¥ 48,056 $ 361
Letters of Credit 220,347 1,654
Guarantees 2,838,101 21,307
Total ¥3,106,505 $23,322
18. GUARANTEE FOR TRUST PRINCIPAL
The outstanding balances of trust accounts managed by UFJ Trust as of March 31, 2002, which are contractually indemnified, were as follows:
Millions ofMillions of Yen U.S. Dollars
2002 2002
Jointly Operated Designated Money Trust ¥ 690,871 $ 5,187
Loan Trust 2,119,084 15,909
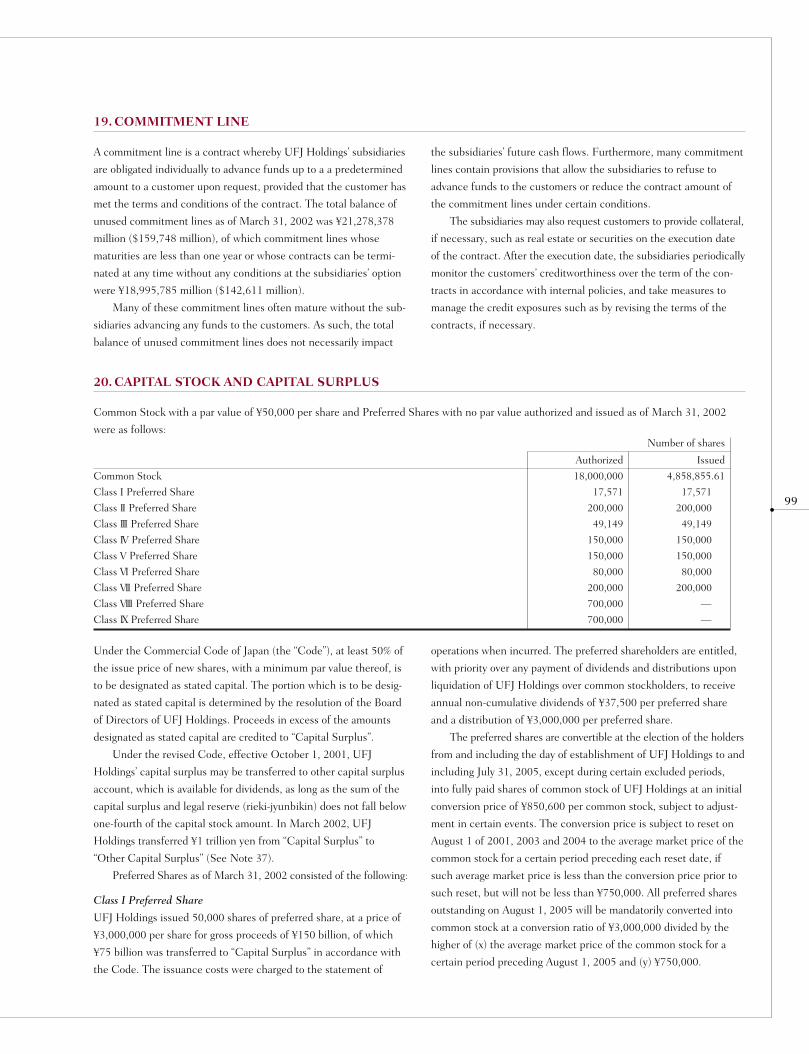
99
19. COMMITMENT LINE
20. CAPITAL STOCK AND CAPITAL SURPLUS
Common Stock with a par value of ¥50,000 per share and Preferred Shares with no par value authorized and issued as of March 31, 2002
were as follows:Number of shares
Authorized Issued
Common Stock 18,000,000 4,858,855.61
Class I Preferred Share 17,571 17,571
Class II Preferred Share 200,000 200,000
Class III Preferred Share 49,149 49,149
Class IV Preferred Share 150,000 150,000
Class V Preferred Share 150,000 150,000
Class VI Preferred Share 80,000 80,000
Class VII Preferred Share 200,000 200,000
Class VIII Preferred Share 700,000 —
Class IX Preferred Share 700,000 —
A commitment line is a contract whereby UFJ Holdings’ subsidiaries
are obligated individually to advance funds up to a a predetermined
amount to a customer upon request, provided that the customer has
met the terms and conditions of the contract. The total balance of
unused commitment lines as of March 31, 2002 was ¥21,278,378
million ($159,748 million), of which commitment lines whose
maturities are less than one year or whose contracts can be termi-
nated at any time without any conditions at the subsidiaries’ option
were ¥18,995,785 million ($142,611 million).
Many of these commitment lines often mature without the sub-
sidiaries advancing any funds to the customers. As such, the total
balance of unused commitment lines does not necessarily impact
the subsidiaries’ future cash flows. Furthermore, many commitment
lines contain provisions that allow the subsidiaries to refuse to
advance funds to the customers or reduce the contract amount of
the commitment lines under certain conditions.
The subsidiaries may also request customers to provide collateral,
if necessary, such as real estate or securities on the execution date
of the contract. After the execution date, the subsidiaries periodically
monitor the customers’ creditworthiness over the term of the con-
tracts in accordance with internal policies, and take measures to
manage the credit exposures such as by revising the terms of the
contracts, if necessary.
Under the Commercial Code of Japan (the “Code”), at least 50% of
the issue price of new shares, with a minimum par value thereof, is
to be designated as stated capital. The portion which is to be desig-
nated as stated capital is determined by the resolution of the Board
of Directors of UFJ Holdings. Proceeds in excess of the amounts
designated as stated capital are credited to “Capital Surplus”.
Under the revised Code, effective October 1, 2001, UFJ
Holdings’ capital surplus may be transferred to other capital surplus
account, which is available for dividends, as long as the sum of the
capital surplus and legal reserve (rieki-jyunbikin) does not fall below
one-fourth of the capital stock amount. In March 2002, UFJ
Holdings transferred ¥1 trillion yen from “Capital Surplus” to
“Other Capital Surplus” (See Note 37).
Preferred Shares as of March 31, 2002 consisted of the following:
Class I Preferred Share
UFJ Holdings issued 50,000 shares of preferred share, at a price of
¥3,000,000 per share for gross proceeds of ¥150 billion, of which
¥75 billion was transferred to “Capital Surplus” in accordance with
the Code. The issuance costs were charged to the statement of
operations when incurred. The preferred shareholders are entitled,
with priority over any payment of dividends and distributions upon
liquidation of UFJ Holdings over common stockholders, to receive
annual non-cumulative dividends of ¥37,500 per preferred share
and a distribution of ¥3,000,000 per preferred share.
The preferred shares are convertible at the election of the holders
from and including the day of establishment of UFJ Holdings to and
including July 31, 2005, except during certain excluded periods,
into fully paid shares of common stock of UFJ Holdings at an initial
conversion price of ¥850,600 per common stock, subject to adjust-
ment in certain events. The conversion price is subject to reset on
August 1 of 2001, 2003 and 2004 to the average market price of the
common stock for a certain period preceding each reset date, if
such average market price is less than the conversion price prior to
such reset, but will not be less than ¥750,000. All preferred shares
outstanding on August 1, 2005 will be mandatorily converted into
common stock at a conversion ratio of ¥3,000,000 divided by the
higher of (x) the average market price of the common stock for a
certain period preceding August 1, 2005 and (y) ¥750,000.

100
Class II Preferred Share
UFJ Holdings issued 200,000 shares of preferred shares, at a price
of ¥3,000,000 per share for gross proceeds of ¥600 billion, of which
¥300 billion was transferred to “Capital Surplus” in accordance with
the Code. The issuance costs were charged to the statement of
operations when incurred. The preferred shareholders are entitled,
with priority over any payment of dividends and distributions upon
the liquidation of UFJ Holdings over common stockholders, to
receive annual non-cumulative dividends of ¥15,900 per preferred
share and a distribution of ¥3,000,000 per preferred share.
The preferred shares are convertible at the election of the holders
from and including July 1, 2001 to and including July 31, 2008,
except during certain excluded periods, into fully paid shares of
common stock of UFJ Holdings at an initial conversion price of
¥1,050,000 per common stock, subject to adjustment in certain
events. The conversion price is subject to reset annually on August
1 between 2001 and 2007 to the average market price of the common
stock for a certain period preceding each reset date multiplied by
1.025, but will not be less than ¥1,050,000. All preferred shares
outstanding on August 1, 2008 will be mandatorily converted into
common stock at a conversion ratio of ¥3,000,000 divided by the
higher of (x) the average market price of the common stock for a
certain period preceding August 1, 2008 and (y) ¥750,000.
Class III Preferred Share
UFJ Holdings issued 50,000 shares of preferred shares, at a price of
¥2,000,000 per share for gross proceeds of ¥100 billion, of which
¥50 billion was transferred to “Capital Surplus” in accordance with
the Code. The issuance costs were charged to the statement of
operations when incurred. The preferred shareholders are entitled,
with priority over any payment of dividends and distributions upon
the liquidation of UFJ Holdings over common stockholders, to
receive annual non-cumulative dividends of ¥68,750 per preferred
share and a distribution of ¥2,000,000 per preferred share.
The preferred shares are convertible at the election of the holders
from and including the day of establishment of UFJ Holdings to and
including September 30, 2004, except during certain excluded peri-
ods, into fully paid shares of common stock of UFJ Holdings at an
initial conversion ratio of 0.888 common stocks per preferred share,
subject to adjustment in certain events. The conversion price is sub-
ject to reset on October 5 of 2001, 2002 and 2003 as ¥2,000,000
divided by average market price of the common stock for a certain
period preceding each reset date, but will not be less than 0.888
and more than 2.480. All preferred shares outstanding on October
1, 2004 will be mandatorily converted into common stock at a con-
version ratio of ¥2,000,000 divided by the higher of (x) the average
market price of the common stock for a certain period preceding
October 1, 2004 and (y) ¥806,500.
Class IV Preferred Share
UFJ Holdings issued 150,000 shares of preferred shares, at a price
of ¥2,000,000 per share for gross proceeds of ¥300 billion, of which
¥150 billion was transferred to “Capital Surplus” in accordance with
the Code. The issuance costs were charged to the statement of
operations when incurred. The preferred shareholders are entitled,
with priority over any payment of dividends and distributions upon
the liquidation of UFJ Holdings over common stockholders, to
receive annual non-cumulative dividends of ¥18,600 per preferred
share and a distribution of ¥2,000,000 per preferred share.
The preferred shares are convertible at the election of the holders
from and including July 1, 2002 to and including March 30, 2009,
except during certain excluded periods, into fully paid shares of
common stock of UFJ Holdings at an initial conversion ratio of
2.202 common stocks per preferred share, subject to adjustment in
certain events. The conversion ratio is subject to reset annually on
October 5 between 2002 and 2008 as ¥2,000,000 divided by
average market price of the common stock for a certain period pre-
ceding each reset date multiplied by 1.035, but will not be more
than 3.543. All preferred shares outstanding on March 31, 2009 will
be mandatorily converted into common stock at a conversion ratio
of ¥2,000,000 divided by the higher of (x) the average market price
of the common stock for a certain period preceding March 31, 2009
and (y) ¥564,500.
Class V Preferred Share
UFJ Holdings issued 150,000 shares of preferred shares, at a price
of ¥2,000,000 per share for gross proceeds of ¥300 billion, of which
¥150 billion was transferred to “Capital Surplus” in accordance with
the Code. The issuance costs were charged to the statement of
operations when incurred. The preferred shareholders are entitled,
with priority over any payment of dividends and distributions upon
the liquidation of UFJ Holdings over common stockholders, to
receive annual non-cumulative dividends of ¥19,400 per preferred
share and a distribution of ¥2,000,000 per preferred share.
The preferred shares are convertible at the election of the holders
from and including July 1, 2003 to and including March 30, 2009,
except during certain excluded periods, into fully paid shares of
common stock of UFJ Holdings at an initial conversion ratio of
2.202 common stocks per preferred share, subject to adjustment in
certain events. The conversion ratio is subject to reset annually on
October 5 between 2003 and 2008 as ¥2,000,000 divided by
average market price of the common stock for a certain period pre-
ceding each reset date multiplied by 1.035, but will not be more
than 3.543. All preferred shares outstanding on March 31, 2009 will
be mandatorily converted into common stock at a conversion ratio
of ¥2,000,000 divided by the higher of (x) the average market price
of the common stock for a certain period preceding March 31, 2009
and (y) ¥564,500.

101
Class VI Preferred Share
UFJ Holdings issued 80,000 shares of preferred shares, at a price of
¥1,000,000 per share for gross proceeds of ¥80 billion, of which ¥40
billion was transferred to “Capital Surplus” in accordance with the
Code. The issuance costs were charged to the statement of opera-
tions when incurred. The preferred shareholders are entitled, with
priority over any payment of dividends and distributions upon the
liquidation of UFJ Holdings over common stockholders, to receive
annual non-cumulative dividends of ¥5,300 per preferred share and
a distribution of ¥1,000,000 per preferred share.
The preferred shares are convertible at the election of the holders
from and including the day of establishment of UFJ Holdings to and
including July 31, 2014, except during certain excluded periods,
into fully paid shares of common stock of UFJ Holdings at an initial
conversion price of ¥710,900 per common stock, subject to adjust-
ment in certain events. The conversion price is subject to reset
annually on August 1 between 2001 and 2013 to the average market
price of the common stock for a certain period preceding each reset
date, if such average market price is less than the conversion price
prior to such reset, but will not be less than ¥569,600. All preferred
shares outstanding on August 1, 2014 will be mandatorily converted
into common stock at a conversion ratio of ¥1,000,000 divided by
the higher of (x) the average market price of the common stock for a
certain period preceding August 1, 2014 and (y) ¥497,600.
Class VII Preferred Share
UFJ Holdings issued 200,000 shares of preferred shares, at a price
of ¥1,000,000 per share for gross proceeds of ¥200 billion, of which
¥100 billion was transferred to “Capital Surplus” in accordance with
the Code. The issuance costs were charged to the statement of
operations when incurred. The preferred shareholders are entitled,
with priority over any payment of dividends and distributions upon
the liquidation of UFJ Holdings over common stockholders, to
receive annual non-cumulative dividends of ¥11,500 per preferred
share and a distribution of ¥1,000,000 per preferred share.
The preferred shares are convertible at the election of the holders
from and including the day of establishment of UFJ Holdings to and
including July 31, 2009, except during certain excluded periods,
into fully paid shares of common stock of UFJ Holdings at an initial
conversion price of ¥704,300 per common stock, subject to adjust-
ment in certain events. The conversion price is subject to reset
annually on June 30th between 2001 and 2008 to the average market
price of the common stock for a certain period preceding each reset
date, if such average market price is less than the conversion price
prior to such reset, but will not be less than ¥493,500. All preferred
shares outstanding on August 1, 2009 will be mandatorily converted
into common stock at a conversion ratio of ¥1,000,000 divided by
the higher of (x) the average market price of the common stock for a
certain period preceding August 1, 2009 and (y) ¥493,000.
In addition, UFJ Holdings has 700,000 Class VIII Preferred Shares
and Class IX Preferred Shares authorized, respectively. As of March
31, 2002, UFJ Holdindgs had no Class VIII and Class IX Preferred
Shares issued.
21. OTHER INTEREST INCOME
The composition of Other Interest Income for the fiscal year ended March 31, 2002 was as follows:
Millions ofMillions of Yen U.S. Dollars
2002 2002
Interest on Receivables under Resale Agreements ¥ 23,350 $ 175
Interest on Due from Banks 139,427 1,047
Interest on Interest Rate Swaps 32,540 244
Other Interest Income 43,841 329
Total ¥239,159 $1,795
22. FEES AND COMMISSIONS (INCOME)
The composition of Fees and Commissions (Income) for the fiscal year ended March 31, 2002 was as follows:
Millions ofMillions of Yen U.S. Dollars
2002 2002
Wire Transfer Service Charges ¥ 97,299 $ 731
Other 218,062 1,637
Total ¥315,361 $2,368
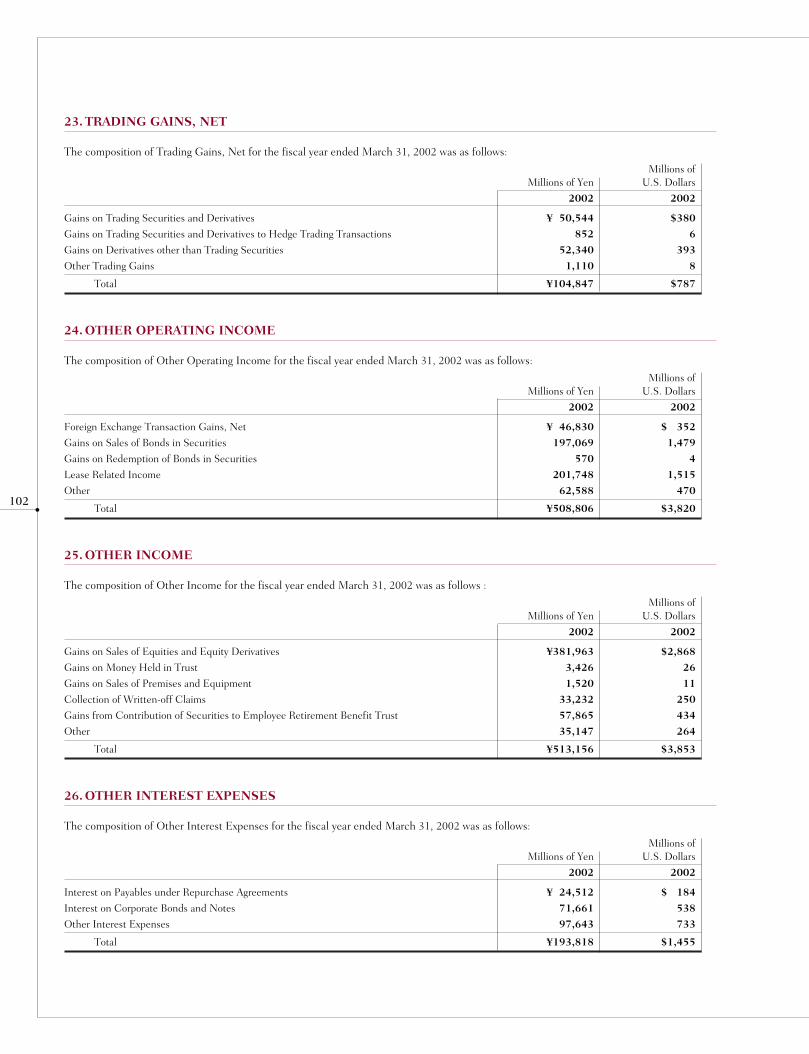
102
23. TRADING GAINS, NET
The composition of Trading Gains, Net for the fiscal year ended March 31, 2002 was as follows:
Millions ofMillions of Yen U.S. Dollars
2002 2002
Gains on Trading Securities and Derivatives ¥ 50,544 $380
Gains on Trading Securities and Derivatives to Hedge Trading Transactions 852 6
Gains on Derivatives other than Trading Securities 52,340 393
Other Trading Gains 1,110 8
Total ¥104,847 $787
24. OTHER OPERATING INCOME
The composition of Other Operating Income for the fiscal year ended March 31, 2002 was as follows:
Millions ofMillions of Yen U.S. Dollars
2002 2002
Foreign Exchange Transaction Gains, Net ¥ 46,830 $ 352
Gains on Sales of Bonds in Securities 197,069 1,479
Gains on Redemption of Bonds in Securities 570 4
Lease Related Income 201,748 1,515
Other 62,588 470
Total ¥508,806 $3,820
25. OTHER INCOME
The composition of Other Income for the fiscal year ended March 31, 2002 was as follows :
Millions ofMillions of Yen U.S. Dollars
2002 2002
Gains on Sales of Equities and Equity Derivatives ¥381,963 $2,868
Gains on Money Held in Trust 3,426 26
Gains on Sales of Premises and Equipment 1,520 11
Collection of Written-off Claims 33,232 250
Gains from Contribution of Securities to Employee Retirement Benefit Trust 57,865 434
Other 35,147 264
Total ¥513,156 $3,853
26. OTHER INTEREST EXPENSES
The composition of Other Interest Expenses for the fiscal year ended March 31, 2002 was as follows:
Millions ofMillions of Yen U.S. Dollars
2002 2002
Interest on Payables under Repurchase Agreements ¥ 24,512 $ 184
Interest on Corporate Bonds and Notes 71,661 538
Other Interest Expenses 97,643 733
Total ¥193,818 $1,455

103
27. FEES AND COMMISSIONS (EXPENSES)
The composition of Fees and Commissions (Expenses) for the fiscal year ended March 31, 2002 was as follows:
Millions ofMillions of Yen U.S. Dollars
2002 2002
Wire Transfer Service Charges ¥22,469 $169
Other 43,067 323
Total ¥65,537 $492
28. OTHER OPERATING EXPENSES
The composition of Other Operating Expenses for the fiscal year ended March 31, 2002 was as follows:
Millions ofMillions of Yen U.S. Dollars
2002 2002
Losses on Sales of Bonds in Securities ¥132,633 $ 996
Losses on Redemption of Bonds in Securities 3,055 23
Revaluation Loss on Bonds in Securities 1,625 12
Financial Derivatives Losses, Net 9,400 70
Amortization of Bond Issue Cost 1,735 13
Lease Related Expenses 205,388 1,542
Other 19,845 149
Total ¥373,685 $2,805
29. OTHER EXPENSES
The composition of Other Expenses for the fiscal year ended March 31, 2002 was as follows:
Millions ofMillions of Yen U.S. Dollars
2002 2002
Write-off of Loans ¥ 600,990 $ 4,512
Losses on Sales of Stocks and Equity Derivatives 176,515 1,325
Revaluation Losses on Stocks and Equity Derivatives 400,391 3,006
Losses on Money Held in Trust 2,949 22
Amortization of Goodwill 4,018 30
Equity in Earnings of Affiliates 15,483 116
Losses on Sales of Loans to the Cooperative Credit Purchasing Company, Limited 16,257 122
Losses on Delinquent Loans Sold 53,242 400
Losses from Financial Supports Provided to Customers 100,147 752
Provision for Contingent Liabilities Related to Loans Sold 13,913 105
Provision for Losses on Supports of Specific Borrowers 424,527 3,187
Provision for Losses on Securities 13,444 101
Losses on Sales of Premises and Equipment 47,059 353
Amortization of Net Transitional Obligations for Employee Retirement Benefits 36,081 271
Merger Related Expenses for Consolidated Subsidiaries 34,419 258
Other 125,271 941
Total ¥2,064,712 $15,501
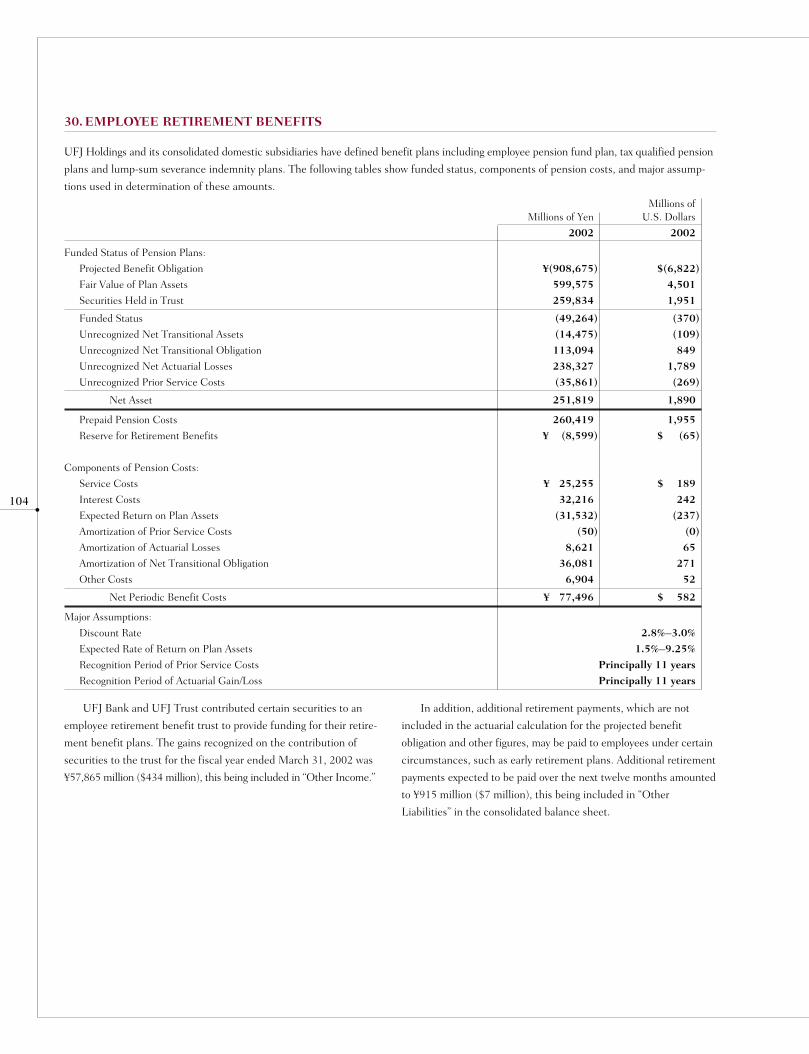
104
30. EMPLOYEE RETIREMENT BENEFITS
UFJ Holdings and its consolidated domestic subsidiaries have defined benefit plans including employee pension fund plan, tax qualified pension
plans and lump-sum severance indemnity plans. The following tables show funded status, components of pension costs, and major assump-
tions used in determination of these amounts.
Millions ofMillions of Yen U.S. Dollars
2002 2002
Funded Status of Pension Plans:
Projected Benefit Obligation ¥(908,675) $(6,822)
Fair Value of Plan Assets 599,575 4,501
Securities Held in Trust 259,834 1,951
Funded Status (49,264) (370)
Unrecognized Net Transitional Assets (14,475) (109)
Unrecognized Net Transitional Obligation 113,094 849
Unrecognized Net Actuarial Losses 238,327 1,789
Unrecognized Prior Service Costs (35,861) (269)
Net Asset 251,819 1,890
Prepaid Pension Costs 260,419 1,955
Reserve for Retirement Benefits ¥ (8,599) $ (65)
Components of Pension Costs:
Service Costs ¥ 25,255 $ 189
Interest Costs 32,216 242
Expected Return on Plan Assets (31,532) (237)
Amortization of Prior Service Costs (50) (0)
Amortization of Actuarial Losses 8,621 65
Amortization of Net Transitional Obligation 36,081 271
Other Costs 6,904 52
Net Periodic Benefit Costs ¥ 77,496 $ 582
Major Assumptions:
Discount Rate 2.8%–3.0%
Expected Rate of Return on Plan Assets 1.5%–9.25%
Recognition Period of Prior Service Costs Principally 11 years
Recognition Period of Actuarial Gain/Loss Principally 11 years
UFJ Bank and UFJ Trust contributed certain securities to an
employee retirement benefit trust to provide funding for their retire-
ment benefit plans. The gains recognized on the contribution of
securities to the trust for the fiscal year ended March 31, 2002 was
¥57,865 million ($434 million), this being included in “Other Income.”
In addition, additional retirement payments, which are not
included in the actuarial calculation for the projected benefit
obligation and other figures, may be paid to employees under certain
circumstances, such as early retirement plans. Additional retirement
payments expected to be paid over the next twelve months amounted
to ¥915 million ($7 million), this being included in “Other
Liabilities” in the consolidated balance sheet.
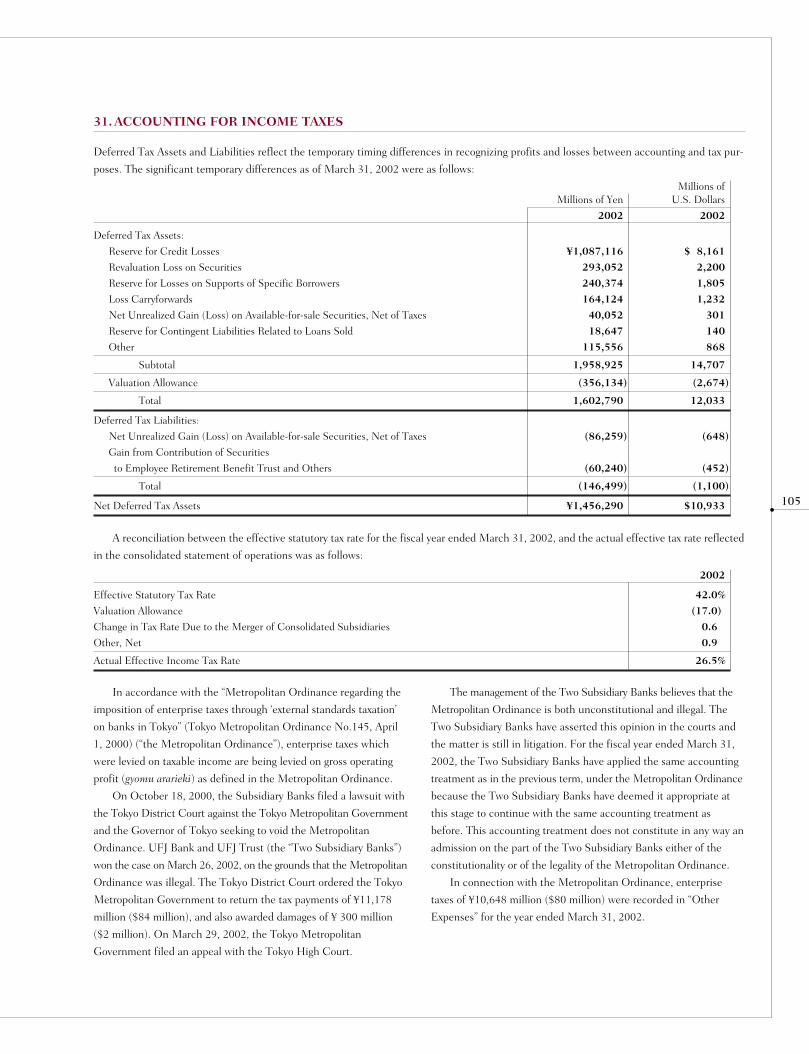
105
31. ACCOUNTING FOR INCOME TAXES
Deferred Tax Assets and Liabilities reflect the temporary timing differences in recognizing profits and losses between accounting and tax pur-
poses. The significant temporary differences as of March 31, 2002 were as follows:
Millions ofMillions of Yen U.S. Dollars
2002 2002
Deferred Tax Assets:
Reserve for Credit Losses ¥1,087,116 $ 8,161
Revaluation Loss on Securities 293,052 2,200
Reserve for Losses on Supports of Specific Borrowers 240,374 1,805
Loss Carryforwards 164,124 1,232
Net Unrealized Gain (Loss) on Available-for-sale Securities, Net of Taxes 40,052 301
Reserve for Contingent Liabilities Related to Loans Sold 18,647 140
Other 115,556 868
Subtotal 1,958,925 14,707
Valuation Allowance (356,134) (2,674)
Total 1,602,790 12,033
Deferred Tax Liabilities:
Net Unrealized Gain (Loss) on Available-for-sale Securities, Net of Taxes (86,259) (648)
Gain from Contribution of Securities
to Employee Retirement Benefit Trust and Others (60,240) (452)
Total (146,499) (1,100)
Net Deferred Tax Assets ¥1,456,290 $10,933
A reconciliation between the effective statutory tax rate for the fiscal year ended March 31, 2002, and the actual effective tax rate reflected
in the consolidated statement of operations was as follows:
2002
Effective Statutory Tax Rate 42.0%
Valuation Allowance (17.0)
Change in Tax Rate Due to the Merger of Consolidated Subsidiaries 0.6
Other, Net 0.9
Actual Effective Income Tax Rate 26.5%
In accordance with the “Metropolitan Ordinance regarding the
imposition of enterprise taxes through ‘external standards taxation’
on banks in Tokyo” (Tokyo Metropolitan Ordinance No.145, April
1, 2000) (“the Metropolitan Ordinance”), enterprise taxes which
were levied on taxable income are being levied on gross operating
profit (gyomu ararieki) as defined in the Metropolitan Ordinance.
On October 18, 2000, the Subsidiary Banks filed a lawsuit with
the Tokyo District Court against the Tokyo Metropolitan Government
and the Governor of Tokyo seeking to void the Metropolitan
Ordinance. UFJ Bank and UFJ Trust (the “Two Subsidiary Banks”)
won the case on March 26, 2002, on the grounds that the Metropolitan
Ordinance was illegal. The Tokyo District Court ordered the Tokyo
Metropolitan Government to return the tax payments of ¥11,178
million ($84 million), and also awarded damages of ¥ 300 million
($2 million). On March 29, 2002, the Tokyo Metropolitan
Government filed an appeal with the Tokyo High Court.
The management of the Two Subsidiary Banks believes that the
Metropolitan Ordinance is both unconstitutional and illegal. The
Two Subsidiary Banks have asserted this opinion in the courts and
the matter is still in litigation. For the fiscal year ended March 31,
2002, the Two Subsidiary Banks have applied the same accounting
treatment as in the previous term, under the Metropolitan Ordinance
because the Two Subsidiary Banks have deemed it appropriate at
this stage to continue with the same accounting treatment as
before. This accounting treatment does not constitute in any way an
admission on the part of the Two Subsidiary Banks either of the
constitutionality or of the legality of the Metropolitan Ordinance.
In connection with the Metropolitan Ordinance, enterprise
taxes of ¥10,648 million ($80 million) were recorded in “Other
Expenses” for the year ended March 31, 2002.

106
Since the enterprise taxes in question are not reflected in the
calculation of deferred taxes, had the enterprise taxes been levied on
taxable income, the deferred tax asset would have been increased by
¥62,630 million ($470 million) from the recorded amount based on
gross operating profit, as defined. In addition, “Deferred Tax
Liabilities for Revaluation Reserve for Land” would have been
increased by ¥3,647 million ($27 million), the “Revaluation Reserve
for Land, Net of Taxes” and “Net Unrealized Gain (Loss) on
Available-for-sale Securities, Net of Taxes” would have been
decreased by ¥ 3,647 million ($27 million) and ¥ 2,683 million ($20
million), respectively, from the recorded amount based on gross
operating profit, as defined.
In accordance with the “Municipal Ordinance regarding the
imposition of enterprise taxes through ‘external standards taxation’ on
banks in Osaka” (Osaka Municipal Ordinance No.131, June 9, 2000)
(“the Municipal Ordinance”), enterprise taxes, which were levied on
taxable income, are being levied on gross operating profit, as defined.
On April 4, 2002, the Two Subsidiary Banks filed a lawsuit with
the Osaka District Court against the Osaka Municipal Government
and the Governor of Osaka seeking to void the Municipal Ordinance.
The management of the Two Subsidiary Banks believes that the
Municipal Ordinance is both unconstitutional and illegal. The Two
Subsidiary Banks have asserted this opinion in the Osaka District
Court and the matter is still in litigation. For the fiscal year ended
March 31, 2002, the Two Subsidiary Banks have applied the
accounting treatment under the Municipal Ordinance because the
Two Subsidiary Banks have deemed it appropriate at this stage to
apply the same accounting treatment consistent with the Metropolitan
Ordinance. This accounting treatment does not constitute in any
way an admission on the part of the Two Subsidiary Banks either of
the constitutionality or of the legality of the Municipal Ordinance.
In connection with the Municipal Ordinance, enterprise taxes
of ¥7,389 million ($55 million) were recorded in “Other Expenses.”
Since the enterprise taxes in question are not reflected in the
calculations for deferred taxes, had the enterprise taxes been levied
on taxable income, the deferred tax assets would have been increased
by ¥40,108 million ($30 million) from the recorded amount based
on gross operating profit, as defined. In addition, “Deferred Tax
Liabilities for Revaluation Reserve for Land” would have been
increased by ¥2,455 million ($18 million), the “Revaluation Reserve
for Land, Net of Taxes” and “Net Unrealized Gain (Loss) on
Available-for-sale Securities, Net of Taxes” would have been
decreased by ¥2,455 million ($18 million) and ¥2,517 million ($19
million), respectively, from the recorded amount based on gross
operating profit, as defined.
In connection with the “Revision of Municipal Ordinance
regarding the imposition of the enterprise taxes through ‘external
standards taxation’ on banks in Osaka”(Osaka Municipal Ordinance
No.77) (“the Revised Municipal Ordinance”) on May 30, 2002, the
treatment regarding the tax basis is to be applicable from the fiscal
year beginning on April 1, 2002.
The enterprise taxes which the Two Subsidiary Banks pay to
Osaka Municipal Government for the fiscal year ended March 31,
2002, are subject to the Supplementary Provision 2 of the Revised
Municipal Ordinance, which requires that the Two Subsidiary
Banks pay the enterprise taxes based on the lesser of gross operating
profit or taxable income. The Subsidiary Banks, therefore, will file
and pay the enterprise taxes based on taxable income.
The fact that the Two Subsidiary Banks will file and pay the
enterprise taxes according to the Revised Municipal Ordinance does
not constitute in any way an admission on the part of the Two
Subsidiary Banks the constitutionality or the legality of the Revised
Municipal Ordinance and the Municipal Ordinance.
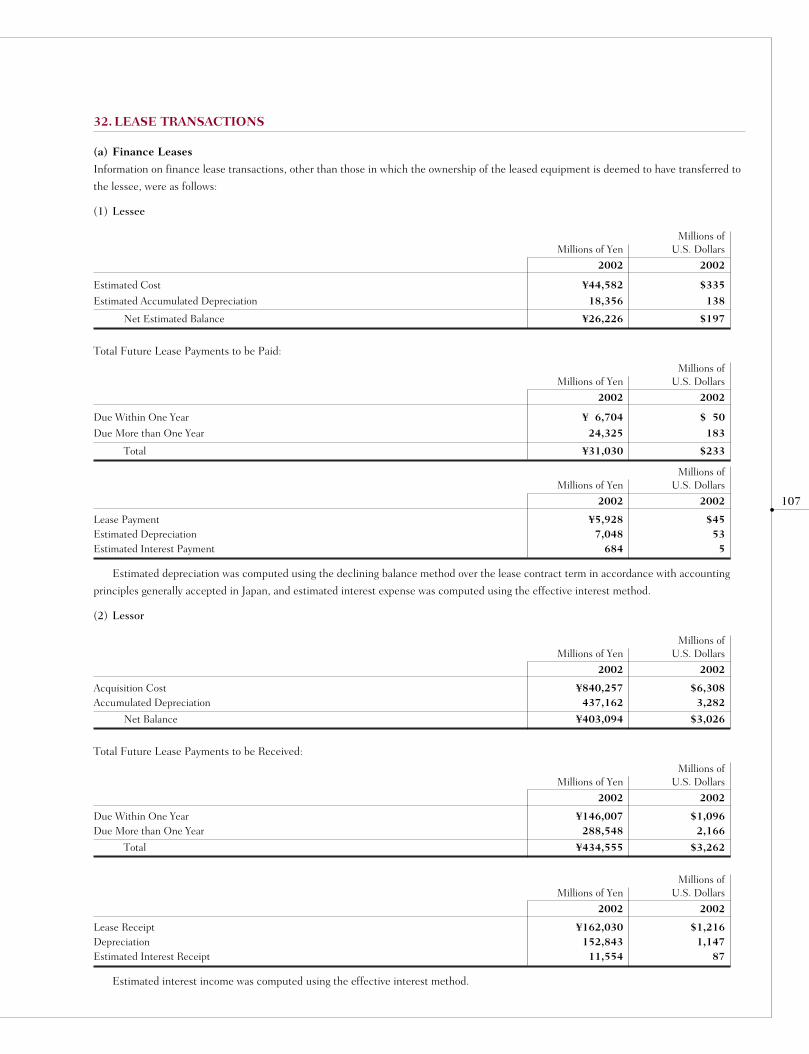
107
32. LEASE TRANSACTIONS
(a) Finance Leases
Information on finance lease transactions, other than those in which the ownership of the leased equipment is deemed to have transferred to
the lessee, were as follows:
(1) Lessee
Millions ofMillions of Yen U.S. Dollars
2002 2002
Estimated Cost ¥44,582 $335
Estimated Accumulated Depreciation 18,356 138
Net Estimated Balance ¥26,226 $197
Total Future Lease Payments to be Paid:
Millions ofMillions of Yen U.S. Dollars
2002 2002
Due Within One Year ¥ 6,704 $ 50
Due More than One Year 24,325 183
Total ¥31,030 $233
Millions ofMillions of Yen U.S. Dollars
2002 2002
Lease Payment ¥5,928 $45Estimated Depreciation 7,048 53Estimated Interest Payment 684 5
Estimated depreciation was computed using the declining balance method over the lease contract term in accordance with accounting
principles generally accepted in Japan, and estimated interest expense was computed using the effective interest method.
(2) Lessor
Millions ofMillions of Yen U.S. Dollars
2002 2002
Acquisition Cost ¥840,257 $6,308Accumulated Depreciation 437,162 3,282
Net Balance ¥403,094 $3,026
Total Future Lease Payments to be Received:
Millions ofMillions of Yen U.S. Dollars
2002 2002
Due Within One Year ¥146,007 $1,096Due More than One Year 288,548 2,166
Total ¥434,555 $3,262
Millions ofMillions of Yen U.S. Dollars
2002 2002
Lease Receipt ¥162,030 $1,216Depreciation 152,843 1,147Estimated Interest Receipt 11,554 87
Estimated interest income was computed using the effective interest method.
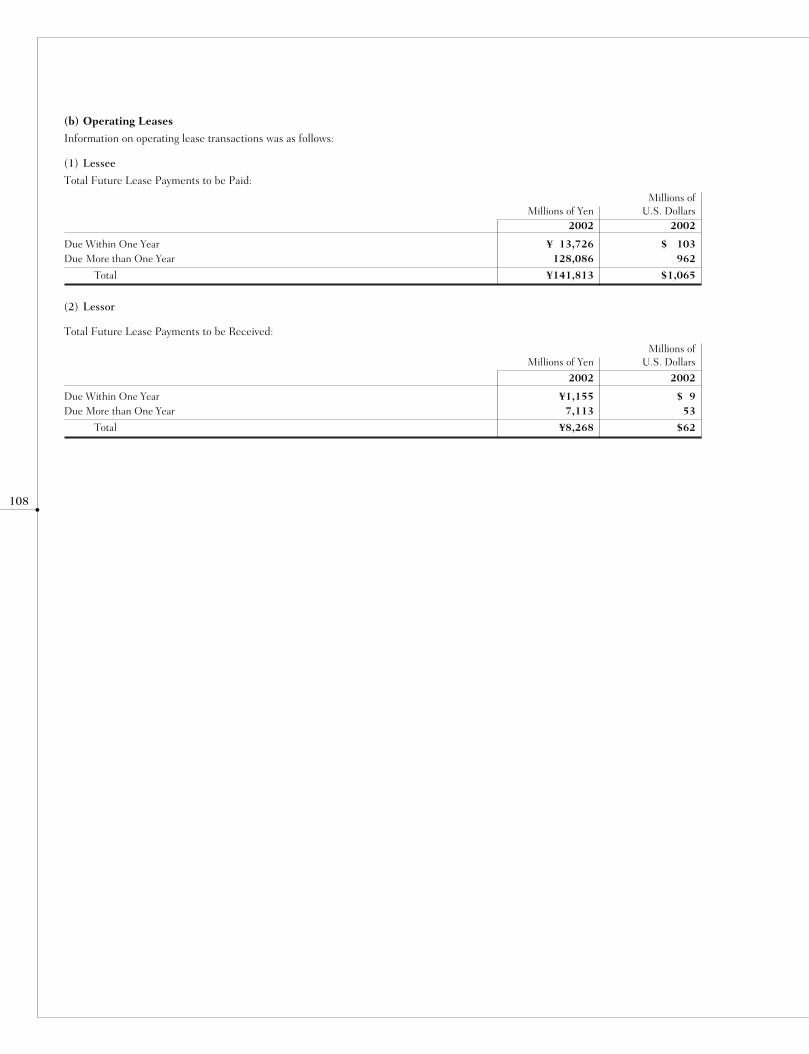
108
(b) Operating Leases
Information on operating lease transactions was as follows:
(1) Lessee
Total Future Lease Payments to be Paid:
Millions ofMillions of Yen U.S. Dollars
2002 2002
Due Within One Year ¥ 13,726 $ 103Due More than One Year 128,086 962
Total ¥141,813 $1,065
(2) Lessor
Total Future Lease Payments to be Received:
Millions ofMillions of Yen U.S. Dollars
2002 2002
Due Within One Year ¥1,155 $ 9Due More than One Year 7,113 53
Total ¥8,268 $62
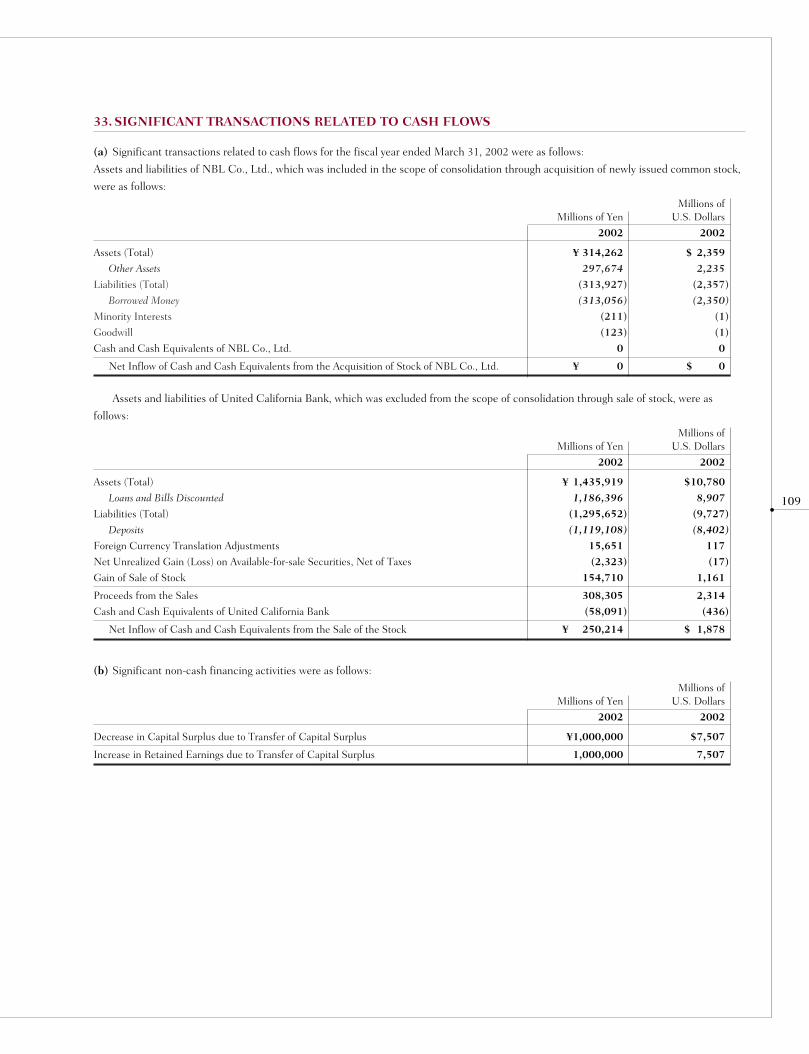
109
33. SIGNIFICANT TRANSACTIONS RELATED TO CASH FLOWS
(a) Significant transactions related to cash flows for the fiscal year ended March 31, 2002 were as follows:
Assets and liabilities of NBL Co., Ltd., which was included in the scope of consolidation through acquisition of newly issued common stock,
were as follows:
Millions ofMillions of Yen U.S. Dollars
2002 2002
Assets (Total) ¥ 314,262 $ 2,359
Other Assets 297,674 2,235
Liabilities (Total) (313,927) (2,357)
Borrowed Money (313,056) (2,350)
Minority Interests (211) (1)
Goodwill (123) (1)
Cash and Cash Equivalents of NBL Co., Ltd. 0 0
Net Inflow of Cash and Cash Equivalents from the Acquisition of Stock of NBL Co., Ltd. ¥ 0 $ 0
Assets and liabilities of United California Bank, which was excluded from the scope of consolidation through sale of stock, were as
follows:
Millions ofMillions of Yen U.S. Dollars
2002 2002
Assets (Total) ¥ 1,435,919 $10,780
Loans and Bills Discounted 1,186,396 8,907
Liabilities (Total) (1,295,652) (9,727)
Deposits (1,119,108) (8,402)
Foreign Currency Translation Adjustments 15,651 117
Net Unrealized Gain (Loss) on Available-for-sale Securities, Net of Taxes (2,323) (17)
Gain of Sale of Stock 154,710 1,161
Proceeds from the Sales 308,305 2,314
Cash and Cash Equivalents of United California Bank (58,091) (436)
Net Inflow of Cash and Cash Equivalents from the Sale of the Stock ¥ 250,214 $ 1,878
(b) Significant non-cash financing activities were as follows:
Millions ofMillions of Yen U.S. Dollars
2002 2002
Decrease in Capital Surplus due to Transfer of Capital Surplus ¥1,000,000 $7,507
Increase in Retained Earnings due to Transfer of Capital Surplus 1,000,000 7,507

110
34. MARKET VALUES OF SECURITIES AND MONEY HELD IN TRUST
(a) Securities
“Securities” include trading securities, securities used for hedging trading transactions, negotiable due from banks and commercial paper in
“Trading Assets,” negotiable due from banks in “Cash and Due from Banks,” and the commodity fund in “Monetary Receivables Bought.”
(1) Trading securities
Millions of Yen
March 31, 2002 Book Value Valuation Gain (Loss)
Securities in Trading Account ¥2,194,333 ¥(7,188)
Millions of U.S. Dollars
March 31, 2002 Book Value Valuation Gain (Loss)
Securities in Trading Account $16,474 $ (54)
(2) Held-to-maturity Debt Securities with market values
Millions of Yen
Unrealized Gain (Loss)
March 31, 2002 Book Value Market Value Net Gain Loss
Japanese Corporate Bonds and Notes ¥ 2,002 ¥ 2,010 ¥ 7 ¥ 7 ¥ —
Other 23,981 24,034 52 68 15
Total ¥25,984 ¥26,045 ¥60 ¥76 ¥15
Millions of U.S. Dollars
Unrealized Gain (Loss)
March 31, 2002 Book Value Market Value Net Gain Loss
Japanese Corporate Bonds and Notes $ 15 $ 15 $0 $0 $ —
Others 180 181 1 1 0
Total $195 $ 196 $1 $1 $ 0
Note: Market values are primarily calculated by using the closing prices at the balance sheet date.
(3) Available-for-sale Securities with market values
Millions of Yen
Unrealized Gain (Loss)
AggregateMarch 31, 2002 Cost Market Value Net Gain Loss
Japanese Equities ¥ 4,307,018 ¥ 4,411,761 ¥104,743 ¥542,569 ¥437,825
Japanese National Government Bonds 7,085,085 7,090,785 5,699 13,299 7,599
Japanese Local Government Bonds 574,842 578,459 3,616 6,259 2,642
Japanese Corporate Bonds and Notes 257,691 260,865 3,174 4,395 1,221
Other 1,849,417 1,842,679 (6,737) 52,008 58,745
Total ¥14,074,054 ¥14,184,551 ¥110,496 ¥618,531 ¥508,035
Note: Market values for Japanese Equities are calculated by using the average market prices over a month that ended on the balance sheet date.Market values for securities other than Japanese Equities are primarily calculated by using the closing prices at the balance sheet date.
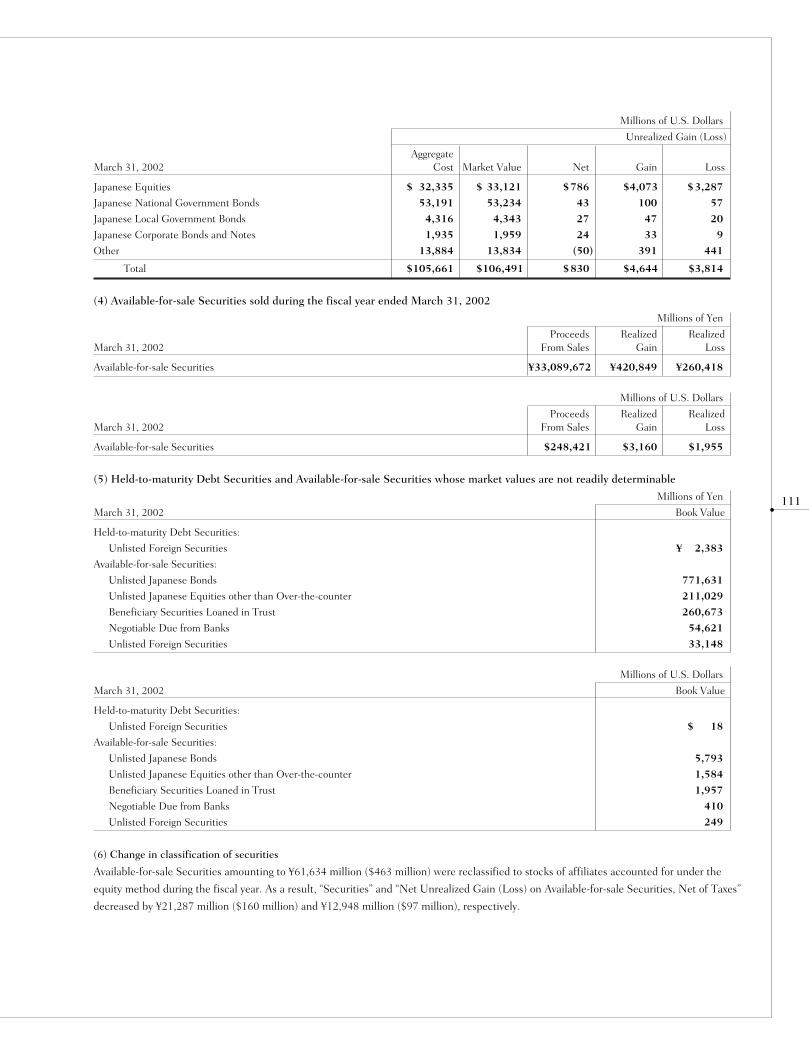
111
Millions of U.S. Dollars
Unrealized Gain (Loss)
AggregateMarch 31, 2002 Cost Market Value Net Gain Loss
Japanese Equities $ 32,335 $ 33,121 $786 $4,073 $3,287
Japanese National Government Bonds 53,191 53,234 43 100 57
Japanese Local Government Bonds 4,316 4,343 27 47 20
Japanese Corporate Bonds and Notes 1,935 1,959 24 33 9
Other 13,884 13,834 (50) 391 441
Total $105,661 $106,491 $830 $4,644 $3,814
(4) Available-for-sale Securities sold during the fiscal year ended March 31, 2002
Millions of Yen
Proceeds Realized RealizedMarch 31, 2002 From Sales Gain Loss
Available-for-sale Securities ¥33,089,672 ¥420,849 ¥260,418
Millions of U.S. Dollars
Proceeds Realized RealizedMarch 31, 2002 From Sales Gain Loss
Available-for-sale Securities $248,421 $3,160 $1,955
(5) Held-to-maturity Debt Securities and Available-for-sale Securities whose market values are not readily determinable
Millions of Yen
March 31, 2002 Book Value
Held-to-maturity Debt Securities:
Unlisted Foreign Securities ¥ 2,383
Available-for-sale Securities:
Unlisted Japanese Bonds 771,631
Unlisted Japanese Equities other than Over-the-counter 211,029
Beneficiary Securities Loaned in Trust 260,673
Negotiable Due from Banks 54,621
Unlisted Foreign Securities 33,148
Millions of U.S. Dollars
March 31, 2002 Book Value
Held-to-maturity Debt Securities:
Unlisted Foreign Securities $ 18
Available-for-sale Securities:
Unlisted Japanese Bonds 5,793
Unlisted Japanese Equities other than Over-the-counter 1,584
Beneficiary Securities Loaned in Trust 1,957
Negotiable Due from Banks 410
Unlisted Foreign Securities 249
(6) Change in classification of securities
Available-for-sale Securities amounting to ¥61,634 million ($463 million) were reclassified to stocks of affiliates accounted for under the
equity method during the fiscal year. As a result, “Securities” and “Net Unrealized Gain (Loss) on Available-for-sale Securities, Net of Taxes”
decreased by ¥21,287 million ($160 million) and ¥12,948 million ($97 million), respectively.
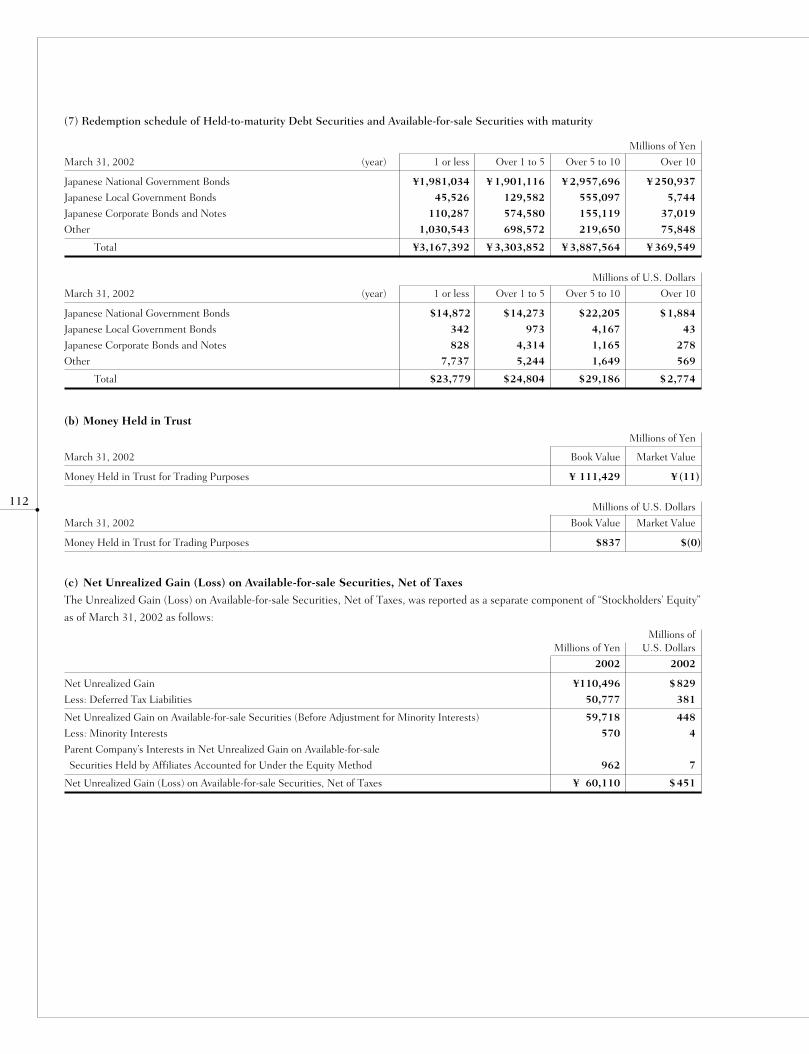
112
(7) Redemption schedule of Held-to-maturity Debt Securities and Available-for-sale Securities with maturity
Millions of Yen
March 31, 2002 (year) 1 or less Over 1 to 5 Over 5 to 10 Over 10
Japanese National Government Bonds ¥1,981,034 ¥ 1,901,116 ¥ 2,957,696 ¥ 250,937
Japanese Local Government Bonds 45,526 129,582 555,097 5,744
Japanese Corporate Bonds and Notes 110,287 574,580 155,119 37,019
Other 1,030,543 698,572 219,650 75,848
Total ¥3,167,392 ¥ 3,303,852 ¥ 3,887,564 ¥ 369,549
Millions of U.S. Dollars
March 31, 2002 (year) 1 or less Over 1 to 5 Over 5 to 10 Over 10
Japanese National Government Bonds $14,872 $14,273 $22,205 $1,884
Japanese Local Government Bonds 342 973 4,167 43
Japanese Corporate Bonds and Notes 828 4,314 1,165 278
Other 7,737 5,244 1,649 569
Total $23,779 $24,804 $29,186 $2,774
(b) Money Held in Trust
Millions of Yen
March 31, 2002 Book Value Market Value
Money Held in Trust for Trading Purposes ¥ 111,429 ¥ (11)
Millions of U.S. Dollars
March 31, 2002 Book Value Market Value
Money Held in Trust for Trading Purposes $837 $(0)
(c) Net Unrealized Gain (Loss) on Available-for-sale Securities, Net of Taxes
The Unrealized Gain (Loss) on Available-for-sale Securities, Net of Taxes, was reported as a separate component of “Stockholders’ Equity”
as of March 31, 2002 as follows:
Millions ofMillions of Yen U.S. Dollars
2002 2002
Net Unrealized Gain ¥110,496 $829
Less: Deferred Tax Liabilities 50,777 381
Net Unrealized Gain on Available-for-sale Securities (Before Adjustment for Minority Interests) 59,718 448
Less: Minority Interests 570 4
Parent Company’s Interests in Net Unrealized Gain on Available-for-sale
Securities Held by Affiliates Accounted for Under the Equity Method 962 7
Net Unrealized Gain (Loss) on Available-for-sale Securities, Net of Taxes ¥ 60,110 $451
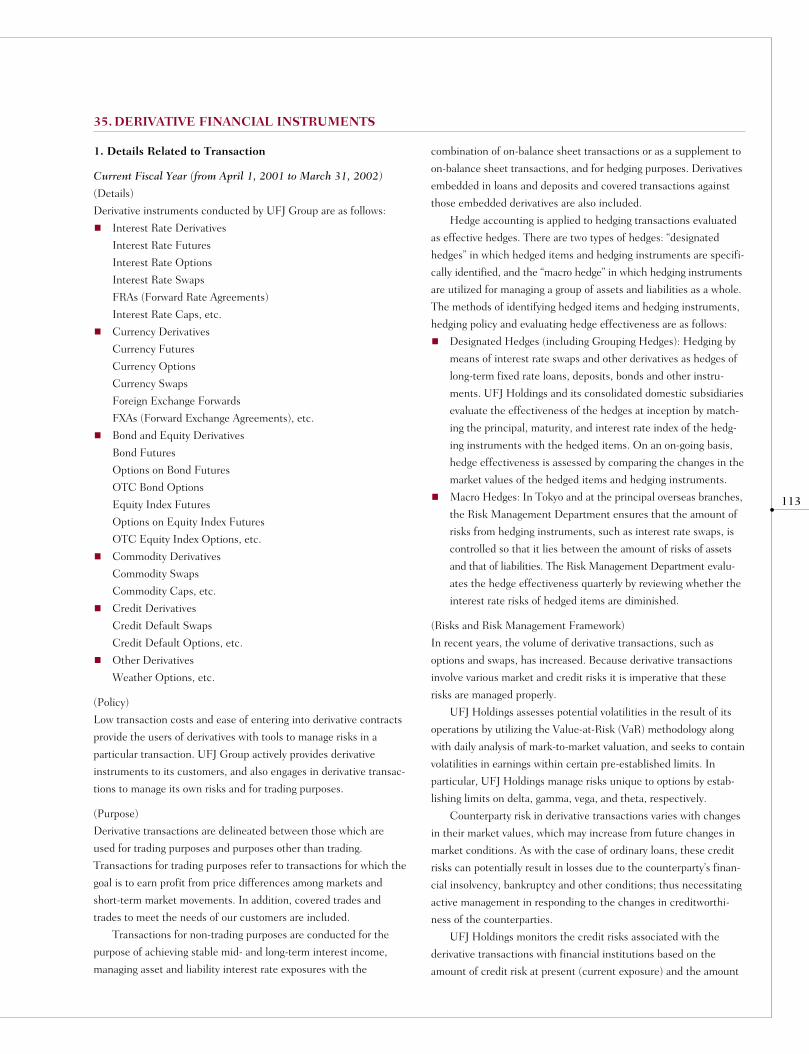
113
35. DERIVATIVE FINANCIAL INSTRUMENTS
1. Details Related to Transaction
Current Fiscal Year (from April 1, 2001 to March 31, 2002)
(Details)
Derivative instruments conducted by UFJ Group are as follows:
Interest Rate Derivatives
Interest Rate Futures
Interest Rate Options
Interest Rate Swaps
FRAs (Forward Rate Agreements)
Interest Rate Caps, etc.
Currency Derivatives
Currency Futures
Currency Options
Currency Swaps
Foreign Exchange Forwards
FXAs (Forward Exchange Agreements), etc.
Bond and Equity Derivatives
Bond Futures
Options on Bond Futures
OTC Bond Options
Equity Index Futures
Options on Equity Index Futures
OTC Equity Index Options, etc.
Commodity Derivatives
Commodity Swaps
Commodity Caps, etc.
Credit Derivatives
Credit Default Swaps
Credit Default Options, etc.
Other Derivatives
Weather Options, etc.
(Policy)
Low transaction costs and ease of entering into derivative contracts
provide the users of derivatives with tools to manage risks in a
particular transaction. UFJ Group actively provides derivative
instruments to its customers, and also engages in derivative transac-
tions to manage its own risks and for trading purposes.
(Purpose)
Derivative transactions are delineated between those which are
used for trading purposes and purposes other than trading.
Transactions for trading purposes refer to transactions for which the
goal is to earn profit from price differences among markets and
short-term market movements. In addition, covered trades and
trades to meet the needs of our customers are included.
Transactions for non-trading purposes are conducted for the
purpose of achieving stable mid- and long-term interest income,
managing asset and liability interest rate exposures with the
combination of on-balance sheet transactions or as a supplement to
on-balance sheet transactions, and for hedging purposes. Derivatives
embedded in loans and deposits and covered transactions against
those embedded derivatives are also included.
Hedge accounting is applied to hedging transactions evaluated
as effective hedges. There are two types of hedges: “designated
hedges” in which hedged items and hedging instruments are specifi-
cally identified, and the “macro hedge” in which hedging instruments
are utilized for managing a group of assets and liabilities as a whole.
The methods of identifying hedged items and hedging instruments,
hedging policy and evaluating hedge effectiveness are as follows:
Designated Hedges (including Grouping Hedges): Hedging by
means of interest rate swaps and other derivatives as hedges of
long-term fixed rate loans, deposits, bonds and other instru-
ments. UFJ Holdings and its consolidated domestic subsidiaries
evaluate the effectiveness of the hedges at inception by match-
ing the principal, maturity, and interest rate index of the hedg-
ing instruments with the hedged items. On an on-going basis,
hedge effectiveness is assessed by comparing the changes in the
market values of the hedged items and hedging instruments.
Macro Hedges: In Tokyo and at the principal overseas branches,
the Risk Management Department ensures that the amount of
risks from hedging instruments, such as interest rate swaps, is
controlled so that it lies between the amount of risks of assets
and that of liabilities. The Risk Management Department evalu-
ates the hedge effectiveness quarterly by reviewing whether the
interest rate risks of hedged items are diminished.
(Risks and Risk Management Framework)
In recent years, the volume of derivative transactions, such as
options and swaps, has increased. Because derivative transactions
involve various market and credit risks it is imperative that these
risks are managed properly.
UFJ Holdings assesses potential volatilities in the result of its
operations by utilizing the Value-at-Risk (VaR) methodology along
with daily analysis of mark-to-market valuation, and seeks to contain
volatilities in earnings within certain pre-established limits. In
particular, UFJ Holdings manage risks unique to options by estab-
lishing limits on delta, gamma, vega, and theta, respectively.
Counterparty risk in derivative transactions varies with changes
in their market values, which may increase from future changes in
market conditions. As with the case of ordinary loans, these credit
risks can potentially result in losses due to the counterparty’s finan-
cial insolvency, bankruptcy and other conditions; thus necessitating
active management in responding to the changes in creditworthi-
ness of the counterparties.
UFJ Holdings monitors the credit risks associated with the
derivative transactions with financial institutions based on the
amount of credit risk at present (current exposure) and the amount
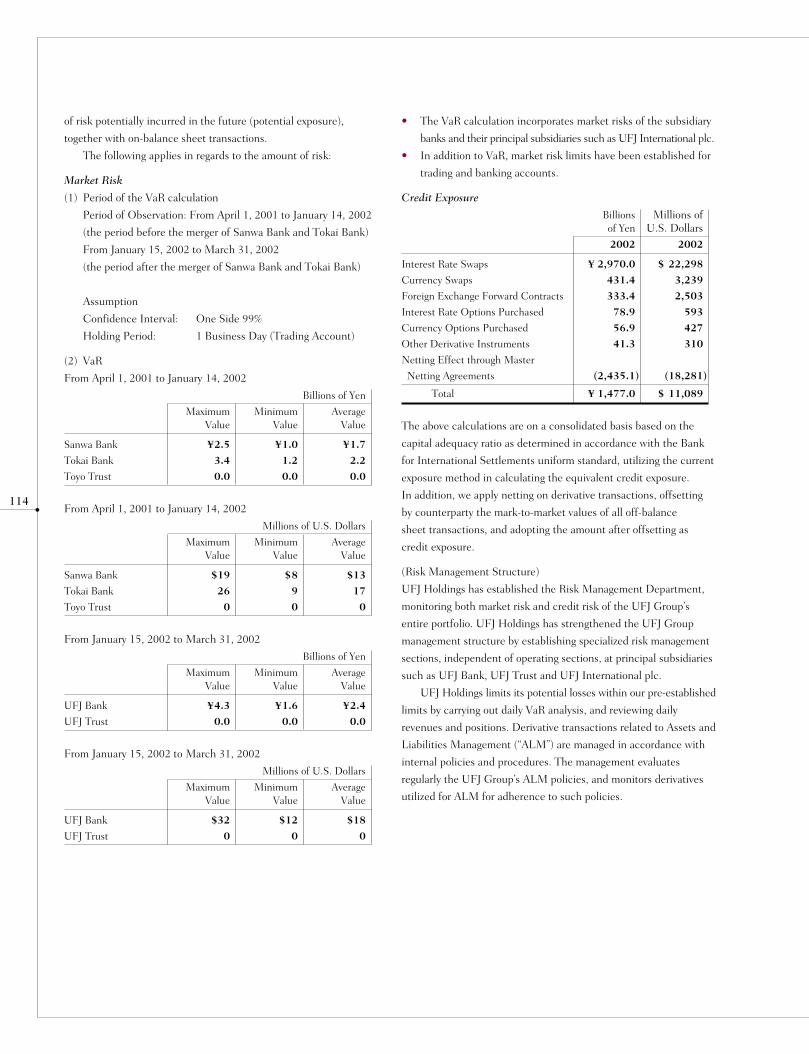
114
of risk potentially incurred in the future (potential exposure),
together with on-balance sheet transactions.
The following applies in regards to the amount of risk:
Market Risk
(1) Period of the VaR calculation
Period of Observation: From April 1, 2001 to January 14, 2002
(the period before the merger of Sanwa Bank and Tokai Bank)
From January 15, 2002 to March 31, 2002
(the period after the merger of Sanwa Bank and Tokai Bank)
Assumption
Confidence Interval: One Side 99%
Holding Period: 1 Business Day (Trading Account)
(2) VaR
From April 1, 2001 to January 14, 2002
Billions of Yen
Maximum Minimum AverageValue Value Value
Sanwa Bank ¥2.5 ¥1.0 ¥1.7
Tokai Bank 3.4 1.2 2.2
Toyo Trust 0.0 0.0 0.0
From April 1, 2001 to January 14, 2002
Millions of U.S. Dollars
Maximum Minimum AverageValue Value Value
Sanwa Bank $19 $8 $13
Tokai Bank 26 9 17
Toyo Trust 0 0 0
From January 15, 2002 to March 31, 2002
Billions of Yen
Maximum Minimum AverageValue Value Value
UFJ Bank ¥4.3 ¥1.6 ¥2.4
UFJ Trust 0.0 0.0 0.0
From January 15, 2002 to March 31, 2002
Millions of U.S. Dollars
Maximum Minimum AverageValue Value Value
UFJ Bank $32 $12 $18
UFJ Trust 0 0 0
• The VaR calculation incorporates market risks of the subsidiary
banks and their principal subsidiaries such as UFJ International plc.
• In addition to VaR, market risk limits have been established for
trading and banking accounts.
Credit Exposure
Billions Millions ofof Yen U.S. Dollars2002 2002
Interest Rate Swaps ¥ 2,970.0 $ 22,298
Currency Swaps 431.4 3,239
Foreign Exchange Forward Contracts 333.4 2,503
Interest Rate Options Purchased 78.9 593
Currency Options Purchased 56.9 427
Other Derivative Instruments 41.3 310
Netting Effect through Master
Netting Agreements (2,435.1) (18,281)
Total ¥ 1,477.0 $ 11,089
The above calculations are on a consolidated basis based on the
capital adequacy ratio as determined in accordance with the Bank
for International Settlements uniform standard, utilizing the current
exposure method in calculating the equivalent credit exposure.
In addition, we apply netting on derivative transactions, offsetting
by counterparty the mark-to-market values of all off-balance
sheet transactions, and adopting the amount after offsetting as
credit exposure.
(Risk Management Structure)
UFJ Holdings has established the Risk Management Department,
monitoring both market risk and credit risk of the UFJ Group’s
entire portfolio. UFJ Holdings has strengthened the UFJ Group
management structure by establishing specialized risk management
sections, independent of operating sections, at principal subsidiaries
such as UFJ Bank, UFJ Trust and UFJ International plc.
UFJ Holdings limits its potential losses within our pre-established
limits by carrying out daily VaR analysis, and reviewing daily
revenues and positions. Derivative transactions related to Assets and
Liabilities Management (“ALM”) are managed in accordance with
internal policies and procedures. The management evaluates
regularly the UFJ Group’s ALM policies, and monitors derivatives
utilized for ALM for adherence to such policies.

115
2. Information on Market Values of Derivative Financial InstrumentsContractual or notional amounts, market values or estimated market values and unrealized gain (loss) on derivative financial instruments as of
March 31, 2002, are shown in the following tables:
(a) Interest Rate Derivatives
Millions of Yen
2002
Contractual or Notional Amounts
Over Market UnrealizedOne Year Values Gain (Loss)
Listed:
Interest Rate Futures
Sold ¥17,115,026 ¥ 3,359,873 ¥ (65,319) ¥ (65,319)
Bought 16,718,903 2,993,223 38,765 38,765
Interest Rate Options
Sold 10,118,765 111,465 13,109 (2,109)
Bought 6,892,065 126,501 12,098 4,154
Over-the-counter:
Forward Rate Agreements
Sold 2,955,364 1,166,750 403 403
Bought 3,327,780 932,668 (1,998) (1,998)
Interest Rate Swaps
Receipts Fixed / Payments Fixed 1,620 1,620 51 51
Receipts Fixed / Payments Floating 90,090,046 62,468,018 1,426,225 1,426,225
Receipts Floating / Payments Fixed 89,682,658 61,208,721 (1,389,233) (1,389,233)
Receipts Floating / Payments Floating 7,345,246 6,167,126 (162) (162)
Other
Sold 5,449,007 3,896,392 27,223 8,787
Bought 4,979,859 3,722,621 51,844 29,430
Total / / ¥ 32,343 ¥ 48,995
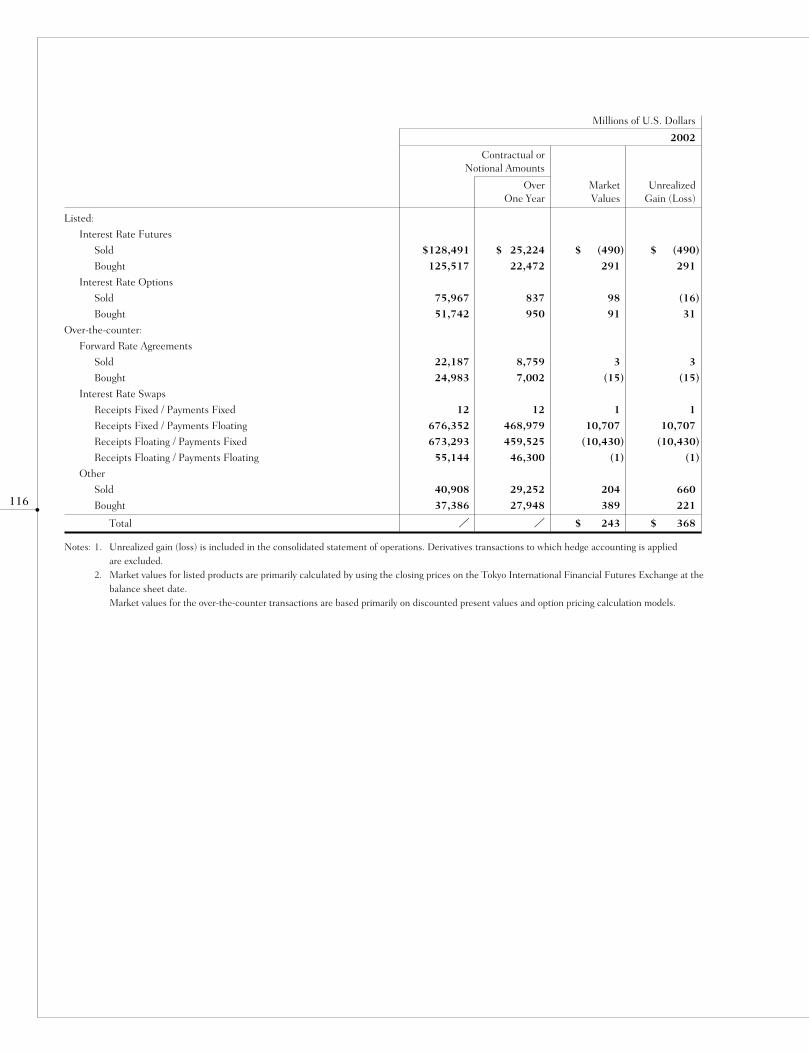
116
Millions of U.S. Dollars
2002
Contractual or Notional Amounts
Over Market UnrealizedOne Year Values Gain (Loss)
Listed:
Interest Rate Futures
Sold $128,491 $ 25,224 $ (490) $ (490)
Bought 125,517 22,472 291 291
Interest Rate Options
Sold 75,967 837 98 (16)
Bought 51,742 950 91 31
Over-the-counter:
Forward Rate Agreements
Sold 22,187 8,759 3 3
Bought 24,983 7,002 (15) (15)
Interest Rate Swaps
Receipts Fixed / Payments Fixed 12 12 1 1
Receipts Fixed / Payments Floating 676,352 468,979 10,707 10,707
Receipts Floating / Payments Fixed 673,293 459,525 (10,430) (10,430)
Receipts Floating / Payments Floating 55,144 46,300 (1) (1)
Other
Sold 40,908 29,252 204 660
Bought 37,386 27,948 389 221
Total / / $ 243 $ 368
Notes: 1. Unrealized gain (loss) is included in the consolidated statement of operations. Derivatives transactions to which hedge accounting is applied are excluded.
2. Market values for listed products are primarily calculated by using the closing prices on the Tokyo International Financial Futures Exchange at thebalance sheet date.Market values for the over-the-counter transactions are based primarily on discounted present values and option pricing calculation models.

117
(b) Currency Derivatives
Millions of Yen
Contractual or Notional Amounts
Over Market UnrealizedMarch 31, 2002 One Year Values Gain (Loss)
Over-the-counter:
Currency Swaps ¥6,287,501 ¥ 4,539,717 ¥ (49,288) ¥ (49,288)
Millions of U.S. Dollars
Contractual or Notional Amounts
Over Market UnrealizedMarch 31, 2002 One Year Values Gain (Loss)
Over-the-counter:
Currency Swaps $47,203 $34,082 $(370) $(370)
Notes: 1. Unrealized gain (loss) is included in the consolidated statement of operations. Derivatives transactions to which hedge accounting is applied andtransactions stated in the Note 3 are excluded.
2. Market values for the over-the-counter transactions are based primarily on discounted present values.3. Certain currency swaps have been excluded from the above tables since such currency swaps have been accounted for using the accrual method of
accounting in accordance with “Temporary Treatment for Accounting and Auditing of ‘Revised Accounting for Foreign Currency Transaction’ inBanking Industry” (JICPA April 10, 1999).The contractual amounts, market values and unrealized gain (loss) of currency swaps accounted for using the accrual method are as follows:
Millions of Yen
Contractual or Market UnrealizedMarch 31, 2002 Notional Amounts Values Gain (Loss)
Currency Swaps ¥606,609 ¥(5,109) ¥(5,109)
Millions of U.S. Dollars
Contractual or Market UnrealizedMarch 31, 2002 Notional Amounts Values Gain (Loss)
Currency Swaps $4,554 $ (38) $ (38)
Foreign exchange forward contracts, currency options and certain other transactions are excluded from the above tables since they are revalued atthe end of the fiscal year and their gains and losses are recorded in the consolidated statement of operations, or included in receivables/payableswhich are reflected in the consolidated balance sheet or eliminated in the consolidation process. The following table shows the contractualamounts of currency related transactions included in the consolidated statement of operations through revaluation at the end of the fiscal year:
Millions of Yen
Contractual or March 31, 2002 Notional Amounts
Listed:
Currency Futures
Sold ¥ 1,290
Bought —
Over-the-counter:
Foreign Exchange Forward Contracts
Sold 4,904,472
Bought 6,051,811
Currency Options
Sold 1,494,556
Bought 1,664,564
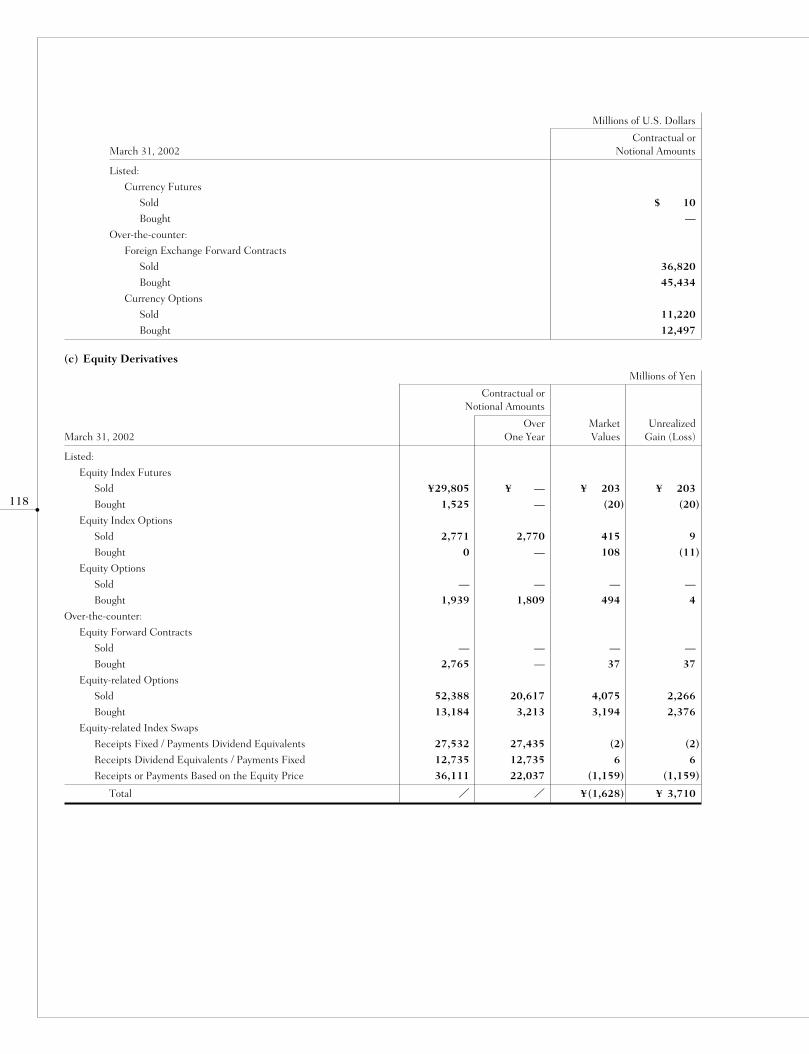
118
Millions of U.S. Dollars
Contractual or March 31, 2002 Notional Amounts
Listed:
Currency Futures
Sold $ 10
Bought —
Over-the-counter:
Foreign Exchange Forward Contracts
Sold 36,820
Bought 45,434
Currency Options
Sold 11,220
Bought 12,497
(c) Equity Derivatives
Millions of Yen
Contractual or Notional Amounts
Over Market UnrealizedMarch 31, 2002 One Year Values Gain (Loss)
Listed:
Equity Index Futures
Sold ¥29,805 ¥ — ¥ 203 ¥ 203
Bought 1,525 — (20) (20)
Equity Index Options
Sold 2,771 2,770 415 9
Bought 0 — 108 (11)
Equity Options
Sold — — — —
Bought 1,939 1,809 494 4
Over-the-counter:
Equity Forward Contracts
Sold — — — —
Bought 2,765 — 37 37
Equity-related Options
Sold 52,388 20,617 4,075 2,266
Bought 13,184 3,213 3,194 2,376
Equity-related Index Swaps
Receipts Fixed / Payments Dividend Equivalents 27,532 27,435 (2) (2)
Receipts Dividend Equivalents / Payments Fixed 12,735 12,735 6 6
Receipts or Payments Based on the Equity Price 36,111 22,037 (1,159) (1,159)
Total / / ¥(1,628) ¥ 3,710

119
Millions of U.S. Dollars
Contractual or Notional Amounts
Over Market UnrealizedMarch 31, 2002 One Year Values Gain (Loss)
Listed:
Equity Index Futures
Sold $224 $ — $ 2 $ 2
Bought 11 — (0) (0)
Equity Index Options
Sold 21 21 3 0
Bought 0 — 1 (0)
Equity Options
Sold — — — —
Bought 15 14 4 0
Over-the-counter:
Equity Forward Contracts
Sold — — — —
Bought 21 — 0 0
Equity-related Options
Sold 393 155 31 17
Bought 99 24 24 18
Equity-related Index Swaps
Receipts Fixed / Payments Dividend Equivalents 207 206 (0) (0)
Receipts Dividend Equivalents / Payments Fixed 96 96 0 0
Receipts or Payments Based on the Equity Price 271 165 (9) (9)
Total / / $(12) $28
Notes: 1. Unrealized gain (loss) is included in the consolidated statement of operations. Derivatives transactions to which hedge accounting is applied are excluded.2. Market values for listed products are calculated using the closing prices of the Tokyo Stock Exchange and others at the balance sheet date.
Market values for the over-the-counter transaction are based primarily on discounted present values and option pricing calculation models.
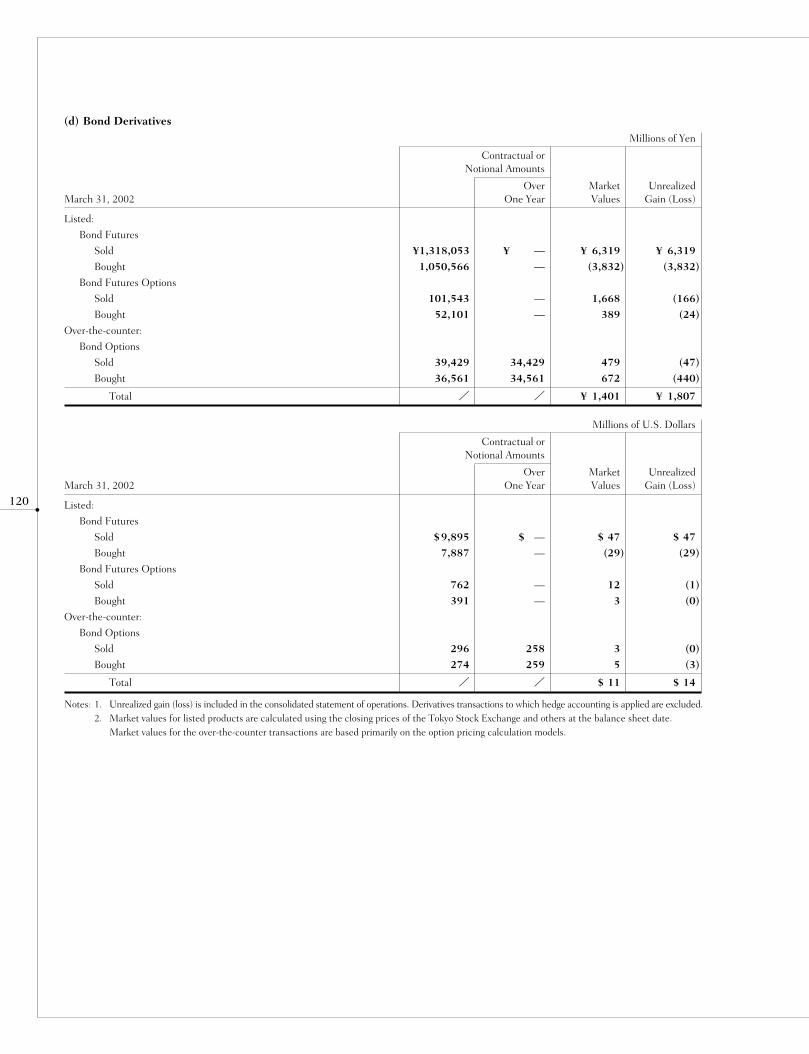
120
(d) Bond Derivatives
Millions of Yen
Contractual or Notional Amounts
Over Market UnrealizedMarch 31, 2002 One Year Values Gain (Loss)
Listed:
Bond Futures
Sold ¥1,318,053 ¥ — ¥ 6,319 ¥ 6,319
Bought 1,050,566 — (3,832) (3,832)
Bond Futures Options
Sold 101,543 — 1,668 (166)
Bought 52,101 — 389 (24)
Over-the-counter:
Bond Options
Sold 39,429 34,429 479 (47)
Bought 36,561 34,561 672 (440)
Total / / ¥ 1,401 ¥ 1,807
Millions of U.S. Dollars
Contractual or Notional Amounts
Over Market UnrealizedMarch 31, 2002 One Year Values Gain (Loss)
Listed:
Bond Futures
Sold $9,895 $ — $ 47 $ 47
Bought 7,887 — (29) (29)
Bond Futures Options
Sold 762 — 12 (1)
Bought 391 — 3 (0)
Over-the-counter:
Bond Options
Sold 296 258 3 (0)
Bought 274 259 5 (3)
Total / / $ 11 $ 14
Notes: 1. Unrealized gain (loss) is included in the consolidated statement of operations. Derivatives transactions to which hedge accounting is applied are excluded.2. Market values for listed products are calculated using the closing prices of the Tokyo Stock Exchange and others at the balance sheet date.
Market values for the over-the-counter transactions are based primarily on the option pricing calculation models.

121
(e) Commodity Derivatives
Millions of Yen
Contractual or Notional Amounts
Over Market UnrealizedMarch 31, 2002 One Year Values Gain (Loss)
Over-the-counter:
Commodity Swaps (Fuel) ¥13,707 ¥2,343 ¥58 ¥58
Millions of U.S. Dollars
Contractual or Notional Amounts
Over Market UnrealizedMarch 31, 2002 One Year Values Gain (Loss)
Over-the-counter:
Commodity Swaps (Fuel) $103 $18 $0 $0
Notes: 1. Unrealized gain (loss) is included in the consolidated statement of operations. Derivatives transactions to which hedge accounting is applied are excluded.2. Market values are calculated by using the quoted prices of the commodity, contractual term or other contractual elements.
(f) Credit Derivatives
Millions of Yen
Contractual or Notional Amounts
Over Market UnrealizedMarch 31, 2002 One Year Values Gain (Loss)
Over-the-counter:
Credit Default Swaps
Sold ¥ 73,022 ¥58,644 ¥(171) ¥(171)
Bought 507,315 67,000 429 429
Credit Default Options
Sold 18,249 8,958 146 129
Bought 20,242 9,310 165 (115)
Total / / ¥ 277 ¥ 272
Millions of U.S. Dollars
Contractual or Notional Amounts
Over Market UnrealizedMarch 31, 2002 One Year Values Gain (Loss)
Over-the-counter:
Credit Default Swaps
Sold $ 548 $440 $(1) $(1)
Bought 3,809 503 3 3
Credit Default Options
Sold 137 67 1 1
Bought 152 70 1 (1)
Total / / $ 2 $ 2
Notes: 1. Unrealized gain (loss) is included in the consolidated statement of operations. Derivatives transactions to which hedge accounting is applied are excluded.2. Market values are based primarily on the discounted present values.3. ‘Sold’ means the underwriting of credit risk and ‘Bought’ means the transferring of credit risk.

122
(g) Other Derivatives
Millions of Yen
Contractual or Notional Amounts
Over Market UnrealizedMarch 31, 2002 One Year Values Gain (Loss)
Over-the-counter:
Weather Options
Sold ¥1,040 ¥ — ¥ 49 ¥124
Bought 715 — 25 (31)
Total / / ¥ (23) ¥ 93
Millions of U.S. Dollars
Contractual or Notional Amounts
Over Market UnrealizedMarch 31, 2002 One Year Values Gain (Loss)
Over-the-counter:
Weather Options
Sold $8 $ — $ 0 $ 1
Bought 5 — 0 (0)
Total / / $(0) $ 1
Notes: 1. Unrealized gain (loss) is included in the consolidated statement of operations. Derivatives transactions to which hedge accounting is applied are excluded.2. Market values are based primarily on the discounted present values.
36. SEGMENT INFORMATION
(a) Segment Information by Business Lines
The following tables present profits and assets of UFJ Group by business lines, based on internal management reporting.
Millions of Yen
Banking/
Year ended March 31, 2002 Trust Business Leasing Other Total Eliminations Consolidated
Ordinary Income:
Outside Customers ¥ 2,619,801 ¥216,183 ¥ 234,825 ¥ 3,070,810 ¥ — ¥ 3,070,810
Inter-Business Transfers 39,203 13,183 143,378 195,765 (195,765) —
2,659,004 229,367 378,203 3,266,575 (195,765) 3,070,810
Ordinary Expenses 4,275,795 231,271 290,499 4,797,566 (123,029) 4,674,536
Ordinary Profit (Loss) ¥ (1,616,790) ¥ (1,903) ¥ 87,703 ¥ (1,530,990) ¥ (72,735) ¥ (1,603,726)
Assets ¥76,635,442 ¥685,360 ¥8,436,045 ¥85,756,848 ¥(5,983,867) ¥79,772,980
Depreciation 62,043 421 4,772 67,238 — 67,238
Capital Expenditures 146,331 768 6,813 153,913 — 153,913

123
Millions of U.S. Dollars
Banking/
Year ended March 31, 2002 Trust Business Leasing Other Total Eliminations Consolidated
Ordinary Income:
Outside Customers $ 19,668 $1,623 $ 1,763 $ 23,054 $ — $ 23,054
Inter-Business Transfers 294 99 1,076 1,469 (1,469) —
19,962 1,722 2,839 24,523 (1,469) 23,054
Ordinary Expenses 32,100 1,736 2,181 36,017 (923) 35,094
Ordinary Profit (Loss) $(12,138) $ (14) $ 658 $ (11,494) $ (546) $ (12,040)
Assets $575,341 $5,145 $63,334 $643,820 $(44,924) $ 598,896
Depreciation 466 3 36 505 — 505
Capital Expenditures 1,099 6 51 1,156 — 1,156
Notes: 1. Ordinary Income represents “Total Revenues” less certain items such as “Gains on Sales of Premises and Equipment” and “Collection of Written-off Claims.” Ordinary Expense represents “Total Expenses” less certain items such as “Losses on Sales of Premises and Equipment” and“Amortization of Net Transitional Obligation for Employee Retirement Benefits.”
2. “Other” business lines include securities, credit card, financing, venture capital, investment trust management and investment advisory business.
(b) Segment Information by Geographic Areas
The following tables present profits and assets relating to international and domestic operations of UFJ Group by major geographic areas, as
determined by proximity, similarity of economic activities, and relationships of operations by location.
Millions of Yen
Asia/Oceania
Year ended March 31, 2002 Japan Americas Europe Excluding Japan Total Eliminations Consolidated
Ordinary Income:
Outside Customers ¥ 2,456,445 ¥ 272,237 ¥ 164,010 ¥ 178,117 ¥ 3,070,810 ¥ — ¥ 3,070,810
Inter-Area Transfers 223,990 95,029 9,082 71,610 399,712 (399,712) —
2,680,435 367,266 173,092 249,728 3,470,523 (399,712) 3,070,810
Ordinary Expenses 4,288,313 328,552 168,355 255,547 5,040,768 (366,231) 4,674,536
Ordinary Profit (Loss) ¥ (1,607,877) ¥ 38,713 ¥ 4,737 ¥ (5,819) ¥ (1,570,245) ¥ (33,480) ¥ (1,603,726)
Assets ¥74,811,763 ¥4,199,638 ¥3,152,883 ¥4,423,886 ¥86,588,171 ¥(6,815,191) ¥79,772,980
Millions of U.S. Dollars
Asia/Oceania
Year ended March 31, 2002 Japan Americas Europe Excluding Japan Total Eliminations Consolidated
Ordinary Income:Outside Customers $ 18,442 $ 2,044 $ 1,231 $ 1,337 $ 23,054 $ — $ 23,054
Inter-Area Transfers 1,681 714 68 538 3,001 (3,001) —
20,123 2,758 1,299 1,875 26,055 (3,001) 23,054
Ordinary Expenses 32,194 2,467 1,264 1,919 37,844 (2,750) 35,094
Ordinary Profit (Loss) $ (12,071) $ 291 $ 35 $ (44) $ (11,789) $ (251) $ (12,040)
Assets $561,650 $31,529 $23,670 $33,212 $650,061 $(51,165) $598,896
Notes: 1. Ordinary Income represents “Total Revenues” less certain items such as “Gains on Sales of Premises and Equipment” and “Collection of Written-off Claims.” Ordinary Expense represents “Total Expenses” less certain items such as “Losses on Sales of Premises and Equipment” and“Amortization of Net Transitional Obligation for Employee Retirement Benefits.”
2. “Americas” includes the United States and Canada. “Europe” includes United Kingdom and Germany. “Asia/Oceania Excluding Japan” includesHong Kong, Singapore and Australia.

124
(c) Ordinary Income from Overseas Operations
Millions ofMillions of Yen U.S. Dollars
2002 2002
Ordinary Income from Overseas Operations ¥ 614,364 $ 4,612
Consolidated Ordinary Income 3,070,810 23,054
Ratio of Ordinary Income from Overseas Operations to Consolidated Ordinary Income 20.0% 20.0%
Notes: 1. Ordinary Income from Overseas Operations is presented as a substitute for “Overseas Sales” utilized by non-financial companies.2. Ordinary Income from Overseas Operations primarily includes ordinary income from domestic transactions in foreign currencies, and from
transactions of the UFJ Bank’s overseas branches and of consolidated overseas subsidiaries (excluding ordinary income from intercompany transactions).Segment Information for Ordinary Income from Overseas Operations by location is not presented since the counterparties to the large number oftransactions are not classified by location.
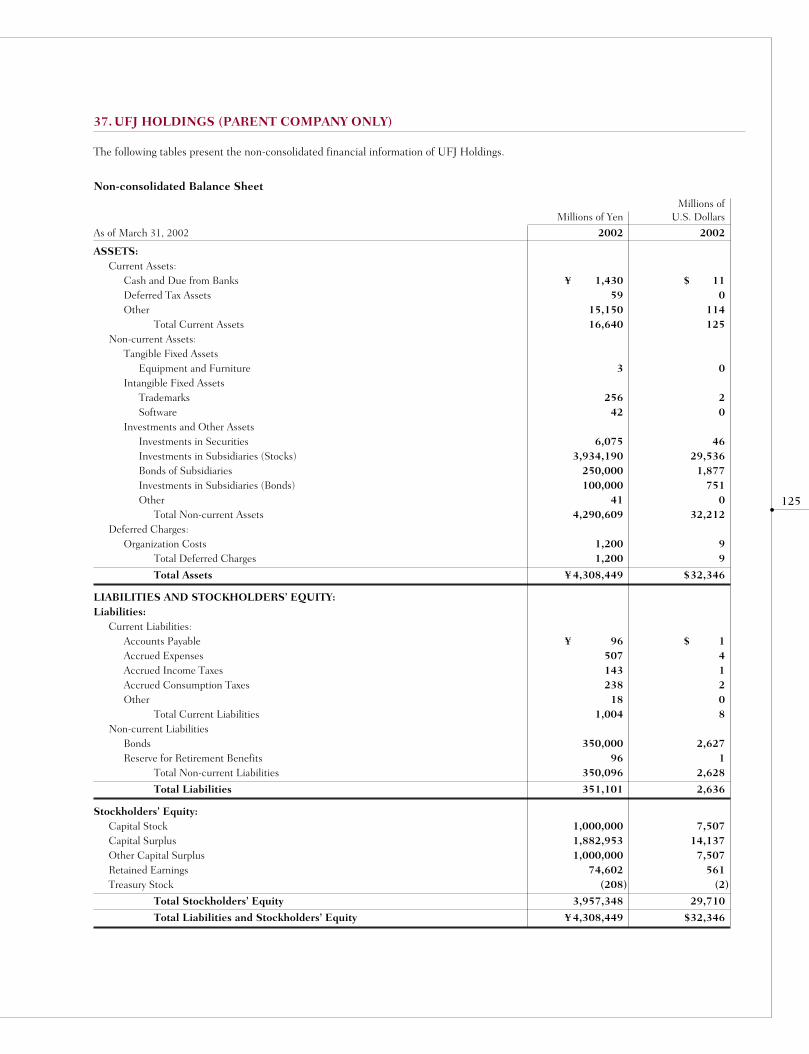
125
37. UFJ HOLDINGS (PARENT COMPANY ONLY)
The following tables present the non-consolidated financial information of UFJ Holdings.
Non-consolidated Balance Sheet
Millions ofMillions of Yen U.S. Dollars
As of March 31, 2002 2002 2002
ASSETS:Current Assets:
Cash and Due from Banks ¥ 1,430 $ 11Deferred Tax Assets 59 0Other 15,150 114
Total Current Assets 16,640 125Non-current Assets:
Tangible Fixed AssetsEquipment and Furniture 3 0
Intangible Fixed AssetsTrademarks 256 2Software 42 0
Investments and Other AssetsInvestments in Securities 6,075 46Investments in Subsidiaries (Stocks) 3,934,190 29,536Bonds of Subsidiaries 250,000 1,877Investments in Subsidiaries (Bonds) 100,000 751Other 41 0
Total Non-current Assets 4,290,609 32,212Deferred Charges:
Organization Costs 1,200 9Total Deferred Charges 1,200 9
Total Assets ¥ 4,308,449 $32,346
LIABILITIES AND STOCKHOLDERS’ EQUITY:Liabilities:
Current Liabilities:Accounts Payable ¥ 96 $ 1Accrued Expenses 507 4Accrued Income Taxes 143 1Accrued Consumption Taxes 238 2Other 18 0
Total Current Liabilities 1,004 8Non-current Liabilities
Bonds 350,000 2,627Reserve for Retirement Benefits 96 1
Total Non-current Liabilities 350,096 2,628
Total Liabilities 351,101 2,636
Stockholders’ Equity:Capital Stock 1,000,000 7,507Capital Surplus 1,882,953 14,137Other Capital Surplus 1,000,000 7,507Retained Earnings 74,602 561Treasury Stock (208) (2)
Total Stockholders’ Equity 3,957,348 29,710
Total Liabilities and Stockholders’ Equity ¥ 4,308,449 $32,346
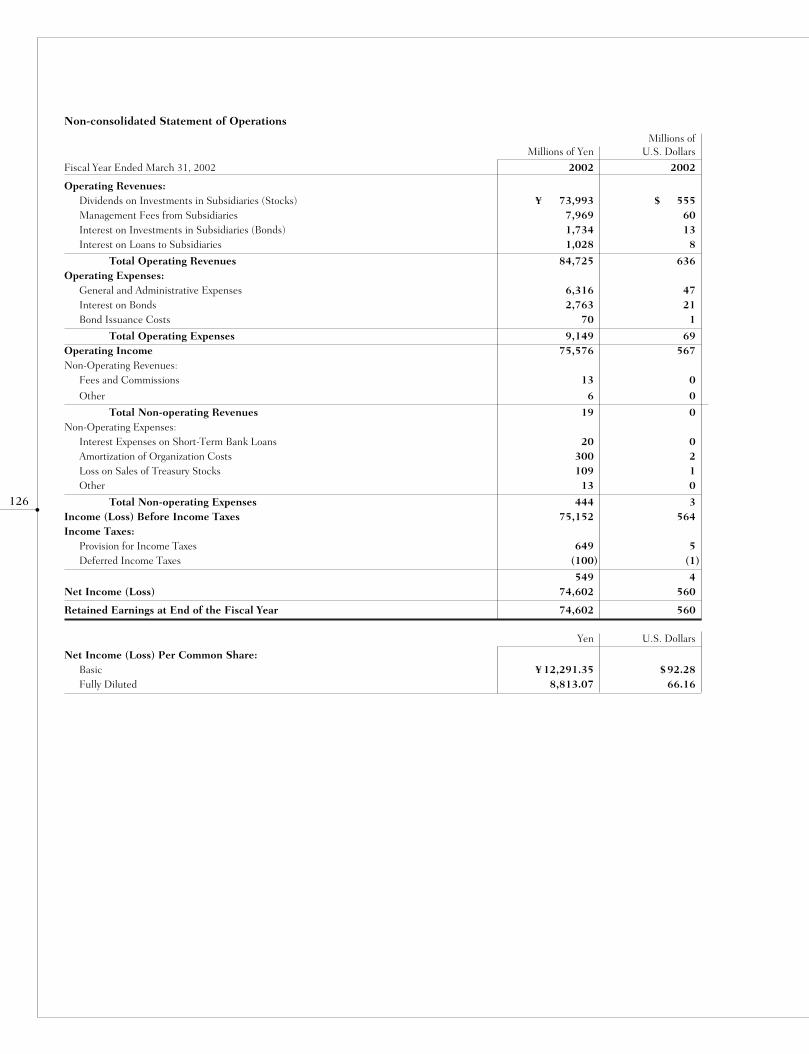
126
Non-consolidated Statement of Operations
Millions ofMillions of Yen U.S. Dollars
Fiscal Year Ended March 31, 2002 2002 2002
Operating Revenues:Dividends on Investments in Subsidiaries (Stocks) ¥ 73,993 $ 555Management Fees from Subsidiaries 7,969 60Interest on Investments in Subsidiaries (Bonds) 1,734 13Interest on Loans to Subsidiaries 1,028 8
Total Operating Revenues 84,725 636Operating Expenses:
General and Administrative Expenses 6,316 47Interest on Bonds 2,763 21Bond Issuance Costs 70 1
Total Operating Expenses 9,149 69Operating Income 75,576 567Non-Operating Revenues:
Fees and Commissions 13 0
Other 6 0
Total Non-operating Revenues 19 0Non-Operating Expenses:
Interest Expenses on Short-Term Bank Loans 20 0Amortization of Organization Costs 300 2Loss on Sales of Treasury Stocks 109 1Other 13 0
Total Non-operating Expenses 444 3Income (Loss) Before Income Taxes 75,152 564Income Taxes:
Provision for Income Taxes 649 5Deferred Income Taxes (100) (1)
549 4Net Income (Loss) 74,602 560
Retained Earnings at End of the Fiscal Year 74,602 560
Yen U.S. Dollars
Net Income (Loss) Per Common Share:Basic ¥ 12,291.35 $92.28Fully Diluted 8,813.07 66.16
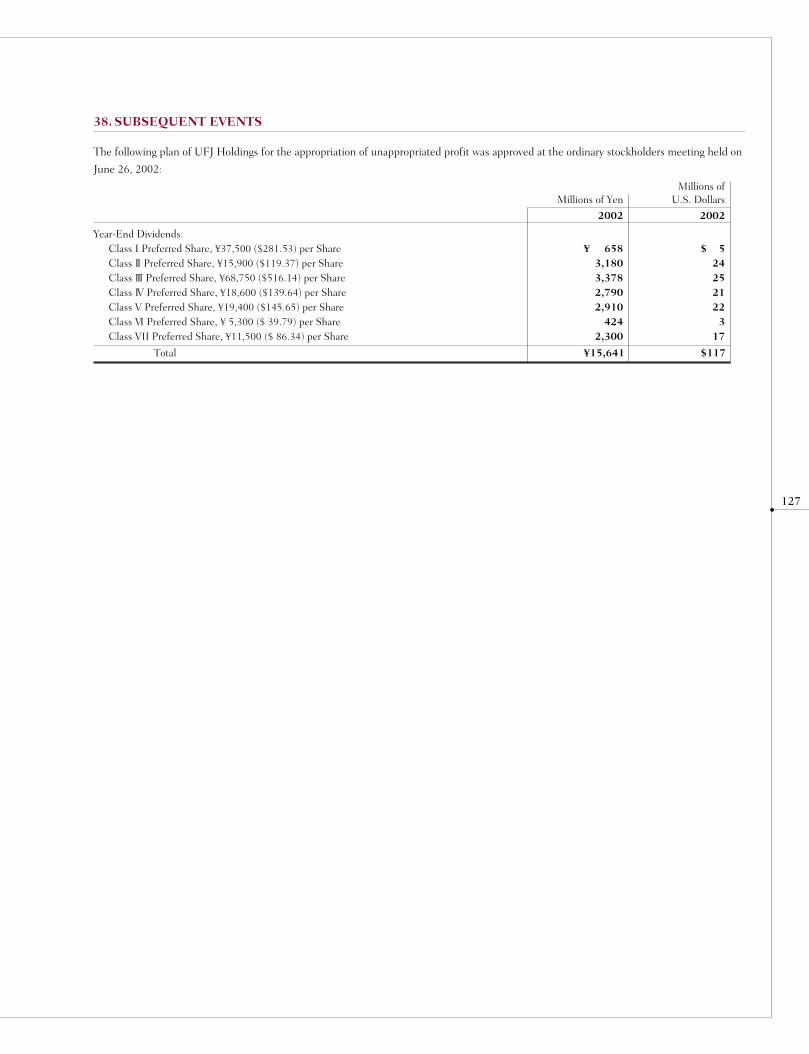
127
38. SUBSEQUENT EVENTS
The following plan of UFJ Holdings for the appropriation of unappropriated profit was approved at the ordinary stockholders meeting held on
June 26, 2002:
Millions ofMillions of Yen U.S. Dollars
2002 2002
Year-End Dividends:Class I Preferred Share, ¥37,500 ($281.53) per Share ¥ 658 $ 5Class II Preferred Share, ¥15,900 ($119.37) per Share 3,180 24Class III Preferred Share, ¥68,750 ($516.14) per Share 3,378 25Class IV Preferred Share, ¥18,600 ($139.64) per Share 2,790 21Class V Preferred Share, ¥19,400 ($145.65) per Share 2,910 22Class VI Preferred Share, ¥ 5,300 ($ 39.79) per Share 424 3Class VII Preferred Share, ¥11,500 ($ 86.34) per Share 2,300 17
Total ¥15,641 $117
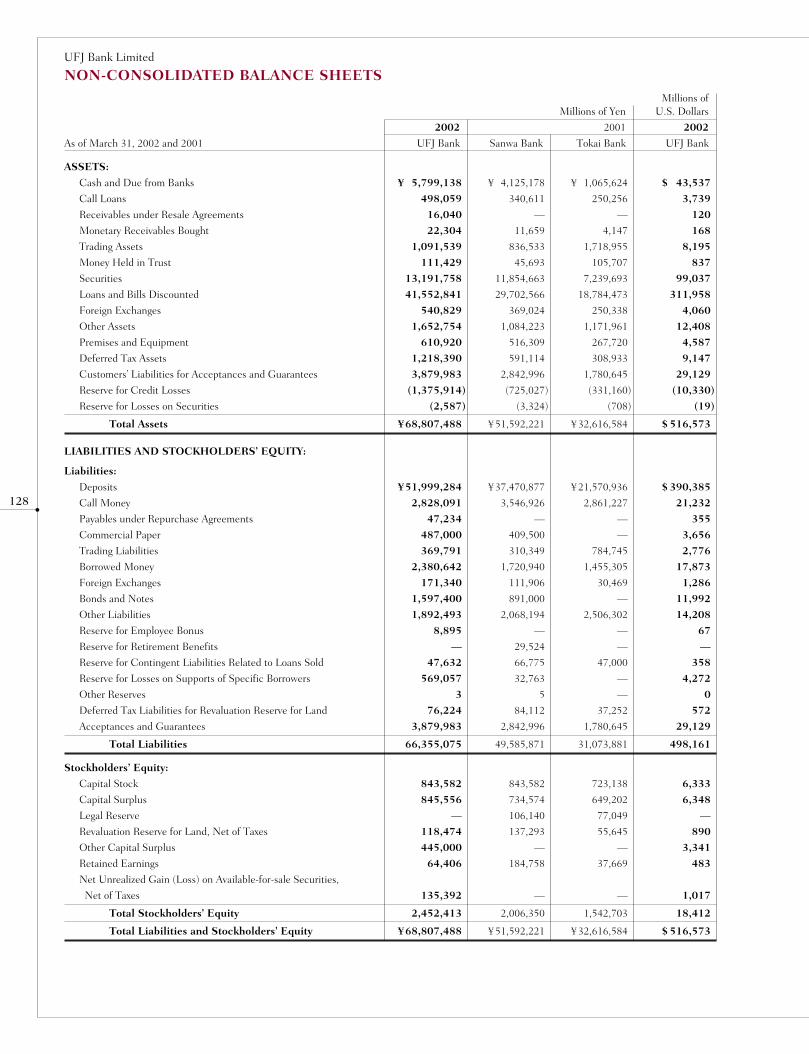
128
UFJ Bank Limited
NON-CONSOLIDATED BALANCE SHEETSMillions of
Millions of Yen U.S. Dollars
2002 2001 2002
As of March 31, 2002 and 2001 UFJ Bank Sanwa Bank Tokai Bank UFJ Bank
ASSETS:
Cash and Due from Banks ¥ 5,799,138 ¥ 4,125,178 ¥ 1,065,624 $ 43,537
Call Loans 498,059 340,611 250,256 3,739
Receivables under Resale Agreements 16,040 — — 120
Monetary Receivables Bought 22,304 11,659 4,147 168
Trading Assets 1,091,539 836,533 1,718,955 8,195
Money Held in Trust 111,429 45,693 105,707 837
Securities 13,191,758 11,854,663 7,239,693 99,037
Loans and Bills Discounted 41,552,841 29,702,566 18,784,473 311,958
Foreign Exchanges 540,829 369,024 250,338 4,060
Other Assets 1,652,754 1,084,223 1,171,961 12,408
Premises and Equipment 610,920 516,309 267,720 4,587
Deferred Tax Assets 1,218,390 591,114 308,933 9,147
Customers’ Liabilities for Acceptances and Guarantees 3,879,983 2,842,996 1,780,645 29,129
Reserve for Credit Losses (1,375,914) (725,027) (331,160) (10,330)
Reserve for Losses on Securities (2,587) (3,324) (708) (19)
Total Assets ¥68,807,488 ¥51,592,221 ¥32,616,584 $ 516,573
LIABILITIES AND STOCKHOLDERS’ EQUITY:
Liabilities:
Deposits ¥51,999,284 ¥37,470,877 ¥21,570,936 $ 390,385
Call Money 2,828,091 3,546,926 2,861,227 21,232
Payables under Repurchase Agreements 47,234 — — 355
Commercial Paper 487,000 409,500 — 3,656
Trading Liabilities 369,791 310,349 784,745 2,776
Borrowed Money 2,380,642 1,720,940 1,455,305 17,873
Foreign Exchanges 171,340 111,906 30,469 1,286
Bonds and Notes 1,597,400 891,000 — 11,992
Other Liabilities 1,892,493 2,068,194 2,506,302 14,208
Reserve for Employee Bonus 8,895 — — 67
Reserve for Retirement Benefits — 29,524 — —
Reserve for Contingent Liabilities Related to Loans Sold 47,632 66,775 47,000 358
Reserve for Losses on Supports of Specific Borrowers 569,057 32,763 — 4,272
Other Reserves 3 5 — 0
Deferred Tax Liabilities for Revaluation Reserve for Land 76,224 84,112 37,252 572
Acceptances and Guarantees 3,879,983 2,842,996 1,780,645 29,129
Total Liabilities 66,355,075 49,585,871 31,073,881 498,161
Stockholders’ Equity:
Capital Stock 843,582 843,582 723,138 6,333
Capital Surplus 845,556 734,574 649,202 6,348
Legal Reserve — 106,140 77,049 —
Revaluation Reserve for Land, Net of Taxes 118,474 137,293 55,645 890
Other Capital Surplus 445,000 — — 3,341
Retained Earnings 64,406 184,758 37,669 483
Net Unrealized Gain (Loss) on Available-for-sale Securities,
Net of Taxes 135,392 — — 1,017
Total Stockholders’ Equity 2,452,413 2,006,350 1,542,703 18,412
Total Liabilities and Stockholders’ Equity ¥68,807,488 ¥51,592,221 ¥32,616,584 $ 516,573
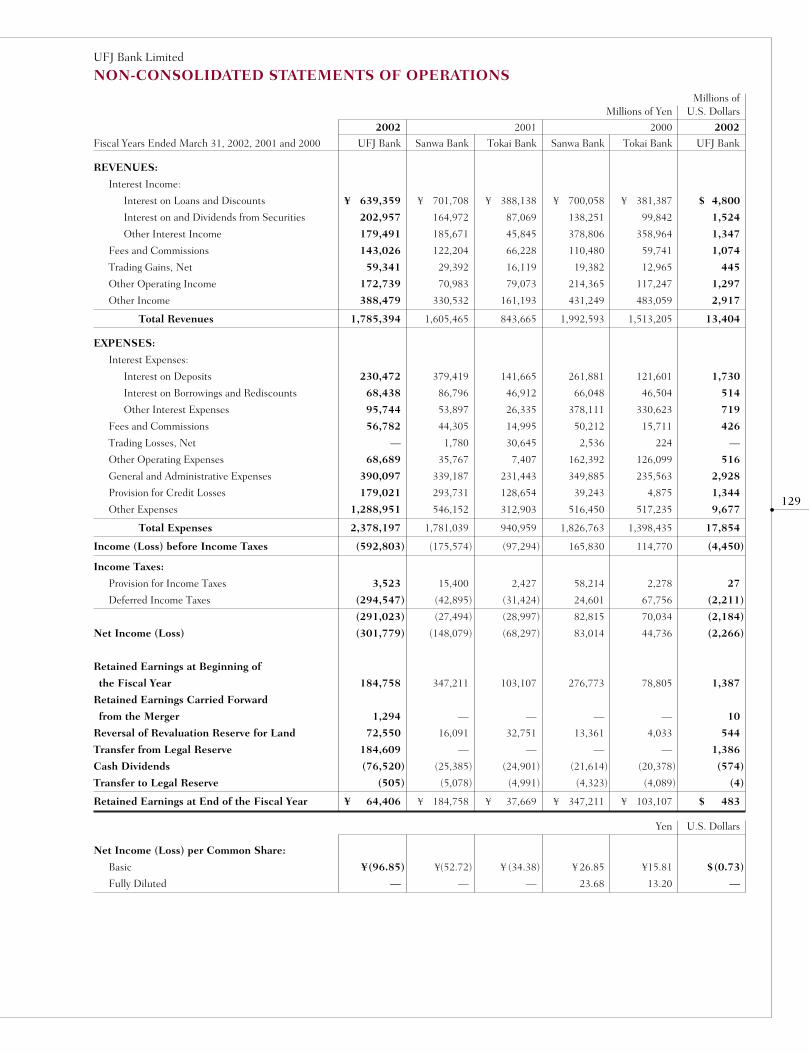
129
UFJ Bank Limited
NON-CONSOLIDATED STATEMENTS OF OPERATIONSMillions of
Millions of Yen U.S. Dollars
2002 2001 2000 2002
Fiscal Years Ended March 31, 2002, 2001 and 2000 UFJ Bank Sanwa Bank Tokai Bank Sanwa Bank Tokai Bank UFJ Bank
REVENUES:
Interest Income:
Interest on Loans and Discounts ¥ 639,359 ¥ 701,708 ¥ 388,138 ¥ 700,058 ¥ 381,387 $ 4,800
Interest on and Dividends from Securities 202,957 164,972 87,069 138,251 99,842 1,524
Other Interest Income 179,491 185,671 45,845 378,806 358,964 1,347
Fees and Commissions 143,026 122,204 66,228 110,480 59,741 1,074
Trading Gains, Net 59,341 29,392 16,119 19,382 12,965 445
Other Operating Income 172,739 70,983 79,073 214,365 117,247 1,297
Other Income 388,479 330,532 161,193 431,249 483,059 2,917
Total Revenues 1,785,394 1,605,465 843,665 1,992,593 1,513,205 13,404
EXPENSES:
Interest Expenses:
Interest on Deposits 230,472 379,419 141,665 261,881 121,601 1,730
Interest on Borrowings and Rediscounts 68,438 86,796 46,912 66,048 46,504 514
Other Interest Expenses 95,744 53,897 26,335 378,111 330,623 719
Fees and Commissions 56,782 44,305 14,995 50,212 15,711 426
Trading Losses, Net — 1,780 30,645 2,536 224 —
Other Operating Expenses 68,689 35,767 7,407 162,392 126,099 516
General and Administrative Expenses 390,097 339,187 231,443 349,885 235,563 2,928
Provision for Credit Losses 179,021 293,731 128,654 39,243 4,875 1,344
Other Expenses 1,288,951 546,152 312,903 516,450 517,235 9,677
Total Expenses 2,378,197 1,781,039 940,959 1,826,763 1,398,435 17,854
Income (Loss) before Income Taxes (592,803) (175,574) (97,294) 165,830 114,770 (4,450)
Income Taxes:
Provision for Income Taxes 3,523 15,400 2,427 58,214 2,278 27
Deferred Income Taxes (294,547) (42,895) (31,424) 24,601 67,756 (2,211)
(291,023) (27,494) (28,997) 82,815 70,034 (2,184)
Net Income (Loss) (301,779) (148,079) (68,297) 83,014 44,736 (2,266)
Retained Earnings at Beginning of
the Fiscal Year 184,758 347,211 103,107 276,773 78,805 1,387
Retained Earnings Carried Forward
from the Merger 1,294 — — — — 10
Reversal of Revaluation Reserve for Land 72,550 16,091 32,751 13,361 4,033 544
Transfer from Legal Reserve 184,609 — — — — 1,386
Cash Dividends (76,520) (25,385) (24,901) (21,614) (20,378) (574)
Transfer to Legal Reserve (505) (5,078) (4,991) (4,323) (4,089) (4)
Retained Earnings at End of the Fiscal Year ¥ 64,406 ¥ 184,758 ¥ 37,669 ¥ 347,211 ¥ 103,107 $ 483
Yen U.S. Dollars
Net Income (Loss) per Common Share:
Basic ¥(96.85) ¥(52.72) ¥ (34.38) ¥ 26.85 ¥15.81 $(0.73)
Fully Diluted — — — 23.68 13.20 —
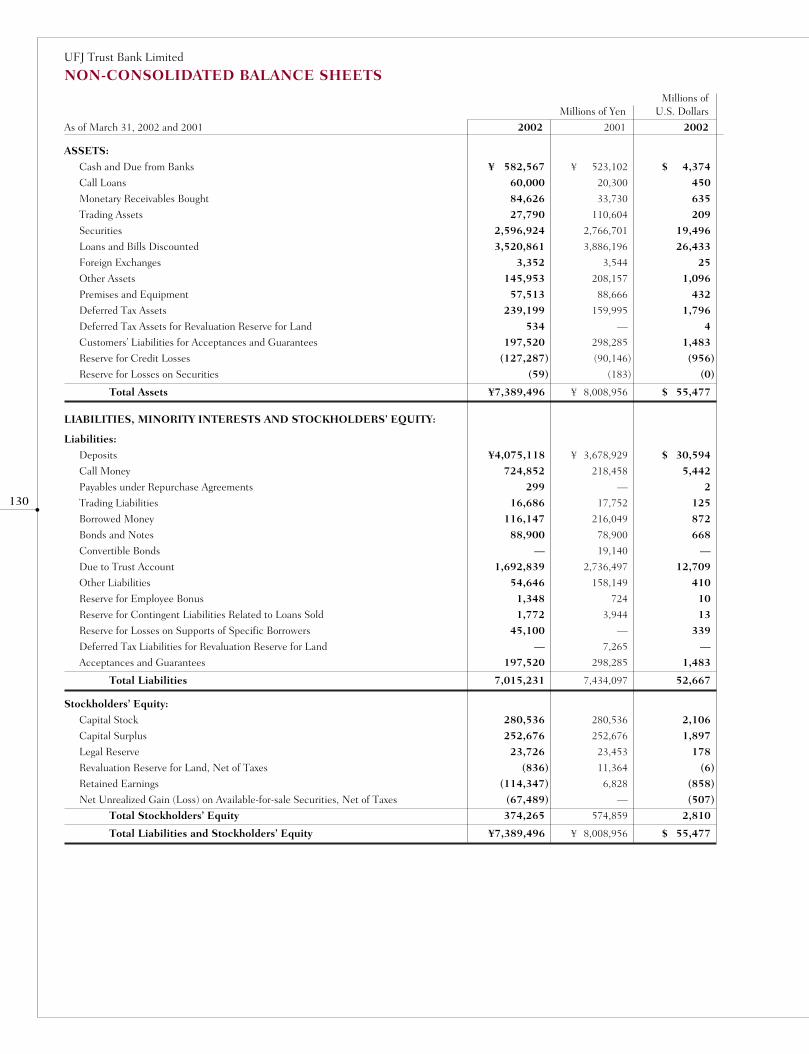
130
UFJ Trust Bank Limited
NON-CONSOLIDATED BALANCE SHEETSMillions of
Millions of Yen U.S. Dollars
As of March 31, 2002 and 2001 2002 2001 2002
ASSETS:
Cash and Due from Banks ¥ 582,567 ¥ 523,102 $ 4,374
Call Loans 60,000 20,300 450
Monetary Receivables Bought 84,626 33,730 635
Trading Assets 27,790 110,604 209
Securities 2,596,924 2,766,701 19,496
Loans and Bills Discounted 3,520,861 3,886,196 26,433
Foreign Exchanges 3,352 3,544 25
Other Assets 145,953 208,157 1,096
Premises and Equipment 57,513 88,666 432
Deferred Tax Assets 239,199 159,995 1,796
Deferred Tax Assets for Revaluation Reserve for Land 534 — 4
Customers’ Liabilities for Acceptances and Guarantees 197,520 298,285 1,483
Reserve for Credit Losses (127,287) (90,146) (956)
Reserve for Losses on Securities (59) (183) (0)
Total Assets ¥7,389,496 ¥ 8,008,956 $ 55,477
LIABILITIES, MINORITY INTERESTS AND STOCKHOLDERS’ EQUITY:
Liabilities:
Deposits ¥4,075,118 ¥ 3,678,929 $ 30,594
Call Money 724,852 218,458 5,442
Payables under Repurchase Agreements 299 — 2
Trading Liabilities 16,686 17,752 125
Borrowed Money 116,147 216,049 872
Bonds and Notes 88,900 78,900 668
Convertible Bonds — 19,140 —
Due to Trust Account 1,692,839 2,736,497 12,709
Other Liabilities 54,646 158,149 410
Reserve for Employee Bonus 1,348 724 10
Reserve for Contingent Liabilities Related to Loans Sold 1,772 3,944 13
Reserve for Losses on Supports of Specific Borrowers 45,100 — 339
Deferred Tax Liabilities for Revaluation Reserve for Land — 7,265 —
Acceptances and Guarantees 197,520 298,285 1,483
Total Liabilities 7,015,231 7,434,097 52,667
Stockholders’ Equity:
Capital Stock 280,536 280,536 2,106
Capital Surplus 252,676 252,676 1,897
Legal Reserve 23,726 23,453 178
Revaluation Reserve for Land, Net of Taxes (836) 11,364 (6)
Retained Earnings (114,347) 6,828 (858)
Net Unrealized Gain (Loss) on Available-for-sale Securities, Net of Taxes (67,489) — (507)
Total Stockholders’ Equity 374,265 574,859 2,810
Total Liabilities and Stockholders’ Equity ¥7,389,496 ¥ 8,008,956 $ 55,477
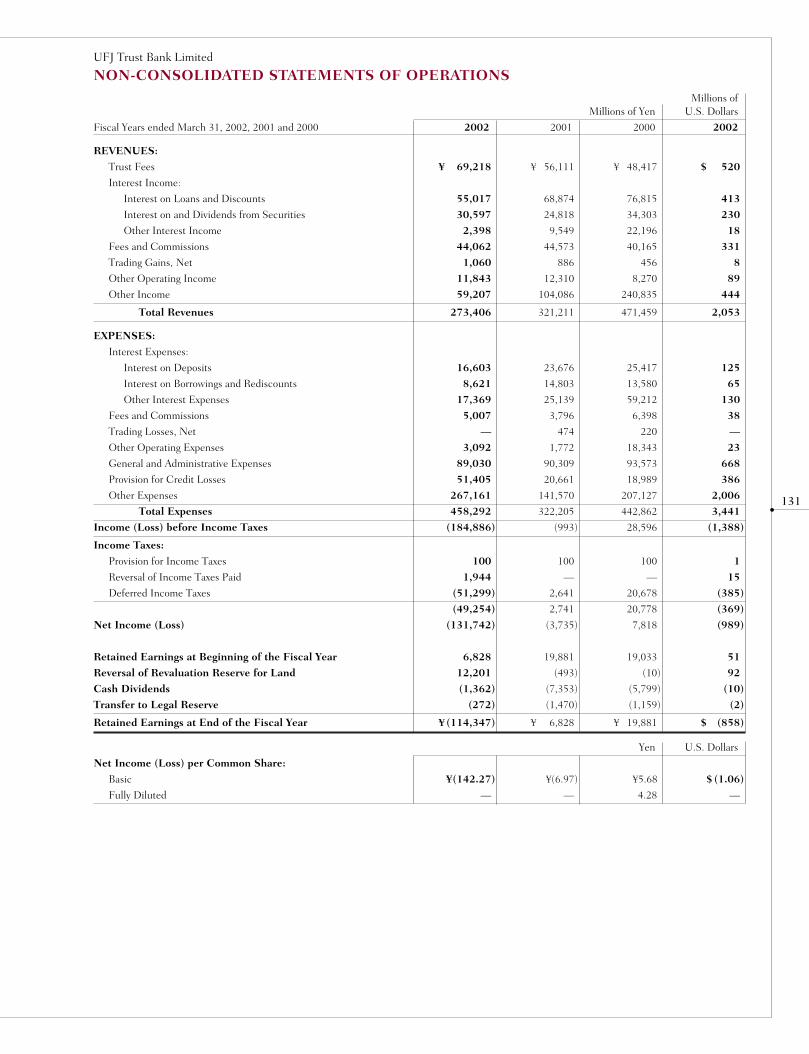
131
UFJ Trust Bank Limited
NON-CONSOLIDATED STATEMENTS OF OPERATIONSMillions of
Millions of Yen U.S. Dollars
Fiscal Years ended March 31, 2002, 2001 and 2000 2002 2001 2000 2002
REVENUES:
Trust Fees ¥ 69,218 ¥ 56,111 ¥ 48,417 $ 520
Interest Income:
Interest on Loans and Discounts 55,017 68,874 76,815 413
Interest on and Dividends from Securities 30,597 24,818 34,303 230
Other Interest Income 2,398 9,549 22,196 18
Fees and Commissions 44,062 44,573 40,165 331
Trading Gains, Net 1,060 886 456 8
Other Operating Income 11,843 12,310 8,270 89
Other Income 59,207 104,086 240,835 444
Total Revenues 273,406 321,211 471,459 2,053
EXPENSES:
Interest Expenses:
Interest on Deposits 16,603 23,676 25,417 125
Interest on Borrowings and Rediscounts 8,621 14,803 13,580 65
Other Interest Expenses 17,369 25,139 59,212 130
Fees and Commissions 5,007 3,796 6,398 38
Trading Losses, Net — 474 220 —
Other Operating Expenses 3,092 1,772 18,343 23
General and Administrative Expenses 89,030 90,309 93,573 668
Provision for Credit Losses 51,405 20,661 18,989 386
Other Expenses 267,161 141,570 207,127 2,006
Total Expenses 458,292 322,205 442,862 3,441
Income (Loss) before Income Taxes (184,886) (993) 28,596 (1,388)
Income Taxes:
Provision for Income Taxes 100 100 100 1
Reversal of Income Taxes Paid 1,944 — — 15
Deferred Income Taxes (51,299) 2,641 20,678 (385)
(49,254) 2,741 20,778 (369)
Net Income (Loss) (131,742) (3,735) 7,818 (989)
Retained Earnings at Beginning of the Fiscal Year 6,828 19,881 19,033 51
Reversal of Revaluation Reserve for Land 12,201 (493) (10) 92
Cash Dividends (1,362) (7,353) (5,799) (10)
Transfer to Legal Reserve (272) (1,470) (1,159) (2)
Retained Earnings at End of the Fiscal Year ¥ (114,347) ¥ 6,828 ¥ 19,881 $ (858)
Yen U.S. Dollars
Net Income (Loss) per Common Share:
Basic ¥(142.27) ¥(6.97) ¥5.68 $ (1.06)
Fully Diluted — — 4.28 —

132
UFJ Trust Bank Limited
NON-CONSOLIDATED BALANCE SHEETSTrust Account
Millions ofMillions of Yen U.S. Dollars
As of March 31, 2002 and 2001 2002 2001 2002
ASSETS:
Loans and Bills Discounted ¥ 1,300,544 ¥ 1,767,754 $ 9,763
Securities 14,544,647 12,796,772 109,194
Securities of Investment Trusts 7,703,581 7,401,596 57,834
Overseas Investments of Investment Trusts 1,423,548 934,340 10,687
Beneficiary Rights in Trust 87,701 131,525 658
Securities in Trust 293,166 202,693 2,200
Securities Lent 481,500 364,900 3,614
Money Claims 3,552,805 2,958,438 26,672
Premises and Equipment 809,458 570,943 6,077
Leasing Rights on Land 15,885 15,885 119
Other Claims 109,858 833,685 824
Bills Purchased — 1,010,000 —
Call Loans 2,298,260 3,778,728 17,254
Lending Money to Banking Account 1,692,839 2,736,497 12,709
Cash and Due from Banks 599,842 661,316 4,503
Total Assets ¥34,913,641 ¥36,165,079 $262,114
LIABILITIES:
Money Trust ¥ 9,432,411 ¥ 8,428,003 $ 70,813
Pension Trust 4,463,767 4,494,590 33,511
Property Formation Trusts 4,790 4,481 35
Loan Trusts 1,978,766 3,302,042 14,855
Investment Trusts 12,819,599 15,744,706 96,243
Money in Trust Other than Money Trusts 1,129,100 1,315,758 8,476
Securities in Trust 1,150,120 956,393 8,634
Money Claims in Trust 1,833,911 834,543 13,768
Equipment in Trust 136,455 108,674 1,024
Real Estate in Trust 103,520 111,223 777
Leasing Rights on Land in Trust 725 718 5
Composite Trusts 1,847,847 853,741 13,872
Other Trusts 12,623 10,203 94
Total Liabilities ¥34,913,641 ¥36,165,079 $262,114
Notes: 1. The total amount of Co-operative Trusts with other trust companies administrated were ¥8,739,427 million ($65,611million) and ¥9,764,976 millionas of March 31, 2002 and 2001, respectively.
2. Total amounts of loans in trust account with principal indemnification of clause were ¥1,217,004 million ($9,136 million) and ¥1,588,361 million asof March 31,2002 and 2001,respectively.Problem Loans in trust account with principal indemnification of clause defined by the Japanese Banking Law were as follows;
Millions ofMillions of Yen U.S. Dollars
As of March 31, 2002 and 2001 2002 2001 2002
Loans to Bankrupt Companies ¥ 14,932 ¥ 20,169 $ 112
Other Delinquent Loans 59,908 65,618 449
Loans Past Due 3 Months or More 2,038 954 15
Restructured Loans 59,346 32,509 445
Total ¥136,227 ¥119,252 $1,022
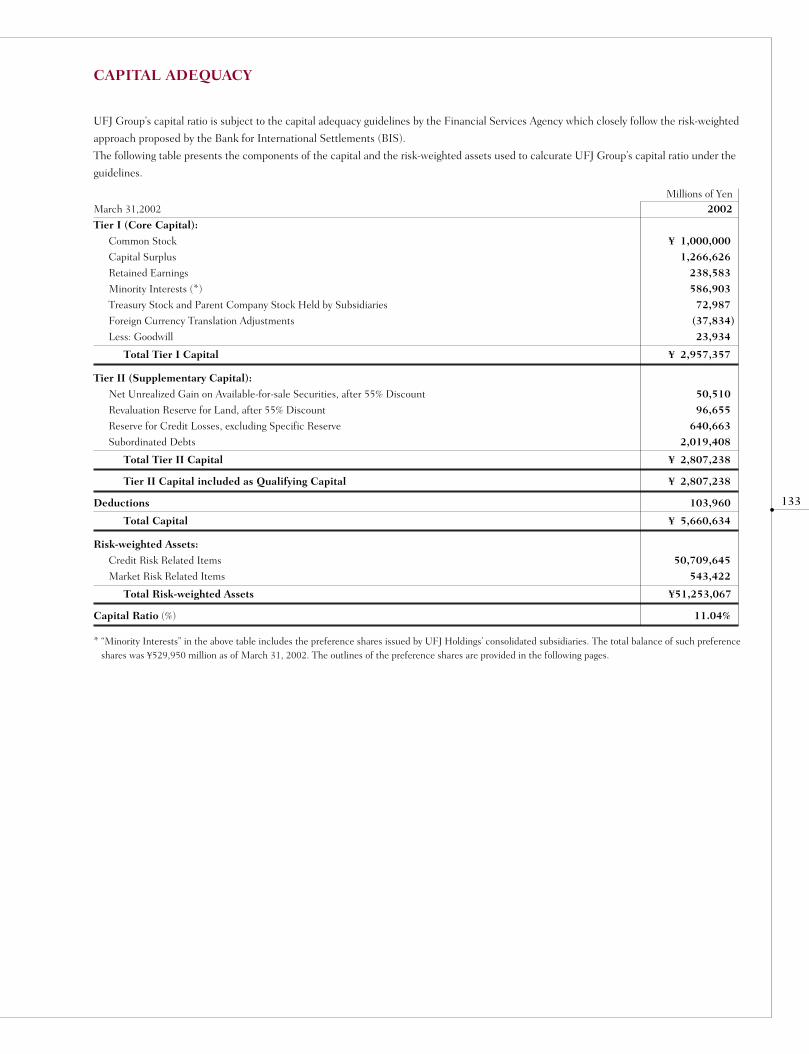
133
UFJ Group’s capital ratio is subject to the capital adequacy guidelines by the Financial Services Agency which closely follow the risk-weighted
approach proposed by the Bank for International Settlements (BIS).
The following table presents the components of the capital and the risk-weighted assets used to calcurate UFJ Group’s capital ratio under the
guidelines.
Millions of YenMarch 31,2002 2002
Tier I (Core Capital):
Common Stock ¥ 1,000,000
Capital Surplus 1,266,626
Retained Earnings 238,583
Minority Interests (*) 586,903
Treasury Stock and Parent Company Stock Held by Subsidiaries 72,987
Foreign Currency Translation Adjustments (37,834)
Less: Goodwill 23,934
Total Tier I Capital ¥ 2,957,357
Tier II (Supplementary Capital):
Net Unrealized Gain on Available-for-sale Securities, after 55% Discount 50,510
Revaluation Reserve for Land, after 55% Discount 96,655
Reserve for Credit Losses, excluding Specific Reserve 640,663
Subordinated Debts 2,019,408
Total Tier II Capital ¥ 2,807,238
Tier II Capital included as Qualifying Capital ¥ 2,807,238
Deductions 103,960
Total Capital ¥ 5,660,634
Risk-weighted Assets:
Credit Risk Related Items 50,709,645
Market Risk Related Items 543,422
Total Risk-weighted Assets ¥51,253,067
Capital Ratio (%) 11.04%
* “Minority Interests” in the above table includes the preference shares issued by UFJ Holdings’ consolidated subsidiaries. The total balance of such preferenceshares was ¥529,950 million as of March 31, 2002. The outlines of the preference shares are provided in the following pages.
CAPITAL ADEQUACY

134
[1] [2]
Issuer(s) Sanwa Capital Finance 1 Limited Sanwa Capital Finance 2 Limited
Both incorporated with limited liability in the Cayman Islands
Relation to UFJ Bank 100% subsidiaries
Business of the Issuer(s) The principal purposes of the Issuers are to issue the Offered Shares to investors and to make subordinated loans to
UFJ Bank.
Offered Securities
The Offered Shares were privately placed. The Offered Shares are intended to provide holders with rights to liquidation
preferences that are similar to those provided by UFJ Bank’s most senior preferred shares, and rights to dividends as
described below under “Dividend Distribution Policy”.
Amount ¥50 billion ¥130 billion
Issuing Date March 18, 1999 March 25, 1999
Maturity Date Perpetual
Redemption
Dividend Rate
Dividend Payment Dates January 25 and July 25 of each year (or if such day is not a Business Day on the immediately succeeding Business Day
unless such day would fall in the next calendar month in which case such day shall be the immediately preceding
Business Day).
Dividend Distribution The Offered Shares provide holders with rights to dividends as follows:
Policy (1) If UFJ Bank pays any dividends on its common shares for any fiscal year, dividends will be paid on the subsequent
two Dividend Payment Dates (“Mandatory Dividend Payment Dates”).
(2) If a Dividend Payment Date is not a Mandatory Dividend Payment Date, UFJ Bank may determine in its discretion
to reduce or eliminate dividends.
If UFJ Bank declares less than 100% of dividends payable on its most senior preferred shares for any fiscal year,
dividends on the Offered Shares for the subsequent two Dividend Payment Dates will be limited to the same
percentage.
Notwithstanding (1) or (2), dividends will be reduced or eliminated if UFJ Bank has insufficient distributable profits as
described below, and no dividends will be payable if UFJ Bank is insolvent or in liquidation (“Liquidation Period”) or
fails to meet applicable capital requirements (“Supervisory Period”).
Non-cumulative dividends are payable at a floating rate
(with a step-up rate of 100bp for each dividend period in
and after July 2009).
Non-cumulative dividends are payable at a floating rate
(with no step-up rate).
OUTLINES OF PREFERENCE SHARES
5,000 Floating Rate Non-cumulative Preference Shares,
with a par value and liquidation preference of
¥10,000,000 per share (the “Offered Shares”).
13,000 Floating Rate Non-cumulative Preference
Shares, with a par value and liquidation preference of
¥10,000,000 per share (the “Offered Shares”).
The Offered Shares may be redeemed in whole or in part
on any Dividend Payment Date commencing in July
2004 at the option of the Issuer. The Offered Shares may
not be redeemed prior thereto except in whole upon the
occurrence of certain tax events or capital events. Any
redemption of the Offered Shares is subject to compli-
ance with applicable regulatory requirements, including
the prior approval of the Japanese regulatory authorities
if then required.
The Offered Shares may be redeemed in whole or in
part on any Dividend Payment Date commencing in July
2009 at the option of the Issuer. The Offered Shares
may not be redeemed prior thereto except in whole
upon the occurrence of certain tax events or capital
events. Any redemption of the Offered Shares is subject
to compliance with applicable regulatory requirements,
including the prior approval of the Japanese regulatory
authorities if then required.
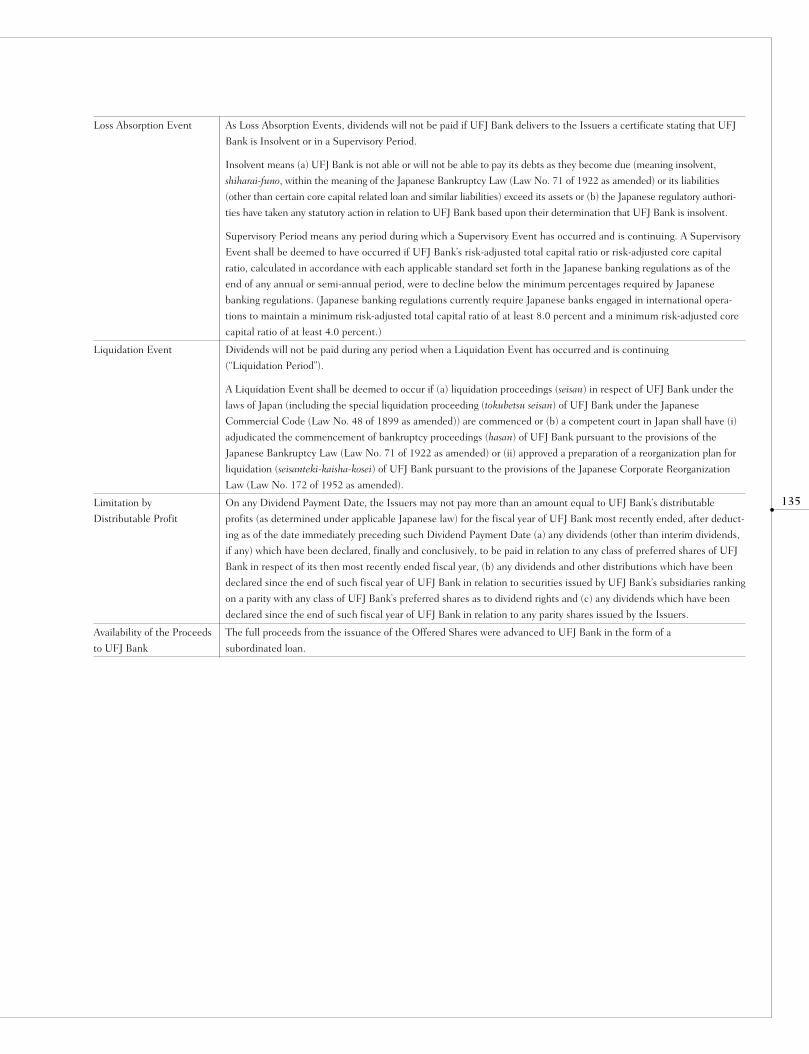
135
Loss Absorption Event As Loss Absorption Events, dividends will not be paid if UFJ Bank delivers to the Issuers a certificate stating that UFJ
Bank is Insolvent or in a Supervisory Period.
Insolvent means (a) UFJ Bank is not able or will not be able to pay its debts as they become due (meaning insolvent,
shiharai-funo, within the meaning of the Japanese Bankruptcy Law (Law No. 71 of 1922 as amended) or its liabilities
(other than certain core capital related loan and similar liabilities) exceed its assets or (b) the Japanese regulatory authori-
ties have taken any statutory action in relation to UFJ Bank based upon their determination that UFJ Bank is insolvent.
Supervisory Period means any period during which a Supervisory Event has occurred and is continuing. A Supervisory
Event shall be deemed to have occurred if UFJ Bank’s risk-adjusted total capital ratio or risk-adjusted core capital
ratio, calculated in accordance with each applicable standard set forth in the Japanese banking regulations as of the
end of any annual or semi-annual period, were to decline below the minimum percentages required by Japanese
banking regulations. (Japanese banking regulations currently require Japanese banks engaged in international opera-
tions to maintain a minimum risk-adjusted total capital ratio of at least 8.0 percent and a minimum risk-adjusted core
capital ratio of at least 4.0 percent.)
Liquidation Event Dividends will not be paid during any period when a Liquidation Event has occurred and is continuing
(“Liquidation Period”).
A Liquidation Event shall be deemed to occur if (a) liquidation proceedings (seisan) in respect of UFJ Bank under the
laws of Japan (including the special liquidation proceeding (tokubetsu seisan) of UFJ Bank under the Japanese
Commercial Code (Law No. 48 of 1899 as amended)) are commenced or (b) a competent court in Japan shall have (i)
adjudicated the commencement of bankruptcy proceedings (hasan) of UFJ Bank pursuant to the provisions of the
Japanese Bankruptcy Law (Law No. 71 of 1922 as amended) or (ii) approved a preparation of a reorganization plan for
liquidation (seisanteki-kaisha-kosei) of UFJ Bank pursuant to the provisions of the Japanese Corporate Reorganization
Law (Law No. 172 of 1952 as amended).
Limitation by On any Dividend Payment Date, the Issuers may not pay more than an amount equal to UFJ Bank’s distributable
Distributable Profit profits (as determined under applicable Japanese law) for the fiscal year of UFJ Bank most recently ended, after deduct-
ing as of the date immediately preceding such Dividend Payment Date (a) any dividends (other than interim dividends,
if any) which have been declared, finally and conclusively, to be paid in relation to any class of preferred shares of UFJ
Bank in respect of its then most recently ended fiscal year, (b) any dividends and other distributions which have been
declared since the end of such fiscal year of UFJ Bank in relation to securities issued by UFJ Bank’s subsidiaries ranking
on a parity with any class of UFJ Bank’s preferred shares as to dividend rights and (c) any dividends which have been
declared since the end of such fiscal year of UFJ Bank in relation to any parity shares issued by the Issuers.
Availability of the Proceeds The full proceeds from the issuance of the Offered Shares were advanced to UFJ Bank in the form of a
to UFJ Bank subordinated loan.

136
[3] [4] [5]
Issuer(s) UFJ Capital Finance 1 Limited UFJ Capital Finance 2 Limited UFJ Capital Finance 3 Limited
Each incorporated with limited liability in the Cayman Islands
Relation to UFJ Bank 100% subsidiaries
Business of the Issuer(s) The principal purposes of the Issuers are to issue the Offered Shares to investors and to make subordinated loans to
UFJ Bank.
Offered Securities
The Offered Shares were privately placed. The Offered Shares are intended to provide holders with rights to liquidation
preferences that are similar to those provided by UFJ Bank’s most senior preferred shares, and rights to dividends as
described below under “Dividend Distribution Policy”.
Amount ¥90 billion ¥118 billion ¥10 billion
Issuing Date October 24, 2001 November 8, 2001 November 8, 2001
Maturity Date Perpetual
Redemption
Dividend Rate
Dividend Payment Dates January 25 and July 25 of each year (or if such day is not a Business Day on the immediately succeeding Business
Day unless such day would fall in the next calendar month in which case such day shall be the immediately preceding
Business Day).
Dividend Distribution The Offered Shares provide holders with rights to dividends as follows:
Policy (1) If UFJ Bank pays any dividends on its common shares for any fiscal year, dividends will be paid on the subsequent
two Dividend Payment Dates (“Mandatory Dividend Payment Dates”).
(2) If f a Dividend Payment Date is not a Mandatory Dividend Payment Date, UFJ Bank may determine in its discretion
to reduce or eliminate dividends.
If UFJ Bank declares less than 100% of dividends payable on its most senior preferred shares for any fiscal year, divi-
dends on the Offered Shares for the subsequent two Dividend Payment Dates will be limited to the same percentage.
Notwithstanding (1) or (2), dividends will be reduced or eliminated if UFJ Bank has insufficient distributable profits as
described below, and no dividends will be payable if UFJ Bank is insolvent or in liquidation (“Liquidation Period”) or
fails to meet applicable capital requirements (“Supervisory Period”).
9,000 Floating Rate Non-cumulative
Preference Shares, with a par value
and liquidation preference of
¥10,000,000 per share
(the “Offered Shares”).
11,800 Floating Rate Non-cumula-
tive Preference Shares, with a par
value and liquidation preference of
¥10,000,000 per share
(the “Offered Shares”).
1,000 Fixed Rate Non-cumulative
Preference Shares, with a par value
and liquidation preference of
¥10,000,000 per share
(the “Offered Shares”).
The Offered Shares may be redeemed in whole or in part on any Dividend Payment Date commencing in January
2007 at the option of the Issuer. The Offered Shares may not be redeemed prior thereto except in whole upon the
occurrence of certain tax events or capital events. Any redemption of the Offered Shares is subject to compliance with
applicable regulatory requirements, including the prior approval of the Japanese regulatory authorities if then required.
Non-cumulative dividends are payable at a floating rate (with no step-up rate). Non-cumulative dividends are
payable at a fixed rate
(with no step-up rate).

137
Loss Absorption Event As Loss Absorption Events, dividends will not be paid if UFJ Bank delivers to the Issuers a certificate stating that UFJ
Bank is Insolvent or in a Supervisory Period.
Insolvent means (a) UFJ Bank is not able or will not be able to pay its debts as they become due (meaning insolvent,
shiharai-funo, within the meaning of the Japanese Bankruptcy Law (Law No. 71 of 1922 as amended) or its liabilities
(other than certain core capital related loan and similar liabilities) exceed its assets or (b) the Japanese regulatory authori-
ties have taken any statutory action in relation to UFJ Bank based upon their determination that UFJ Bank is insolvent.
Supervisory Period means any period during which a Supervisory Event has occurred and is continuing. A Supervisory
Event shall be deemed to have occurred if UFJ Bank’s risk-adjusted total capital ratio or risk-adjusted core capital ratio,
calculated in accordance with each applicable standard set forth in the Japanese banking regulations as of the end of
any annual or semi-annual period, were to decline below the minimum percentages required by Japanese banking regu-
lations. (Japanese banking regulations currently require Japanese banks engaged in international operations to maintain
a minimum risk-adjusted total capital ratio of at least 8.0 percent and a minimum risk-adjusted core capital ratio of at
least 4.0 percent.)
Liquidation Event Dividends will not be paid during any period when a Liquidation Event has occurred and is continuing
(“Liquidation Period”).
A Liquidation Event shall be deemed to occur if (a) liquidation proceedings (seisan) in respect of UFJ Bank under the
laws of Japan (including the special liquidation proceeding (tokubetsu seisan) of UFJ Bank under the Japanese
Commercial Code (Law No. 48 of 1899 as amended)) are commenced or (b) a competent court in Japan shall have (i)
adjudicated the commencement of bankruptcy proceedings (hasan) of UFJ Bank pursuant to the provisions of the
Japanese Bankruptcy Law (Law No. 71 of 1922 as amended) or (ii) approved a preparation of a reorganization plan for
liquidation (seisanteki-kaisha-kosei) of UFJ Bank pursuant to the provisions of the Japanese Corporate Reorganization
Law (Law No. 172 of 1952 as amended).
Limitation by On any Dividend Payment Date, the Issuers may not pay more than an amount equal to UFJ Bank’s distributable
Distributable Profit profits (as determined under applicable Japanese law) for the fiscal year of UFJ Bank most recently ended, after deduct-
ing as of the date immediately preceding such Dividend Payment Date (a) any dividends (other than interim dividends,
if any) which have been declared, finally and conclusively, to be paid in relation to any class of preferred shares of UFJ
Bank in respect of its then most recently ended fiscal year, (b) any dividends and other distributions which have been
declared since the end of such fiscal year of UFJ Bank in relation to securities issued by UFJ Bank’s subsidiaries ranking
on a parity with any class of UFJ Bank’s preferred shares as to dividend rights and (c) any dividends which have been
declared since the end of such fiscal year of UFJ Bank in relation to any parity shares issued by the Issuers.
Availability of the Proceeds The full proceeds from the issuance of the Offered Shares were advanced to UFJ Bank in the form of a
to UFJ Bank subordinated loan.
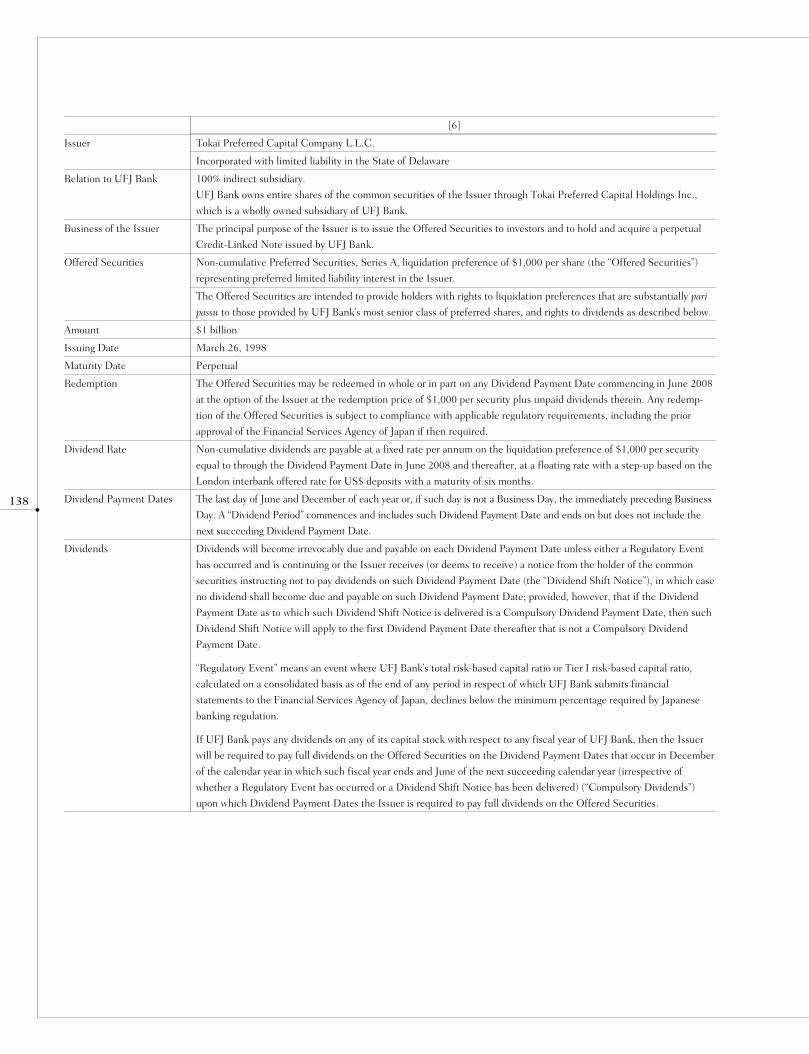
138
[6]
Issuer Tokai Preferred Capital Company L.L.C.
Incorporated with limited liability in the State of Delaware
Relation to UFJ Bank 100% indirect subsidiary.
UFJ Bank owns entire shares of the common securities of the Issuer through Tokai Preferred Capital Holdings Inc.,
which is a wholly owned subsidiary of UFJ Bank.
Business of the Issuer The principal purpose of the Issuer is to issue the Offered Securities to investors and to hold and acquire a perpetual
Credit-Linked Note issued by UFJ Bank.
Offered Securities Non-cumulative Preferred Securities, Series A, liquidation preference of $1,000 per share (the “Offered Securities”)
representing preferred limited liability interest in the Issuer.
The Offered Securities are intended to provide holders with rights to liquidation preferences that are substantially pari
passu to those provided by UFJ Bank’s most senior class of preferred shares, and rights to dividends as described below.
Amount $1 billion
Issuing Date March 26, 1998
Maturity Date Perpetual
Redemption The Offered Securities may be redeemed in whole or in part on any Dividend Payment Date commencing in June 2008
at the option of the Issuer at the redemption price of $1,000 per security plus unpaid dividends therein. Any redemp-
tion of the Offered Securities is subject to compliance with applicable regulatory requirements, including the prior
approval of the Financial Services Agency of Japan if then required.
Dividend Rate Non-cumulative dividends are payable at a fixed rate per annum on the liquidation preference of $1,000 per security
equal to through the Dividend Payment Date in June 2008 and thereafter, at a floating rate with a step-up based on the
London interbank offered rate for US$ deposits with a maturity of six months.
Dividend Payment Dates The last day of June and December of each year or, if such day is not a Business Day, the immediately preceding Business
Day. A “Dividend Period” commences and includes such Dividend Payment Date and ends on but does not include the
next succeeding Dividend Payment Date.
Dividends Dividends will become irrevocably due and payable on each Dividend Payment Date unless either a Regulatory Event
has occurred and is continuing or the Issuer receives (or deems to receive) a notice from the holder of the common
securities instructing not to pay dividends on such Dividend Payment Date (the “Dividend Shift Notice”), in which case
no dividend shall become due and payable on such Dividend Payment Date; provided, however, that if the Dividend
Payment Date as to which such Dividend Shift Notice is delivered is a Compulsory Dividend Payment Date, then such
Dividend Shift Notice will apply to the first Dividend Payment Date thereafter that is not a Compulsory Dividend
Payment Date.
“Regulatory Event” means an event where UFJ Bank’s total risk-based capital ratio or Tier I risk-based capital ratio,
calculated on a consolidated basis as of the end of any period in respect of which UFJ Bank submits financial
statements to the Financial Services Agency of Japan, declines below the minimum percentage required by Japanese
banking regulation.
If UFJ Bank pays any dividends on any of its capital stock with respect to any fiscal year of UFJ Bank, then the Issuer
will be required to pay full dividends on the Offered Securities on the Dividend Payment Dates that occur in December
of the calendar year in which such fiscal year ends and June of the next succeeding calendar year (irrespective of
whether a Regulatory Event has occurred or a Dividend Shift Notice has been delivered) (“Compulsory Dividends”)
upon which Dividend Payment Dates the Issuer is required to pay full dividends on the Offered Securities.
139
Liquidation Event A “Liquidation Event” shall be deemed to occur if (a) a liquidation proceeding (Seisan) under the laws of Japan (including
the special liquidation proceeding (Tokubetsu Seisan) of UFJ Bank under the Commercial Code (Law No. 48 of 1899, as
amended)) is commenced by or against UFJ Bank (for the avoidance of doubt, otherwise than for the purpose of or
pursuant to any merger or amalgamation of UFJ Bank under the Commercial Code or the Special Law regarding Merger
Procedures of Bank for Bank Holding Company (Law No. 121 of 1997), the terms of which are approved by UFJ Bank’s
shareholders and where the continuing company or the company formed as a result of which has effectively succeeded to
all or substantially all of the assets of UFJ Bank and assumes the entire obligation of UFJ Bank under the Credit-Linked
Note and the Parent Contribution Agreement), or (b) a competent court in Japan shall have either (x)adjudicated UFJ
Bank to be bankrupt (Hasan) pursuant to the provisions of the Japanese Bankruptcy Law (Law No. 71 of 1922, as
amended) or (y) approved the preparation of a reorganization plan for liquidation (Seisan-o-Naiyotosuru-Keikaku) of UFJ
Bank pursuant to the provisions of the Japanese Corporate Reorganization Law (Law No. 172 of 1952, as amended).
Parent Contribution Pursuant to the Parent Contribution Agreement, UFJ Bank will be obligated to contribute (or cause to be contributed)
Agreement to the Issuer such additional funds as are necessary for the payment of Compulsory Dividends, except that, as long as
the Credit-Linked Note is outstanding, (i) if UFJ Bank is not in default under the Credit-Linked Note on either such
Compulsory Dividend Payment Date on which such Compulsory Dividends are payable, dividends so payable by the
Issuer on such Dividend Payment Date will be limited to amounts received by the Issuer under the Credit-Linked Note,
and (ii) the amount UFJ Bank is obligated to contribute to the Issuer during any Dividend Period, together with interest
payments actually made by UFJ Bank under the Credit-Linked Note, shall not exceed the scheduled amount of interest
payments under the Credit-Linked Note due during such Dividend Period.
Credit-Linked Note The Issuer acquired and holds the Credit-Linked Note having a principal amount of $1,125,000,000 issued by UFJ
Bank. The Credit-Linked Note has generated net income for distribution to the holders of the Offered Securities and its
common securities.
The Credit-Linked Note evidences a subordinated perpetual obligation of UFJ Bank under which UFJ Bank will make
payments only of interest and not principal.
The Credit-Linked Note will provide that, if a Liquidation Event occurs and for so long as it continues, (i) the obligation
of UFJ Bank to make payments of interest under the Credit-Linked Note will be suspended, (ii) the obligation of UFJ
Bank to make payments under the Parent Contribution Agreement will be suspended and (iii) the Credit-Linked Note
will evidence a subordinated claim in the liquidation of UFJ Bank and the Issuer will have no other financial claim
against or interest in UFJ Bank under the Credit-Linked Note. The subordinated claim evidenced by the Credit-
Linked Note will entitle the Issuer to substantially the same liquidating distributions in the liquidation of UFJ Bank
that the Issuer would be entitled to if the Credit-Linked Note were pari passu to the most senior class of preferred
stock of UFJ Bank having an aggregate liquidation preference at least equal to the aggregate liquidation preference of
the Offered Securities.
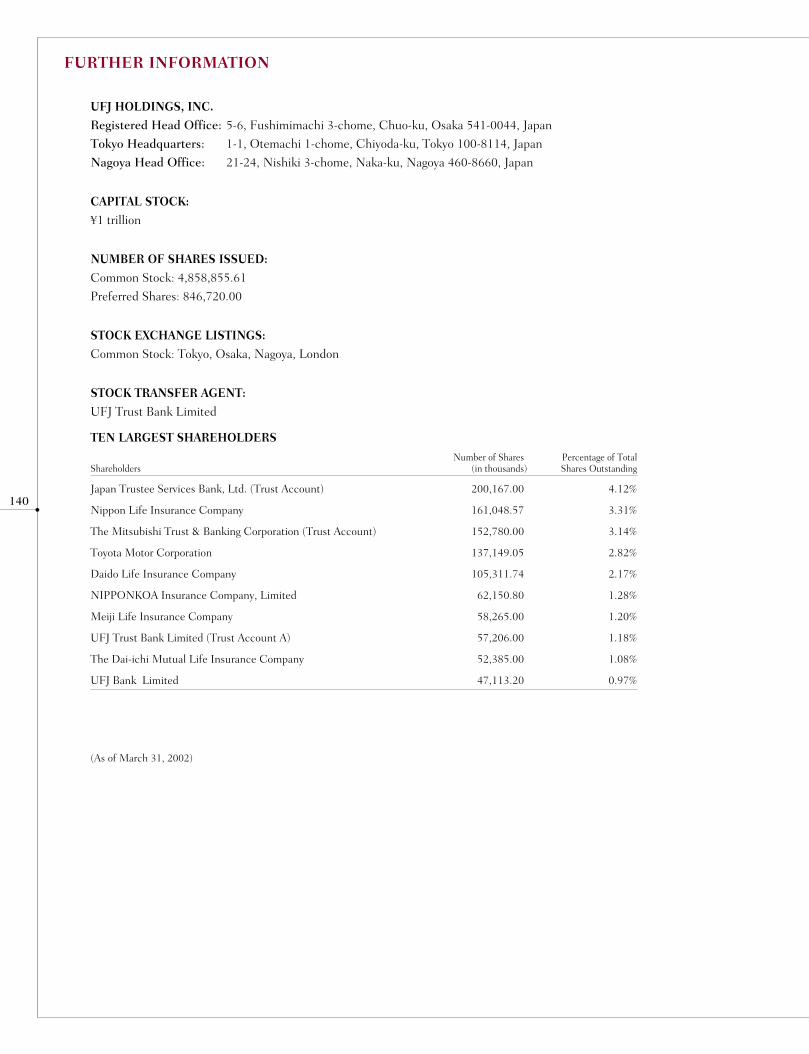
140
UFJ HOLDINGS, INC. Registered Head Office: 5-6, Fushimimachi 3-chome, Chuo-ku, Osaka 541-0044, Japan
Tokyo Headquarters: 1-1, Otemachi 1-chome, Chiyoda-ku, Tokyo 100-8114, Japan
Nagoya Head Office: 21-24, Nishiki 3-chome, Naka-ku, Nagoya 460-8660, Japan
CAPITAL STOCK:¥1 trillion
NUMBER OF SHARES ISSUED:Common Stock: 4,858,855.61
Preferred Shares: 846,720.00
STOCK EXCHANGE LISTINGS:Common Stock: Tokyo, Osaka, Nagoya, London
STOCK TRANSFER AGENT:UFJ Trust Bank Limited
(As of March 31, 2002)
FURTHER INFORMATION
Japan Trustee Services Bank, Ltd. (Trust Account) 200,167.00 4.12%
Nippon Life Insurance Company 161,048.57 3.31%
The Mitsubishi Trust & Banking Corporation (Trust Account) 152,780.00 3.14%
Toyota Motor Corporation 137,149.05 2.82%
Daido Life Insurance Company 105,311.74 2.17%
NIPPONKOA Insurance Company, Limited 62,150.80 1.28%
Meiji Life Insurance Company 58,265.00 1.20%
UFJ Trust Bank Limited (Trust Account A) 57,206.00 1.18%
The Dai-ichi Mutual Life Insurance Company 52,385.00 1.08%
UFJ Bank Limited 47,113.20 0.97%
Number of Shares Percentage of TotalShareholders (in thousands) Shares Outstanding
TEN LARGEST SHAREHOLDERS
This annual report is printed on recycled paper.
Forward-Looking Statement
This annual report contains forward-looking statements with respect to the financial condition, results of operations and businesses of UFJ Holdings, Inc.,
UFJ Bank Limited, UFJ Trust Bank Limited (collectively hereinafter, “the UFJ Group”) and their group companies. These forward-looking statements involve
certain risks and uncertainties resulting from changes in the UFJ Group’s business environment.
CONTACT:Investor Relations
Investor Relations Office, Group Planning Department
UFJ Holdings, Inc.
1-1, Otemachi 1-chome, Chiyoda-ku, Tokyo 100-8114, Japan
Tel: 81-3-3212-5458
Fax: 81-3-3212-5867
URL: www.ufj.co.jp

Printed in Japan
Tokyo Headquarters: 1-1, Otemachi 1-chome, Chiyoda-ku, Tokyo 100-8114, Japan
www.ufj.co.jp