The Financing of Illinois K-12 Education 1998-2007 Dr. Michael Jacoby Executive Director, Illinois...
28
The Financing of Illinois K-12 Education 1998-2007 Dr. Michael Jacoby Executive Director, Illinois ASBO Chair, Illinois Education Roundtable
-
Upload
rosalind-hamilton -
Category
Documents
-
view
220 -
download
0
Transcript of The Financing of Illinois K-12 Education 1998-2007 Dr. Michael Jacoby Executive Director, Illinois...

The Financing of Illinois K-12 Education 1998-2007
Dr. Michael JacobyExecutive Director, Illinois ASBOChair, Illinois Education Roundtable

Topics, Documents Revenue/Expenditure Data
2008 AFR Rev and Exp Summary Data 1998-2008 Rev and Exp Graphs 1998-2008
Historical Review of Funding Reform Proposals Legislative Research Unit Report

Annual Financial Report How Data is Collected: (See 2007 AFR)
Illinois Program Accounting Manual (IPAM) Revenue (by Fund [9] and Source):
Local:TaxesCPPRTTuitionFeesInterest EarningsFood ServicePupil ActivitiesOther
State:GSASpecial EdVocationalBilingualTransportationOther
Federal:UnrestrictedRestrictedTitle VFood ServiceTitle ITitle IVSpecial EdVocational

Annual Financial Report Expense (by Fund [9], Function & Object):
Fund:Operating Funds: - Education - Operation & Maintenance - Transportation - IMRFBond & InterestSite & ConstructionWorking CashRent (Tort in 2009)Life Safety
Function:InstructionSupport ServicesCommunity ServicesNon-Programmed ChargesDebt Service
Object:SalaryBenefitsPurchased ServicesCapital OutlayOther ObjectsTransfersTuition

ADA = Average Daily AttendanceIllinois School District ADA Growth 1998-2007
0.0%
0.4%
2.0%
2.9%
4.8%
6.7%
5.8%
6.2%6.2%
7.3%
0.0%
1.0%
2.0%
3.0%
4.0%
5.0%
6.0%
7.0%
8.0%
1998 1999 2000 2001 2002 2003 2004 2005 2006 2007
Fiscal Year
% G
row
th

Operating Fund Data – 10 Year Summary
Source = ISBE Analysis of AFR Data 1998 - 2007

Revenue and Expense Growth 1998-2007
49.4%
45.5%
0.0%
10.0%
20.0%
30.0%
40.0%
50.0%
60.0%
1998 1999 2000 2001 2002 2003 2004 2005 2006 2007
Fiscal Year
% G
row
th
Revenue
Expense

Inflation Adjusted
Inflation measured by the Consumer Price Index indicates that $1.00 in 1998 is equivalent in purchasing power to $1.27 in 2007.
Inflation Adjusted Revenue Increase 1998 to 2007 = 22.4% Expense Increase 1998 to 2007 = 18.5%
Policy Implication CPI is not a reliable inflation index for education. “ECI is a more accurate measurement of the
inflationary spending pressures that school districts face” (EFAB 2005)

Operating Fund Revenue Per ADA
4,58
02,
240
501
4,75
72,
497
553
4,93
92,
578
609
5,11
32,
654
650
5,15
12,
637
676
5,27
82,
595
761
5,67
22,
843
819
6,00
92,
880
857
6,49
92,
952
866
6,85
03,
232
863
0
2,000
4,000
6,000
8,000
10,000
12,000
Per ADA
1998 1999 2000 2001 2002 2003 2004 2005 2006 2007
Fiscal Year
Illinois School Revenues per ADA (by Source)
Federal Sources
State Sources
Local Sources

Operating Fund Revenue Per ADA Illinois School District Revenue (by Source)
62.5% 62.5%
30.6% 29.5%
6.8% 7.9%
0.0%
10.0%
20.0%
30.0%
40.0%
50.0%
60.0%
70.0%
1998 1999 2000 2001 2002 2003 2004 2005 2006 2007
Fiscal Year
% o
f R
ev Local Sources
State Sources
Federal Sources

Local vs State Revenue – Operating Funds
(2 Axis)
62.5%
60.8%60.7% 60.6%
60.8%
61.0%
60.7%
61.6%
62.9%
62.5%
30.6%
31.9%
31.7%
31.5%
31.1%
30.0%
30.4%
29.5%
28.6%
29.5%
60.0%
61.0%
62.0%
63.0%
64.0%
1998 1999 2000 2001 2002 2003 2004 2005 2006 200728.5%
29.5%
30.5%
31.5%
32.5%
Lo
cal R
even
ue
Sta
te R
even
ue

Operating Fund Expenditures Per ADA by Function
4,07
22,
916
4,38
53,
078
4,51
03,
257
4,75
13,
478
4,92
03,
603
5,08
93,
696
5,27
83,
748
5,42
33,
903
5,62
54,
129
5,86
84,
305
0
2,000
4,000
6,000
8,000
10,000
12,000
Per ADA
1998 1999 2000 2001 2002 2003 2004 2005 2006 2007
Fiscal Year
Illinois School Expenditures per ADA (by Function)
Debt Services
Nonprogrammed Charges
Community Services
Support Services
Instruction

Operating Fund Expenditure Per ADA Illinois School District Expense (by Function)
Instruction and Support Service Only = 95.9% of Expenses
55.3%55.9%
40.6%40.0%
35.0%
45.0%
55.0%
65.0%
1998 1999 2000 2001 2002 2003 2004 2005 2006 2007
Fiscal Year
% o
f E
xp Instruction
Support Services

Operating Fund Expenditures Per ADA by Object
4,50
9
628
794
532363235
4,76
9
724
894
537369249
5,01
7
706
910
579385260
5,25
5
783
953
648
399273
5,45
6863
978
612407319
5,63
0
923
1,018
631364331
5,77
4
1,061
1,057
632300321
5,93
9
1,076
1,158
650281333
6,11
6
1,144
1,237
701310352
6,36
7
1,187
1,315
722315376
0
2,000
4,000
6,000
8,000
10,000
12,000
Per ADA
1998 1999 2000 2001 2002 2003 2004 2005 2006 2007
Fiscal Year
Illinois School Expenditures per ADA (by Object)
Tuition
Transfers
Other Objects
Capital Outlay
Supplies
Purchased Services
Benefits
Salary

Operating Fund Expenditure Per ADA Illinois School District Expense (by Object)
Major Objects Only = 99% of Expenses
63.09% 61.35%
0.00%
10.00%
20.00%
30.00%
40.00%
50.00%
60.00%
70.00%
1998 1999 2000 2001 2002 2003 2004 2005 2006 2007
Fiscal Year
% o
f E
xp
Salary
Benefits
Purchased Services
Supplies
Capital Outlay
Tuition
See Next Chart for
Detail

Operating Fund Expenditure Per ADA Illinois School District Expense (by Object)
Not Including Salary = ~38% of Expenses
11.43%
8.78%
12.67%
11.12%
6.96%7.45%
3.04%
5.08%
3.62%3.29%
0.72% 0.83%
0.00%
2.00%
4.00%
6.00%
8.00%
10.00%
12.00%
14.00%
1998 1999 2000 2001 2002 2003 2004 2005 2006 2007
Fiscal Year
% o
f E
xp
Benefits
Purchased Services
Supplies
Capital Outlay
Tuition
Capital Outlay
Transfers

Expense Per ADA – Change from 1998 by Function
Function $ Inc from 1998
% Inc from 1998
Instruction 1,796 44%
Support Services 1,387 48%
Community Services
11 20%
Non Programmed Charges
85 37%
Debt Services 34 240%
Denotes potential policy implication or budget trend

Local Budget Trends
An increase in Debt Services within the Operating Funds suggests an increased reliance upon Tax or GSA Anticipation Warrants, or non-referendum debt (i.e. performance contracts).
Both principal and interest for these types of borrowing must be paid directly from the fund that receives the revenue.
Total Warrants/Notes issued or outstanding FY 2007 = $268M
Total principal/interest paid from Operating Funds in FY 2007 = $90.2M
An increase from 1998 of $63.6M

Expense Per ADA – Change from 1998 by Function
Object $ Inc from 1998
% Inc from 1998
Salary 1,858 41%
Benefits 559 89%
Purchase Services
520 65%
Supplies 190 36%
Capital Outlay -48 -13%
Other Objects 34 67%
Transfers -23 -69%
Tuition 140 60%Denotes potential policy implication or budget trend

Local Budget Trends
Employee benefit increases over 10 years have had a significant impact on school budgets.
This is primarily associated with health insurance premiums.
Total expense from Operating Funds in FY 2007 = $2.2B
An increase from 1998 of $1.05B

Benefit Cost Per ADA % Change from 1998
Fiscal Yr $ Inc from 1998
% Inc from 1998
1999 96 15.3%
2000 78 12.4%
2001 155 24.8%
2002 236 37.6%
2003 295 47.0%
2004 434 69.1%
2005 449 71.5%
2006 517 82.4%
2007 559 89.1%
Total Cost Inc = $1.052 Billion

Local Budget Trends
Purchased Service increase suggests more external contracting by schools for various functions Custodial Services + $211M or 76% over 1998 Transportation Services + $224M or 82% over 1998
Capital Outlay decrease suggests schools purchased less equipment or equipment at lower costs. Education Fund down $74M or 25% decline over
1998 Instruction down $30M or 21% decline over 1998

Local Budget Trends
Transfers decrease is difficult to discern and AFR data is not sufficient to make an evaluation.
IPAM Definition: “This object category does not represent a purchase; rather, it shows that funds have been transferred in some manner. Included here are transactions for moving money from one fund to another and for transmitting flow-through funds to another LEA.”

Local Budget Trends Tuition increase is summarized below:
Regular program increase suggests more districts paying tuition to other districts for programming.
Sp Ed increase is within expectations when compared with total expense increase 1998 to 2007
Increase in CC tuition suggests more dual credit programs.
Function Per ADA $ Inc from
1998
Per ADA % Inc from
1998
Regular 13 150%
Special Ed 70 49%
Vocational 2 15%
Community College .05 108%
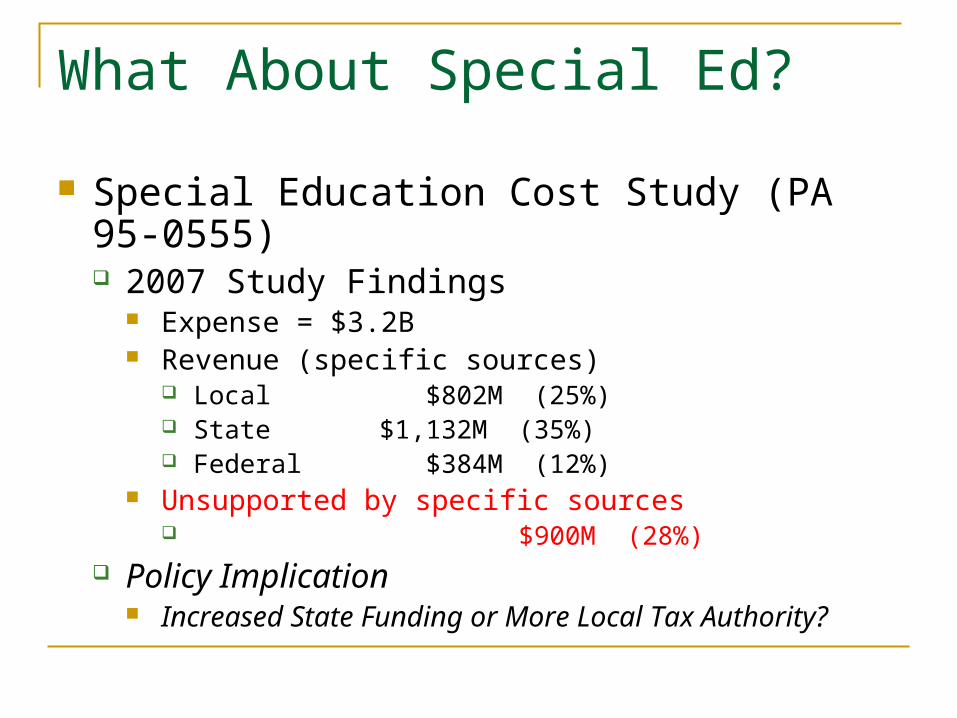
What About Special Ed?
Special Education Cost Study (PA 95-0555) 2007 Study Findings
Expense = $3.2B Revenue (specific sources)
Local $802M (25%) State $1,132M (35%) Federal $384M (12%)
Unsupported by specific sources $900M (28%)
Policy Implication Increased State Funding or More Local Tax
Authority?

What About Special Ed?
1998 to 2007 per ADA (select *Function #s)
Function1998 per
ADA2007 per
ADA $ Inc % Inc1200 Sp Ed 647.32 1,051.55 404 62%2110 Social Work 70.40 113.76 43 62%2140 Psych 34.27 57.40 23 67%2150 Speech 36.50 85.48 49 134%4120 Tuition 165.45 253.91 88 53%
953.94 1,562.10 608 64%
The PA 95-0555 Expense methodology is preferred, however comparable 1998 data is not currently available.

Local Budget Trend
Special Education expenses per ADA from 1998 to 2007 increased 64% compared to the total Education Fund increase of 45%.
Speech and Hearing expenses represented the largest increase at 134%.
As a % of the total Education Fund Budget, Special Ed increased from 16% in 1998 to 18% in 2007. This 2% proportional increase = $334M
Illinois Funding Proposals
Handout Historical Review of Selected Education
Funding and Reform Proposals-Illinois Legislative
Research Unit December 20, 2006