The Financial System of the EU 25 - Wharton...
108
1 The Financial System of the EU 25 Franklin Allen 1 Laura Bartiloro Oskar Kowalewski Finance Department The Wharton School University of Pennsylvania e-mail: [email protected] Research Department Banca d’Italia e-mail: [email protected] Finance Department Leon Kozminski Academy of Entrepreneurship and Management e-mail: [email protected] Abstract We present an overview of the financial structure of the enlarged European Union with 25 countries. We start by describing the financial system development in all member states since 1995, and then compare the structure between the old and new countries. Using financial measures we document the prevailing substantial differences in the financial structure between new and old member states after the enlargement in 2004. Finally, we compare the financial structures of an enlarged EU with those of the United States and Japan. In our study we do not present any empirical evidence concerning whether bank-based or market-based financial systems are better then another but use the distinction in order to underline the existing differences in financial structures. 1 Corresponding author, Finance Department, Wharton School, University of Pennsylvania, Philadelphia, Pa 19104. Phone: 215-898-3629, fax:215-573-2007, e-mail: [email protected] . We would like to thank Luc Laeven and Philipp Hartmann for useful comments.
-
Upload
nguyenkhanh -
Category
Documents
-
view
218 -
download
0
Transcript of The Financial System of the EU 25 - Wharton...

1
The Financial System of the EU 25 Franklin Allen1 Laura Bartiloro Oskar Kowalewski Finance Department The Wharton School University of Pennsylvania e-mail: [email protected]
Research Department Banca d’Italia e-mail: [email protected]
Finance Department Leon Kozminski Academy of Entrepreneurship and Management e-mail: [email protected]
Abstract
We present an overview of the financial structure of the enlarged European Union with 25
countries. We start by describing the financial system development in all member states since
1995, and then compare the structure between the old and new countries. Using financial
measures we document the prevailing substantial differences in the financial structure between
new and old member states after the enlargement in 2004. Finally, we compare the financial
structures of an enlarged EU with those of the United States and Japan. In our study we do not
present any empirical evidence concerning whether bank-based or market-based financial
systems are better then another but use the distinction in order to underline the existing
differences in financial structures.
1 Corresponding author, Finance Department, Wharton School, University of Pennsylvania, Philadelphia, Pa 19104. Phone: 215-898-3629, fax:215-573-2007, e-mail: [email protected]. We would like to thank Luc Laeven and Philipp Hartmann for useful comments.

2
1 The enlarged European Union of 25
1.1 Introduction
Despite the political and economic convergence in the European Union (EU), the
financial structures of different members remain diverse. In this paper we present and compare
the financial structures of the EU members after the enlargement of May 2004. The
enlargement not only changed the political situation but also the structure of the financial
system of the EU.
In order to present the financial structure of the enlarged EU we analyse data and
provide indicators derived from the previous literature on international financial system
comparison (Allen and Gale, 2000; Demirgüç-Kunt and Levine, 2001). Additionally with the
purpose to better understand the countries’ peculiarities we examine each indicator not only
with respect to the overall European average (EU-25), but also with respect to the group the
country belongs to, having separated the former European Union members (EU-15) from the
new accession countries (EU-10). The distinction between former and new members allows us
to understand better the differences between the two groups of countries, as well as each
group’s homogeneity and development over time. In our study, to the extent possible, we
include in the last section of the paper also USA and Japan, to highlight the unique
characteristics of the European financial system.
Our paper complements the existing studies on the differences in financial structures of
countries (see Allen and Gale, 200) and specific analyses on the European financial structure
(Hartmann et al., 2003). In our study we present the development of the EU financial system
since 1995 and consider the accession of the 10 new member states (NMS). Previous studies
compared the financial structures within the EU-15 member states (OMS) or related it to other
developed countries. With our work we close the gap using new and comprehensive data on
the financial system of the old and new member states. In addition in our study we provide a
broad overview of the financial structure of the EU-25 as well as of the old and new member
states. Finally, at the end of our paper we merge our findings on EU financial structure with the
aim to compare it with those of the United States and Japan.
We do not present any empirical evidence on the relationship between GDP growth and
the development of the financial system or on whether one system is better than another. In

3
order to reliably identify any relationship we would need a longer time series, both because of
statistical needs and because the evidence for the finance-growth nexus has been shown to be
relevant for the long run. Since for most EU-10 countries comparable data on the financial
system is rather new, we are not able to retrieve a long time series. Thus, the main purpose of
this paper is a description of the financial system of the new EU, and to provide as many
financial indicators as possible for drawing a picture of the EU financial structure development
in the last ten years.
We start our analysis by illustrating the economic background of the enlarged EU. In
section 2, we describe the main characteristics of the banking system: we highlight the banking
system as almost all member states have a bank-based financial system. In section 3, we focus
on the development of capital markets, while section 4 deals with other important
characteristics of the financial system, such as the pension system and the role of insurance
companies. We will then examine in section 5 the legal and fiscal environment. Section 6
concludes by summarizing and making a comparison of the EU financial system with the US
and Japan.
1.2 The economic background
On May 1st 2004 the EU experienced the largest enlargement since its creation. It is not
only the number of acceding countries that needs to be pointed out, but also their
characteristics. In the last fifteen years, the 10 NMS except Cyprus and Malta have been
engaged in a transition process involving fundamental institutional and structural changes that
has dramatically turned former planned economies to market economies. These changes will
take more time before they are fully complete. As a consequence, the main economic
indicators for these countries still show a radically different picture compared to the 15 MS. In
this section we will present some key macroeconomic and structural characteristics of these
economies, and compare them with the corresponding figures for EU-15 countries.2
In particular, in this section we emphasise the economic growth data, which the
traditional literature usually relates to indicators of financial development in order to verify a
hypothesized finance-growth nexus. In recent years a consensus has emerged about the
2 See ECB (2004) for a broad survey of EU-10 economies.

4
important role of financial development on economic growth. Thus, understanding the existing
differences in the financial structure and development may help understand the differences in
growth rates across the new and old members of the EU. An extensive review of the literature
on finance and growth is given by Levine (1997).
Even if the number of new member states is high, their total size, in terms of population
and GDP is rather small compared to the EU-15 states. At the end of 2004 the EU-10
combined population of 74 million was one fifth of that of the EU-15, which amounted to 383
million. The weight of EU-10 countries in terms of GDP is even smaller. The GDP at current
market prices was only 5 per cent (477 billion euros) of that of EU-15 countries (9,886 billion
euros). This result is due to the low per capita income level of EU-10 countries.
Figure 1 – GDP per capita
All EU-10 countries have GDP per capita in PPP terms levels lower than the EU-25 average.
Among EU-15 countries only Greece, Portugal and Spain perform worse than the EU-25
average. Among EU members the highest GDP per capita is recorded in Luxembourg, but even
controlling for this outlier EU-10 countries, Greece, Portugal and Spain still have values lower
than the EU-25 average. In the new members group, higher GDP per capita levels can be seen
in Malta, Cyprus, Slovenia and Czech Republic.
On average EU-15 economies are twice as rich as EU-10 ones. The gap between the
two groups has reduced in the time span under examination only slightly. This is not surprising
because GDP per capita levels are very persistent and no large variations are usually observed
in short time spans. Almost all countries follow similar patterns with the exception of
Luxembourg and Ireland in our sample. In those two countries the GDP per capital almost
doubled in the last decade. The situation is remarkable especially in case of Ireland, which was
one of the poorest countries among the MS economies in 1997. Ten year later Ireland has one
of the highest level of GDP per capita among the EU-25 members states.
According to ECB (2004), inequality, as measured by Theil’s inequality coefficient, in the
period 1996-2003, was, on average, higher for EU-10 countries than for Greece and Portugal,
on the one hand, and for Denmark, Sweden and the United Kingdom on the other. The same
study argues that Cyprus and Slovenia, identified as the two most advanced EU-10 countries,
could reach the EU-15 average by around the middle of the next decade. For the other

5
economies it could take between six and 35 years to reach the relative position of the two EU
countries with the lowest GDP per capita levels, i.e. Greece and Portugal.
The reduction of the EU-10 countries differential in GDP per capita levels and the
outstanding performance of Luxembourg and Irish economies are reflected in higher GDP
growth rates.
Table 1 GDP growth rate in %.
Due to the catching-up process, EU-10 economies have grown faster than EU-15 economies.
The Czech Republic was the only EU-10 country experiencing lower growth rates than the EU-
25 average. Among EU-15 countries differences arise between more mature economies (like
Austria, Belgium, France, Germany, Italy), whose average growth rate was around 2.8%, and
countries with a more recent development (like Ireland, Finland, Greece, Luxembourg and
Spain), which have recorded a growth rate higher than 3%. Among those MS countries the two
extremes are Germany and Ireland. Latvia, Estonia, Lithuania and Poland are the EU-10
countries with the highest growth rates. In the NMS high growth rates in the late nineties were
the result of very low activity levels recorded during the recession which occurred during the
initial phase of the transition process.
The GDP per capita weighted averages of growth rates were lower than the unweighted
average. In case of the EU-10 the average growth rates was only 0.2 percentage points lower,
while for the EU-15 it was 0.8 percentage point lower. Finally, the weighted average for the
EU-25 was 0.9 lower. The difference between the averages suggest that more mature member
states develop slower than countries with low level of GDP per capita. The differences seem to
be much stronger among the EU-15 countries than EU-10.
The EU-15 growth rates have fluctuated following similar patterns in the time span
under consideration, while EU-10 figures have had different dynamics. However, in almost all
member states we could observe a slow down in growth rates in the years 2000 – 2002.
Corresponding slowdown in economic growth in almost all member states may suggest that
their economies are getting more and more dependent on each others.

6
2 The banking system
2.1 The role of banks in the European financial system
The financial system of the EU is often described in the literature as a bank-based
system, owing to the prominent role traditionally played by banks in the major economies in
the EU. The main exception among EU member countries is United Kingdom where capital
markets are well developed and play a significant role in the economy. Thus the financial
system of United Kingdom is often called a market–based system. Both financial systems have
their costs and benefits. Their evolution, even in the case of close geographic locations, has
arguably been a result of the superiority of the financial system in their environment. In the
literature the market-based financial system has sometimes been presented as the most efficient
financial system model. Nevertheless the question about the superiority of a particular system
is not widely agreed upon in the literature.
In a recent study Rajan and Zingales (2003) compared the European financial system
characteristics over the last two decades. According to them in this time the European financial
system moved away from a bank–based (relationship-based system) towards a market-based
system (arm’s length system). The underlying causes of these changes have been the process of
monetary and financial integration and innovation. The ongoing process will likely result in the
evolution of a more market-based system over time, but until then the bank–based system still
predominates in most of continental Europe.
In our study to assess the level of development of the financial sector in the EU-25
countries, we use several frequently applied measures of size and performance of the banking
sector. As the first measure we analyze the ratio of credit institutions’ assets to GDP as a proxy
for the depth of bank intermediation.3 This proxy shows that the banking sector still plays a
3 In order to identify credit institutions we have adopted the ECB definition: “Credit institution are: (i) an undertaking whose business is to receive deposits or other repayable funds from the public and to grant credits for its own account; or (ii) an undertaking or any other legal person, other than those under (i), which issues means of payment in the form of electronic money. In each member State the number of credit institutions includes the entities under the law of that country and the branches of foreign banks. If a foreign bank has several branches in a given country, then they are counted as a single branch. However, if the same bank has several subsidiaries, the latter are counted separately because they are considered to be separate legal entities. In the case of credit institutions that depend on a central organization (such as groups of cooperative banks), these may be counted separately.”

7
crucial role even though non-financial sectors in the European countries increasingly direct
their surplus funds away from banks toward new forms of financial intermediary.
Table 2 Total assets of domestic credit institutions as % of GDP
In the years 1995–2004 the banking sector grew rapidly reflecting the financial
deepening and integration of the EU financial system. In the same period the average growth of
banks’ assets outpaced GDP growth. In terms of GDP, bank assets in the EU-25 reached 308%
in 2004, an increase of almost 30 percentage since 1995. This indicator amounts to 416% in the
EU-15 area at the end of 2004, while in the EU-10 the level of financial intermediation was
considerably lower.
The difference in the bank asset ratio to GDP between EU-15 and EU-25 is quite small, when
we apply the weighted averages. Thus, the high value of the indicator for EU-25 may be driven
by small countries with high bank assets as Luxembourg. A comparison of the weight averages
between EU-10 and EU-25 reveals similar patterns, yet the a large difference prevails. As a
consequence we may assume that in the NMS banks still have a less significant role then in
EU-15 or in the EU-25.
Among all member states Luxembourg stands out in this respect, producing ratios that are
twenty times higher than the lowest value observed. However Luxembourg is witnessing a
decline of its banking sector in recent years. The decline can partially be explained by the new
EU financial regulation, which has removed some of the existing tax advantage of investing
money in Luxembourg.
In the EU-10 area, only Cyprus and Malta, the two non-transition economies among the
accession countries, display a ratio comparable with the EU-15 countries. In the transition
countries even after more than a decade of bank restructuring, this ratio is still under 100%
even if it has distinctly increased in recent years. In these countries credit institutions are the
most important intermediaries in the financial system. In this context, the Czech Republic and
the Slovakia stand out as the two economies with the strongest banking systems with bank
assets amounting to 100% of GDP and 88% of GDP in 2004, respectively. The high share in
these two countries is partially a result of the existence of a significant banking system under
the previous socialist regime. Wagner and Iakova (2001) report that Czechoslovakia entered
transition with a very high ratio of bank assets to GDP, and this was reflected in high ratios
even when the country split into the Czech Republic and the Slovakia in 1993. However, both

8
these countries are now the only European countries, together with Luxembourg, where we
observe a decline in the ratio of bank assets to GDP. In the Czech Republic and Slovakia the
reduction can be explained by growing competition inside the financial system and a trend of
disintermediation.
At the other end of the spectrum is Lithuania, with bank assets of only around 48% of GDP in
2004, and countries like Poland and Hungary with levels between 70% and 80% of GDP in the
same year.
Another widely used indicator of the importance of banks is the ratio of domestic credit
provided by credit institutions divided by GDP. Credit is a broad measure of the financing of
non-monetary financial institutions provided by credit institutions. The ratio includes loans and
holdings of securities issued by non-monetary financial institutions. The latter include shares,
other equity and debt securities. As securities can be seen as an alternative source of funds to
loans, and as some loans can be securitized, this definition provides more accurate information
on the total amount of financing provided by the credit institutions to the economy than a
narrow definition comprising loans only. Thus, the ratio is a good proxy for the overall credit
activity in the banking sector.
Table 3 Total credit granted by domestic credit institutions as % of GDP
In all EU-25 member states there has been an increase in the lending volume from 66%
in 1995 to 116% of GDP in 2004. Among EU-15 countries the highest level of bank lending is
observed in Luxembourg at 467% and Ireland at 176% GDP in 2004. A high level of banking
activity could be observed also in Germany and the Netherlands too. When we apply the
weighted averages the results are a bit lower. In the EU-15 the average lending volume was
comparable to the EU-25 amounting to 120% of GDP and 115% of GDP for the years 1995-
2004, respectively. However, in the new accession countries total credit granted by credit
institutions is on average was three times lower of that in EU-25 or EU-15, showing that in the
NMS bank lending is less developed.. Again only in Cyprus and Malta is the level of bank
lending comparable to the EU-15 figures. In the transition economies bank activity is usually
very low and even in the Czech Republic, which has the largest banking sector, total credit
over GDP in 2003 amounts to only about one-third of bank assets, i.e. 30% of GDP.
The low level of bank lending in transition countries can be explained by the sharp economic
downturn, which resulted in GDP falling between 15-20% in the first period of economic

9
transformation. Severe recessions led to a massive bad-debt problem in the corporate sector
dominated at this time by former state enterprises. These led to widespread defaults and a
substantial reduction of banks’ loan portfolios. In some countries, these developments
triggered banking crises, which further reduced bank assets. It strongly affected banks’ lending
behavior and induced a shift towards government securities. The shift from bank lending
towards government securities was motivated additionally by high interest rates, which were
raised in order to control inflation. Nevertheless as the economic situation improved and
government securities’ interest rates decreased, bank lending started to grow again. However,
this situation is still very fragile as the case of Czech Republic shows, where an economic
downturn and an unresolved bad–debt problem led to a shrinking of credit levels to record
lows.
Another, popular measure reflecting the bank position in the financial system is the
share of total deposits to GDP. The ratio reflects household deposits, which constitute the main
source of funding for the banking sector and represent the ability of credit institutions to
channel financial savings into investment and credits.
Table 4 Total deposits of domestic credit institutions as % of GDP
An increase in the deposit level from 58% in 1995 to 116% in 2004 implies a strong position of
the banking sector in the EU. Luxembourg and Denmark were the outliers, where the ratio of
intermediation decreased. However, in case of Denmark the situation has stabilized and bank
deposit has been growing again since 2002. In case of Luxembourg the decrease of bank
deposits can be explained by the change the EU- tax regulation, which stimulate outflow of
bank deposits mostly to third countries in the last years.
In the years 1997-1999 some member states experienced disintermediation. Then again the
trend was reversed with the overall fall of stock markets in the year 2000. It is worth
mentioning the high growth levels of deposits observed in fast growing economies such as
Ireland, Greece and Spain, where the ratios reached 123%, 96% and 105% in 2004,
respectively. When we use weighted averages the ratio of bank deposits to GDP decrease.
However, again the average bank deposit level in the EU-15 was very similar to that of the EU-
25. Only in the EU-10 countries the level of deposits as a share of GDP was half of that in the
EU-15 or EU-25 economies. Cyprus and Malta, again the two non-transition economies among
the accession countries, display a ratio comparable with the EU-15 countries. The low level of

10
deposits in the EU-10 countries is attributable to low level of economic development and
savings. Additionally the infrastructure of the banking system is still underdeveloped compared
to the EU-15. This situation is illustrated by the case of Poland where only 60% of the working
population had a bank account in 2004. In Poland traditionally payments are still mostly done
through a country-wide network of post office branches. Despite this the Polish Post itself was
not very successful in setting up a bank. This situation could change if the Post Bank is sold to
a foreign investor. At the opposite end of the spectrum to Poland is the Czech Republic, which
displays high deposits, because here historically the banking tradition has been stronger and the
infrastructure well developed.
2.2 Market structure
European banking has experienced fundamental changes over the last decades. As a
result of structural deregulation and technological innovation competition in the banking sector
has intensified considerably (Vives, 2000). The implementation of a single market in banking
and the introduction of the single currency accelerated integration of the market for financial
services. As a consequence further increases in competition and structural changes in the
banking sector have followed.
European credit institutions responded to the structural changes by consolidating
activities in order to increase in size and scope. As a consequence the number of credit
institutions has steadily declined in the last decades. In the EU-15 area the trend began in the
1990s and affected all types of banks, including cooperative banks and mutual savings banks.
The downward trend, has in turn, increased the level of concentration in domestic markets and
across European banking markets (Marques Ibanez and Molyneux, 2001).
At the same time in the transition countries a two-tier banking system was created. In
most of these countries the first commercial banks were carved out of the old central bank. In
Poland, for example, nine regional commercial banks were created based on the branch
network of the central bank. Besides in order to promote competition the minimum capital
requirement for a bank license was set at a low level and the review process was very lax. It
was a regulatory mistake, which resulted in a growing number of credit institutions, but did not
translate into growing efficiency of the banking system. On the contrary, the entry of
undercapitalized de novo credit institutions created a risk to the stability of the banking system.
Therefore after a brief period the authorities had to encourage foreign investors and large banks

11
to take them over. As a consequence the number of credit institutions after a short peak began
to decline.
Table 5 Number of domestic credit institutions
In the last decade almost all countries have experienced a sharp decline in the number
of credit institutions. In the years 1995–2004 the average number of credit institutions was
reduced by more then 27%. At the same time the number of credit institutions in the EU-15
remains higher than in the EU-10. The existing differences in the banking structure between
EU-15 and EU-10 are more visible when we apply the population weighted averages. In this
case the number of credit institutions is three times smaller in the NMS then in MS. However,
the high number of credit institutions in the MS is mainly due ta a large number of cooperative
and saving banks in Germany, France and Italy.
In the EU-15 the reduction in the number of credit institutions reflects a consolidation process
rather than liquidation of existing institutions. Among those countries the major reductions
occurred in Germany and the United Kingdom. However, at the same time Sweden, Greece
and Ireland report a substantial increase in the number of credit institutions, while it remains
almost constant in Denmark and Finland.
On the other hand, in the EU-10 the number of credit institutions shrank at the beginning due
to the large number of failures. The number of failures has been the highest in the group of
savings and cooperative banks. Meanwhile, the number decreased as external factors such as
acquisition of domestic commercial banks by foreign entities or mergers between regional
banks affected the ongoing trend. The pressure to merge operations stems either from inside or
outside the banking system. Inside as banks try to improve efficiency through mergers, and
outside as a consequence of bank consolidation outside the host country. As a result the
number of credit institutions in the EU-10 dropped significantly by more then 42%, from an
average of 262 in 1995 to 152 in 2004. Only in Lithuania and Czech Republic do we observe
an increase in credit institutions, while in Cyprus the number was almost unchanged. In all
other EU-10 countries the number of credit institutions decreased with major reductions of
around 50% in Poland, Estonia, Slovenia and Latvia.
Despite the declining trend in the EU-25, the number of credit institutions remains large
compared to the US or Japan. The large number reflects that the banking sector is still very
fragmented. Inside the countries the banking activity is dominated often by two to five

12
nationwide domestic universal banks. Other remaining institutions are small, regional saving
and cooperative banks. The steady development towards integrated European financial markets
has reduced the number of credit institutions and made the banking sector a little more
international. However, most institutions have only a domestic network and not a single bank
was able to build a European-wide network.
Subsequent to the introduction of the euro competition and cross-border consolidation
has intensified. As a result the number of cross-border mergers and acquisitions has been
growing and the number of credit institution in the EU-25 fell from 12, 256 in 1985 to 7,444 in
2003 (Dermine, 2005). However, the volume of the cross-border transactions is still modest
compared to the domestic ones.
In the EU-15 area out of a total of 2,549 transactions in the banking sector only 17% were
cross-border/within-industry and 6% cross-border/cross-industry over the period 1990-1999
(Group of Ten, 2001).
Table 6 Number of domestic, intra-EU and outside-EU mergers in Europe, 2001- 2004
In the EU-25 438 transactions involving at least on credit institutions were recorded over the
period 2001-2004. In the EU-25 68% of these transactions were within-border transactions,
26% transactions within European Economic Area, and only 6% of deals were with third
countries outside the EEA. In those period based on the number of transaction 354 (81%) deals
were reported in the EU-15 and only 84 (19%) in the EU-10. We get a slight different picture
of the consolidation process in the EU-25 when we compare the number of deals to the existing
number of credit institution. In this case the process of merger and acquisition was more
significant for the structure of the banking system in the EU-10 than in EU-15. In the EU-10
the number of mergers affected 14% of all institutions, while in the EU-10 it was only 6%. In
the EU-10 the high number of mergers was due to cross-border deals or consolidation of
domestic banks caused by mergers process outside the host countries. An illustrative example
is the recent purchase of the German bank HVB by the Italian UniCredito, which will spur a
wave of domestic mergers in the EU-10 as both banks had subsidiaries in CEE countries. HVB
was the biggest foreign bank in the CEE (including EU candidate countries) with a market
share of 5,4% and total assets of 35,5 bln euro at the end of 2004, while UniCredito had an
market share of 4,3% and total assets of 27,2 bln euro. The merger of HVB and UniCredtio

13
will create not only the biggest foreign bank in CEE but also it will often the biggest institution
in local markets.
The significance of foreign investors reflects the average market share of bank assets held by
non-residents amounts to 28% in terms of credit institutions assets for the EU-15 and 78% for
EU-10 countries at the end of 2004. As a result the difference in foreign ownership between
the MS and NMS was fifty percentage point, while the EU-25 average was 44% at the end of
2004.
Table 7 Share of foreign credit institutions as % of total assets of domestic credit institutions
The existing difference between EU-15 and EU-10 in bank ownership structure is more
significant when we calculated assets weighted average of foreign ownership. In the period of
1997 – 2004 the market share of foreign banks was on average 22% in the EU-25, constituting
17% in the EU-15, while in the EU-10 it was 55%.
These numbers hide enormous differences in consolidation and internationalization across
bank sectors in the EU-25. In the EU-15 area the consolidation process involves mostly small
and midsize domestic banks. The bigger banks have been left out of this process as there
appears to be reluctance across the EU-15 to see domestic banks pass into the hands of
foreigners. Thus governments and central banks encourage domestic banks to merge especially
if there is a threat of foreign acquisition. The defensive nature of bank consolidation is based
on the belief of the necessity of a strong home market before moving abroad (Boot, 1999).
Thus national champions are created in order to be competitive and they are protected from
hostile foreign takeovers. As a consequence in many leading European countries foreign
ownership does not exceed 15% of domestic credit institutions’ total assets. At the other end of
the spectrum, transition economies were eager to open their borders from the beginning of the
economic changes and foreign entities have been active since the early 1990s. Thus, foreign
entities already own more than 50% of the assets of credit institutions in these countries. In the
EU-10 area foreign ownership represents on average 77% of the banking sector’s asset at the
end of 2003, and in some countries foreign entities control over 90% of the banking market.
The privatization of credit institutions was the crucial factor affecting the ownership structure
of the banking sector. Foreign investors became the new owners of the largest banks, which
were formerly state-owned.

14
Therefore the new European Union presents a very mixed structure regarding foreign
ownership. Differences are not only visible between new and old members, but between small
and strong economies as well: the level of foreign ownership in 2004 is very high in Estonia,
the Czech Republic, Slovakia, Hungary and Luxembourg, while it is around 50% in Cyprus,
United Kingdom, and only 6% in Germany.
Divergence in foreign ownership has a strong impact on the market structure of the EU
and influences the number of credit institutions and the ratio of concentration too. Davis and
De Bandt (1999) provided evidence of monopolistic competition in a variety of European
banking markets in the mid-1990s. They noted that the competitive environment in French,
German and Italian banking markets still lags behind that in the USA. Our results of foreign
penetration as a prevailing large number of credit institutions confirm that these markets are
still closed to outside competition.
In order to capture the structure of the host banking system among member states we
calculated the five-firm concentration ratio (CR5) and the Herfindahl-Hirschman Index (HHI)
for all the twenty-five EU banking systems. Both our concentration measures are derived from
assets. We assume that the level of a bank’s assets is a good proxy for the level of its other
financial services in the market.
The CR5 is defined as the sum of the markets share of the top five credit institutions in
the industry. When we compare the percentage of the banking sector controlled by the five
largest credit institutions, measured in terms of total assets, we observe an increase in this
figure for most member countries in the period 1995 – 2004.
Table 8 Share of the five largest credit institutions in total assets in %
The rising trend in the CR5s reflects the ongoing process of consolidation and the decline in
the number of credit institutions in the EU-25. Table 7 shows that the concentration level in the
EU-25 has risen on average only 4%, from 57% in 1995 to 59% in 2004. The market share of
the five credit institutions seems to be lower, when we adjust the average by assets. The assets
weighted average of CR5 for EU-25 was 45% in the period 1995-2004, while for the EU-15
and EU-10 it was 45% and 60%, conversely.
However, the level of concentration is very different across member countries. In Austria,
France, Germany, Italy, Luxembourg and United Kingdom the combined market share of the
five credit institutions stay below 50%. Conversely, values of more then 80% can be observed

15
in Belgium, Estonia, Finland, Lithuania and Netherlands. This high level of concentration
should be a regulatory concern as it can disrupt local competition. Additionally it is a sign of
the oligopoly structure of the banking industry. In the EU-15 this is often the consequence of
banks expansion in size in the course of being promoted by governments with the aim to create
national champions. Marques Ibanez and Molyneux (2001) note that this can induce a “too big
to fail” problem in these countries. In their opinion the increased fragility of the system is
especially acute as banks attempt to regain lost profitability through the assumption of higher
risk.
Across member countries market concentration is lower on average in the EU-15 than
in the EU-10. The higher level of concentration in the transition economies can be explained
by the still dominant position of former state-owned saving banks. Yet, even though the CR5
does not reflect it, their market share is diminishing due to the growing competition of new
entrants. In addition most foreign banks after entering the market pursue the aim of enlarging
their market share. As a consequence they acquire the remaining domestic credit institutions.
This tendency accelerated as foreign credit institutions merged their operations as a
consequence of cross-border and domestic consolidation.
The CR5 measure is very popular because it has the advantage of being easily
measurable. On the other hand it has some limitations as it takes no account of the size
distribution of the remaining credit institutions in the sector. Thus, any change in the sector not
affecting banks inside the top five will not influence the CR5. Therefore we also use the
Herfindahl-Hirschman Index (HHI), a commonly accepted measure of market concentration,
which is more data intensive. The HHI is defined as the sum of the squared market shares of
the individual banks. Its advantage compared to CR5 is that it makes full use of information
about the market position of all banks (Bikker, 2001; Bikker and Haaf 2002a). It still attaches
greater weighting to larger banks, yet it includes all banks. The upper value of the index is
10,000 in the case of a monopolist and tends to zero in the case of a large number of firms with
very small market shares.
Table 9 Herfindahl-Hirschman Index (HHI) for credit institutions’ total assets
In the EU-25 the HHI is decreasing reflecting a downward trend in market concentration in the
period 1995-2004. The main cause for the decrease is growing competition and the new
entrants in the EU-10. In fact, behind this trend we can observe different behavior and levels of

16
concentration in the new and old member states. The banking sectors of the EU-10 remained
much more concentrated throughout the sample period than those of the EU-15. In smaller
member states, especially in the NMS, tend to have a high concentration in the banking sector
as measured by the HHI of total banking sector assets. In Belgium, Estonia, Finland, Lithuania
and Malta the HHI exceeds 1800 points, which is regarded as the high level concentration
threshold in many countries4. On the other side concentration remained relatively low in
Germany, Italy, Luxembourg and United Kingdom. In the last two countries the low level of
concentration is due to the presence of many foreign banks. As those institution do not directly
provide services to residents, so the level of concentration may be higher in the banking sector.
At the end of 2004 the HHI for assets was at 1,531 for the EU-10, while for the EU-15 it was
931. However, in the last decade the level of concentration in the EU-10 fell, which can be
explained by foreign bank expansion, while in the EU-15 it remained stable. Similar evidence
is conveyed by the assets weighted HHI, which presents lower level of concentration in the
EU-25, EU-10 and EU-15. The weighted average level of concentration was lower as larger
countries have a less concentrate banking sector.
A number of recent studies have attempted to measure whether a concentrated market structure
adversely affects competitive market conditions. Bikker and Haaf (2002b) and Claessens and
Laeven (2004) have shown that often a more concentrated banking system goes hand in hand
with a more competitive structure. Their results may suggest that a concentrated banking
structure can result in economies of scale and scope, as larger banks tend to be more efficient.
On the other hand high level of concentration as already present in Estonia may rise concern
about over the exploitation of market power by large banks.
2.3 The performance of the banking sector
In the last part of this section we focus on the performance of the banking industry,
providing a comprehensive set of bank characteristics in the EU-25. We use income statement
and balance sheet data of commercial banks, saving and cooperative banks from the
BankScope database provided by Bureau van Dijk. BankScope coverage is fully
comprehensive, accounting for 90% of all bank assets. We begin our analysis by comparing the
aggregate structure of credit institutions’ balance sheet items. Later we discuss the existing
4 According to US competition authorities, a number higher than 1,800 indicates a concentrated market.
17
differences in the structure, as they are a direct indicator of earning power and cost sources.
Finally, we provide some proxies for banking system efficiency, as it has a strong impact on
credit institutions’ profitability. While conducting this analysis, we need to take into account
that a credit institution’s balance sheet structure, together with its efficiency and profitability,
is strongly dependent on the structure of the financial system and competition inside the
banking sector.
The ratio of total loans to total assets reflects the role of the financial intermediary in
providing financing. We expect this indicator to be quite high, because of the important role
played by banks in the European countries’ financial systems.
Table 10 Loans as % of banks’ total assets
On average the level of total loans to assets is almost equal in EU-15 and EU-10 countries in
2003. Changes in the ratio indicate that credit institutions have significantly improved their
activity in financial intermediation in recent years. In Hungary, Estonia and Lithuania the ratio
is higher then in most EU-15 countries. The indicator is particularly low only in Belgium,
France, Ireland and Luxembourg. In those countries the low levels of bank credit to the private
sector are a sign of the disintermediation trend and the growing importance of financial
markets. Among EU-10 countries the ratio is relatively low only in Slovakia and the Czech
Republic. In this case it may be explained by the restrictive lending policy of credit institutions
due to bad loan problems in recent years.
The ratio of non–interest earning assets to total assets is a proxy of credit institutions’
ability to manage their assets and the cost of fixed assets. These earnings are, for example,
commissions paid by households for portfolio management; as a consequence this indicator
sheds some light on activity differentiation.
Table 11 Non-interest earnings assets as % of banks’ total assets
On average the level of non–interest earning assets to total assets is a little lower in the EU-10
than in the EU-15 in the years 1996–2003. However, in EU-15 economies non–interest earning
assets rise, while in EU-10 countries they fall. While in EU-15 countries the rise in non–
interest earnings is strongly correlated with an increase in capital, in EU-10 countries the fall
was probably due more to efficient management of assets. Besides, the ratio yields very
different results and presents a very mixed picture of the banking industry in the EU-25. At the

18
end of 2003 the highest values are observed in Finland, Lithuania, Portugal and France, while
the lowest values are reported in Germany and Cyprus.
Demirgüç–Kunt and Huizinga (1999) present evidence that profits appear to decline the
greater the proportion of non–interest earning assets. Thus, the existing different levels could
represent discrepancy in asset management and influence banks’ efficiency and profitability.
The ratio of customer and short-term funding to total assets provide information on the main
source of financing for credit institutions. It indicates credit institutions’ function as financial
intermediaries in the allocation of savings. The level of the ratio has an impact on the liquidity
position of a credit institution. Thus, it may influence credit institutions profitability as a higher
ratio means access to cheaper sources of funds.
Table 12 Customer and short–term funding as % of banks’ total assets
In the EU-25 customer and short-term funding amounts to 75% of total assets at the end of
2003. On average the ratio is higher for the EU-10 then EU-15 and amounted to 83% and 69%
as of December 2003, respectively. Those ratios suggest a strong position for credit institutions
in the EU-10 financial systems. In addition, the financial systems seem not to be affected by
disintermediation and credit institutions are still the main institution for allocating savings.
Conversely, disintermediation due to competition for savings and the change of investment
behavior has significantly reduced the role of intermediaries in the EU-15 financial system.
Among countries the lowest ratios are recorded for Denmark and Sweden, while the highest
are observed for Cyprus, Greece, Latvia and Slovakia at the end of 2003.
We measure capital adequacy of credit institutions by dividing book equity by total
assets. This measure is a proxy for stability in the banking sector. Demirgüç–Kunt et al (1999)
show that profit is positively related to the lagged equity variable. In their opinion well–
capitalized banks face lower expected bankruptcy costs for themselves and their customers,
thereby reducing their cost of funding.
Table 13 Equity as % of banks’ total assets
At the end of 2003 the ratio of capital adequacy is almost 7% for the EU-25. The
capital ratio varies considerably from one country to another, ranging from 3.43% in Belgium
to 10.69% in Estonia. On average the bank capital ratios were higher in EU-10 countries than
in EU-15 ones. The level of capital varies not only with the aim of satisfying prudential
regulation and the decisions of the owner and managers but also on the structural features of
19
their markets as well as the risk of economic shocks (Marques Ibanez and Molyneux, 2001).
As a result credit institutions in countries undergoing economic transition are under pressure to
keep a high level of capitalization. Additionally the increase in capitalization can be partly
explained by the need to fulfill the new regulation of the BIS Basel Committee.
The most popular proxies for bank efficiency are the ratio of overhead costs to total
assets and the cost income ratio. We begin with the overhead costs to total assets, which show
how effective credit institutions are in managing their fixed costs. By construction this ratio
strongly reflects variation in employment and wage levels in credit institutions.
Table 14 Overhead costs as % of banks’ total assets
Despite low wages the overhead variable appears to be higher in transition economies than in
the EU-15. In the years 1996-2003, on average, the ratio is twice as high in EU-10 countries as
in EU-15 ones. At the end of 2003 the overhead cost measure is notably high in Hungary and
Poland, at 4% and 3.84% respectively. The high value of the ratio probably still reflects over-
employment in credit institutions in those countries. Overall in all transition economies the
ratio has decreased and in the Czech Republic it has already reached a level comparable to
some EU-15 countries. Implementing new technology has been a major factor responsible for
the reduction in overhead costs.
The second efficiency measure, the cost-income ratio, reflects trends in both earnings
and costs. In this ratio the bank’s expenditures are related to income. European banks
significantly improved their costs side by reducing personnel and increasing productivity by
introducing new technology. As a result there is an overall downward trend in the cost-income
ratio. However, several income sources such as trading and investment banking are volatile
and fluctuate over time. Furthermore due to the merger and acquisition process in some cases
costs can rise in the short term. Thus, the cost-income ratio can vary in the short run, but
overall the trend has been downwards in Europe since the 1990s.
Table 15 Cost/income ratio as % of banks’ total income
In the EU-25 the average cost income ratio declined from 62.44% in 1997 to 61.85% in
2003. The table shows, however, that the trend in the cost-income ratio has been different
among member countries and over time. Belgium, Estonia, Finland, France, Greece, Ireland,
Italy, Malta and Spain witnessed efficiency gains, but in other countries the trend was in the
reverse direction. The cost improvements reflected also by the falling ratio of overheads to

20
total assets can in part explain the decline trend of the income ratio. Indeed, the overhead ratio
declines, both in the EU-15 and in the EU-10, and indicates operation rationalization and cost
cutting strategies of credit institutions. As we mentioned earlier, the increase in productivity
can be attributed mainly to the development and implementation of new technology. It could
also explain the significant variation in the cost-income ratio between EU-10 and EU-15
countries in the years 1996–2003. In transition countries this indicator rose until 1999, when a
high amount of investment has gone toward IT capital. Afterwards it was declining as the
productivity accelerated due to the new technologies and knowledge. Additionally, the
improvement was a natural consequence of privatization and acquisition by foreign entities. In
both cases we can observe an improved performance of credit institutions in transition
economies (Bonin et al., 2005). Thus at the end of 2003 the income ratios for credit institutions
in most EU-10 countries is in line with EU-15 indicators or even outperform them.
Generally, most European credit institutions will try to increase cost effectiveness by
further reducing wage costs, increasing revenue volume or by spreading operating costs over a
larger asset base via consolidation, which has already partially taken place in recent years.
The trends in overhead costs and cost-income ratios are reflected in the profitability of
credit institutions. We measure the profitability of credit institutions using two indicators: net
interest margin and return on assets. The net interest margin equals net interest income divided
by total assets. The measure reflects competitive conditions or efficiency in banking markets
and allows comparison over time and across countries. We are assuming that competition
enforces efficiency and lowers the margin. However, looking at Table 15 we see there are
mixed results.
Table 16 Net interest margin as % of banks’ total assets
Net interest margins in EU-10 economies are almost twice as high as in the EU-15
countries. However, generally the net interest margins are declining as most credit institutions
have been subject to increasing competitive pressure. In EU-10 countries the average net
interest margin fell by 36%, from 5.04% in 1996 to 3.25% in 2003. In the same period net
interest margins in the EU-15 countries experienced small fluctuations, in the range 1.90-
2.20%. The margins vary with the interest cycle but the overall trend is downward since the
1990s. The decline in net interest margin indicates that consolidation, the fall in the number of
credit institutions and foreign entry has not adversely affected competitive conditions in the

21
EU-25 banking system. However, the net interest margins are quite diverse. In the EU-15 the
lowest values are observed in Luxembourg and France, while among EU-10 countries Malta,
Cyprus and the Czech Republic are at the lower bound. Across EU-15 countries the highest
values are recorded in Greece, Spain and Italy, while among EU-10 economies Hungary and
Estonia hit the upper limit.
The results for return on assets (ROA) present a mixed picture for EU-25 countries.
The return improved among EU-15 countries, while in EU-10 ones there was a downward
trend. Given that the level of return in EU-10 countries was quite high the decline is
understandable. The high returns in those countries attracted new competition, which forced a
reduction in net interest margins and bank profits.
Table 17 Return on total assets as % of banks’ total assets
In 2003 profitability in Europe was almost 1%. EU-15 countries report lower
profitability then EU-10 economies, reflecting increased competitive pressure in EU-15
countries. Additionally the fall in share prices at the end of the 20th century had an adverse
effect on banking activities. Most EU-15 countries have kept their profits and the downturn has
not been severe. However, this does not hold for all countries. In Germany, Austria and France
the fall in profits in recent years indicates the fairly poor condition of many of their banks. This
condition reflects the unsteady situation of the banking sector due to strong government
intervention and lack of foreign competition. At the same time the rising return level in EU-10
countries indicates that banks have significantly improved their efficiency in recent years. In
transition economies the credit institutions often inherited the loan portfolio and deposit base
of the former state-owned banks. This meant that they continued relationships with state-
owned enterprises, the vast majority of which were struggling to survive and reorganize.
Additionally credit institutions were often under political pressure to continue lending to state-
owned or former state-owned companies. There was also a lack of a credit culture and the
credit procedures were lazy. Therefore the loan portfolios of credit institutions were often
excessively concentrated either in individual industries or in geographical regions. As
economic slowdown occurred it was then often accompanied by a large and expanding stock of
nonperforming loans, which created solvency problems for many banks. The poor performance
of credit institutions in some transition countries, like the Czech Republic, is a reflection of the
bad loans problems in this period and the years following it. As the countries moved forward

22
with economic reforms, the financial situation of banks improved significantly. The
governments often decided to restructure the credit institutions by selling them off to a foreign
entity and tightening bank supervision. Thus, the increasing level of foreign capital in
transition countries often reflects the growing bad debt problems in the financial system. The
entry of foreign entities stabilized banking systems by providing funding for the
undercapitalized and poorly performing credit institutions. As a result, the credit institutions’
performance has improved substantially, helped by enhanced productivity and improving
macroeconomic conditions.
Concluding, our results partially confirm and partially oppose the existing literature.
According to the Demirgüç–Kunt et al (1998) well capitalized banks have higher net interest
margins and are more profitable. Our study confirms these findings as we find the highest net
interest margins and profitability in transition economies. However, here higher foreign
ownership is positively correlated with higher interest margins. These results are different from
those presented by Claessens, Demirgüç and Huizinga (2001), where they report that foreign
entry in the banking industry is associated with lower non–interest income, profitability and
overhead costs. However, more advanced econometric methods would be needed to draw any
final conclusion from our results.
3 The capital markets
In the last decade European stock exchanges were not attractive to many local firms.
Despite the cost of listing, many European companies decided to cross-list on the US stock
exchanges. This was particularly important for companies from the high tech sector that found
on the US stock exchanges better financing opportunities and greater analyst expertise. In
addition export-oriented firms were interested as they used the cross-listing as an
advertisement. A comprehensive review of the literature and study on the characteristics of
European firms listing abroad was conducted by Pagano, Roell and Zechner (2002).
The fact that accounting standards and shareholders’ rights protection were lower in
many European countries and that transaction costs were usually higher can also explain why
many companies decided to list overseas: the commitment to higher accounting standards or
stricter rules provided companies with higher reputation and, therefore, more financing

23
possibilities. Of course, the larger is the market, the more opportunities there are for firms
wishing to expand their equity base.
Some studies have shown that cross-listing is also an outcome of income growth: when
GDP rises, not only do national stock exchange markets develop, but many companies decide
to list abroad too (Claessens, Kingebiel and Schmukler, 2002). There are some policy
implications for large migration of listed companies. The reduction of transactions on the
national stock exchange decreases its liquidity and the opportunities for small companies to get
listed. A stock exchange market has large fixed overhead costs for managing trading, clearing
and settlement systems, so if the number of transactions shrinks dramatically, the conditions
under which the market can operate efficiently are altered.
Intra-European cross-listing was less popular and often associated with the
privatizations of state-owned companies. Moreover cross-listing was induced in countries were
the domestic stock markets were shallow. Thus, companies decided to list on other European
stock exchange markets as they experienced a lack of demand for their stocks, which was often
also the result of poor investors’ rights protection.
In transition economies the privatization of former state-owned companies has induced
the development of equity markets: that’s how the first stock exchanges appeared in the Czech
Republic, Slovakia and Poland in 1992. After that stock markets were set up in other transition
countries. The aim of opening the stock markets by the government was to provide some
means of allocating and trading the ownership rights that came with privatization in the first
place (Bonin and Wachtel, 2003). As a consequence the future development of stock markets
was strongly influenced by the privatization strategies of the government in individual
countries. We can distinguish two main strategies: the mass privatization (voucher method)
and the graduate approach.
A strategy of mass privatization schemes was employed in the Czech Republic,
Slovakia and Lithuania. In these countries the stock markets quickly comprised a large number
of companies. However, the extensive equity markets restrained the liquidity. In addition the
widespread ownership limited the transparency and enforcement of corporate governance
mechanisms. Thus, few companies were traded and most companies were later delisted. As an
example in the Czech Republic 81% companies were delisted between 1995 and 1997 and the
number of listed companies declined from 1,716 in 1995 to 55 in 2004.

24
A different strategy to privatization and stock market development was adopted in
Estonia, Hungary, Latvia, Poland and Slovenia. In these countries the government decided to
privatize only financially sound and recognized companies via the stock market. In addition
minority stakes in the privatized companies were often sold prior to the initial public offering
to a foreign strategic investor. This provided an additional security for the government on the
success for the planned public offer and guaranteed also a higher price for the remaining
shares. As a result, the equity markets in those countries have been growing gradually and
provided adequate liquidity for the listed companies. In Poland, in contrast to the Czech
Republic, the number of listed companies grew steadily from 8 in 1992 to 250 in 2004.
However, many of those companies are currently closely held by strategic investors and
therefore the equity is not always liquid. Thus, this strategic approach to market development
also has some flaws but in the end it provided a more developed stock exchange to the
economy.
The 21st century has started with another revolution for European stock exchange
markets: deregulation, globalisation and technological developments have helped equity
market integration, through the creation of stock exchange market networks. European stock
exchanges have largely exploited this opportunity. They are particularly active, taking the lead
in forming and joining in active network cooperation (Hasan and Schmiedel, 2003). It is also
true, that the United States have already experienced this network creation over the last
hundred years: from about 200 at the beginning of the 20th century, US stock exchanges have
been reduced to about half a dozen today. European stock exchanges did not change over time,
and started to rethink their structure only in recent years. The first nodes of this large trans-
European market are Euronext, connecting the Amsterdam, Paris, Brussels and Lisbon stock
exchanges, and the Nordic and Baltic stock exchange, which combines the markets of Sweden,
Finland, Estonia, Latvia, Lithuania and Denmark.
Stock exchange networks satisfy the needs of companies seeking to broaden their
shareholders’ base and raise capital beyond local markets. Together with the dismantling of the
public system, this is what has probably induced the small countries of Estonia, Latvia, and
Lithuania to join the Nordic and Baltic alliance. It may be the only way they could avoid an
almost sure decline of the local market, undermined by the migration of the best companies
through cross-listing in international markets.

25
Another characteristic of stock exchange networks is their higher efficiency, granted by
extended trading hours, the possibility of remote membership, lower transaction costs and
greater information. All in all, an integrated European stock exchange market should lead to
greater efficiency. Network externalities may contribute a lot in increasing a market size and
activity.
Because of the development of the European exchange market networks, the traditional
distinction between market-based and bank-based financial systems starts to be less applicable,
as the very concept of national market is no longer clear cut. On the other hand we still believe
that the traditional classification can be useful in summarizing a financial system’
characteristics and as the stock markets integration is a present-day phenomenon (i.e. it affects
only the latest years’ data). At the last section of this paper we will show and discuss the
traditional indicators and compare them with those of countries from other economic areas. In
the meantime we will provide some information about the European stock exchange market
networks as a whole, as we believe that this will be an important characteristic of the European
financial system in the near future.
3.1 Market size
We will look at both shares and bond markets. We will examine all listed shares and
bonds in each market, regardless of the residency of the issuer and whether it is a public or
private entity. Data for the bond market are scarce and of lower quality. In order not to distort
the results about the equity market, and to provide more detailed insights, we will analyse the
two markets separately. As dynamic movements in market indicators are heavily influenced by
asset price changes, we will analyse average values over the period under examination. By
doing so we are neutralizing prices effects and capturing only structural characteristics.
The share market size is usually represented by the ratio between the market
capitalization of companies listed in the national stock exchange market and GDP.
Table 18 Market capitalization of listed companies as % of GDP
According to this indicator, the largest European stock exchange markets are in Luxembourg,
the United Kingdom, the Netherlands, Finland and Sweden. The London stock exchange (LSE)
is in absolute terms the largest in Europe; the Amsterdam stock exchange is large both in
absolute and relative terms. On the other hand, in absolute values the stock exchange is not
very large in Luxembourg, but, compared to GDP, it is the largest in Europe. The result for

26
Finland is mainly due to the single company Nokia that dominates the Finnish economy and
the stock exchange. Nokia’s market capitalization counted for around 60% of the total Finnish
stock exchange market capitalization in the last five years. This same phenomenon holds for
Sweden, even if to a much lesser extent: during the last five years, on average Ericsson
represented 30% of the total Stockholm stock exchange. Among the new accession countries
only Cyprus seems to have a market size comparable to previous EU members. The Wiener
Börse is particularly small and this is probably due to the centrality of banks in the Austrian
financial system.
The two groups are very different: the average size of the stock exchange in EU-10
countries amounts to a third of the EU-15 one. Excluding Cyprus, the market size is
homogeneous in this group: the market is not very large in these countries. The evidence for
the former EU members is more scattered, taking into account the different historical
developments of all countries concerned.
Over time the ratio of market capitalization to GDP does not vary much in most
European countries; the exceptions are Finland and Cyprus on the one hand, whose ratio has
risen substantially, and Luxembourg, showing an opposite downward trend. For Finland, again,
this is due to the market capitalization of Nokia, which had astonishingly high values in the
period 1999-2001. Now that Nokia’s shares values are to a more customary level, Finnish
stock market capitalization is still high, but in line with the relatively largest European stock
exchanges. The same pattern has been observed for Cyprus and for the same period (1999-
2001).
The size of a stock exchange market can also be examined through the number of listed
companies.
Table 19 Average number of listed companies
EU-15 countries have larger stock exchange markets than new members. Spain and the United
Kingdom have very large markets; French and German stock exchanges have many listed
companies too.
The British result is predictable, while the Spanish one needs to be stressed. It is due to
the fact that Spanish exchanges are an important market for companies operating in Latin
America. In fact, since 1999, the Spanish exchange has a market segment dedicated to the
Latin American companies that has risen a lot. At the end of 2003 Latibex had 31 listed

27
companies and currently and it is the third largest market by capitalization for Latin America
after Brazil and Mexico.
On the London market many of the listed companies are not of domestic origin.
Perhaps surprisingly, the London market is not the one that hosts the largest proportion of
foreign companies. It is surpassed by Luxembourg, which is the only country where the
number of foreign companies listed is higher (up to four times) than the number of domestic
ones. Listings on the Luxembourg stock exchange have been strongly encouraged by its
favourable legal and tax regimes. In addition the legal and political environment has become
particularly attractive to set up holding companies, which allow operation in other European
countries. These holding companies, created under the Act Sociétés Commerciales de
Participations Financières (SOPARFIs), benefit from dual taxation agreements or the EU-
Directive establishing a common tax regime between parent companies and their subsidiaries
within the EU. In addition to Luxembourg, the German Deutsche Börse and the Irish market,
even if smaller in size, also host a larger proportion of foreign companies (more than 20% of
the total) than the British one.
Among the new members only Poland displays a number of listed companies
comparable to the Slovak and Czech ones, and to EU-15 countries. For the Slovak and the
Czech Republics the figure has dramatically declined in recent years. This pattern is what
might be expected because of the privatization process: due to the mergers and acquisitions
that usually follow privatizations, a clear decline in the number of firms listed in the EU-10
countries might be expected, but this has not always taken place. Even if still small in size, the
Cyprus stock exchange is growing quickly. The number of companies listed in European
markets does not show a common trend between 1995 and 2003, and the differences across
countries are increasing.
It is worth noticing that the European stock exchanges are not completely dominated by
the British market, as one might expect from a historical perspective, but other markets, like
the Spanish and the German ones, are important. From now on, the competition from Euronext
and the Nordic and Baltic stock exchange has to be taken into account too.
An important part of the domestic capital market is the market for debt securities. In the
EU-25 member states bonds are traded mainly on the exchanges, yet the dealer market have
been developing quite fast in the last decade. In the EU-25 especially the euro denominated

28
bond market has been characterised by the growing use of multilateral electronic trading
systems, which allowed easier cross-border trading. The trend was clearly visible in the
government bond and asset or mortgage backed securities sector. In the EU-25 the number of
systems operating increased from 17 in 1997 to 31 at the end of 2003 .
However, the debt securities listed on stock exchanges are still dominant. In the EU-25 the size
of the domestic debt securities market reached 128.5% GDP at the end of 2004.
Table 20 Domestic debt securities as % GDP
The debt securities markets have been growing much faster in the EU-10 then in the EU-15
member states in the years 1995-2004. However, the debt market in the EU-10 member states
is still three times smaller than that of EU-15 member states with an average of 67% GDP and
146% GDP at the end of 2004, respectively. At this time the most developed domestic bond
market was in Denmark, Italy and Belgium within the EU-15 member states, and in the Czech
Republic, Hungary and Poland among the EU-10 countries. The weighted average present a
slight higher importance of the domestic debt securities market in the EU-25, yet the
importance decreases in the EU-15 and EU-10 member states.
At first sight the domestic debt market of Luxembourg and United Kingdom seems small
compared to that of other EU-15 member states. In those two countries, however, the debt
market is quite well developed, but a significant proportion consists of international bonds. In
those two countries they represent almost half of all the debt securities issued in the market. As
a result, when international bonds are included in the assessment of the debt markets, the
United Kingdom and Luxembourg have the biggest bond markets within the EU-25.
In the other member states within the EU-25 the bond market was until recently mainly
domestic. Pagano and von Thadden (1998) reported that at the start of 1990s almost all public
debt was issued domestically, while for private-sector issues the ratio of domestic to
international debt securities was about 4:1 in Europe.
At first sight the EU-25 domestic debt securities market seems to be more developed
than the equity market. However, the structure of the EU-25 debt markets as a whole is
dominated by bonds issued by governments, while the rest is distributed between financial and
corporate debt instruments.
It is often emphasized that the introduction of the euro created the biggest market in the world
for government bonds. It is described as a single market in as much as all government bonds

29
are issued in one currency. On the other hand the euro government debt market is represented
only by twelve countries of the twenty five member states. Furthermore there is no central
government issuer in the Economic and Monetary Union (EMU) and each member state has its
own fiscal policy. Thus, even though it is the biggest government bond market in the world it
is still divided among some national governments within the EU-25.
Table 21 Domestic government debt securities as % GDP
The recent increase in issuance of government debt instruments primarily reflects the
financing of fiscal imbalances of member states. At the end of 2004 the value of domestic
government securities as a share of GDP was 77% for the EU-25, while for the EU-15 it was
82% and 62% for the EU-10. The weighted averages presented slightly lower levels of
domestic debt for the EU-25 and EU-15, while for the EU-10 the weighted average was almost
ten percent lower.
Among the EU-15 member states the highest value of domestic debt was recorded for Greece,
Belgium and Italy. In the EU-10 the countries with the highest figures were the Czech
Republic, Hungary and Poland. In those countries the domestic government debt market has
increased 121% over the period 1997 – 2004. As a result in the transition economies the debt
securities markets are more developed than equity markets only due to the extent of the
domestic government bond segment.
The amount outstanding of privately issued debt in the EU-25 is still relatively modest,
but the issuance of bonds by financial institutions has increased noticeably in recent years.
Table 22 Domestic financial institutions debt securities as % GDP
In the EU-25 the share of financial institutions bonds as a share of GDP increased from 41% in
1995 to 47% in 2004. The difference in importance of the financial institution debt market
between the EU-15 and the EU-10 is significant. While in the EU-15 the share of financial
institution bonds was 53% of GDP, in the EU-10 it was merely 5% of GDP at the end of 2004.
In addition the weighted average present a lower level of importance of the financial
institutions bond in the EU-10 and EU-15, yet the indicator is slightly higher for the EU-25.
In the EU-15 the financial institution bond market is dominated by mortgage-backed securities,
especially by the Pfandbriefe. The Pfandbriefe is a bond of German origin, which is secured
either by first-ranking mortgages or public-sector loans. Therefore the security is perceived by
investors as an extremely safe investment vehicle, being covered by mortgage liens or

30
government guarantees. The security itself was issued for the first time more than 230 years
ago, however its popularity has drastically increased among member states due to the
regulatory framework at the EU level. Due to an EU-Directive the Pfandbriefe has been
recognized by the ECB as Tier 1 collateral within the EU-25. Consequently, it is the only
private debt instrument to be placed on a par with government bonds so far. At the same time
the Pfandbriefe offers a higher yield then comparable long-term government bonds (Rasche
and Hagen, 2003).
Another reason for the growing popularity of this security among financial institutions
and investors was the introduction of the Jumbo Pfandbriefe in 1995, with a minimum issue
volume of 500 million euro. In contrast to original Pfandbriefes, a Jumbo Pfandbriefe has to be
underwritten by at least 3 banks or securities traders. Moreover with the aim to create a
homogeneous and liquid market segment comparable to the government bond market, the
Jumbo Pfandbriefes have been standardized. Standardization and legal recognition has sparked
a growing demand for this instrument among investors. As a result, similar debt instruments
have been issued in other member states such as the Cedulas in Spain, the Obligation Foncière
in France, the Lettre de Gage in Luxembourg’s or the Asset Covered Security in Ireland. As a
result of this development Pfandbriefes are the largest segment in the private debt market
within the EU-25 (Kaiser and Heilenkötter, 1999).
Unlike debt issued by financial institutions, corporate bonds are not well established in
the EU financial market. Although the non-financial corporate bond market has been growing
rapidly in recent years it is still the smallest segment of the debt market in the EU-25.
Moreover this segment of the market has been growing much slower then the government or
financial debt market.
Table 23 Domestic corporate debt securities as % GDP
In the EU-25 the corporate bond market was equivalent to only 5.6% of GDP at the end of
2004. At the same time the average was over one percentage point higher for the EU-15
countries, while in the EU-10 the corporate bond market does not practically exist as it is
equivalent to only 1.5% GDP. The weighted averages confirms that the corporate bond market
has been growing steadily and is more significant in the EU-15 than in the EU-10. In addition
the importance of the corporate bond market in the economy of the EU-15 and EU-10
increases when we apply weighted averages.

31
Although the corporate bond market is still not very large within the EU-25, it has been
growing in most member states as corporations have increasingly been exploring the
opportunities for direct financing with better funding conditions. The switch to debt markets
was accompanied by increased financing needs, which were related to new technologies and an
intensive period of mergers and acquisitions. The surge in corporate bonds may also be a
consequence of EMU and the introduction of the euro. Hartmann et al. (2003) noted that after
the introduction of the euro, corporate net issues have been growing and sustained the level in
spite of a significant decline of non-financial corporations in recent years. The decline of the
non-financial corporation was caused by a wave of mergers and a record number of failures
over the last decade. Thus, Hartmann et al. (2003) attribute the growth of the corporate bond
market to the introduction of the common currency rather than corporate restructuring and
technological changes. These findings were confirmed also empirically by Rajan and Zingales
(2003), who reported that the euro had a positive effect on the amount of net debt issued.
Moreover our data shows that the largest increase in the importance of the corporate securities
domestic debt market was in those member states that also introduced the euro.
Besides the introduction of the common currency, the corporate issuance of debt instruments
was also encouraged by banks as a result of new BIS regulations and stronger competition in
the financial system. Thus, European financial intermediaries were helping their existing
customers obtain direct access to the capital market. Consequently it is hard to distinguish
whether the recent changes in corporate finance towards debt securities have been driven either
by market changes, corporation restructuring or the banks themselves (Pagano et al., 2004).
In the EU-10, especially in the transition economies, the bond market for non-financial
corporations is still very tiny. Nevertheless, in most of these countries the government has
recently made efforts to develop the debt market. For example, in Poland the legal barriers
have been eased. Moreover changes in the pension system in those countries should create
demand for corporate bonds, and enhance new issues in the long-term.
3.2 Market activity or liquidity
Size alone is not sufficient for understanding the relevance of the stock exchange in a
country. It is very important to analyse its activity, usually measured as the ratio between the
value of shares traded and GDP.
Table 24 Total value of shares traded as of GDP

32
The most active markets are the London and the Amsterdam stock exchanges. Transactions
volumes are high in Spain and Sweden too. Despite its large size, Luxembourg has a very idle
market, to the same extent as the Wiener Börse. The EU-10 markets have very small trading
volumes; Cyprus is, again, the only exception.
Looking at market activity the difference between the two groups is higher than when
we examined size. Even when countries are trying to catch up by expanding their stock
exchanges, these markets are still not very active. Enlarging a market seems to be easier than
having a dynamic one. Almost all markets have recorded a peak in activity in 2000; after this
exceptional year they all have returned to a stable level. Intra-group differences are higher for
the EU-15 countries.
We are able to provide the evidence on bonds trading volumes only for a restricted
sample.
Table 25 Average value of bond traded as of GDP
The EU-10 countries have almost no bond trading: positive trade values are recorded for Malta
and Hungary, but these are quite small and much lower than the trading volumes in EU-15
countries. The data for EU-15 countries is more diverse: the stock exchanges that have a higher
activity in bonds are located in Denmark, Sweden and Italy. Together with the London stock
exchange and the Amsterdam stock exchange, these are the only markets which record any
significant activity in bonds. For Italy the reported average is influenced by the large values
traded in 1996-1998; the ratio is quite low in recent years. In the late Nineties the highest trade
volumes of bonds were recorded and these years were characterized by high volatility. In
recent years, trade volumes are more stable and their average level is quite low.
Combining the information on size and activity, we get a measure of a market’s
liquidity; the ratio between the value of shares traded and market capitalization is also known
as market turnover ratio.
Table 26 Shares turnover ratio of stock traded in %
As far as shares’ trading is concerned, the most liquid markets are the Spanish exchanges, the
London stock exchange and Deutsche Börse. The high turnovers in Sweden, Italy and the
Netherlands are worth mentioning, also because of their huge increase. Turnover seems to be
particularly low in Luxembourg and Malta. Only Hungary and Cyprus, and Poland and the
Czech Republic to a lesser extent, seem to have kept pace with the EU-15 countries. Budapest

33
is the only EU-10 stock exchange with an average turnover higher than the overall European
average.
The difference between the two groups is quite high: average turnover for the EU-15
countries is more then twice the one for the EU-10 ones. Except for the Wiener Börse, all EU-
15 markets show an ascending trend over time, even with increasing divergence between
countries. The evidence for EU-10 countries is more complex, but is becoming more
homogeneous over time: if there is any, except for the peak reached in year 2000, a downward
trend is observed.
In all the countries examined, bond market turnover is not significant, meaning that the
European bond market is not liquid. The highest ratio (0.33%) is recorded for Denmark and
Sweden.
Lastly we briefly describe an indicator of stock market significance designed to
measure a market’s ability to finance investment for the national economy. This is the ratio of
the capital raised through the stock exchange to gross fixed capital formation.
Table 27 Average investment financing
Again the London stock exchange and the Spanish exchange stand out. Only Malta seems to
have a similarly significant stock exchange. Euronext, even if performing better than other
European markets, has still some way to go before being as influential as the London stock
market. The Hungarian, the German and the Polish markets’ contribution to the financing of
investments is fairly irrelevant.
3.3 Overall market development
We will now identify in which countries the stock market is developed, and in which it
is not. This does not necessarily imply that a financial system is market-based: this latter
definition can be assessed only when putting together all the results. For the time being we can
just observe which countries have a developed stock market as measured by the examined
ratios through a cross-country comparison. As before a financial system will be said to have a
developed market if its ratios are at or above the European average. We will deliberately not
look at the two sub-samples separately (EU-15 and EU-10) because we are trying here to start
considering the European financial system as a whole. We will also not consider the bond

34
market, due to the scarcity of observations since this hinders reliable cross-country
comparisons.
Markets are very developed in the United Kingdom, the Netherlands, Spain, France,
Germany, Finland and Sweden. Luxembourg is not included here because of its very low
activity in shares, which we judge outweighs the overwhelming international importance of its
bond market.
We have classified Finland and Sweden as having developed markets, but we know that
the result is due to the aforementioned presence of two large firms, Nokia and Ericsson, that
constitute the largest part of the two markets, both in terms of capitalization and activity.
For all other EU-15 countries it is difficult to state clearly to what extent the stock
market is developed. Here are some examples: the Danish and Italian markets are quite small,
but trading activity in both markets is very large and promising for future development. At the
opposite extreme, Belgium and Ireland have a large capitalization, but low market liquidity.
The Athens stock exchange and Euronext Lisbon are the latest markets to be included among
developed markets by private mutual funds.
Among EU-10 countries only Cyprus seems to have an almost developed stock
exchange market. The Eastern European countries have no developed market. Some authors
have wondered whether the establishment of a stock market in some transition economies
represented nothing more than a potent symbol of capitalism (Bonin and Wachtel, 2003). This
doubt is legitimate, because most of these markets are still very small and illiquid, and have so
far served only privatization needs. Not only are they small relative to the European average,
but both size and activity are usually lower than the values recorded in countries with similar
levels of output. It may well be that these markets are very young and will naturally grow and
develop, but this eventual development is influenced by many factors: the appealing possibility
of cross-listing, the joining of stock exchange networks, the presence of firms large enough to
go public, the regulatory environment, overall economic growth, and so on. We could also
wonder whether it is necessary for a small open economy to have its own stock exchange
market, as long as access to foreign capital and global financial markets is guaranteed. A
counter-argument is that domestic stock markets, especially in transition economies, play an
important role for foreign investors, because an equity market investment, being more liquid,
may represent a valid alternative to foreign direct investment. In fact, non-resident investors

35
have substantial holdings in transition economies that have more developed stock markets
among EU-10 countries (Hungary, the Czech Republic and Poland).
3.4 Euronext and the Nordic and Baltic Stock Exchange
On September 2000 Euronext N.V., a holding company incorporated under Dutch law
that operates through local subsidiaries, was formed: the Amsterdam Exchange, the Brussels
Exchange and the Paris Bourse received shares in this new company in exchange for their
existing interests. The former companies retain their identity under the new names Euronext
Amsterdam N.V., Euronext Brussels N.V. and Euronext Paris N.V. and remain under the
supervision of national authorities. The Euronext stock exchange expanded at the beginning of
2002 with the merger with the Portuguese Bolsa de Valores de Lisboa e Porto, now Euronext
Lisbon N.V.
Euronext works as a unified market: there is a single list and clients can have access to
it through the national market, that now acts as portal to the wider Euronext list. Depending on
their liquidity, shares may be traded either continuously or by call auctions held twice a day.
Moreover, there are two special categories or compartments: NextEconomy, for high tech
companies, and NextPrime, for traditional industries. These are designed to help raise the
profile of companies complying with stricter reporting standards than required by ordinary
regulation. This was exactly one of the reasons that we have mentioned as a cause for cross-
listing on US stock markets. This provision is one of the reasons why we believe that Euronext
can help overcome the relatively inferior position of European stock markets.
While Euronext is a typical case of horizontal integration (i.e. different markets have
merged), the Nordic and Baltic security market is a case of vertical integration, as it originates
from the exchange division of OMX, a Swedish company, provider of technology, processing
and outsourcing solutions. In 1997 the Stockholm stock exchange established a close
cooperation with the Copenhagen stock exchange. But this cooperation was just a first step
towards integration. The first real alliance took place in 2003 between the Stockholm stock
exchange and the Helsinki stock exchange that also brought its existing engagement of
operating the exchanges in Estonia and Latvia. At the same time Lithuania participated in the
merger too. In December 2004 the Copenhagen stock exchange has announced having signed
an agreement for combining with OMX.

36
The goal of the Nordic and Baltic stock exchange market is to have access to a very
large list through national markets, which are well known by national investors. While
Euronext is ahead in terms of establishing a common trading platform, a central counterparty
clearing house, harmonized rules and regulations, the Nordic and Baltic market still has some
way to go, but has, as a strong suit, a very flexible, state-of-the-art technology, that proves to
be an important component for the competitive power of a mid-sized market. We also believe
that this market could be of crucial help for the three Baltic countries, whose exchange markets
were completely rebuilt during the first Nineties after independence from Soviet Union.
Without the Nordic and Baltic market integration, it could have taken a very long time for
them to catch up with the rest of the European Union.
Both Euronext and the Baltic and Nordic stock exchange have very active derivatives
markets. In 2002 Euronext bought LIFFE (London International Financial Futures and Options
Exchange), now Euronext.liffe. A single market for derivatives was created by bringing
together all the derivatives products together on a single electronic trading platform, LIFFE
CONNECT. On the other hand, besides collecting the Nordic derivatives markets from the
participating markets, OMX has started cooperation with EDX London, a British company that
offers trading services on 3 linked derivatives exchanges: the Stockholm Stock Exchange in
Sweden (offering Swedish and Finnish products), the Copenhagen Stock Exchange in
Denmark and Norway’s Oslo Børs.
The figure shows the relevance of the networks compared to the largest independent
stock exchanges markets, i.e. the UK, Germany and Spain.
Figure 2 A comparison of some of the largest stock exchange market
Regardless of the fact that during the last year the Nordic and Baltic stock exchange has
experienced an increase in both share trading and market capitalization, it is still the fifth stock
market in Europe. For the time being the British predominance in Europe does not seem to be
in danger. Even if the proposed merger between Euronext and the London Stock Exchange
would have been realised, its capitalization would be still well below that of the New York
Stock Exchange, in spite of the relatively small number of listed companies there. However,
the European exchanges are more liquid than the NYSE: the turnover ratio is higher in the
Spanish and German markets, but the Nordic and Baltic market performs quite well too, in line

37
with the turnover ratio of Euronext. European markets, even if smaller in size, are then more
active than their main competitor.
4 The importance of other financial corporations
The enlargement of the EU-25 accelerated the process of financial integration and is
already evident in the banking industry and capital markets. The developments in each of these
main areas have been summarized above emphasizing that the extent of integration across
markets is not uniform.
Insurance companies, investment funds and pension funds are notable features of OMS
financial system, while in the NMS these financial institutions have only marginal importance.
In part this is due to the breadth of activities and the historically strong position of universal
banks. The development of these financial intermediaries is strongly connected with the
problem of aging of the population and ongoing pension system reforms.
Within the EU-25 the total investments of insurance companies represented 48 per cent
of GDP in 2004, an increase of almost 10 percent since 2001. In the NMS the increase was
especially significant: total investments of insurance companies increased almost 30 per cent
over the years 2001-2004, mainly because of an increase in spending on life insurance. The per
capita life insurance premiums have increased by 37 per cent since 1996 and were equal to
€776 in 2003, yet there is a lot of cross-country variation in the average life insurance spending
in the EU-25 (Swiss Re, 2000; 2004).
Also investment and pension funds have become a powerful factor in the financial
services industry as a result of changes in saving patterns caused by demographic changes and
decreasing yields on bank deposits and other traditional financial instruments.
Owing to favorable tax treatment the assets under management by investment and
pensions funds are already comparable in some countries to those of the banking industry. The
growth of investment and pensions funds was encouraged also by credit institutions and
insurance companies as asset management makes up an important share of their non-interest
income. Nevertheless, there is still significant potential for growth as weighted average assets
managed within the EU-25 without Ireland and Luxembourg amount only to 29 per cent of
GDP in 2004 compared to 70 per cent in the US.

38
Table 28 Total investments of insurance companies and total assets under management
as per cent of GDP
4.1 Insurance corporations
In recent years the insurance sector has been going through a period of rapid change in
the EU-25, which was partly driven by the liberalization of insurance and capital markets. The
harmonization of insurance regulation has created an almost homogeneous insurance market in
terms of supervisory control in the EU-25, even though some differences still remain that are
upheld by the authorities in the member states. The creation of a unified insurance sector and
the removal of existing barriers within the EU-25 financial system has intensified the
competition of insurance companies and encouraged domestic or cross-border consolidation.
Moreover recent changes in information technology have provided additional incentives to
consolidate and boost efficiency at the same time.
According to the Comité Européen des Assurances (2002) in spite of the tendency to
consolidate in recent years, the number of active companies still remains high. In the EU-25
5,322 insurance companies operated in 2002, of which 4,693 were in the EU-15. However, the
number of companies operating varies among member states between several dozen companies
in the smaller insurance markets to several hundreds in the larger markets. In the large markets
the average share for the five largest companies does not generally exceed 40% to 55% of the
insurance market, while in the small markets the ratio lies between 60% and 70%.
Consequently, the insurance market seems less concentrated then the banking market for the
EU-25.
The United Kingdom, which has the largest insurance market among the member
states, has also the highest number of insurers. On the other hand, the number of insurers does
not always express the volume and level of the national insurance market. In Spain there are
ten times as many insurance companies as in Austria, but the volume of premiums is lower.
Therefore, despite the harmonization process and changes in the financial system, there are still
significant structural differences between national insurance markets within the EU-25.
In our study the existing differences and the potential of the EU-25 insurance market
will be documented by two indicators, premium per capita and share of premium in the
formation of GDP. The first indicator presents the density of the insurance domestic market
and represents the average insurance spending of each resident. It provides an indication of the

39
insurance purchasing power in each member state. The second indicator, penetration, measures
the significance and the importance of the insurance industry in the domestic economy.
Although there are significant variations in insurance spending among member states
the life insurance market has grown and strengthened in the EU-25 in the last decade.
Table 29 Per capita life insurance premium (in euro)
The growing share of life insurance in the national markets is an indication of financial market
and economic development. In the EU-25 per capita life insurance premiums increased by 37%
since 1996 and were equal to 776 euro in 2003. However, there is a lot of variation in the
average life insurance spending per capita and growth among EU-25 countries. Moreover, the
EU-10 lags significantly behind the average of the EU-15 in life insurance penetration. In the
years 1996–2003, on average, life insurance spending in the EU-10 countries was 10 percent of
that in the EU-15. The lowest levels of spending were reported in Latvia and Lithuania, and it
was more then hundred times lower compared to countries with the highest per capita
expenditures. The level of the spending reflects the still very weak position of the life
insurance industry in the transition economies. However, the industry should develop as
pension reforms are put in place and the economic situation improves.
In the EU-15 the United Kingdom, Ireland and Finland have the highest per capita
expenditures in 2003 while in the EU-10, Cyprus, Malta and Slovenia are in this position. In
the EU-10 countries the low level of density was compensated by higher growth rates of life
insurance premiums. In the EU-10 the growth rate in insurance premiums was 70% for the
years 1996-2002, while in the EU-15 it was 53%. In the EU-25 the life insurance sector growth
was fuelled by growing concerns about state social security based on the pay-as-you go
system. Since many people fear that the future benefit may be inadequate, there has been an
increase in demand for life insurance products, especially in more developed countries. This
growth is often fuelled also by additional tax brakes offered by the governments with the aim
of encouraging the growth of private pension systems.
At the same time the non-life insurance industry was developing much slower than in
the life insurance sector.
Table 30 Per capita non-life insurance premium (in euro)
The average growth rate in non-life insurance spending was 9% for the EU-25 in the years
1996 - 2003, with the growth rate being almost twice as fast in the EU-15 as in the EU-10. In

40
2004 the average non-life insurance spending was 755 euro in the EU-25, while in the EU-15 it
was 1,059 euro and in the EU-10 it was 248 euro.
In the EU-10 the higher level of non-life expenditure per capita was largely determined
by car insurance. In the transition economies it is the most important line of business in
insurance services mainly due to the introduction of the statutory minimum coverages by the
EU. The legal obligation of minimum coverage explains also the high growth rates in the non-
life insurance sector in the transition countries. As a result, Latvia and Lithuania, which have
the lowest levels of insurance spending per capita among the EU-25, have a non-life per capita
expenditure five times larger then that for life insurance.
On the other hand, the low level of growth in non-life business reported in the EU-15
was mainly due to the saturation of markets, lack of demand and falling premium rates
following an increase in competition after the EU insurance market deregulation. Nevertheless
among old member states the highest non-life insurance spending was reported in United
Kingdom, Netherlands and Ireland. As in the EU-10 the highest levels could be observed again
in Cyprus, Malta and Slovenia.
The country’s level of insurance spending indicates the significance of the insurance
industry in the financial system and economy. In the EU-25 the life and non-life insurance
industry account for a total premium income of 6.14% of GDP. However, the development of
the industry is unevenly distributed among member states and the life and non-life businesses.
Table 31 Life Insurance premiums as % of GDP
In the EU-25 the average level of life insurance premiums was 3.25% of GDP in the year’s
l996–2003. In the EU-15 the share of life premiums to GDP increased from 3.69% in 1996 to
4.62% in 2003, while in the EU-10 the share increased from 0.94% to 1.33%. Consequently,
the life insurance sector grew twice as fast in the EU-10 as in the EU-15. Nevertheless the
significance of the life insurance industry in the economy is minor, especially in the transition
countries. In Lithuania and Latvia, which had the lowest ratio among all member states, the
share of life insurance premiums to GDP was 0.40% and 0.09% in 2003, respectively. Those
countries were followed by Greece with a share of 0.93% in 2003, which was even lower then
in the other EU-10 countries.
On the contrary, the highest share of life insurance penetration reported was in the
United Kingdom with 8.62% in 2003, followed by Belgium and Finland both with 6.81%. The
41
highest shares among the EU-10 were reported again in Malta and Cyprus with a ratio of
2.52% and 2.29%, respectively.
The share of life insurance penetration between the lowest and highest values among
member states presents enormous differences in the significance of the insurance industry
within the EU-25 financial system. On the other hand the level of development of the non-life
insurance industry is more balanced in the EU-25.
Table 32 Non -life Insurance premiums as % of GDP
In the EU-25 the share of non-life premiums to GDP increased slightly from 2.74% in 1996 to
2.76% in 2003. The increase of non-life penetration was mainly stimulated by development of
the industry in the EU-10, which reported a growth rate of 34.86% in the years 1996–2003. In
contrast in the same period the growth rate for the EU-15 was negative at
-3.62%. As mentioned before, the stagnation of the non-life business has been mostly due to
massive competition in a saturated market, at the same time as the EU-10 countries benefited
from a low level of per capita expenditure presenting a large potential for growth.
In all member states the non-life insurance industry is an important part of the economy
and the penetration ratios varied between 1.11% and 4.94% in 2003. The lowest share of non-
life insurance premiums to GDP was recorded for Lithuania, while the highest was for the
Netherlands. Consequently, the existing differences in penetration between member states are
less substantial in the non-life insurance industry than in the life insurance industry.
Concluding, there are still large differences in the importance and penetration of
insurance in the EU-25. This primarily concerns the difference between the EU-15 and EU-10,
but there are also differences within those two groups of member states. Moreover they are
more significant in the life insurance market then in the non-life market, which may be a result
of differences in the state social security system and the tax treatment of private pension plans.
5 The legal and fiscal environment
5.1 The legal system
La Porta, Lopez-de-Silanes, Shleifer, and Vishny (1997, 1998) (henceforth LLSV)
provided evidence that legal rules and their enforcement are determinants of financing patterns.
In their study they collect data on legal treatment of shareholders and creditors, the efficiency

42
of the legal system in enforcing contracts and accounting standards. According to LLSV
(1998) legal origin may explain the international variation in financial systems and the level of
financial development. The results were later confirmed by Levine (1997), who using cross-
country data from LLSV presented evidence that the legal status of a country has an effect on
financial development and long–term economic growth. Since then various studies have shown
that legal origin has an influence on economic growth by shaping the national financial system.
Thus in this section we present the legal treatment of shareholders’ and creditors’ rights,
banking institutions regulations and the efficiency of the legal system in the member states of
the European Union.
Simplifying to some extent, the legal system in the member states consists of EU law
and domestic law. The EU law is based on treaties, regulation, directives and decisions. The
rights granted by the EU legislation have priority over the domestic law and may be claimed
even if member states have failed to introduce them into domestic law or have not
implemented them correctly. As a result, the legal system in the EU gets more uniform as the
member states are responsible for making their domestic laws in order to conform with EU
regulations. Nevertheless the legal systems still differ among member states as in many
countries unique legal solutions have prevailed in conformity with their legal tradition and
heritage.
In Europe the origins of the legal system are derived either from Roman law or
common law, which is based on case law applied in Great Britain. LLSV (1998, 1999). Note
that within the Roman law tradition there are major families that modern laws originate from:
French, German and Scandinavian. As a consequence they divide countries into those with
prominently English, French, German or Scandinavian legal origins of company or commercial
law. In the EU the traditional distinction among civil law families has become difficult as they
become more homogeneous as a result of the ongoing exchange of legal models. It would be
very problematic to classify, for example, the Polish legal system, within one of the
subfamilies. LLSV would probably classify the Polish legal system to the French civil tradition
since the Napoleonic Code was introduced in the Duchy of Warsaw in 1808. However, in
Poland the civil code was again revised in 1933, where the creditor rights were then based on
the Swiss law, and the new commercial code was almost a copy of the German Commercial
Code. In addition a significant revision of the civil law and commercial law, which was a part

43
of the ongoing process of harmonizing the national legislation with EU directives, was finished
in 2001. As a result a new company law was introduced, which was strong influenced again by
the German Law. Therefore the Polish civil law, where commercial law is only a part of it,
presents currently a mixture of French and German law. Thus, any classification into the three
civil law families would be almost impossible and misleading. In order to avoid any problems
with legal classification we decided so to use the historical distinction and divide the countries
legal origin only in either to be civil law or common law. Subsequently we had no problem in
the classification of the member states legal origin with the exception to one country. The
country was Malta, where the legal origins compromise both the civil law and common law.
However, in Malta the private law is derived from Napoleonic codes and thus we classified the
legal system to the civil law family. Among the member states only Great Britain, Ireland and
Cyprus belong to the common law family and in the rest 22 EU countries the legal system
origins from the Roman civil law.
We use two indexes to measure the legal treatment of shareholders and creditors in a
country. These indexes are created by aggregating indicators, which can take the value of zero
or one. The first index of shareholder rights aggregate six indicators and it ranges from zero to
six. The indicators provide information on the rights of minority shareholders against large
shareholders. A higher value of the index means that the shareholders are better protected
against expropriation by large shareholders and management and therefore should be more
willing to provide external financing. Additionally to this index we present an indicator for
voting procedures and mandatory dividend. The first indicator shows if companies are subject
to one – share – one vote rules in the country, which should better protect investors. The
second indicator can be treated as a substitute for the weakness of protections for minority
shareholder rights (LLSV, 1998). LLSV (1998) show that common law countries provide
better protection for shareholders’ rights in the EU. The highest value is observed in Great
Britain, whereas Belgium and France have the lowest levels in the EU area. The level of
shareholder protection is considerably higher in EU-10 countries than in EU-15 countries. The
high values are mostly due to regulations in the transition economies, which improved
significantly in recent years in order to attract outside investors. Compared to the average
indicators of LLSV (1998) calculated for 49 countries, the EU provides better shareholder

44
protection based on the index and the regulation of a single vote per share but provides on
average a lower mandatory dividend.

45
Table 33 Shareholders’ rights in Europe
The second index, creditors’ rights, aggregates four indicators and it ranges from zero
to four. The first two focus on the rights of creditors in reorganizations and the next two on
bankruptcy. In countries with a higher value of creditor rights, outside investors have more
rights relative to the management and other stakeholders, and should therefore be more willing
to provide external financing. We use legal reserve requirements as an additional indicator to
measure shareholder rights. This requirement obliges companies to maintain a minimum level
of capital to avoid liquidation. The regulation protects creditors of a company as they have
limited possibilities to force liquidation before the capital is wasted (LLSV, 1998). We can
observe that the index of creditors’ rights is higher for common law countries then for civil law
countries. On the other hand, the required legal reserve could only be observed in the civil law
countries. Slovakia and Great Britain have high levels of creditor rights among the member
states, while Estonia, Finland, Greece, Hungary, Lithuania and Portugal have low levels of
creditors’ rights. The new accession countries present higher creditors’ rights and require
higher legal reserves then the EU-15 countries. Compared to the average indicators of LLSV
(1998) calculated for 49 countries, the EU has a lower level of creditor rights but requires a
higher legal reserve.
Table 34 Creditors’ rights
In order to better understand the performance of the financial system in the EU, we
examine different regulations for bank activities in the member states. In the last decades, the
regulation of the financial system of EU has changed dramatically. In 1993 the single market in
banking was inaugurated, transforming the regulatory environment for financial institutions
and markets in the EU. The intent was to unify regulation by defining and specifying the banks
activities that could be undertaken inside the EU. The regulation introduced also the concept of
a single license and mutual recognition. Since then bank licensed in any EU nation are allowed
to do business in any other EU nation on whatever basis it considers most advantageous.
Additionally the host nation allows banks to do whatever is permitted in that bank’s domestic
sector and recognizes also the primacy of home–country control. Today the primacy of home–
country supervision is often seen as the main barrier in cross - border merger and acquisitions
inside the EU. The national central banks and their supervision arms prevent cross-border
consolidation in order to keep control of their domestic banks and financial system.

46
The main stage in the convergence process of European banking was the Second
Banking Directive, which was adopted in 1989 to be implemented at the beginning of 1993.
Thus, by the end of 1992 all member states had to have in place laws and regulations consistent
with this directive. The harmonization of legislative financial regulation and the adoption of
common prudential regulation favored the full integration of the previously segmented banking
sector. It was expected that the elimination of regulatory disparities would have created the
necessary condition to obtain convergence in financial structures and bank performance.
However, Montanaro, Scala and Tonveronachi (2001) point out that contrary to expectation,
experience presents a lack of convergence in the structural models of banking. They observe a
significant process of polarization and divergence in the performance of the European national
banking sectors. The lack of convergence can be explained partly by the prevailing disparities
in financial regulation, state intervention and protectionism.
The range of activities that credit institutions are able to undertake by law has an
impact on the profitability and safety of the banking sector. Thus in order to present the
existing disparities inside the EU financial system we use an index on the degree to which
national regulatory authorities permit banks to engage in securities, insurance and real estate
activities and ownership of non-financial firms. The index is an aggregate of the four activities
rated from one to four, with larger numbers representing greater restrictiveness. We have also a
measure which equals one if the country’s banking system has deposit protection and zero
otherwise. The banking systems in civil law countries are less restricted then in common law
ones. Among the member states the less restrictive banking systems are in the Netherlands and
the United Kingdom, while Malta and Luxembourg are the only two countries in the EU,
which don’t provide deposit protection. Furthermore, the activity of banks in the EU-15 area is
more restricted then in the new accession countries.
Table 35 Financial systems’ regulations
The legal system can only provide a protection of shareholders’, creditors’ and
financial institutions’ rights if there are procedures and courts able to enforce them. LLSV
(1998) note that a strong legal enforcement could substitute for weak rules since well–
functioning courts can step in and protect the rights. On the other hand even the best rules are
weak without a well functioning enforcement. Therefore we use four measures to proxy for the
quality of law enforcement. The first three indicators measure the differences in contract

47
enforcement by providing information on the number of procedures from the moment the
plaintiff files the lawsuit in court until the moment of actual payment, the associated time and
cost of the whole procedure. The last indicator is an assessment of the law and order in
member states that ranges from zero to ten, with a lower number representing weak law and
order. This indicator is an overall index based on 22 components of risk constructed by the
Composite International Country Risk Guide (CIRG) and we calculate it as an average over the
period 1995–2003. In the EU, common law countries have better law enforcement then civil
law countries. Denmark, Ireland, Netherlands and United Kingdom are the countries with the
best law enforcement, whereas the Czech Republic, Italy, Poland and Slovenia are those with
the longest procedures and highest costs of law enforcement. Nevertheless on average the EU-
10 countries present better law enforcement then the EU-15 countries. In the new accession
countries the system is less formal and the time to enforce the contract is shorter and the cost
lower. On the other hand, the EU-15 countries have a higher level of law and order than EU-10
countries. The lowest level in the EU-25 is recorded for Luxembourg. On average the indicator
law and order index is higher in civil law countries then in common law countries.
Table 36 Law enforcement
Concluding, the results show that the legal environment in the EU-10 countries seems
to be superior to those in the EU-15 countries. The new accession countries provide better legal
protection for investors and are more efficient in enforcing them. Additionally in the EU-10
countries the banking system is less restricted then in the EU-15 area, which should result in
higher efficiency and lower risk. Taking into account the legal families in the EU-25 we
observe that countries belonging to the common law family provide considerably better
shareholder protection then civil law countries. The existing differences are smaller in the case
of creditors’ rights and the right of banks to engage in different non bank activities. Thus, EU-
25 countries with common law provide better protection for investors, more freedom for banks
and are more efficient than civil law countries.
5.2 The corporate and capital income taxes
The EU has a single financial market and is also integrated in real terms, yet the tax
policies in the member states still present a lot of discrepancy. As a result there is a lot
variation in the tax rates among member states although most of the governments have taken

48
steps to harmonize the tax levels. In addition, most governments have decided to reduce the
existing tax burden with the intention to improve countries’ competitiveness and enhance
future economic growth. It has been long assumed that the existing level of countries’
corporate and capital income taxes affect the level of economic development, mainly through
foreign direct investments flows. This assumption was confirmed empirically by various
studies, which reported that the level of taxes influence investment decisions of multinational
firms (Bénassy-Quéré et al., 2001; Desai et al., 2002). Thus, there is currently a strong belief
that member states may use corporate tax cuts in order to attract foreign companies with the
aim of reducing domestic unemployment at the expense of other member states. The problem
is especially severe since capital markets are becoming integrated in the EU, allowing capital
mobility, and hence they are tax sensitive. Furthermore the introduction of the common
currency reduced the transaction costs and eliminated the exchange rate uncertainty among
EMU members. However, the problem seems to be more acute between old and new member
states as the latter may offer not only a lower tax rate but also lower production costs due
mainly to lower wages.
As a consequence most member states recently implemented tax reforms aimed at
reducing corporate income tax rates, which constitute a large part of capital taxation. The lower
level of corporate taxes should improve the performance of capital markets in the longer term.
The outcome of this trend was an overall reduction of the corporate income tax rate in recent
years.
Table 37 Effective top statutory tax rate on corporate income
The average corporate tax rates were lower in EU-10 than in the EU-15 in the years 1995-2004
and were 27.51% and 35.15% respectively. In 2004 the average corporate tax burden in the
EU-10 was 7.64% lower than the average level of EU-15 countries. However, the lower ratio
of corporate taxes in EU-10 is often counterbalanced by the higher ratio of indirect taxes and in
addition in the Czech Republic, Poland and Slovakia by high social contributions.
The considerable tax difference between the member states has been an area of tension
between the new and old member countries in the recent past. There is widespread concern that
low tax countries impose a fiscal externality on other member states attracting investment that
would otherwise be located in high tax areas within the EU-25. Countries that are often
mentioned to be affected by this trend are especially Germany and France. These two countries

49
had the highest levels for the average top statutory corporate tax in the EU-25, while the lowest
ratio was recorded in Ireland, Cyprus, Lithuania and Latvia. In addition, Ireland has also the
lowest ratio among all member states and is the only country in the EU-15, which has a ratio
lower than the average for the EU-10.
The low level of corporate taxes in Ireland is often mentioned as one of the reasons for
its high economic growth in the last decades. As a consequence the transition economies have
decided to follow this example and have accelerated the reduction of corporate tax rates in
recent years. In fact, this process induced a tax competition among the member states and thus
the reduction in corporate tax rates is already an EU-25 wide trend. As a consequence the
average top statutory corporate tax rate in the EU-25 was 32.10 per cent and decreased almost
22% between 1995 and 2004.
Capital gains taxes are another burden, which may influence the development of
financial systems across countries. In almost all member states dividends paid and other
distributions made by companies to resident and non-residents and for both corporations and
individuals are liable to taxes. Until recently the rates on capital taxes have varied across
member states in spite of the governments’ calls for a law designed to ensure an effective
taxation of savings income and dividends within the EU-25. The idea behind this was to make
sure that all member states apply the same tax on all capital gains.
Nevertheless, after more than twenty years of discussion the Council of EU Finance
Ministers reached a political agreement on the harmonization of the taxation of cross-border
interest payments to private clients within the EU in June 2003. The EU Savings Tax Directive
came into effect on July 1, 2005 and should prevent future private financial outflows to other
member states in order to avoid taxation in the resident country.
The new Directive ensures effective taxation of cross-border savings income paid to
individual investors within the EU as it introduces an automatic exchange of information on
cross-border interest payments to EU-resident in other EU countries. However, the tax and
information exchange does not apply to private clients from countries outside the EU-25. Only
22 of 25 EU member states introduced an automatic exchange of information on cross-border
interest payments. In Austria, Belgium, Luxembourg and San Marino (Italy) a withholding tax
was introduced instead, which applies currently at a rate of 15% until 1 July 2008. Thereafter
the rate will rise to 20% until 30 June 2011 and onwards a withholding tax of 35% will apply.

50
The introduction of the harmonization was only possible because important financial centers
with European origin, such as Switzerland, Liechtenstein and Monaco along with dependent
territories such as the Channel Islands, Aruba and the Cayman Islands, have also agreed to
introduce a withholding tax on EU citizens’ interest income or an exchange information system
with the member states. It is worth mentioning, however, that Bermuda, was missed by
accident and the Directive does not apply there, but this may change in the future.
On the other hand, the Directive does not harmonize the tax rates on interest income at
the national level, where different systems are still in place. Domestic interest tax will still
remain the responsibility of the governments and vary across the member states.
Table 38 Capital income taxation as of July-2005 (general rates in %)
In the EU-25 the average tax on interest payments to residents is currently 13.45%, while to
non-EU-residents it is significantly lower with a rate of 5.66%. The lower tax rates for non-
EU-residents are aimed to attract private foreign investors to invest in national debt
instruments. Moreover on average the current tax rate is noticeably lower in the EU-10 than the
EU-15. The average rate for the EU-10 is 7.80%, while for the EU-15 it is 17.21%. Lower
taxes rates in new member states are again intended to attract foreign investors, especially to
the transition economies as those are in need of huge funds in order to finance economic
development. Nevertheless the tax rate shows a lot of variation within the EU-25. The highest
tax rates on interest payments for residents were in Germany and Sweden with 31.65% and
30%, respectively. Conversely, there are several member states, which do not impose a tax on
interest payments at all. Thus, even after the implementation of the EU Saving Directive
differences in savings taxation still prevail within the EU-25. In addition, the European private
investor will still have many opportunities to avoid taxation, for example, by moving their
funds to financial centers in Asia. Consequently, the new tax law may lead to a decrease in
funds invested in debt instruments in the EU in the long term. In addition, there is some
concern that more effective taxation of interest income may lead to higher interest rates and
entail a higher interest burden for governments (Becker, 2005).
Moreover, the directive covers only interest income but not dividends, capital gains or
non-interest-bearing instruments. Consequently, private investors may substitute equity for
debt instruments in order to avoid taxes. However, the average tax rate on dividend payments
to residents and non-residents is currently 15.98% and 16.72%, respectively. Thus it is

51
currently higher than the average rate on interest payments in spite of the also higher risk of
equity instruments. The dividends withholding tax is lower in the EU-10 with an average rate
of 13.60%, then in the EU-15 with an average rate of 17.57%. In the transition countries lower
withholding taxes provide an additional incentive for foreign investors to buy shares in
privatized companies on the stock exchanges. However, as equity markets develop the
governments may switch to higher taxation, as has already happened in Poland. Nevertheless
there are still member states, which do not impose dividend withholding taxes at all, such as
the United Kingdom or Malta.
Consequently, the main aim of the new directive, to mitigate the tax-related distortion
of investment decisions, has not yet been achieved within the EU-25. However, there are
already some governmental propositions to expand the scope of the law on other instruments or
introduce an EU-wide final tax on all financial instruments. However, past experience shows
that this could be a long process. On the other hand, without the introduction of an EU-wide
final tax law it may be very difficult to prevent the capital outflow from the EU-25 member
states to off-shore financial centers around the world.
6 Comparing the EU with the US and Japan
The enlargement of the EU has created a unified economic area with a population of
456 million people and a combined GDP of 10,207 billion euros at the end of 2004. This puts
the EU-25 slightly ahead of the United States with a population of 292 million and GDP of
9,434 billion euro, while it is almost three times bigger then Japan’s GDP of 3,758 billion euro
with a population of 127 million.
Until now we have documented the financial structures across member states.
However, the EU-25 is an economic area with a unified economic market and (perhaps) the
political ambition to create in the future a federation of states. Therefore, in this section we
compare the financial structure of the EU-25 with those of Japan and the United States. In
order to present the transformation and structural changes in the financial system due to the
recent enlargement, we will in addition compare the structures with those of new (EU-10) and
old (EU-15) member states.

52
With the aim to compare the financial structure, we follow the literature and classify
first a financial system either to be bank-based or market-based (see Allen and Gale, 2000).
This bilateral classification allows us to stress the differences in financial structures, yet we do
not provide evidence on whether one system is better than another. In our analysis we
concentrate only on describing the current developments in financial structures as we try to
point out the significant differences.
Figure 3 Size of financial markets (average, 1995 –
Figure 3 presents the average size of financial markets as a percentage of GDP. We use
the size of a country’s (region) financial markets in order to be able classify the different
financial structures. The figure presents clearly that the EU-25 has a bank-based financial
system. Moreover, the EU-15 and EU-10 are also clearly bank-based economies, where banks
are significantly more important in old member states than the new accession countries. On the
other hand, stock markets are less developed in the EU-25. In addition they are less significant
in the EU-10 than the EU-15. Furthermore the debt securities markets are also more developed
in the EU-15 than in the EU-10, yet they are mainly dominated by public bonds as we have
seen. However, even by ignoring this fact and adding the debt market and capital market
together the importance in the economy would be lower than the banks. Consequently, the
structure of the EU-25 financial system is obviously bank-based.
The United States is significantly different and presents an almost opposite financial
structure to the EU-25. In the US the debt market and stock market are the most important
financial markets in the economy. Moreover the importance of the banks in the economy is the
lower then in Japan and even in the EU-10. Thus, the US financial structure may evidently be
defined as market-based.
The Japanese financial structure could be defined as market- and bank-based. In Japan
the significance of the debt market and stock market in the economy is larger then that of
banks. In this case we would classify Japan financial system as market-based. Nevertheless, the
Japanese debt market is dominated mainly by public bonds and the private sector debt market
is rather small as we will show later. As a result when comparing only the private debt market
and stock market together with the banks’ significance in the economy, we have a different
picture of the Japanese financial system. In this case the Japanese financial system would be
defined as bank-based. Consequently, the Japanese financial system is not easy to classify as it

53
features present a mixture of both structures at the same time depending only on the measures
applied.
Our first findings and classifications of country’s (region’s) financial system are in line
with related work on financial structures (Allen et al., 2004; Hartmann et al., 2003; Allen and
Gale, 2000). Therefore, considering the results of previous studies the financial structure of
the EU has not changed in spite of the enlargement. In addition our results show that the
existing differences in financial structures across the most important economic regions and
countries have not been affected in the last decades.
Our results presents noticeably that banks are the most important institution in the
financial system of the EU-25. Thus, we continue our analysis in comparing first the main
characteristics of the banking system, then concentrate on the capital market and finally the
insurance sector.
Figure 4 Bank credit and liabilities (average, 1995 -2003)
Figure 4 shows the main components of banks’ balance sheets as a percentage of total
assets. The figure again presents that banks’ are the most important financial intermediaries in
the EU-25. The importance of banks’ in the EU-25 economy is similar to the level observed for
Japan, yet they are more important in the EU-15. The decline in the level of bank
intermediation in the economy was due to the accession of new member states, where the
financial system in less developed. However, the significance of banks’ as financial
intermediaries in the EU-10 is similar to the United States despite the huge differences in
financial system development. As a result it suggests evidence on the insignificant role of
banks in the US economy. However, the structure of banks’ balance sheets main components is
comparable across the regions and countries with the exception of the EU-10.
In new member states the level of deposits is higher than the level of domestic credit to
the private sector. This difference can be explained by three factors. First, most of the new
member states are transition economies, where banks are the most developed financial
institution and have not been strongly affected by the disintermediation process. Therefore the
ratio of financial assets held in banks by household in those countries is higher then in more
developed financial systems. Second, most transformation economies underwent a bad loan
problem in the banking system, which was mostly caused by former state owned enterprises.
This caused banks to constrain lending to private enterprises going forward. The final factor

54
was high interest rates on government securities, which was part of a monetary policy aimed at
reducing inflation. Consequently, in transformations economies the level of government
securities in banks portfolio is very high compared to developed countries’. However, in recent
years the interest rates on government bonds have been slowly declining, while banks’ have
learned to apply modern credit scoring methods, which results in a growing willingness to lend
to private enterprises again. Therefore, the existing differences will decline as banks increase
their loan portfolio, while the level of deposits will decrease due to growing competition and a
financial outflow toward other financial intermediaries. Consequently, in those countries we
are already observing a rapid development of the private debt market, which is caused by an
increase in the issuance of financial bonds. In the last decade banks have move to other sources
of funding, mainly debt securities, in order to compensate the continuing decrease in deposits
and balancing the gap between financial liabilities and assets.
Figure 5 Bank concentration and efficiency (average, 1996 – 2003)
Figure 5 shows that the banking sector in the EU-10 countries is fairly concentrated.
The combined market share of the five biggest banks (CR5) was the highest among the regions
and countries, and caused an increase in concentration in the EU-25. Nevertheless the
concentration degree in the EU-15 was significantly higher than in Japan and the United States.
It is usually argued that concentration is closely linked to a country’s market size. In smaller
countries the degree of concentration tends to be higher due to the presence of a few large
banks in the financial system. The main reason behind this argument is the level of banks’
scale economies in the market. In a smaller market fewer banks may be able to reach an
adequate scale to be profitable, whereas in a large market, a smaller percentage share may
provide a sufficient scale to operate efficiently. Henceforth, the high degree of concentration in
the EU-25 illustrates the low level of integration and foreign bank penetration in the banking
system, especially in the former member states. However, the recent wave of European cross-
border mergers and acquisition may lead to a decrease in the concentration in the long term.
Figure 5 suggests that the concerns about the adverse effects on banking competition
due to the concentrated nature of the EU-25 banking sector have mostly turned out to be
unfounded. The banking sector in the EU-25 and EU-15 is more efficient than in the United
States based on net interest margin and overhead costs in spite of the higher degree of
concentration. Furthermore in the EU-10 and the US banking sectors we can observe a

55
comparable level of efficiency, while the degree of concentration is quite different at the same
time. However, the factor behind the high inefficiency of the banking sector in the EU-10 and
United States are quite different. In the EU-10 the ratios were driven mainly by the transition
economies. In those countries the high interest rates on loans charged by banks compensate for
the high level of loan defaults, while the overheads costs were caused by excessive
employment and low application of modern technology. Nevertheless, recent studies present
evidence that the efficiency of banks has been increasing in transition economies in recent
years (Bonin et al., 2005; Fries and Tacit, 2005). As a consequence, the considerable
differences in efficiency between the EU-15 and EU-10 will decline and the level of bank
efficiency will be more uniform across the EU-25. In the United States the high overhead costs
are mainly due to a still large number of small banks despite the merger boom of the last
decade. Those banks have high overhead costs on average as they are not able to benefit from
the effects of scale. The significant variation in net margins between the United States and
other countries reflects differences in bank activity, rather than in efficiency or competition. In
the United States the banks are more focused on short-term and consumer financing, while in
Europe and Japan they are more commercially based and long-term oriented.
In Japan the degree of concentration in the banking sector is between the level observed
in the United States and EU-25. However, the efficiency of Japanese banks is close to that of
the EU-15. The Japanese banks have the lowest overhead costs, while the net margins are
comparable to the lowest in the EU-15. Thus, we may deduce that the level of banks efficiency
is affected by the degree of development and countries financial structure.
Figure 6 Equity market development (average, 1995-2003)
The United States with a market-based financial system has a stock market, which is
more active and more efficient then that of EU-25 or Japan. As shown in Figure 6 only the
United States has an equity market, where the value of stock transactions relative to the
economy is larger than its market capitalization. Thus the US equity market is not only an
important part of the economy but is also very vibrant. Furthermore, the turnover ratio shows
that the US market has also the largest value of transactions relative to the market’s size, which
we interpret as a sign of effectiveness.
The importance of the Japanese equity market in the economy is larger than that of the
EU-25 relative to the economy, yet it was smaller than that of the EU-15. The stock markets of

56
the EU-15 tend to be more active and more efficient then that of Japan. Nevertheless the
importance of equity markets in the EU-25 decreased after the accession of the new member
states. In the EU-10 the stock markets are relatively small and show a low level of liquidity.
Additionally the substantial difference in the level of value traded and turnover ratio suggest
that only a few stocks are traded. In transition economies these are mainly the stocks of the
largest, privatized companies, which are due to their size and liquidity of interest to
institutional investors.
Figure 7 Debt market development (average, 1995-2004)
An important part of the capital markets is the debt securities market. As shown at the
beginning of this section the most developed debt market is in the United States, followed by
Japan and finally the EU-25. Nevertheless the structure of the debt market varies significantly
across the countries. In Japan and EU-25 the debt market is dominated by government bonds,
while in the United States the larger proportion are financial bonds. In Japan the importance of
domestic government securities relative to the economy is twice as large as in the UE-25.
Besides, the level of government securities was significant larger than in the United States,
where the level was comparable to the EU-15.
In Japan and the EU-25 financial institution bonds are the second largest segment in the
domestic debt market. In the United States they surpass even the government bond market.
The high level of financial debt securities relative to the economy reflects the ongoing change
in the intermediation process in the banking sector. Banks in order to substitute for the
decrease in traditional deposits have turned in recent years to the debt markets. Thus, the large
number of financial debt securities reflects the change in the structure of financing banks.
In the EU-25 the proportion of corporate bond financing is low compared to the United
States and Japan despite the recent increase in issuance. This situation may be explained by the
strong position of banks in financing large and small companies in the EU-25. Conversely, in
the United States bank loans to large companies are insignificant and banks have to compete
with the debt market even for medium sized companies (Pagano and von Thadden, 2004).
After the accession of the EU-10 the structure of the EU-25 debt market changed only slightly.
In the EU-10 only the government debt market is well developed, while the segments for
finance and corporate bonds have a negligible position. The current situation mirrors the strong
position of banks in collecting deposits and financing corporations, especially in the transition

57
economies. With the decrease in banks’ importance in the financial system due to an increase
in competition we can observe a growing issuance of financial bonds, and recently also
corporate bonds. Those segments of the market are very small in the EU-10 compared to EU-
15, thus the difference in the EU-25 between public and private debt increased after the
accession. Nevertheless we may expect that the difference between public and private bonds
will return to pre-accession levels as the financial systems develop in the transition economies.
Figure 8 Insurance market penetration (average, 1996 - 2003)
In recent years the importance and penetration of the insurance sector was growing in
all the countries, especially the life segment. Figure 8 shows the penetration of the insurance
market, which refers to the ratio of direct premiums to GDP. The indicator represents the
relative importance of the insurance industry in the domestic economy.
The highest penetration of the insurance industry we can observe in Japan, followed by
the United States. In Japan the insurance sector is strongly dominated by the life segment,
which is almost five times bigger than the non-life segment. In Japan the high degree of life
insurance penetration can be explained by the historically high level of domestic saving.
Although the size of the insurance sectors in the United States and EU-15 are only
slightly smaller than that of Japan they are more balanced. In the United States the degree of
non-life insurance penetration is higher then that of the life segment. The existing differences
may be due to different pension planning in the United States, where it is more based on
private provision using direct investments and mutual funds.
In the EU-10 the penetration of insurance is very low, especially the life segment in
transition economies. The accession resulted in a decrease in insurance penetration in the EU-
25. Moreover in the EU-25 the differences between life and non-life insurance are now more
balanced than in the EU-15. However, economic and financial development connected with
reforms in the pension system in transition countries should result in growing interest in life
insurance. Consequently life insurance should grow faster in those countries in the near future.
Thus, the differences between life and non-life penetration may widen again in the EU-25 to
the degree observed in the EU-15.
7. Concluding Remarks
We have presented evidence on the financial structures in the EU-25 focusing on the

58
differences between the previous countries in the EU-15 and the accession countries in the EU-
10. The financial system varies significantly between the old and new member states. In
addition there is a lot of variation within the EU-10 and EU-15. Both the EU-10 and the EU-15
(with the notable exception of the UK) have bank-based financial systems. The banking
systems in the EU-15, whether measured by assets to GDP, credit to GDP, or deposits to GDP
are more developed than in the EU-10. The market structure for banking services in the EU-10
is more concentrated than in the EU-15. Banks in the EU-10 are more oriented to consumer
and short term funding. Perhaps the most striking difference between the EU-10 and the EU-
15, though, is the much higher share of the market for banking services held by foreign banks
in the EU-10 than in the EU-15.
In the UK and the Netherlands equity markets are well developed. The development of
trans-national markets such as Euronext and the Nordic and Baltic Stock Exchange is an
important development that seems set to continue in the coming years. The experience of the
transition economies in the EU-10 regarding stock markets is an interesting one. Despite
considerable efforts to develop stock markets as a major component of the financial system,
they are not very important. In countries like the Czech Republic, Slovakia and Lithuania that
adopted mass privatization, the number of firms listed has shrunk dramatically. For example, in
the Czech Republic the number of listed firms fell from 1,716 in 1995 to 55 in 2004. In other
countries, such as Poland, that adopted a strategy of listing only strong companies, the number
of firms listed remains small.
The importance of bond markets varies significantly. Markets for government debt are
important in almost all the EU countries while markets for debt issued by financial institutions
are important in many. Corporate debt markets are important in only a few countries.
Securitization of mortgages based on the model of the German Pfandebriefe has been quite
successful in a number of countries.
The insurance sector is much less important in the EU-10 than in the EU-25. This is
particularly true for the life insurance part of the industry. The non-life part is relatively more
important in the EU-10 countries because of EU requirements mandating a minimum level of
insurance for cars.
The important differences between the EU-10 and the EU-15 need to be taken account
of by policymakers going forward. For example, prior to the accession foreign banks played an

59
important role in very few countries. Thus policies such as supervision by a bank’s home
regulator could be readily justified. Now, however, with foreign banks important in so many
countries this is not so clear.
We have also compared the EU with the United States and Japan. Despite the
differences between the EU-10 and the EU-15, the accession of the new member states did not
change significantly the financial structure of the EU-25 compared to those of the United
States and Japan. After the accession, the financial structure of the EU-25 is still dominated by
banks, while the capital markets are less developed compared to the United States. Noteworthy
changes occurred only in the structure of the EU-25 debt market and insurance sector, yet those
changes are caused by the low level of economic and financial development of the transition
countries. As the new member states develop and will economically converge we assume the
existing changes in the structure will decline and develop toward the levels observed in the
EU-15. Nevertheless, we believe strongly that more research needs to be done on financial
integration in the EU-25 with the aim to understand the structural changes in the financial
system caused by the integration of member states.

60
References
Allen, F., M. K. F. Chui, A. Maddaloni (2004), “Financial systems in Europe, the USA, and Asia”, Oxford Review of Economic Policy, 20 (4), 490 – 508.
Allen, F., D. Gale (2000), Comparing financial systems, Cambridge, MA: The MIT Press.
Barth, J. R., L. G. Dopico, D. E. Nolle, J. A. Wilcox (2002), “Bank safety and soundness and the structure of bank supervision: a cross-country analysis”, International Review of Finance 3 (3-4), 163-188.
Barth, J. R., L. G. Dopico, D. E. Nolle, J. A. Wilcox (2003), “An international comparison and assessment of the structure of bank supervision” in D. Arner and J. Lin (eds.), Financial regulation: a guide to structural reform, Hong Kong: Sweet and Maxwell Asia.
Bénassy-Quéré A., S. Dées, L. Fontagné, G. Gaulier A. Kadareja, A. Lahrèche-Révil (2001), “The reform of taxation in EU member states”, mimeo, Centre d’Études Prospectives et d’Informations Internationales, April.
Becker, W. (2005), “EU Savings Tax Directive is close to the finish line”, Financial Market Special, EU Monitor No. 25, Deutsche Bank Research, May.
Bikker, J. A., A. A. T. Wesseling (2003), “Intermediation, integration and internationalizations: A survey on banking in Europe”, Research Series Supervision No. 53, March.
Bikker, J. A., K. Haaf. (2001), “Competition, concentration and their relationship: an empirical analysis of the banking industry” DNB Staff Report No. 68, De Nederlandsche Bank, July.
Bikker, J. A., K. Haaf (2002a), “Measures of competition and concentration in the banking industry: a review of the literature” Economic and Financial Modeling, 9, 53 - 98.
Bikker , J. A., K. Haaf (2002b), “Competition, concentration and their relationship: An empirical analysis of the banking industry”, Journal of Banking and Finance, 26 (1), 2191-2214.
Boning, J. P., I. Hasan, P. Wachtel (2005), “Bank performance, efficiency and ownership in transition countries” Journal of Banking and Finance, 29, 31 – 53.
Boot, A. W. A. (1999), “European lessons on consolidation in banking”, Journal of Banking and Finance, 23, 609 – 613.
Claessens, S., A. Demirgüç-Kunt, H. Huizinga (2001), “How does foreign entry affect domestic banking markets?”, Journal of Banking and Finance, 25, 891-911.
Claessens, S., D. Klingebiel, S. Schmukler, (2002), “The future of stock exchanges in emerging markets”, CEPR Discussion Paper No. 3301.
Claessens, S., L. Laeven (2004), “What Drives Bank Competition? Some International Evidence” Journal of Money, Credit and Banking, 36, 563-584.

61
Comité européen des assurances (2002), "Single European insurance market: the way forward", CEA ECO.
Davis, E. P., O. De Bandt, (1999), “A cross-country comparison of market structures in European banking”, ECB Working Paper No. 7, September.
Demirgüç-Kunt, A., H. Huizinga (1999), “Determinants of commercial bank interest margins and profitability: some international evidence”, World Bank Economic Review, 13(2), 379-408.
Desai, A., C. F. Foley, J. R. Hines (2002), “Chains of ownership, tax competition, and foreign direct investment.”, NBER Working Paper No 9224, August.
Dermine, J. (2005), “European banking integration: Don’t put the cart before the horse”, Conference Proceeding Cross-Border Banking Regulatory Challenges, Federal Reserve Bank of Chicago, 6-7 October.
ECB (2002), Report on financial structures, European Central Bank, Frankfurt am Main. Fries, S., A. Tacit (2005), “Cost efficiency of banks in transition: Evidence from 289 banks in 15 post-communist countries”, Journal of Banking and Finance, 29, 55-81.
Galati G., K. Tsatsronis (2001), “The impact of the Euro on Europe’s financial markets.” BIS Working Paper, No. 100, Basel, July.
Group of Ten (2001), “Consolidation in the financial sector”, BIS Working Paper, Basle.
Hartmann, P, A. Maddaloni, S. Manganelli (2003), “The Euro-area financial system: structure, integration, and policy initiatives”, Oxford Review of Economic Policy, 19 (1), 180 – 213.
Iftekhar H., H. Schmiedel (2003), "Do networks in the stock exchange industry pay off? European evidence”, Bank of Finland, Discussion Papers No. 2003/02, January.
Kaiser, H., Heilenkötter A. (1999), “The bond market in the European Monetary Union”, EMU Watch No. 79, Deutsche Bank Research, November.
Levine, R. (1997), “Financial development and economic growth: Views and Agenda”, Journal of Economic Literature, 35 (2), 688 – 726.
Marques, I. D., P. Molyneux (2001),”Integration of European banking and financial markets”, EIFC – Technology and Finance Working Paper 14.
Montanaro E., C. Scala, M. Tonaveronachi (2001), “The unified European banking market and the convergence of national banking sectors” in E. P. M. Gardener, P. C. Versluijs (eds.), Bank strategies and the challenges in the new Europe, Houndsmills: Palgavere.
Pagano, M., A. Roell, and J. Zechner (2002), “The geography of equity listing: why do companies list abroad?”, Journal of Finance, 57 (6), 2651-2694.
Pagano, M., E-L. von Thadden (2004), “The European bond markets under EMU“, Oxford Review of Economic Policy, 20 (4), 531-554.

62
Rajan, R., L. Zingales (2003), “Banks and markets: the changing character of European finance” in V. Gaspar, P. Hartmann, O. Sleijpen (eds.), The transformation of the European financial system, Frankfurt: European Central Bank.
Rasche, H. L. Hagen (2003), “The Pfandbriefe and other covered bonds in the EU capital market: development and regulation”, Financial Market Special, EU Monitor No. 7, Deutsche Bank Research, October.
Swiss Re (2000a), “Europe in focus: Non-life markets undergoing structural change”, Sigma No. 3/2000.
Swiss Re (2000b), “World insurance in 1999: Soaring life insurance business”, Sigma No. 9/2000.
Swiss Re (2001a), “Insurance industry in Central and Eastern Europe – current trends and progress of preparations for EU membership”, Sigma No. 9/2001.
Swiss Re (2001b), “World insurance in 2000: another boom year for life insurance; return to normal growth for non-life insurance”, Sigma No. 6/2001.
Swiss Re (2002), “World insurance in 2001: turbulent financial markets and high claims burden impact premium growth”, Sigma No. 7/2002.
Swiss Re (2003), “World insurance in 2002: high premium growth in non-life insurance”, Sigma No. 8/2003.
Swiss Re (2004), “World insurance in 2003: insurance industry on the road to recovery”, Sigma No. 3/2004.
Wagner, N., Iakova, D (2001), “Financial sector evolution in the Central European economies: Challenges in supporting macroeconomic stability and sustainable growth” IMF Working Paper No 141.
Vives, X. (2000), “Lessons from European banking liberalization and integration.” in S. Claessens, M. Jansen (eds.), The internationalization of financial services: Issues and Lessons for Developing Countries, Hague: Kulwer Law International.
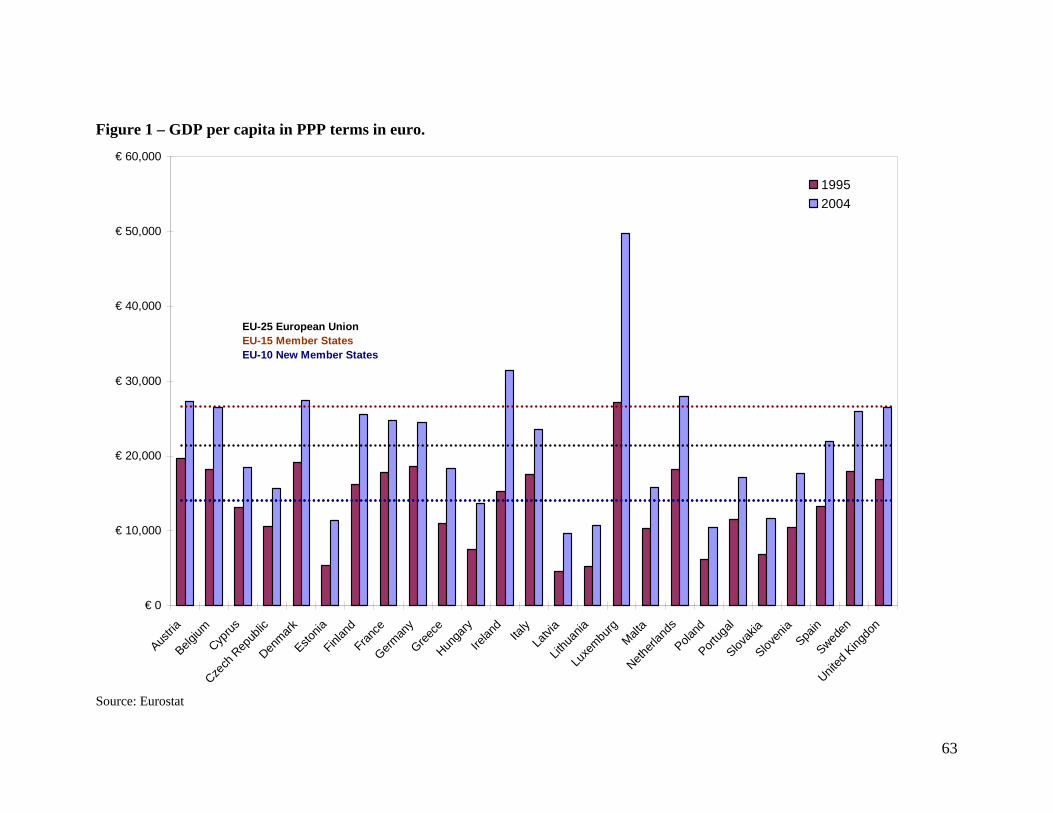
63
Figure 1 – GDP per capita in PPP terms in euro.
€ 0
€ 10,000
€ 20,000
€ 30,000
€ 40,000
€ 50,000
€ 60,000
Austria
Belgium
Cyprus
Czech
Rep
ublic
Denmark
Estonia
Finlan
dFran
ceGerm
any
Greece
Hunga
ryIre
land
Italy
Latvi
aLit
huan
iaLu
xembu
rgMalt
aNeth
erlan
dsPola
ndPort
ugal
Slovak
iaSlov
enia
Spain
Sweden
United
King
don
19952004
EU-25 European UnionEU-15 Member StatesEU-10 New Member States
Source: Eurostat

64
Table 1 GDP growth rate in %. Country 1995 1996 1997 1998 1999 2000 2001 2002 2003 2004 Mean
1 Austria 1.6 2.0 1.6 3.9 2.7 3.4 0.8 1.4 0.7 2.2 2.0 2 Belgium 2.4 1.2 3.5 2.0 3.2 3.8 0.6 0.7 1.1 2.9 2.1 3 Cyprus 6.1 1.9 2.4 5.0 4.6 5.0 4.1 2.1 1.9 3.7 3.7 4 Czech Republic 5.9 4.2 -0.7 -1.1 1.2 3.9 2.6 1.5 3.7 4.0 2.5 5 Denmark 2.8 2.5 3.0 2.5 2.6 2.8 1.6 1.0 0.4 2.4 2.2 6 Estonia 4.5 4.5 10.5 5.2 -0.1 7.8 6.4 7.2 5.1 6.2 5.7 7 Finland 3.4 3.9 6.3 5.0 3.4 5.1 1.1 2.3 1.9 3.7 3.6 8 France 1.7 1.1 1.9 3.4 3.2 3.8 2.1 1.2 0.5 2.3 2.1 9 Germany 1.7 0.8 1.4 2.0 2.0 2.9 0.8 0.2 -0.1 1.6 1.3
10 Greece 2.1 2.4 3.6 3.4 3.4 4.4 4.0 3.9 4.3 4.2 3.6 11 Hungary 1.5 1.3 4.6 4.9 4.2 5.2 3.8 3.5 3.0 4.0 3.6 12 Ireland 9.9 8.1 11.1 8.6 11.3 10.1 6.2 6.9 3.7 4.9 8.1 13 Italy 2.9 1.1 2.0 1.8 1.7 3.0 1.8 0.4 0.3 1.2 1.6 14 Latvia -0.9 3.8 8.3 4.7 3.3 6.9 8.0 6.4 7.5 8.5 5.6 15 Lithuania 3.3 4.7 7.0 7.3 -1.7 3.9 6.4 6.8 9.7 6.7 5.4 16 Luxembourg 1.4 3.3 8.3 6.9 7.8 9.0 1.3 1.7 2.1 4.5 4.7 17 Malta 6.2 4.0 4.8 3.5 4.0 6.3 -1.7 2.3 -1.7 1.4 2.9 18 Netherlands 3.0 3.0 3.8 4.3 4.0 3.5 1.2 0.2 -0.9 1.4 2.4 19 Poland 7.0 6.0 6.8 4.8 4.1 4.0 1.0 1.4 3.7 5.3 4.4 20 Portugal 4.3 3.5 4.0 4.6 3.8 3.4 1.7 0.4 -1.2 1.0 2.5 21 Slovakia 5.9 6.2 4.6 4.2 1.5 2.0 3.8 4.6 4.5 5.5 4.3 22 Slovenia 4.1 3.5 4.6 3.8 5.2 3.9 2.7 3.3 2.5 4.6 3.8 23 Spain 2.8 2.4 4.0 4.3 4.2 4.2 2.8 2.0 2.4 3.1 3.2 24 Sweden 4.1 1.3 2.4 3.6 4.6 4.3 0.9 2.1 1.6 3.6 2.9 25 United Kingdom 2.8 2.7 3.3 3.1 2.8 3.8 2.1 1.6 2.2 3.1 2.8 EU-25 averagea 3.6 3.2 4.5 4.1 3.5 4.7 2.7 2.6 2.4 3.7 3.5 EU-15 averagea 3.1 2.6 4.0 4.0 4.0 4.5 1.9 1.7 1.3 2.8 3.0 EU-10 averagea 4.4 4.0 5.3 4.2 2.6 4.9 3.7 3.9 4.0 5.0 4.2 EU-25 averageb 2.7 1.9 2.8 3.0 2.9 3.6 1.8 1.2 1.2 2.5 2.4 EU-15 averageb 2.5 1.7 2.6 3.0 2.9 3.6 1.8 1.1 0.9 2.3 2.2 EU-10 averageb 5.4 4.7 4.8 3.7 3.2 4.1 2.5 2.5 3.9 5.0 4.0 Source: Eurostat, World Development Indicators Note: a aggregates are unweighted averages, b aggregates represent GDP per capita in PPP-weighted averages

65
Table 2 Total assets of domestic credit institutions as % of GDP Country 1995 1996 1997 1998 1999 2000 2001 2002 2003 2004 Mean Change (%)
1 Austria 213.3 221.0 223.3 236.7 243.3 250.9 265.6 251.3 258.4 268.0 243.2 25.6 2 Belgium 291.2 315.7 306.0 298.4 303.1 282.0 305.4 296.5 307.4 322.3 302.8 10.7 3 Cyprus 85.9 168.4 193.6 206.1 240.1 264.7 341.2 307.0 294.8 305.9 240.8 255.9 4 Czech Republic 132.1 130.5 128.2 134.5 134.9 135.8 115.1 101.1 97.2 99.7 120.9 -24.5 5 Denmark 118.0 164.5 211.0 227.0 235.5 251.6 253.5 276.3 289.7 309.3 233.6 162.1 6 Estonia 35.9 33.0 63.0 56.0 62.0 68.0 65.5 69.9 77.6 94.4 62.5 163.2 7 Finland 117.0 99.7 97.0 93.3 99.5 98.4 119.7 117.6 129.2 141.9 111.3 21.3 8 France 173.1 174.0 243.8 239.0 251.1 246.6 251.7 247.4 252.0 267.9 234.7 54.7 9 Germany 205.0 225.7 256.2 275.3 285.9 298.7 296.7 297.0 295.5 29.7 246.6 -85.5
10 Greece 98.0 99.0 107.0 118.5 137.6 155.8 153.9 141.6 150.0 137.9 129.9 40.7 11 Hungary 36.1 33.9 33.3 57.0 61.9 65.8 68.0 66.8 71.5 80.1 57.4 121.7 12 Ireland 129.4 135.3 261.3 302.1 337.8 345.5 367.9 363.7 413.5 486.4 314.3 275.9 13 Italy 139.0 145.3 155.6 143.2 147.0 151.8 152.0 160.6 163.4 168.4 152.6 21.2 14 Latvia 31.0 36.0 49.0 44.1 50.4 58.2 78.9 74.0 86.0 101.3 60.9 226.8 15 Lithuania 27.9 20.2 25.0 26.7 29.5 30.9 32.3 33.6 39.5 47.5 31.3 70.0 16 Luxembourg 2 876.0 3 113.7 3 351.4 3 201.4 3 194.0 3 044.8 3 274.3 2 905.5 2 738.2 2 708.5 3 040.8 -5.8 17 Malta 177.9 181.8 184.7 197.8 203.3 202.5 324.6 365.1 424.4 476.8 273.9 168.0 18 Netherlands 216.0 223.6 231.2 254.8 263.0 285.6 282.7 291.6 309.4 343.3 270.1 58.9 19 Poland 48.8 51.1 52.8 57.6 59.1 61.6 64.4 57.3 56.0 67.6 57.6 38.5 20 Portugal 158.0 160.9 163.8 190.4 196.2 174.6 272.8 260.6 254.6 242.5 207.4 53.5 21 Slovakia 76.0 114.0 109.6 102.7 92.1 93.2 92.0 83.7 72.1 87.7 92.3 15.4 22 Slovenia 61.1 59.6 57.9 63.0 69.1 66.8 80.8 84.4 86.6 93.6 72.3 53.2 23 Spain 159.0 164.7 170.5 172.9 177.9 202.4 183.6 184.2 192.5 205.0 181.3 29.0 24 Sweden 152.0 165.1 178.3 157.4 165.7 167.2 184.5 184.9 189.5 208.9 175.4 37.5 25 United Kingdom 239.0 284.1 329.2 304.4 328.3 335.2 363.7 351.1 386.4 406.4 332.8 70.0 EU-25 averagea 239.9 260.8 287.3 286.4 294.7 293.5 319.6 302.9 305.4 308.0 289.9 28.4 EU-15 averagea 352.3 379.5 419.0 414.3 424.4 419.4 448.5 422.0 422.0 416.4 411.8 18.2 EU-10 averagea 71.3 82.8 89.7 94.6 100.2 104.7 126.3 124.3 130.6 145.4 107.0 104.1 EU-25 averageb 181.7 196.8 225.5 225.6 236.4 243.0 249.9 247.1 255.9 215.1 227.7 18.4 EU-15 averageb 187.6 203.3 233.1 233.1 244.3 251.5 258.8 256.5 265.6 219.1 235.3 16.8 EU-10 averageb 66.6 70.7 71.1 77.1 78.6 81.0 82.3 75.5 75.0 84.7 76.2 27.2 Source: ECB, Eurostat, National Central Banks Note: a aggregates are unweighted averages, b aggregates represent GDP in PPP term weighted averages

66
Table 3 Total credit granted by domestic credit institutions as % of GDP Country 1995 1996 1997 1998 1999 2000 2001 2002 2003 2004 Mean Change (%)
1 Austria 94.0 97.0 114.4 120.4 127.9 139.3 124.3 123.7 122.1 125.1 118.1 29.8 2 Belgium 74.7 76.9 95.0 99.1 108.4 115.1 103.7 106.9 106.6 107.2 98.5 42.7 3 Cyprus 80.2 88.0 93.8 98.5 110.1 114.8 121.4 124.8 122.1 141.1 109.5 52.2 4 Czech Republic 70.7 69.5 70.0 59.9 53.8 47.9 39.6 37.7 39.0 38.7 54.2 -44.8 5 Denmark 134.1 138.3 140.7 138.4 145.9 150.0 154.7 164.4 143.2 15.4 6 Estonia 14.0 18.0 24.7 23.7 24.3 23.9 39.0 42.7 54.3 65.4 29.4 287.4 7 Finland 66.0 61.9 48.4 53.2 59.4 66.4 59.4 61.1 65.5 69.4 60.1 -0.8 8 France 101.9 102.1 85.4 86.7 93.1 102.3 89.3 88.5 90.3 92.9 93.3 -11.4 9 Germany 205.2 218.1 227.0 237.8 144.4 140.9 139.9 135.8 187.6 -31.8
10 Greece 33.6 34.6 35.9 42.4 49.9 62.4 62.1 66.8 71.4 76.4 51.0 112.6 11 Hungary 22.5 22.1 24.3 24.2 26.1 32.2 35.5 37.9 42.5 48.3 29.7 89.0 12 Ireland 70.3 74.5 88.3 107.2 148.2 179.4 163.0 152.3 149.5 176.2 125.9 112.7 13 Italy 95.6 93.1 72.3 76.5 83.0 92.8 82.9 84.5 86.7 88.0 85.3 -9.3 14 Latvia 7.1 6.6 9.7 13.7 14.5 17.2 31.3 35.4 45.1 56.5 20.1 531.7 15 Lithuania 14.3 10.8 10.6 11.0 12.8 11.4 15.2 17.2 23.9 30.4 14.1 67.4 16 Luxembourg 546.5 676.2 791.9 845.5 218.5 578.8 494.8 467.3 593.2 -9.5 17 Malta 95.8 105.0 104.8 109.5 113.9 108.2 162.4 174.4 191.1 200.1 129.5 82.1 18 Netherlands 112.5 118.7 125.0 142.9 161.8 182.3 146.2 151.4 159.9 174.1 144.5 42.2 19 Poland 17.3 20.9 22.7 24.5 26.5 27.3 27.9 30.1 30.8 34.8 25.3 78.1 20 Portugal 70.5 77.8 78.5 99.9 130.7 162.7 132.1 135.7 135.7 136.8 113.7 92.5 21 Slovakia 36.7 43.9 56.0 53.9 54.5 51.3 37.6 39.6 31.6 36.3 44.1 -14.1 22 Slovenia 25.7 27.0 26.7 30.8 33.9 36.2 39.3 39.3 42.1 47.3 33.4 63.7 23 Spain 102.3 102.3 83.2 94.2 107.2 124.5 100.6 104.2 110.5 120.6 103.2 8.1 24 Sweden 114.1 112.2 97.2 89.8 104.3 111.5 107.6 110.2 110.9 114.5 106.4 -2.8 25 United Kingdom 122.3 126.1 121.6 120.0 145.8 163.4 132.6 131.7 139.1 142.2 133.6 13.7 EU-25 averagea 65.6 67.7 95.0 104.6 118.0 127.8 94.5 110.6 110.4 115.6 101.0 68.4 EU-15 averagea 88.1 89.8 128.7 144.3 165.3 181.6 120.8 145.8 142.5 146.1 135.3 61.7 EU-10 averagea 38.4 41.2 44.3 45.0 47.0 47.0 54.9 57.9 62.2 69.9 50.8 61.9 EU-25 averageb 71.6 72.6 113.3 118.8 130.3 141.9 108.3 109.2 111.8 114.5 109.2 59.9 EU-15 averageb 76.5 77.3 117.1 123.7 136.3 149.4 114.0 114.6 117.2 119.9 114.6 56.8 EU-10 averageb 31.8 33.8 35.6 34.4 34.8 34.9 34.6 36.1 37.6 41.9 35.6 31.4 Source: ECB, Eurostat, National Central Banks Note: a aggregates are unweighted averages, b aggregates represent GDP in PPP term weighted averages
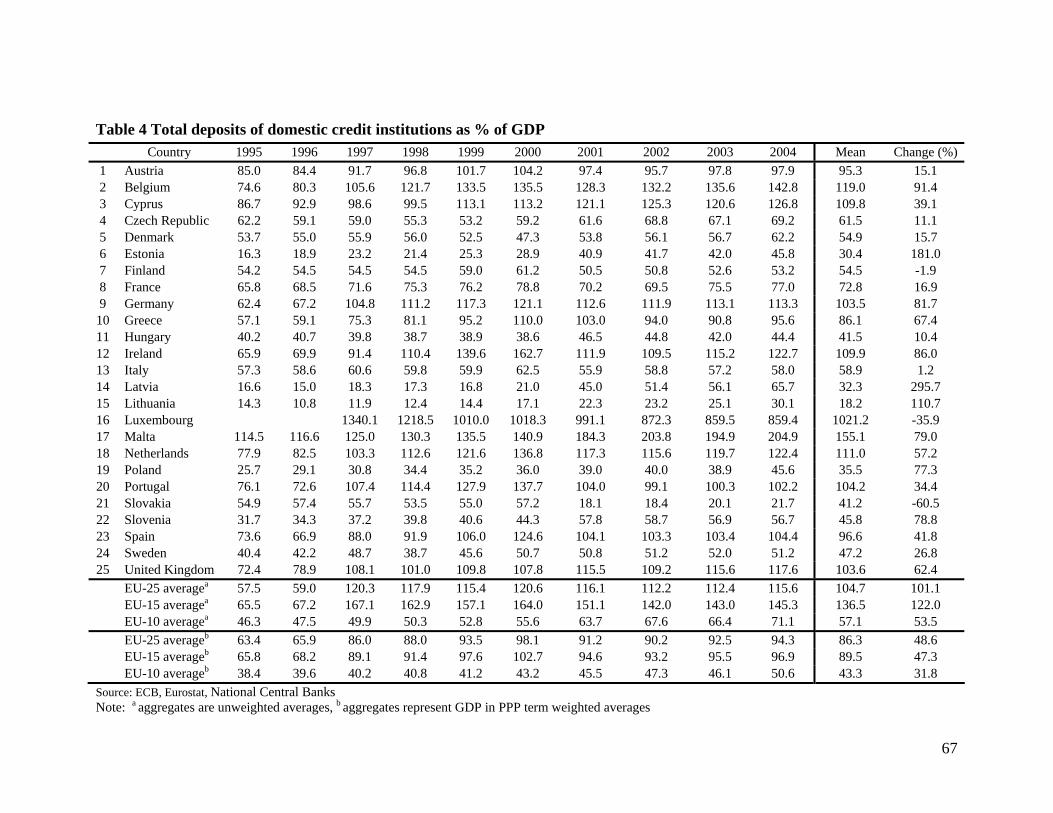
67
Table 4 Total deposits of domestic credit institutions as % of GDP Country 1995 1996 1997 1998 1999 2000 2001 2002 2003 2004 Mean Change (%)
1 Austria 85.0 84.4 91.7 96.8 101.7 104.2 97.4 95.7 97.8 97.9 95.3 15.1 2 Belgium 74.6 80.3 105.6 121.7 133.5 135.5 128.3 132.2 135.6 142.8 119.0 91.4 3 Cyprus 86.7 92.9 98.6 99.5 113.1 113.2 121.1 125.3 120.6 126.8 109.8 39.1 4 Czech Republic 62.2 59.1 59.0 55.3 53.2 59.2 61.6 68.8 67.1 69.2 61.5 11.1 5 Denmark 53.7 55.0 55.9 56.0 52.5 47.3 53.8 56.1 56.7 62.2 54.9 15.7 6 Estonia 16.3 18.9 23.2 21.4 25.3 28.9 40.9 41.7 42.0 45.8 30.4 181.0 7 Finland 54.2 54.5 54.5 54.5 59.0 61.2 50.5 50.8 52.6 53.2 54.5 -1.9 8 France 65.8 68.5 71.6 75.3 76.2 78.8 70.2 69.5 75.5 77.0 72.8 16.9 9 Germany 62.4 67.2 104.8 111.2 117.3 121.1 112.6 111.9 113.1 113.3 103.5 81.7
10 Greece 57.1 59.1 75.3 81.1 95.2 110.0 103.0 94.0 90.8 95.6 86.1 67.4 11 Hungary 40.2 40.7 39.8 38.7 38.9 38.6 46.5 44.8 42.0 44.4 41.5 10.4 12 Ireland 65.9 69.9 91.4 110.4 139.6 162.7 111.9 109.5 115.2 122.7 109.9 86.0 13 Italy 57.3 58.6 60.6 59.8 59.9 62.5 55.9 58.8 57.2 58.0 58.9 1.2 14 Latvia 16.6 15.0 18.3 17.3 16.8 21.0 45.0 51.4 56.1 65.7 32.3 295.7 15 Lithuania 14.3 10.8 11.9 12.4 14.4 17.1 22.3 23.2 25.1 30.1 18.2 110.7 16 Luxembourg 1340.1 1218.5 1010.0 1018.3 991.1 872.3 859.5 859.4 1021.2 -35.9 17 Malta 114.5 116.6 125.0 130.3 135.5 140.9 184.3 203.8 194.9 204.9 155.1 79.0 18 Netherlands 77.9 82.5 103.3 112.6 121.6 136.8 117.3 115.6 119.7 122.4 111.0 57.2 19 Poland 25.7 29.1 30.8 34.4 35.2 36.0 39.0 40.0 38.9 45.6 35.5 77.3 20 Portugal 76.1 72.6 107.4 114.4 127.9 137.7 104.0 99.1 100.3 102.2 104.2 34.4 21 Slovakia 54.9 57.4 55.7 53.5 55.0 57.2 18.1 18.4 20.1 21.7 41.2 -60.5 22 Slovenia 31.7 34.3 37.2 39.8 40.6 44.3 57.8 58.7 56.9 56.7 45.8 78.8 23 Spain 73.6 66.9 88.0 91.9 106.0 124.6 104.1 103.3 103.4 104.4 96.6 41.8 24 Sweden 40.4 42.2 48.7 38.7 45.6 50.7 50.8 51.2 52.0 51.2 47.2 26.8 25 United Kingdom 72.4 78.9 108.1 101.0 109.8 107.8 115.5 109.2 115.6 117.6 103.6 62.4 EU-25 averagea 57.5 59.0 120.3 117.9 115.4 120.6 116.1 112.2 112.4 115.6 104.7 101.1 EU-15 averagea 65.5 67.2 167.1 162.9 157.1 164.0 151.1 142.0 143.0 145.3 136.5 122.0 EU-10 averagea 46.3 47.5 49.9 50.3 52.8 55.6 63.7 67.6 66.4 71.1 57.1 53.5 EU-25 averageb 63.4 65.9 86.0 88.0 93.5 98.1 91.2 90.2 92.5 94.3 86.3 48.6 EU-15 averageb 65.8 68.2 89.1 91.4 97.6 102.7 94.6 93.2 95.5 96.9 89.5 47.3 EU-10 averageb 38.4 39.6 40.2 40.8 41.2 43.2 45.5 47.3 46.1 50.6 43.3 31.8 Source: ECB, Eurostat, National Central Banks Note: a aggregates are unweighted averages, b aggregates represent GDP in PPP term weighted averages

68
Table 5 Number of domestic credit institutions Country 1995 1996 1997 1998 1999 2000 2001 2002 2003 2004 Mean Change (%)
1 Austria 1,019 995 898 875 848 836 823 814 796 878 -21.9 2 Belgium 120 116 131 123 117 118 112 111 108 104 116 -13.3 3 Cyprus 404 406 408 405 405 406 0.2 4 Czech Republic 55 53 50 45 42 119 96 83 77 74 69 34.5 5 Denmark 204 203 213 212 210 210 203 178 203 202 204 -1.0 6 Estonia 18 15 12 6 7 7 7 7 7 9 10 -50.0 7 Finland 349 347 348 348 346 341 369 369 366 363 355 4.0 8 France 1,258 1,226 1,158 1,099 1,050 989 939 897 1,077 -25.4 9 Germany 3651 3542 3,420 3,238 2,992 2,742 2,526 2,363 2,148 2,148 2,877 -41.2
10 Greece 39 41 55 59 57 57 61 61 59 62 55 59.0 11 Hungary 295 292 286 294 260 241 230 225 219 217 256 -26.4 12 Ireland 71 78 81 81 88 85 80 80 81 12.7 13 Italy 970 937 935 921 890 841 843 821 801 787 875 -18.9 14 Latvia 43 39 37 27 23 21 19 19 19 23 27 -46.5 15 Lithuania 17 26 37 42 48 52 53 68 71 74 49 335.3 16 Luxembourg 220 221 215 212 211 202 194 184 172 162 199 -26.4 17 Malta 22 17 14 16 16 17 -27.3 18 Netherlands 744 658 648 634 616 586 561 539 481 461 593 -38.0 19 Poland 1,591 1,475 1,378 1,272 858 754 713 667 660 653 1,002 -59.0 20 Portugal 257 243 238 227 224 218 212 202 200 197 222 -23.3 21 Slovakia 33 29 29 27 25 23 23 22 21 21 25 -36.4 22 Slovenia 41 36 34 30 31 28 24 22 22 24 29 -41.5 23 Spain 316 313 416 404 387 368 366 359 346 346 362 9.5 24 Sweden 116 175 237 223 212 211 149 216 222 212 197 82.8 25 United Kingdom 486 478 557 521 496 491 452 451 426 413 477 -15.0 EU-25 averagea 478 488 504 481 442 403 384 371 355 350 426 -26.8 EU-15 averagea 623 644 647 622 591 561 535 517 491 482 571 -22.6 EU-10 averagea 262 246 233 218 162 167 159 154 152 152 190 -42.1 EU-25 averageb 1073 1053 1206 1148 1047 976 919 873 816 805 992 -25.0 EU-15 averageb 1114 1102 1295 1236 1158 1081 1018 966 899 886 1075 -20.5 EU-10 averageb 871 812 762 708 490 447 421 396 391 387 568 -55.6 Source: ECB, Eurostat, National Central Banks Note: a aggregates are unweighted averages, b aggregates represent population weighted averages

69
Table 6 Number of domestic, intra-EU and outside-EU mergers in Europe, 2001- 2004 Country Domestic Intra-EEA Outside-EEA Total Domestic Intra-EEA Outside-EEA Total to average number of credit institutions (in%)
1 Austria 4 2 0 6 0.5 0.2 0.0 0.7 2 Belgium 5 1 0 6 4.6 0.9 0.0 5.5 3 Cyprus 0 0 0 0 0.0 0.0 0.0 0.0 4 Czech Republic 3 10 1 14 3.6 12.1 1.2 17.0 5 Denmark 5 6 2 13 2.5 3.1 1.0 6.6 6 Estonia 0 1 0 1 0.0 13.3 0.0 13.3 7 Finland 2 1 0 3 0.5 0.3 0.0 0.8 8 France 43 7 1 51 4.4 0.7 0.1 5.3 9 Germany 42 9 2 53 1.8 0.4 0.1 2.3
10 Greece 8 4 0 12 13.2 6.6 0.0 19.8 11 Hungary 9 7 1 17 4.0 3.1 0.4 7.6 12 Ireland 1 2 1 4 1.2 2.4 1.2 4.8 13 Italy 82 8 3 93 10.1 1.0 0.4 11.4 14 Latvia 1 1 3 5 5.0 5.0 15.0 25.0 15 Lithuania 0 4 0 4 0.0 6.0 0.0 6.0 16 Luxembourg 0 3 0 3 0.0 1.7 0.0 1.7 17 Malta 0 0 0 0 0.0 0.0 0.0 0.0 18 Netherlands 8 5 3 16 1.6 1.0 0.6 3.1 19 Poland 14 15 0 29 2.1 2.2 0.0 4.3 20 Portugal 3 8 1 12 1.5 3.9 0.5 5.9 21 Slovakia 1 5 0 6 4.6 23.0 0.0 27.6 22 Slovenia 4 4 0 8 17.4 17.4 0.0 34.8 23 Spain 13 4 1 18 3.7 1.1 0.3 5.1 24 Sweden 4 1 0 5 2.0 0.5 0.0 2.5 25 United Kingdom 48 4 7 59 11.0 0.9 1.6 13.5
EU-25 total/average 300 112 26 438 3.8 4.3 0.9 9.0 EU-15 total/average 268 65 21 354 3.9 1.6 0.4 5.9 EU-10 total/average 32 47 5 84 3.7 8.2 1.7 13.6 Source: ECB

70
Table 7 Share of foreign credit institutions as % of total assets of domestic credit institutions Country 1995 1996 1997 1998 1999 2000 2001 2002 2003 2004 Mean Change (%)
1 Austria 3.4 2.7 2.7 2.8 19.4 21.4 19.6 19.4 11.44 479.06 2 Belgium 30.4 26.9 23.7 24.9 24.9 24.0 22.9 23.2 25.1 -23.8 3 Cyprus 10.2 10.9 11.3 11.7 12.8 12.7 12.3 30.1 14.0 194.8 4 Czech Republic 16.0 20.0 24.0 26.0 39.0 75.4 93.3 94.2 95.9 91.8 57.6 473.9 5 Denmark 4.5 6.3 4.3 5.2 16.2 13.0 16.0 16.2 10.2 260.8 6 Estonia 2.0 3.0 29.0 90.0 90.0 97.0 98.0 98.0 99.2 98.0 70.4 4798.1 7 Finland 8.4 8.2 9.5 8.1 6.8 9.1 7.4 59.5 14.6 607.3 8 France 10.4 9.9 11.3 15.0 9.6 12.7 11.1 11.4 11.4 9.2 9 Germany 4.3 4.3 4.0 4.1 4.7 6.1 6.0 6.3 5.0 45.9
10 Greece 15.8 12.7 11.0 11.6 8.8 21.7 22.0 24.8 16.1 57.0 11 Hungary 41.8 46.2 53.0 64.0 66.4 68.1 70.0 90.7 83.0 77.0 66.0 84.2 12 Ireland 24.8 55.9 57.2 57.9 59.4 47.3 43.9 45.4 49.0 83.5 13 Italy 4.5 4.8 7.0 8.0 7.4 6.5 5.5 5.6 5.9 7.7 6.3 71.1 14 Latvia 36.0 53.0 55.0 63.1 66.2 69.9 67.8 54.4 53.9 57.8 57.7 60.6 15 Lithuania 0.0 28.0 41.0 51.0 37.0 57.7 81.1 88.1 88.7 93.0 56.6 741350.2 16 Luxembourg 92.5 94.5 94.5 92.2 94.6 93.7 93.9 94.1 93.7 1.7 17 Malta 45.6 47.1 56.5 56.7 57.9 59.2 72.8 68.2 39.1 55.9 49.5 18 Netherlands 7.2 6.5 5.2 11.2 11.3 10.3 11.8 12.1 9.4 66.8 19 Poland 4.2 13.7 15.3 16.6 47.2 69.5 68.7 67.4 67.8 67.6 43.8 1509.5 20 Portugal 14.8 21.0 14.7 22.2 24.6 25.1 26.5 26.1 21.9 76.4 21 Slovakia 19.0 23.0 30.0 30.0 31.0 43.0 90.5 95.6 96.3 97.0 55.5 410.5 22 Slovenia 4.0 5.0 5.0 4.8 15.3 15.6 15.6 23.1 24.2 38.0 15.1 850.0 23 Spain 12.5 11.5 9.2 9.0 11.2 9.9 11.0 11.5 10.7 -8.1 24 Sweden 2.5 4.4 3.6 5.4 5.8 6.6 7.6 8.7 5.6 244.6 25 United Kingdom 52.2 52.9 50.1 52.5 50.5 47.4 49.8 51.3 50.8 -1.8 EU-25 averagea 14.2 24.2 24.0 29.5 30.7 35.8 40.4 42.0 41.8 44.3 36.1* 84.4* EU-15 averagea 19.4 21.7 20.6 21.9 23.5 23.6 23.7 27.8 22.8 43.6 EU-10 averagea 15.4 26.4 31.0 41.3 46.0 56.6 65.7 69.7 76.1 77.5 50.6 404.2 EU-25 averageb 0.6 0.7 20.3 20.4 20.4 22.6 19.4 22.3 22.8 29.2 22.2* 43.5* EU-15 averageb 15.8 16.3 15.5 16.9 16.5 17.0 17.4 19.0 16.8 19.9 EU-10 averageb 14.3 19.1 23.0 27.0 42.1 61.7 69.9 71.3 70.4 70.4 46.9 390.7 Source: ECB, Eurostat, National Banks, BankScope, * calculated as 1997-2004 Note: a aggregates are unweighted averages, b aggregates represent assets weighted averages

71
Table 8 Share of the five largest credit institutions in total assets in % (CR5) Country 1995 1996 1997 1998 1999 2000 2001 2002 2003 2004 Mean Change (%)
1 Austria 39.2 39.0 48.3 42.0 41.0 43.0 44.9 45.6 44.2 43.8 43.1 11.8 2 Belgium 51.2 52.2 54.0 63.0 76.0 75.0 78.3 82.0 83.5 84.3 70.0 64.6 3 Cyprus 96.1 91.6 91.6 92.7 92.7 71.5 69.3 69.7 69.4 82.7 -27.8 4 Czech Republic 70.0 69.0 67.0 66.0 65.0 66.0 64.4 65.7 65.8 64.0 66.3 -8.6 5 Denmark 80.0 77.0 70.0 71.0 71.0 60.0 67.6 68.0 66.6 67.0 69.8 -16.3 6 Estonia 75.0 83.0 99.0 99.0 99.0 98.9 99.1 99.2 98.6 94.5 31.5 7 Finland 70.6 71.7 88.0 86.0 86.0 87.0 79.5 78.6 81.2 82.7 81.1 17.1 8 France 41.3 41.2 40.0 41.0 43.0 47.0 47.0 44.6 46.7 44.7 43.7 8.2 9 Germany 16.7 16.0 17.0 19.0 19.0 20.0 20.2 20.5 21.6 22.1 19.2 32.6
10 Greece 82.0 87.0 56.0 63.0 67.0 65.0 67.0 67.4 66.9 65.0 68.6 -20.7 11 Hungary 59.0 58.0 53.0 54.0 54.0 53.0 56.4 54.5 52.1 52.7 54.7 -10.7 12 Ireland 44.4 42.2 41.0 40.0 41.0 41.0 42.5 46.1 44.4 43.9 42.7 -1.1 13 Italy 32.3 32.1 31.0 25.0 26.0 23.0 29.0 30.6 27.0 26.0 28.2 -19.4 14 Latvia 53.0 52.0 51.0 61.0 61.0 62.0 63.4 65.3 63.1 62.4 59.4 17.7 15 Lithuania 76.0 80.0 84.0 90.0 91.0 88.0 87.6 83.9 81.0 78.9 84.0 3.8 16 Luxembourg 30.0 29.0 23.0 25.0 26.0 26.0 28.0 30.3 31.8 29.7 27.9 -1.0 17 Malta 98.0 98.0 98.0 97.7 79.6 82.0 79.3 78.7 88.9 -19.7 18 Netherlands 76.1 75.4 79.4 82.0 82.0 81.0 82.5 82.7 84.2 84.0 80.9 10.3 19 Poland 48.2 48.8 46.2 42.9 47.7 46.5 54.7 53.4 52.3 50.2 49.1 4.2 20 Portugal 74.0 80.0 46.0 45.0 44.0 59.0 59.8 60.5 62.7 66.5 59.8 -10.1 21 Slovakia 75.0 68.0 63.0 60.0 59.0 63.0 66.1 66.4 67.5 66.5 65.5 -11.3 22 Slovenia 63.0 63.0 62.0 63.0 63.0 63.0 67.6 68.4 66.4 64.1 64.4 1.7 23 Spain 47.3 46.0 45.0 45.0 52.0 54.0 44.9 44.3 43.9 41.9 46.4 -11.4 24 Sweden 73.0 63.0 59.0 60.0 60.0 62.0 54.6 56.0 53.8 54.4 59.6 -25.5 25 United Kingdom 47.0 33.0 24.0 25.0 28.0 28.0 28.6 29.6 32.8 34.5 31.1 -26.6 EU-25 averagea 56.8 58.1 56.8 58.3 59.7 60.1 59.4 59.8 59.5 59.0 58.8 4.0 EU-15 averagea 53.7 52.3 48.1 48.8 50.8 51.4 51.6 52.5 52.8 52.7 51.5 -1.8 EU-10 averagea 63.5 67.8 69.9 72.5 73.0 73.1 71.0 70.8 69.6 68.6 70.0 8.0 EU-25 averageb 38.5 35.7 33.3 34.3 36.2 36.9 39.9 38.3 39.8 44.8 37.8 16.4 EU-15 averageb 38.2 35.4 33.0 33.9 35.9 36.6 39.7 38.0 39.5 44.6 37.5 16.8 EU-10 averageb 57.1 60.2 61.3 59.5 61.2 61.0 61.7 61.7 61.4 60.3 60.5 5.6 Source: ECB, Eurostat, BankScope Note: a aggregates are unweighted averages, b aggregates represent assets weighted averages

72
Table 9 Herfindahl-Hirschman Index (HHI) for credit institutions’ total assets Country 1995 1996 1997 1998 1999 2000 2001 2002 2003 2004 Mean Change
1 Austria 648 515 515 511 548 561 618 557 552 558 -96 2 Belgium 986 669 909 1518 1506 1587 1905 2065 2100 1472 1114 3 Cyprus 2931 2747 2724 2778 2733 1304 1339 1392 1365 2146 -1566 4 Czech Republic 2551 2533 2269 1994 1847 1263 1199 1870 1103 1848 -1448 5 Denmark 1431 1442 1499 863 1119 1145 1114 1146 1220 -285 6 Estonia 4312 4573 4961 5210 4067 4028 3943 3887 4372 -425 7 Finland 2110 2274 2150 2120 1960 2050 2240 2050 2420 2680 2205 570 8 France 398 399 449 485 509 587 606 551 597 623 520 225 9 Germany 148 159 114 133 140 151 158 163 173 178 152 30
10 Greece 885 1165 986 1122 1113 1164 1130 1069 1079 184 11 Hungary 2886 2101 1895 1749 1409 892 856 783 795 1485 -2091 12 Ireland 500 473 480 486 512 553 562 556 515 56 13 Italy 316 291 201 210 220 190 260 270 240 230 243 -86 14 Latvia 1679 1450 1756 1304 1383 1244 1234 1144 1021 1357 -658 15 Lithuania 3353 2972 3320 3625 3188 2503 2240 2071 1854 2792 -1499 16 Luxembourg 210 222 236 242 275 296 315 304 263 94 17 Malta 4411 3921 3953 3553 2163 2390 2199 2015 3076 -2396 18 Netherlands 2058 1654 1802 1700 1694 1762 1788 1744 1726 1770 -332 19 Poland 850 859 788 731 705 821 792 753 692 777 -158 20 Portugal 577 575 566 986 991 963 1044 1093 849 516 21 Slovakia 2875 2643 1803 1965 1821 1205 1252 1191 1154 1768 -1721 22 Slovenia 2346 2314 2006 1966 1964 1582 1602 1496 1425 1856 -921 23 Spain 376 389 285 329 441 581 551 529 521 482 448 106 24 Sweden 830 790 790 800 760 800 760 854 798 854 25 United Kingdom 208 221 250 264 282 307 347 376 282 376 EU-25 averagea 1688 1481 1458 1473 1435 1193 1201 1217 1171 1369 -517 EU-15 averagea 913 693 712 759 787 805 852 873 906 931 823 238 EU-10 averagea 2434 2634 2506 2503 2381 1704 1693 1684 1531 2119 -903 EU-25 averageb 211 389 427 459 475 519 521 551 670 469 459 EU-15 averageb 334 189 370 409 444 461 512 513 542 662 444 473 EU-10 averageb 1940 2024 1782 1693 1565 1143 1142 1279 1087 1517 -853 Source: ECB, Eurostat, BankScope Note: a aggregates are unweighted averages, b aggregates represent assets weighted averages

73
Table 10 Loans as % of banks’ total assets Country 1996 1997 1998 1999 2000 2001 2002 2003 Mean Change (%) 1 Austria 49.84 50.50 51.25 49.11 49.16 51.34 51.25 50.35 2.83 2 Belgium 36.94 35.30 38.58 39.63 42.83 39.91 42.21 41.89 39.66 13.40 3 Cyprus 55.30 55.33 58.42 57.15 57.81 54.97 56.84 55.42 56.41 0.22 4 Czech Republic 45.63 46.05 40.99 35.08 30.17 32.30 32.91 37.25 37.55 -18.37 5 Denmark 66.42 61.85 61.53 64.20 64.80 61.75 58.17 58.86 62.20 -11.38 6 Estonia 48.82 55.97 59.67 56.23 59.05 57.83 64.55 69.53 58.96 42.42 7 Finland 55.43 58.30 62.40 64.86 64.50 62.78 64.34 53.47 60.76 -3.54 8 France 40.66 40.83 41.19 39.01 39.09 37.07 36.69 36.38 38.87 -10.53 9 Germany 62.27 61.98 60.94 57.44 57.43 57.31 57.05 56.82 58.91 -8.75
10 Greece 35.44 34.95 35.57 38.37 41.03 44.46 51.73 55.21 42.10 55.78 11 Hungary 31.28 33.53 37.09 40.53 47.69 50.38 58.60 63.90 45.38 104.28 12 Ireland 59.52 54.99 53.90 53.10 54.54 50.76 46.85 53.38 -21.29 13 Italy 49.94 50.84 55.88 57.27 58.14 57.34 60.48 55.70 21.11 14 Latvia 17.62 26.84 44.39 44.69 39.03 45.68 47.85 50.72 39.60 187.85 15 Lithuania 50.39 43.27 43.57 48.15 43.05 43.83 50.81 60.02 47.89 19.11 16 Luxembourg 19.94 22.36 22.37 22.76 23.36 23.87 23.04 21.24 22.37 6.52 17 Malta 53.39 49.89 49.44 50.73 50.33 49.42 48.79 50.28 -8.62 18 Netherlands 62.54 60.22 57.29 61.02 60.70 59.66 60.65 58.14 60.03 -7.04 19 Poland 35.37 40.22 42.40 47.84 46.56 44.99 47.03 49.14 44.19 38.93 20 Portugal 50.09 57.02 60.92 63.85 67.41 69.88 64.83 62.00 29.43 21 Slovakia 48.61 46.52 45.81 48.11 44.10 31.46 34.77 40.16 42.44 -17.38 22 Slovenia 42.75 44.66 47.83 51.96 52.51 48.92 50.34 52.90 48.98 23.74 23 Spain 46.21 49.04 51.87 53.59 53.55 55.22 58.64 60.27 53.55 30.43 24 Sweden 64.77 72.09 71.94 73.36 74.42 74.72 74.99 75.61 72.74 16.74 25 United Kingdom 53.72 53.39 54.9 54.06 53.86 54.52 55.04 54.21 2.46 EU 25 average 45.60 48.23 49.62 50.81 50.79 50.42 52.18 52.97 50.08 16.16 EU-15 average 49.06 50.67 51.36 52.74 53.27 53.32 54.09 53.09 52.20 8.21 EU-10 average 41.75 44.58 47.01 47.92 47.07 46.07 49.31 52.78 47.06 26.42 Source: BankScope

74
Table 11 Non-interest earnings assets as % of banks’ total assets Country 1996 1997 1998 1999 2000 2001 2002 2003 Mean Change (%)
1 Austria 3.49 5.33 4.83 5.11 6.94 6.92 6.81 5.63 95.31 2 Belgium 3.18 3.92 4.94 5.42 6.77 8.49 7.51 7.57 5.97 138.47 3 Cyprus 2.64 2.40 2.70 5.13 4.16 3.46 3.16 2.58 3.28 -2.26 4 Czech Republic 8.74 10.64 10.48 7.96 6.87 5.79 5.88 5.59 7.74 -36.04 5 Denmark 3.39 6.22 6.86 6.09 5.44 5.31 7.51 4.63 5.68 36.53 6 Estonia 9.08 9.86 10.65 9.79 9.39 8.45 7.32 6.34 8.86 -30.20 7 Finland 5.84 6.36 7.27 7.35 6.92 8.79 10.19 13.62 8.29 133.11 8 France 6.57 6.86 8.39 9.81 9.14 9.54 8.79 9.21 8.54 40.24 9 Germany 2.01 1.79 1.77 2.27 2.26 2.47 2.36 2.36 2.16 17.31
10 Greece 4.22 5.56 3.84 4.93 4.55 4.89 3.66 3.37 4.38 -20.07 11 Hungary 6.68 6.61 6.01 6.98 6.29 5.82 5.15 4.75 6.04 -28.89 12 Ireland 5.45 10.17 9.74 10.15 9.82 7.92 7.39 8.66 35.66 13 Italy 7.00 7.44 5.66 5.92 6.80 7.46 8.14 6.92 16.27 14 Latvia 11.13 11.30 12.54 10.38 8.90 7.50 7.48 6.28 9.44 -43.55 15 Lithuania 19.89 13.55 18.76 18.12 16.05 16.49 13.29 12.74 16.11 -35.95 16 Luxembourg 2.54 3.23 3.31 4.43 5.34 6.02 3.92 3.97 4.09 56.34 17 Malta 2.75 2.85 3.69 3.64 3.33 3.24 3.53 3.29 28.43 18 Netherlands 3.75 4.33 4.09 4.87 4.86 5.61 4.80 5.37 4.71 42.99 19 Poland 11.50 10.37 11.86 7.48 7.55 11.31 8.67 8.54 9.66 -25.75 20 Portugal 8.46 7.67 9.04 7.71 8.31 7.81 10.75 8.54 27.07 21 Slovakia 3.95 4.30 5.06 5.62 5.90 4.49 3.75 3.82 4.61 -3.24 22 Slovenia 4.64 4.50 4.00 3.99 3.96 5.00 3.66 3.43 4.15 -25.96 23 Spain 5.58 6.00 6.70 8.12 9.94 10.44 8.95 8.18 7.99 46.61 24 Sweden 7.78 7.13 7.01 7.59 7.00 7.10 7.95 6.51 7.26 -16.35 25 United Kingdom 7.48 7.46 6.71 7.46 7.58 7.51 7.81 7.43 4.44
EU-25 average 6.48 6.38 7.09 7.04 6.85 7.19 6.59 6.53 6.77 0.81 EU-15 average 4.49 5.55 6.15 6.46 6.57 7.21 6.88 7.05 6.29 57.06 EU-10 average 8.69 7.63 8.49 7.91 7.27 7.16 6.16 5.76 7.39 -33.74 Source: BankScope

75
Table 12 Customer and short–term funding as % of banks’ total assets Country 1996 1997 1998 1999 2000 2001 2002 2003 Mean Change (%)
1 Austria 64.35 68.53 68.66 67.87 68.68 66.52 66.33 67.28 3.07 2 Belgium 80.63 83.59 84.02 84.65 81.06 82.02 81.86 81.90 82.46 1.58 3 Cyprus 89.38 88.46 87.63 87.05 86.72 86.90 87.59 87.34 87.63 -2.29 4 Czech Republic 84.22 84.54 82.63 81.04 81.21 83.77 82.71 82.61 82.84 -1.91 5 Denmark 43.56 48.62 44.96 44.28 39.07 37.86 37.53 38.66 41.82 -11.25 6 Estonia 80.29 83.59 74.04 77.83 78.15 77.61 79.54 78.14 78.65 -2.67 7 Finland 81.88 82.61 78.80 76.80 74.66 69.20 68.12 66.22 74.79 -19.12 8 France 77.33 77.36 75.98 71.22 68.68 68.53 68.77 67.47 71.92 -12.75 9 Germany 72.60 72.28 71.91 71.33 68.54 69.32 69.41 71.28 70.83 -1.82
10 Greece 89.79 89.13 89.36 85.16 86.38 88.18 88.87 86.13 87.88 -4.08 11 Hungary 85.52 83.26 83.64 81.02 81.84 82.18 77.71 74.20 81.17 -13.23 12 Ireland 84.13 76.05 76.55 76.42 78.63 71.07 70.00 76.12 -16.80 13 Italy 67.52 67.05 63.42 62.97 61.86 64.27 65.31 64.63 -3.29 14 Latvia 80.66 81.68 88.10 82.72 84.13 86.18 86.52 87.24 84.66 8.16 15 Lithuania 75.94 79.97 76.30 82.65 80.96 83.07 83.62 84.36 80.86 11.08 16 Luxembourg 86.07 84.71 82.90 82.05 80.47 80.39 79.41 79.26 81.91 -7.90 17 Malta 89.94 84.96 85.12 85.58 86.49 86.49 86.01 86.37 -4.37 18 Netherlands 71.72 71.08 70.32 67.36 68.00 68.41 67.88 67.84 69.08 -5.42 19 Poland 81.30 82.89 84.40 85.36 83.92 82.11 79.89 80.38 82.53 -1.13 20 Portugal 82.82 83.66 81.69 79.25 76.08 73.48 72.57 78.51 -12.38 21 Slovakia 89.66 90.58 94.65 88.71 87.08 88.25 86.84 86.20 89.00 -3.86 22 Slovenia 75.95 77.08 84.32 84.61 83.32 84.48 82.93 82.89 81.95 9.14 23 Spain 84.30 83.65 82.52 79.65 77.14 76.24 75.61 74.12 79.15 -12.08 24 Sweden 47.34 50.12 46.37 46.80 55.14 57.86 56.70 53.73 51.76 13.50 25 United Kingdom 77.21 76.87 77.21 75.80 76.37 75.94 74.97 76.34 -2.90 EU-25 average 77.80 78.45 77.60 76.52 75.77 76.03 75.17 74.61 76.49 -4.10 EU-15 average 73.52 74.61 73.29 71.79 70.76 70.64 69.70 69.05 71.67 -6.08 EU-10 average 82.55 84.20 84.07 83.61 83.29 84.10 83.39 82.94 83.52 0.47 Source: BankScope

76
Table 13 Equity as % of banks’ total assets Country 1996 1997 1998 1999 2000 2001 2002 2003 Mean Change (%)
1 Austria 4.31 3.94 3.88 3.89 4.19 4.35 4.59 4.16 6.50 2 Belgium 3.09 3.29 3.59 3.69 3.73 3.27 3.45 3.43 3.44 11.00 3 Cyprus 5.08 5.15 5.14 7.49 8.51 6.74 6.15 5.66 6.24 11.42 4 Czech Republic 6.29 7.24 6.82 7.45 6.19 6.14 6.63 6.76 6.69 7.47 5 Denmark 6.74 5.99 5.84 5.45 4.92 4.56 4.43 4.53 5.31 -32.79 6 Estonia 9.96 7.17 13.56 13.79 12.08 10.52 11.04 10.69 11.10 7.33 7 Finland 4.61 4.59 4.88 5.24 6.39 5.78 5.87 10.03 5.92 117.57 8 France 4.11 4.11 4.08 4.03 4.24 4.35 4.40 4.57 4.24 11.19 9 Germany 5.45 5.37 5.15 4.72 4.72 4.57 4.67 4.62 4.91 -15.23
10 Greece 3.98 4.25 5.68 9.99 8.70 7.54 6.04 6.65 6.60 67.09 11 Hungary 5.81 7.94 7.47 6.80 7.59 8.19 8.77 8.58 7.64 47.68 12 Ireland 6.07 6.64 6.42 6.87 6.66 4.85 4.46 6.00 -26.52 13 Italy 6.39 6.69 8.98 8.21 7.94 7.69 7.60 7.64 18.94 14 Latvia 12.39 13.25 6.55 10.11 8.86 9.31 8.99 8.74 9.78 -29.46 15 Lithuania 7.59 6.84 10.81 10.02 10.48 10.27 10.72 9.66 9.55 27.27 16 Luxembourg 3.38 3.16 3.62 3.73 3.83 3.85 4.34 4.24 3.77 25.44 17 Malta 5.78 8.33 8.07 8.12 7.89 7.78 8.79 7.82 52.08 18 Netherlands 5.25 4.67 4.21 4.46 4.29 4.02 4.08 4.01 4.37 -23.62 19 Poland 6.33 7.73 7.41 8.19 8.98 9.75 10.40 10.23 8.63 61.61 20 Portugal 5.47 6.14 6.28 5.37 5.29 5.46 5.75 5.68 5.12 21 Slovakia 4.19 3.57 5.50 5.20 6.99 7.98 8.77 9.37 6.45 123.63 22 Slovenia 10.84 10.90 10.10 9.84 9.84 9.29 9.25 9.17 9.90 -15.41 23 Spain 6.05 6.30 6.51 6.69 7.46 7.39 7.39 7.11 6.86 17.52 24 Sweden 4.08 3.95 4.15 4.41 4.28 4.45 4.38 4.56 4.28 11.76 25 United Kingdom 4.52 4.72 4.88 5.20 5.20 5.06 5.02 4.94 11.06
EU-25 average 6.06 5.92 6.30 6.79 6.79 6.61 6.60 6.75 6.48 11.35 EU-15 average 4.67 4.83 5.06 5.52 5.47 5.27 5.10 5.41 5.17 15.78 EU-10 average 7.61 7.56 8.17 8.70 8.76 8.61 8.85 8.77 8.38 15.19
Source: BankScope

77
Table 14 Overhead costs as % of banks’ total assets Country 1996 1997 1998 1999 2000 2001 2002 2003 Mean Change (%)
1 Austria 1.69 1.70 1.60 1.40 1.59 1.69 1.63 1.61 -3.48 2 Belgium 1.37 1.29 1.51 1.46 1.54 1.48 1.43 1.33 1.43 -3.09 3 Cyprus 2.12 2.13 2.25 2.32 2.26 2.23 2.37 2.29 2.25 8.08 4 Czech Republic 2.72 2.66 4.52 3.52 3.24 3.28 2.66 2.52 3.14 -7.47 5 Denmark 1.26 1.36 1.30 1.30 1.15 1.11 0.99 0.90 1.17 -28.44 6 Estonia 5.84 3.92 4.15 4.75 4.01 3.44 3.49 2.80 4.05 -52.05 7 Finland 2.44 1.99 2.06 1.77 1.51 1.48 1.83 2.09 1.90 -14.44 8 France 1.75 1.73 1.74 1.55 1.64 1.55 1.52 1.47 1.62 -15.84 9 Germany 1.75 1.67 1.64 1.58 1.54 1.53 1.49 1.44 1.58 -17.74
10 Greece 2.64 2.63 2.55 2.59 2.57 2.54 2.69 2.59 2.60 -1.83 11 Hungary 4.71 4.23 4.50 5.42 4.92 4.55 4.49 4.01 4.60 -15.01 12 Ireland 1.91 2.64 2.53 2.08 1.58 1.12 0.85 1.82 -55.47 13 Italy 2.68 2.60 2.87 2.43 2.47 2.30 2.46 2.54 -8.42 14 Latvia 6.25 5.57 9.84 6.07 4.58 4.16 3.60 3.18 5.41 -49.12 15 Lithuania 6.82 6.14 5.30 4.61 5.03 5.20 4.41 3.39 5.11 -50.25 16 Luxembourg 0.62 0.62 0.69 0.70 0.76 0.76 0.84 0.78 0.72 26.41 17 Malta 1.67 1.55 1.60 1.58 1.49 1.39 1.49 1.54 -10.75 18 Netherlands 1.90 1.91 1.90 1.98 2.02 1.94 1.91 1.72 1.91 -9.40 19 Poland 2.79 3.35 4.03 4.23 4.33 3.84 4.07 3.84 3.81 37.49 20 Portugal 2.22 2.45 2.19 1.93 1.85 1.85 1.79 2.04 -19.59 21 Slovakia 2.70 3.52 3.43 3.86 4.00 5.25 3.42 3.28 3.68 21.51 22 Slovenia 3.25 3.61 3.74 3.62 3.60 3.10 3.15 3.06 3.39 -5.61 23 Spain 2.40 2.46 2.56 2.42 2.25 2.33 2.21 1.95 2.32 -18.80 24 Sweden 0.95 0.93 1.01 1.00 1.08 1.09 1.01 0.94 1.00 -0.81 25 United Kingdom 1.75 1.77 1.71 1.70 1.88 1.75 1.77 1.76 0.87
EU-25 average 2.86 2.55 2.86 2.69 2.53 2.47 2.31 2.14 2.55 -24.99 EU-15 average 1.71 1.79 1.87 1.82 1.71 1.68 1.64 1.58 1.72 -7.45 EU-10 average 4.13 3.68 4.33 4.00 3.75 3.65 3.31 2.99 3.73 -27.75
Source: BankScope
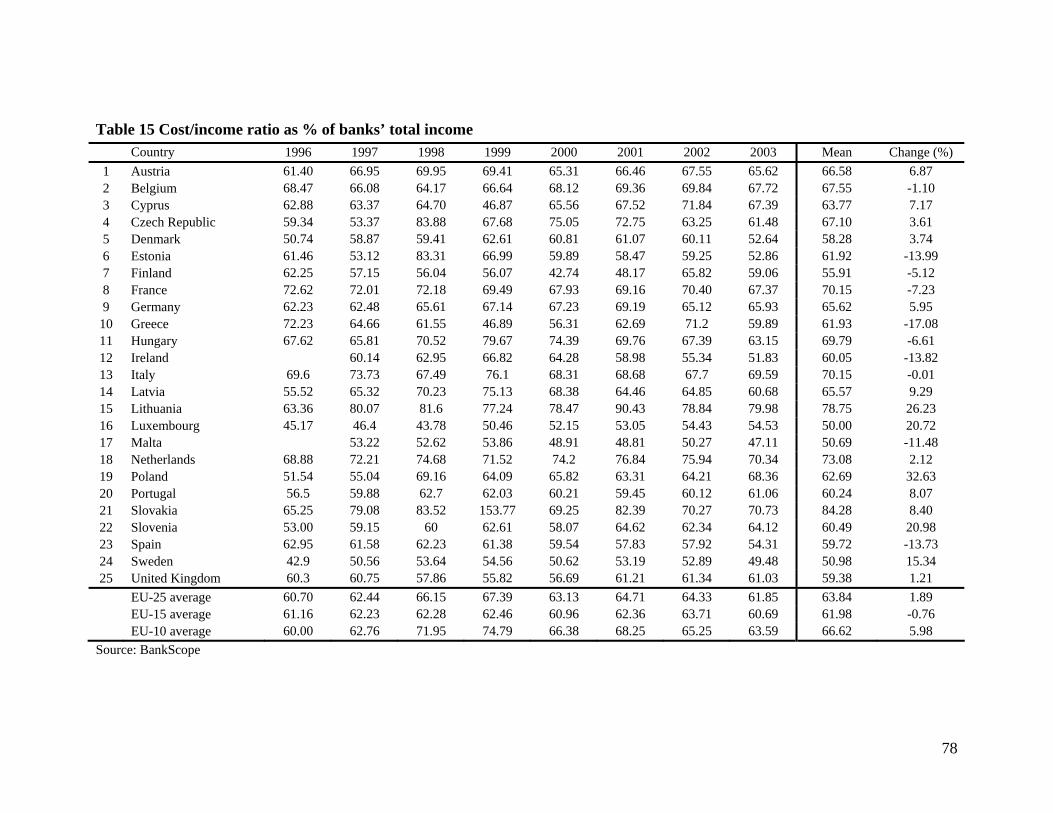
78
Table 15 Cost/income ratio as % of banks’ total income Country 1996 1997 1998 1999 2000 2001 2002 2003 Mean Change (%)
1 Austria 61.40 66.95 69.95 69.41 65.31 66.46 67.55 65.62 66.58 6.87 2 Belgium 68.47 66.08 64.17 66.64 68.12 69.36 69.84 67.72 67.55 -1.10 3 Cyprus 62.88 63.37 64.70 46.87 65.56 67.52 71.84 67.39 63.77 7.17 4 Czech Republic 59.34 53.37 83.88 67.68 75.05 72.75 63.25 61.48 67.10 3.61 5 Denmark 50.74 58.87 59.41 62.61 60.81 61.07 60.11 52.64 58.28 3.74 6 Estonia 61.46 53.12 83.31 66.99 59.89 58.47 59.25 52.86 61.92 -13.99 7 Finland 62.25 57.15 56.04 56.07 42.74 48.17 65.82 59.06 55.91 -5.12 8 France 72.62 72.01 72.18 69.49 67.93 69.16 70.40 67.37 70.15 -7.23 9 Germany 62.23 62.48 65.61 67.14 67.23 69.19 65.12 65.93 65.62 5.95
10 Greece 72.23 64.66 61.55 46.89 56.31 62.69 71.2 59.89 61.93 -17.08 11 Hungary 67.62 65.81 70.52 79.67 74.39 69.76 67.39 63.15 69.79 -6.61 12 Ireland 60.14 62.95 66.82 64.28 58.98 55.34 51.83 60.05 -13.82 13 Italy 69.6 73.73 67.49 76.1 68.31 68.68 67.7 69.59 70.15 -0.01 14 Latvia 55.52 65.32 70.23 75.13 68.38 64.46 64.85 60.68 65.57 9.29 15 Lithuania 63.36 80.07 81.6 77.24 78.47 90.43 78.84 79.98 78.75 26.23 16 Luxembourg 45.17 46.4 43.78 50.46 52.15 53.05 54.43 54.53 50.00 20.72 17 Malta 53.22 52.62 53.86 48.91 48.81 50.27 47.11 50.69 -11.48 18 Netherlands 68.88 72.21 74.68 71.52 74.2 76.84 75.94 70.34 73.08 2.12 19 Poland 51.54 55.04 69.16 64.09 65.82 63.31 64.21 68.36 62.69 32.63 20 Portugal 56.5 59.88 62.7 62.03 60.21 59.45 60.12 61.06 60.24 8.07 21 Slovakia 65.25 79.08 83.52 153.77 69.25 82.39 70.27 70.73 84.28 8.40 22 Slovenia 53.00 59.15 60 62.61 58.07 64.62 62.34 64.12 60.49 20.98 23 Spain 62.95 61.58 62.23 61.38 59.54 57.83 57.92 54.31 59.72 -13.73 24 Sweden 42.9 50.56 53.64 54.56 50.62 53.19 52.89 49.48 50.98 15.34 25 United Kingdom 60.3 60.75 57.86 55.82 56.69 61.21 61.34 61.03 59.38 1.21
EU-25 average 60.70 62.44 66.15 67.39 63.13 64.71 64.33 61.85 63.84 1.89 EU-15 average 61.16 62.23 62.28 62.46 60.96 62.36 63.71 60.69 61.98 -0.76 EU-10 average 60.00 62.76 71.95 74.79 66.38 68.25 65.25 63.59 66.62 5.98
Source: BankScope

79
Table 16 Net interest margin as % of banks’ total assets Country 1996 1997 1998 1999 2000 2001 2002 2003 Mean Change (%)
1 Austria 1.82 2.32 1.65 1.74 1.77 1.86 1.80 1.85 -1.10 2 Belgium 1.54 1.74 1.87 1.50 1.45 1.50 1.41 1.40 1.55 -9.09 3 Cyprus 2.14 2.24 2.47 2.41 2.82 2.64 2.45 2.51 2.46 17.29 4 Czech Republic 3.51 3.61 4.56 3.42 3.24 3.12 2.74 2.54 3.34 -27.64 5 Denmark 1.81 1.97 1.87 1.72 1.52 1.57 1.42 1.36 1.66 -24.86 6 Estonia 5.66 6.14 6.09 5.09 5.36 5.04 4.63 4.03 5.26 -28.80 7 Finland 2.37 3.62 2.35 2.17 2.40 2.03 2.06 1.92 2.37 -18.99 8 France 1.63 1.62 1.48 1.45 1.14 1.13 1.12 1.15 1.34 -29.45 9 Germany 2.39 2.31 2.12 2.13 1.88 1.78 1.8 1.86 2.03 -22.18
10 Greece 2.13 2.5 2.67 2.89 2.66 2.87 2.85 3.51 2.76 64.79 11 Hungary 4.63 5.05 4.87 4.51 4.72 4.76 4.97 4.62 4.77 -0.22 12 Ireland 2.27 2.49 2.03 1.9 1.9 1.81 1.29 1.96 -43.17 13 Italy 2.87 2.82 2.22 2.92 2.94 3.05 2.99 2.83 4.18 14 Latvia 7.71 6.34 7.12 6.7 5.19 4.45 3.5 3.1 5.51 -59.79 15 Lithuania 9.17 7.16 5.88 5.99 5.58 4.71 4.2 3.42 5.76 -62.70 16 Luxembourg 0.82 0.79 0.76 0.73 0.67 0.73 0.71 0.68 0.74 -17.07 17 Malta 2.45 2.51 2.24 3.22 2.35 1.65 2 2.35 -18.37 18 Netherlands 1.9 1.93 1.86 1.84 1.67 1.59 1.63 1.63 1.76 -14.21 19 Poland 4.67 5.61 5.65 5.2 5.48 4.48 3.76 3.38 4.78 -27.62 20 Portugal 2.79 3.01 2.7 2.69 2.5 2.46 2.23 2.63 -20.07 21 Slovakia 3.21 2.63 1.97 1.1 2.96 3.4 3.83 3.58 2.84 11.53 22 Slovenia 4.67 4.48 5.54 4.3 4.87 3.96 3.56 3.29 4.33 -29.55 23 Spain 2.99 3.16 3.13 3.02 3.02 3.21 3.02 2.75 3.04 -8.03 24 Sweden 1.62 1.48 1.32 1.38 1.42 1.49 1.54 1.54 1.47 -4.94 25 United Kingdom 1.93 2.32 2.24 1.99 1.94 1.88 1.69 2.00 -12.44
EU-25 average 3.40 3.14 3.16 2.83 2.90 2.71 2.56 2.41 2.89 -29.06 EU-15 average 1.92 2.19 2.16 1.98 1.94 1.93 1.91 1.85 1.98 -3.47 EU-10 average 5.04 4.57 4.67 4.10 4.34 3.89 3.53 3.25 4.17 -35.59
Source: BankScope

80
Table 17 Return on total assets as % of banks’ total assets Country 1996 1997 1998 1999 2000 2001 2002 2003 Mean Change (%)
1 Austria 0.25 0.34 0.36 0.43 0.37 0.33 0.41 0.36 64.00 2 Belgium 0.33 0.65 0.69 0.55 0.68 0.49 0.37 0.45 0.53 36.36 3 Cyprus 0.73 0.75 0.68 2.18 0.95 0.43 -0.47 -0.06 0.65 -108.22 4 Czech Republic 0.16 0.44 -2.25 -0.90 0.47 0.85 1.23 1.28 0.16 700.00 5 Denmark 0.79 0.84 0.74 0.62 0.65 0.45 0.41 0.58 0.64 -26.58 6 Estonia 3.34 3.64 -1.58 1.49 1.61 2.33 2.22 2.17 1.90 -35.03 7 Finland 0.35 1.50 0.83 1.12 1.69 1.39 0.53 1.00 1.05 185.71 8 France 0.25 0.31 0.32 0.44 0.52 0.47 0.36 0.40 0.38 60.00 9 Germany 0.26 0.30 0.29 0.23 0.33 0.19 0.21 0.18 0.25 -30.77
10 Greece 0.60 0.71 1.04 2.98 1.40 0.90 0.42 0.94 1.12 56.67 11 Hungary 1.16 1.75 1.18 0.60 1.31 1.57 1.72 1.73 1.38 49.14 12 Ireland 0.92 1.32 1.00 0.92 0.69 0.87 0.68 0.91 -26.09 13 Italy 0.36 0.52 0.39 0.66 0.69 0.68 0.75 0.58 108.33 14 Latvia 2.65 3.27 -9.94 0.55 1.88 1.77 1.43 1.41 0.38 -46.79 15 Lithuania 2.38 -0.22 1.19 1.32 0.60 -0.09 0.92 1.27 0.92 -46.64 16 Luxembourg 0.48 0.56 0.71 0.49 0.56 0.51 0.48 0.54 0.54 12.50 17 Malta 0.93 0.96 0.92 1.15 1.08 0.87 1.08 1.00 16.13 18 Netherlands 0.51 0.58 0.45 0.61 0.58 0.50 0.36 0.47 0.51 -7.84 19 Poland 2.15 1.97 0.41 1.19 1.15 0.97 0.46 0.43 1.09 -80.00 20 Portugal 1.05 0.96 1.11 1.04 0.84 0.74 0.79 0.93 -24.76 21 Slovakia 0.06 -1.26 -3.63 1.47 1.52 1.05 1.23 1.34 0.22 2133.33 22 Slovenia 1.08 1.11 1.49 0.93 1.28 0.86 1.12 0.88 1.09 -18.52 23 Spain 0.70 0.89 0.94 0.98 1.05 0.99 0.88 0.94 0.92 34.29 24 Sweden 0.81 0.48 0.62 0.69 0.78 0.65 0.59 0.65 0.66 -19.75 25 United Kingdom 0.66 0.88 0.88 0.96 0.71 0.58 0.63 0.76 -4.55
EU-25 average 0.99 0.90 -0.03 0.89 0.97 0.83 0.74 0.84 0.76 -15.30 EU-15 average 0.51 0.67 0.71 0.83 0.82 0.66 0.52 0.63 0.67 23.49 EU-10 average 1.52 1.24 -1.15 0.98 1.19 1.08 1.07 1.15 0.89 -24.31
Source: BankScope

81
Table 18 Market capitalization of listed companies as % of GDP Country 1995 1996 1997 1998 1999 2000 2001 2002 2003 2004 Mean Change (%)
1 Austria 13.8 14.7 17.4 16.1 15.7 15.7 12.9 15.4 21.5 29.6 17.3 113.9 2 Belgium 37.9 44.4 55.9 98.1 73.6 79.9 73.0 52.1 57.5 219.6 79.2 478.9 3 Cyprus 28.4 26.4 23.6 27.8 220.4 125.9 64.7 14.2 7.9 31.7 57.1 11.5 4 Czech Republic 28.4 29.6 22.7 19.7 20.0 19.7 15.0 21.6 19.5 28.8 22.5 1.5 5 Denmark 31.2 39.2 55.5 57.3 60.8 68.0 59.6 44.6 60.4 62.3 53.9 99.6 6 Estonia 22.3 9.3 32.2 33.9 24.6 34.5 41.7 57.4 32.0 156.8 7 Finland 34.0 49.4 59.8 119.4 273.3 244.9 157.1 105.5 105.2 98.5 124.7 189.4 8 France 33.6 38.0 48.0 68.3 102.2 110.6 88.9 67.3 77.1 92.7 72.7 175.9 9 Germany 23.5 28.2 39.1 51.0 67.9 67.9 57.8 34.5 44.9 44.0 45.9 87.4
10 Greece 14.5 19.4 28.2 65.6 170.1 98.9 73.8 51.7 62.0 61.6 64.6 324.3 11 Hungary 5.4 11.7 32.8 29.8 33.9 25.7 20.1 20.2 20.2 28.8 22.8 435.8 12 Ireland 38.9 47.5 61.6 76.6 72.0 86.4 73.3 49.2 55.3 62.2 62.3 59.9 13 Italy 19.1 20.9 29.5 47.6 61.7 71.5 48.4 40.2 41.9 47.2 42.8 147.2 14 Latvia 0.2 2.7 5.5 5.8 5.4 7.3 8.3 7.8 10.3 12.1 6.5 6333.5 15 Lithuania 2.1 11.1 17.2 9.6 10.5 14.0 9.9 10.4 19.1 29.0 13.3 1288.0 16 Luxembourg 168.4 180.1 194.0 187.3 180.0 173.5 121.0 106.6 140.9 161.0 161.3 -4.4 17 Malta 4.7 14.2 13.8 22.4 52.7 52.8 35.9 35.9 38.4 52.7 32.3 1011.2 18 Netherlands 85.9 92.0 124.4 153.3 174.4 172.8 119.3 95.9 95.5 107.8 122.1 25.4 19 Poland 3.4 5.5 7.9 12.2 18.0 18.8 13.9 15.0 17.7 29.4 14.2 776.5 20 Portugal 17.1 22.0 36.6 56.0 57.8 57.0 42.2 35.1 39.4 43.6 40.7 154.8 21 Slovakia 6.4 10.5 8.6 4.4 3.5 3.7 2.6 7.8 8.5 10.7 6.7 67.8 22 Slovenia 1.6 3.3 8.3 11.7 10.3 13.4 14.2 20.8 25.7 30.1 13.9 1836.1 23 Spain 33.9 39.8 51.7 68.4 71.7 89.8 80.1 70.4 86.6 94.9 68.7 180.2 24 Sweden 71.7 91.3 110.3 112.4 148.5 137.1 106.0 73.4 95.3 108.8 105.5 51.6 25 United Kingdom 124.0 146.1 150.4 166.8 200.6 179.0 155.0 119.2 134.4 131.5 150.7 6.0 EU-25 averagea 34.5 41.2 49.0 59.9 85.5 78.7 59.1 46.0 53.1 67.0 57.4 94.3 EU-15 averagea 49.8 58.2 70.8 89.6 115.4 110.2 84.6 64.1 74.5 91.0 80.8 82.6 EU-10 averagea 8.9 12.8 16.3 15.3 40.7 31.5 20.9 18.8 20.4 28.3 21.4 216.4 EU-25 averageb 42.7 50.1 60.5 76.8 98.2 97.6 78.9 60.1 69.3 78.7 71.3 84.3 EU-15 averageb 45.4 53.1 63.7 81.6 104.7 103.7 83.7 63.1 72.8 81.9 75.4 80.4 EU-10 averageb 9.2 12.0 15.1 15.6 22.5 20.5 15.2 16.8 18.4 28.2 17.3 206.9 Source: World Development Indicators, World Federation of Exchanges Note: a aggregates are unweighted averages, b aggregates represent GDP in PPP term weighted averages

82
Table 19 Average number of listed companies
No Obs.
Difference with
respect to the EU-15
average
Difference with
respect to the EU-10
average
Difference with
respect to the EU-25
average Austria 9 127 -355 -231 Belgium 8 155 -327 -203 Cyprus 8 83 -88 -275 Czech Republic 9 477 306 119 Denmark 9 232 -250 -126 Estonia 7 20 -151 -338 Finland 9 129 -353 -229 France 8 734 252 376 Germany 6 880 398 522 Greece 9 263 -219 -95 Hungary 9 52 -119 -306 Ireland 9 89 -393 -269 Italy 9 269 -213 -89 Latvia 4 16 -155 -342 Lithuania 4 48 -123 -310 Luxembourg 9 269 -213 -89 Malta 9 9 -162 -349 Netherlands 8 207 -275 -151 Poland 9 176 5 -182 Portugal 8 125 -357 -233 Slovakia 6 729 558 371 Slovenia 9 103 -68 -255 Spain 9 965 483 607 Sweden 9 276 -206 -82 United Kingdom 9 2506 2024 2148 EU-15 average 482 EU-10 average 171 EU-25 average 358 Period averages (1995-2003 when feasible). Data refer to all companies listed on the national stock exchange market (both residents and non residents). Sources: World Federation of Exchanges, ISI - Emerging Markets. For Cyprus, Belgium, France, the Netherlands and Portugal only domestic listed companies are reported. For these five countries the source is World Bank - World Development Indicators.

83
Table 20 Domestic debt securities as % GDP Country 1995 1996 1997 1998 1999 2000 2001 2002 2003 2004 Mean Change (%)
1 Austria 91.8 88.8 85.3 88.5 84.3 79.2 74.9 89.6 106.7 114.1 90.3 24.3 2 Belgium 251.3 238.6 201.6 209.2 172.3 154.8 145.1 171.2 196.1 203.5 194.4 -19.0 3 Cyprus 32.5 36.0 48.1 60.1 44.2 84.8 4 Czech Republic 29.5 26.4 25.9 45.0 50.5 44.5 45.2 66.5 83.3 90.5 50.7 206.2 5 Denmark 256.1 238.1 209.9 226.7 186.7 168.1 166.9 208.8 246.3 282.8 219.0 10.4 6 Estonia 2.1 2.0 3.1 3.3 2.6 60.9 7 Finland 95.7 95.5 82.3 89.4 76.6 62.2 57.8 68.8 88.3 98.0 81.5 2.5 8 France 132.8 125.9 112.1 112.6 97.3 93.4 89.8 108.6 138.6 154.1 116.5 16.0 9 Germany 118.5 116.9 108.7 122.6 107.2 99.0 84.4 96.7 115.0 119.9 108.9 1.2
10 Greece 114.6 122.0 105.3 109.7 90.6 84.0 82.9 108.8 136.3 156.4 111.1 36.5 11 Hungary 41.1 50.5 41.3 44.8 43.8 38.7 40.5 53.2 69.0 77.3 50.0 87.8 12 Ireland 66.1 63.3 49.7 47.5 42.0 35.8 29.4 35.4 60.7 73.6 50.3 11.2 13 Italy 216.0 206.7 169.8 175.4 150.1 135.3 130.7 156.3 189.8 208.8 173.9 -3.3 14 Latvia 7.8 8.0 10.3 11.1 9.3 41.9 15 Lithuania 13.3 14.0 15.7 16.4 14.8 22.9 16 Luxembourg 17 Malta 59.0 63.0 66.7 72.6 65.3 23.0 18 Netherlands 123.3 117.9 108.9 116.6 110.9 102.7 99.7 118.6 153.2 171.4 122.3 39.0 19 Poland 28.5 25.2 21.9 22.9 21.0 21.1 25.4 32.5 42.3 58.4 29.9 105.1 20 Portugal 85.7 85.5 69.7 76.7 69.9 66.7 66.6 88.5 115.0 132.6 85.7 54.8 21 Slovakia 18.4 18.9 19.1 18.1 15.5 13.0 28.6 33.2 38.0 43.1 24.6 133.7 22 Slovenia 35.0 29.0 47.0 46.7 39.4 33.6 23 Spain 95.1 92.9 84.3 88.2 80.8 67.8 63.5 77.8 101.1 123.9 87.5 30.3 24 Sweden 169.6 156.6 131.2 134.4 120.0 90.2 77.8 95.7 124.1 132.9 123.3 -21.7 25 United Kingdom 77.5 86.1 71.3 68.8 66.0 52.5 49.8 54.7 61.8 72.4 66.1 -6.5 EU-25 averagea 111.8 108.7 94.4 99.8 88.1 65.0 62.9 77.3 94.8 128.5 93.1 15.0 EU-15 averagea 135.3 131.1 113.6 119.0 103.9 92.3 87.1 105.7 130.9 146.0 116.5 7.9 EU-10 averagea 29.4 30.2 27.0 32.7 32.7 26.7 29.2 37.6 38.8 67.3 35.2 128.9 EU-25 averageb 124.8 121.5 105.5 110.7 97.4 87.5 82.0 97.0 118.5 131.1 107.6 5.1 EU-15 averageb 131.1 128.4 111.8 117.1 103.0 92.4 86.1 102.3 125.4 139.2 113.7 6.1 EU-10 averageb 26.1 25.3 22.3 26.7 26.4 27.4 30.8 41.3 51.7 57.6 33.6 120.9 Source: BIS, ECB Note: a aggregates are unweighted averages, b aggregates represent GDP in PPP term weighted averages

84
Table 21 Domestic government debt securities as % GDP Country 1995 1996 1997 1998 1999 2000 2001 2002 2003 2004 Mean Change (%)
1 Austria 45.1 44.3 43.1 45.6 45.0 42.6 40.6 47.0 52.0 53.4 45.9 18.4 2 Belgium 164.7 158.5 137.2 144.1 118.6 106.7 102.3 120.6 140.4 148.1 134.1 -10.0 3 Cyprus 29.9 40.9 47.5 39.5 58.7 4 Czech Republic 22.8 19.0 18.7 37.4 42.1 35.8 37.8 58.1 73.1 79.6 42.4 249.2 5 Denmark 101.1 93.1 77.9 79.4 67.7 57.3 52.1 63.9 67.0 70.5 73.0 -30.3 6 Estonia 0.4 1.6 1.4 1.1 221.6 7 Finland 51.9 56.4 50.8 53.4 45.7 39.1 36.4 42.0 54.5 58.9 48.9 13.4 8 France 58.0 58.7 54.7 60.6 52.8 49.1 47.3 59.0 77.3 84.8 60.2 46.2 9 Germany 36.1 36.8 34.8 39.8 36.2 34.4 33.7 43.2 56.3 64.3 41.6 77.9
10 Greece 110.6 120.8 104.3 108.5 90.2 83.8 82.6 108.5 135.6 155.7 110.1 40.7 11 Hungary 40.1 49.5 38.3 42.8 41.4 36.4 38.0 50.6 62.3 70.2 47.0 75.1 12 Ireland 61.0 60.0 43.3 39.3 33.2 24.9 18.3 22.1 31.5 35.6 36.9 -41.7 13 Italy 164.2 155.2 128.9 134.4 112.3 98.9 91.5 105.0 123.8 131.6 124.6 -19.8 14 Latvia 7.4 9.2 10.0 8.9 34.2 15 Lithuania 1.4 2.6 4.0 5.6 5.8 12.6 15.0 15.6 7.8 983.9 16 Luxembourg 17 Malta 52.8 0.0 58.0 63.0 43.4 19.4 18 Netherlands 77.1 74.1 64.1 68.0 57.8 48.5 43.9 52.7 67.1 74.6 62.8 -3.2 19 Poland 28.5 25.2 21.9 22.9 21.0 21.1 25.4 32.5 42.3 58.4 29.9 105.1 20 Portugal 66.1 61.4 46.2 47.3 41.7 39.1 39.5 54.9 71.6 84.3 55.2 27.6 21 Slovakia 18.4 18.9 19.1 18.1 15.5 22.0 28.6 32.5 33.6 43.1 25.0 133.7 22 Slovenia 2.2 10.0 24.5 18.1 17.1 18.0 0.0 27.6 25.9 15.9 1059.7 23 Spain 73.3 74.8 69.3 72.3 61.1 53.2 47.3 54.6 61.8 64.0 63.2 -12.7 24 Sweden 83.9 77.1 66.7 70.2 62.8 48.1 39.5 48.2 63.1 68.1 62.8 -18.8 25 United Kingdom 56.6 59.3 47.3 43.5 40.1 32.5 30.6 33.9 38.1 46.9 42.9 -17.2 EU-25 averagea 63.2 62.8 54.7 57.6 50.4 41.5 41.8 49.2 58.9 77.3 55.7 22.4 EU-15 averagea 82.1 80.8 69.2 71.9 61.8 54.2 50.4 61.1 74.3 81.5 68.7 -0.8 EU-10 averagea 18.9 20.9 21.1 24.1 23.8 23.7 21.6 32.6 33.0 62.8 28.3 232.2 EU-25 averageb 72.5 71.3 61.7 65.1 56.5 50.3 47.4 57.2 69.6 76.9 62.8 6.1 EU-15 averageb 77.1 76.2 66.0 69.2 59.8 53.0 49.8 59.7 72.9 80.3 66.4 4.2 EU-10 averageb 24.7 24.1 21.5 25.9 25.4 25.3 26.2 38.3 47.4 54.5 31.3 121.0 Source: BIS, ECB Note: a aggregates are unweighted averages, b aggregates represent GDP in PPP term weighted averages

85
Table 22 Domestic financial institutions debt securities as % GDP Country 1995 1996 1997 1998 1999 2000 2001 2002 2003 2004 Mean Change (%)
1 Austria 34.8 30.6 25.5 29.4 25.2 17.4 15.8 19.8 25.1 30.7 25.4 -11.6 2 Belgium 67.1 57.9 49.3 42.7 33.7 32.1 30.4 36.1 43.6 50.2 44.3 -25.1 3 Cyprus 82.0 79.7 73.5 82.2 70.1 63.2 48.6 50.2 52.7 48.6 65.1 -40.8 4 Czech Republic 3.8 1.2 1.0 1.1 0.4 0.2 0.3 0.3 0.7 0.7 1.0 -81.2 5 Denmark 0.3 0.3 0.9 0.6 0.8 0.7 0.8 1.0 5.1 5.3 1.6 1419.8 6 Estonia 7 Finland 49.6 49.5 39.4 39.4 35.6 33.0 32.0 39.6 49.3 55.9 42.3 12.7 8 France 0.3 1.1 0.8 0.7 126.8 9 Germany 0.0 0.0 0.0 0.4 0.0
10 Greece 2.8 2.8 11 Hungary 3.3 3.1 2.9 -13.4 12 Ireland 41.0 38.5 39.9 42.7 44.7 39.7 40.8 50.3 69.0 81.1 48.8 97.6 13 Italy 0.0 0.0 0.0 0.0 0.0 0.0 1.4 0.0 0.2 0.0 14 Latvia 8.5 11.2 12.4 16.1 16.5 17.1 16.7 19.1 28.0 30.8 17.6 263.0 15 Lithuania 0.3 0.1 2.0 0.8 546.0 16 Luxembourg 9.9 18.7 20.1 16.2 103.6 17 Malta 12.1 10.2 8.7 8.6 11.6 8.6 9.2 12.7 21.8 33.8 13.7 178.7 18 Netherlands 79.4 72.9 57.8 55.6 48.3 33.5 27.9 37.1 50.3 53.5 51.6 -32.7 19 Poland 16.7 22.6 20.7 22.3 23.2 17.9 17.2 18.9 21.3 23.3 20.4 39.7 20 Portugal 36.7 34.6 30.5 32.1 28.0 20.0 23.4 23.8 27.9 39.2 29.6 6.8 21 Slovakia 50.4 47.5 41.7 43.9 38.3 33.7 31.5 38.1 44.1 53.5 42.3 6.2 22 Slovenia 1.2 1.2 1.3 1.3 1.3 2.2 2.3 3.2 4.5 2.6 2.1 114.7 23 Spain 34.8 30.6 25.5 29.4 25.2 17.4 15.8 19.8 25.1 30.7 25.4 -11.6 24 Sweden 67.1 57.9 49.3 42.7 33.7 32.1 30.4 36.1 43.6 50.2 44.3 -25.1 25 United Kingdom 82.0 79.7 73.5 82.2 70.1 63.2 48.6 50.2 52.7 48.6 65.1 -40.8 EU-25 averagea 36.7 34.6 30.5 32.1 28.0 20.0 23.4 23.8 27.9 39.2 29.6 6.8 EU-15 averagea 50.4 47.5 41.7 43.9 38.3 33.7 31.5 38.1 44.1 53.5 42.3 6.2 EU-10 averagea 1.2 1.2 1.3 1.3 1.3 2.2 2.3 3.2 4.5 2.6 2.1 114.7 EU-25 averageb 48.1 46.0 40.2 41.6 36.4 32.2 28.3 32.3 38.4 41.7 38.5 -13.3 EU-15 averageb 49.3 47.5 41.8 43.4 38.3 33.9 30.0 34.5 41.1 45.0 40.5 -8.7 EU-10 averageb 1.2 1.2 1.2 1.2 1.2 1.5 1.0 1.7 3.5 1.7 1.5 42.5 Source: BIS, ECB Note: a aggregates are unweighted averages, b aggregates represent GDP in PPP term weighted averages

86
Table 23 Domestic corporate debt securities as % GDP Country 1995 1996 1997 1998 1999 2000 2001 2002 2003 2004 Mean Change (%)
1 Austria 10.7 15.4 16.8 16.6 22.2 23.4 24.9 30.7 46.0 51.2 25.8 378.2 2 Belgium 10.1 9.6 8.5 6.2 6.4 5.9 8.2 11.6 16.2 18.6 10.1 83.4 3 Cyprus 1.1 0.5 0.4 0.7 -60.9 4 Czech Republic 1.1 1.7 1.7 1.7 2.4 3.3 3.3 4.4 5.0 5.9 3.1 426.9 5 Denmark 14.2 13.4 13.2 14.6 12.0 10.2 9.2 10.2 12.4 13.0 12.2 -8.9 6 Estonia 1.1 0.6 0.8 0.8 -26.9 7 Finland 8.9 8.4 6.0 6.7 5.8 5.8 5.7 7.0 8.7 8.4 7.1 -5.1 8 France 7.7 9.3 8.1 9.2 10.8 12.2 12.0 13.5 17.7 19.0 12.0 147.4 9 Germany 0.4 0.4 0.4 0.5 0.9 1.4 2.1 3.2 6.0 7.1 2.2 1858.7
10 Greece 0.1 0.0 0.1 0.0 0.0 0.0 0.0 0.0 0.0 0.0 0.0 -100.0 11 Hungary 0.7 0.7 2.1 1.4 1.6 1.6 1.6 1.6 1.6 1.8 1.5 153.3 12 Ireland 5.2 3.3 6.4 8.3 8.8 10.8 11.0 13.3 29.2 38.0 636.5 13 Italy 2.2 2.0 1.5 1.6 2.2 3.4 7.2 11.7 16.7 21.3 7.0 855.9 14 Latvia 0.1 0.4 0.2 385.2 15 Lithuania 0.7 0.7 0.4 0.6 -40.5 16 Luxembourg 17 Malta 2.9 5.6 6.7 5.1 128.5 18 Netherlands 5.1 5.3 4.9 5.9 8.4 14.5 15.0 15.6 17.1 15.7 10.7 207.2 19 Poland 2.1 2.1 20 Portugal 11.2 13.1 11.0 13.2 11.7 10.5 10.4 14.5 15.4 17.4 12.8 55.3 21 Slovakia 1.0 0.0 0.5 2.4 1.0 144.5 22 Slovenia 2.1 0.8 2.3 1.1 0.0 0.7 0.8 1.1 -64.5 23 Spain 9.6 7.9 6.4 7.4 8.1 6.0 7.0 10.5 17.4 26.1 10.6 171.2 24 Sweden 6.3 6.6 6.8 8.6 9.0 8.6 10.4 10.4 10.7 11.3 8.9 80.2 25 United Kingdom 4.2 4.2 3.3 3.0 2.7 2.1 2.1 1.9 2.3 2.2 2.8 -46.6 EU-25 averagea 6.1 6.3 5.8 6.2 6.8 5.6 7.2 7.7 9.9 6.5 6.8 5.9 EU-15 averagea 6.8 7.1 6.7 7.3 7.8 8.2 8.9 11.0 15.4 8.1 8.7 18.8 EU-10 averagea 0.9 1.2 2.0 1.3 2.1 1.4 1.2 1.8 1.7 1.5 1.5 64.0 EU-25 averageb 4.3 4.5 4.0 4.4 5.0 5.5 6.4 8.1 11.5 13.4 6.7 209.6 EU-15 averageb 4.8 5.0 4.4 4.8 5.4 5.8 6.7 8.7 12.3 14.7 7.2 203.3 EU-10 averageb 0.3 0.4 0.7 0.6 0.7 1.0 0.8 1.2 2.4 1.3 1.0 303.8 Source: BIS, ECB Note: a aggregates are unweighted averages, b aggregates represent GDP in PPP term weighted averages

87
Table 24 Total value of shares traded as of GDP Country 1995 1996 1997 1998 1999 2000 2001 2002 2003 2004 Mean Change (%)
1 Austria 11.0 8.9 5.9 8.3 5.6 4.9 3.8 2.8 4.3 8.2 6.4 -0.3 2 Belgium 5.5 9.7 12.1 22.1 23.5 16.7 18.1 13.8 12.4 20.1 15.4 2.6 3 Cyprus 3.4 5.2 3.4 6.5 69.2 101.2 35.9 1.9 0.7 1.1 22.9 -0.7 4 Czech Republic 6.6 13.8 12.6 7.9 7.0 11.8 5.5 8.2 9.7 16.5 10.0 1.5 5 Denmark 14.4 18.9 27.7 40.9 36.0 57.9 44.3 29.9 31.6 40.1 34.2 1.8 6 Estonia 30.1 16.6 5.1 6.0 3.7 3.4 6.2 7.7 9.8 -0.7 7 Finland 14.7 17.6 29.7 46.6 88.8 172.3 147.7 134.1 101.0 117.9 87.0 7.0 8 France 23.5 17.8 28.6 40.7 54.6 82.8 81.6 65.1 56.6 65.5 51.7 1.8 9 Germany 23.3 32.3 25.4 35.5 38.6 57.2 76.5 62.1 47.7 51.8 45.0 1.2
10 Greece 5.2 6.7 17.3 38.4 157.2 84.8 31.9 18.7 22.4 21.4 40.4 3.1 11 Hungary 0.8 3.6 16.3 34.1 30.0 26.0 9.3 9.2 10.0 13.0 15.2 15.4 12 Ireland 19.5 16.8 20.3 48.8 53.0 15.2 21.9 27.0 28.6 24.1 27.5 0.2 13 Italy 7.9 8.3 17.0 39.8 45.4 72.4 50.6 45.5 45.2 48.1 38.0 5.1 14 Latvia 0.2 1.4 1.3 0.6 2.9 2.0 1.3 1.3 0.8 1.3 2.8 15 Lithuania 0.5 0.6 2.4 2.0 2.7 1.8 1.7 1.3 1.1 2.1 1.6 3.2 16 Luxembourg 1.1 2.9 3.2 6.2 5.2 6.1 2.2 1.3 1.0 1.2 3.0 0.0 17 Malta 0.5 0.4 0.7 1.6 9.2 4.9 1.2 1.4 1.7 2.4 2.5 18 Netherlands 59.9 82.4 75.6 106.8 120.0 182.7 269.1 110.5 90.6 104.7 120.2 0.7 19 Poland 2.0 3.6 5.2 5.3 6.8 8.8 4.0 3.1 4.1 6.9 5.0 2.4 20 Portugal 3.9 6.4 19.7 42.3 35.4 51.1 24.8 16.7 14.5 20.5 23.5 4.2 21 Slovakia 4.3 11.1 10.2 4.7 2.3 4.4 4.6 3.3 2.0 1.6 4.9 -0.6 22 Slovenia 1.7 2.0 1.8 3.4 3.5 2.5 4.1 0.5 2.6 3.6 2.6 1.1 23 Spain 10.2 41.2 80.7 118.9 123.6 175.5 143.4 154.8 111.5 120.5 108.0 10.8 24 Sweden 37.6 50.6 71.2 82.1 94.8 162.8 137.4 90.6 87.7 119.1 93.4 2.2 25 United Kingdom 45.0 48.6 62.4 82.0 94.2 127.5 130.8 174.0 119.8 173.2 105.8 2.9 EU-25 average 13.2 17.1 23.2 33.7 44.5 57.6 50.3 39.2 33.9 39.7 35.2 201.5 EU-15 average 18.8 24.6 33.1 50.6 65.1 84.7 79.0 63.1 51.7 62.4 53.3 231.2 EU-10 average 2.5 4.5 8.4 8.3 13.6 17.0 7.2 3.4 4.6 6.5 7.6 163.8 Source: World Development Indicators, World Federation of Exchanges

88
Table 25 Average value of bond traded as of GDP
nobs Value of
bond traded / GDP
Difference with respect to the EU-15
average
Difference with respect to the EU-10
average
Difference with respect to the EU-25
average
Austria 8 0.00 -0.99 -0.78 Belgium 5 0.00 -0.99 -0.78 Cyprus 0 Czech Republic 0 Denmark 8 5.49 4.50 4.71 Estonia 0 Finland 8 0.00 -0.99 -0.78 France 5 0.37 -0.63 -0.41 Germany 8 0.46 -0.54 -0.32 Greece 0 Hungary 4 0.03 0.00 -0.75 Ireland 7 0.47 -0.52 -0.31 Italy 8 1.75 0.76 0.97 Latvia 0 Lithuania 0 Luxembourg 8 0.11 -0.88 -0.67 Malta 5 0.04 0.02 -0.73 Netherlands 5 0.79 -0.21 0.01 Poland 8 0.01 -0.01 -0.77 Portugal 6 0.06 -0.93 -0.71 Slovakia 0 Slovenia 8 0.01 -0.01 -0.77 Spain 8 0.02 -0.97 -0.75 Sweden 8 3.43 2.43 2.65 United Kingdom 8 0.95 -0.04 0.17 EU-15 average 0.99 EU-10 average 0.02 EU-25 average 0.78 Source: World Federation of Exchanges; World Bank, World Development Indicators Data refer to listed bonds yearly traded values, period averages (1996-2003 when feasible)

89
Table 26 Shares turnover ratio of stock traded in %
Country 1995 1996 1997 1998 1999 2000 2001 2002 2003 2004 Mean Change (%) 1 Austria 78.3 61.8 70.7 47.4 37.9 29.8 27.7 21.3 25.1 34.0 43.4 -56.6 2 Belgium 15.6 23.2 23.1 28.9 27.5 20.7 24.1 247.9 24.9 14.9 45.1 -4.3 3 Cyprus 15.3 18.9 14.6 26.6 39.2 56.6 39.9 11.0 6.3 3.6 23.2 -76.2 4 Czech Republic 24.9 50.3 45.7 38.0 36.7 60.3 34.1 36.6 52.5 72.8 45.2 191.9 5 Denmark 45.2 54.2 56.7 73.0 60.0 86.0 66.6 60.4 65.4 71.4 63.9 58.0 6 Estonia 98.2 17.6 18.9 13.6 14.9 18.3 16.6 28.3 -83.1 7 Finland 44.5 41.8 53.3 53.0 44.3 64.3 75.6 106.8 105.8 124.3 71.4 179.3 8 France 146.6 49.8 64.1 68.7 62.4 74.1 84.6 88.0 85.7 81.7 80.6 -44.3 9 Germany 211.4 123.2 137.6 144.9 107.5 79.1 124.7 140.5 130.0 123.7 132.3 -41.5
10 Greece 37.0 40.2 72.5 86.5 131.1 63.7 39.1 26.0 44.0 37.5 57.7 1.3 11 Hungary 17.3 41.6 73.4 113.9 95.8 90.7 44.4 46.5 57.6 57.3 63.8 231.0 12 Ireland 56.7 24.5 83.4 81.8 90.9 19.2 29.5 50.5 60.7 44.5 54.2 -21.6 13 Italy 45.2 43.8 65.8 104.1 82.7 104.0 87.9 109.1 121.5 114.5 87.9 153.4 14 Latvia 16.6 34.4 1.4 0.2 48.6 26.3 24.0 15.7 7.9 19.5 -52.6 15 Lithuania 39.5 5.1 17.6 39.4 48.5 14.8 15.1 17.5 8.2 9.3 21.5 -76.4 16 Luxembourg 0.7 1.7 1.7 3.4 2.9 3.4 1.5 2.3 0.8 0.8 1.9 19.3 17 Malta 16.0 4.5 4.7 9.0 10.0 9.3 2.8 3.4 2.6 4.0 6.6 -74.9 18 Netherlands 75.1 92.4 67.2 70.7 145.1 101.4 191.8 123.7 104.1 108.8 108.0 44.8 19 Poland 71.5 84.8 78.4 54.4 45.8 49.9 26.1 28.7 26.6 30.6 49.7 -57.2 20 Portugal 23.1 33.2 65.8 93.4 63.0 85.5 52.5 52.4 42.4 52.5 56.4 127.2 21 Slovakia 69.9 135.9 108.0 73.7 59.7 129.8 140.7 179.5 29.4 18.2 94.5 -73.9 22 Slovenia 69.0 66.8 40.4 2.0 1.6 20.7 30.5 27.7 12.7 13.9 28.5 -79.8 23 Spain 33.6 113.1 169.9 201.9 178.5 210.7 177.2 211.1 157.5 143.3 159.7 326.6 24 Sweden 61.6 64.4 67.8 73.9 73.1 111.2 112.8 96.2 113.6 123.7 89.8 100.9 25 United Kingdom 77.1 36.8 44.4 53.4 51.9 66.6 78.4 135.4 100.6 140.5 78.5 82.3 EU-25 averagea 55.4 51.2 60.9 65.7 60.6 64.8 61.9 74.5 56.5 58.0 60.9 4.6 EU-15 averagea 63.4 53.6 69.6 79.0 77.3 74.6 78.3 98.1 78.8 81.1 75.4 27.8 EU-10 averagea 40.4 47.2 46.3 45.6 35.5 49.9 37.4 39.0 27.6 28.3 39.7 -30.0 Source: World Development Indicators, World Federation of Exchanges

90
Table 27 Average investment financing
Gross fixed capital
formation
New capital raised %
Athens 35.20 1.80 5.11
Borsa Italiana 258.10 6.20 2.40
Budapest 16.70 0.00 0.00
Copenhagen 39.40 0.80 2.03
Deutsche Börse 408.30 0.20 0.05
Euronext 492.90 36.00 7.30
Helsinki 27.50 0.40 1.45
Irish 29.80 1.50 5.03
London 272.80 34.40 12.61
Luxembourg 5.30 2.20 41.51
Malta 0.90 0.10 11.11 Spanish Exchanges (BME) 182.70 21.40 11.71
Stockholm 44.90 na na
Warsaw 38.70 0.10 0.26
Wiener Börse 50.30 1.10 2.19
Year 2002. Billions of dollars. Source: World Federation of Exchanges

91
Figure 2 A comparison of some of the largest stock exchange market
1923
106.6
2692
16461392
855
148.1
866575
1995
421113
542
8972
2308
112.6 167.4 89.5
Market capitalisation (billions ofeuros)
Turnover ratio Number of quoted companies
London stock exchangeEuronext (without Lisbon)Deutsche Borse Spanish exchangesNordic and Baltic stock exchangeNew York Stock Exchange
2003

92
Table 28 Total investments of insurance companies and total assets under management
as per cent of GDP
Insurance companies Pension funds Investment funds 1995 2004 1995 2004 1995 2004
Austria 26.6 28.8 3.7 4.3 45.3 51.7 Belgium 45.5 57.7 5.7 4.1 34.1 33.4 Cyprus n/a n/a n/a n/a n/a n/a Czech Republic 7.2 9.3 2.4 3.7 4.0 4.3 Denmark 53.8 63.3 23.3 192.8 21.2 39.2 Estonia 2.3 3.4 0.0 1.9 n/a 3.5 Finland 23.7 25.5 n/a n/a 9.0 14.4 France 55.9 59.9 0.0 0.0 43.3 48.5 Germany 44.6 49.3 n/a 11.7 37.6 38.9 Greece 9.2 7.2 0.0 0.0 13.2 9.5 Hungary 4.9 4.4 4.0 6.6 5.0 5.3 Ireland 48.2 58.2 43.7 42.0 242.7 292.5 Italy 25.2 29.4 0.5 0.9 31.5 20.8 Latvia 2.2 2.0 0.2 0.4 0.2 0.5 Lithuania 1.6 2.3 0.0 0.1 n/a n/a Luxemburg 130.0 130.3 n/a n/a 3,878.3 3,797.9 Malta 10.9 13.9 0.0 0.0 13.0 23.5 Netherlands 66.3 65.8 100.8 106.9 25.1 20.1 Poland 5.1 7.1 2.7 7.9 1.7 4.7 Portugal 20.6 24.6 11.5 10.7 19.8 21.9 Slovakia 5.6 7.2 n/a n/a n/a 5.0 Slovenia 6.0 8.9 0.9 2.0 11.5 8.0 Spain 21.9 24.3 6.6 7.7 23.3 24.8 Sweden 0.1 31.3 0.0 0.0 35.6 42.1 United Kingdom 108.6 95.0 73.6 64.5 22.6 24.8 EU-25 average a 46.6 48.3 17.6 21.9 39.6 41.0 OMS average a 50.3 52.2 19.0 23.5 42.9 44.4 NMS average a 5.2 6.7 2.3 5.4 2.8 4.6 Source: ECB, National Central Banks and Eurostat n/a= not available a GDP in PPP terms weighted averages

93
Table 29 Per capita life insurance premium (in euro) 1996 1997 1998 1999 2000 2001 2002 2003 Mean Change (%)
1 Austria 897.7 586.3 630.8 672.4 560.5 566.0 613.4 917.4 680.6 2.2 2 Belgium 850.7 806.3 981.7 1113.7 1158.5 1034.4 1251.6 2267.8 1183.1 166.6 3 Cyprus 318.7 291.6 309.8 871.4 423.3 259.6 298.6 433.2 400.8 35.9 4 Czech Republic 49.5 44.0 51.0 59.7 52.9 64.8 97.0 157.7 72.1 218.4 5 Denmark 1593.5 1385.0 1575.4 1366.6 1129.8 1222.0 1489.2 2304.8 1508.3 44.6 6 Estonia 10.9 10.9 7 Finland 1923.7 1551.3 1735.6 1863.1 1611.1 1469.9 1669.3 2405.8 1778.7 25.1 8 France 1979.5 1713.4 1409.4 1483.9 1327.6 1135.8 1276.1 1999.8 1540.7 1.0 9 Germany 967.5 786.5 797.5 812.4 630.8 603.9 696.6 1052.5 793.5 8.8
10 Greece 121.9 113.3 118.4 143.7 109.4 97.5 109.7 172.1 123.2 41.1 11 Hungary 39.4 38.3 46.4 53.4 58.4 53.1 72.5 112.1 59.2 184.8 12 Ireland 1147.9 1237.8 1444.5 1931.2 1743.9 1522.9 1619.1 2615.9 1657.9 127.9 13 Italy 373.3 426.9 580.3 701.1 513.2 645.5 855.7 1400.8 687.1 275.2 14 Latvia 6.4 6.1 8.0 2.4 2.7 4.5 5.0 -28.8 15 Lithuania 10.3 22.7 16.5 120.6 16 Luxembourg 744.1 685.8 663.6 623.3 499.1 497.2 794.3 1313.4 727.6 76.5 17 Malta 123.8 165.0 198.9 333.4 205.2 169.3 18 Netherlands 1610.0 1398.6 1535.0 1488.4 1253.2 1204.6 1225.6 1766.6 1435.3 9.7 19 Poland 29.2 30.6 30.5 40.9 45.8 43.6 47.9 67.8 42.0 132.0 20 Portugal 365.7 297.0 365.5 413.4 326.9 271.3 395.8 691.6 390.9 89.1 21 Slovakia 26.7 0.0 38.2 40.8 42.0 47.8 60.8 97.1 44.2 264.0 22 Slovenia 95.2 81.8 118.4 85.6 78.0 91.1 119.5 196.4 108.2 106.2 23 Spain 425.4 387.0 392.9 484.4 513.2 439.7 556.0 552.7 468.9 29.9 24 Sweden 1031.0 708.3 740.6 1422.4 1404.8 1214.4 1165.2 1812.5 1187.4 75.8 25 United Kingdom 1819.6 1951.3 3783.6 2667.5 2797.1 2299.8 2533.6 2960.5 2601.6 62.7
EU-25 average 781.4 660.3 760.0 798.2 740.1 679.5 715.0 1069.1 775.5 36.8 EU-15 average 1056.8 935.7 1117.0 1145.8 1038.6 948.3 1083.4 1615.6 1117.7 52.9 EU-10 average 93.1 70.4 90.5 146.3 100.4 103.6 100.9 158.3 107.9 70.0 Source: Swiss RE

94
Table 30 Per capita non-life insurance premium (in euro) 1996 1997 1998 1999 2000 2001 2002 2003 Mean Change (%)
1 Austria 1245.6 966.8 931.5 847.4 652.2 642.0 759.7 1171.6 902.1 -5.9 2 Belgium 1062.8 1031.1 776.6 716.2 554.5 548.9 642.3 985.2 789.7 -7.3 3 Cyprus 289.5 258.0 260.1 251.7 205.4 210.4 272.4 432.5 272.5 49.4 4 Czech Republic 132.1 121.2 135.3 127.4 111.1 120.1 160.8 253.4 145.2 91.9 5 Denmark 1090.7 886.8 925.3 841.0 658.6 653.6 825.9 1220.0 887.8 11.9 6 Estonia 7 Finland 580.3 501.6 538.2 495.0 413.0 409.0 479.2 664.8 510.1 14.6 8 France 1003.1 785.7 789.8 733.9 566.8 564.8 675.8 1052.6 771.6 4.9 9 Germany 1392.9 1103.0 1055.6 973.6 746.7 725.3 842.6 1267.8 1013.5 -9.0
10 Greece 130.8 114.1 109.9 117.6 95.3 102.0 129.7 215.7 126.9 64.9 11 Hungary 85.1 78.2 79.9 79.1 67.3 74.7 104.2 168.2 92.1 97.7 12 Ireland 780.9 705.8 690.7 685.0 613.5 685.4 936.8 1534.9 829.1 96.6 13 Italy 598.1 514.3 542.9 527.5 412.4 416.9 501.6 763.3 534.6 27.6 14 Latvia 46.5 62.1 63.6 59.2 62.0 97.4 65.1 109.5 15 Lithuania 44.4 63.8 54.1 43.6 16 Luxembourg 1516.1 1200.2 1253.9 1124.5 864.0 902.8 1034.8 1510.2 1175.8 -0.4 17 Malta 236.9 189.0 233.9 333.1 248.2 40.6 18 Netherlands 1345.9 1087.1 1110.3 1075.6 862.0 876.8 1112.3 1733.5 1150.4 28.8 19 Poland 71.1 78.4 89.9 83.9 68.7 81.8 88.7 115.7 84.8 62.7 20 Portugal 407.6 334.2 336.8 313.0 282.3 256.1 360.1 529.6 352.5 29.9 21 Slovakia 78.7 76.4 87.3 72.3 59.1 61.9 79.9 141.2 82.1 79.3 22 Slovenia 478.7 305.4 284.4 320.4 324.3 335.2 407.2 624.5 385.0 30.5 23 Spain 551.1 436.6 427.5 436.6 368.1 387.8 476.1 743.8 478.4 35.0 24 Sweden 844.4 669.7 609.5 552.1 455.2 418.8 530.0 854.7 616.8 1.2 25 United Kingdom 859.6 828.9 834.7 790.3 674.9 739.7 1134.4 1630.5 936.6 89.7
EU-25 average 692.6 551.4 529.1 510.3 414.3 427.4 495.6 754.5 546.9 8.9 EU-15 average 894.0 744.4 728.9 681.9 548.0 555.3 696.1 1058.5 738.4 18.4 EU-10 average 189.2 137.7 154.5 142.6 127.9 153.3 161.5 247.8 164.3 31.0 Source: Swiss RE

95
Table 31 Life Insurance premiums as % of GDP 1996 1997 1998 1999 2000 2001 2002 2003 Mean Change (%)
1 Austria 2.51 2.02 2.15 2.45 2.61 2.75 2.61 2.59 2.46 3.19 2 Belgium 2.54 2.98 3.57 4.52 5.68 5.18 5.57 6.81 4.61 168.11 3 Cyprus 2.12 2.28 2.39 6.92 3.82 2.46 2.39 2.29 3.08 8.02 4 Czech Republic 0.77 0.77 0.85 1.08 1.16 1.31 1.50 1.72 1.15 123.38 5 Denmark 3.77 3.79 4.28 3.92 4.03 4.51 4.84 5.18 4.29 37.40 6 Estonia 0.29 0.29 7 Finland 6.20 5.87 6.21 7.02 7.42 6.99 6.98 6.81 6.69 9.84 8 France 5.90 6.34 5.10 5.70 6.59 5.73 5.61 5.99 5.87 1.53 9 Germany 2.65 2.72 2.71 2.96 3.00 3.00 3.06 3.17 2.91 19.62
10 Greece 0.82 0.93 1.14 1.12 1.00 0.94 0.93 0.98 13.41 11 Hungary 0.71 0.77 0.88 1.05 1.37 1.16 1.18 1.20 1.04 69.01 12 Ireland 4.79 5.33 5.61 7.26 7.50 6.30 5.42 6.04 6.03 26.10 13 Italy 4.79 1.89 2.54 3.24 3.41 3.81 4.39 4.82 3.61 0.63 14 Latvia 0.25 0.21 0.29 0.09 0.08 0.09 0.17 -64.00 15 Lithuania 0.29 0.28 0.40 0.32 37.93 16 Luxembourg 1.41 1.64 1.44 1.33 1.27 1.19 1.75 2.09 1.52 48.23 17 Malta 1.26 1.99 2.14 2.52 1.98 100.00 18 Netherlands 4.97 5.29 5.68 5.60 5.85 5.66 4.98 4.93 5.37 -0.80 19 Poland 0.64 0.77 0.70 0.96 1.21 1.07 1.04 1.12 0.94 75.00 20 Portugal 2.67 2.55 3.05 3.58 3.37 2.76 3.46 4.14 3.20 55.06 21 Slovakia 0.61 0.72 0.90 1.05 1.28 1.44 1.46 1.38 1.11 126.23 22 Slovenia 0.80 0.79 0.81 0.81 0.92 1.08 1.15 1.25 0.95 56.25 23 Spain 2.27 2.53 2.51 3.01 3.92 3.32 3.65 2.38 2.95 4.85 24 Sweden 2.85 2.42 2.48 4.96 5.94 5.74 4.55 4.74 4.21 66.32 25 United Kingdom 7.27 7.87 8.94 10.30 12.71 10.73 10.19 8.62 9.58 18.57
EU-25 average 2.91 2.84 2.83 3.32 3.83 3.60 3.30 3.38 3.25 16.38 EU-15 average 3.69 3.80 3.81 4.47 4.96 4.58 4.53 4.62 4.31 24.96 EU-10 average 0.94 0.91 1.00 1.42 1.41 1.50 1.25 1.33 1.22 41.24 Source: Swiss RE

96
Table 32 Non -life Insurance premiums as % of GDP 1996 1997 1998 1999 2000 2001 2002 2003 Mean Change (%)
1 Austria 2.51 3.34 3.17 3.09 3.04 3.12 3.23 3.30 3.10 31.47 2 Belgium 2.54 3.82 3.80 2.91 2.72 2.75 2.86 2.96 3.05 16.54 3 Cyprus 2.12 2.01 2.01 2.00 1.85 2.00 2.18 2.28 2.06 7.55 4 Czech Republic 0.77 2.12 2.25 2.32 2.44 2.43 2.49 2.76 2.20 258.44 5 Denmark 3.77 2.43 2.50 2.41 2.35 2.41 2.68 2.74 2.66 -27.32 6 Estonia 1.43 1.43 7 Finland 6.20 1.90 1.93 1.86 1.90 1.94 2.00 1.88 2.45 -69.68 8 France 5.90 2.91 2.86 2.82 2.81 2.85 2.97 3.15 3.28 -46.61 9 Germany 2.65 3.81 3.59 3.55 3.55 3.60 3.70 3.82 3.53 44.15
10 Greece 0.82 0.87 0.86 0.93 0.98 1.04 1.11 1.17 0.97 42.68 11 Hungary 0.71 1.56 1.51 1.55 1.58 1.63 1.70 1.80 1.51 153.52 12 Ireland 4.79 3.04 2.70 2.57 2.64 2.84 3.14 3.55 3.16 -25.89 13 Italy 1.39 2.28 2.38 2.44 2.39 2.46 2.58 2.63 2.32 89.21 14 Latvia 1.84 2.13 2.32 2.12 1.83 1.97 2.04 7.07 15 Lithuania 0.78 1.19 1.11 1.03 42.31 16 Luxembourg 1.41 2.88 2.73 2.39 2.19 2.15 2.28 2.40 2.30 70.21 17 Malta 2.29 2.28 2.52 2.52 2.40 10.04 18 Netherlands 4.15 4.12 4.11 4.05 4.02 4.12 4.52 4.84 4.24 16.63 19 Poland 0.64 1.97 2.06 1.97 1.82 2.00 1.92 1.91 1.79 198.44 20 Portugal 2.67 2.87 2.80 2.71 2.91 2.61 3.14 3.17 2.86 18.73 21 Slovakia 1.76 1.87 2.06 1.86 1.80 1.86 1.92 2.00 1.89 13.64 22 Slovenia 4.05 2.94 2.57 2.88 3.84 3.96 3.91 3.98 3.52 -1.73 23 Spain 2.93 2.85 2.73 2.71 2.81 2.93 3.12 3.20 2.91 9.22 24 Sweden 2.34 2.29 2.04 1.92 1.93 1.98 2.07 2.23 2.10 -4.70 25 United Kingdom 3.44 3.34 3.15 3.05 3.07 3.45 4.56 4.75 3.60 38.08
EU-25 average 2.74 2.59 2.53 2.36 2.49 2.56 2.65 2.76 2.59 0.51 EU-15 average 3.17 2.85 2.76 2.63 2.62 2.68 2.93 3.05 2.84 -3.62 EU-10 average 1.68 2.04 2.11 1.90 2.21 2.31 2.18 2.26 2.09 34.86 Source: Swiss RE

97
Table 33 Shareholders’ rights in Europe
Country One Share -One Vote
Proxy by Mail
Allowed
Shares Not Blocked before
Meeting
Cumulative Voting /
Proportional Representation
Oppressed Minority
Preemptive Right to New
Issues
Percentage of Share Capital to Call an
Extraordinary Shareholder Meeting
Shareholder rights
Mandatory dividend
1 Cyprus 0 0 0 1 1 1 0.10 4 0 2 Ireland 0 0 1 0 1 1 0.10 4 0 3 United Kingdom 0 1 1 0 1 0 0.10 5 0 Common law - origin average 0.00 0.33 0.67 0.33 1.00 0.67 0.10 4.33 0.00
4 Austria 0 0 0 0 0 1 0.05 2 0 5 Belgium 0 0 0 0 0 0 0.20 0 0 6 Czech Republic 0 0 1 0 1 1 0.05 4 0 7 Denmark 0 0 1 0 0 0 0.10 2 0 8 Estonia 1 0 1 1 0 1 0.10 4 0 9 Finland 0 0 1 0 0 1 0.10 3 0
10 France 0 1 0 0 0 1 0.10 3 0 11 Germany 0 0 0 0 0 0 0.05 1 0 12 Greece 1 0 0 0 0 1 0.05 2 0.35 13 Hungary 0 0 0 1 1 0 0.10 3 0 14 Italy 0 0 1 0 0 0 0.10 2 0 15 Latvia 0 0 0 1 1 1 0.05 4 0 16 Lithuania 1 0 0 1 0 1 0.10 3 0 17 Luxembourg 1 1 0 0 1 1 0.20 4 0 18 Malta 0 0 0 1 1 1 0.10 4 0 19 Netherlands 0 0 0 0 0 1 0.10 2 0 20 Poland 0 0 0 1 1 1 0.10 4 0 21 Portugal 0 0 1 0 0 1 0.05 3 0 22 Slovakia 1 0 0 1 1 1 0.05 4 0 23 Slovenia 1 0 1 0 1 1 0.05 4 0 24 Spain 0 0 0 1 1 1 0.05 4 0 25 Sweden 0 0 1 0 0 1 0.10 3 0
Civil law - origin average 0.27 0.09 0.36 0.36 0.41 0.77 0.09 2.95 0.02 Source: Company law or commercial code; LLSV (1998)

98
Table 34 Creditors’ rights
Country No Automatic Stay on Assets
Secured Creditors First Paid
Restrictions for Going into
Reorganization
Management Does Not Stay in
Reorganization
Creditor Rights
Legal Reserve Required as a %
of Capital
1 Cyprus 0 1 1 1 3 0 2 Ireland 0 1 0 0 1 0 3 United Kingdom 1 1 1 1 4 0 Common law - origin average 0.33 1.00 0.67 0.67 2.67 0.00
4 Austria 1 1 1 0 3 0.10 5 Belgium 1 1 0 0 2 0.10 6 Czech Republic 1 0 1 1 2 0.00 7 Denmark 1 1 1 0 3 0.25 8 Estonia 0 0 0 1 1 0.34 9 Finland 0 1 0 0 1 0.00
10 France 0 0 0 0 0 0.10 11 Germany 1 1 1 0 3 0.10 12 Greece 0 0 0 1 1 0.33 13 Hungary 1 0 0 0 1 0.75 14 Italy 0 1 1 0 2 0.20 15 Latvia 0 1 1 0 2 0.00 16 Lithuania 0 0 0 1 1 0.50 17 Luxembourg 0 0 1 1 2 0.10 18 Malta 0 1 1 1 3 0.00 19 Netherlands 0 1 1 0 2 0.00 20 Poland 1 0 1 1 3 0.66 21 Portugal 0 1 0 0 1 0.20 22 Slovakia 1 1 1 1 4 0.00 23 Slovenia 0 1 1 1 3 0.00 24 Spain 1 1 0 0 2 0.20 25 Sweden 0 1 1 0 2 0.20
Civil law - origin average 0.41 0.64 0.59 0.41 2.00 0.19 Source: Company law or commercial code; LLSV (1998)

99
Table 35 Financial systems’ regulations
Ability of banks to engage in:
Country Securities Insurance Real estate Nonfinancial firms
Restricted banking
Deposit Insurance
1 Cyprus 2 2 1 3 2 1 2 Ireland 1 4 1 2 2 1 3 United Kingdom 1 2 1 1 1.25 1 Common law - origin average 1.33 2.67 1.00 2.00 1.75 1.00
4 Austria 1 2 1 1 1.25 1 5 Belgium 2 2 3 2 2.25 1 6 Czech Republic 1 2 2 3 2 1 7 Denmark 1 2 2 2 1.75 1 8 Estonia 2 2 2 2 2 1 9 Finland 1 3 1 2 1.75 1
10 France 1 2 1 2 1.5 1 11 Germany 1 3 1 2 1.75 1 12 Greece 2 3 2 2 2.25 1 13 Hungary 2 2 2 2 2 1 14 Italy 1 2 4 3 2.5 1 15 Latvia 1 2 3 2 2 1 16 Lithuania 2 2 3 2 2.25 1 17 Luxembourg 1 2 1 2 1.5 0 18 Malta 1 3 3 3 2.5 0 19 Netherlands 1 2 1 1 1.25 1 20 Poland 1 3 3 2 2.25 1 21 Portugal 1 2 3 2 2 1 22 Slovakia 1 2 2 3 2 1 23 Slovenia 2 2 2 3 2.25 1 24 Spain 1 2 3 1 1.75 1 25 Sweden 1 2 3 3 2.25 1
Civil law – origin average 1.32 2.23 2.18 2.14 1.95 0.91 Source: Bank law, J.R. Barth, L. G. Dopico, D. E. Nolle, J. A. Wilcox (2002, 2003)

100
Table 36 Law enforcement as 2004
Country Procedures to
enforce a contract
Time to enforce a contract (days)
Cost to enforce a contract
(% of GNI per capita)
Law & Order
1 Cyprus 7.85 2 Ireland 16 183 7.00 8.69 3 United Kingdom 12 101 0.50 8.30 Common law - origin average 14.00 142.00 3.75 8.28
4 Austria 20 434 1.00 8.68 5 Belgium 22 365 9.10 8.49 6 Czech Republic 16 270 18.50 7.72 7 Denmark 14 83 3.80 8.71 8 Estonia 7.40 9 Finland 19 240 15.80 8.70
10 France 21 210 3.80 8.05 11 Germany 14 154 10.40 8.37 12 Greece 15 315 8.20 7.56 13 Hungary 17 365 2.40 7.57 14 Italy 16 645 3.90 7.97 15 Latvia 19 189 7.50 7.34 16 Lithuania 30 150 5.80 7.29 17 Luxembourg 9.05 18 Malta 8.13 19 Netherlands 21 39 0.50 8.69 20 Poland 18 1000 11.20 7.74 21 Portugal 22 420 4.90 8.14 22 Slovakia 26 420 13.30 7.53 23 Slovenia 22 1003 3.60 7.86 24 Spain 20 147 10.70 7.92 25 Sweden 21 190 7.60 8.31
Civil law - origin average 19.63 349.42 7.47 8.06 Source: World Development Indicators

101
Table 37 Effective top statutory tax rate on corporate income (in %)
1995 1996 1997 1998 1999 2000 2001 2002 2003 2004 Mean Change (%)
1 Austria 34 34 34 34 34 34 34 34 34 34 34.00 0.00 2 Belgium 40.2 40.2 40.2 40.2 40.2 40.2 40.2 40.2 34 34 38.96 -15.42 3 Cyprus 25 25 25 25 25 29 28 28 15 15 24.00 -40.00 4 Czech Republic 41 39 39 35 35 31 31 31 31 28 34.10 -31.71 5 Denmark 34 34 34 34 32 32 30 30 30 30 32.00 -11.76 6 Estonia 26 26 26 26 26 26 26 26 26 26 26.00 0.00 7 Finland 25 28 28 28 28 29 29 29 29 29 28.20 16.00 8 France 36.7 36.7 36.7 41.7 40 36.7 36.4 35.4 35.4 35.4 37.11 -3.54 9 Germany 56.8 56.7 56.7 56 51.6 51.6 38.3 38.3 39.6 38.3 48.39 -32.57
10 Greece 40 40 40 40 40 40 37.5 35 35 35 38.25 -12.50 11 Hungary 19.6 19.6 19.6 19.6 19.6 19.6 19.6 19.6 19.6 17.7 19.41 -9.69 12 Ireland 40 38 36 32 28 24 20 16 12.5 12.5 25.90 -68.75 13 Italy 52.2 53.2 53.2 41.3 41.3 41.3 40.3 40.3 38.3 37.3 43.87 -28.54 14 Latvia 25 25 25 25 25 25 25 22 19 15 23.10 -40.00 15 Lithuania 29 29 29 29 29 24 24 15 15 15 23.80 -48.28 16 Luxembourg 40.9 40.9 39.3 37.5 37.5 37.5 37.5 30.4 30.4 30.4 36.23 -25.67 17 Malta 35 35 35 35 35 35 35 35 35 35 35.00 0.00 18 Netherlands 35 35 35 35 35 35 35 34.5 34.5 34.5 34.85 -1.43 19 Poland 40 40 38 36 34 30 28 28 27 19 32.00 -52.50 20 Portugal 39.6 39.6 39.6 37.4 37.4 35.2 35.2 33 33 27.5 35.75 -30.56 21 Slovakia 40 40 40 40 40 29 29 25 25 19 32.70 -52.50 22 Slovenia 25 25 25 25 25 25 25 25 25 25 25.00 0.00 23 Spain 35 35 35 35 35 35 35 35 35 35 35.00 0.00 24 Sweden 28 28 28 28 28 28 28 28 28 28 28.00 0.00 25 United Kingdom 33 33 31 31 30 30 30 30 30 30 30.80 -9.09
EU 25 average 35.04 35.04 34.73 33.87 33.26 32.12 31.08 29.75 28.65 27.42 32.10 -21.74 EU-15 average 38.03 38.15 37.78 36.74 35.87 35.30 33.76 32.61 31.91 31.39 35.15 -17.44 EU-10 average 30.56 30.36 30.16 29.56 29.36 27.36 27.06 25.46 23.76 21.47 27.51 -29.74 Source: Eurostat

102
Table 38 Capital income taxation as of July-2005 (general rates in %) Interest payments to Dividend payments to
Countries Residents Residents in (other) EU State
Non-residents Residents Non-residents
1 Austria 25 15 0 25 25 2 Belgium 15 15 15 25 25 3 Cyprus 10 IS 10 20 0 4 Czech Republic 15 IS 15 15 15 5 Denmark 0 IS 0 28 28 6 Estonia 0 IS 0 26 0 7 Finland 29 IS 0 28 28 8 France 25 IS 15 25 25 9 Germany 31.65 IS 0 25 25 10 Greece 15 IS 15 0 0 11 Hungary 0 IS 0 20 20 12 Ireland 20 IS 0 20 20 13 Italy 12.5 IS 12.5 12.5 27 14 Latvia 0 IS 0 0 10 15 Lithuania 0 IS 0 15 15 16 Luxembourg 0 15 0 20 20 17 Malta 15 IS 0 0 0 18 Netherlands 0 IS 0 25 25 19 Poland 19 IS 20 15 15 20 Portugal 20 IS 20 15 25 21 Slovakia 19 IS 19 0 0 22 Slovenia 0 IS 0 25 15 23 Spain 15 IS 0 15 25 24 Sweden 30 IS 0 0 30 25 United Kingdom 20 IS 0 0 0 EU 25 average 13.45 5.66 15.98 16.72 EU-15 average 17.21 5.17 17.57 21.87 EU-10 average 7.80 6.40 13.60 9.00 * IS – Exchange Information System Source: Deutsche Bank Research, PriceWaterhouseCoopers

103
Figure 3 Size of financial markets (average, 1995 – 2003)
-
50.00
100.00
150.00
200.00
250.00
300.00
350.00
400.00
450.00
EU-25 EU-15 EU-10 United States Japan
% o
f GD
P
Bank assets Stock market capitalization Debt Securities
Sources: ECB, Eurostat, BIS, WDI, WFE. Note: EU-25, EU-15 and EU-10 aggregates represent GDP in PPP term weighted averages

104
Figure 4 Bank credit and liabilities (average, 1995 -2003)
0.00
20.00
40.00
60.00
80.00
100.00
120.00
140.00
160.00
180.00
EU-25 EU-15 EU-10 United States Japan
% o
f GD
P
Bank loans Bank deposits
Sources: ECB, Eurostat, WDI Note: EU-25, EU-15 and EU-10 aggregates represent GDP in PPP term weighted averages

105
Figure 5 Bank concentration and efficiency (average, 1996 – 2003)
0.00
0.50
1.00
1.50
2.00
2.50
3.00
3.50
4.00
4.50
EU-25 EU-15 EU-10 United States Japan
% o
f tot
al a
sset
s
0.00
10.00
20.00
30.00
40.00
50.00
60.00
70.00
80.00
% o
f tot
al a
sset
s (C
R5)
Net Interest Margin Overhead Costs Concentration (CR5)
Sources: ECB, BankScope Note: EU-25, EU-15 and EU-10 aggregates represent asset weighted averages for CR5

106
Figure 6 Equity market development (average, 1995-2003)
0.00
20.00
40.00
60.00
80.00
100.00
120.00
140.00
160.00
180.00
200.00
EU-25 EU-15 EU-10 United States Japan
% o
f GD
P
0.00
20.00
40.00
60.00
80.00
100.00
120.00
140.00
160.00
% o
f val
ue o
f dom
estic
equ
ities
Total value traded Market capitalization Turnover ratio
Sources: WDI, WFE Note: EU-25, EU-15 and EU-10 aggregates represent GDP in PPP term weighted averages for Market Capitalization
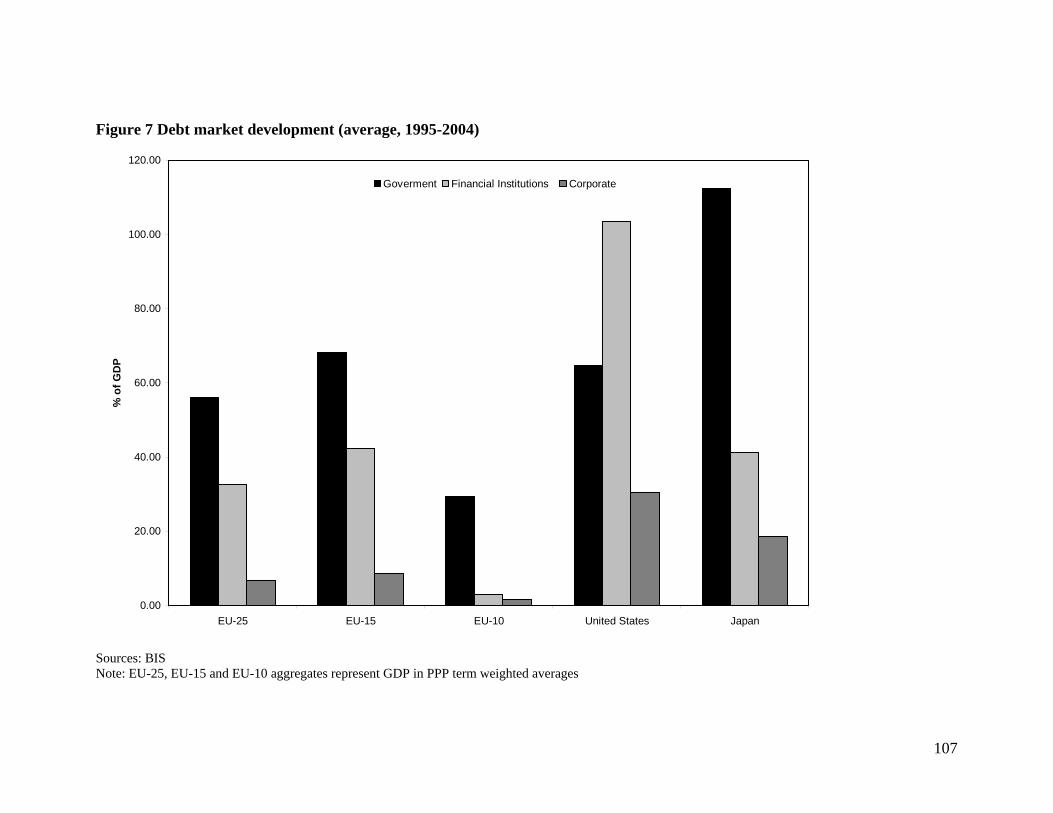
107
Figure 7 Debt market development (average, 1995-2004)
0.00
20.00
40.00
60.00
80.00
100.00
120.00
EU-25 EU-15 EU-10 United States Japan
% o
f GD
P
Goverment Financial Institutions Corporate
Sources: BIS Note: EU-25, EU-15 and EU-10 aggregates represent GDP in PPP term weighted averages
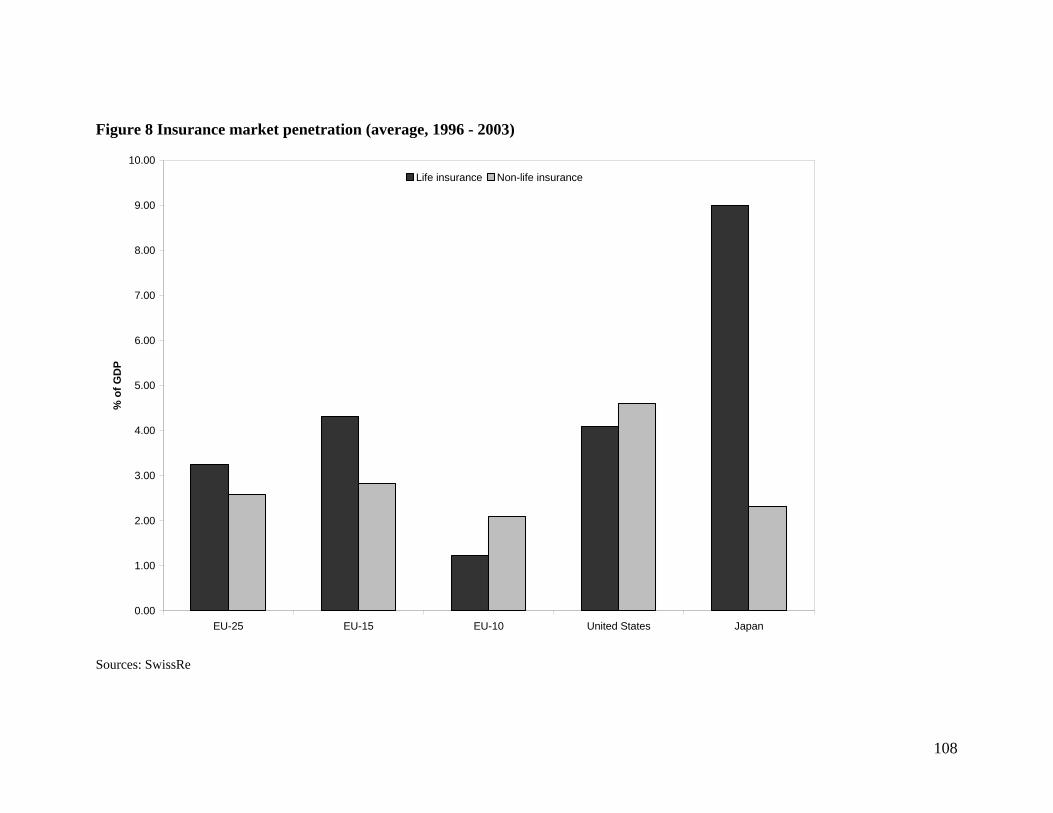
108
Figure 8 Insurance market penetration (average, 1996 - 2003)
0.00
1.00
2.00
3.00
4.00
5.00
6.00
7.00
8.00
9.00
10.00
EU-25 EU-15 EU-10 United States Japan
% o
f GD
P
Life insurance Non-life insurance
Sources: SwissRe