The Financial State of British Columbia’s Non-Profit...
59
The Financial State of British Columbia’s Non-Profit Housing Stock Current and Emerging Opportunities Written by Christine Wenmann B.C. Non-Profit Housing Association Research Intern School of Community and Regional Planning University of British Columbia In collaboration with B.C. Non-Profit Housing Association Made possible by the financial support and administration of MITACS ACCELERATE and the B.C. Government, Ministry of Housing and Social Development September 2009
Transcript of The Financial State of British Columbia’s Non-Profit...
The Financial State of British Columbia’s Non-Profit Housing Stock
Current and Emerging Opportunities
Written by Christine Wenmann B.C. Non-Profit Housing Association Research Intern
School of Community and Regional Planning University of British Columbia
In collaboration with
B.C. Non-Profit Housing Association
Made possible by the financial support and administration of MITACS ACCELERATE
and the B.C. Government, Ministry of Housing and Social Development
September 2009

2/59
This report was written with the support, guidance and input of many people. In particular, the author wishes to thank: Natasha Jategaonkar Research Director B.C. Non-Profit Housing Association
Dr. Cecile Lacombe Director of Housing Research, Knowledge and Information Services, Office of the Chief information Officer, Ministry of Citizens’ Services Dr. Penny Gurstein Director, School of Community and Regional Planning University of British Columbia
3/59
Executive Summary This report, The Financial State of British Columbia’s Non-profit Housing Stock: Current and Emerging Opportunities, analyzes data from the B.C. Non-Profit Housing Association’s (BCNPHA) Asset Analysis project. A sample of 797 non-profit housing buildings representing 63% of the sector in B.C. were included in the analysis, which seeks to answer the question: What is the financial state of B.C.’s non-profit housing sector and what does the current situation imply in terms of the opportunities and challenges that will emerge for the sector as operating agreements expire? Non-profit housing societies manage affordable housing stock with government subsidies distributed within the terms of operating agreements. The majority of the non-profit housing sector will see their operating agreements expire within 25 years. At present there are no current plans for federal reinvestment of funds for those operating agreements devolved to the province by the federal government. The implicit intention of most operating agreements is that buildings will be able to meet operating costs with rental and other income once the mortgage has amortized and the subsidy withdrawn. In practice, this intention may be realised in some but not all cases. There are no current plans provincially to ensure that these expectations are valid and to ameliorate effects if they are found wanting. To better understand the impact of expiring operating agreements, an analysis of the financial viability of B.C.’s sector is necessary and has not previously been done. This report explores several financial indicators to determine relative financial strength of non-profit housing buildings in B.C. Three of these — if a building is covering its operating costs with income and subsidy; if a building has a capital plan in place; and if a building has an investment strategy for replacement reserve funds — are grouped to create a financial strength index by which to broadly characterize buildings in the sector as ‘positive,’ ‘medium’ or ‘vulnerable’. Additional analyses assess mortgages, assets, and replacement reserve fund allocations. Financial indicators are then compared between groups of societies on the basis of four characteristics: urban/rural geography; portfolio size; operating agreement program; and a segmentation framework developed by BCNPHA. Seventy-three percent of non-profit housing buildings in B.C. are currently able to cover their existing operating costs with their income and subsidy. Just over half of the buildings (53%) have a capital plan and 72% have an investment strategy for their replacement reserve funds. Taking these three factors into consideration, 36% of buildings are characterized as “positive” by the financial strength index while almost one quarter of buildings are characterized as “vulnerable”. The majority (78%) of non-profit housing buildings have only one mortgage but 4% have two or more mortgages. Fourteen percent do not have any mortgage at all. Approximately half (52%) of the non-profit housing buildings are on land owned by the non-profit society itself, while smaller proportions of the buildings are on land owned by the province (29%) and municipalities (11%). Average building value is over $2 million. The overall assets recorded to date value nearly $2.5 billion although they represent only approximately three quarters of the completed surveys. Annual per unit reserve fund allocations differ greatly across buildings and frequently fluctuate across years for individual buildings. When compared against a rule of thumb for reserve funding adequacy proposed through CHRA research, only 3% of buildings fail the test, however,
4/59
available benchmarks are specific to the Ontario context and so it is difficult to make concrete inferences applicable to B.C. Of the four characteristics examined, the one most strongly related to financial strength is portfolio size. Buildings operated by societies with larger portfolios are most likely to be characterized as ‘positive’ (47%) compared with buildings operated by both medium (44%) and small societies (18%). The evident strength of buildings within large and medium sized portfolios reflects the fact that more of these buildings have both capital plans and replacement reserve investment strategies in place. In addition, 78% of buildings managed by large societies cover their expenses with their subsidy and rental income compared with 75% of buildings managed by medium sized societies and 66% of buildings managed by small societies. Some less pronounced differences are evident among other groupings of buildings. Urban buildings are more likely than rural buildings to be characterized as ‘positive’ using the financial strength index largely because fewer rural buildings (27%) have a capital plan compared with their urban counterparts (56%). Fewer of the older federally administered programs can be characterized as ‘positive’ compared with buildings operated within newer bilateral or provincially administered programs. Differences among society segments as defined by the BCNPHA framework provide further evidence as to the strength of buildings within larger portfolios; large societies with housing as their primary mandate are one of two segments most likely to be characterized as ‘positive’. The segment that groups societies offering health or supportive services to tenants who are most at risk is the other segment faring well according to the financial strength index, possibly because this segment has been a recent priority in terms of provincial funding and programming. The study demonstrates that significant opportunities are emerging for the non-profit housing sector in B.C. as operating agreements expire but that collaboration among all levels of government and non-profits will ensure that these opportunities are capitalized. Concerted efforts are needed to improve some indicators and to develop a long-term comprehensive asset management strategy that will facilitate decision-making throughout the sector. The proportion of buildings with a capital plan in place is particularly low. BCNPHA will need to support societies through capacity building in financial planning with a particular focus on novel service delivery support in the development of capital plans and asset strategies to rural areas. Rural areas may face unique challenges to financial planning because of generally weaker market conditions, socio-economic differences of the resident demographic and challenges to accessing resources and forming partnerships because of relative isolation. To encourage more societies to engage in financial planning, the province may find mutual advantages to structuring policy so as to allow increased autonomy in terms of financial planning for non-profits, particularly those already demonstrating significant capacities. Rethinking some existing provincial policies may help to create greater impetus for societies to engage in long-term financial planning. For instance, a current policy that creates a threshold for replacement reserve funds prevents non-profits from carrying surpluses and may deter societies from not only seeking optimal efficiencies but also planning for contingencies and inevitable repair costs associated with aging stock that fall outside of replacement reserve fund criteria. Revised policies could encourage
5/59
non-profits to consider long-term comprehensive strategies including end-of-building-life decisions. The significant assets held within the sector are a valuable public investment that must be protected. Moreover, current assets may be leveraged for further development of affordable housing stock. The provincial government would therefore benefit from assessing government-owned land for its redevelopment potential and from collaborating with non-profits to devise strategies of how best to leverage existing assets. Similarly, BCNPHA would offer a valuable service in providing technical support and research to non-profits in analyzing opportunities for redevelopment and in facilitating partnerships between the non-profit, public and private sectors to this end. Without restrictions prescribed by operating agreements, non-profit societies may be able to find internal subsidies within their portfolios to protect existing numbers of subsidized units. Their ability to do so will depend not only on external market conditions but also the building condition and the availability of replacement reserve funds for capital repair as only well maintained buildings will be likely to attract a proportion of tenants paying low end of market rent. Although replacement reserve funds as currently defined appear to fare well when compared with conservative Ontario benchmarks, information on building conditions in the B.C. sector is currently insufficient to make concrete inferences from the replacement reserve fund data and more research is needed. The fact that many societies allocate funds to their replacement reserve inconsistently between years suggests that replacement reserves may be given secondary priority to short-term financial considerations and that their adequacy may be threatened because societies are operating within tight margins. Moreover, major inevitable repairs associated with aging buildings are not included within criteria for replacement reserve funds and instead are funded within annual provincial budgets and occasionally through second mortgages and extended operating agreements where available funds do not suffice. The small proportion of buildings with two or more mortgages (4%) may therefore grow in light of this policy. A comprehensive asset management plan incorporating a framework that characterizes the objective repair condition of non-profit housing and that forms a model through which strategic decisions about deferred investments and redevelopment opportunities can be made is urgently needed. Government and BCNPHA should collaborate to develop such a framework. Given that portfolio size is clearly the greatest predictor of financial strength, BCNPHA should support initiatives that seek to maximize the economies of scale within societies. A decision-making framework would facilitate non-profits in identifying opportunities for partnerships and mergers and ensuring that all alternatives are explored. The province should collaborate with BCNPHA to streamline administrative processes when mergers and other partnerships between societies are found to be appropriate. Further research should continue to collect and disseminate information about non-profit’s financial management and viability and to monitor progress to improving indicators over time.
6/59
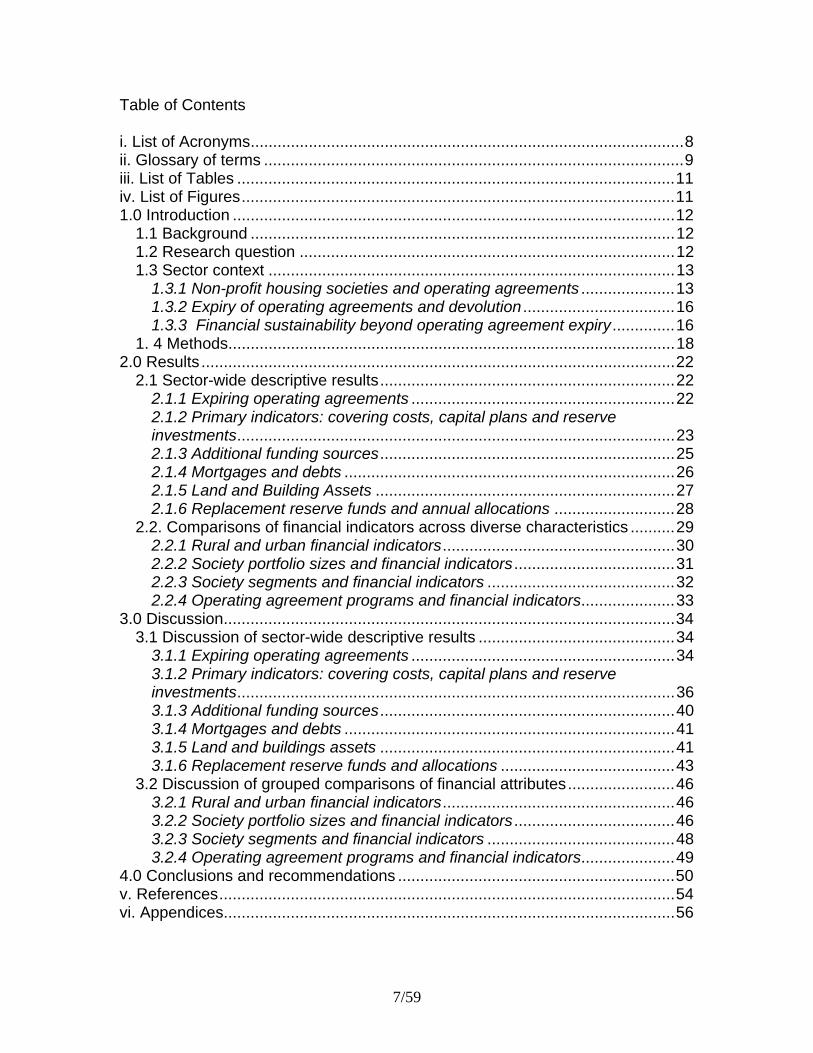
Table of Contents i. List of Acronyms.................................................................................................8 ii. Glossary of terms ..............................................................................................9 iii. List of Tables ..................................................................................................11 iv. List of Figures.................................................................................................11 1.0 Introduction ...................................................................................................12
1.1 Background ...............................................................................................12 1.2 Research question ....................................................................................12 1.3 Sector context ...........................................................................................13
1.3.1 Non-profit housing societies and operating agreements .....................13 1.3.2 Expiry of operating agreements and devolution ..................................16 1.3.3 Financial sustainability beyond operating agreement expiry..............16
1. 4 Methods....................................................................................................18 2.0 Results ..........................................................................................................22
2.1 Sector-wide descriptive results..................................................................22 2.1.1 Expiring operating agreements ...........................................................22 2.1.2 Primary indicators: covering costs, capital plans and reserve investments..................................................................................................23 2.1.3 Additional funding sources..................................................................25 2.1.4 Mortgages and debts ..........................................................................26 2.1.5 Land and Building Assets ...................................................................27 2.1.6 Replacement reserve funds and annual allocations ...........................28
2.2. Comparisons of financial indicators across diverse characteristics ..........29 2.2.1 Rural and urban financial indicators....................................................30 2.2.2 Society portfolio sizes and financial indicators ....................................31 2.2.3 Society segments and financial indicators ..........................................32 2.2.4 Operating agreement programs and financial indicators.....................33
3.0 Discussion.....................................................................................................34 3.1 Discussion of sector-wide descriptive results ............................................34
3.1.1 Expiring operating agreements ...........................................................34 3.1.2 Primary indicators: covering costs, capital plans and reserve investments..................................................................................................36 3.1.3 Additional funding sources..................................................................40 3.1.4 Mortgages and debts ..........................................................................41 3.1.5 Land and buildings assets ..................................................................41 3.1.6 Replacement reserve funds and allocations .......................................43
3.2 Discussion of grouped comparisons of financial attributes........................46 3.2.1 Rural and urban financial indicators....................................................46 3.2.2 Society portfolio sizes and financial indicators ....................................46 3.2.3 Society segments and financial indicators ..........................................48 3.2.4 Operating agreement programs and financial indicators.....................49
4.0 Conclusions and recommendations ..............................................................50 v. References......................................................................................................54 vi. Appendices.....................................................................................................56
7/59
i. List of Acronyms
BCA Building Condition Assessment
BCNPHA British Columbia Non-Profit Housing Association
CHRA Canadian Housing Renewal Association
CMHC Canadian Mortgage and Housing Corporation
CNIT Core Need Income Threshold
CPI Community Partnership Initiative
ILBC Independent Living British Columbia
FCI Facility Condition Index
LEMR Low End of Market Rent
MEIA Ministry of Employment and Income Assistance
MHSD Ministry of Housing and Social Development
OHCS Office of Housing and Construction Standards
PHI Provincial Homelessness Initiative
PHP Provincial Housing Program (formerly Homes BC)
PRAP Provincial Rental Assistance Program
RGI Rent Geared to Income
SAFER Shelter Aid For Elderly Residents
SHSC Social Housing Services Corporation
TCHC Toronto Community Housing Corporation
8/59
ii. Glossary of terms
Capital plan A financial tool used to project the timing and costs of building repair items. The capital plan does not include operating and maintenance costs such as cleaning, landscaping and utility payments but includes costs associated with inevitable aging and wear and tear to the building itself. Common items, for example, include interior and exterior painting and appliance replacement. The capital plan is also commonly referred to as the replacement reserve schedule. It does not include major structural building repairs such as those associated with obsolescence, deficiencies, premature failure and functional upgrades; these fall within a category of repairs known as modernization and improvement projects. A capital plan uses projected costs and estimated item life years to predict the magnitude and frequency of expenses. Capital repair Refers to the state of building condition at a given time or the act of maintaining adequate building condition. Facilities Condition Index (FCI) A framework used to gauge and plan for capital repair. The FCI is equal to the cost of repair divided by the cost of replacement for a given building where the cost of repair is determined by a detailed building condition assessment. A very low FCI (0-5%) would indicate a building that is in excellent repair, likely newly built or refurbished. Low end of market rent (LEMR) Buildings operated by non-profit entities may, according to their management and/or the agreement within which they operate, include a proportion of units for which rents are less subsidized or not subsidized at all. Instead of using a formula calculating the rent to be paid as a percentage of a tenant’s income, LEMR units have rent set at the lower end of private market rates. As such, these units generally provide a source of rental income that meets or exceeds its economic rent (the rent needed to meet operating costs). LEMR units can therefore be used as internal subsidies — rent accrued from these units can defray the costs of other more deeply subsidized units. Rent geared to income (RGI) Commonly, tenants living in subsidized housing pay rent as a percentage of their gross household income, that is, they pay rent geared to income. Common RGI formulas are based on 25% or 30% of income. RGI units are generally deeply targeted — the unit is intended for those most in financial need and the subsidy may be significant.
9/59
Post operating agreement viability Buildings that are able to cover their operating costs with their rental and other income once they no longer receive public subsidies (and presumably once they no longer have mortgage payments) are said to be viable post operating agreement expiry. Replacement reserve fund Money set aside by a building’s administration, usually as an annual per unit calculation, to cover projected capital repair costs. The fund will fluctuate according to the age of the building as younger buildings may be in the stage of accumulating funds whereas older buildings may be depleting funds at a rate exceeding accumulation because money is being used for repair items. Replacement reserve fund investment strategy Replacement reserve funds may be invested to maximize rates of return. A society may have a short, medium or long-term strategy in place or any mix of the three.
10/59
iii. List of Tables Table 1
Characteristics of operating agreements through which B.C. societies manage publicly funded non-profit housing stock………. 14
Table 2 Frequency and percentage of buildings that cover their costs with income and subsidy…………………………………………………… 23
Table 3
Frequency and percentage of buildings with a capital plan………. 23
Table 4 Frequency and percentage of buildings with a replacement reserve fund investment strategy…………………………………….
23
Table 5 Additional funding sources……………………………………………. 25
Table 6 Number of mortgages…………………………………………………. 26
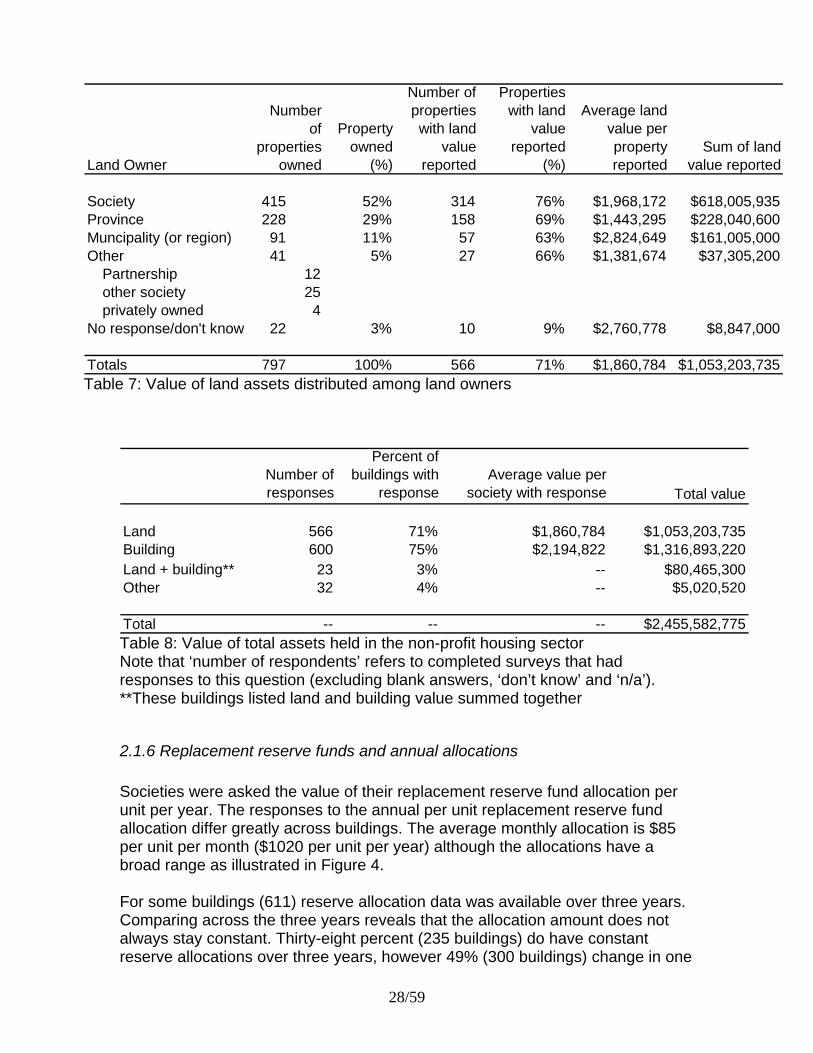
Table 7 Value of land assets distributed among land owners……………… 27
Table 8 Value of total assets held in the non-profit housing sector………... 27
iv. List of Figures Figure 1
Withdrawal of federal subsidies to B.C. non-profit housing stock….
15
Figure 2 Rate of operating agreement expiry for buildings used in this analysis………………………………………………………………….. 22
Figure 3
The Financial Strength Index: incorporating three financial strength and vulnerability indicators………………………. 24
Figure 4 Distribution of replacement reserve fund allocations per unit per year………………………………………………………………………. 28
Figure 5 Financial indicators compared across urban and rural societies…. 29
Figure 6 Financial indicators comparing buildings operated by societies with small, medium and large portfolios……………………………... 30
Figure 7 Financial indicators compared across society segments………….. 31
Figure 8 Financial indicators compared across groups of operating agreement programs…………………………………………………... 33
11/59
1.0 Introduction
1.1 Background Non-profit housing societies in British Columbia offer nearly 50,000 units of affordable, non-market housing to people in need. The B.C. Non-Profit Housing Association (BCNPHA) is a provincial umbrella organization providing leadership, support, education, services, and advocacy to the non-profit housing sector. Through the BCNPHA Asset Analysis Project1, the BCNPHA Research Department has created the most comprehensive database in the province of non-profit housing providers and the buildings they operate. The topics covered in the database reflect the breadth and depth of the information needed to plan for the long-term financial, social, and environmental sustainability of the sector. The database has been compiled based primarily on information obtained from an extensive survey distributed to all non-profit housing societies in B.C. in January 2008. Additional data was obtained from an operational database from B.C. Housing and the City of Vancouver’s non-market housing inventory. The data collected serves to establish a baseline understanding of the diverse characterizations of the non-profit housing sector and to create a basis of common understanding through the non-profit, public and private sectors that will help to inform future research, policies, programming and partnerships. This report, ‘The financial state of British Columbia’s non-profit housing stock: current and emerging opportunities,’ has been funded in partnership with the Provincial Government’s Ministry of Housing and Social Development through a student internship supported by MITACS ACCELERATE and supervised by the BCNPHA Research Department and the School of Community and Regional Planning at the University of British Columbia.
1.2 Research question This report seeks to use data from the BCNPHA Asset Analysis project to answer the question: What is the financial state of B.C.’s non-profit housing sector and what does the current situation imply in terms of the opportunities and challenges that will emerge for the sector as operating agreements expire? The question is posed intending to address multiple objectives:
1 The Asset Analysis database compiles information on long-term, affordable housing operated by non-profit societies. It does not include co-op housing, temporary housing such as emergency shelters or transition houses, rent supplements administered by non-profit societies used on the private market, or housing stock directly managed by B.C. Housing. These exclusions represent an additional 35,000 units of housing. The BCNPHA Asset Analysis Project was funded by the Real Estate Foundation of B.C., the Vancity Community Foundation, and the Heart and Stroke Foundation of B.C. & Yukon.
12/59
Illustrate quantitatively and discuss the non-profit housing project
characteristics that will support building viability post-operating agreement expiry and those that may signal impending challenges;
Explore how emerging challenges and opportunities can best be anticipated and managed;
Inform emerging provincial government policy; and, Provide an overview of the financial status of the sector to facilitate
non-profit housing societies and B.C. Non-Profit Housing Association to set and address strategic priorities.
1.3 Sector context
1.3.1 Non-profit housing societies and operating agreements Non-profit housing societies build and manage long-term, affordable shelter for those unable to find housing on the private market. Non-profit housing societies connect vulnerable persons such as low-income families; seniors; people at-risk of homelessness; and people with complex health needs such as disabilities, addictions, or mental illnesses with suitable housing and essential health and social services. The sector is diverse and non-profit societies differ from one another in many respects. Geographically, societies located in rural areas may face different challenges than their urban counterparts because urban markets are likely to be stronger and because rural areas may be more isolated in terms of access to human resources, training, networking and pooling resources. The size of societies also differs vastly across the sector and may have financial implications because larger portfolios might allow for internal subsidies and may create economies of scale in terms of capital replacement costs and human resources. Societies are also unique in terms of their mandate, where some focus specifically on housing provision while others consider supportive services or health to be their priority. Finally, societies differ in terms of the population they seek to serve, with some targeting seniors, families, singles, hard-to-house and those in need of health supports. Public funds for affordable housing are distributed either through grants or on-going subsidies within the terms established in an operating agreement between B.C. Housing and a non-profit society. It is the non-profit society that is responsible for the on-going management of the housing units with annual reports submitted to B.C. Housing illustrating that the terms agreed to in the operating agreement are being respected. B.C. Housing has about 7500-8000 units of direct-managed stock but is also the major funder for non-profit housing. Operating agreements are the mechanism by which B.C. Housing financially
13/59
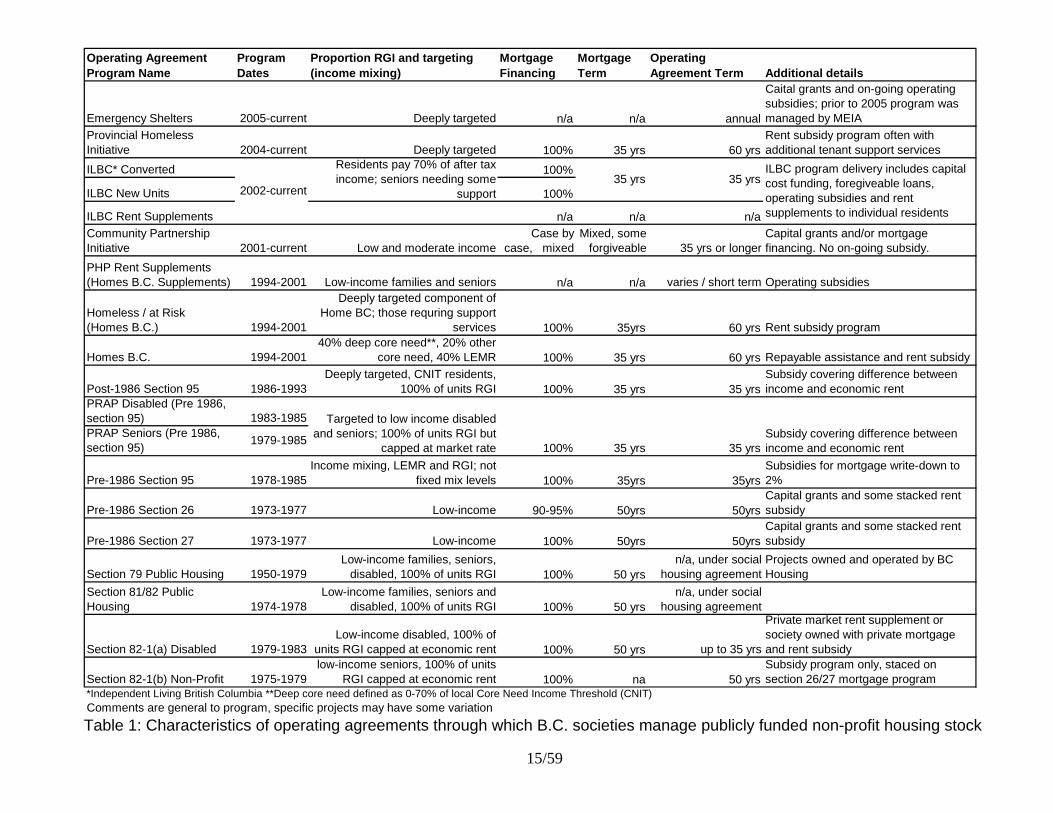
supports non-profit housing societies. About 90% of the 50,000 units of non-profit housing are covered under current operating agreements with B.C. Housing2. The specific terms outlined in an operating agreement reflect the overarching policy that was in place at the time that the agreement was signed and so differ in various aspects. There are 18 distinct types of operating agreements. Some were intended to foster a social mix within a building with a specified percentage of lower income tenants as well as some tenants paying market rates — called low-end of market rents (LEMR). Other programs are said to be ‘deeply targeted,’ intending to serve only those most in need and so requiring a higher proportion of tenants to pay rent according to a percentage of their gross household income (GHI). This is called rent geared to income (RGI) and rates have generally been specified at 25-30% of GHI.3 Agreements vary by term though in most cases the operating term equals the mortgage amortization period4. This is typically 35 years for newer programs and 50 years previously. Depending on the program, operating agreements can also guarantee a percentage of or the entire mortgage and provide a one-time capital grant and/or on-going subsidies to operating expenses. Table 1 displays the specific characteristics of the many operating agreements through which B.C. non-profit housing societies manage publicly funded housing stock. Often, a non-profit housing society operates under several contracts from different government ministries. This is particularly frequent if the society’s mandate includes health or support services in addition to housing provision.
2 BCNPHA Research Department, 2008. Those buildings not managed within an operating agreement may have been established without public funds or may have previously had an operating agreement which has since expired. 3 Some mix specifications are more complex and formula for rent calculations can vary. Another common specification used, for instance, is core need income threshold (CNIT). Core Need Income Thresholds represent the income required to pay the average market rent for an appropriate sized unit in the private market. Some tenant target specifications require that tenants’ GHI be less than a specific percentage or within a target range of local CNIT. 4 Exceptions to this rule are the provincially administered B.C. Homes and Homeless At Risk programs as these two programs operate with a 60 year agreement but the mortgage amortizes in 35 years.
14/59
Operating Agreement Program Name
Program Dates
Proportion RGI and targeting (income mixing)
Mortgage Financing
Mortgage Term
Operating Agreement Term Additional details
Emergency Shelters 2005-current Deeply targeted n/a n/a annual
Caital grants and on-going operating subsidies; prior to 2005 program was managed by MEIA
Provincial Homeless Initiative 2004-current Deeply targeted 100% 35 yrs 60 yrs
Rent subsidy program often with additional tenant support services
ILBC* Converted 100%
ILBC New Units 100%
ILBC Rent Supplements n/a n/a n/a
Community Partnership Initiative 2001-current Low and moderate income
Case by case, mixed
Mixed, some forgiveable 35 yrs or longer
Capital grants and/or mortgage financing. No on-going subsidy.
PHP Rent Supplements (Homes B.C. Supplements) 1994-2001 Low-income families and seniors n/a n/a varies / short term Operating subsidies
Homeless / at Risk (Homes B.C.) 1994-2001
Deeply targeted component of Home BC; those requring support
services 100% 35yrs 60 yrs Rent subsidy program
Homes B.C. 1994-200140% deep core need**, 20% other
core need, 40% LEMR 100% 35 yrs 60 yrs Repayable assistance and rent subsidy
Post-1986 Section 95 1986-1993Deeply targeted, CNIT residents,
100% of units RGI 100% 35 yrs 35 yrsSubsidy covering difference between income and economic rent
1983-1985PRAP Seniors (Pre 1986, section 95)
Pre-1986 Section 95 1978-1985Income mixing, LEMR and RGI; not-
fixed mix levels 100% 35yrs 35yrsSubsidies for mortgage write-down to 2%
Pre-1986 Section 26 1973-1977 Low-income 90-95% 50yrs 50yrsCapital grants and some stacked rent subsidy
Pre-1986 Section 27 1973-1977 Low-income 100% 50yrs 50yrsCapital grants and some stacked rent subsidy
Section 79 Public Housing 1950-1979Low-income families, seniors,
disabled, 100% of units RGI 100% 50 yrsn/a, under social
housing agreementProjects owned and operated by BC Housing
Section 81/82 Public Housing 1974-1978
Low-income families, seniors and disabled, 100% of units RGI 100% 50 yrs
n/a, under social housing agreement
Section 82-1(a) Disabled 1979-1983Low-income disabled, 100% of
units RGI capped at economic rent 100% 50 yrs up to 35 yrs
Private market rent supplement or society owned with private mortgage and rent subsidy
Section 82-1(b) Non-Profit 1975-1979low-income seniors, 100% of units
RGI capped at economic rent 100% na 50 yrsSubsidy program only, staced on section 26/27 mortgage program
*Independent Living British Columbia **Deep core need defined as 0-70% of local Core Need Income Threshold (CNIT)Comments are general to program, specific projects may have some variation
35 yrs
35 yrs
ILBC program delivery includes capital cost funding, foregiveable loans, operating subsidies and rent supplements to individual residents
Subsidy covering difference between income and economic rent
2002-current
Residents pay 70% of after tax income; seniors needing some
support
1979-1985
35 yrs
PRAP Disabled (Pre 1986, section 95) Targeted to low income disabled
and seniors; 100% of units RGI but capped at market rate 100% 35 yrs
Table 1: Characteristics of operating agreements through which B.C. societies manage publicly funded non-profit housing stock
15/59
16/59
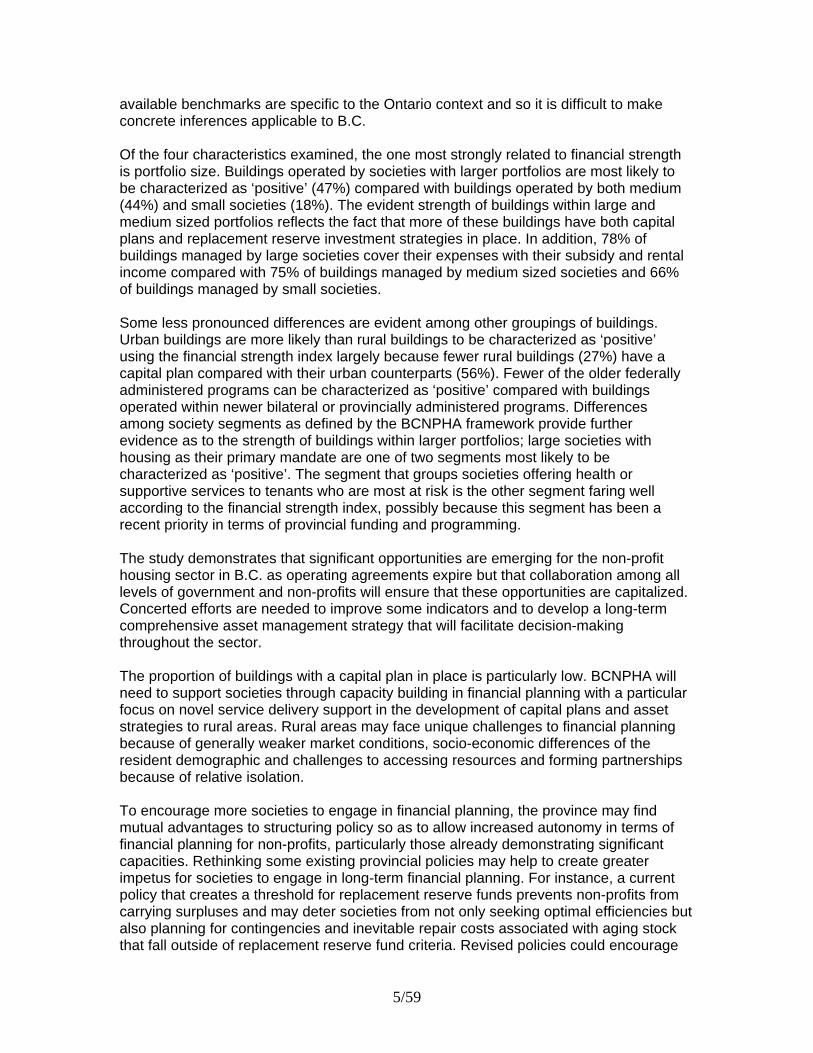
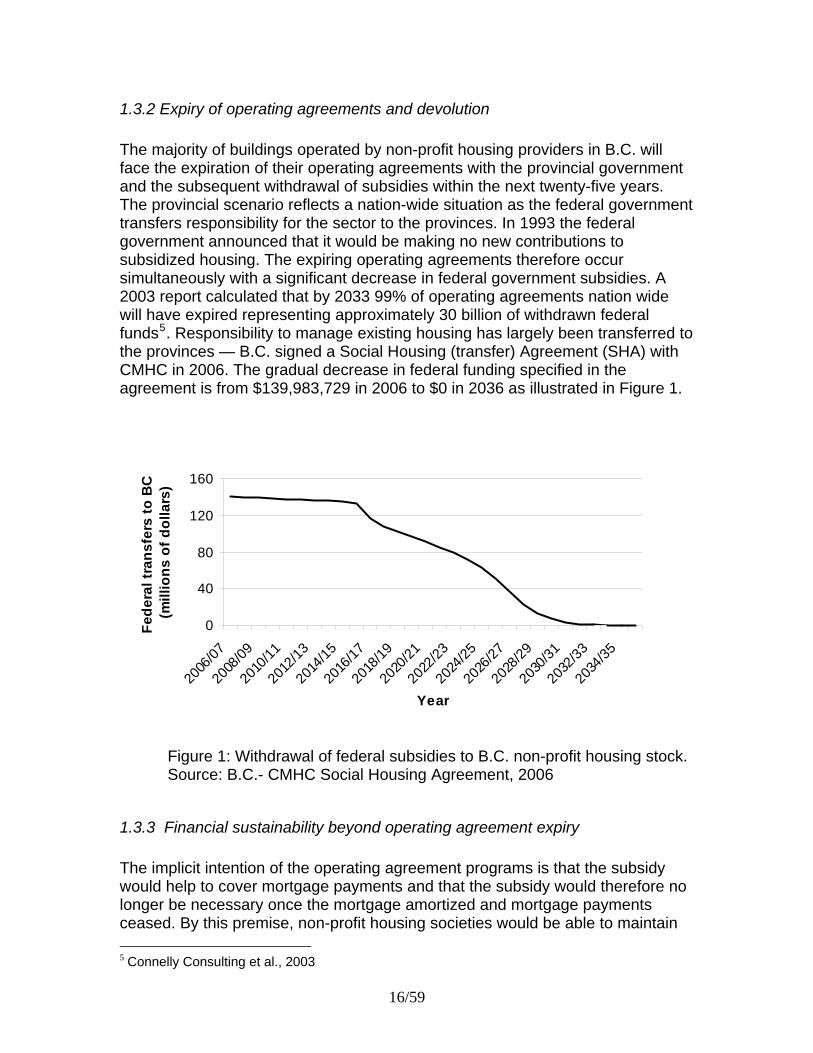
1.3.2 Expiry of operating agreements and devolution The majority of buildings operated by non-profit housing providers in B.C. will face the expiration of their operating agreements with the provincial government and the subsequent withdrawal of subsidies within the next twenty-five years. The provincial scenario reflects a nation-wide situation as the federal government transfers responsibility for the sector to the provinces. In 1993 the federal government announced that it would be making no new contributions to subsidized housing. The expiring operating agreements therefore occur simultaneously with a significant decrease in federal government subsidies. A 2003 report calculated that by 2033 99% of operating agreements nation wide will have expired representing approximately 30 billion of withdrawn federal funds5. Responsibility to manage existing housing has largely been transferred to the provinces — B.C. signed a Social Housing (transfer) Agreement (SHA) with CMHC in 2006. The gradual decrease in federal funding specified in the agreement is from $139,983,729 in 2006 to $0 in 2036 as illustrated in Figure 1.
0
40
80
120
160
2006
/07
2008
/09
2010
/11
2012
/13
2014
/15
2016
/17
2018
/19
2020
/21
2022
/23
20
Year
Fe
de
ral
tra
ns
fers
to
BC
(m
illi
on
s o
f d
oll
ars
)
24/2
5
2026
/27
2028
/29
2030
/31
2032
/33
2034
/35
Figure 1: Withdrawal of federal subsidies to B.C. non-profit housing stock. Source: B.C.- CMHC Social Housing Agreement, 2006
1.3.3 Financial sustainability beyond operating agreement expiry The implicit intention of the operating agreement programs is that the subsidy would help to cover mortgage payments and that the subsidy would therefore no longer be necessary once the mortgage amortized and mortgage payments ceased. By this premise, non-profit housing societies would be able to maintain
5 Connelly Consulting et al., 2003
the stock of affordable housing beyond operating agreement expiry solely with income generated through rents6. In practice, this intention has been realised in some but not all cases. At a national level, research has begun to explore the financial viability of the sector. The Canadian Housing Renewal Association (CHRA) commissioned studies investigating the implications of expiring operating agreements and specific indicators that suggest potential risk. In one study, Pomeroy and his colleagues7 examined a cross-section of twenty housing projects and concluded that more deeply targeted projects (with more RGI units and fewer LEMR units) are more likely to be at risk because they do not have excess funds from market rents to use as internal subsidies. Additional indicators of vulnerability identified in the report include a lease payment due on the land after operating agreement expiry and difficulty filling LEMR units in locations with weak markets. This report also emphasized the importance of healthy capital reserves and monthly allocations. Capital reserves are funds kept in savings (usually planned as a fixed dollar amount per unit per year) for on-going building repair costs. Within its operating agreement, a society is required to allocate funds annually to a reserve fund, which is used to pay for relatively predictable, recurring costs such as indoor and outdoor painting, carpet replacement, boiler replacement and so forth. The reserve fund does not include one-time significant expenditures such as elevator replacement and building envelope repair. If a society encounters the need for one of these larger items it is expected to negotiate with B.C. Housing for funds held within a pooled fund called the Modernization and Improvement fund8. The fund may fluctuate annually with provincial budgets and when exhausted, B.C. Housing has instead negotiated with societies to remortgage the building and to extend the term of the operating agreement9. The question of what is a healthy reserve fund does not have a simple answer. B.C. Housing ensures that societies are not saving too much money (which might imply that rents are higher than need be) but are saving enough to meet expected expenditures through a threshold calculation. Given a list of expected expenditures and approximate frequencies of expenses, B.C. Housing calculated that the total reserve fund would always fluctuate within a range that is equal to between two times and ten times an average annual per unit provision. At last publication this provision was $60 per unit per month for seniors’ developments and $72 per unit per month for families and special needs10. If a society’s total
6 Pomeroy et al., 2006 7 Ibid. 8 B.C. Housing Management Corporation, 2001, 2002 9 Personal communication with Jim Crisp, Senior Manager, Program Analysis, B.C. Housing, 2008 10 B.C. Housing Management Corporation, 2001 and Personal communication with Jim Crisp, Senior Manager, Program Analysis, B.C. Housing, 2008. B.C. Housing’s 2001 “Housing Provider Kit: Financial Management” specifies this average figure as an annual per unit allocation but it is in fact monthly.
17/59
reserve fund falls below or above this threshold, it will be a signal for B.C. Housing to investigate the associated finances. If, after closer analysis, the fund does indeed appear to be depleted, B.C. Housing may recommend steps to replenish the fund such as increases in rents. If the fund is found to be too high, the money will be reallocated to a pooled modernization and improvement fund managed by B.C. Housing. As an exception, Homes B.C. programming holds societies responsible for both shortfalls and surpluses in their budget. Using available engineering reports that examined reserve funding adequacy in Ontario and that were available at the time of writing, Pomeroy and colleagues created a benchmark ‘healthy’ project in which $450 dollars per unit per year is allocated to a reserve fund. Given expectant costs, using a three percent interest rate and assuming no withdrawals for the first 10 years, this ideal and fictitious project could then tolerate a withdrawal of $750 per unit per year until the year of operating agreement expiry at which point its reserves would have been depleted to zero. On-going maintenance costs would then be covered through rental income. Later studies commissioned by the Social Housing Services Corporation (SHSC) investigated 40% of the Ontario stock to estimate that $1225 was needed to be allocated per unit annually to cover expected capital repair costs. This estimate took into account Ontario specific details including compensating for past insufficient allocations such as those caused by a contributions moratorium from 1992 to 1997. Subsequent provincial top-up allocations partially, but not entirely, compensated for losses caused by the moratorium11. Due to the moratorium and the overall older stock of non-profit housing in Ontario, it is not clear how these findings would apply in other jurisdictions and contexts such as British Columbia. Pomeroy and others have encouraged provinces to undertake more in depth quantitative analyses of the financial status of their non-profit housing stock, particularly in the face of expiring operating agreements12. Such an analysis in B.C. has not yet been done.
1. 4 Methods The data used in this report reflects BCNPHA Asset Analysis survey responses current as of May 1, 2009. The database remains dynamic as non-profit profiles change and as additional societies continue to submit responses. As of May 1, 2009, of 1220 buildings managed by 431 non-profit societies throughout the province13, 279 societies representing 797 buildings had submitted a survey, representing a building response rate of 65%. Surveys were completed in one of three formats: paper, electronic (pdf) or on-line (using Survey Monkey.com). Surveys were distributed to all non-profit housing providers in the province.
11 SHSC, 2004 12 Pomeroy et al., 2006; Connelly Consulting et al., 2003 13 A building is defined as a stand-alone structure or a series of connected structures on one property.
18/59
For 611 buildings, the survey data on replacement reserves has been validated using 2007 data from B.C. Housing. Among those buildings where validation was not possible, outliers were omitted. Information on land ownership was also expanded for some buildings where responses had been blank by accessing the B.C. Land Registry. Analyses in this report are at the building level unless otherwise specified. The issue of expiring operating agreement is first explored by graphing the rate and proportion of agreements expiring over time. A broad analysis is then conducted using the indicators that are most strongly indicative of a building’s financial status: if it is covering its operating costs with subsidy and income; if it has a capital plan in place and if it has an investment strategy for its replacement reserve fund14. These three attributes are quantified individually and then used in concert to create a ‘financial strength index’ that provides a crude indicator of financial strength or vulnerability. Any building not covering its operating costs with subsidy is immediately categorized as vulnerable because it is potentially operating within a deficit. A building covering costs but engaging in no form of financial planning (neither a capital plan nor a replacement reserve investment strategy) is also considered vulnerable since the lack of financial planning may suggest a lack of resilience and/or capacity in the face of impending changes in the sector. Those covering costs with subsidy and income but having only one of a capital plan or replacement reserve investment strategy in place are categorized as ‘medium’ as they have some positive indicators but demonstrate opportunities for improvement. In contrast, buildings satisfying each of these three indicators: covering its costs with subsidy and income, having a capital plan and a replacement reserve fund investment strategy are categorized as having ‘positive’ financial attributes. In a second level of analysis, additional indicators are then quantified to contribute to a more detailed understanding of B.C. non-profit housing societies’ financial portfolios. These indicators include:
Characterization of additional funding sources Number of mortgages against a building Other debts against a building Value of land, building and other assets Adequacy of replacement reserve funds and annual allocations.
The last indicator — adequacy of replacement reserve funds and annual allocations — is calculated using the total replacement reserve and the annual contribution at the time of the survey and by using the benchmark of the fictitious
14 Note that survey respondents were asked if they had a short, medium or long term investment strategy for their replacement reserves but these responses were dichotomized as either having or not having a strategy.
19/59
‘ideal’ project created by the consulting team that worked on the 2006 report commissioned by CHRA. The ‘ideal’ project is assumed to have allocated $450 per unit per year since its inception, to make no withdrawals in the first 10 years and to then be able to withdrawal at a rate of $750 per unit per year from year 11 until operating agreement expiry. Borrowing these assumptions for our own analysis, if at this withdrawal rate, building reserve funds are calculated to be negative at the time of operating agreement expiry, the reserve funds are marked as ‘inadequate’ whereas positive funds are characterized as ‘adequate.’ For several societies, B.C. Housing data was available for the 2006, 2007 and 2008 fiscal year. Changes to allocations between years for each society were recorded so as to investigate to what extent allocations remain constant or change over time. Following analysis of each of these indicators at a building scale throughout the province, important indicators (if the building is covering costs, has a capital plan, has a replacement reserve fund investment strategy, number of mortgages, additional funding sources and overall score on the financial strength index) are then examined across diverse categories of non-profit housing societies and/or buildings. These are:
Urban versus rural buildings. Rural buildings are defined as those with a ‘0’ as the second digit in the postal code.
Society portfolio size The distribution of portfolio sizes is graphed and natural groupings in the data are used to determine small (1-50 units), medium (51-300 units) and large (301 and more units) portfolios. The variable ‘units’ was chosen as the most appropriate indicator of overall size as buildings can differ vastly in terms of size and occupancy.
Member segmentation BCNPHA developed a sophisticated method of characterizing its diverse members so as to better understand the needs of distinct groupings of non-profit housing societies15. The segmentation takes into consideration the primary mandate of a society, the target tenant demographic group and the society’s size in terms of number of buildings. Six segments have been identified in the preliminary member segmentation framework. The segmentation has been extended to all survey respondents (members and non-members) for the purpose of this analysis. The segments are:
o Segment #1: societies that have housing as their primary mandate, serve primarily families and independent seniors and have fewer than six buildings in their portfolio.
o Segment #2: societies that have housing as their primary mandate, serve primarily tenants other than families and independent
15 BCNPHA Research Department
20/59
seniors and have fewer than six buildings in their portfolio. The sample size of segment 2 is small and so results pertaining to this segment should be interpreted with caution (n=18).
o Segment #3: societies that have housing as their primary mandate and have six or more buildings in their portfolio irrespective of tenants served.
o Segment #4: societies that have health/supportive services as their primary mandate irrespective of tenants served.
o Segment #5: societies that have supportive housing as their primary mandate and serve frail seniors.
o Segment #6: societies that have emergency/transition housing as their primary mandate or have supportive housing as their primary mandate and serve tenants other than frail seniors.
Operating Agreements
Non-profit societies manage housing under 18 distinct types of operating agreements that are summarized in Table 1. For purposes of analysis, these agreements were grouped into three chronological categories, which also loosely reflect the administrative lead.
o Programs initiated at or before 1978 were primarily federally led with the provinces taking a bilateral role. These include Pre-1986 Sections 95, 26 and 27, Section 79, Section 82-1(a) Disabled and Section 82-1(b) Non-Profit; these have been grouped as older, federally administered programs.
o Later, CMHC relinquished its role in the development of new social housing programs to the provinces acting as a partial funder16. These programs are categorized as ‘middle bilateral, provincially administered’ and include Provincial Rental Assistance Program (PRAP) Disabled, PRAP Seniors and Post-1986 Section 95.
o Newer programs follow the 1993 federal announcement of no new funding for affordable housing, when provinces were ultimately left to lead their own program development. These are categorized as ‘newer provincial programs’ and include Homes B.C., Homeless / at Risk (HAR), Provincial Health Partnership (PHP), Community Partnership Initiative, Independent Living B.C., Provincial Homeless Initiative and Emergency Shelters.
These three categories are hypothesized to show differences among them because they capture both chronological differences in terms of capital construction and maintenance costs and policy changes over time including changes in tenant targeting.
The indicators are tested for independence within these groupings with a Pearson’s chi-squared test of independence at a 99% confidence using SPSS software. Where group sizes were too small, Fisher’s exact test was used. The researcher also engaged in discussions with key experts in the sector from B.C. Housing, CMHC, private research consultants and non-profit housing societies.
16 Connelly Consulting et al., 2003; Findlay et al., 2007
21/59
Their input provided context for the financial data analysis and aided in exploring the implications of the preliminary results.
2.0 Results The survey asked several questions that function as proxy indicators of the financial strengths of affordable housing societies. These have been grouped here as: Primary broad indicators:
1. If a society is covering its operating costs with income and subsidy; 2. If a society has a capital plan in place; 3. If a society has a replacement reserve fund investment strategy.
Other indicators:
4. additional funding sources; 5. mortgages and debts; 6. land ownership; 7. value of land, building and other assets; 8. and replacement reserve fund amounts and annual per unit allocations.
The results are first displayed as sector-wide results and then grouped by: urban/rural, society portfolio size, segment and operating agreement.
2.1 Sector-wide descriptive results
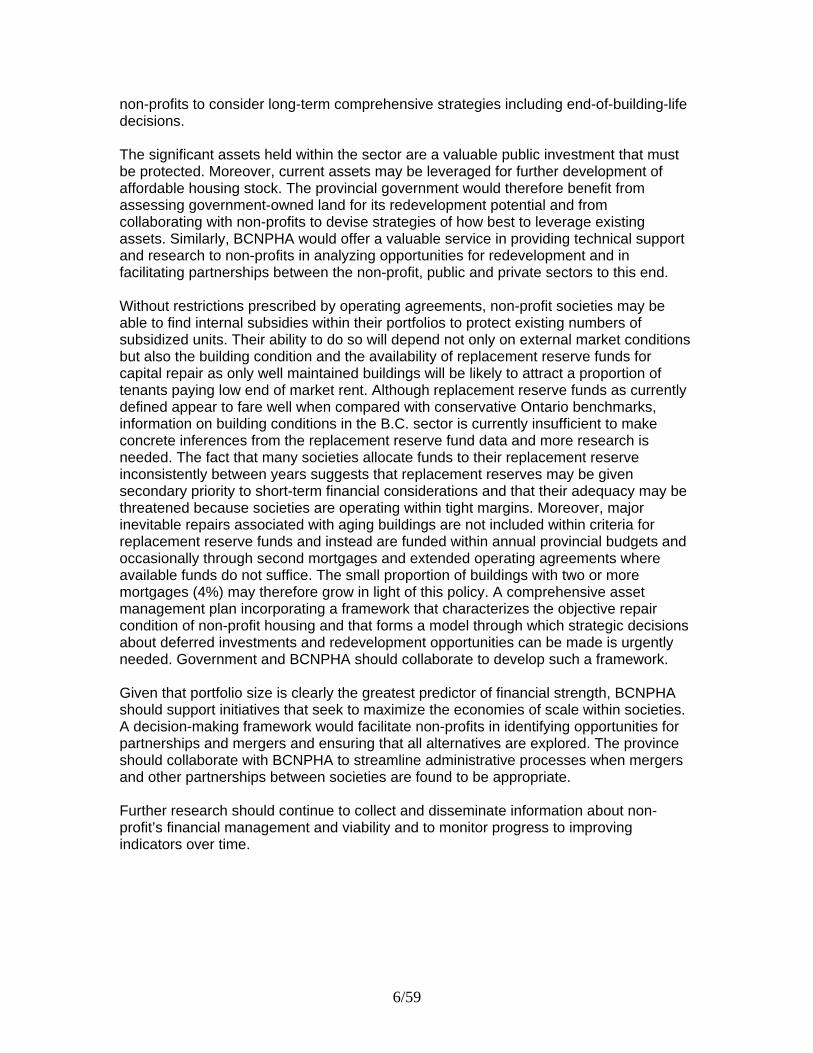
2.1.1 Expiring operating agreements Sixty-three percent of current agreements will have expired within the next 25 years (2009-2034). The rate of operating agreement expiry at the building level is illustrated in Figure 2. Of the 797 buildings included in this analysis the vast majority (78%) are managed with an operating agreement that will expire by 2069.
22/59
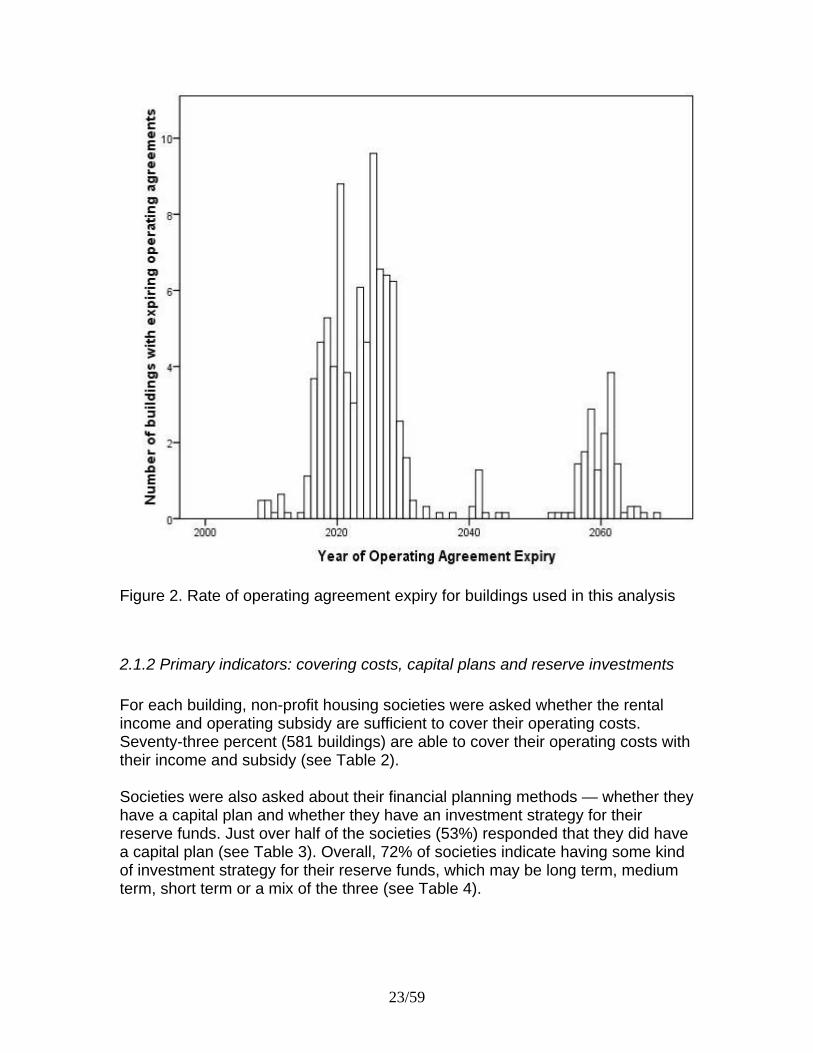
Figure 2. Rate of operating agreement expiry for buildings used in this analysis
2.1.2 Primary indicators: covering costs, capital plans and reserve investments For each building, non-profit housing societies were asked whether the rental income and operating subsidy are sufficient to cover their operating costs. Seventy-three percent (581 buildings) are able to cover their operating costs with their income and subsidy (see Table 2). Societies were also asked about their financial planning methods — whether they have a capital plan and whether they have an investment strategy for their reserve funds. Just over half of the societies (53%) responded that they did have a capital plan (see Table 3). Overall, 72% of societies indicate having some kind of investment strategy for their reserve funds, which may be long term, medium term, short term or a mix of the three (see Table 4).
23/59
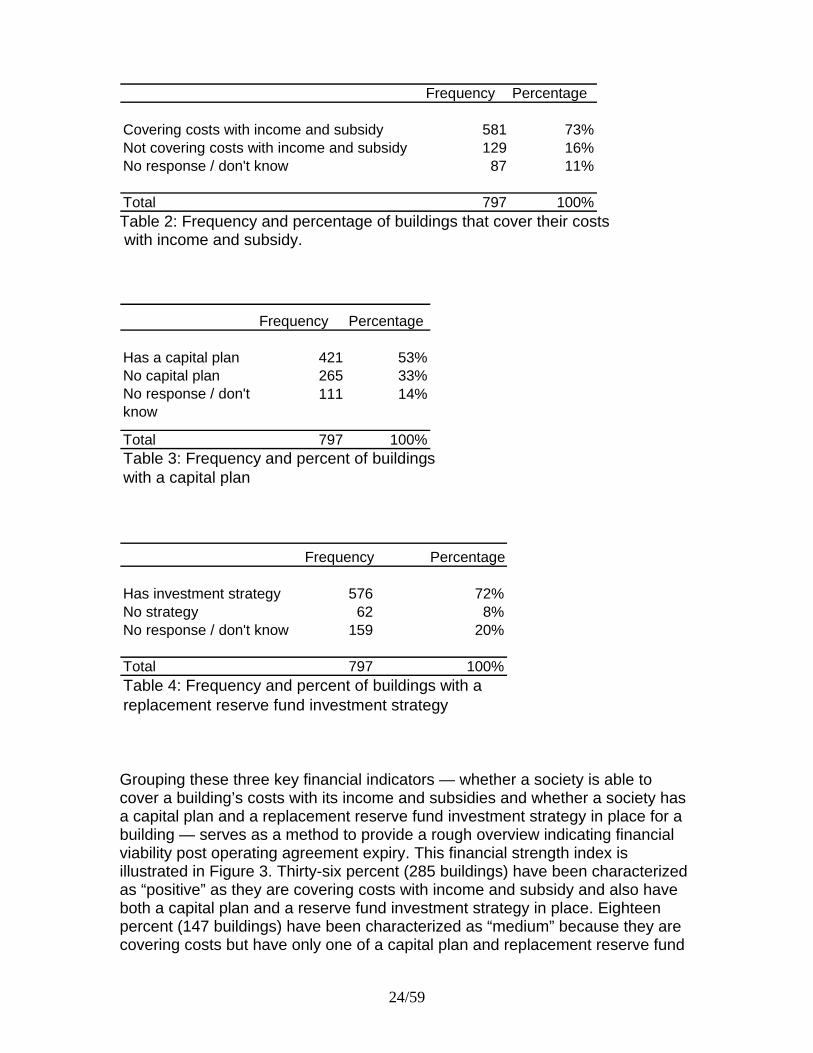
Frequency Percentage
Covering costs with income and subsidy 581 73%Not covering costs with income and subsidy 129 16%No response / don't know 87 11%
Total 797 100% Table 2: Frequency and percentage of buildings that cover their costs with income and subsidy.
Frequency Percentage
Has a capital plan 421 53%No capital plan 265 33%No response / don't know
111 14%
Total 797 100%Table 3: Frequency and percent of buildingswith a capital plan
rouping these three key financial indicators — whether a society is able to has
terized
e
Frequency Percentage
Has investment strategy 576 72%No strategy 62 8%No response / don't know 159 20%
Total 797 100%Table 4: Frequency and percent of buildings with a replacement reserve fund investment strategy
Gcover a building’s costs with its income and subsidies and whether a society a capital plan and a replacement reserve fund investment strategy in place for a building — serves as a method to provide a rough overview indicating financial viability post operating agreement expiry. This financial strength index is illustrated in Figure 3. Thirty-six percent (285 buildings) have been characas “positive” as they are covering costs with income and subsidy and also have both a capital plan and a reserve fund investment strategy in place. Eighteen percent (147 buildings) have been characterized as “medium” because they arcovering costs but have only one of a capital plan and replacement reserve fund
24/59
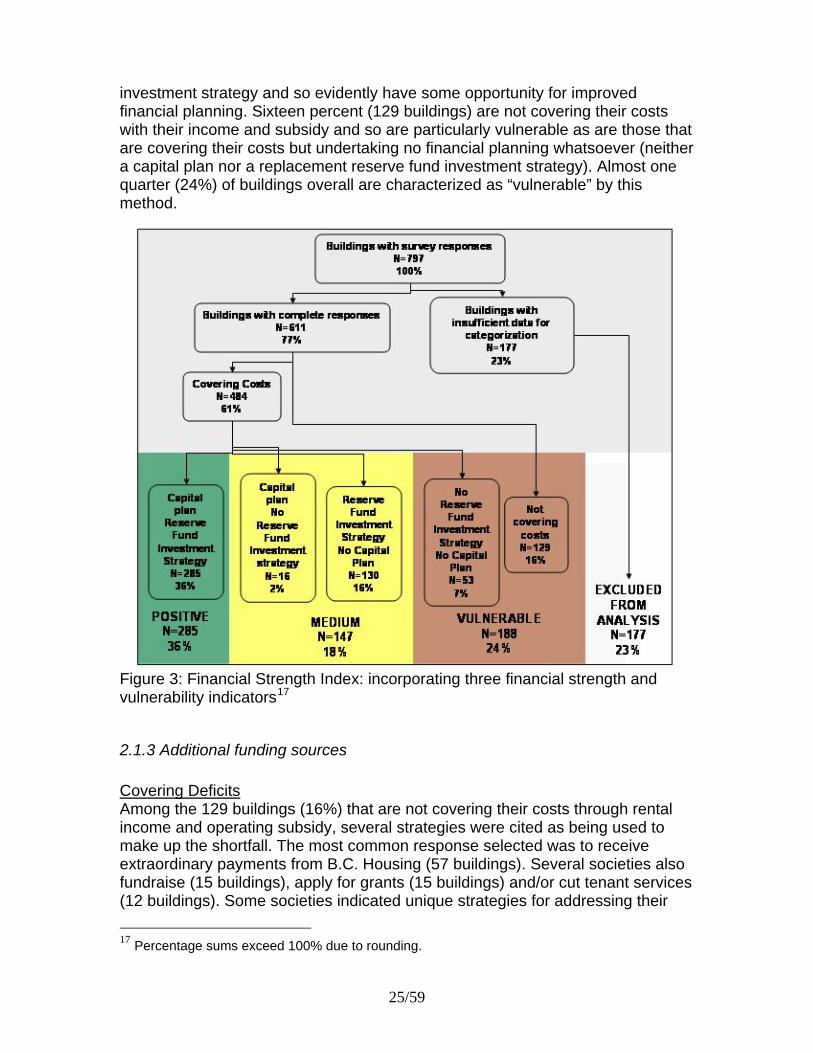
investment strategy and so evidently have some opportunity for improved financial planning. Sixteen percent (129 buildings) are not covering their cowith their income and subsidy and so are particularly vulnerable as are those thare covering their costs but undertaking no financial planning whatsoever (neither a capital plan nor a replacement reserve fund investment strategy). Almost one quarter (24%) of buildings overall are characterized as “vulnerable” by this method.
sts at
Figure 3: Financial Strength Index: incorporating three financial strength and
2.1.3 Additional funding sources
overing Deficits
vulnerability indicators17
C
ildings (16%) that are not covering their costs through rental
lso
Among the 129 buincome and operating subsidy, several strategies were cited as being used to make up the shortfall. The most common response selected was to receive extraordinary payments from B.C. Housing (57 buildings). Several societies afundraise (15 buildings), apply for grants (15 buildings) and/or cut tenant services(12 buildings). Some societies indicated unique strategies for addressing their
17 Percentage sums exceed 100% due to rounding.
25/59
shortfall that were not listed as options on the survey. Several indicated that thewere eroding investments, reserve funds or surpluses from previous years. Others wrote that they had approached B.C. Housing for additional support bwere awaiting a response. Some indicated innovative approaches such as camera and cell tower rental revenues or using internal subsidies from surpaccrued from other buildings operated by the same non-profit. Finally, several buildings receive additional funding from other ministries or public entities.
y
ut
lus
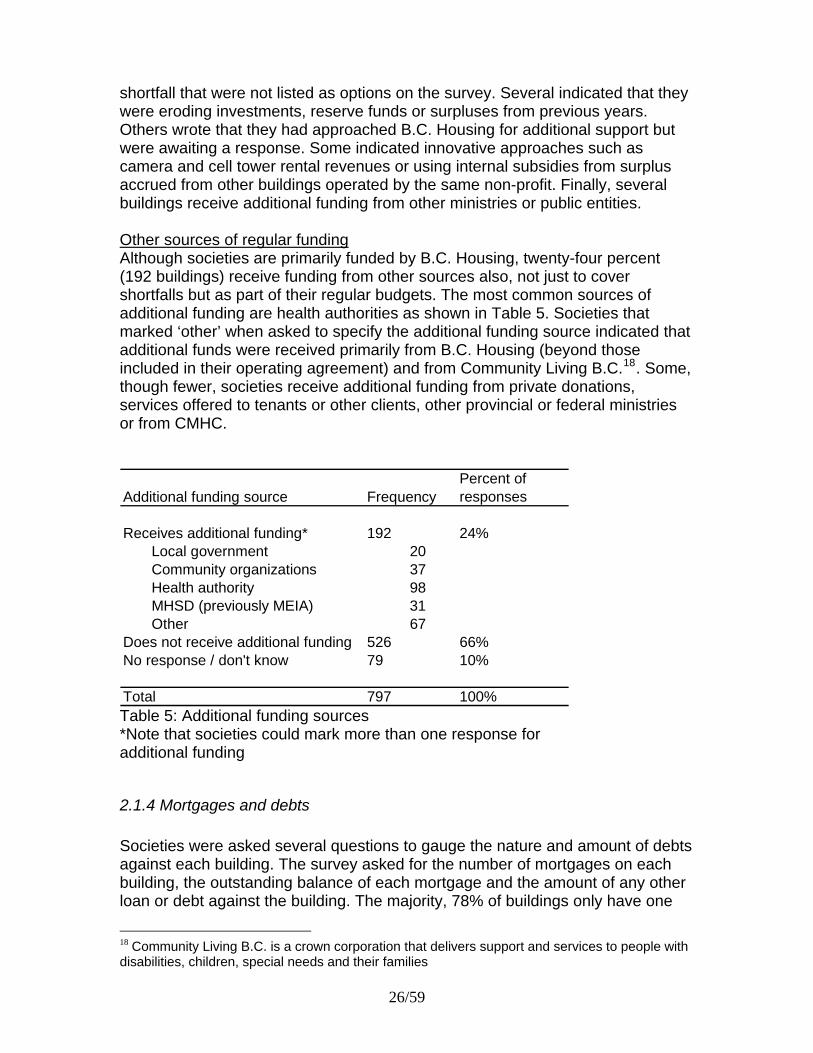
ther sources of regular fundingO nded by B.C. Housing, twenty-four percent
of
that
ome,
tries
Although societies are primarily fu(192 buildings) receive funding from other sources also, not just to cover shortfalls but as part of their regular budgets. The most common sources additional funding are health authorities as shown in Table 5. Societies that marked ‘other’ when asked to specify the additional funding source indicatedadditional funds were received primarily from B.C. Housing (beyond those included in their operating agreement) and from Community Living B.C.18. Sthough fewer, societies receive additional funding from private donations, services offered to tenants or other clients, other provincial or federal minisor from CMHC.
Percent of responses
Receives additional funding* 192 24%Local government 20Community organizations 37Health authority 98MHSD (previously MEIA) 31Other 67
Does not receive additional funding 526 66%No response / don't know 79 10%
Total 797 100%
FrequencyAdditional funding source
Table 5: Additional funding sources
than one response for
2.1.4 Mortgages and debts
ocieties were asked several questions to gauge the nature and amount of debts
r
*Note that societies could mark moreadditional funding
Sagainst each building. The survey asked for the number of mortgages on each building, the outstanding balance of each mortgage and the amount of any otheloan or debt against the building. The majority, 78% of buildings only have one
18 Community Living B.C. is a crown corporation that delivers support and services to people with disabilities, children, special needs and their families
26/59
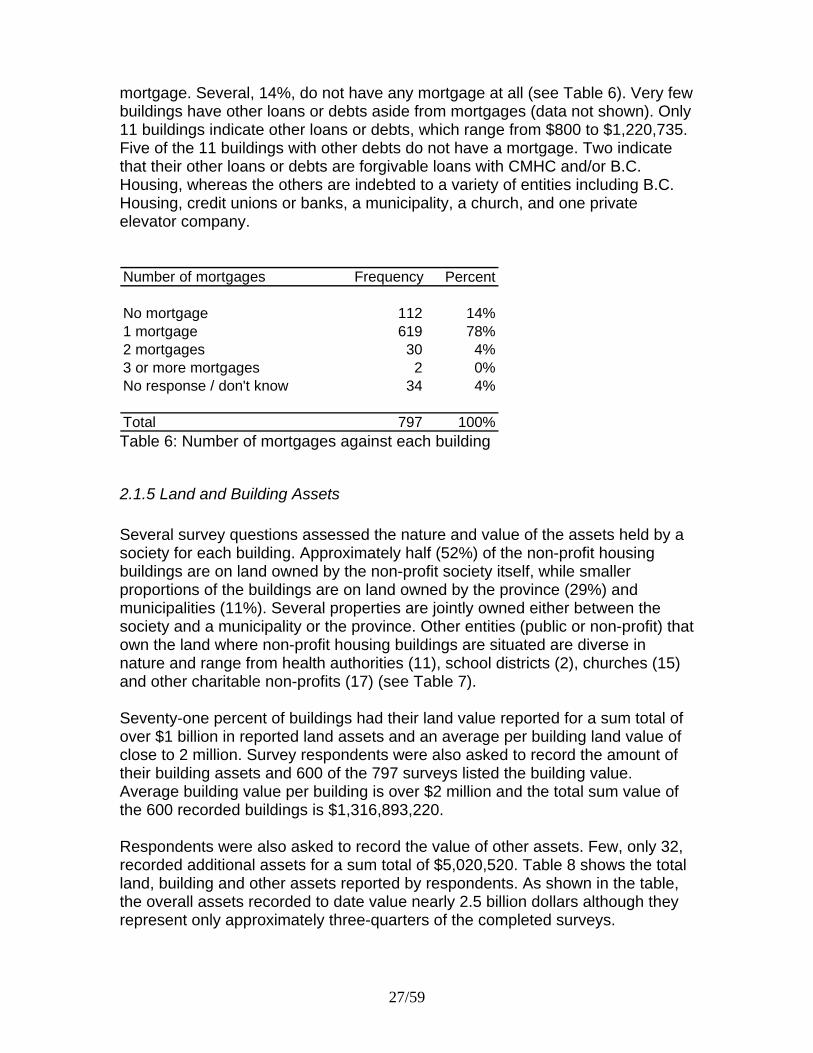
mortgage. Several, 14%, do not have any mortgage at all (see Table 6). Very febuildings have other loans or debts aside from mortgages (data not shown). Only 11 buildings indicate other loans or debts, which range from $800 to $1,220,735. Five of the 11 buildings with other debts do not have a mortgage. Two indicate that their other loans or debts are forgivable loans with CMHC and/or B.C. Housing, whereas the others are indebted to a variety of entities including BHousing, credit unions or banks, a municipality, a church, and one private elevator company.
w
.C.
Number of mortgages Frequency Percent
No mortgage 112 14%1 mortgage 619 78%2 mortgages 30 4%3 or more mortgages 2 0%No response / don't know 34 4%
Total 797 100% Table 6: Number of mortgages against each building
2.1.5 Land and Building Assets
everal survey questions assessed the nature and value of the assets held by a
e
hat
(15)
eventy-one percent of buildings had their land value reported for a sum total of
lue of
espondents were also asked to record the value of other assets. Few, only 32,
Ssociety for each building. Approximately half (52%) of the non-profit housing buildings are on land owned by the non-profit society itself, while smaller proportions of the buildings are on land owned by the province (29%) andmunicipalities (11%). Several properties are jointly owned either between thsociety and a municipality or the province. Other entities (public or non-profit) town the land where non-profit housing buildings are situated are diverse in nature and range from health authorities (11), school districts (2), churches and other charitable non-profits (17) (see Table 7). Sover $1 billion in reported land assets and an average per building land value of close to 2 million. Survey respondents were also asked to record the amount of their building assets and 600 of the 797 surveys listed the building value. Average building value per building is over $2 million and the total sum vathe 600 recorded buildings is $1,316,893,220. Rrecorded additional assets for a sum total of $5,020,520. Table 8 shows the total land, building and other assets reported by respondents. As shown in the table, the overall assets recorded to date value nearly 2.5 billion dollars although they represent only approximately three-quarters of the completed surveys.
27/59
Property owned
(%)
Number of properties with land
value reported
Properties with land
value reported
(%)
Average land value per property reported
Sum of land value reported
415 52% 314 76% $1,968,172 $618,005,935228 29% 158 69% $1,443,295 $228,040,60091 11% 57 63% $2,824,649 $161,005,00041 5% 27 66% $1,381,674 $37,305,200
12254
22 3% 10 9% $2,760,778 $8,847,000
Totals 797 100% 566 71% $1,860,784 $1,053,203,735
Muncipality (or region)Other
Land Owner
Number of
properties owned
SocietyProvince
No response/don't know
Partnershipother societyprivately owned
Table 7: Value of land assets distributed among land owners
Number of responses
Percent of buildings with
responseAverage value per
society with response Total value
Land 566 71% $1,860,784 $1,053,203,735Building 600 75% $2,194,822 $1,316,893,220Land + building** 23 3% -- $80,465,300Other 32 4% -- $5,020,520
Total -- -- -- $2,455,582,775Table 8: Value of total assets held in the non-profit housing sector Note that ‘number of respondents’ refers to completed surveys that had responses to this question (excluding blank answers, ‘don’t know’ and ‘n/a’). **These buildings listed land and building value summed together
2.1.6 Replacement reserve funds and annual allocations Societies were asked the value of their replacement reserve fund allocation per unit per year. The responses to the annual per unit replacement reserve fund allocation differ greatly across buildings. The average monthly allocation is $85 per unit per month ($1020 per unit per year) although the allocations have a broad range as illustrated in Figure 4. For some buildings (611) reserve allocation data was available over three years. Comparing across the three years reveals that the allocation amount does not always stay constant. Thirty-eight percent (235 buildings) do have constant reserve allocations over three years, however 49% (300 buildings) change in one
28/59
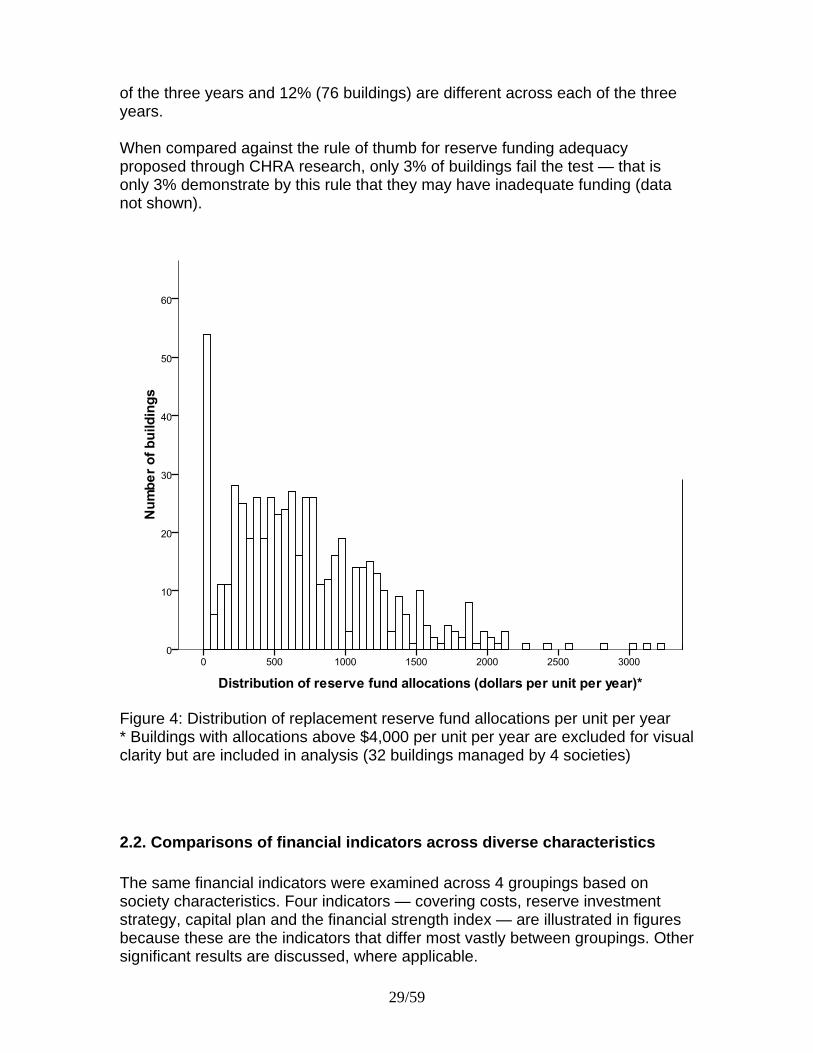
of the three years and 12% (76 buildings) are different across each of the three years. When compared against the rule of thumb for reserve funding adequacy proposed through CHRA research, only 3% of buildings fail the test — that is only 3% demonstrate by this rule that they may have inadequate funding (data not shown).
Figure 4: Distribution of replacement reserve fund allocations per unit per year * Buildings with allocations above $4,000 per unit per year are excluded for visual clarity but are included in analysis (32 buildings managed by 4 societies)
2.2. Comparisons of financial indicators across diverse characteristics The same financial indicators were examined across 4 groupings based on society characteristics. Four indicators — covering costs, reserve investment strategy, capital plan and the financial strength index — are illustrated in figures because these are the indicators that differ most vastly between groupings. Other significant results are discussed, where applicable.
29/59
2.2.1 Rural and urban financial indicators
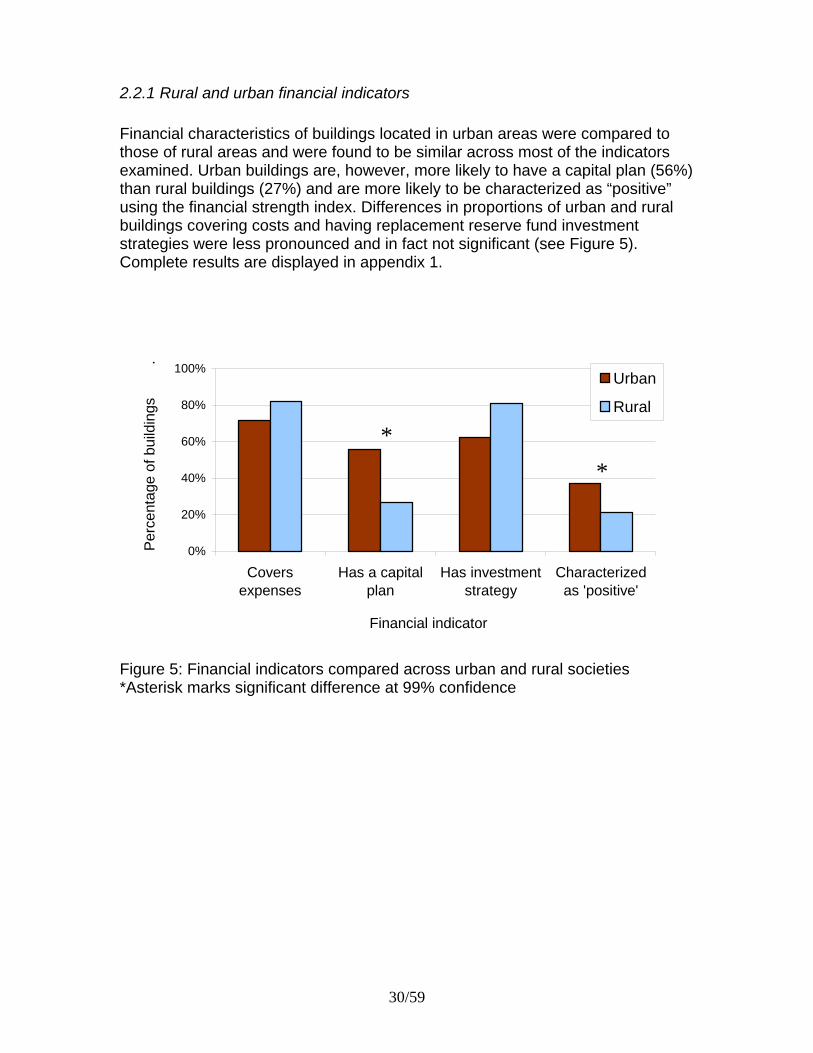
Financial characteristics of buildings located in urban areas were compared to those of rural areas and were found to be similar across most of the indicators examined. Urban buildings are, however, more likely to have a capital plan (56%) than rural buildings (27%) and are more likely to be characterized as “positive” using the financial strength index. Differences in proportions of urban and rural buildings covering costs and having replacement reserve fund investment strategies were less pronounced and in fact not significant (see Figure 5). Complete results are displayed in appendix 1.
igure 5: Financial indicators compared across urban and rural societies
0%
20%
40%
60%
80%
100%
Coversexpenses
Has a capitalplan
Has investmentstrategy
Characterizedas 'positive'
Financial indicator
Per
cent
age
of b
uild
ings
.
Urban
Rural
*
*
F*Asterisk marks significant difference at 99% confidence
30/59
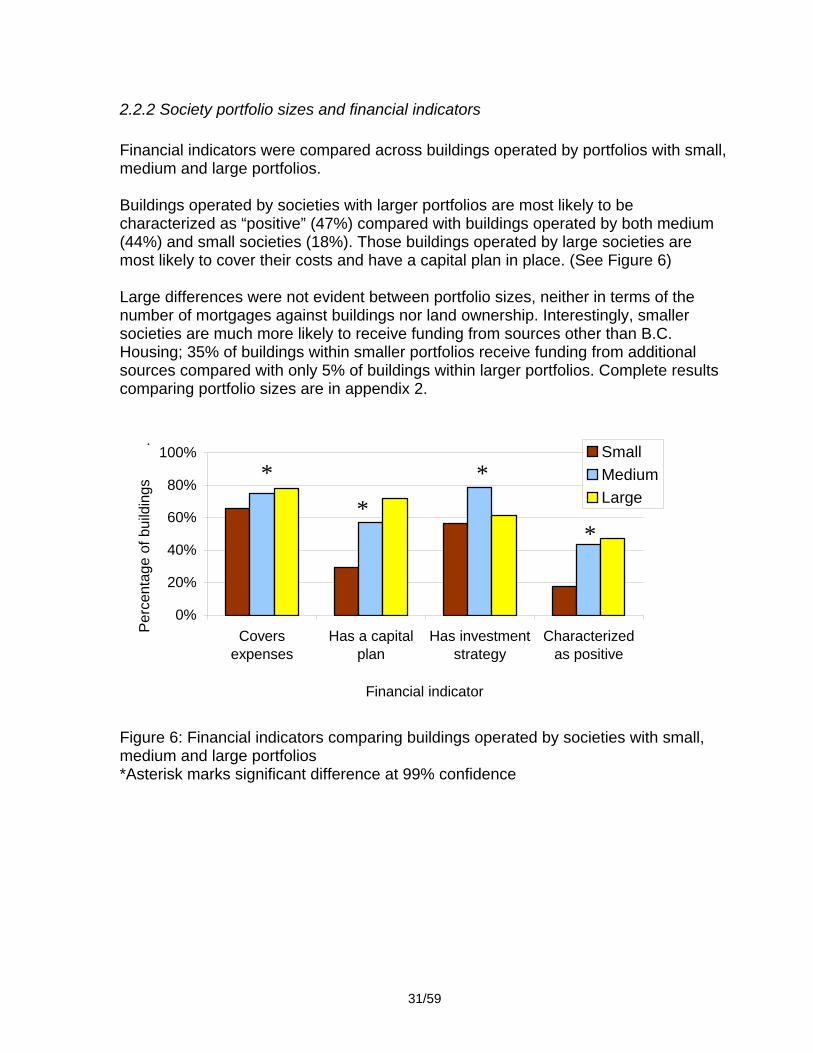
2.2.2 Society portfolio sizes and financial indicators Financial indicators were compared across buildings operated by portfolios with small, medium and large portfolios. Buildings operated by societies with larger portfolios are most likely to be characterized as “positive” (47%) compared with buildings operated by both medium (44%) and small societies (18%). Those buildings operated by large societies are most likely to cover their costs and have a capital plan in place. (See Figure 6) Large differences were not evident between portfolio sizes, neither in terms of the number of mortgages against buildings nor land ownership. Interestingly, smaller societies are much more likely to receive funding from sources other than B.C. Housing; 35% of buildings within smaller portfolios receive funding from additional sources compared with only 5% of buildings within larger portfolios. Complete results comparing portfolio sizes are in appendix 2.
31/59
igure 6: Financial indicators comparing buildings operated by societies with small,
ference at 99% confi ce
0%
20%
40%
60%
80%
100%
Coversexpenses
Has a capitalplan
Has investmentstrategy
Characterizedas positive
Financial indicator
Per
cent
age
of b
uild
ings
.
Small
Medium
Large*
*
*
*
Fmedium and large portfolios *Asterisk marks significant dif den
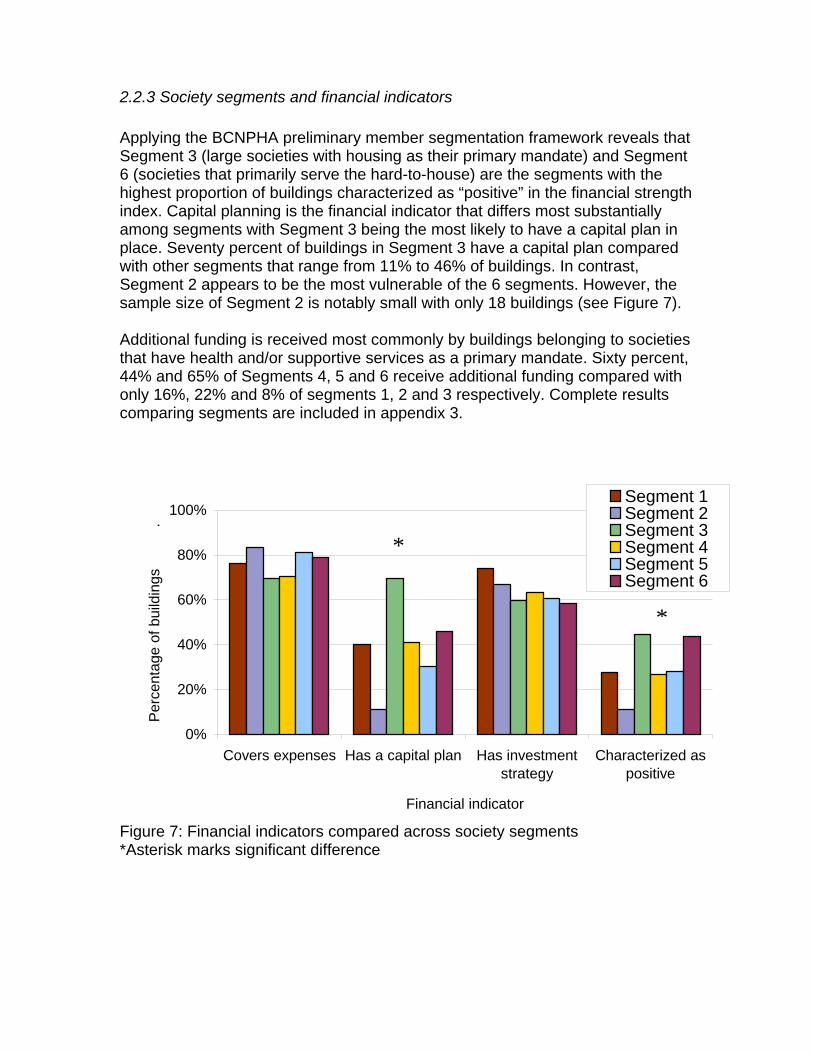
2.2.3 Society segments and financial indicators
Applying the BCNPHA preliminary member segmentation framework reveals that Segment 3 (large societies with housing as their primary mandate) and Segment 6 (societies that primarily serve the hard-to-house) are the segments with the highest proportion of buildings characterized as “positive” in the financial strength index. Capital planning is the financial indicator that differs most substantially among segments with Segment 3 being the most likely to have a capital plan in place. Seventy percent of buildings in Segment 3 have a capital plan compared with other segments that range from 11% to 46% of buildings. In contrast, Segment 2 appears to be the most vulnerable of the 6 segments. However, the sample size of Segment 2 is notably small with only 18 buildings (see Figure 7). Additional funding is received most commonly by buildings belonging to societies that have health and/or supportive services as a primary mandate. Sixty percent, 44% and 65% of Segments 4, 5 and 6 receive additional funding compared with only 16%, 22% and 8% of segments 1, 2 and 3 respectively. Complete results comparing segments are included in appendix 3.
igure 7: Financial indicators compared across society segments
0%
20%
40%
60%
80%
100%
Covers expenses Has a capital plan Has investmentstrategy
Characterized aspositive
Financial indicator
Per
cent
age
of b
uild
ings
.
Segment 1Segment 2Segment 3Segment 4Segment 5Segment 6
*
*
F*Asterisk marks significant difference
Segment Primary mandate Primary tenants served Number of buildings
1 Housing Families and independent seniors < 6 buildings
2Housing Tenants other than families and
independent seniors< 6 buildings
3 Housing Irrespective of tenants served Six or more buildings
4 Health / supportive services Irrespective of tenants served Irrespective of size
5 Supportive housing Frail seniors Irrespective of size
6Emergency / transition or su
Tenants other than frail seniors Irrespective of sizepportive housing
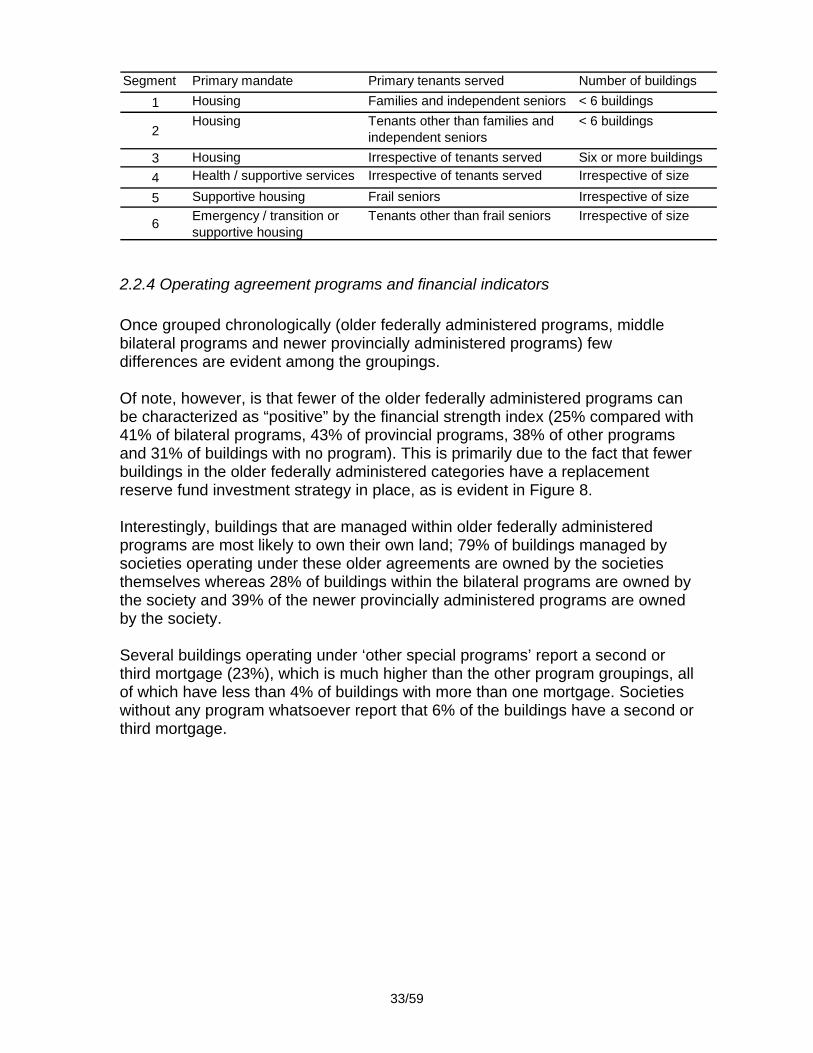
2.2.4 Operating agreement programs and financial indicators Once grouped chronologically (older federally administered programs, middle bilateral programs and newer provincially administered programs) few differences are evident among the groupings. Of note, however, is that fewer of the older federally administered programs can be characterized as “positive” by the financial strength index (25% compared with 41% of bilateral programs, 43% of provincial programs, 38% of other programs and 31% of buildings with no program). This is primarily due to the fact that fewer buildings in the older federally administered categories have a replacement reserve fund investment strategy in place, as is evident in Figure 8. Interestingly, buildings that are managed within older federally administered programs are most likely to own their own land; 79% of buildings managed by societies operating under these older agreements are owned by the societies themselves whereas 28% of buildings within the bilateral programs are owned by the society and 39% of the newer provincially administered programs are owned by the society. Several buildings operating under ‘other special programs’ report a second or third mortgage (23%), which is much higher than the other program groupings, all of which have less than 4% of buildings with more than one mortgage. Societies without any program whatsoever report that 6% of the buildings have a second or third mortgage.
33/59
0%
20%
40%
60%
80%
100%
Coversexpenses
Has a capitalplan
Has investmentstrategy
Characterizedas positive
Financial indicator
Per
cent
age
of b
uild
ings
.
Provincial prgrams (1994-current)Bilateral programs (1979-1993)Federal programs (before 1985)Other programsNo program
Figure 8: Financial indicators compared across groups of operating agreement programs *Asterisk marks significant difference
3.0 Discussion This research has examined data from the BCNPHA Asset Analysis survey in order to characterize the current financial strength of non-profit societies managing affordable housing in the province and to further determine the viability of their portfolio post-operating agreement expiry. Results have been calculated at a building scale and shown for the primary financial indicators examined. The implications of the results on building and sector-wide viability are herein discussed.
3.1 Discussion of sector-wide descriptive results
3.1.1 Expiring operating agreements This study examines financial indicators of 797 buildings comprising 27,981 units, 78% of which currently operate under operating agreements that will expire by 2069 (see Figure 2 in section 2.1.1). The study provides insight into the financial strength of the overall sector by examining an approximate 63% of the province’s stock19. In the British Columbia non-profit housing sector overall approximately 90% of 50,000 units20 will see their operating agreements expire by 2060. In order to best seize the opportunities that will continue to present
**
19 Excluding co-operative housing and emergency/transition housing 20 BCNPHA Research Department
34/59
themselves, a detailed understanding of the current portfolios is essential before moving forward. The impending expiry of the operating agreements through which non-profit housing societies manage publicly funded buildings also means the simultaneous withdrawal of committed federal funds. However, as numerous experts working in the sector have been quick to point out, the devolution of social housing to provinces is also an opportunity to explore new methods of delivery and to learn from past and existing programs to create a sector that is more specifically tailored to the British Columbia context. In spite of the insecurity that this change may incite for some and the increased responsibility borne by the province, research at the federal level has determined that “the sky is not falling” for non-profit housing societies21. The end of business-as-usual is an opportunity for innovation. While this indeed holds true in the B.C. context, the results of the analysis presented here warn against complacency. There are serious signs that the stock is not being managed as efficiently as possible and that immediate, concerted and collaborative efforts are required on the part of municipal, provincial and federal levels of government, non-profit societies and advocacy groups to ensure that the number of current housing units is maintained post-operating expiry and to take advantage of clear opportunities for expansion of the existing stock. Working toward a common understanding to create a comprehensive and strategic vision for the affordable housing sector is urgent. Sixty-three percent of the current stock in B.C. operates under agreements set to expire within the next 25 years. Nation-wide, 99% of stock is set to expire by 203322. B.C.’s percentage is smaller than the national average because B.C. is one of the few provinces (along with Ontario and Quebec) that have made significant provincial contributions to non-profit housing since the 1993 federal cap on funding. Nevertheless, the funding withdrawal has an impact on well over half of the provincial stock and thus gravely threatens the sector if on-going building viability is not ensured. Without the restrictions of the agreements, expiry may be an opportunity for housing managers to not only maintain but expand the current stock; societies will be free to leverage funds using their current assets to make significant capital repairs or to redevelop their land entirely and either protect or expand the existing number of units through partnerships with the private and public sectors. Societies will also be free to change proportions and calculations of rent geared to income (RGI) and low end of market rents (LEMR) in order to increase internal subsidies to ensure viability while still supporting deeply targeted units23. Shortfalls and surpluses may be redistributed among different buildings within a society’s portfolio, where that option exists.
21 Pomeroy et al., 2006 22 Connelly Consulting Services, 2003 23 Connelly Consulting Services, 2003 and Pomeroy et al., 2006
35/59
However, such innovation is contingent on several factors, some of which are in the control of the non-profit housing provider and some of which are based on external market conditions. Where weaker markets or inappropriate zoning render redevelopment an unlikely option, the financial strength of the existing building is particularly important as buildings in disrepair will likely encounter challenges to attracting tenants paying lower end of market rent thereby limiting opportunities for internal subsidies. 3.1.2 Primary indicators: covering costs, capital plans and reserve investments Covering costs The majority of buildings (73%) are covering their costs with their subsidy and rental income, but 16% did not cover their costs in 2007. Although in the minority, this 16% of buildings does present cause for alarm in part because the specific balance of a society’s portfolio can change from year to year. Indeed, some societies that indicated that they covered their costs in 2007 also noted that this had not been the case during the preceding year or that they anticipated a shortfall in the current fiscal year. Moreover, this figure is likely to increase when operating agreements expire and subsidies are subsequently withdrawn. Pomeroy and Connelly24 suggest that as a rule of thumb, societies’ net operating income — the amount of income remaining once subsidy and mortgage payments are removed — represents the state of the finances at operating agreement expiry25. If the subsidy is greater than the mortgage payment, then the building may be at risk post-expiry since the subsidy is evidently covering some of its operating costs (and not just the mortgage). The BCNPHA Asset Analysis survey asks if rental income and operating subsidy are covering expenses, which may be a less sensitive indicator — a project may be covering its costs with the subsidy but may be unable to do so without it (if indeed the subsidy exceeds the mortgage payments). Whether an organization covered its costs during the fiscal year prior to survey completion is a broad but sweeping indicator of its financial strength. If it is unable to do so, it is presumably operating within a very thin margin and a high degree of uncertainty and is thus in a considerably vulnerable position. It is encouraging, however, that already those societies operating with a deficit are finding innovative ways to diversify their sources of funding including fundraising, working with other entities to seek grants or on-going funding arrangements, engaging in social enterprises such as cell tower rentals and supplementing deficits through internal subsidies within their portfolio. Clearly, non-profits are demonstrating that with their significant human capital there will be many opportunities to find diverse solutions and work collaboratively with public and private sectors towards long-term solutions.
24 Ibid. 25 The removal of both mortgage payments and operating subsidy usually represents the state of the finances at operating agreement expiry because in general expiry coincides with the end of the mortgage amortization period.
36/59

Further research is needed that focuses on this proportion of buildings that are not currently covering operating expenses so as to better understand the reasons for their apparent deficit. It may be that capital needs in terms of replacements were higher than anticipated or, if a project relies on LEMR tenant rental income, that weak markets frustrated attempts to fill units at or near market rates. If funding calculations are based on RGI, then changes in tenants or their circumstances could require deeper subsidies and therefore cause additional stress to the society. Given the complex funding arrangements of some societies, particularly those offering additional supportive or health related services, the deficit may have more to do with unexpected costs associated with tenant services or maintaining feasible levels of human resources. Characterizing and quantifying the principle challenges are necessary steps in order to address them. It is possible that some may require restructuring of finances including changes in social mixes and rent calculations within a building. Interestingly, operating agreement expiry may present an opportunity to do so because a society will no longer need to work within the boundaries of prescribed mixes. However increasing the proportion of market rate units is contingent on market forces and will correlate with a decline in units available for those most in need, if it is not done simultaneously with redevelopment or expansion that otherwise increases the overall number of units available. If such changes are required, waiting until operating agreement expiry may be too late, as changes will take some time to implement and even longer for financial returns to be seen. Societies would do well to investigate sooner than later which of these opportunities may or may not apply to their specific contexts. Capital planning B.C. Housing encourages societies to prepare a capital plan estimating the amount and timing of costs associated with building repair26. However, only about half of buildings (53%) have a capital plan in place. Capital plans are a tool used by a society to forecast the timing and costs of repairs that will be needed for a given building so as to ensure that an appropriate per unit allocation is being saved in a replacement reserve fund. Without a capital plan in place, it seems unlikely that a society will be well placed to manage expenses that will inevitably arise as a building ages. With just over half of the buildings reporting a capital plan in place, there is cause for concern about the sector overall. If societies, having not planned for these expenses, are unable to meet them, buildings will increasingly operate with deficits and ultimately may be unable to maintain the current number of subsidized units. If buildings are not properly maintained as they age, they will increasingly encounter difficulty attracting tenants paying low end of market rents, potentially decreasing the opportunity for internal subsidies and thereby decreasing the proportion of deeply subsidized units that a single building can maintain. Alternatively, societies may seek additional funding from B.C. Housing representing a potentially significant pressure on public funds. The importance of 26 B.C. Housing Management Corporation, 2001
37/59
capital planning in ensuring financial viability both for an individual building and also for the sector overall can therefore not be overstated. The lack of a capital plan may imply that a society either does not have sufficient excess funds to make long term financial planning seem worthwhile (and may imply insufficient replacement reserve funds), or it may be that with human resource capacities and administrative overheads already stressed, the society has not had an opportunity to engage in such planning or does not have the capacity to do so. Some societies may not see the value in having a capital plan, either because of uncertainties involved in the process of forecasting expenses or because of specific policies that act as weak motivators. In order to keep calculations for replacement reserve funding thresholds relatively simple, B.C. Housing’s calculation model ignores both interest earned on funds in the reserve and the affects of inflation on items to be replaced.27 Nevertheless, for societies projecting capital repair costs, both rates may represent uncertainty. Capital plans are most significantly affected by projected life spans of building replacement items, estimates which can differ vastly depending on the consultant giving the estimate28. Managers may encounter insufficient motivation to engage in capital planning because there is a risk that surpluses accumulated in reserves would be redirected by B.C. Housing to a pooled Maintenance and Improvement fund, although excesses and deficits are handled on a case by case basis29. The data speaks strongly to the need for capacity building opportunities for societies. Currently BCNPHA offers societies half or full-day workshops in understanding their operating agreements and preparing budgets, marketing mixed income developments, and creating and funding replacement reserves including a customized hands-on workshop where a nearly-complete capital plan is actually prepared. Whereas these educational opportunities are currently available, the low proportion of societies with a capital plan suggests that more support for such programs may be required and that new delivery mechanisms may be necessary to ensure the programs are effective and accessible to all societies. Moreover, dialogue among non-profit societies, BCNPHA and the provincial government should explore how societies, particularly those demonstrating strong operational capacity, can be more involved in their own long-term comprehensive financial planning without risk of losing surpluses. Replacement Reserve Fund Investment Strategies The majority (72%) of non-profit housing providers in B.C. do have investment strategies for their replacement reserve funds.
27 Personal communication with Jim Crisp, Senior Manager, Program Analysis, B.C. Housing, 2008 28 SHSC, 2004 29 B.C. Housing Management Corporation, 2001 and 2002
38/59
Reasons for not having replacement reserve investment strategies may be similar to reasons for abstaining from capital planning and may include capacity and/or resource limitations. Alternatively, the building may not possess sufficient capital to invest, particularly if it is newer and has not yet built up reserves, in which case it should not yet have many capital expenses or if it is older and nearing operating agreement expiry, in which case it may have already depleted reserves by investing them in building repair. Boards may be risk averse — strategies that maximize returns also tend to increase real and /or perceived risk and board members may be liable for losses. Future research may explore these possible explanations. Once a reserve fund is accumulated through monthly allocations, housing providers are encouraged to safely invest the money to maximize interest rates. However, historically, returns have not been particularly high. In Ontario, non-profits are now required to invest in pooled funds through the Social Housing Services Corporation (CHSC) resulting in improved returns on investments30. In B.C. a trilateral agreement among BCNPHA, B.C. Housing and the Cooperative Housing Federation, B.C. was established to set the parameters for the exploration of options for voluntary pooled investments. The initial program was suspended and new options are currently being investigated to ensure that the short, medium and long-term investment needs of non-profits are being met. The initiative promises not only to provide impetus encouraging non-profits to invest their replacement reserve funds, but also to ensure that higher rates of return are being achieved sector-wide. Financial Strength Index A composite index was created to provide an overview of the three indicators previously described — if a society is covering a building’s costs with subsidy and income, if it is engaging in capital planning and if it has a replacement reserve investment strategy in place. The index provides a baseline from which to monitor improvements in financial security and planning in the sector. Only one third of the sector (36%) is characterized as “positive” (meaning that they are covering their costs and have both a capital plan and a replacement reserve investment strategy in place). Another 18% are ”medium” buildings, which are covering their costs but demonstrate opportunity for improvement as they have either a capital plan or a replacement reserve investment strategy in place, but not both. One quarter (24%) of buildings are characterized as ”vulnerable” meaning that they are not covering their costs or have neither a capital plan nor a replacement reserve investment strategy in place31.
30 SHSC, 2007a 31 An additional 23% could not be classified according to the financial strength index because they had a blank response or indicated ‘don’t know’ to at least one of the three survey questions used.
39/59
With only one third of buildings in the sector characterized as ”positive”, there is cause for concern. The index suggests that a significant amount of collaborative effort is needed to ensure optimal financial management in the sector. Improving these baseline indicators — covering costs, capital planning and replacement reserve investment strategies — still would not guarantee post-operating agreement viability but it would suggest that financial management and planning has become a priority for both the non-profit societies themselves and the public agencies that support them. The index can and should be used as a tool by which to monitor progress in the sector in terms of increasing capacity and focusing attention on financial management. The majority of those buildings considered ”vulnerable” are not covering their operating costs with income and subsidy. The remainder are covering their costs but have neither a capital plan nor an investment strategy in place. Capacity building will therefore have a role in improving the indicator provided by the financial strength index; however, additional public spending or innovative partnerships of the type described previously in this section may also be required.
3.1.3 Additional funding sources Covering deficits As previously discussed, 16% of societies are not covering their operating expenses with their subsidy and rental income. In order to make up for these shortfalls many societies are seeking additional payments from B.C. Housing called extraordinary payments; 57 buildings reported using this as a strategy. Others are seeking additional funds through grant writing (15 buildings) and fundraising (115 buildings). Fundraising and grant applications can require very large amounts of time and energy with no guaranteed result. Given that some societies even write about cutting tenant services (12 buildings) and eroding their savings (6 buildings) in order to cover their shortfall, the risk to sound financial management is evident. Funding from other agencies Almost one quarter (24%) of societies receive funding from other sources, not as deficit recovery but as part of their regular budget. Multiple funding sources may well present challenges for non-profits, however. With different reporting requirements and operating agreements for different funding sources, it is conceivable that this is an added strain for societies. This observation presents an opportunity to streamline the regulation and accounting processes among the most frequently involved agencies such as the Ministry of Housing and Social Development32 and Community Living B.C. Alternatively, it is conceivable that there is added security and flexibility for societies that receive funding from diverse sources. Further research may both explore whether societies perceive
32 This funding previously came from the Ministry of Employment and Income Assistance
40/59
this as providing stability or complicating management and also characterize specific challenges and benefits of this diversification. Interestingly, streamlining administrative processes may also have added benefit for B.C. Housing33. For example, audits are currently submitted by societies without the benefit of a consistent format. A general template used by all societies would likely make the work more efficient on both ends. Thus, it is likely that efficiencies in administration between non-profits and B.C. Housing can be explored and achieved in tandem with efficiencies between additional funding organizations.
3.1.4 Mortgages and debts The vast majority of buildings in this analysis have either one mortgage (78%) or no mortgage (14%). Only a small proportion (4%) has 2 or more mortgages; however, this may be cause for concern given that the additional mortgage(s) represent a further encumbrance to the non-profit society. Six of these buildings do not have an operating agreement, but the others are restricted by their agreements and thus would have had to seek government permission prior to putting a second mortgage on their building. Nevertheless, under exceptional circumstances, B.C. Housing has negotiated with societies on a case-by-case basis to restructure financing with second mortgages and extended operating agreements to cover major capital expenses when available government budgets have been insufficient to cover costs34. With only 4% of buildings burdened with second or third mortgages, the issue does not seem to have a major impact on the sustainability of the sector overall. However, if the need for additional funding is linked to capital repairs, then this proportion may increase as the non-profit housing stock continues to age. Additional mortgages on non-profit housing buildings must therefore be considered within a broader asset management strategy, discussed further in section 3.1.6.
3.1.5 Land and buildings assets Over half of the buildings surveyed are on land owned by the society itself (52%). The society-owned land has a summed value of over 600 million even though this total represents only three quarters (76%) of the buildings that responded to the Asset Analysis survey. Land ownership can be a significant financial strength for a non-profit housing society. A society owning its own land may find it is able
33 Personal communication with Karen Hemmingson, Research Director, B.C. Housing, 2009 34 Personal communication with Jim Crisp, Senior Manager, Program Analysis, B.C. Housing, 2008
41/59
to leverage the asset to redevelop existing housing to expand the number of units or to make significant repairs such as building envelope repairs that would ensure its longevity. This is a particularly promising opportunity where strong markets are likely to attract the necessary partners and investors and where higher density zoning has been implemented or could be negotiated with municipalities. It is not as significant an opportunity in regions with weaker markets (high rental vacancy rates) and declining populations. In contrast, a society that is leasing the land may be at risk of having to make a lease payment after its operating agreement expires, a potentially significant one-time expense that may jeopardize its financial viability. However, only 29 buildings are on land owned by an entity other than the society or a municipal, regional or provincial government. The leasing of land may therefore be a problem for them but is not widespread through the province so long as municipal and provincial governments are dedicated to maintaining current housing stock. Almost one third (29%) of the buildings are on land owned by the provincial government. Although not all societies reported their land value, just 69% of the provincially owned land within this data set has a summed value of $228 million. Already the province is recognising the potential of this land and engaging in redevelopments that may expand or at least protect the existing number of affordable housing units. One such piece of land is slated for redevelopment at Little Mountain in Vancouver. Redevelopment is, however, contingent on changing market scenarios. The Little Mountain project, for instance, is on hold during the current economic down turn. The Little Mountain example illustrates that while leveraging assets to attract private partners and revitalize or expand existing projects is a significant opportunity, it can also be a controversial initiative. Opposition of the Little Mountain redevelopment, for instance, critique the partial loss of government land that will be sold for private, at-market units. Furthermore, revitalization disrupts the existing community and can displace existing tenants during construction phases. The example shows that any redevelopment must be contingent not only on market conditions but also on carefully planned and thorough engagement processes that ensure that residents are involved in plans and that their concerns are genuinely addressed. Nonetheless it is worth looking into redevelopment potential in more detail by considering market attributes and current zoning. Where older buildings are on sites that have since been zoned for higher density, great potential exists in not only preserving but expanding the current affordable housing stock. Even with only 71% of respondents reporting their land value, the summed land asset is over $1 billion. This is a clear opportunity for financial leverage. Municipalities and regional districts are a smaller but not insignificant player with respect to land ownership. Eleven percent of non-profit housing buildings are reported to be on land owned by local governments. Given these figures, it is essential that provincial and municipal governments declare their commitment to
42/59
maintain the existing land base for affordable housing purposes and ensuring that future developments maintain if not expand the number of subsidized units. Overall, reported land buildings and other assets total almost $2.5 billion even though this figure represents an approximate three quarters of survey respondents and less than half of the sector overall. This is a huge asset created through the investment of public funds over several decades and one that clearly merits protection.
3.1.6 Replacement reserve funds and allocations Adequacy of replacement reserve allocation It is very difficult to draw conclusions from the available data about the adequacy of replacement reserves in B.C. because the work that has been published investigating replacement reserve fund adequacy is specific to Ontario. As was discussed in section 1.3.3 the Ontario context includes a moratorium on allocations in the 1990s that depleted funds and an overall older stock that requires more urgent repair. The most recent Ontario figures suggest that up to $1225 per unit per year is the average allocation needed to ensure adequate reserves for the province overall and compensate for historic underfunding. Earlier work by Pomeroy and his colleagues propose more modest projections. Using the rule of thumb proposed by Pomeroy and his colleagues, B.C. reserves fare very well, with only 3% failing this test indicating inadequate reserves. Given that Ontario projections are likely to be more severe, it is tempting to conclude that the issue of replacement reserve allocations in B.C. does not appear to be a particular challenge. However, the lack of available information in B.C. suggests that the topic merits more attention. With major and inevitable expenses of aging housing stock not covered within replacement reserve funding schemes and without sector-wide data characterizing the state of building repair, it is not clear when and to what extent aging stock will need major repairs, when it will encounter the end of its life-term and require investment for redevelopment and how much money will ultimately be required to preserve the existing number of subsidized units. Moreover, with these major repairs being paid for through fluctuating annual provincial budgets, ongoing availability of funds to meet capital repairs remains uncertain. Clearly, a sensitive and detailed assessment framework is needed to plan for building repair post-expiry and to ensure that current reserves are sufficient to cover these major and inevitable costs. Much work has been done on investigating the adequacy of replacement reserve funds and allocation amounts in Toronto, as responsibility to manage subsidized housing has been devolved to the municipalities in Ontario35. Toronto Community Housing Corporation (TCHC), the municipal corporation tasked to coordinate the management of the city’s subsidized housing stock, uses a real-
35 SHSC, 2007a and 2007b
43/59
estate-based facilities condition index (FCI) to rate the state of good repair of buildings. The FCI equals the cost of repair divided by the cost of replacemea given building where the cost of repair is determined by a detailed building condition assessment (BCA), a review of past capital investment, current wand patterns of operating maintenance costs. The FCI chosen by TCHC abenchmark from which to make investment and redevelopment decisions is a range of 10% to 20% with the goal of having a portfolio average FCI of 12%. Based on a qualitative scale of FCI ratings, 11-15% is considered ‘fair’ and 16% to 30% is considered ‘poor’. Zero to 10% encompasses the ‘good’ and ‘excellent’ ratings but these are generally nearly new or fully refurbished buildings. Rating buildings against these benchmarks, TCHC has created a framework through which to make decisions about when and where to invest funding in revitalization. Once having identified target locations for redevelopment, they also differentiate FCI targets between buildings that will see longer life spans and those targeted for redevelopment. The latter they maintain at a higher FCI index (poorer state of repair) of FCI=20%. Using the established FCI targets, TCHC can better quantify the projected investment need of capital repairs and so has determined that the annual investment required is $95 million, a $35 million annual increase from the 2008 allocation
nt for
ork s a
36. The FCI has been refined by Ameresco and is increasingly becoming a tool used for financial planning of the affordable housing sector across the board in Canada. Until B.C. has developed a similar framework of what is considered adequate repair, it is not possible to make concrete inferences from the replacement reserve data and estimate current and projected costs. Developing a similar framework will aid the province in making decisions about investments in current buildings or redevelopment as much of the stock post-expiry also nears the end of projected building life spans. As the TCHC report points out, buildings inevitably and quickly have rising FCI indexes as they age — the potential for investment is always there, the question is how much deferred investment is wise and sustainable and when further investment is no longer the best use of public funds. Consistency of replacement reserve allocations The data also indicates that a building’s reserve fund allocations tend to vary across time. This is an interesting finding given that the intent of capital plans is to project costs over the long-term and distribute them by relatively constant smaller savings in the interim. Of 611 buildings for which multiple year data was available, 38% remain constant over the three fiscal years (2006-2008). However, well over half (61%) do change in at least one of the three years. Such inconsistency brings into question to what extent the allocations are prioritized or are sacrificed to shorter term financial pressures and deficits. Alternatively, if allocations are increasing as capital repairs are undertaken and purchases are made because prices are found to be higher or lifespans shorter than projected, this raises concern that current reserves may be insufficient. In either case, the changing allocations may indicate that societies are operating within margins so tight that sound long-term planning becomes jeopardized. 36 TCHC, 2008
44/59
Scope of replacement reserve funds Larger one-time costs such as building envelope or elevator repairs are not included in capital plans and repairs covered by replacement reserve funds according to B.C. Housing and CMHC guides37. Instead, these repairs are covered by a pooled Modernization and Improvement fund administered by B.C. Housing to which surpluses in societies’ replacement reserve funds are redirected. Like all budgeted items, the fund may change from year to year. Although societies are encouraged to plan for capital repairs, major and inevitable repairs may be beyond their control and financial power. The Modernization and Improvement fund presents an evident challenge in sustainable sector-wide financing because money to ensure the viability of these buildings post-expiry has never been committed. Moreover, the barrier to sound and long-term financial planning would understandably frustrate and perhaps even discourage staff and boards of non-profit housing societies. With the risk of losing surpluses to B.C. Housing, societies may have little motivation and leeway to plan optimal reserve allocations with sufficient contingent funds. The need for further research into building conditions through building condition assessments and a comparative framework for decision making such as the FCI used by TCHC is evident. Replacement reserve funds were never intended to ensure the life of a building into perpetuity, as ultimately redevelopment will be the sound financial choice. Much of the federal stock is currently nearing 40-50 years of age and will age further by the time operating agreements expire. Unexpected increases to projected building costs have been caused by increasing petroleum prices and labour wages well above the rate of inflation. Additional costs have been accrued associated with the leaky condo era. Given such current and impending uncertainty, a sector-wide analysis is necessary to elucidate the costs that will be demanded in the coming decades. With a framework similar to the FCI, B.C. will be able to project the costs required over time to maintain current numbers of affordable housing units. Understanding the requisite cost will provide a starting point for dialogue between the non-profit sector and levels of government exploring alternative means of maintaining the sector’s viability. Second mortgages and extended operating agreements will be one of the options available but further burdening non-profits financially may not be in the sector’s best interest. Non-profit housing providers in Ontario, where the sector is further advanced in creating a long-term financial asset planning framework, point out that the most fair approach to meeting costs would bring the federal government back to the negotiating table to facilitate the provincial government in funding deferred investments in long-term capital repairs that were never included in financial planning models for the sector38.
37 CMHC, 2003b and B.C. Housing, 2002 and 2001 38 SHSC, 2007a and 2007b
45/59
3.2 Discussion of grouped comparisons of financial attributes To better understand the sector-wide data, it is useful to examine societies by comparing finances within groupings based on specific characteristics that are likely to influence the types of challenges and opportunities that a society encounters. Indicators have therefore been compared across several groupings: urban and rural buildings; buildings operated within small, medium and large portfolios; society segments that take into account the society’s mandate, the demographic they intend to serve and the number of buildings they operate; and the type of operating agreement through which the society manages the building based on chronology and the administrative lead.
3.2.1 Rural and urban financial indicators Some differences are indeed evident between rural and urban buildings. Most notably, fewer rural buildings have a capital plan (27%) compared with their urban counterparts (56%) and a smaller proportion of rural buildings are characterized as “positive” (22% compared with 37%). Although differences observed in this analysis are not extreme, the results indicate that further efforts would be beneficial to extend resources and capacity building opportunities to areas outside of urban centres. Moreover, in those rural areas that have weak markets, it will likely not be possible to leverage assets for redevelopment nor increase internal subsidies through low end of market rents. Buildings that are not viable post operating agreement expiry may therefore require additional public support to ensure capital repairs are up to date, expenses are met and the number of subsidized units protected. This is particularly important given previous CMHC research that has demonstrated that rural households in BC are more likely to be in core housing need than elsewhere in the country.39
3.2.2 Society portfolio sizes and financial indicators Small (0-50 units), medium (51-300 units) and large (301+ units) portfolios significantly differ from each other in all of the key indicators investigated. (See Figure 6 in section 2.2.2). Forty-seven percent of buildings operated by large societies are characterized as ”positive”, compared with 44% of buildings operated by medium sized societies and only 18% of buildings operated by small societies. A similar pattern is evident for other financial indicators, wherein larger societies appear to fare better than medium-sized and small ones. For example, 78% percent of buildings managed by large societies cover their expenses with their subsidy and rental income compared with 75% of buildings managed by medium
39 CMHC, 2003a
46/59
sized societies and 66% of buildings managed by small societies. Seventy-two percent of buildings managed by large societies have a capital plan in place compared with 57% of buildings managed by medium sized societies and only 29% of buildings managed by small societies. Sixty-one percent of buildings operated by large societies and 79% of buildings operated by medium-sized societies have a replacement reserve fund investment strategy, whereas only 56% of buildings operated by smaller societies do so. Larger societies are likely to benefit from economies of scale both in terms of human resources with the ability to spread administration costs over more units and to have strong purchasing power in terms of capital items, goods, and services. Furthermore, larger societies may be more established and have more years of experience. The benefits of a larger portfolio size for non-profit housing providers have been demonstrated elsewhere. Recent work at SHSC recommends a minimum portfolio of 125 units, but recognizes that greater efficiencies will likely continue to occur above that number,40 and research in the UK (where non-profit housing societies tend to have larger portfolios) recommends portfolios with unit numbers greater than one thousand41. However, there are opportunities for innovation in how the benefits of a larger portfolio size may be realized. Pooled investment sources and bulk purchasing of the kind already initiated by BCNPHA are examples and there may be room to explore more opportunities for shared resources such as waste disposal services, bulk energy purchase, capital supply purchasing and so forth. For some societies, mergers or formalized sharing of some administrative and support services (partial mergers) may be appropriate strategies. Research commissioned by BCNPHA in 2004 suggests that there is interest among societies to engage in at least partial mergers or informal partnerships42. In a survey administered to a sample of 279 non-profit societies, 60% indicated that they were willing to share services among societies where economic advantages could be realized. Maintenance and administration were the two areas in which the highest proportion of societies showed interest in partnerships, whereas contracted services, volunteer recruitment, fundraising, and client programmes were seen as less favourable options. Research into the relative costs and benefits of mergers of non-profit housing societies in the UK commissioned by the Chartered Institute of Housing recognized many benefits to increasing portfolio sizes across the sector but also warned of potential risks associated with this policy43. Reported benefits are diverse and range from economies of scale that can be achieved in terms of accessing borrowing vehicles and complex treasury instruments, managing risk and moving resources around the group to maximize their efficiency of use.
40 Turner, 2008 41 Ibid. 42 Marason Management Limited in partnership with BCNPHA, 2004 43 Davies et al., 2006
47/59

Other benefits occur because of strategic positioning where larger groups are able to better harness market intelligence and develop increased influence over and access to decision makers within both the public and private sectors. Finally, benefits accrue in terms of human resources including localized accountability, an ability to attract higher calibre staff and opportunities to better hone skills. The study warns however that portfolio size increases whether through constitutional mergers or more informal partnerships should not occur without the consideration of associated risks. In particular, larger organizations are more likely to neglect front-line service and reduce opportunities for tenant influence and participation in decision-making and policy implementation. Further, cost savings can often be emphasized at the risk of under-reporting increases in costs such as legal costs, redundancies, re-branding and information technology, communication and office integration. The lesson emphasized most clearly within the UK experience is that many options for increased efficiencies exist and legal mergers should not be pursued to the neglect of other opportunities. Objectives must be clarified and all available alternatives considered which may include retrenching services (trading a broad-sector mandate for a more specialized one), engaging in more informal partnerships and outsourcing inefficient or costly services. With growing experience in this realm and close relationships to the non-profit housing societies themselves, BCNPHA is likely best suited to take on a facilitatory role with respect to developing a decision-making framework, connecting societies with others seeking compatible partnerships, and managing pooled resources or bulk purchasing schemes. The government will need to play an instrumental role in streamlining administration to accommodate new partnerships.
3.2.3 Society segments and financial indicators Society segments take into account a society’s primary mandate, the demographic that they serve and the size of their overall portfolio. Segment 3 (large societies with housing as their primary mandate regardless of the demographic they serve) and Segment 6 (societies providing supportive services and housing for those most at risk) are the two segments that are most likely to be characterized as ”positive” by the financial strength index (45% and 44% compared to a range of 11% to 28% for the other four segments). Segment 3 and Segment 6 are most likely to have a capital plan (70% and 46%, respectively, compared to a range of 11%-44% for the other four segments). The evident strength of Segment 3 supports earlier findings that the size of a society’s portfolio greatly influences its financial sustainability. The strength of Segment 6 may be partially attributable to the funding priorities of the current provincial administration, who have pursued policies of targeted funding and deep subsidies that seek to help those most in need. Segment 2 (small societies with housing as their primary mandate, serving tenants other than families and independent seniors) has the lowest proportion
48/59
(11%) of societies characterized as “positive” on the financial strength index, primarily due to the lack of a capital plan. However, Segment 2 also has the smallest number of societies compared to other segments, and thus these results should be interpreted with caution.
3.2.4 Operating agreement programs and financial indicators Only slight differences are evident among the groupings of operating agreement programs (newer provincial from 1994, bilateral 1979-1993, and federally administered programs before 1985). Older, federally administered programs display the weakest financial indicators with only 25% characterized as ”positive” compared with 41% of bilateral programs and 43% of newer provincially-administered programs. Sixty-nine percent of the older federal stock are covering costs compared to 71% of bilateral programs and 81% of provincial programs. Similarly, 50% have a replacement reserve investment strategy compared with 74% of bilateral programs and 68% of provincial ones. The challenges faced by the federal stock may be, in part, because these buildings are older and so may be facing increased capital repair costs and depleted reserves. If the older buildings have not been adequately maintained, they may not be able to attract higher income residents who would be able to provide internal subsidies. (In the section 26 and 27 programs, internal subsidy was possible within the agreement as a surcharge levied on households with RGI of less than 22%44. The later, section 95-pre-1986 programs are designed so as to have a proportion of LEMR units). Finally, financial challenges encountered by buildings operating under older, federally administered programs may be related to subsidy calculations. These programs calculate subsidy based on a mortgage interest write-down to an effective rate of 2%. With currently low interest rates, these societies have seen their subsidy amount fall. However, these same programs have several aspects working in their favour. Firstly, the 2% write-down by design has a subsidy that is less than the mortgage payment amount. This means that in most cases mortgage amortization and subsidy withdrawal at the end of the operating agreement should leave the society with additional funds to spend on operating expenses. Secondly, the buildings operated under the older agreements are also those that are most likely to be on land owned by the society itself (79% compared with 28% of bilateral programs and 39% of provincial programs). These societies will therefore have a significant asset to leverage at operating agreement expiry and considerable latitude in deciding how to best ensure their long-term viability. Societies managed without an operating agreement do not appear to have major differences in terms of financial sustainability as compared to those with operating agreements. The only exceptions are in terms of number of mortgages
44 Findlay et al., 2007
49/59
and the proportion engaging in capital planning. Thirty-seven percent of societies without an operating agreement do not have a mortgage (compared with 3%-13% for the various program groupings). Forty-four percent have capital plans, which is slightly lower than the societies operating under other programs, which range from 54%-57%). The high proportion of buildings with no mortgage is probably indicative that most of these societies have already amortized their mortgage (and probably previously operated under subsidy agreements that have now expired). The apparent lack of differences between societies with and without a program may speak to an opportunity for government to take less of a regulatory role and instead play a greater capacity building or facilitative role in the sector. Increased society autonomy could ultimately result in more innovative approaches and economic efficiencies. Further research will help to elucidate where such opportunities exist.
4.0 Conclusions and recommendations The findings demonstrate that significant opportunities are emerging for the non-profit housing sector in British Columbia as operating agreements expire. The vast majority of non-profit housing societies are covering their operating costs with income and subsidy and many that are not are demonstrating innovative solutions to addressing budget shortfalls. The land, building and other assets held within non-profit housing societies that were included in this analysis total over $2.5 billion and provide clear opportunity for financial leverage for further development of affordable housing stock. Societies hold the majority of the assets but the province and various municipalities are also significant stakeholders. With multiple players, collaborative planning and clear commitments to maintaining investments within the sector are necessary from all parties. Further research should identify emerging opportunities for redevelopment to increase the stock of affordable housing considering market conditions, current density, and zoning requirements. Combined with opportunities to subsidize across portfolios and establish mixes in proportions of RGI and LEMR rents, expiring operating agreements will bring with them opportunity for innovative and context-specific approaches. In spite of positive opportunities, several indicators also warn against complacency. Concerted action, including further research to make informed policy decisions, is needed to ensure optimal long-term financial strength of the province’s affordable housing sector. Sixteen percent of buildings are not currently covering costs, thirty-three percent have no capital plan, eight percent do not have a replacement reserve investment strategy and twenty-four percent can be characterized as ”vulnerable”. Collaborative action among all levels of government, non-profit housing societies and the B.C. Non-Profit Housing Association is most certainly needed to ensure the sector is prepared to take optimal advantage of post-operating agreement expiry opportunities. The majority of non-profit housing buildings operate with only one mortgage. However, the small proportion (4%) of buildings with two or more mortgages may yet grow in the face of aging housing stock and insufficient dedicated provincial
50/59
funds to meet all impending repair costs. Currently, second mortgages and extended operating agreements are occasionally being used to meet repair costs but alternatives should be considered within a sector-wide long-term asset management strategy and discussed among non-profits and all levels of government. Replacement reserve funds appear to be healthy when compared with the most moderate of projected allocation requirements determined in the Ontario context. However, Ontario projections may not be applicable to the B.C. context because of the overall older age of the Ontario stock and because of a moratorium placed on reserve allocation in Ontario in the early 1990s. With insufficient information on B.C. building conditions, more research on the issue of replacement reserve funds and allocations is clearly needed. The fact that many societies allocate funds to their replacement reserve inconsistently between years suggests that replacement reserves may be given secondary priority to short-term financial considerations and that their adequacy may be threatened because societies are operating within tight margins. Moreover, with just over half of societies not engaging in capital planning to ensure adequate replacement reserve allocations, improved access to information, capacity building programs, government policies with strong motivators and increased financial autonomy are likely all needed to improve the sector’s financial viability. Portfolio size is clearly the most distinctive indicator of financial strength where large societies perform significantly better than their smaller counterparts. To some extent, rural societies are slightly more likely to be vulnerable than urban ones. Segments of the non-profit housing sector that include smaller societies and those that serve demographics that are not among the current provincial priorities also fare slightly worse and may therefore require additional attention and support as the end of operating agreement terms draw nearer. Finally, older housing stock that was initially administered by the federal government demonstrates slightly weaker financial indicators than newer programs administered bilaterally or unilaterally by the provincial government. These same buildings however are those most likely to be on land owned by the society and are operated under programs which tend to have been structured such that their subsidy is less than their mortgage. Thus there are unique opportunities for their financial sustainability after subsidy withdrawal. The results of this analysis lead to the following policy and research recommendations. Recommendations to the provincial government:
Streamline operating agreements and reporting requirements among the various agencies that most frequently fund non-profit housing societies. This is likely most feasible between divisions of the provincial government; however, collaboration with other funding agencies such as health authorities should also be sought. As approximately one third of non-profit
51/59
Further research the adequacy of replacement reserve funds and annual
allocations specific to the British Columbia context. Thorough building condition assessments are recommended by B.C. Housing but societies may not have the resources available for this. As the issue of reserve fund adequacy is ultimately a financial risk for the Ministry of Housing and Social Development and public investment, the provincial government may want to consider funding this work for a comprehensive sector-wide assessment.
Work collaboratively with the non-profit housing sector to develop a
framework that characterizes the objective repair condition of non-profit housing and forms a model through which to make strategic decisions about deferred investments and redevelopment opportunities. The facilities condition index (FCI) used by the TCHC is an example of such a framework. Collaborate with BCNPHA to build the necessary dataset from existing information such as the Asset Analysis.
Use the framework and the building condition assessments to project
long-term temporal costs. Devise a plan collaboratively between senior levels of government and non-profit housing societies about how capital repair costs that are beyond the scope of replacement reserve funds will be financed.
Further explore mutual advantages to structuring policy so as to allow
increased autonomy in terms of financial planning for non-profits, particularly those already demonstrating significant capacities in this regard.
Conduct further research to better characterize the financial pressures
preventing some societies from covering their operating costs with subsidy and revenue so that shortfalls can be prevented in the future.
Assess land owned by government for its potential for redevelopment
opportunities to increase the stock of affordable housing and collaborate with non-profits to devise strategies of how to best leverage existing assets.
Recommendations to BCNPHA:
Further initiatives that seek to maximize the economies of scale among
societies. Develop a decision-making framework that facilitates non-profits in identifying opportunities for partnerships and mergers. The framework should ensure that partnerships pursue explicit objectives and consider a broad range of alternatives. BCNPHA already informally facilitates partnerships but efforts could be increasingly formalized and
52/59
Investigate opportunities to support societies through capacity-building in financial planning. Focus attention in particular on reaching societies located in rural areas, which may require developing novel delivery mechanisms. Determine current obstacles deterring societies from engaging in capital planning or from devising a replacement reserve investment strategy.
Collaborate with the provincial government to conduct further research to
better characterize the financial pressures preventing some societies from covering their operating costs with subsidy and revenue so that shortfalls can be prevented in the future.
Continue to collect and disseminate information about non-profit housing
societies’ financial management and viability to add more clarity to the baseline information and to monitor on-going progress. In particular, in addition to the data currently being collected in the BCNPHA Asset Analysis project, additional useful indicators include net operating income and precise figures on rental subsidies including proportion of RGI and LEMR units and methods of calculation.
Provide technical support and research to non-profit housing societies in
analyzing opportunities to leverage existing assets for redevelopment. Facilitate partnerships among the non-profit, public and private sectors toward this end.
53/59
v. References
B.C. Housing Management Corporation (2001) Housing Provider Kit: Financial
Management B.C. Housing Management Corporation (2002) Housing Provider Kit:
Maintenance Canadian Housing Renewal Association. (2003) Report on the future of
Canada’s social housing subsidies and assets. Impacts and solutions Canadian Mortgage and Housing Corporation (CMHC) (2003a) Special studies
on 1996 census data: Housing conditions of rural households, Research Highlight, Socio-economic Series 55-11, April
Canadian Mortgage and Housing Corporation (CMHC) (2003b) Capital
Replacement Planning: Manual for Co-operative and Non-Profit Housing Providers
Canadian Mortgage and Housing Corporation (CMHC) (2005) Social Housing in
the context of rural depopulation, Research Highlight, Socio-economic Series 03-023, August
Connelly Consulting Services in association with Focus Consulting and Paul
Dowling Consulting. (2003) Guaranteeing a future: The challenge to social housing as operating agreements expire, A report to The Canadian Housing and Renewal Association
Davies, A., Lupton, M., McRoberts D. (2006) The Costs and Benefits of Groups,
Mergers and Partnerships, Chartered Institute of Housing and Tribal Findlay K. and Stobie P. with additional chapters by Weber D. (2007) Social and
Affordable Housing in B.C.: From Crisis Response to Preventative Maintenance, Langara College, Continuing Studies
Marason Management Limited in partnership with The B.C. Non-Profit Housing
Association (2004) Sustaining the non-profit housing sector in British Columbia
Pomeroy, S. (Focus Consulting) in association with Charles, G., Gaudreault, A.
and Connelly, P. (2006) Was Chicken Little Right? Case studies on the impact of expiring social housing operating agreements
Social Housing Services Corporation (SHSC) (2004) Reserve fund review and
capital contribution benchmarking for social housing in Ontario, February
54/59
Social Housing Services Corporation (2007a) Capital Ideas: How to extend the health and safety of social housing
Social Housing Services Corporation (2007b) Social housing and the Provincial-
Municipal fiscal service delivery review: Sustaining a new partnership Toronto Community Housing Corporation (TCHC) (2008). Real Estate Asset
Investment Strategy. Item 2, December 8, 2008 TCHC: 2008-165, Report to the Board of Directors from the Chief Executive Officer, December 2, 2008. Available on-line http://www.torontohousing.ca/webfm_send/5310, accessed, July 14, 2009
Turner, S. (2008) Is there an optimum size for a social housing provider? Social
Housing Services Corporation
55/59
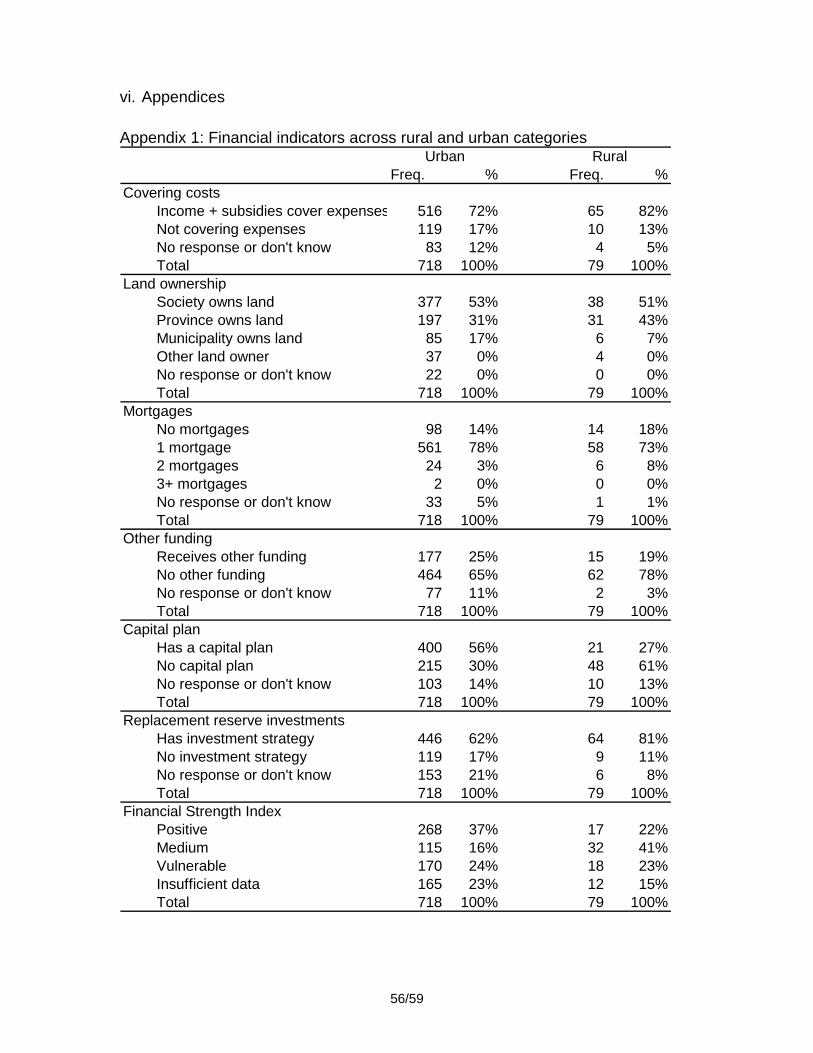
vi. Appendices
Appendix 1: Financial indicators across rural and urban categories
Freq. % Freq. %Covering costs
Income + subsidies cover expenses 516 72% 65 82%Not covering expenses 119 17% 10 13%No response or don't know 83 12% 4 5%Total 718 100% 79 100%
Land ownershipSociety owns land 377 53% 38 51%Province owns land 197 31% 31 43%Municipality owns land 85 17% 6 7%Other land owner 37 0% 4 0%No response or don't know 22 0% 0 0%Total 718 100% 79 100%
MortgagesNo mortgages 98 14% 14 18%1 mortgage 561 78% 58 73%2 mortgages 24 3% 6 8%3+ mortgages 2 0% 0 0%No response or don't know 33 5% 1 1%Total 718 100% 79 100%
Other fundingReceives other funding 177 25% 15 19%No other funding 464 65% 62 78%No response or don't know 77 11% 2 3%Total 718 100% 79 100%
Capital planHas a capital plan 400 56% 21 27%No capital plan 215 30% 48 61%No response or don't know 103 14% 10 13%Total 718 100% 79 100%
Replacement reserve investmentsHas investment strategy 446 62% 64 81%No investment strategy 119 17% 9 11%No response or don't know 153 21% 6 8%Total 718 100% 79 100%
Financial Strength IndexPositive 268 37% 17 22%Medium 115 16% 32 41%Vulnerable 170 24% 18 23%Insufficient data 165 23% 12 15%Total 718 100% 79 100%
Urban Rural
56/59
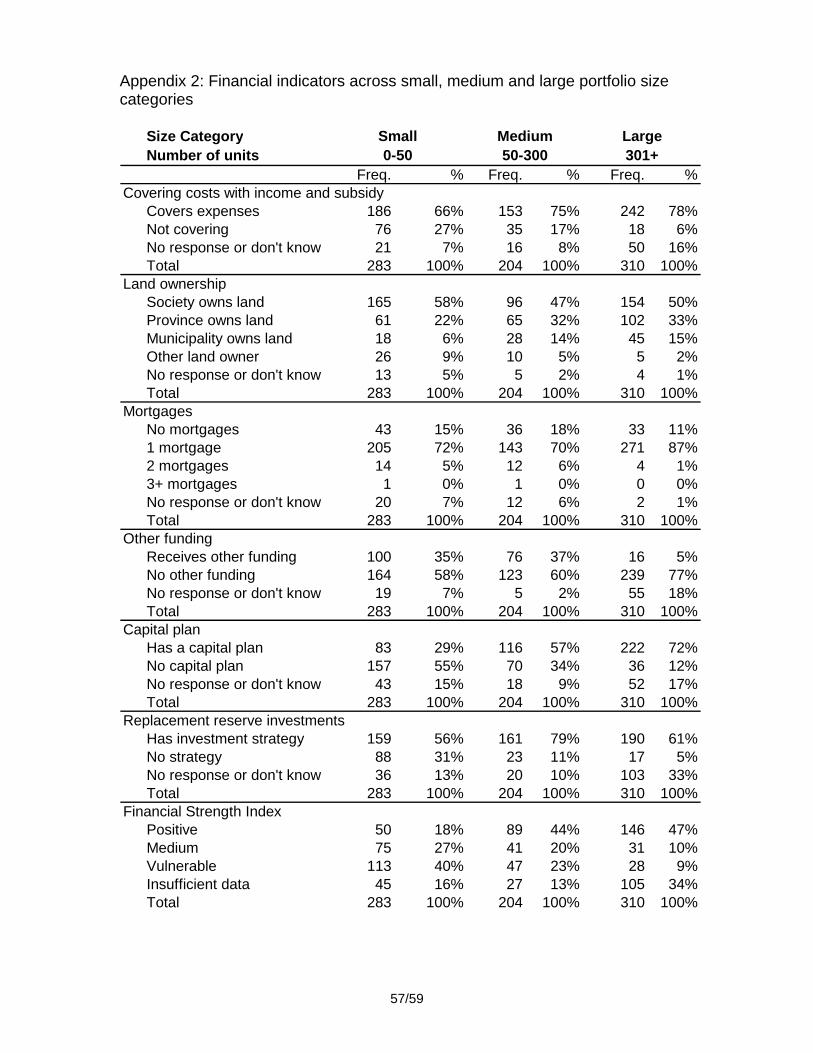
Appendix 2: Financial indicators across small, medium and large portfolio size categories
Size CategoryNumber of units
Freq. % Freq. % Freq. %Covering costs with income and subsidy
Covers expenses 186 66% 153 75% 242 78%Not covering 76 27% 35 17% 18 6%No response or don't know 21 7% 16 8% 50 16%Total 283 100% 204 100% 310 100%
Land ownershipSociety owns land 165 58% 96 47% 154 50%Province owns land 61 22% 65 32% 102 33%Municipality owns land 18 6% 28 14% 45 15%Other land owner 26 9% 10 5% 5 2%No response or don't know 13 5% 5 2% 4 1%Total 283 100% 204 100% 310 100%
MortgagesNo mortgages 43 15% 36 18% 33 11%1 mortgage 205 72% 143 70% 271 87%2 mortgages 14 5% 12 6% 4 1%3+ mortgages 1 0% 1 0% 0 0%No response or don't know 20 7% 12 6% 2 1%Total 283 100% 204 100% 310 100%
Other fundingReceives other funding 100 35% 76 37% 16 5%No other funding 164 58% 123 60% 239 77%No response or don't know 19 7% 5 2% 55 18%Total 283 100% 204 100% 310 100%
Capital planHas a capital plan 83 29% 116 57% 222 72%No capital plan 157 55% 70 34% 36 12%No response or don't know 43 15% 18 9% 52 17%Total 283 100% 204 100% 310 100%
Replacement reserve investmentsHas investment strategy 159 56% 161 79% 190 61%No strategy 88 31% 23 11% 17 5%No response or don't know 36 13% 20 10% 103 33%Total 283 100% 204 100% 310 100%
Financial Strength IndexPositive 50 18% 89 44% 146 47%Medium 75 27% 41 20% 31 10%Vulnerable 113 40% 47 23% 28 9%Insufficient data 45 16% 27 13% 105 34%Total 283 100% 204 100% 310 100%
Small Medium Large0-50 50-300 301+
57/59
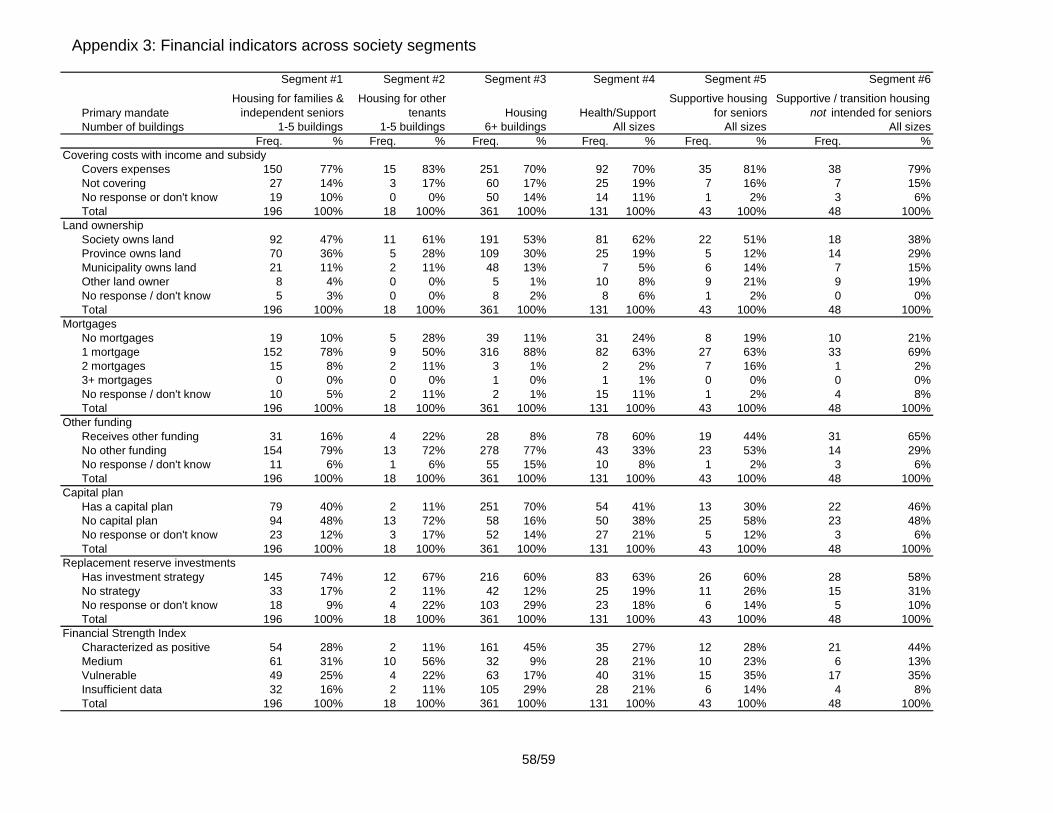
58/59
Appendix 3: Financial indicators across society segments
Primary mandateNumber of buildings
Freq. % Freq. % Freq. % Freq. % Freq. % Freq. %Covering costs with income and subsidy
Covers expenses 150 77% 15 83% 251 70% 92 70% 35 81% 38 79%Not covering 27 14% 3 17% 60 17% 25 19% 7 16% 7 15%No response or don't know 19 10% 0 0% 50 14% 14 11% 1 2% 3 6%Total 196 100% 18 100% 361 100% 131 100% 43 100% 48 100%
Land ownershipSociety owns land 92 47% 11 61% 191 53% 81 62% 22 51% 18 38%Province owns land 70 36% 5 28% 109 30% 25 19% 5 12% 14 29%Municipality owns land 21 11% 2 11% 48 13% 7 5% 6 14% 7 15%Other land owner 8 4% 0 0% 5 1% 10 8% 9 21% 9 19%No response / don't know 5 3% 0 0% 8 2% 8 6% 1 2% 0 0%Total 196 100% 18 100% 361 100% 131 100% 43 100% 48 100%
MortgagesNo mortgages 19 10% 5 28% 39 11% 31 24% 8 19% 10 21%1 mortgage 152 78% 9 50% 316 88% 82 63% 27 63% 33 69%2 mortgages 15 8% 2 11% 3 1% 2 2% 7 16% 1 2%3+ mortgages 0 0% 0 0% 1 0% 1 1% 0 0% 0 0%No response / don't know 10 5% 2 11% 2 1% 15 11% 1 2% 4 8%Total 196 100% 18 100% 361 100% 131 100% 43 100% 48 100%
Other fundingReceives other funding 31 16% 4 22% 28 8% 78 60% 19 44% 31 65%No other funding 154 79% 13 72% 278 77% 43 33% 23 53% 14 29%No response / don't know 11 6% 1 6% 55 15% 10 8% 1 2% 3 6%Total 196 100% 18 100% 361 100% 131 100% 43 100% 48 100%
Capital planHas a capital plan 79 40% 2 11% 251 70% 54 41% 13 30% 22 46%No capital plan 94 48% 13 72% 58 16% 50 38% 25 58% 23 48%No response or don't know 23 12% 3 17% 52 14% 27 21% 5 12% 3 6%Total 196 100% 18 100% 361 100% 131 100% 43 100% 48 100%
Replacement reserve investmentsHas investment strategy 145 74% 12 67% 216 60% 83 63% 26 60% 28 58%No strategy 33 17% 2 11% 42 12% 25 19% 11 26% 15 31%No response or don't know 18 9% 4 22% 103 29% 23 18% 6 14% 5 10%Total 196 100% 18 100% 361 100% 131 100% 43 100% 48 100%
Financial Strength IndexCharacterized as positive 54 28% 2 11% 161 45% 35 27% 12 28% 21 44%Medium 61 31% 10 56% 32 9% 28 21% 10 23% 6 13%Vulnerable 49 25% 4 22% 63 17% 40 31% 15 35% 17 35%Insufficient data 32 16% 2 11% 105 29% 28 21% 6 14% 4 8%Total 196 100% 18 100% 361 100% 131 100% 43 100% 48 100%
Segment #5 Segment #6
Supportive housing for seniors
Supportive / transition housing not intended for seniors
Segment #1 Segment #2
Housing for families & independent seniors
Housing for other tenants Housing Health/Support
Segment #3 Segment #4
All sizes All sizes1-5 buildings 1-5 buildings 6+ buildings All sizes
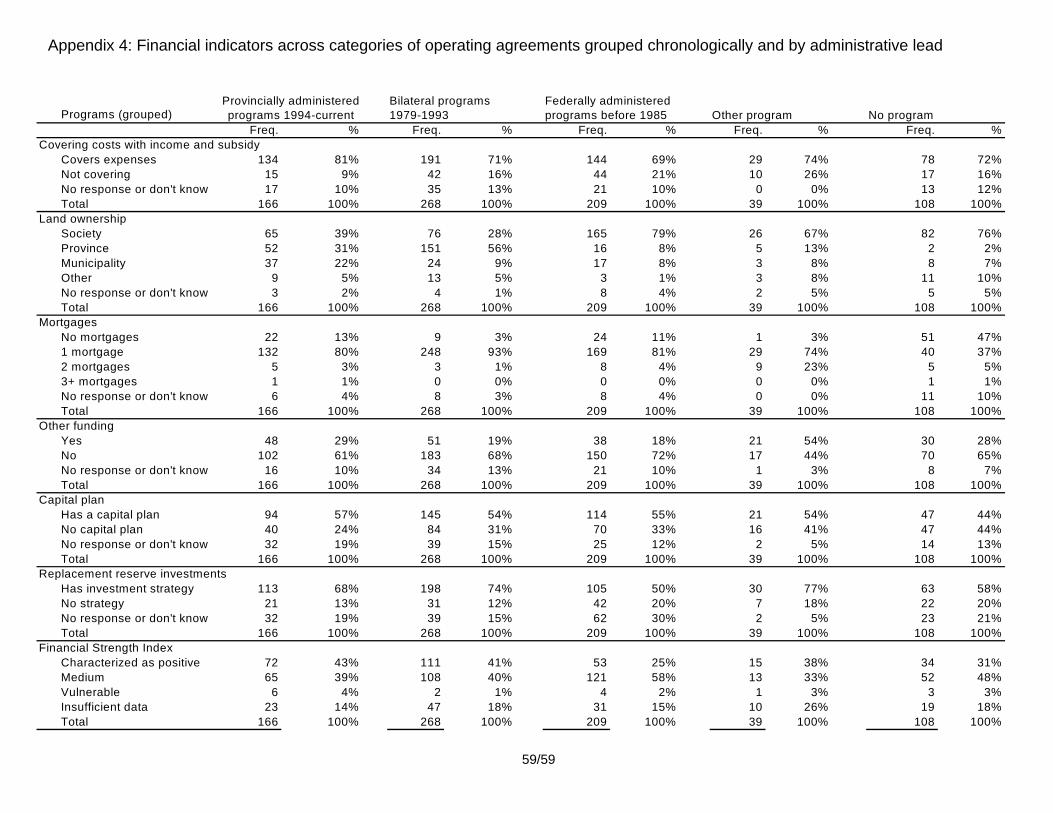
Appendix 4: Financial indicators across categories of operating agreements grouped chronologically and by administrative lead
Programs (grouped)Freq. % Freq. % Freq. % Freq. % Freq. %
Covering costs with income and subsidyCovers expenses 134 81% 191 71% 144 69% 29 74% 78 72%Not covering 15 9% 42 16% 44 21% 10 26% 17 16%No response or don't know 17 10% 35 13% 21 10% 0 0% 13 12%Total 166 100% 268 100% 209 100% 39 100% 108 100%
Land ownershipSociety 65 39% 76 28% 165 79% 26 67% 82 76%Province 52 31% 151 56% 16 8% 5 13% 2 2%Municipality 37 22% 24 9% 17 8% 3 8% 8 7%Other 9 5% 13 5% 3 1% 3 8% 11 10%No response or don't know 3 2% 4 1% 8 4% 2 5% 5 5%Total 166 100% 268 100% 209 100% 39 100% 108 100%
MortgagesNo mortgages 22 13% 9 3% 24 11% 1 3% 51 47%1 mortgage 132 80% 248 93% 169 81% 29 74% 40 37%2 mortgages 5 3% 3 1% 8 4% 9 23% 5 5%3+ mortgages 1 1% 0 0% 0 0% 0 0% 1 1%No response or don't know 6 4% 8 3% 8 4% 0 0% 11 10%Total 166 100% 268 100% 209 100% 39 100% 108 100%
Other fundingYes 48 29% 51 19% 38 18% 21 54% 30 28%No 102 61% 183 68% 150 72% 17 44% 70 65%No response or don't know 16 10% 34 13% 21 10% 1 3% 8 7%Total 166 100% 268 100% 209 100% 39 100% 108 100%
Capital planHas a capital plan 94 57% 145 54% 114 55% 21 54% 47 44%No capital plan 40 24% 84 31% 70 33% 16 41% 47 44%No response or don't know 32 19% 39 15% 25 12% 2 5% 14 13%Total 166 100% 268 100% 209 100% 39 100% 108 100%
Replacement reserve investmentsHas investment strategy 113 68% 198 74% 105 50% 30 77% 63 58%No strategy 21 13% 31 12% 42 20% 7 18% 22 20%No response or don't know 32 19% 39 15% 62 30% 2 5% 23 21%Total 166 100% 268 100% 209 100% 39 100% 108 100%
Financial Strength IndexCharacterized as positive 72 43% 111 41% 53 25% 15 38% 34 31%Medium 65 39% 108 40% 121 58% 13 33% 52 48%Vulnerable 6 4% 2 1% 4 2% 1 3% 3 3%Insufficient data 23 14% 47 18% 31 15% 10 26% 19 18%Total 166 100% 268 100% 209 100% 39 100% 108 100%
Other program No programProvincially administered programs 1994-current
Bilateral programs 1979-1993
Federally administered programs before 1985
59/59