The financial effects from continuous improvement...
50
The financial effects from continuous improvement adaptations A study of the Swedish electrical contracting industry Master’s thesis in Production Engineering SIMON HALL Department of Technology Management and Economics CHALMERS UNIVERSITY OF TECHNOLOGY Division of Operations Management Gothenburg, Sweden 2015 Report no. E2015:021
Transcript of The financial effects from continuous improvement...

The financial effects from continuous improvement adaptations
A study of the Swedish electrical contracting industry
Master’s thesis in Production Engineering
SIMON HALL
Department of Technology Management and Economics CHALMERS UNIVERSITY OF TECHNOLOGY Division of Operations Management Gothenburg, Sweden 2015 Report no. E2015:021


REPORT NO. E2015:021
The financial effects from continuous improvement adaptations
A study of the Swedish electrical contracting industry
Simon Hall
Department of Technology management and Economics
CHALMERS UNIVERSITY OF TECHNOLOGY
Göteborg, Sweden 2015

The financial effects from continuous improvement adaptations
A study of the Swedish electrical contracting industry
Simon Hall
© Simon Hall, 2015
Report No. E2015:021
Department of Technology Management and Economics
CHALMERS UNIVERSITY OF TECHNOLOGY
Gothenburg, Sweden 2015
SE-412 96 Göteborg
Sweden
Telephone +46(0)31-772 1000

Abstract
The concept of continuous improvement adopts an approach to conduct work in a way that
aligns organizations towards their goals. The concept was originally introduced in the
Japanese manufacturing industry in the 1950s. It started as a method for solving problems and
has since developed to become a philosophy for improvement. The Japanese call it Kaizen.
The effects from improvements in a manufacturing setting are often clear and measurable, and
can generally be translated to economic gain. However, when improvements are of such
nature that they indirectly contribute to value, such as increased employee satisfaction, safety
or even to some extent quality, the short term effects can be difficult to measure and long term
financial effects become more relevant. This is often the case in the service sector.
The present study has investigated the impact a culture that encourages the work with
continuous improvements can have on companies’ financial performance. The purpose was
hence to identify a connection between continuous improvement work and financial
performance.
26 small- to medium sized electrical contracting companies were investigated regarding their
efforts towards working with continuous improvement as well as their financial performance.
A literature study was performed to create an understanding of the concept of continuous
improvement and how it is practiced in small- to medium sized service enterprises (SMSEs).
In order to answer the research question, a statistical analysis was performed followed by four
case studies. The purpose of the case studies was to support the findings from the statistical
analysis.
The statistical analysis showed that a connection between continuous improvement and
financial performance was indicated for 81% of the sample companies. The probability that
the result was coincidental was less than 1%. The findings from the case studies supported the
statistical result.
The study showed that continuous improvement and financial performance were related.
Electrical contracting firms that had successfully implemented the concept of continuous
improvement had benefited financially from such adaptations.
Keywords: Continuous improvement, financial performance, quality management, ISO 9001,
electrical contracting, SMEs, SMSEs.

Acknowledgements
This master’s thesis has been performed for the master’s program Production Engineering, at
the department of Technology Management and Economics. The research has been carried
out at C2 management in Stockholm, which is a consultancy firm specialized in continuous
improvement.
I would like to take this opportunity to thank my supervisor at Chalmers, Prof. Mats Winroth,
as well as my supervisor at C2 management, Christian Gustafsson, and the quality director at
EIO, Pär Lanner, for their involvement and support throughout this project.

Contents
1. Introduction ............................................................................................................................................. 1
1.1 Background ................................................................................................................................... 1
1.1.1 Kaizen in the west ............................................................................................................ 3
1.2 Purpose ................................................................................................................................................. 3
1.3 Research question ......................................................................................................................... 4
1.4 Limitations ......................................................................................................................................... 4
2. Method ......................................................................................................................................................... 5
2.1 Quantitative analysis ................................................................................................................... 5
2.2 Qualitative analysis ...................................................................................................................... 6
3. Theory .......................................................................................................................................................... 8
3.1 Quality management .................................................................................................................... 8
3.1.1 The fundament of quality management .................................................................. 8
3.1.2 Quality management in small- to medium sized enterprises................... 9
3.1.3 Quality management in service companies ....................................................... 10
3.1.4 The ISO 9001 series .......................................................................................................... 11
3.2 Creating and sustaining an improvement culture ................................................ 12
3.2.1 Suggestion systems ........................................................................................................... 12
3.2.2 The low-hanging fruit trap .......................................................................................... 14
3.2.3 Quality circles ....................................................................................................................... 14
3.2.4 The emperor’s new clothes .......................................................................................... 15
3.3 The Electrical Installation Organization (EIO) ....................................................... 15
4. Empirical findings ............................................................................................................................. 17
4.1 Company A ....................................................................................................................................... 17
4.2 Company B ....................................................................................................................................... 18
4.3 Company C ....................................................................................................................................... 19
4.4 Company D ...................................................................................................................................... 20
4.5 Results from the statistical analysis .............................................................................. 21
5. Analysis .................................................................................................................................................... 24
5.1 Company A ....................................................................................................................................... 24
5.2 Company B ....................................................................................................................................... 25
5.3 Company C ....................................................................................................................................... 26

5.4 Company D ...................................................................................................................................... 26
5.5 General analysis .......................................................................................................................... 27
6. Discussion ............................................................................................................................................... 28
6.1 Reflections on trustworthiness ......................................................................................... 28
7.1 Implications for practice ....................................................................................................... 30
7.2 Future research ............................................................................................................................ 30
Appendix A ................................................................................................................................................... 35
Appendix B ................................................................................................................................................... 38
Appendix C ................................................................................................................................................... 40
Appendix D ................................................................................................................................................... 41
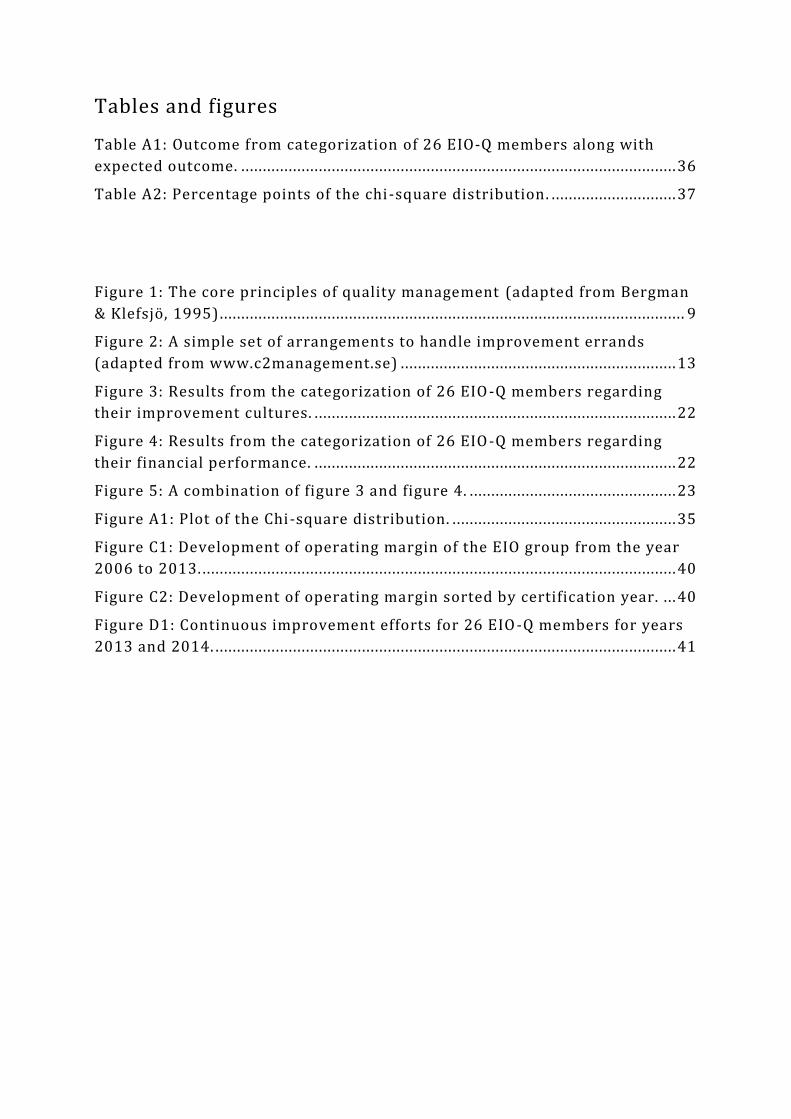
Tables and figures
Table A1: Outcome from categorization of 26 EIO-Q members along with
expected outcome. ... . . . . . . . . . . . . . . . . . . . . . . . . . . . . . . . . . . . . . . . . . . . . . . . . . . . . . . . . . . . . . . . . . . . . . . . . . . . . . . . . . . . . . . . . . . . . . . . . . . 36
Table A2: Percentage points of the chi-square distribution. .. . . . . . . . . . . . . . . . . . . . . . . . . . . . 37
Figure 1: The core principles of quality management (adapted from Bergman
& Klefsjö, 1995) ... . . . . . . . . . . . . . . . . . . . . . . . . . . . . . . . . . . . . . . . . . . . . . . . . . . . . . . . . . . . . . . . . . . . . . . . . . . . . . . . . . . . . . . . . . . . . . . . . . . . . . . . . . 9
Figure 2: A simple set of arrangement s to handle improvement errands
(adapted from www.c2management.se) ... . . . . . . . . . . . . . . . . . . . . . . . . . . . . . . . . . . . . . . . . . . . . . . . . . . . . . . . . . . . . . 13
Figure 3: Results from the categorization of 26 EIO -Q members regarding
their improvement cultures. .. . . . . . . . . . . . . . . . . . . . . . . . . . . . . . . . . . . . . . . . . . . . . . . . . . . . . . . . . . . . . . . . . . . . . . . . . . . . . . . . . . . 22
Figure 4: Results from the categorization of 26 EIO -Q members regarding
their financial performance. .. . . . . . . . . . . . . . . . . . . . . . . . . . . . . . . . . . . . . . . . . . . . . . . . . . . . . . . . . . . . . . . . . . . . . . . . . . . . . . . . . . . 22
Figure 5: A combination of figure 3 and figure 4. .. . . . . . . . . . . . . . . . . . . . . . . . . . . . . . . . . . . . . . . . . . . . . . . 23
Figure A1: Plot of the Chi-square distribution. .. . . . . . . . . . . . . . . . . . . . . . . . . . . . . . . . . . . . . . . . . . . . . . . . . . . 35
Figure C1: Development of operating margin of the EIO group from the year
2006 to 2013. .. . . . . . . . . . . . . . . . . . . . . . . . . . . . . . . . . . . . . . . . . . . . . . . . . . . . . . . . . . . . . . . . . . . . . . . . . . . . . . . . . . . . . . . . . . . . . . . . . . . . . . . . . . . . . 40
Figure C2: Development of operating margin sorted by certification year. .. . 40
Figure D1: Continuous improvement efforts for 26 EIO -Q members for years
2013 and 2014. .. . . . . . . . . . . . . . . . . . . . . . . . . . . . . . . . . . . . . . . . . . . . . . . . . . . . . . . . . . . . . . . . . . . . . . . . . . . . . . . . . . . . . . . . . . . . . . . . . . . . . . . . . . 41

1
1. Introduction
The introduction firstly aims at providing an overview of the concept of continuous
improvement, its origin, and how it is viewed and adapted by different practitioners.
Secondly, the purpose of the thesis along with the research question is presented. The chapter
ends with stating the limitations for the thesis.
1.1 Background
The concept of continuous improvements (CI) adopts an approach to conduct work in a way
that improves performance through small, continuous arrangements or actions. Small
improvements have the benefit of easily being followed by other small improvements, thus
they may simplify the ability to create an optimal way of working towards a common goal
within organizations. It is therefore usually beneficial for organizations to implement the
concept of continuous improvements; (Slack & Lewis, 2011; Weitlaner, et. al., 2012). The
concept was first introduced in Japan in the early 1950s by the American quality pioneer W.
Edwards Deming. Deming encouraged the Japanese to adopt a systematic approach to
problem solving, which later became known as the Deming Cycle, or Plan-Do-Check-Act
(PDCA) cycle. The method was adopted by Toyota Motor Corporation and later became a
cornerstone in their work with continuous improvements. They called it “Kaizen”, which
directly translates to “ongoing changes to the better”. Today, the concept has expanded to
include improvement of processes, data collection and analyses, documentation, group
dynamics, self-managing and much more, (Liker, 2004).
Imai (1986) explains that the ideal type Kaizen is built on three principles:
Principle 1 – Process orientation
Improvement work should start at the processes. The idea is that sound processes where non
value-adding work is minimized create satisfactory results. Also, a process orientation where
focus lies on the activities and methods rather than outcomes, facilitates the use of employee
experience and common sense. However, for improvement work to be effective, a process
needs to be thoroughly understood. Interaction between people, machines, material and
information is complex and managing the variability and interdependency of such activities
requires commitment, knowledge and high participation from the employees. Management
should emphasize process improvements by stimulating and supporting the members of the
organization to engage in such work by providing the adequate skills and training.
In the spirit of the Deming-cycle, process orientated improvement work calls for evaluation
and follow up. This can act as an important catalyst for further process improvement as well
as increase the willingness and motivation amongst employees to keep improving. The
number of submitted suggestions and the rate of implementation and participation indicate the

2
efforts made by employees, but also the support given by management. This indicates that
Kaizen can be applied to monitor employee motivation, a property that, according to Berger
(1997), is partly overlooked in western adoptions of CI.
Principle 2 – Improving and maintaining standards
CI is a concept that emphasizes challenging the existing standards, and for small
improvements to accumulate to an overall performance contribution for the whole
organization, this process must be ongoing. Standards therefore need to be up to date and
maintained. “There can be no improvement where there are no standards", (Imai, 1986).
Standardization is also inherent in the PDCA-cycle. The problem solving wheel adopts a
simple approach to work with CI and to maintain standards. The “A” stands for “act”, which
denotes an organizational implementation of an improvement. This is generally the
responsibility of the middle management. Middle management is informed of the
improvement, usually via a suggestion system, and, provided the result is considered
satisfactory, formalizes the improvement by altering the existing standards, thereby closing
the PDCA-loop.
Lastly, standards contribute to employee competence and character through providing;
1. Individual authorization and responsibility.
2. Learning opportunities through interpersonal and interdepartmental knowledge
transfer.
3. Discipline, because standards are binding and all-encompassing.
Principle 3 – People orientation
Fundamental for Kaizen is the belief in peoples’ inherent desire for quality and value creation.
This intrinsic attribute combined with a managerial support and a reward system focused on
acknowledgement and praise is considered enough to create a high motivation to work with
continuous improvement.
High levels of participation from both managers and workers at the shop floor are
recommended in order for CI to be efficient. To succeed in engaging all employees, the
concept requires some contextualization. Improvement work should be conducted in all areas
of an organization, but different people, depending on e.g. hierarchy or skill, should engage in
different improvement activities.
Briefly mentioned above is management’s role in maintaining standards, but management
also has the responsibility, besides improving day to day operations such as machinery and
equipment, to gradually improve system processes such as planning and control, organization,

3
decision making and IT-systems. Kaizen on an individual level is associated with improving
one’s own work, on-the-spot method improvements and waste minimization. Improvement
work in groups takes another form, where quality control circles (QCCs) and smaller group
activities aimed at improving work methods, routines and procedures are dominating, see
section 3.2, “Creating and sustaining an improvement culture”.
1.1.1 Kaizen in the west
Improvement work in western companies has traditionally been seen as a managerial activity.
The employees have merely had the job of adopting or maintaining the improvements, never
to challenge them. An improvement culture can never take form with such an approach.
Kaizen should be considered a philosophy for improvement, not a tool for improvement, and
not a one-man-job. It should be integrated in the organizational culture as a natural way to
think and act, (Imai, 1986). Another common mistake in western companies is to view Kaizen
as an improvement system only. The concept is first and foremost a way to motivate and
incentivize the employees, in which recognition and merit for promotion is far more important
than monetary rewards. It is also a system for education. The most efficient way to learn
about one’s work is to analyze it and improve it. This creates motivation whereby the
improvement suggestions will keep coming as a natural continuation, (Berger, 1995).
Corresponding to Imai’s first principle, one way to facilitate this learning is to allocate
responsibility of processes. Weitlaner et. al. (2012) identified process ownership as an
important complement to continuous improvement when 840 Austrian service- and
manufacturing companies were investigated regarding their process ownership, continuous
process improvement, financial performance, and customer satisfaction. It was found that the
companies with high process ownership and a thoroughgoing improvement work had more
satisfied customers and performed better financially, and that continuous improvement work
had a direct correlation to profitability whereas process ownership to a larger extent positively
affected customer satisfaction.
1.2 Purpose
Research regarding the financial effects from CI is otherwise limited in academia. It is not
difficult to argue that increased productivity or reduced lead time, can contribute to financial
performance, but the relationship between continuous improvement work and financial
performance is nevertheless complex, especially in environments where immediate effects
from improvements are difficult to measure. The “C” in the PDCA-cycle stands for “check”.
The arrangement aims at following up and evaluating an improvement. It includes monitoring
and measuring. When improvements are of such nature that they indirectly contribute to
value, such as employee satisfaction, safety or even to some extent quality, the short term

4
effects can be difficult to measure and long term financial performance becomes more
relevant. This is often the case in the service sector.
The present study will investigate the impact a culture that encourages the work with
continuous improvements can have on companies’ financial performance. The purpose is
hence to identify a connection between continuous improvement work and financial
performance.
1.3 Research question
Can a relationship be found between continuous improvement work and increased financial
performance amongst organizations practicing such work?
1.4 Limitations
The study was carried out investigating one type of industry, the electrical contracting
industry. This provided uniformity to the study, since all study objects possess similar
characteristics. The study comprised investigation of members of the Electrical Installation
Organization (EIO), specifically those partaking in EIO’s quality scheme, EIO-Q. Only ISO
9001 certified small- to medium sized enterprises (SMEs) were included.
The overall result from improvement work was identified and correlated with the change in
company financial performance between consecutive years. Larger improvements and other
factors that could influence financial figures were not included in the analysis unless they
could be related to, or as a result of, a continuous improvement culture.
Differentiation of improvement efforts between companies were determined by selecting the
mean number of submitted suggestions per year and the mean rate of participation of
employees amongst the sample companies as reference point. Companies displaying results
above the mean in both aspects were considered likely to support the work with continuous
improvements.

5
2. Method
This chapter describes the research methodology used in the thesis. A deductive process was
adopted to answer the research question. Deductive research has its strength in testing theories
and hypothesis through subjecting these to empirical scrutiny, (Bryman & Bell, 2003).
Particularly for this thesis, the deductive research strategy is suited to attain knowledge of the
prerequisites and circumstances regarding continuous improvement in SMEs within the EIO.
Both quantitative and qualitative research was conducted to test the hypothesis and thereby
answer the research question. This integration of research methods is called multi-strategy
research, (Layder, D., 1993).
2.1 Quantitative analysis
The quantitative analysis was based on data from improvement work and financial figures
from 26 EIO-Q members, all of which met the criteria stated in the limitations section. Two
hypotheses were derived from the research question; a null hypothesis and an alternative
hypothesis. The null hypothesis stated that improvement culture and financial performance
are independent. The alternative hypothesis stated the opposite, i.e. that there is a dependency.
Pearson’s chi-square test of independence was used to statistically test the null hypothesis.
The method aims at determining the independence of two variables associated with one
sample, (The Concise Encyclopedia of Statistics, 2008). The sample consisted of 26
investigated companies within the EIO. The companies were categorized regarding their
improvement culture and their financial performance, and the categorical variables were the
presence or absence of an improvement culture and whether the companies where highly
financially successful or not. This created a two-times-two table.
It is often appropriate to use relative measurements when comparing companies’ financial
performance, and one common measurement is operating margin, i.e. operating profit over
turnover, (Skärvad & Olsson, 2009). The mean operating margin for the certified companies
was selected as a reference point in the evaluation, but other aspects were also taken into
consideration. Expanding companies that showed a continual operating margin above the
sample mean were considered highly financially successful. Expanding companies were
mapped by analyzing turnover development and increase in headcount. Companies that
decreased in headcount were considered less financially successful. There are two arguments
for taking a decreased headcount into consideration. Firstly, it was found that the general
demand for electrical installation work in Sweden may be high. Decreasing the workforce
under such circumstances was therefore considered alarming. Secondly, in 2014, the average
number of employees at the sample companies was 36. Therefore, continual layoffs may,
given the company size, correspond to a large percental decrease of the work force.
A change in fiscal year can render deviating results the year the change took place. Data of
division of fiscal year for each investigated company was therefore analyzed. The effects

6
from an improvement culture are only visible over time; (Martichenko, 2004; Jha et al.,
1996). Therefore, it was necessary to also examine financial performance over time. The
companies’ finances were analyzed over an economic cycle of five years. Conjectural effects
were therefore taken into consideration.
Two variables were selected to define a CI culture; rate of participation per year and number
of suggestions submitted per employee and year. Participation rate was defined as the
percentage of the employees that had, at any stage during an improvement errand, handled
that errand. The two variables captured both the frequency of suggestions and the employee
commitment, and therefore best indicated the presence of an improvement culture. The mean
participation and mean number of submitted suggestions from the 26 sample companies was
selected as a reference point for comparing improvement efforts.
When all companies had been categorized, the outcome was compared to a mathematically
expected outcome. The expected outcome was calculated by multiplying the total values for
each row with the total of each column, creating another two-times-two table. The probability
that the observed differences between the outcome and the expected outcome arose by chance
was then calculated using a particular probability distribution called the chi-square
distribution. The result validated or rejected the hypothesis.
2.2 Qualitative analysis
The Chi-square test can only determine a relationship between two variables, not the nature of
the relationship. It cannot prove that one variable is contingent on the other and is therefore
arguably insufficient to answer the research question. A complementary qualitative study was
therefore deemed necessary. The main purpose of the qualitative study was to support the
results from the statistical analysis through interviewing four selected companies. To allow
for an interesting comparison of the interview results, it was important that the chosen
companies displayed indices of an improvement culture but that their financial performance
differed. The research could have been conducted the other way around, examining
companies with high profitability and varying CI efforts, but the premise of the present study
was to evaluate the effects an improvement culture has on financial performance. Whether the
opposite relationship is forthcoming requires further research. The qualitative analysis
therefore took its starting point in investigating which companies displayed indices of an
improvement culture.
6 companies performed above the industry average with regards to participation rate and
submitted suggestions for year 2014, whereas 3 performed around the average; see the results
section for statistics regarding improvement work. The financial performance of all 9
companies was investigated whereupon 4 displayed clear financial trends, either related to
turnover or to operating margin. These companies were selected for the qualitative study.
In preparation for the interviews, a literature study was performed to accumulate knowledge
of how SMEs perform continuous improvement work and what the prerequisites of

7
succeeding with such work are. The study also comprised investigation of how the service
industry works with continuous improvements and how that differs from manufacturing
companies. Furthermore, the relevance of an ISO certification with regards to improvement
work was studied. This was relevant since all examined companies were ISO 9001 certified.
The concept of an improvement culture was also studied along with the impact suggestion
systems can have on such a culture. Understanding the above mentioned circumstances
allowed for relevant questions during the interviews. Hence, the research was conducted
deductively. The literature study also investigated previous research on the topic of quality
management, continuous improvements, and their connection to company success. Scientific
literature from books, journals and articles was used throughout the literature study.
Interviews were conducted in a semi-structured manner. The format allows the interviewer to
ask more leading and general questions – compared to a structured interview which in many
cases acts as an oral survey – thereby establishing a climate for discussion and opportunities
for complementing questions in response to significant replies, (Bryman and Bell, 2007). The
purpose of the interviews was to support the findings from the statistical analysis in order to
answer the research question, i.e. to investigate the integration of continuous improvement
work in company culture and to what extent this had affected the profitability. The research
question is complex because the work with continuous improvements needs to be isolated
from several other factors that can affect financial performance. Information regarding
company culture as well as financials was therefore best obtained through probing and
discussion. A semi-structured interview was therefore considered appropriate. The interview
guide is presented in appendix B.

8
3. Theory
This chapter presents a summary of the reviewed literature. It is divided into three parts. The
first part presents the concept of quality management and how it can be applied to small- and
medium sized companies. This is followed by an explanation of the ISO 9001 standards. The
second part presents the concept of an improvement culture and how such a culture can be
created and sustained. Lastly, a presentation of the electrical installation organization (EIO) is
presented. Brief information on EIOs quality management initiative, EIO-Q, is included.
3.1 Quality management
The Japanese definition of continuous improvements (CI), or Kaizen, implies “improvement
that involves everyone—both managers and workers—and entails relatively little expense”,
(Imai, 2012). A similar description is provided by Bessant et al. (1994), who argues that the
employee involvement and low costs can yield great benefits for any company adopting the
concept. This suggests that the work with continuous improvements does not depend on
resources nor type of organization, that is, the philosophy is context free. However,
continuous improvement work is recognized as a key ingredient in quality management;
(Bessant et al. 1994; Bergman & Klefsjö 2002; Temponi , 2005; Wood, 1997), and research
shows that the prerequisites to adopt quality management and establish a continuous
improvement culture may differ between size and type of organization. The following part of
the literature study will introduce quality management and cover continuous improvements in
the context of quality management work within small to medium sized service enterprises
(SMSEs).
3.1.1 The fundament of quality management
Quality management, henceforth denoted QM, is a concept for regulating and improving the
quality of organizations’ processes and products. Figure 1 displays the core values of QM,
developed by Bergman & Klefsjö (1995). There are naturally more models on QM, but they
all, almost exclusively in one way or another, contain the five elements displayed in figure 1.
The selected model is the simplest found and therefore henceforth referred to in the literature
review.
A quality management system (QMS) represents the methods, tools, routines and allocation of
responsibilities to support these core values, (Bergman & Klefsjö, 1995). A well implemented
QMS should contribute to achieving company goals and targets as well as to increased
customer satisfaction and profitability. It also provides additional benefits by giving external
parties, e.g. prospective suppliers and customers the possibility to learn more about the
organization’s work with quality, (Bergman & Klefsjö, 2002).

9
Figure 1: The core principles of quality management
3.1.2 Quality management in small- to medium sized enterprises
Small- to medium sized enterprises (SMEs) are defined as a range between 10 to 50
employees for small enterprises and between 50 to 250 employees for medium enterprises,
(European commission, 2005), and they make up for more than 95% of the worlds’
businesses, (ISO 9001 for small businesses, 2008). It is often stated that SMEs suffer from
resource limitations, but opinions differ regarding whether such limitations have any
significant effect on continuous improvement efforts, (Assarlind, M., 2014). For example,
Ghobadian and Gallear (1996) suggest that it is rather the engagement from top management
that determines the success of a CI initiative whereas Beheshti and Lollar (2003) and Bicheno
(2008) argue that the resource limitations themselves can act as an incentive to focus on
improvement work.
Assarlind (2014), on the other hand, points out two reasons why QM is more difficult to
establish in SMEs than in larger organizations. The first is that SMEs might not realize the
benefits that could come from QM, nor have the awareness of its methods and principles. The
second is the aforementioned resource scarcity amongst SMEs. External support is identified
as a critical factor for adoption of QM in SMEs. This implies costs for funding and for access
to competence through e.g. consultancy services, (Assarlind, 2014). Other associated costs are
production downtime for manufacturing companies and training of personnel. These costs
might deter SMEs from adopting QM and consequently implementing a thoroughgoing work

10
with continuous improvements, (Achanga et al., 2006). Deleryd et. al. (1999) also argue that
resource limitations can restrict SMEs from adopting QM. Contributing factors are lack of
knowledge, people and time.
3.1.3 Quality management in service companies
Researchers within service management, e.g. Zeithaml et. al. (1985) and Edvardsson &
Thomasson (1989), explain service through four characteristics:
Intangibility. Services are abstract and difficult to evaluate before they have been
acquired
Co-production. Services are often produced, delivered and consumed at the same time.
The customer specifies the service to a high degree.
Heterogenity. The customer participates in the production of the service which creates
variation in process and result.
Perishability. Services cannot usually be stored or saved.
There is no right way to define quality in services. What is important is that the definition
chosen is known by the entire service company and that it can be communicated both
internally between employees and externally to the customer, (Edvardsson, 1996). This is
further emphasized by Bicheno (2008), who recommends that service companies should try to
keep a holistic view of the value flow and recognize that there is a common purpose that
applies to everyone, that is, to improve the customer experience.
Customer expectations differ between service and manufacturing companies. Manufacturing
companies work according to specifications that allow them to set clear targets that can be
quantified and measured. In service companies, such specifications as well as customer
expectations are generally more unclear since they change more frequently. This means that
the quality management system must be designed to adapt to these changes, and that is a great
incentive to continuously improve, (Bicheno, 2008).
It also means that service companies generally work closely with their customers, as is
evident by the four characteristics. This facilitates certain room for experimentation with new
ideas. Service consumers can help evaluate improvement efforts and consequently influence
the value provided by the service. Due to the “co-production” characteristic, such evaluation
will be quicker for service than for manufacturing, (Bicheno, 2008). Similar conclusions have
been drawn earlier by Bitner (1991) who suggests that a crucial part of quality work in the
service business is the feedback from the customer. It is particularly important when the

11
nature of the service is repetitive and reoccurring since it is during such circumstances when
continuous improvement work yields the best results, (Bitner, 1991). However, improving ad
hoc is not sustainable. Improvements also need to be incorporated into the organization and
become standards, (Bicheno, 2008).
3.1.4 The ISO 9001 series
The ISO 9000 series, developed by the International Organization for Standardization (ISO),
is a set of standards for implementing and sustaining a QMS. A standard is, according to ISO,
“a document that provides requirements, specifications, guidelines or characteristics that can
be used consistently to ensure that materials, products, processes and services are fit for their
purpose.” The ISO standards therefore provide support for ensuring the safety, reliability and
quality of products and services. They act as a strategic tool for waste- and error
minimization, cutting costs and increasing productivity. Furthermore, a certificate can act as a
competitive advantage, both locally and globally. The ISO 9000 series took form in 1987 and
originates from US military standards, (Bergman & Klefsjö, 1995). ISO 9001 sets out the
requirements of a QMS, and over one million companies and organizations in over 170
countries have implemented ISO 9001 as of 2015 (www.iso.org).
Poksinska et. al. (2005) conducted a survey investigation of how ISO 9001 certified
companies in Sweden related to their quality management systems and their certificates. The
investigation showed that the main reasons that companies pursued certification were due to
demand from their customers and for marketing reasons. The participants also expected the
certification to result in improvements of their product and/or service. This was also a
contributing factor for application. When asked about the main function of their quality
management system, a majority of the companies stated that their system best represented a
tool for continually improving the organization. One tenth, (528 companies as of 2005), of all
certified companies were sent surveys and around one third replied, 82% of which were
SMEs.
Certificates are annually revised for renewal. This is important, but it also poses a risk.
According to a later study by Poksinska (2006), there is a tendency amongst companies to
focus too much on passing the revision and pay less attention to satisfying their customers and
establishing an improvement culture. Another common mistake is to only view certification
as a selling point. This could cause companies to overlook the actual benefits from a
certificate – implementing and sustaining a QMS.
Still, the certification seems to be overall advantageous. Another survey conducted at the
Norwegian Quality Association (NFK) investigated the effects from ISO 9001 certification.
316 NFK members – all private companies and a majority of which were SMEs – were
investigated. The results showed that those companies with ISO 9001 certification performed
better with regards to profitability than those without. This was mainly due to that the
certified companies were better at reducing quality related costs; (Hongyi, 2000).

12
Continuous improvement work is an important part of quality management. The ISO 9001
series includes standards on how to work with continuous improvements. However, the
standards alone cannot create an improvement culture; they can only provide the platform. It
is ultimately the leaders who must strive towards creating and sustaining an improvement
culture and also combine it with a process- and customer centric view. It is this combination
that can make companies great, (Bergman & Klefsjö, 1995).
3.2 Creating and sustaining an improvement culture
This section will cover the prerequisites for creating and sustaining an improvement culture as
well as some of the pitfalls and problems companies can face.
Woods (1997) defines culture as “the shared beliefs, values, attitudes, institutions, and
behavior patterns that characterize the members of a community or organization.” He states
that management plays a crucial role in forming an organizational culture. Only when the
culture is in place, the work with continuous improvements can become a natural part of the
organization. This will bring about more satisfied employees and customers, and, ultimately,
increase companies’ financial performance, (Woods, 1997).
The work with continuous improvements has long term benefits. Small individual
improvements usually have miniscule impact on organizational performance, but can together
over time result in significant process improvements. An improvement culture acts as an
inexpensive substitute to larger reformative work such as re-engineering, re-structuring, and
re-organization, (Martichenko 2004; Jha et. al., 1996). It is even suggested that organizations
that do not embrace continuous improvements risk developmental stagnation, (Cole, 2001).
3.2.1 Suggestion systems
In 1994, the best country, light-years ahead of the rest of the world, with regards to
submission of improvement suggestions per employee and year was Japan, which had an
average yearly rate of around 25 suggestions per employee. Sweden was number two with an
average of 0.32 suggestions, (Rydbrink, 1995). In 2013, the Swedish industry and commerce
had improved to around 1 suggestion per employee and year, (www.sifv.se).
This data can be derived from suggestion systems. The suggestion system is an American
invention, initially used by the U.S. Air Force, and brought to Japan after WW2. The Japanese
industry embraced the invention and integrated it with the Kaizen concept. By 1994, Japan’s
annual savings from suggestion systems was estimated to £ 2,600 per employee, compared to
the £ 65 savings in the second best country – Sweden, (Rydbrink, 1995).
The view on suggestion systems was different between U.S and Japan. Japanese industry saw
it as a means to boost morale and increase employee participation – much like the way Berger

13
(1995) describes Kaizen – whereas the U.S. saw suggestions as directly related to financial
performance, (Rydbrink, 1995). N.b. that the purpose of the present study is not to support the
U.S. view. A suggestion system cannot by itself yield increased financial performance.
Kanjiro Yamada, former managing director of the Japan Human Association, stresses the
importance of integrating the suggestion system in the company culture. This is done through
three stages:
1. Managerial support and emphasis on simplicity in the suggestions to create a broad
organizational commitment.
2. Education through the use of quality control tools and statistical methods to increase
problem solving abilities.
3. Focus on economic impact.
This process can take up to a decade, and patience and gradual progress is the recipe for
success, according to Yamada, who also states that the problem with most western companies
is that management skips the first two stages to start at the third, thereby defeating the
purpose of Kaizen, (Imai, 1986).
Figure 2: A simple set of arrangements to handle improvement errands. In this example, the suggestion has been submitted and awaits a decision.
An improvement culture is not necessarily reflected in the amount of suggestions submitted or
the rate of participation. It is a deeper concept build from the ground and inherent in the

14
organization. However, the road to cultural alignment within organizations can be rocky and
seemingly excellent improvement data can disguise the absence of a culture pretty well. Some
pitfalls and possibilities will be discussed below in relation to creating an improvement
culture.
3.2.2 The low-hanging fruit trap
During the initial phase of creating an improvement culture, it is usually easy and comfortable
to attack and solve the apparent problems – the low hanging fruits. This is not in itself a bad
approach and in line with Yamada’s first step. Such problems are usually urgent and solving
those yields immediate results and visible benefits. This can create enthusiasm around
improvement work amongst the employees, and is therefore a natural starting point in creating
an improvement culture. It is then important to harness this enthusiasm by fostering a
systematic approach to continuous improvement work and to build in competence around it.
This will sustain the culture. The pitfall lies in attacking these problems ad hoc without
creating the habits of working together systematically to improve. The enthusiasm will then
likely fizzle out and things will go back to normal. Increasing the autonomy and allocating
responsibility to the employees can act as a remedy to regain the enthusiasm for continuous
improvements, (Ahlström, J., 2014).
3.2.3 Quality circles
Another alternative to increase the interest in improvement work is to engage the employees
in quality circles (QCs). Quality circles are in essence people that on a regular basis set aside
time to discuss current problems and suggestions for improvements. Involving employees in
the improvement work increases their problem-solving abilities, their commitment as well as
their sense of ownership over company processes, (Goh, M. 2000). Since quality circles are
intended for smaller groups of people, usually within the same departmental division or
function, they have limited applicability in solving cross-departmental problems, (Sörqvist,
L., 2004). One might therefore argue that quality circles are particularly efficient in creating
an improvement culture within SMEs.
QCs originate from the successful Japanese concept of quality control circles (QCCs). The
implementation of the concept in the western world is however considered less successful.
The fact that the “control-aspect” has disappeared from QCCs could, according to Berger
(1997), imply that the management role and responsibility for controlling the quality has been
neglected by western organizations, resulting in unsustainable improvement work.

15
3.2.4 The emperor’s new clothes
In the classic story by Hans Christian Andersen, the emperor receives a suit promised by the
weavers to be invisible to those unfit their positions or incompetent. Naturally, since the
emperor is in fact naked, no one can see the suit, until a child points out the obvious. The
perfunctory behavior of the people in the story is also evident in organizations that deny or
have forgotten the purpose of continually improving. Such organizations put in a lot of effort
and resources into creating the right structure and to implement the right tools and methods,
but improvement work is conducted on the side, separate from the value-creating processes.
The improvement efforts can therefore look statistically excellent but result in little or no
increase in performance. To correct the situation it is important to go back to basics and
contemplate the core principles of quality management and how they apply to the
organization in question. Who are the external and internal customers, what do they want, and
what can be done to meet their needs? (Ahlström, J., 2014).
3.3 The Electrical Installation Organization (EIO)
EIO is a nonpolitical employer’s organization consisting of 2800 electrical contracting firms
in Sweden as of 2015. The organization was founded in 1906 and has since then worked
towards strengthening the competitiveness of its members and of the electrical engineering
trade. This is done through lobbying, formation of opinion and acting as a consultative body
in important industry-related matters. The member companies operate in a variety of fields,
e.g. telephony, construction, security, surveillance and more. A majority of the customer base
is part of the public sector, and business is conducted according to specific laws regarding
public procurement. As of 2015, the member companies collectively employ 26500 people
and 95% of the companies employ 25 people or less, (www.eio.se).
EIO has since the early 1990s offered a quality management system to its members called
EIO-Q. The system was developed by the current quality manager at EIO, who, during an
interview, explained that EIO-Q provide a set of guidelines and advice on how to work with
quality management. Included in this is an IT-system called System C2 which is used for
handling suggestions, surveys and a variety of errands and ultimately to help companies
establish an improvement culture. EIO-Q also prepares participants for ISO 9001 certification
and handles related administrative work. As of yet, around 50 of the EIO members utilize
EIO-Q, all of which are ISO 9001 certified. These companies are subject to investigation in
the present thesis.
Appendix C shows the development of operating margin of 1360 EIO members from the year
2006 to 2013. The electrical contracting industry is heavily project oriented. This means that
the commitment to the customer is usually long term. Effects from market conjunctures are
therefore generally delayed a while.

16
A previous investigation of the first four EIO-Q participants was conducted at Uppsala
University in 2008. The purpose of the study was to determine what results the ISO 9001
certification had yielded. A survey study as well as interviews with the CEO and quality
manager of each company was conducted. Surveys were sent out to employees in leading
positions in all pilot companies in order to investigate the rate of participation in the quality
work. One line of questioning was designed to establish the level of awareness of why the
certificate was pursued. Reoccurring answers were that it was expected to bring increased
quality, competence development, and structure and order. Many also stated that the
certificate was pursued due to customer demand and to provide benefits during public
procurements. The financial results from ISO 9001 certification were also analyzed, but no
precise figures could be presented during the interviews. All interviewees however concurred
that the income had increased, mainly due to better handling of customer reclamations and of
deviations from customer requirement specifications. In particular, System C2 had provided
opportunities to more accurately charge customers during such deviations and to quickly
respond to complaints. Costs had also been reduced due to continuous improvement work.
The improvement work was facilitated by an increased awareness of waste, that is, non-value
adding activities, amongst employees, (Lanner, L. & Neikter, C., 2008).
17
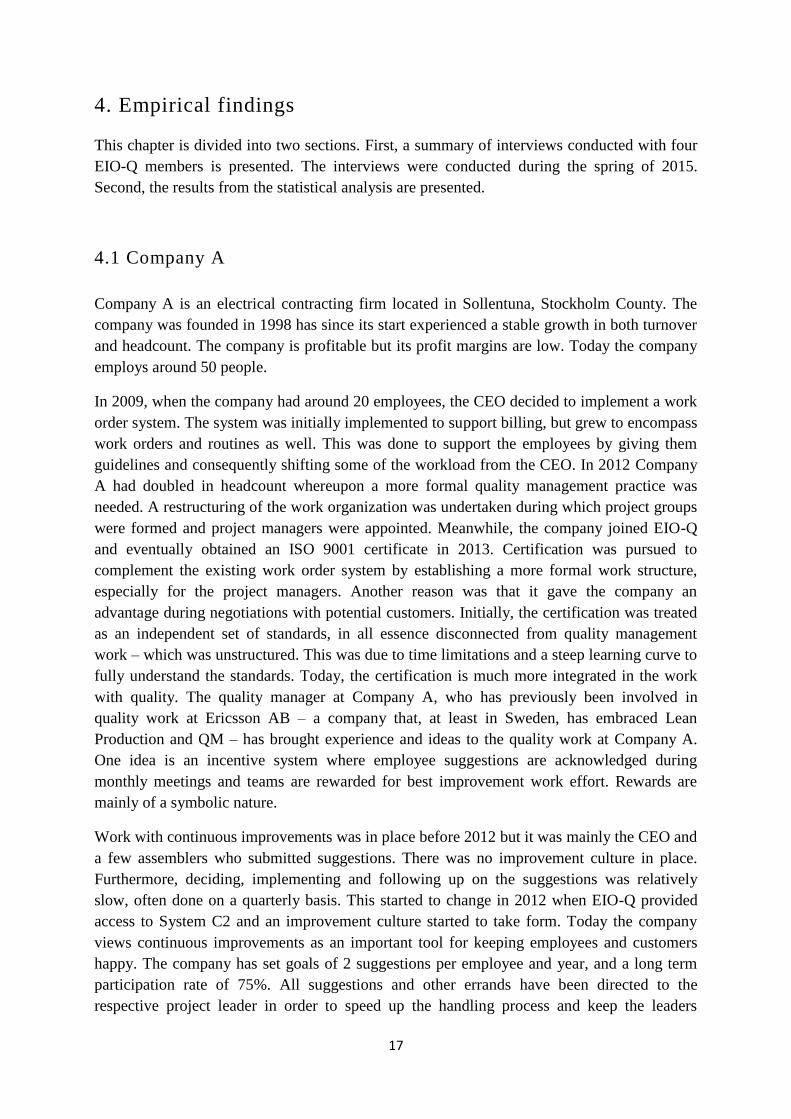
4. Empirical findings
This chapter is divided into two sections. First, a summary of interviews conducted with four
EIO-Q members is presented. The interviews were conducted during the spring of 2015.
Second, the results from the statistical analysis are presented.
4.1 Company A
Company A is an electrical contracting firm located in Sollentuna, Stockholm County. The
company was founded in 1998 has since its start experienced a stable growth in both turnover
and headcount. The company is profitable but its profit margins are low. Today the company
employs around 50 people.
In 2009, when the company had around 20 employees, the CEO decided to implement a work
order system. The system was initially implemented to support billing, but grew to encompass
work orders and routines as well. This was done to support the employees by giving them
guidelines and consequently shifting some of the workload from the CEO. In 2012 Company
A had doubled in headcount whereupon a more formal quality management practice was
needed. A restructuring of the work organization was undertaken during which project groups
were formed and project managers were appointed. Meanwhile, the company joined EIO-Q
and eventually obtained an ISO 9001 certificate in 2013. Certification was pursued to
complement the existing work order system by establishing a more formal work structure,
especially for the project managers. Another reason was that it gave the company an
advantage during negotiations with potential customers. Initially, the certification was treated
as an independent set of standards, in all essence disconnected from quality management
work – which was unstructured. This was due to time limitations and a steep learning curve to
fully understand the standards. Today, the certification is much more integrated in the work
with quality. The quality manager at Company A, who has previously been involved in
quality work at Ericsson AB – a company that, at least in Sweden, has embraced Lean
Production and QM – has brought experience and ideas to the quality work at Company A.
One idea is an incentive system where employee suggestions are acknowledged during
monthly meetings and teams are rewarded for best improvement work effort. Rewards are
mainly of a symbolic nature.
Work with continuous improvements was in place before 2012 but it was mainly the CEO and
a few assemblers who submitted suggestions. There was no improvement culture in place.
Furthermore, deciding, implementing and following up on the suggestions was relatively
slow, often done on a quarterly basis. This started to change in 2012 when EIO-Q provided
access to System C2 and an improvement culture started to take form. Today the company
views continuous improvements as an important tool for keeping employees and customers
happy. The company has set goals of 2 suggestions per employee and year, and a long term
participation rate of 75%. All suggestions and other errands have been directed to the
respective project leader in order to speed up the handling process and keep the leaders

18
continually informed. A time limit of 48 hours for deciding on errands has been set.
Employee and customer satisfaction is continually measured and the data indicates an
increase in both compared to 2012. Similarly, improvement suggestions are seldom made
with regards to direct cost cutting or increased profit but rather to maintain high employee and
customer satisfaction.
The work environment has improved significantly since the work with CI started. This is due
to efficient reporting of work related incidents and the new way of handling errands through
system C2. An area that still needs improvement is finance administration. The company
expansion is ongoing to meet the excess customer demand. This mismatch means that
customer demand cannot always fully be met and the company is forced to choose between
customers. The financial basis for making these decisions is today regarded as insufficient.
The quality manager sees no direct correlation between continuous improvement work and
financial performance.
4.2 Company B
Company B was founded in 1989. The company is located in Malmö and employs 20 people as of
2015. Company B offers a variety of services, from maintenance work to setting up new hardware
systems in e.g. telephony, lighting, surveillance and more. Its primary customers are companies and
housing cooperatives. The company business strategy is to establish long term relationships through
accurate deliveries and high quality.
The level of work with continuous improvements is statistically high with a participation rate of 46%
and 2.8 suggestions per employee and year as of 2014. The company is profitable, however the profit
and headcount decreased annually between 2010 and 2013.
Company B joined EIO-Q in 2012 and became ISO 9001 certified soon thereafter. Certification was
required by some customers and there was an opportunity to use it as a selling point. The management
also expected the changes to result in a more structured and organized work environment. The
attitudes towards these changes were, and still are, generally positive, especially amongst upper
management, who feel that the changes have brought the previously desired work structure and order.
There has however been some resistance towards the changes and a few people have decided to leave
the company. The overall employee satisfaction has nonetheless increased and the employee
satisfaction survey is used to detect and change eventual divergent attitudes, but the task is difficult,
according to the quality manager.
Administrative work has increased since the certification. This is currently seen as burdensome
amongst managers, especially during large scale projects where a lot of pre-work and learning is
required before getting started. It has even on occasion resulted in choosing ineffective work methods.
Long term benefits from documenting the work are however expected and creating guidelines for
specific types of projects is currently under consideration.
Work with continuous improvements started shortly after the EIO-Q membership. Suggestions are
much more frequently submitted now compared to 2012. The goal, which has been met, is to submit at
least 2 suggestions per employee and year. It is however usually the same group of people behind

19
submission suggestions, the CEO predominantly. The participation rate is high, 63% and 46% for
2013 and 2104 respectively, and the reason is that the management team is actively involved in
handling most suggestions. Conversely, the employees do not often partake in the improvement work.
The benefits from working with continuous improvements are hitherto; increased responsiveness and
participation amongst employees, a more structured workplace, and an increased customer
satisfaction, according to the CEO.
Company B has basically had the same customers for 20 years. This is however partly in line with the
company strategy. Although there is a desire to expand the customer base, lack of people and time are
currently restricting the company from taking on more work.
4.3 Company C
Company C is an old family-owned company, founded in 1918 and located in Skoby, outside
Stockholm. The company offers a broad set of services within electrical contracting. This
includes installations of lighting, alarm systems and computer networks. The company also
plans to expand within the field of renewable energy, specifically wind- and solar power, as
well as, along with a Swedish technical university, investigate the possibilities of installing
roads that could charge electrical cars. 25 people are currently employed and no further
expansion of the work force is planned. The company has an old and broad customer base,
Arlanda airport being the largest customer. Current resource limitations restrict the company
from acquiring new customers and the company is on occasion forced to decline work. There
is no economic basis for prioritizing what work to undertake other than that it is said to be
based on long term benefits. This is however planned to be arranged in the near future. The
mismatch between demand and resources is however a conscious choice from the CEO who
does not wish to expand beyond 25 employees. The reason is that he wants the company to
remain small and personal.
Company C performs above average with regards to continuous improvements as well as
turnover- and profit development over time. The CEO views work with continuous
improvements as a means to ease everyday work for the employees and keep the employee
satisfaction level high. It is important that the employees stay at Company C because
competence in electrical installation is valuable and costly to replace. Personal performance
reviews are conducted regularly to establish individual plans for development. Employees are
also able to partake in shorter educations in order to keep up with technical development and
be ahead of competition. Further efforts to create an improvement culture have been made by
investing in tablets for the employees. The purpose is to more easily provide information
regarding work orders and routines as well as to allow for submission of improvement
suggestions and material ordering. This has resulted in an increase in submitted improvement
suggestions. The company displays excellent improvement data. In 2013, the level of
participation and the number of submitted suggestions were 61% and 2.1 suggestions per
employee. Corresponding numbers for 2014 were 72% and 3.1. The company has no annual
goals for number of submitted suggestions or participation but the CEO welcomes a further

20
increase in both. The Company does however have clear measurable goals that are in
accordance with common ISO standards. That is, goals regarding work environment, quality
management, and environmental impact. Furthermore, identified areas that had potential for
improvement were; giving incentives, transportation routes, material ordering and finally that
the employees should strive to complete one project before starting another. Improving these
areas was also included in the annual company goals.
The company became ISO-certified in 2013. The initial purpose for certification was to gain
competitive advantage during public procurement processes. Today, the ISO standards are to
a larger extent integrated in the work and the benefits from the certification are, according to
the CEO, apparent. Teams have been formed and assigned specific work areas to uphold the
certificate and improve the organization in general. One of the teams is dedicated to sustain
and increase the work with continuous improvements. A few days per year are set aside as
improvement days. These days are dedicated to evaluate the company’s work with continuous
improvements and to discuss specific suggestions. Improvement work is also conducted to
minimize work related injuries, for example by clarifying safety regulations and making these
accessible and known to all employees or by arranging physical activities.
4.4 Company D
Company D was founded in 1990 and is located in Älvängen. Company D is an electrical
contracting firm that specializes in installation and maintenance of electrical- and computer
networks and solar cells. The company targets both industry and private housing. Headcount
has grown continuously since 1990, and reached 20 people in 2015. Company D acquired
Älvängens Installationsbyrå AB (ÄIAB), which is a firm consisting of four employees
specialized in electrical installation in industrial settings. The CEO however expresses his
desire that Company D should remain a small, flexible and personal company, and has set the
limit at 20 employees. To meet increased market demand, external workforce is utilized –
usually around 5 extra people at all times.
Over a ten year period, the company has had a profit margin of around 7% and approximately
doubled its turnover. The participation rate regarding improvement work has steadily declined
since 2010 from 33% to 17% in 2013. It did however increase somewhat in 2014,
corresponding to the average participation rate within the EIO-Q group, 24%. Submitted
suggestions per employee and year were 0.5 and 1 for 2013 and 2014 respectively. This
roughly corresponds to the Swedish national average as well as the EIO-Q group average. The
CEO commented that, these days, employees seldom have time to record their suggestions,
which are instead usually submitted verbally directly to the CEO, who records them
accordingly. Furthermore, the enthusiasm for improvement work was higher the first couple
of years following ISO9001 certification.
Company D obtained its ISO9001 certificate in 2007 which made the company amongst the
first within EIO to become certified. The certificate was pursued due to the competitive
21
advantage it was expected to bring during procurement processes. Today, the CEO claims
that the real benefit from the certificate lies internally. Employee satisfaction has increased,
work related incidents have decreased and a greater structure and order has been obtained.
Improvement work has also increased due to the ISO guidelines, which act as an inspirational
source for generating new improvement ideas. Nevertheless, the frequency of submitted
suggestions has historically been uneven and somewhat stagnated during the last three years.
The purpose of working with continuous improvements is, according to the CEO, to allow all
employees to gain a better understanding of the work processes.
The organizational structure has recently changed with the introduction of teams and informal
middle management. Each team is responsible for its own work area, e.g. computer network
installation, service and passage systems, or contracting. The purpose is for the employees to
specialize in one particular field. Each team has 4 days per year that are dedicated to quality
management. These occasions are used to follow up on improvement suggestions,
competence development and quality work in general. This has increased the autonomy
amongst the employees and therefore shifted some of the workload from the CEO to the
respective team leaders.
4.5 Results from the statistical analysis
One suggestion per employee and year was the average in 2013 for Swedish companies
(www.sifv.se). This is slightly below the average for the sample companies in 2013, which
was 1.28, but near equal to the average in 2014. The average participation rates for the sample
companies were 28% and 24% in 2013 and 2014 respectively. There is no collective data for
the average participation rate for companies in Sweden. These numbers may imply a decline
in the work with continuous improvements amongst electrical contractors but a longer
observation period is necessary for the establishment of a possible trend. Appendix D shows
the improvement efforts made by the 26 investigated companies for years 2013 and 2014.
The percentage distributions of improvement culture and financial performance from 26
investigated companies are presented separately in figure 3 and 4 respectively. The
distributions are roughly corresponding.

22
Figure 3: Results from the categorization of 26 EIO-Q members regarding their improvement cultures.
Figure 4: Results from the categorization of 26 EIO-Q members regarding their financial performance.
Figure 5 depicts the outcome of the quantitative analysis, and is a combination of figure 3 and
figure 4. 81% of the companies have financial performances corresponding to their
continuous improvement efforts, that is, corresponding to the alternative hypothesis. This
indicates a relationship. Whether this relationship is coincidental has been determined by
Pearson’s chi-square test of independence, presented in appendix A. The result from the test
shows that the probability that the observed data has occurred by chance is very low. At a
significance level of 0.01, the null hypothesis can be rejected in favor of the alternative
hypothesis, that is, continuous improvement and financial performance are associated.

23
Figure 5: A combination of figure 3 and figure 4.
The test does not determine the nature of the association, only that the two are associated. The
following analysis will determine this association through a triangulation of the statistical
analysis, the interviews and the literature study, whereby a final conclusion can be drawn.

24
5. Analysis
A deeper investigation of the four interviewed companies is presented below. Parallels are
drawn to the literature study whereupon the result from the statistical analysis will be
strengthened and the research question consequently answered.
5.1 Company A
Company A has slowly adapted to working with continuous improvement. In 2009 the
company implemented a work order system. The system was gradually developed to include
standard operating procedures. Referring back to Imai (1986), this is an essential part of the
PDCA-cycle. The expanded work order system resulted in a first step towards allocating
responsibilities to the employees. The second step was implemented in 2012, when project
groups were formed and project managers appointed. The work became more specific and the
process ownership increased. The positive effects from allocating responsibility as explained
by Imai (1986) and Ahlström (2014) are that it facilitates learning and enthusiasm for
improvement work. These arrangements likely created a benign environment for establishing
an improvement culture at Company A. ISO 9001 certification was merely the catalyst for
initiating continuous improvement. The improvement work started immediately in 2013,
displaying a high number of submitted and followed up suggestions and a high participation
rate. This indicates preparedness for working with CI, but also that the company has followed
Kanjiro Yamada’s advice, that the integration of a suggestion system, and consequently the
work with continuous improvement, into organizational culture is a gradual process that needs
to take time. However, at Company A the improvement work is seldom focused on economic
impact, which is the last stage in Yamada’s adaptation process, but rather to keep employees
and customers satisfied. This is arguably a natural approach for service companies because
they work according to customer specifications that frequently change. The customer centric
view at the company therefore corresponds to the recommendations made by Bicheno (2008)
and Bitner (1991) regarding the form for improvement work in service companies.
A downturn of the financial performance was seen for 2012 and 2013. One possible
contributing factor is the integration of the quality management system with the organization.
This endeavor required time and resources – the learning curve was steep, according to the
quality manager. Another contributing factor could be the work force expansion in 2013. The
company employed 10 additional people in 2013, expanding the work force by 35%. A new
employment is usually associated with long term benefits but also certain initial costs. For the
average electrical contracting firm, examples of such costs are additional service cars, tools,
equipment and costs for eventual training periods. The financial benefits from the expansion
were therefore likely delayed until 2014. The results for 2014 were in fact exceptional. The
company experienced a great upward swing in both turnover and operating margin, which had
increased by 23% and 2.7% respectively, compared to 2013. It is likely that the aggressive
expansion contributed to this result, but there are a couple of arguments against this being the
only reason. The first is that the company has expanded its work force continuously since its

25
start and no historical economic upswing of similar magnitude can be found. Secondly, the
company expanded the work force in 2014 as well, by 6 people, roughly corresponding to
15%. This likely also induced expenses and affected the financial result that year. It is
therefore reasonable to assume that the financial result in 2014 was not a consequence of the
expansion alone. The other significant organizational change was the integration of the
quality management system and consequently the introduction of continuous improvement.
Martichenko (2004) and Jha et. al. (1996) argued that the effects from an improvement culture
were only visible over time. The improvement culture at Company A took form in 2013, and
its financial benefits are likely reflected in the result from 2014.
5.2 Company B
The interview with the quality manager at Company B indicated that the improvement efforts
made were not sufficiently anchored in the organization. A goal of 2 submitted suggestions
per employee and year was set and also met. This is ambitious, but the purpose of working
with continuous improvement is to involve everybody to create a thriving and culturally
aligned organization working towards common goals, (Slack & Lewis, 2011; Weitlaner, et.
al., 2012). A majority of the improvement work was conducted by top management and no
goals concerning participation rate were presented. This corresponds to the general
westernized adaptation of CI but not to Imai’s vision of the concept. Structure, order and
employee responsiveness were identified as positive effects from the ISO9001 certification
and CI. These aspects are naturally important, but not particularly associated with continuous
improvement, given the reviewed literature. They rather indicate that the company has fallen
into the emperor’s new clothes-trap, i.e. the improvement work is conducted on the side,
separate from the value adding processes, (Ahlström, 2014).
Company B is undergoing an implementation of a quality management system following ISO
9001 certification in 2012. This process has been shaky. Administrative work has been
burdensome and the changes have partly caused the departure of 7 people, corresponding to
28%, from the company. This has made it difficult for the company to expand its customer
base.
The company’s financial results have declined continuously between year 2010 and 2013.
Profit and turnover have declined by 81% and 40% respectively. Therefore the company
cannot by definition be considered financially successful. No evident contributing factor was
presented to explain the declining financial results, but the above mentioned circumstances
are considered likely to have influenced the result. Assarlind’s (2014) argument that SMEs
generally have difficulties to implement QM seems true in the case of company B.

26
5.3 Company C
The improvement work at company C is mainly conducted with the purpose of simplifying
and improving everyday work for the employees. There are two reasons for this approach.
The first is that management values a high employee satisfaction to keep competence within
the organization. The second is the starting point that the employees themselves know best
how to improve their own work. Improvement suggestions submitted by employees are
considered to ultimately be beneficial to the end customer. Eventual costs associated are
therefore considered long term investments. These ideas correspond to Imai’s third principle.
That is, a belief in peoples’ inherent desire for quality and value creation, (Imai, 1986).
Further parallels to the reviewed literature can be drawn from the improvement work
conducted at company C. Investments in tablets have been made to increase enthusiasm for
improvement work while the focus on employee health, education, and the efforts made
towards personal development can be considered improvement work in itself, (Imai, 1986;
Bessant et al. 1994). The division of workforce into teams generally increases process
ownership, which is an important complement to CI, (Weitlaner et. al. 2012). Furthermore, a
form of quality circles have been implemented and facilitated by the teams, that is, the days
per year solely dedicated to improvement work. At Company C, areas in need of
improvement have been identified and yearly improvement goals have been set. CI
contributes to organizational alignment in the work towards common goals; (Slack & Lewis,
2011; Weitlaner, et. al., 2012). It is therefore arguably logical that unified improvement goals
align an organization in its improvement work.
Company C shows a continual above average operating margin of around 12% between 2010
and 2014 and is therefore considered highly financially successful. The best result was
obtained in 2014, one year after certification. The turnover had increased by 30% compared to
2013 which indicates that the company has successfully implemented its QMS. The result
also followed the increased participation and number of submitted suggestions between year
2013 and 2014.
5.4 Company D
The registered improvement work at Company D has been varying. The CEO almost
exclusively handled the suggestion system the first two years after certification. Improvement
work started to increase in 2010 and continued to stay relatively high for three years before
declining to current levels. Enthusiasm for improvement work can easily be lost after
attacking and solving the apparent problems – the low hanging fruits, (Ahlström, 2014). The
data indicates that this has occurred for Company D. The CEO however expresses that the
employees do not have the time to report all errands in the suggestion system. Instead most
suggestions are submitted verbally to the CEO. It is therefore natural that the data shows a
lower participation level, but the recorded submission of suggestions has also declined. If the
improvements are not recorded, it will become more difficult to follow up and evaluate their

27
effects as well as to update standards. The importance of maintaining standards is explained
by Imai (1986), in his second principle. The verbal approach with fewer recordings therefore
defeats the purpose of a suggestion system. It can also make the work with CI more tedious
and possibly inefficient.
Nevertheless, the company has the prerequisites to get back to their former improvement
levels. The increased autonomy provided by the recent formation of teams along with the
days set aside for quality management – in essence quality circles – should contribute to
creating an improvement culture. Perhaps the mediocre improvement levels in recent years
are the result of a combination of not fully utilizing the suggestion system and the seemingly
healthy organizational culture.
Company D has been ISO 9001 certified since 2007 and was one of the pilot companies
enrolled in EIO-Q. The turnover has more than doubled between 2005 and 2014. However a
33% decline in turnover can be seen between 2010 and 2012. The acquisition of the smaller
company in November 2011 affected the result for 2012 negatively, but the main reason,
according to the CEO, was a change in fiscal year, moving it back 2 months in 2012.
The company shows stable financial results and is considered highly financially successful,
given the definition stated in the methods section. It therefore becomes difficult to attribute
the work with CI to the financial result. No direct relation between continuous improvement
and financial performance can therefore be determined from the analysis of Company D.
5.5 General analysis
The statistical analysis showed that 94% of the less financially successful companies had not
implemented a CI culture, whereas 61 % of the highly successful companies had such a culture in
place. Overall the qualitative study supported the findings from the statistical analysis. For three out of
the four investigated companies the analysis indicated a relationship between continuous improvement
and financial performance. The qualitative analysis of Company A and Company C indicated a
positive correlation whereas the analysis of Company B indicated the opposite. These findings
supported the result from the statistical analysis. Company D was more difficult to analyze due to the
mediocre improvement work presently performed combined with the high financial performance.
However, it is not unlikely that the long term financial effects from continuous improvement work
may still be effective for Company D, due to its former improvement efforts, which were extensive.
Company D belongs to the 39 % of the highly successful companies that had a mediocre CI culture
during the investigated 5 year period.
The common factor for the three financially successful companies; A, C and D, was that the work with
CI was performed to increase employee satisfaction. No company conducted CI with the main purpose
of cutting cost or increasing profit; improvements were seldom of a direct financial nature.
Management’s engagement in CI was high for company A and C. An understanding of the concept
and its purpose was obvious during the interviews. For both companies, the work with CI followed
Imai’s three principles.

28
6. Discussion
The present chapter presents a reflection regarding particular areas of the study that might
question the trustworthiness of the method and the result. These areas are scrutinized and
defended.
6.1 Reflections on trustworthiness
It is desirable to have a high rate of participation but it does not necessarily mean that an
improvement culture exists. Suggestions can for example be submitted by the same group of
people every time but decided on, implemented and followed up by various other people.
Such a scenario could result in a high rate of participation without an actual improvement
culture. The data examined in the present paper only shows the total participation per year of
the investigated companies. It does not show individual contributions to improvement
errands. It is therefore difficult to determine if a CI culture exists only by examining this type
of data. N.b. that an improvement culture is reflected in the mindset and ways of working
amongst the employees. Hence, the data alone cannot prove that such a culture exists; it can
only point towards the probability that it does or does not. Nonetheless, the statistical analysis
is most likely correct, with the proviso that errors in categorization of individual companies
might be present. The size of the sample should mitigate the effects from categorization errors
because a large majority of the companies displayed clear indications one way or the other.
Also, one such error was also found via the interviews. The error concerned company B and
warranted a revision of the statistical analysis.
The competitive situation of each company has not been examined. Many companies are
located in smaller rural towns or suburbs. This means that two or more firms within the same
area may compete for the same customers. How this effected the analysis is subject to further
investigation. However all interviewed companies proclaimed that the demand was generally
greater than the supply. This was true for Company B that is located in Malmö, where
competition is fierce, as well as for Company C, competing with a handful others in a rural
town outside Gothenburg, and utilizing an external workforce of 20% to meet the excess
customer demand. It was also the case for Company C and Company B, which operate in
smaller adjacent suburbs in the northern part of Stockholm County. Direct competition did
however occur between the two during an important public procurement that Company B won
on coin-flip! In any event, the four companies are representative for the EIO.
There are also internal factors that can affect the financial performance. Reinvestment of
capital for competence development is one example. External education such as conferences
or courses as well as competence development within the company such as trainee programs
are costly arrangements that can show short term set-backs in the annual reports. Similarly,
ISO-certification is in essence an investment for competence development. This is costly, and
may significantly change short term financial performance, especially for companies with
small margins. It is difficult to assess the costs associated with competence development, but

29
perhaps that is not the point. Competence development likely indicates a desire to change and
to stay ahead. It should from that perspective be considered a part of continuous
improvement. It is therefore arguably the associated long term benefits and not the costs that
are interesting. The financial investigation performed in this study spans over five years, and
is considered likely to capture the benefits from competence development, conditional upon it
being continuous.

30
7. Conclusion
The findings of the thesis were based on a statistical analysis and they were supported by a
literature review and four case studies. The purpose was to determine a relationship between
continuous improvement work and financial performance.
The research showed that any small- to medium sized electrical contracting firm can benefit
financially from adopting continuous improvement. It was found that the presence of an
improvement culture had an impact on the financial performance during the 5-year period
studied. For the interviewed companies that had embraced the concept, it took one year for
the financial effects to show.
For the average electrical contracting firm, management played a crucial role in creating and
sustaining an improvement culture. A suggestion system provided a structured way of
working with CI and complemented an improvement culture well, but only if it was combined
with managerial support, competence development and working with the PDCA-cycle.
7.1 Implications for practice
Employee satisfaction was a common key performance indicator in the electrical contracting
industry. Adaptation of CI could support high employee satisfaction and consequently allow
for employee engagement in the improvement work. Imai’s (1986) third principle may
therefore be particularly important for the electrical contracting industry.
The research indicated that resources in terms of time, people and money were limited in the
electrical contracting industry. Therefore, implementation of continuous improvement work
may be of particular importance for this industry, since it may free up resources in the long
run and consequently positively affect the financial performance. It may also allow for
maintaining the company financially successful while keeping it small and personal, which
was a goal for the owners of some of the companies investigated.
7.2 Future research
This study has focused on the Swedish electrical contracting industry. It would be interesting
to apply the research question to other types of industries, both service- and manufacturing
oriented. Similar studies could also be performed on larger companies. The present study
could for such purposes be used in a broader meta-analysis.
The statistical analysis could be refined. A longer observation period and an increased sample
size may increase the accuracy of the results. For a more extensive analysis, additional
categories regarding financial performance and continuous improvement work could be
included. Finally, other statistical methods could be used to answer the research question. A

31
canonical-correlation analysis is an example of one such method that has not been discussed
in this thesis.

32
References
Achanga, P., Shehab, E., Roy, R., & Nelder, G. (2006). Critical success factors for lean
implementation within SMEs. Journal of Manufacturing Technology Management, 17(4),
460-471.
Ahlström, J., (2014), How to succeed with continuous improvement – A primer for becoming
the best in the world
Beheshti, H. M., & Lollar, J. G. (2003). An empirical study of US SMEs using TQM. Total
Quality Management & Business Excellence, 14(8), 839-847.
Berger, A., (1995). The Effects of Kaizen. A Journey in Japanese Kaizen, The Swedish Work
Environment Fund. Tierps Tryckeri – Partner Print, Sweden.
Berger, A., (1997), Continuous improvement and kaizen: standardization and organizational
designs. Integrated Manufacturing Systems, Vol. 8.2, pp. 110-117.
Bergman, B. & Klefsjö, B., (1995), 2nd Ed, Kvalitet – från behov till användning.
Bergman B. & Klefsjö B., (2002), Kvalitet i alla led, Lund: Studentlitteratur
Bessant, J., Caffym, S., Harding, R. and Webb, S. (1994), “Rediscovering continuous
improvement”, Technovation, Vol. 14 No. 1, pp. 17-29.
Bicheno, J., (2008), The Lean Toolbox for Service Systems, Lean Enterprises Research
Center, Cardiff Business School and University of Buckingham, Ch 1.
Bryman, A., & Bell, E. (2007). Business Research Methods. Oxford: Oxford University Press.
Cole, R. (2001), “From continuous improvement to continuous innovation”, Quality
Management Journal, Vol. 8 No. 4, pp. 7-20.
Deleryd, M. et al, eds. / Edvardsson, B. & Gustafsson, A., (1999), Possibilities, obstacles and
tools for implementing TQM in small and medium-sized enterprises. Lund: Student
litterature, 160-168.
Edvardsson, B., (1996), Kvalitet och tjänsteutveckling.
Edvardsson, B. & Thomasson, B., (1989), Kvalitetsutveckling i privata och offentliga
tjänsteföretag, Natur och Kultur, Stockholm
European commission, (2005), the new SME definition.
Ghobadian, A., & Gallear, D. N. (1996). Total quality management in SMEs. Omega, 24(1),
83-106.
Goh, M. (2000), “Quality circles: journey of an Asian public enterprise”, International Journal
of Quality and Reliability Management, Vol. 17 No. 7, pp. 784-99.

33
Hongyi, S., (2000), Total quality management, ISO 9000 certification and performance
improvement. International Journal of Quality & Reliability Management, Vol 17(2), pp 168-
179.
Imai, M., (2012), Gemba Kaizen: A Commonsense Approach to a Continuous Improvement
Strategy, 2nd Ed, Ch 1.
Imai, M., (1986), Kaizen: The Key To Japan's Competitive Success
ISO 9001 for small businesses – what to do, advice from ISO/TC 176, (2008), 3d Ed.
Jha, S., Noori, H. and Michela, J. (1996), “The dynamics of continuous improvement.
Aligning organizational attributes and activities for quality and productivity”, International
Journal of Quality Science, Vol. 1 No. 1, pp. 19-47.
Lanner, L., & Neikter, C., (2008) ISO 9001 certifiering av Elektriska
Installatörsorganisationen EIO:s medlemsföretag, Ständiga förbättringar eller ständig
dokumentering?
Layder, D. (1993), New Strategies in Social Research (Cambridge: Polity).
Liker, J. (2004). The Toyota way – 14 management principles from the world’s greatest
manufacturer.
Martichenko, R. (2004), “What’s the problem with continuous improvement?”, Logistics
Quarterly, Vol. 10 No. 4, November.
Poksinska, B., Eklund, J., Dahlgaard Jörn, J., (2005), Är certifieringsrevisioner
värdeskapande? Sammanfattning av resultaten från en enkätundersökning. Avdelningen för
kvalitetstekink, Linköpings universitet.
Poksinska, B., (2006). ”ISO 9000: business as usual or radical change? – Experiences from
Swedish organizations”, doktorsavhandling, Linköpings universitet.
Rydbrink, C., (1995), Suggestion Systems as a part of a TQM strategy, Master’s thesis at
Linköping University, Linköping, Sweden.
Slack, N. & Lewis, M., (2011), Operations strategy, 3d ed.
Skärvad P-H. & Olsson, J., (2009), Företagsekonomi 100, 14th ed.
Sörqvist, L., (2004), Ständiga förbättringar, Issue 1:6, studentlitteratur AB, Lund
Temponi, C. (2005), “Continuous improvement framework: implications for academia”,
Quality Assurance in Education, Vol. 13 No. 1, pp. 17-36.
The Concise Encyclopedia of Statistics, (2008), Chi-square Test of Independence, pp. 79-82.

34
Weitlaner, D. et. al., (2012), The joint impact of process ownership and continuous process
improvement on financial performance and customer satisfaction. IEEE International
Conference on Industrial Engineering and Engineering Management.
Woods, J., A., (1997) “The six values of a quality culture”, National productivity review, Vol
16, No. 2, p 49-55.
Zeithaml, V., Parasuraman, A. & Berry, L., (1985) Problems and strategies in services
marketing, Journal of marketing, Vol 49(1), pp 34-46
Online sources
http://www.iso.org/iso/home/standards/management-standards/iso_9000.htm [2015-02-23]
http://www.eio.se/omeio/Sidor/default.aspx [2015-02-18]
www.eio-q.se [2015-05-07]
http://www.sifv.se/statistik.html [2015-03-04]

35
Appendix A
The chi-square distribution
The Chi-square distribution is a continuous probability distribution. If Z is a standard normal
random variable, then 𝑍2 is distributed according to the chi-square distribution with one
degree of freedom.
Similarly, the sum 𝑍12 + 𝑍2
2 + 𝑍32 … 𝑍𝑘
2 has a chi-square distribution with k degrees of
freedom. The degrees of freedom are the amount of system parameters that may vary
independently.
Figure 1 shows the chi-square distribution for 1 to 5 degrees of freedom. The chi-square
distribution is the result of a probability density function, values of which correspond to the y-
axis. This function will not be discussed further. The x-axis corresponds to the chi-square
values, or the 𝑋2-values. How to calculate the 𝑋2-value will be shown in the next section.
The area underneath the curve to the right of the calculated 𝑋2-value, given the degrees of
freedom, corresponds to the probability that the outcome of the observed sample is
coincidental and its variables independent. A high 𝑋2-value gives a small area and therefore
also a low probability. This would support the alternative hypothesis. The area is however
cumbersome to calculate numerically. Instead, a table containing the set probability values
will be used for this study, see table 2.
Figure A1: Plot of the Chi-square distribution for values of k={1,2,3,4,5}.

36
The following part will determine the probability that the observed outcome from
investigating 26 EIO-Q members regarding their financial performance and their
improvement cultures is coincidental.
Pearson’s chi-square test of independence
The following hypotheses were tested:
H0: Improvement culture and financial performance are independent.
H1: Improvement culture and financial performance are associated.
Table A1: The table shows the outcome from the categorization of 26 EIO-Q members along with the expected outcome.
Improvement culture No improvement culture Total
Highly financially successful 6
4
10
Expected
2.69
7.31
38.46%
Less financially successful 1
15
16
Expected
4.31
11.69
61.54%
Total
7
19
26
Assuming a normally distributed sample, i.e. assuming that the null hypothesis is true, the
expected outcome is calculated as; 𝑅𝑖 ∗𝐶𝑗
𝑁, where 𝑅𝑖 and 𝐶𝑗 represent the row and column totals
and N the grand total.
The chi-square value is defined as:
𝑋2 = ∑ ∑(𝑂𝑖𝑗 − 𝐸𝑖𝑗)2
𝐸𝑖𝑗 =
(6 − 2.69)2
2.69 +
(4 − 7.31)2
7.31 +
(1 − 4.31)2
4.31 +
(15 − 11.69)2
11.69= 9.05
Since table 2 will be used instead of a numerical calculation, the probability level can be
chosen. In this test the probability level was set to 0.01.
The degrees of freedom are calculated as:
𝑘 = (𝛴𝑅𝑖 − 1) ∗ (𝛴𝐶𝑗 − 1) = (2 − 1) ∗ (2 − 1) = 1

37
With one degree of freedom, the probability that the 𝑋2-value is larger than 6.63 is 1%. The
calculated 𝑋2-value was 9.01. Therefore the null hypothesis can be rejected in favor of the
alternative hypothesis, i.e. continuous improvement and financial performance are associated.
Table A2: Percentage points of the chi-square distribution.

38
Appendix B
The interview guide provides a platform for discussion regarding quality management and
continuous improvement.
This guide will provide information on how to conduct an interview with a company to
evaluate how they work with continuous improvement. The guide will also include discussion
points on quality management and ISO 9001-certification.
Purpose: The purpose is to facilitate an interview format where reasoning and
discussion around continuous improvement is encouraged.
Scope, time frame and limitations: Interviews with four companies will be
conducted. The interviews will not exceed one hour.
Ethical aspects: Eventual sensitive information obtained will not be disclosed to
others outside the scope of the Masters’ thesis project unless permission is granted by
the concerned party. The interviewed companies will be anonymous in the report.
Method: A semi-structured format will be used for the interviews. Relevant
information will be transcribed by hand. Complementary interviews by phone may be
required.
Validity of questions: A literature review regarding continuous improvements will be
performed prior to the interviews in order to increase the understanding of continuous
improvement in small- to medium sized service enterprises (SMSEs).

39
Questions and discussion points
Introduction
Personal background
Work responsibilities
EIO-Q and ISO 9001 certification
Purpose with EIO-Q membership
Purpose with ISO 9001 certification
Effects from ISO 9001 certification
Continuous improvement
Personal approach
Influence on daily work
Company approach
Employee attitudes
General effects from continuous improvement
Identification of improvement areas
Improvement statistics
Financial effects from continuous improvement
Improvement goals

40
Appendix C
Figure C1: Development of operating margin of the EIO group from the year 2006 to 2013. 1360 member companies are included.
Figure C2: Development of operating margin sorted by certification year. 50 EIO-Q members companies are included.
0
1
2
3
4
5
6
7
5,02006
6,12007
6,12008
5,42009
4,752010
5,862011
5,852012
5,182013
Development of operating margin
-2,0
0,0
2,0
4,0
6,0
8,0
10,0
12,0
2006 2007 2008 2009 2010 2011 2012 2013
Operating margin
Industry
All cert
Cert 2007
Cert 2008
Cert 2009
Cert 2010
Cert 2011
Cert 2012
Cert 2013

41
Appendix D
Figure D1: Continuous improvement efforts from 26 EIO-Q members for years 2013 and 2014. The four investigated companies are highlighted.