
The Financial Determinants of Operating Efficiency for Low...
17
Journal of Finance and Bank Management December 2015, Vol. 3, No. 2, pp. 07-23 ISSN: 2333-6064 (Print), 2333-6072 (Online) Copyright © The Author(s). All Rights Reserved. Published by American Research Institute for Policy Development DOI: 10.15640/jfbm.v3n2a2 URL: http://dx.doi.org/10.15640/jfbm.v3n2a2 The Financial Determinants of Operating Efficiency for Low and High Competitive Banks in Egypt Tarek Eldomiaty 1 , Ahmed Fikri 2 , Wael Mostafa 3 & Hager H. M. Amer 4 Abstract Purpose: This study examines the contribution of Egyptian banks’ financial aspects to their operating efficiency. The study introduces a link between banks’ relative competitive positions and operating efficiency by examining the financial profile of high versus low competitive banks. Design/methodology/approach: The statistical method utilizes the benefits of the Partial Adjustment Model, which measures the extent to which bank financial performance affects its operating efficiency. The sample includes 24 commercial banks covering the period 2001-2008. Findings: The results show that: (a) in the high competitive banks, operating efficiency is positively and significantly affected by banks’ asset quality, capital adequacy, credit risk, and liquidity. These results offer clear evidence that high competitive banks in Egypt are distinguished from low competitive banks by carefully designed financial policies. Originality/value: To the best of the authors’ knowledge, this study contributes to the relevant literature in that it examines a practical relationship between banks’ competitiveness and operating efficiency. Keywords: Bank operating efficiency, bank competitiveness, market share, Egypt, Paper type: Research paper Introduction It is widely recognized that banks’ operating efficiency is a driving forcein their performance. Banks in developing countries are much concerned with their operating efficiency in particular because financial development is not peculiar to a certain economy but indeed guided by universal guidelines. World banks are, for example, guided by the Basel regulationsor Basel guidelines, which call for banks in developing countries to examine their operating efficiencycontinuously to keep pace with their counterparts in developed economies.This studyexamines the issue of operating efficiency by creating a link between banks’ operating efficiency and their competitiveness. The authors use banks’ market shares as measures of competitiveness. The understanding is that competitive banks have a higher relative market share than other,low competitive banks. Market share is measured by the relative ratio of bank net interest revenue to the total net interest revenue for all banks. This is a well-known measure of the relative market share of financial institutions.The orientation of this study is based on the understanding that improvements in bank operating efficiency help the bank expand its market share. 1 Misr International University, Faculty of Business Administration and International Trade, PO Box1 – Postal Code 11341, Cairo, EGYPT. Tel: +02 (2) 4477 1560, Fax: +02 (2) 4477 1566, E-mail: [email protected] 2 Misr International University, Faculty of Business Administration and International Trade, PO Box1 – Postal Code 11341, Cairo, EGYPT. Tel: +02 (2) 4477 1560, Fax: +02 (2) 4477 1566, E-mail: [email protected] 3 Misr International University, Faculty of Business Administration& International Trade, PO Box: 1–Heliopolis 11341 Egypt. E-mail: [email protected] 4 Arab African International Bank, Egypt. E-mail: [email protected]
Transcript of The Financial Determinants of Operating Efficiency for Low...

Journal of Finance and Bank Management December 2015, Vol. 3, No. 2, pp. 07-23
ISSN: 2333-6064 (Print), 2333-6072 (Online) Copyright © The Author(s). All Rights Reserved.
Published by American Research Institute for Policy Development DOI: 10.15640/jfbm.v3n2a2
URL: http://dx.doi.org/10.15640/jfbm.v3n2a2
The Financial Determinants of Operating Efficiency for Low and High Competitive Banks in Egypt
Tarek Eldomiaty1, Ahmed Fikri2, Wael Mostafa3 & Hager H. M. Amer4
Abstract
Purpose: This study examines the contribution of Egyptian banks’ financial aspects to their operating efficiency. The study introduces a link between banks’ relative competitive positions and operating efficiency by examining the financial profile of high versus low competitive banks. Design/methodology/approach: The statistical method utilizes the benefits of the Partial Adjustment Model, which measures the extent to which bank financial performance affects its operating efficiency. The sample includes 24 commercial banks covering the period 2001-2008. Findings: The results show that: (a) in the high competitive banks, operating efficiency is positively and significantly affected by banks’ asset quality, capital adequacy, credit risk, and liquidity. These results offer clear evidence that high competitive banks in Egypt are distinguished from low competitive banks by carefully designed financial policies. Originality/value: To the best of the authors’ knowledge, this study contributes to the relevant literature in that it examines a practical relationship between banks’ competitiveness and operating efficiency.
Keywords: Bank operating efficiency, bank competitiveness, market share, Egypt, Paper type: Research paper
Introduction
It is widely recognized that banks’ operating efficiency is a driving forcein their performance. Banks in developing countries are much concerned with their operating efficiency in particular because financial development is not peculiar to a certain economy but indeed guided by universal guidelines. World banks are, for example, guided by the Basel regulationsor Basel guidelines, which call for banks in developing countries to examine their operating efficiencycontinuously to keep pace with their counterparts in developed economies.This studyexamines the issue of operating efficiency by creating a link between banks’ operating efficiency and their competitiveness. The authors use banks’ market shares as measures of competitiveness. The understanding is that competitive banks have a higher relative market share than other,low competitive banks. Market share is measured by the relative ratio of bank net interest revenue to the total net interest revenue for all banks. This is a well-known measure of the relative market share of financial institutions.The orientation of this study is based on the understanding that improvements in bank operating efficiency help the bank expand its market share.
1 Misr International University, Faculty of Business Administration and International Trade, PO Box1 – Postal Code 11341, Cairo, EGYPT. Tel: +02 (2) 4477 1560, Fax: +02 (2) 4477 1566, E-mail: [email protected] 2 Misr International University, Faculty of Business Administration and International Trade, PO Box1 – Postal Code 11341, Cairo, EGYPT. Tel: +02 (2) 4477 1560, Fax: +02 (2) 4477 1566, E-mail: [email protected] 3 Misr International University, Faculty of Business Administration& International Trade, PO Box: 1–Heliopolis 11341 Egypt. E-mail: [email protected] 4 Arab African International Bank, Egypt. E-mail: [email protected]
8 Journal of Finance and Bank Management, Vol. 3(2), December 2015 1. Objectives of the Study
This study aims at offering a practical answer to the question that follows. How do competitive banks improve operating efficiency? The authors examine the answer to this question by using data about rated commercial banks in Egypt. The objective of the study is to identify robust financial determinants of operating efficiency for highcompetitive versus lowcompetitive banks. In this case, bank financial performance is examined by using the well-known categories of financial ratios such as asset quality, capital adequacy, credit risk, liquidity, and profitability.
2. Contribution of the Study
This research contributes to the current literature as follows.
a. This studyexamines bank operating efficiency by linking it to the bank’s relative competitive position in the market. This orientation has not been examined thoroughly in the relevant literature.
b. To the best of authors’ knowledge, this study is the first one in Egypt to examine the relationship between bank operating efficiency, bank financial performance, and relative competitive position. Accordingly, the expected results of this study provide guidance to bank managers on how to improve operating efficiency and market share.
The study is organized as follows: Section 4reviews evolution and developments in the Egyptian banking sector. Section 5 discusses the relevant literature on the determinants of competitiveness and efficiency in the banking sector. Section 6 describes the data and the statistical methods. Section 7 discusses the results. Section 8 concludes. 3. The Banking Sector in Egypt
The Egyptian financial sector is well established and huge. It provides a variety of financial services that range from commercial banking, insurance, and mortgage lending to financial advisory services. The vast majority of Egyptians (approximately 77,307,143 people)5 use consumer banking and insurance services. This is not the case for the mortgage market, which is still in its infancy. The Central Bank of Egypt (CBE) is the main regulatory body that is responsible for regulation and management of the banking sector and the monetary system in general. CBE has established general rules and guidelines to keep the Egyptian banking industry safe and sound. One of these rules is that the primary capital should be at least 50% of the capital adequacy ratio. In addition, the provisions for general banking risks should not exceed 1.25% of the risk-weighted assets. Moreover, subordinate loans should account for no more than 50% of primary capital. In April 2003, the Egyptian banking sector included 57 banks classified as follows: 28 commercial banks (of which 4 are state-owned banks6), 26 investment banks (of which 11 are joint venture banks and 15 foreign banks), and 3 other specialized banks. Because of privatization of governmental banks, consolidation of smaller banks,a series of acquisitions, mergers, and revocation of licenses of banks that do not comply with the capital adequacy constraints of Basel Accord II, the number of Egyptian banks has been reduced to 37 banks in 2010.
These are classified as follows: 24 commercial, 1 real estate and mortgage, 3 investment banks, 3 Islamic banks, 5 specialized governmental credit institutions, and 1 bank holding company7.The state-owned banks’ shares in 15 joint-venture banks, which account for 20% of the system’s assets, also were divested.8In spite of the fact that the Egyptian financial sector is not as well established as those in other developed countries, it is obvious that the Egyptian banking sector plays a crucial role in terms of the sector’s contribution to overall economic growth. The Egyptian banking sector commands more than 60% of the financial assets in the economy. The deposits-to-GDP ratio reached nearly 100% as of June 2008 (Poshakwale and Qian, 2009). This percentage is much higher than the world average and substantially higher than in many developed economies.
5http://www.trueknowledge.com/q/what_is_the_population_of_egypt_2010 6 National Bank of Egypt, Banque du Caire, Banque Misr, and Bank of Alexandria 7 Based on the Bankscope database,which contains financial statements and data from more than 11,000 public and private banks worldwide 8This includes the four largest holdings, namely, National Société Générale Bank (NSGB), Misr International Bank (MIBank), Egyptian American Bank (EAB), and Commercial International Bank (CIB).

Eldomiaty et. al. 9
However, a small portion of the deposits are channeled to finance real and privately owned enterprises butare allocated mainly to finance government deficit or to extend loans for unsuccessful state-owned enterprises. Banks, especially state-owned banks, use a huge amount of the deposits to invest in treasury bills and government bonds, holding about 91% and 70% of the outstanding amounts respectively, as of June 2008. Consequently, small and medium-sized enterprises (SMEs), which are the majority of Egyptian firms, depend on informal markets and/or their own funding to finance their projects. The ratio of private credit to total credit has declined from 70% in 2000 to 66% in 2008. It is worth noting that 70% of total loans are extended to the large corporate sector, and the remaining 30% account for SMSs and retail lending (20% and 10%, respectively; Nasr, 2009). Subsequently, theloan distribution in Egypt is quite concentrated andhas a negative impact on banks’ credit risk and product diversification.Figure (1) provides an overview of the growth of bank deposits and loans. Egyptian bank loans and deposits have grown steadily over time. During 2001-2008, the growth rate of loans was estimated at 74.32%. On the other hand, the growth rate of deposits during the same period was estimated at 109.12% (CBE, 2009).
Figure 1: The development of loans and deposits during 2001-2008 Source: The authors
3.1. Caveats of the Egyptian Banking Industry
In the last few years, the Egyptian banking sector faced serious problems. This is due to the fact that, before 1990, the Egyptian banking sector was controlled mainly by state-owned banks(Dobronogov and Iqbal, 2005).The Egyptian government imposed barriers against the entry of foreign banks.This was done by applying restrictive regulations, such as special licenses and permits that deter new entry as well as branch expansion. Nonprofitable banks were supported by the government and were left to operate; measures such as restructuring and merging were not applied. Accordingly, banks’ operating efficiency was at risk because inefficient banks were left to operate and undertake high-risk activities and efficient banks were forced to subsidize them.
Theseinstitutionalized attitudes have resulted in an inefficient and uncompetitive banking sector that consequently has led to a poor level of financial intermediation.Government-owned banks were not motivated to serve small and medium-sized private enterprises simply because they were generating guaranteed income by investing in government securities.Nonperforming loans (NPL) was another major problem that facedthe Egyptian banking sector during that period. In late 1990, NPL accumulated and reached their peak. This was the result of many factors, such as severe corruption associated with lending activity, weak supervision by CBE, lackof financial innovation, poor quality of governance structure, and poor asset quality. In addition, the Egyptian governmentforced banks to lend to state-owned companies, which resulted in 30billion EGP owed by such companies to the four state-owned banks. Unfavourable lending terms were another significant problem that faced the Egyptian banking sector. Banks prefer to over-collateralize rather than make their credit decisions based on cashflows.
0
100000
200000
300000
400000
500000
600000
700000
2001 2002 2003 2004 2005 2006 2007 2008
Total Egyptian loans in Million EGP
Total Egyptian deposits in Million EGP
10 Journal of Finance and Bank Management, Vol. 3(2), December 2015
This approach affects the Egyptian credit market negatively and increases lending costs.Along the same line, banks in Egypt are suffering from inadequate and insufficient credit information about their clients’ creditworthiness and sector-related statistics.
3.2. Egyptian Banking Reform
The Egyptian government started to implement the first stage of the Financial Sector Reform Program (2004-2008), which was authorized in September 2004. The first stage focused on four pillars: (1) removing government demonization of the banking sector and restructuring state-owned banks,(2) raising the minimum capital requirement for banks, (3) strengthening the banking supervision at CBE, and (4) addressing of the problem of NPL. The government modified banking and credit law to encourage the entry of more foreign banks. This was done by removing the 49% ceiling on foreign ownership of Egyptian banks. Finally, the Banking Reform Unit at the CBE started to establish new departments in state-owned banks, particularly for risk management, information technology, and management information systems as a step toward financial and management restructuring. This is followed by auditing—according to the international accounting standards—all of the financial statements of state-owned banks for 2004 to 2007.
The aim of this phase was to increase competition and reduce concentration in the banking sector.In July 2003, the Egyptian parliament passed a new banking sector law (Law No. 88/2003), which requires minimum capital of EGP 500 million for domestic banks and US$50 million for branches of foreign banks. In additional, the ratio of banks’ minimum capital requirements to their risk-weighted assets has increased to 10% and an additional capital injection to all state-owned banks has been implemented. This new law forced many banks into mergers and acquisitions to meet the new capital requirements.This was followed by liberalization of deposit and lending ratesand permission for banks to set their own service charges and fees.Furthermore, the government rescheduled more than 45% of NPLs (26 billion EGP) and the outstanding loans of state-owned enterprises to state-owned banks.The objective of the second stage was to implement the full Basel Accord II in the banking sector by the bank’s supervision sector by addressing the three risk exposures (credit risk, operational risk, and market risk) faced by banking institutions. Poshakwale and Qian (2009) showed that these series of reforms have improved the competitiveness and production of the Egyptian banking sector.
4. Determinants of Competitiveness and Efficiency inthe Banking Sector
Recent studies on bank competition stress on the importance to design bank activities that can be used to face competitive forces rather than depending on market structures (Casu and Girardone, 2006; Lee et al., 2010; Ab-Rahim et al., 2011; Mwega, 2011; Poshakwale and Qian, 2011; Biekpe, 2011; Ratnovski, 2013). De Nicolò and Lucchetta, (2011) offer a theoretical model that related bank competition to country’s financial stability. Further empirical evidence is evident in certain African countries, such as Zambia where positive and significant association is reported between market-based financial reforms and bank cost efficiency (Mwenda and Mutoti, 2011).According to the relevant literature, bank competition can be measured by two main streams: structural and nonstructuralapproaches. The structural approach constitutes a natural link between concentration and competition (Bikker and Haaf, 2000) and includes two models: (a) the structure-conduct-performance paradigm and(b) efficiency hypothesis. The former model states that bank performance is greatly affected by exogenous factors related to market structure, explicitly basic demand and supply conditions.This model is used to test whether higher levels of concentration in the market cause collusive behavior among larger banks and thus result in superior performance (Gilbert, 1984; Molyneux et al., 1993). The latter model, developed byDemsetz (1973) and Peltzman (1977)investigates the relationship between market structure and performance by claiming that high efficient banks gain market share by reducing prices as a result of their profit maximizing behavior(Berger, 1995). That is, market concentration results from the superior efficiency of leading banks.
On the other hand, the nonstructure approach states that competition can be measured directly without the use of the relationship between structure, conduct, and performance. Competition, under the nonstructure approach, can be measured using factors such as revenue behavior, risk profiles, and entry and/or exit barriers. Two strands in the literature have been discussed concerning bank competition and financial stability. The traditional view of competitionfragility states that high bank concentrationerodes market power and results in lower profit margins, accordingly reducing bank franchise values that encourage bank risk-taking to increase return(Jiménez et al., 2007).

Eldomiaty et. al. 11
The second alternative view is the competitionstability, whichholds that more market power in the loan market will increase bank risk as high interest rates on loans result in the loan customer defaults and aggravates the moral hazard incentives of borrowers to shift into risks. Recent empirical studies have stated that the risk of bank failure rises in more concentrated markets (Boyd et al., 2006; De Nicolo and Loukoianova, 2007). Berger and Hannan (1989) investigated competitive conditions in the banking system. The authors’ main objective is to examine the relationship between market concentration and profitability using U.S. bank data for 1983 to 1985. Berger and Hannan (1989) conclude that noncompetitive price behavior is quite significant in explaining changes in profitability. Other studies have focused on the best parametric or nonparametric methods that can be used for estimating bank efficiency (Aiger et al., 1977; Charnes et al., 1978). Bank efficiency is usually measured with both internal and external determinants. Bank accounts (balance sheet and/or profit and loss accounts) are used as internal determinants.
5. Data and Research Method
The data were obtained from Bankscope.9 The sample consists of 24 Egyptian commercial banks for 2001-2008. The authors focused only on commercial banks to avoid comparison problems between various types of banks.
5.1. Dependent Variables
The dependent variable is the bank operating efficiency ratio (OER). This ratio is calculated as follows
taxes+lossesloan for provisions+expenseinterest -non+expenseinterest losses)(or gains securities+incomeinterest non +incomeinterest
Ratio Efficiency Operating
.The authors offer a measure of bank competitiveness which is the ratio of net interest revenue of each bank for a specific year to the total net interest revenue for all Egyptian banks in the same year. This measure has an analogy to Boone’s (2008) Profit Elasticity (PE) approach. In addition, this formulation of operating efficiency allows for detecting banks’ future risk (Fiordelisi et al., 2010). The methods of analysis examine two levels of bank competitiveness. The lowcompetitive banks correspond to the 1st quartile of the data and the highcompetitive banks correspond to the 4th quartile. Nevertheless, the entire dataset also is examined in an independent stage to test for robustness of the estimates that were derived from the 1st and 4th quartiles.
5.2. Independent Variables
The independent variables are the categories of bank financial performance. These are asset quality, capital adequacy, credit risk, liquidity, and profitability. A detailed explanation of each variable is presented in Table 1. The method examines the effects of bank financial performance on bank operating efficiency. The estimating equation for the autoregressive “Partial Adjustment Model that follows:
k
1itkitkikk1,-tk1,-tktk εββα Xyy
where t = 1, …..,n, tky = bank operating efficiencyratio, 1k-ty = bank operating efficiency in the previous period,
itkX = bank financial indicators, ikβ = coefficient of bank financial indicators, k1,-tβ = speed of adjustment of bank
operating efficiency to a target level, and tkε = estimation error.
9The Bankscope database contains financial statements and data from more than 11,000 public and private banks worldwide

12 Journal of Finance and Bank Management, Vol. 3(2), December 2015
Table 1: Variables examined in the study
Factors (Predictors of Bank Performance)
Variables (Ratio/Proxy)
Definition
Asset Quality10
Loan Loss Provision/Net Interest Revenue (LLPNIR)
The ratio of loan loss provision to net interest revenue presents the relationship between provisions in the profit and loss account and the interest income over the same period. Ideally, this ratio should be as low as possible. In a well-run bank, if the lending book is higher in risk, this would be reflected by higher interest margins. If the ratio deteriorates this means that risk is not being properly remunerated by margins.
Loan Loss Reserve/ Impaired Loans (LLRIL)
The ratio of loan loss reserve to the impaired loans or non-performing loan.The higher this ratio, the better provided the bank and the more comfortable people will feel about asset quality.
Impaired Loans/ Gross Loans (ILGL)
The ratio of impaired loans to gross loans (Loans + Loan loss reserve).This is a measure of the amount of total loans that are doubtful. The lower this figure improves as assets quality increases.
Net Charge-Off/ Net Income before provision for loan losses (NCONIBLLP)
The ratio of net charge-off (the amount written off from loan loss reserves less recoveries from loans) to net income before loan loss provisions. The net charge-off over net income before loan loss provision ratio is measured similarly to charge-offs but against income generated in the year. The lower this ratio is the better, other things being equal
Impaired Loans/ Equity (ILE)
The ratio of impaired loans to equity.
Unreserved Impaired Loans/ Equity (UILE)
The ratio of unreserved impaired loans to equity.
Capital Adequacy
Tier 1 Ratio (TR)
The ratio of a bank’s core equity capital (common stock and disclosed reserves or retained earnings) to its total assets, which should be at least 4%.
Total Capital Ratio (TCR)
The ratio of total capital (Tier 1 + Tier 2) to risk-weighted assets and should be at least 8%.
Equity/Tot Assets (CS)
The ratio of total equity to total assets. This is used as a proxy for banks’ capital structure.This ratio measures the ability of the bank to withstand losses. A declining trend in this ratio may signal increased risk exposure and possibly capital adequacy problem.
Equity/Net Loans (ENL)
The ratio of total equity to net loans. This ratio measures the equity cushion available to absorb losses on the loan book.
Equity/ Liabilities (EL)
The ratio of total equity to total liabilities.This leverage ratio is simply another way to examine the equity funding of the balance sheet and capital adequacy.
Equity/Deposit & Short-Term Funding (EDSF)
The ratio of equity to total deposits and short-term funding.This ratio measures the amount of permanent funding relative to short-term, potentially volatile funding. The higher this ratio is, the better from bank-risk perspective.
10All definitions of asset quality, capital, operations and liquidity were obtained from the bank scope database.

Eldomiaty et. al. 13
Capital Funds/ Total Assets (CFTA)
The ratio of capital fund to total assets
Capital Funds/ Net Loans (CFNL)
The ratio of capital fund to net loans.
Capital Funds/ Deposit & Short-Term Funding (CFDSF)
The ratio of capital fund to deposits and short-term funding.
Capital Funds/ Liabilities (CFL)
The ratio of capital fund to total liabilities.
Subordinate Debt/Capital Funds (SDCF)
The ratio of subordinate debt to capital funds.This ratio indicates what percentage of total capital funds is provided in the form of subordinated debt.
Equity Multiplier (EM)
The ratio of total assets to total equity. This ratio measures how many times a dollar of equity is leveraged. A higher equity multiplier indicates higher financial leverage, which means that the more the bank relies on debt to finance its assets, the more exposed it is to failure risk.
Profitability Net Interest Margin (NIM)
This ratio is the net interest income (interest received minus interest paid) expressed as a percentage of earning assets (loans plus other earning assets excluding fixed assets). The higher this ratio, the cheaper the funding or the higher the margin the bank commands. Higher margins and profitability are desirable as long as the asset quality is maintained.
Net Interest Income/Average Assets (NIIAA)
Net interest income over average assets indicates that the item is averaged using the net income expressed as a percentage of the total balance sheet.
Other Operating Income/ Average Assets (OIAA)
When compared to the above ratio, this indicates to what extent fees and other income represent a greater percentage of earnings of the bank. As long as this is not volatile trading income, it can be seen as a lower risk form of income. The higher this figure is, the better.
Non-Interest Expense/ Average Assets (NIEAA)
The ratio of non-interest expense to average total assets.Non-interest expenses or overheads plus provisions give a measure of the cost side of the bank’s performance relative to the assets invested
Pre-Tax Operating Income/ Average Assets (PTOIAA)
The ratio of pre-tax operating income to average total assets. This is a measure of the operating performance of the bank before tax and unusual items. This is a good measure of profitability unaffected by one of non-trading activities.
Non Operating Items & Taxes/ Average Assets (NOITAA)
The ratio of non-operating items and taxes to average total assetsThis ratio measures costs and tax as a percentage of assets.
Return on Average Assets (ROAA)
The ratio of net income to average total assets.
Return on Average Equity
The ratio of net profit to average tier one capital plus average revaluation reserve.

14 Journal of Finance and Bank Management, Vol. 3(2), December 2015
(ROAE) Dividend Pay-Out (DPO)
This is a measure of the amount of post-tax profits paid out to shareholders. In general, the higher the ratio, the better, but not if it is at the cost of restricting reinvestment in the bank and its ability to grow its business.
Income Net of Distribution/ Average Equity (INODAE)
This ratio is effectively the return on equity after deducting the dividend from the return. It shows by what percentage the equity has increased from internally generated funds. The higher the better.
Non-Operating Income/Net Income (NOINI)
The ratio of non-operating income to net income.This denotes that the percentage of total net income consists of unusual items.
Cost to Income Ratio (CIR)
The ratio of overheads to the sum of net interest revenue and other operating income.This is currently one of the most discussed ratios. It measures the overheads or costs of running the bank, the major element of which is normally salaries, as percentage of income generated before provisions. CIR is a measure of efficiency, although if the lending margins in a particular country are very high, then the ratio will improve as a result. CIR can be distorted by high net income from associates or volatile trading income.
Recurring Earning Power (REP)
The ratio of pre-provision income to average total assets. This ratio is a measure of after-tax profits and adds back provisions for bad debts as a percentage of total assets. Effectively, this is a return on assets performance measurement that does not deduct provisions.
Net Profit Margin (NPM)
The ratio of net income to interest income plus non-interest income.
Asset Utilization (AU)
The ratio of interest income plus non-interest income to total assets.
Tax Management Efficiency (TME)
The ratio of net income to pre-tax operating income. This ratio reflecting the bank’s use of security gains or losses and other tax-management tools (such as the purchase of tax-exempt bonds) to minimize its tax exposure.
Expense Control Efficiency (ECE)
The ratio of pre-tax operating income to interest income plus non-interest income. ECE measures the bank’s effectiveness in controlling operating expenses.
Credit risk Net Charge-Off/ Average Gross Loans (NCOAGL)
The ratio of net charge-off to average gross loans.Net charge off or the amount written off from loan loss reserves less recoveries are measured as a percentage of the gross loans. This figure indicates whatpercentage of today’s loans finally have been written off the books. The lower this figure, the better as long as the write-off policy is consistent across comparable banks.
Loan Loss Provision / Total Loans (LLPTL)
The ratio of loan loss provision to total loans.
Loan Losses Provision/ Equity (LLPE)
The ratio of loan loss provision to total equity
Loan Loss Reserve/Gross Loans (LLRGL)
The ratio of loan loss reserve to gross loans (loans plus loan loss reserves) indicates how much of the total portfolio has been provided for but not charged off. It is a reserve for losses expressed as percentage of total loans. Given a similar charge-off policy, the higher the ratio, the poorer will be the quality of the loan portfolio.
Eldomiaty et. al. 15
Loan Loss Reserve/Equity (LLRE)
The ratio of reserve for loan losses to total equity.
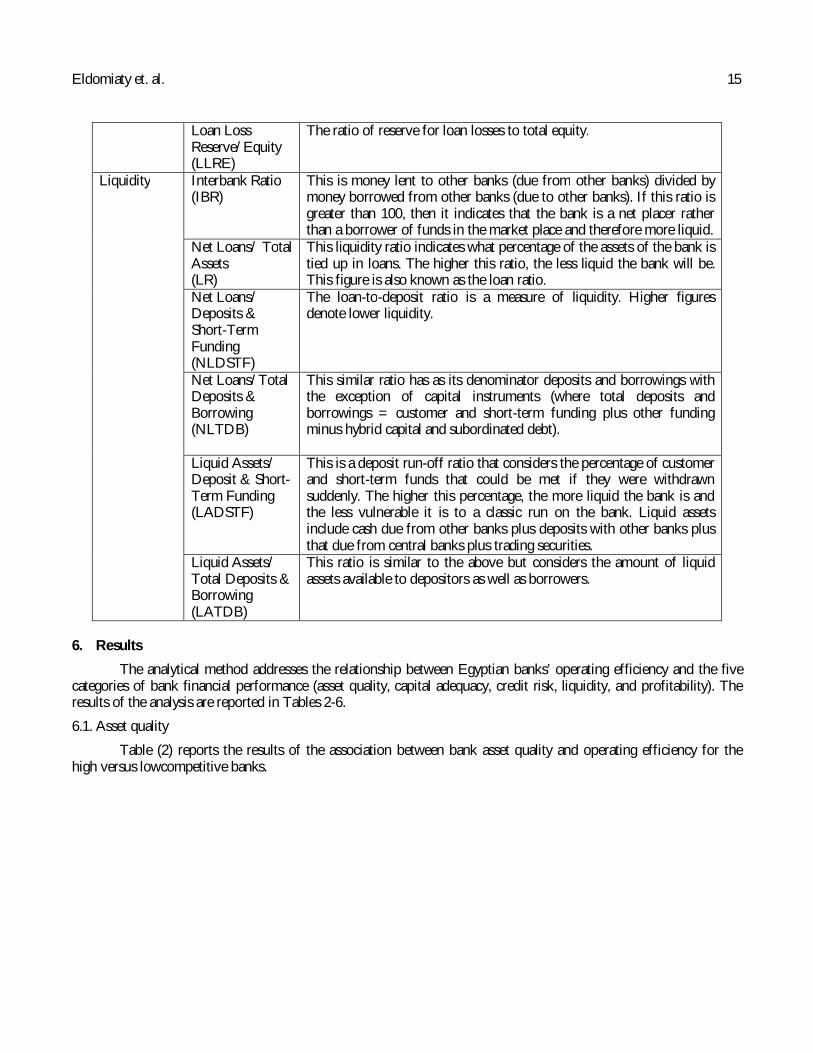
Liquidity Interbank Ratio (IBR)
This is money lent to other banks (due from other banks) divided by money borrowed from other banks (due to other banks). If this ratio is greater than 100, then it indicates that the bank is a net placer rather than a borrower of funds in the market place and therefore more liquid.
Net Loans/ Total Assets (LR)
This liquidity ratio indicates what percentage of the assets of the bank is tied up in loans. The higher this ratio, the less liquid the bank will be. This figure is also known as the loan ratio.
Net Loans/ Deposits & Short-Term Funding (NLDSTF)
The loan-to-deposit ratio is a measure of liquidity. Higher figures denote lower liquidity.
Net Loans/Total Deposits & Borrowing (NLTDB)
This similar ratio has as its denominator deposits and borrowings with the exception of capital instruments (where total deposits and borrowings = customer and short-term funding plus other funding minus hybrid capital and subordinated debt).
Liquid Assets/ Deposit & Short-Term Funding (LADSTF)
This is a deposit run-off ratio that considers the percentage of customer and short-term funds that could be met if they were withdrawn suddenly. The higher this percentage, the more liquid the bank is and the less vulnerable it is to a classic run on the bank. Liquid assets include cash due from other banks plus deposits with other banks plus that due from central banks plus trading securities.
Liquid Assets/ Total Deposits & Borrowing (LATDB)
This ratio is similar to the above but considers the amount of liquid assets available to depositors as well as borrowers.
6. Results
The analytical method addresses the relationship between Egyptian banks’ operating efficiency and the five categories of bank financial performance (asset quality, capital adequacy, credit risk, liquidity, and profitability). The results of the analysis are reported in Tables 2-6.
6.1. Asset quality
Table (2) reports the results of the association between bank asset quality and operating efficiency for the high versus lowcompetitive banks.
16 Journal of Finance and Bank Management, Vol. 3(2), December 2015
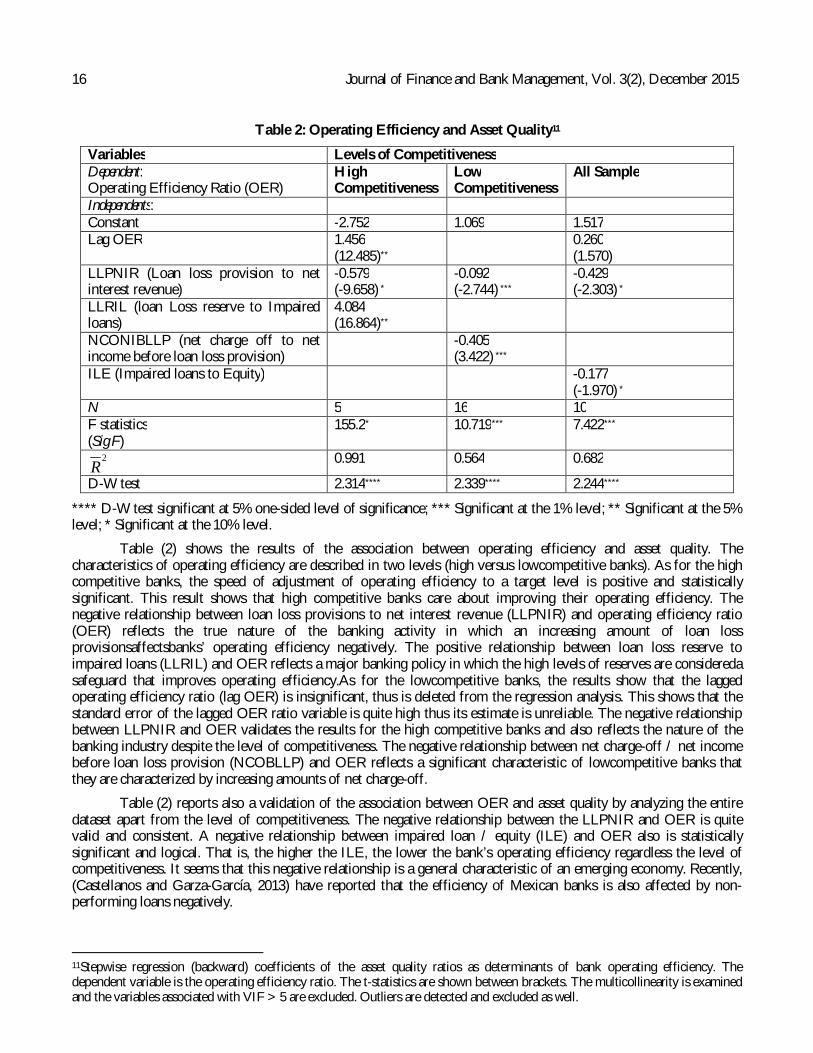
Table 2: Operating Efficiency and Asset Quality11
Variables Levels of Competitiveness Dependent: Operating Efficiency Ratio (OER)
High Competitiveness
Low Competitiveness
All Sample
Independents: Constant -2.752 1.069 1.517 Lag OER
1.456 (12.485)**
0.260 (1.570)
LLPNIR (Loan loss provision to net interest revenue)
-0.579 (-9.658) *
-0.092 (-2.744) ***
-0.429 (-2.303) *
LLRIL (loan Loss reserve to Impaired loans)
4.084 (16.864)**
NCONIBLLP (net charge off to net income before loan loss provision)
-0.405 (3.422) ***
ILE (Impaired loans to Equity) -0.177 (-1.970) *
N 5 16 10 F statistics (Sig F)
155.2* 10.719*** 7.422***
2R
0.991 0.564 0.682
D-W test 2.314**** 2.339**** 2.244****
**** D-W test significant at 5% one-sided level of significance; *** Significant at the 1% level; ** Significant at the 5% level; * Significant at the 10% level.
Table (2) shows the results of the association between operating efficiency and asset quality. The characteristics of operating efficiency are described in two levels (high versus lowcompetitive banks). As for the high competitive banks, the speed of adjustment of operating efficiency to a target level is positive and statistically significant. This result shows that high competitive banks care about improving their operating efficiency. The negative relationship between loan loss provisions to net interest revenue (LLPNIR) and operating efficiency ratio (OER) reflects the true nature of the banking activity in which an increasing amount of loan loss provisionsaffectsbanks’ operating efficiency negatively. The positive relationship between loan loss reserve to impaired loans (LLRIL) and OER reflects a major banking policy in which the high levels of reserves are considereda safeguard that improves operating efficiency.As for the lowcompetitive banks, the results show that the lagged operating efficiency ratio (lag OER) is insignificant, thus is deleted from the regression analysis. This shows that the standard error of the lagged OER ratio variable is quite high thus its estimate is unreliable. The negative relationship between LLPNIR and OER validates the results for the high competitive banks and also reflects the nature of the banking industry despite the level of competitiveness. The negative relationship between net charge-off / net income before loan loss provision (NCOBLLP) and OER reflects a significant characteristic of lowcompetitive banks that they are characterized by increasing amounts of net charge-off.
Table (2) reports also a validation of the association between OER and asset quality by analyzing the entire dataset apart from the level of competitiveness. The negative relationship between the LLPNIR and OER is quite valid and consistent. A negative relationship between impaired loan / equity (ILE) and OER also is statistically significant and logical. That is, the higher the ILE, the lower the bank’s operating efficiency regardless the level of competitiveness. It seems that this negative relationship is a general characteristic of an emerging economy. Recently, (Castellanos and Garza-García, 2013) have reported that the efficiency of Mexican banks is also affected by non-performing loans negatively.
11Stepwise regression (backward) coefficients of the asset quality ratios as determinants of bank operating efficiency. The dependent variable is the operating efficiency ratio. The t-statistics are shown between brackets. The multicollinearity is examined and the variables associated with VIF > 5 are excluded. Outliers are detected and excluded as well.

Eldomiaty et. al. 17
6.2. Capital Adequacy
Table (3) reports the results of the association between bank capital adequacy and operating efficiency for high versus lowcompetitive banks.
Table 3: Operating Efficiency and Capital Adequacy12
Variables Levels of Competitiveness Dependent: Operating Efficiency Ratio (OER)
High Competitiveness
Low Competitiveness
All Sample
Independents: Constant 0.197 1.167 1.405 Lag OER 0.700
(6.457) ***
CFNL (capital fund to net loans) 0.354 (1.907) *
CFDSTF (capital fund to deposit and short term funding)
1.609 (1.151)
ENL (equity to net loans) 2.035 (5.715) ***
EDSTF (equity to deposit and short-term funding)
-4.943 (-3.107) ***
SDCF (subordinated debt to capital fund) -0.660 (-2.678) ***
TCR (total capital ratio) -6.366 (-2.422) **
CFTA (capital fund to total assets) 6.343 (1.733) *
CFNL (capital fund to net loans) 0.206 (1.018)
N 11 23 22 F statistics 21-866*** 15.374*** 5.893***
2R
0.862 0.662 0.463
D-W test 3.112**** 2.488**** 1.336****
**** D-W test significant at 5% one-sided level of significance; *** Significant at the 1% level; ** Significant at the 5% level; * Significant at the 10% level.
Table (3)shows that highcompetitive Egyptian banks use capital adequacy ratios to adjust bank operating efficiency to a target level.As for the lowcompetitive banks, the positive relationship between equity / net loans (ENL) and OER indicates that lowcompetitive banks are characterized by decreasing amounts of net loans. The negative relationship between equity / deposit and short-term funding (EDSTF) and OER shows that the lowcompetitive banks are characterized by decreasing ratios of equity to deposits. The results also show that the negative relationship between subordinated debt to capital fund (SDCF) and OER provides a clear indication that lowcompetitive banks are not able to raise subordinated debt.The negative relationship between total capital ratio (TCR) and OER for the entire sample indicates one of the characteristics of Egyptian banks. That is, TCR in the Egyptian banksaffects OER negatively.
12Stepwise regression (backward) coefficients of the capital adequacy ratios as determinants of bank operating efficiency. The dependent variable is the operating efficiency ratio. The t-statistics are shown between brackets. The multicollinearity is examined and the variables associated with VIF > 5 are excluded. Outliers are detected and excluded as well.
18 Journal of Finance and Bank Management, Vol. 3(2), December 2015
This indicates that the risk-weighted assets are increasing which consequentlyaffects the bank’s OER negatively. The positive relationship between capital fund /total assets (CFTA) and OER shows that the efficient use of bank capital improves bank operating efficiency.Similar results are reported by banks in Kenya (Kamau, 2011; Odunga et al., 2013) and banks in Brazil (Tecles and Tabak, 2011). This positive relationship is not limited to banks in Africa and Latin America. European banks share the same conclusion as well (Altunbas et al., 2007).
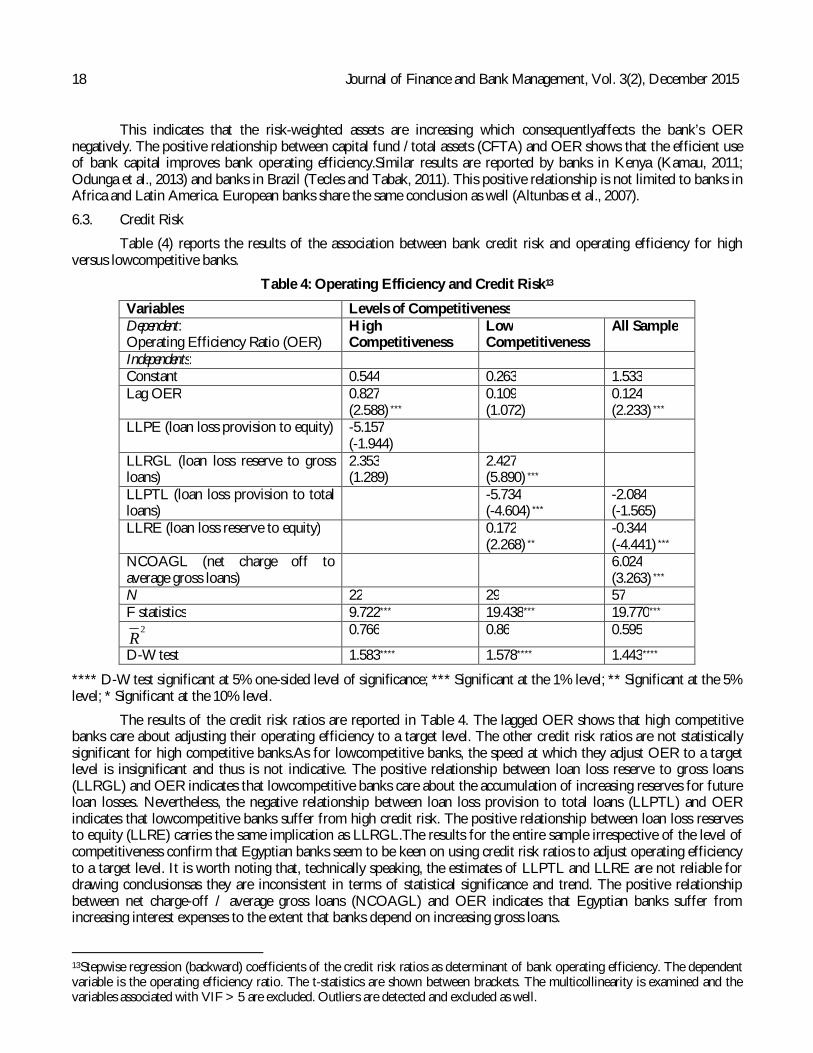
6.3. Credit Risk
Table (4) reports the results of the association between bank credit risk and operating efficiency for high versus lowcompetitive banks.
Table 4: Operating Efficiency and Credit Risk13
Variables Levels of Competitiveness Dependent: Operating Efficiency Ratio (OER)
High Competitiveness
Low Competitiveness
All Sample
Independents: Constant 0.544 0.263 1.533 Lag OER
0.827 (2.588) ***
0.109 (1.072)
0.124 (2.233) ***
LLPE (loan loss provision to equity) -5.157 (-1.944)
LLRGL (loan loss reserve to gross loans)
2.353 (1.289)
2.427 (5.890) ***
LLPTL (loan loss provision to total loans)
-5.734 (-4.604) ***
-2.084 (-1.565)
LLRE (loan loss reserve to equity) 0.172 (2.268) **
-0.344 (-4.441) ***
NCOAGL (net charge off to average gross loans)
6.024 (3.263) ***
N 22 29 57 F statistics 9.722*** 19.438*** 19.770***
2R
0.766 0.86 0.595
D-W test 1.583**** 1.578**** 1.443****
**** D-W test significant at 5% one-sided level of significance; *** Significant at the 1% level; ** Significant at the 5% level; * Significant at the 10% level.
The results of the credit risk ratios are reported in Table 4. The lagged OER shows that high competitive banks care about adjusting their operating efficiency to a target level. The other credit risk ratios are not statistically significant for high competitive banks.As for lowcompetitive banks, the speed at which they adjust OER to a target level is insignificant and thus is not indicative. The positive relationship between loan loss reserve to gross loans (LLRGL) and OER indicates that lowcompetitive banks care about the accumulation of increasing reserves for future loan losses. Nevertheless, the negative relationship between loan loss provision to total loans (LLPTL) and OER indicates that lowcompetitive banks suffer from high credit risk. The positive relationship between loan loss reserves to equity (LLRE) carries the same implication as LLRGL.The results for the entire sample irrespective of the level of competitiveness confirm that Egyptian banks seem to be keen on using credit risk ratios to adjust operating efficiency to a target level. It is worth noting that, technically speaking, the estimates of LLPTL and LLRE are not reliable for drawing conclusionsas they are inconsistent in terms of statistical significance and trend. The positive relationship between net charge-off / average gross loans (NCOAGL) and OER indicates that Egyptian banks suffer from increasing interest expenses to the extent that banks depend on increasing gross loans.
13Stepwise regression (backward) coefficients of the credit risk ratios as determinant of bank operating efficiency. The dependent variable is the operating efficiency ratio. The t-statistics are shown between brackets. The multicollinearity is examined and the variables associated with VIF > 5 are excluded. Outliers are detected and excluded as well.

Eldomiaty et. al. 19
Thus, an increase in gross loans results in an increase in the NCOAGL ratio. It is also obvious that the improvements in operating efficiency are accompanied by increases in credit risk. This result is opposite to other comparable countries such as Malaysia and Singapore (Abd Karim et al., 2010) where higher non-performing loan reduces cost efficiency.
6.4. Liquidity
Table (5) reports the results of the association between bank liquidity and operating efficiency for the high versus lowcompetitive banks.
Table 5: Operating Efficiency and Liquidity14
Variables Levels of Competitiveness Dependent: Operating Efficiency Ratio (OER)
High Competitiveness
Low Competitiveness
All Sample
Independents: Constant -0.484 0.253 0.634 Lag OER 0.705
(5.701) *** 0.278 (1.381)
0.182 (3.120) ***
NLDSTF (net loans to deposit and short-term funding)
0.479 (1.113)
LADSTF (liquid assets to deposit and short-term funding)
1.800 (2.463) ***
LATDB (liquid assets to total deposits and borrowing)
1.101 (2.738) ***
1.016 (2.996) ***
N 36 37 116 F statistics 27.613*** 4.886*** 14.018****
2R
0.776 0.205 0.292
D-W test 2.264**** 1.453**** 1.541****
**** D-W test significant at 5% one-sided level of significance; *** Significant at the 1% level; ** Significant at the 5% level; * Significant at the 10% level.
The results in table (5) show thathigh competitive banks adjust their operating efficiency to a target level. The positive relationship between liquid assets / deposit and short-term funding (LADSTF) and OER indicates that high competitive banks are characterized by large liquid assets.The results also show that lowcompetitive banksnot keen on adjusting OER to a target level. The positive relationship between liquid assets / total deposit and borrowing (LATDB) and OER is as significant as the LADSTF, thus carries the same implication. This is due to the fact that, irrespective of the level of competitiveness, Egyptian bank liquidity is controlled and managed according to certain rules imposed by the Central Bank of Egypt. This explanation is supported by the positive estimate of LATDB using the whole sample.
6.5. Profitability
Table (6) reports the results of the association between bank profitability and operating efficiency for the high versus lowcompetitive banks.
14Stepwise regression (backward) coefficients of the liquidity ratios as determinants of bank operating efficiency. The dependent variable is the operating efficiency ratio. The t-statistics are shown between brackets. The multicollinearity is examined and the variables associated with VIF > 5 are excluded. Outliers are detected and excluded as well.
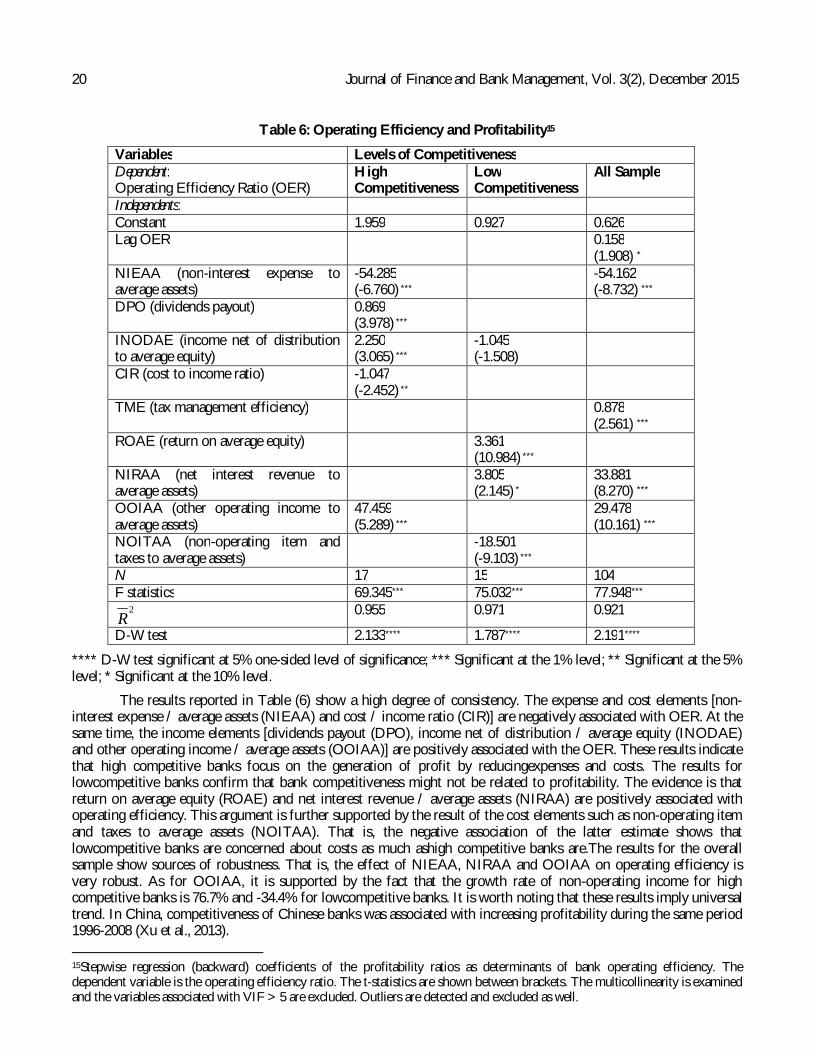
20 Journal of Finance and Bank Management, Vol. 3(2), December 2015
Table 6: Operating Efficiency and Profitability15
Variables Levels of Competitiveness Dependent: Operating Efficiency Ratio (OER)
High Competitiveness
Low Competitiveness
All Sample
Independents: Constant 1.959 0.927 0.626 Lag OER 0.158
(1.908) * NIEAA (non-interest expense to average assets)
-54.285 (-6.760) ***
-54.162 (-8.732) ***
DPO (dividends payout) 0.869 (3.978) ***
INODAE (income net of distribution to average equity)
2.250 (3.065) ***
-1.045 (-1.508)
CIR (cost to income ratio) -1.047 (-2.452) **
TME (tax management efficiency) 0.878 (2.561) ***
ROAE (return on average equity) 3.361 (10.984) ***
NIRAA (net interest revenue to average assets)
3.805 (2.145) *
33.881 (8.270) ***
OOIAA (other operating income to average assets)
47.459 (5.289) ***
29.478 (10.161) ***
NOITAA (non-operating item and taxes to average assets)
-18.501 (-9.103) ***
N 17 15 104 F statistics 69.345*** 75.032*** 77.948***
2R
0.955 0.971 0.921
D-W test 2.133**** 1.787**** 2.191****
**** D-W test significant at 5% one-sided level of significance; *** Significant at the 1% level; ** Significant at the 5% level; * Significant at the 10% level.
The results reported in Table (6) show a high degree of consistency. The expense and cost elements [non-interest expense / average assets (NIEAA) and cost / income ratio (CIR)] are negatively associated with OER. At the same time, the income elements [dividends payout (DPO), income net of distribution / average equity (INODAE) and other operating income / average assets (OOIAA)] are positively associated with the OER. These results indicate that high competitive banks focus on the generation of profit by reducingexpenses and costs. The results for lowcompetitive banks confirm that bank competitiveness might not be related to profitability. The evidence is that return on average equity (ROAE) and net interest revenue / average assets (NIRAA) are positively associated with operating efficiency. This argument is further supported by the result of the cost elements such as non-operating item and taxes to average assets (NOITAA). That is, the negative association of the latter estimate shows that lowcompetitive banks are concerned about costs as much ashigh competitive banks are.The results for the overall sample show sources of robustness. That is, the effect of NIEAA, NIRAA and OOIAA on operating efficiency is very robust. As for OOIAA, it is supported by the fact that the growth rate of non-operating income for high competitive banks is 76.7% and -34.4% for lowcompetitive banks. It is worth noting that these results imply universal trend. In China, competitiveness of Chinese banks was associated with increasing profitability during the same period 1996-2008 (Xu et al., 2013). 15Stepwise regression (backward) coefficients of the profitability ratios as determinants of bank operating efficiency. The dependent variable is the operating efficiency ratio. The t-statistics are shown between brackets. The multicollinearity is examined and the variables associated with VIF > 5 are excluded. Outliers are detected and excluded as well.
Eldomiaty et. al. 21
In Zambia, positive association is found between growth of bank revenues and increasing competition (Simpasa, 2011, 2013).The MENA region shares similar aspects that increasing bank costs affect operating efficiency negatively (Eisazadeh and Shaeri, 2012). The negative association between non-interest expense and bank efficiency is also realized in the Mexican banks (Castellanos and Garza-García, 2013).
7. Conclusion
The results provide lessons to learn for the Egyptian banking sector.For high competitive banks, operating efficiency is affected by the asset quality, capital adequacy, credit risk and liquidity of banks positively and significantly. These results provide clear evidence that high competitive banks in Egypt are distinguished from lowcompetitive banks by carefullydesigned financial policies. The results can be used to outline characteristics of the Egyptian high competitive banks as follows.
1- An increasing amount of loan loss provision affects the banks’ operating efficiency negatively. 2- High levels of reserves are considered a safeguard that improves operating efficiency. 3- Competitive banks are characterized by high capital fund to net loans. 4- Egyptian banks seem to be keen on using credit risk ratios to adjust operating efficiency to a target level. 5- High competitive banks are characterized by high liquid assets. 6- High competitive banks focus on the generation of more profit and reduction of expenses and costs.
In the same sense, the results can be used to outline the characteristics of lowcompetitive Egyptian banks as follows.
1- Lowcompetitive banks are characterized by increasing amounts of net charge-off. 2- Lowcompetitive banks are characterized by decreasing amounts of net loans as well as equity / deposit ratios. 3- Lowcompetitive banks are unable to raise subordinated debt. Risk-weighted assets are increasing which
consequently affects banks’ operating efficiency ratios negatively. 4- Lowcompetitive banks care about the accumulation of increasing reserves for future loan losses. 5- Lowcompetitive banks suffer from high credit risk. 6- Egyptian banks suffer from increasing interest expenses. 7- Profitability of lowcompetitive banks might not be related to bank competitiveness.Lowcompetitive banks are as
much concerned with costs as are high competitive banks.
It is worth noting that the observed similarity between the results reported in this study and other related studies in other countries offer evidence that the use of parametric methods result in valid estimates. This conclusion might be considered an update to the results reported by (Delis and Papanikolaou, 2009).
8. Managerial Implications
The general outcome of this study reveals that bank management must formulate banking strategies that strengthen their relative market competitiveness.
Bank management must consider operating efficiency as a guiding tool to increase market share (net loans) and reduces interest expenses as well as administrative costs.
Bank strategies must be formulated taking into account that bank competitiveness depends significantly on the use of the available funds. The acceptance of much deposit in times when a bank is not able to expand its loan market reduces bank’s competitiveness. It is equally true that the expansion of the loan market must take into consideration the costs of credit risk.
The establishment of credit scoring system helps significantly reducing non-performing loans, thus net charge-off. It is needless to mention that the enforcement of credit scores matters significantly. The 2008 financial crisis has revealed that enforcement of credit scorings could have avoided the crisis.
Bank management must have generic target expense ratios that correspond to changes in interest income. Therefore, operating efficiency can be improved.

22 Journal of Finance and Bank Management, Vol. 3(2), December 2015 References Ab-Rahim, R., Nor-Ghani Md-Nor, N. G. and Jais, M. 2011. Concentration, Competition and Efficiency in Malaysian
Banking Industry. Faculty of Economics and Business, Universiti Malaysia Sarawak (UNIMAS), FEB Working Paper Series No. 1112.
Abd Karim, M. Z., Chan, S. G. and Hassan, S. 2010. Bank efficiency and non-performing loans: evidence from Malaysia and Singapore. Prague Economic Papers, 2: 118-132.
Aiger, D., Lovell,C.K. and Schmidt, P. 1977. Formulation and Estimation of Stochastic Frontier Production Models. Journal of Econometrics,6(1): 21-37.
Altunbas, Y., Carbo, S., Gardener, Edward P. M.and Molyneux, P. 2007. Examining the Relationships between Capital, Risk and Efficiency in European Banking. European Financial Management, 13(1): 49–70.
Berger, A.N. 1995. The Profit-Structure Relationship in Banking: Tests of Market Power and Efficient Structure Hypotheses. Journal of Money, Credit and Banking, 27(2): 404-31.
Berger, A.N. and Hannan, T.H. 1989. The Price-Concentration Relationship in Banking. Review of Economics and Statistics, 71(2): 291-99.
Biekpe, N. 2011. The Competitiveness of Commercial Banks in Ghana. African Development Review, 23(1): 75–87. Bikker, J.A. and Haaf, K. 2000. Measures of Competition and Concentration in the Banking Industry: A Review of the
Literature. Research Series Supervision, Netherlands Central Bank, No. 27: 1-35. Boone, J. 2008. A new way to measure competition. Economic Journal, 118(531): 1245-1261. Boyd, J.H., De Nicolo, G. and Jalal, A.M. 2006. Bank Risk Taking and Competition Revisited: New Theory and New
Evidence. IMF Working Paper, No. 6. Castellanos, S. G. and Garza-García, J. G. 2013. Competition and Efficiency in the Mexican Banking Sector. BBVA
Bancomer, Working Paper No 13/29. Casu, B. and Girardone, C. 2006. Bank competition, concentration and efficiency in the single European market. The
Manchester School, 74(4): 441–468. Central Bank of Egypt. 2009. Economic Review. Research, Development and Publishing Sector, Vol. 49. Charnes, A., Cooper, W.W. and Rhodes, E. 1978. Measuring the Efficiency of Decision Making Units. European
Journal of Operational Research, 2(6): 429-44. De Nicolo, G. and Loukoianova, E. 2007. Bank Ownership, Market Structure and Risk. IMF Working Paper,
WP/07/215 De Nicolò, G. and Lucchetta, M. 2011. Bank Competition and Financial Stability: A General Equilibrium Exposition.
IMF Working Paper, WP/11/295. Delis, M. D. and Papanikolaou, N. I. 2009. Determinants of bank efficiency: Evidence from a semi-parametric
methodology. Munich Personal RePEc Archive, Paper No. 13893. Demsetz, H. 1973. Industry Structure, Market Rivalry and Public Policy. Journal of Law and Economics, 16(1): 1-9. Dobronogov, A., and Iqbal, F. 2005. Economic Growth in Egypt, Constraints and Development. Working Paper,
Middle East and North Africa, The World Bank, No. 42: 1-22. Eisazadeh, S. and Shaeri, Z. 2012. An analysis of bank efficiency in the Middle East and North Africa. The
International Journal of Banking and Finance, 9 (4): 28-47. Fiordelisi, F., Marques-Ibanez, D. and Molyneux, P. 2010. Efficiency and risk in European banking. European Central
Bank, working paper series, No 1211. Gilbert, R.A. 1984. Bank Market Structure and Competition: A Survey. Journal of Money, Credit and Banking, 16(4):
617-44. Jiménez, G., Lopez, J.A. and Saurina, J. 2013. How Does Competition Impact Bank Risk Taking? Journal of Financial
Stability, 9(2): 185–195 Kamau, A. W. 2011. Intermediation efficiency and productivity of the banking sector in Kenya. Interdisciplinary
Journal of Research in Business, 1(9): 12-26. Lee, B. L., Worthington, A. C. and Leong, W. H. 2010. Malmquist indices of pre- and post-deregulation productivity,
efficiency and technological change in the Singaporean banking sector. The Singapore Economic Review, 55(4): 599–618.
Molyneux, P.,Lloyd-Williams, D.M. and Thornton, J. 1993. Competitive Conditions in European Banking. Journal of Banking and Finance, 18(3): 445-59.

Eldomiaty et. al. 23
Mwega, F. 2011. The Competitiveness and Efficiency of the Financial Services Sector in Africa: A Case Study of Kenya. African Development Review, Vol. 23, No. 1, 2011, 44–59.
Mwenda, A. and Mutoti, N. 2011. Financial Sector Reforms, Bank Performance and Economic Growth: Evidence from Zambia. African Development Review, 23(1): 60–74.
Nasr, S. 2009. Are Banks in Egypt Catalysts for Economic Development?. Oxford Business and Economics Conference (OBEC), Oxford University, UK.
Odunga, R. M., Nyangweso P. M., Carter D. A. and Mwarumba M. 2013. Credit Risk, Capital Adequacy and Operating Efficiency of Commercial Banks in Kenya. International Journal of Business and Management Invention, 2(9): 6-12.
Peltzman, S. 1977. The Gains and Losses from Industrial Concentration. Journal of Law and Economics, 20(2): 229-263.
Poshakwale, S. S. and Qian, B. 2011. Competitiveness and Efficiency of the Banking Sector and Economic Growth in Egypt. African Development Review, 23(1): 99–120
Ratnovski, L. 2013. Competition Policy for Modern Banks. IMF Working Paper, WP/13/126. Simpasa, A. M. 2011. Competitive Conditions in the Tanzanian Commercial Banking Industry. African Development
Review, 23(1): 88–98. Simpasa, A. M. 2013. Competition and Market Structure in the Zambian Banking Sector. African Development Bank,
Working Paper No. 168. Tecles, P. and Tabak, B. M. 2011. Determinants of bank efficiency: The Case of Brazil. Banco Central do Brasil,
Working Paper n. 210. Xu, B., Rixtel, A. V. and Leuvensteijn, M. V. 2013. Measuring bank competition in China: a comparison of new versus
conventional approaches applied to loan markets. Bank for International Settlements, Working paper no. 422.


