The Financial Crisis: why, where it is going & how to fix it
24
The Financial Crisis: why, where it is going & how to fix it page 1 of 24 28 January 2008 The Financial Crisis: why, where it is going & how to fix it Jaime Cuevas Dermody, Principal 28 January 2009 Financial Engineering LLC, 1855 Lake Drive, Delray Beach, FL 33444 561 278-4100 [email protected] (0.) INTRODUCTION This paper was originally prepared for a talk on “The Dangers of Printing Too Much Money”, which was given on 17 June 2008 to the Investment Management Institute Conference at the Avenue Hotel in Chicago. In that talk, I said that every major Wall Street investment bank was bankrupt, or in grave danger of it, for the reasons given in Subsection (2.3) below. Many in the audience have since apologized for ridiculing that remark and suggested mak- ing the talk into a paper updated for recent events. In doing so, I have focused on the legal and regulatory environment that precipitated the financial crisis, the “market failure” in the CDO (collateralized debt obligation) market that sparked the crisis, its spread into a general credit crisis, the consequences of the bail out of financial institution, and Government ac- tions that can alleviate the crisis. Section (1.) is a history of the current financial crisis, in particular its regulatory, legal, and policy foundation. Sections (2.) and (3.) explain the mechanics of how the CDO crisis began and spread to a general financial crisis. Section (4.) points out important side effects of the crisis, including home-collateral destruction and the bailout inducing greater risk taking at rescued firms. Section (5.) discusses the reduction in loans outstanding from money-center banks (deleveraging). Section (6.) makes 11 recommendations for Government Action. First, are 10 specific policy actions. The last is a recommendation on the announcement of the first nine actions, in order to obtain an effective psychological impact on the markets. The latter is as crucial as the former, because it must restore both investor confidence in those institutions and consumer confidence in continued employment. Without that confi- dence, the economy will not recover. Sections (7.) and (8.) discuss the short-term and long- term consequences, respectively, of the current Government bailouts, and in particular two polar cases of financing it. This analysis suggests we will face 10% to 20% short-term Libor rates one to three years from now. Section (9.) is a brief conclusion, which warns that the recommended actions are needed before investors and consumers are further panicked by the specter of massive unemployment, retail-store closings, and home-collateral deteriora- tion in the first half of 2009. (1.) WHY (1.1) Regulatory and Legal Precursors of the Crisis Bad regulatory and legal changes occurred in the 1970s and 1980s. Milestones include: 1975 Securities and Exchange Commission (“SEC”) Rule 15c3-1 uses the ratings of “nationally recognized statistical rating organizations” 1 (“NRSRO”) for broker-dealer net capital requirements. Over the next decade, “The SEC and other regulators effect- tively ceded to CROs their public-interest responsibilities for monitoring and disclosing investor loss exposure in structured financial instruments.”. 2 1 The SEC designated credit rating organizations (“CROs”) as NRSRO through ‘no-action” letters in response to requests by security issuers. In 2006, The Credit Rating Agency Reform Act (PL 109-291) required the SEC to set up a formal process for NRSRO designation but not regulation. In 2007 the SEC did that. 2 Caprio, G. Jr. (Williams College), Demirguc-Kunt, A. (World Bank), and Kane, E.J. (Boston College & NBER). “The 2007 Meltdown in Structured Securitization: ....”. Working Paper. 5 September 2008. CRO means credit rating organiza- tion, which includes the NRSROs.
Transcript of The Financial Crisis: why, where it is going & how to fix it

The Financial Crisis: why, where it is going & how to fix it page 1 of 24 28 January 2008
The Financial Crisis: why, where it is going & how to fix it Jaime Cuevas Dermody, Principal 28 January 2009 Financial Engineering LLC, 1855 Lake Drive, Delray Beach, FL 33444 561 278-4100 [email protected]
(0.) INTRODUCTION
This paper was originally prepared for a talk on “The Dangers of Printing Too Much Money”, which was given on 17 June 2008 to the Investment Management Institute Conference at the Avenue Hotel in Chicago. In that talk, I said that every major Wall Street investment bank was bankrupt, or in grave danger of it, for the reasons given in Subsection (2.3) below. Many in the audience have since apologized for ridiculing that remark and suggested mak-ing the talk into a paper updated for recent events. In doing so, I have focused on the legal and regulatory environment that precipitated the financial crisis, the “market failure” in the CDO (collateralized debt obligation) market that sparked the crisis, its spread into a general credit crisis, the consequences of the bail out of financial institution, and Government ac-tions that can alleviate the crisis.
Section (1.) is a history of the current financial crisis, in particular its regulatory, legal, and policy foundation. Sections (2.) and (3.) explain the mechanics of how the CDO crisis began and spread to a general financial crisis. Section (4.) points out important side effects of the crisis, including home-collateral destruction and the bailout inducing greater risk taking at rescued firms. Section (5.) discusses the reduction in loans outstanding from money-center banks (deleveraging). Section (6.) makes 11 recommendations for Government Action. First, are 10 specific policy actions. The last is a recommendation on the announcement of the first nine actions, in order to obtain an effective psychological impact on the markets. The latter is as crucial as the former, because it must restore both investor confidence in those institutions and consumer confidence in continued employment. Without that confi-dence, the economy will not recover. Sections (7.) and (8.) discuss the short-term and long-term consequences, respectively, of the current Government bailouts, and in particular two polar cases of financing it. This analysis suggests we will face 10% to 20% short-term Libor rates one to three years from now. Section (9.) is a brief conclusion, which warns that the recommended actions are needed before investors and consumers are further panicked by the specter of massive unemployment, retail-store closings, and home-collateral deteriora-tion in the first half of 2009.
(1.) WHY
(1.1) Regulatory and Legal Precursors of the Crisis
Bad regulatory and legal changes occurred in the 1970s and 1980s. Milestones include:
1975 Securities and Exchange Commission (“SEC”) Rule 15c3-1 uses the ratings of “nationally recognized statistical rating organizations”1 (“NRSRO”) for broker-dealer net capital requirements. Over the next decade, “The SEC and other regulators effect- tively ceded to CROs their public-interest responsibilities for monitoring and disclosing investor loss exposure in structured financial instruments.”.2
1 The SEC designated credit rating organizations (“CROs”) as NRSRO through ‘no-action” letters in response to requests by security issuers. In 2006, The Credit Rating Agency Reform Act (PL 109-291) required the SEC to set up a formal process for NRSRO designation but not regulation. In 2007 the SEC did that. 2 Caprio, G. Jr. (Williams College), Demirguc-Kunt, A. (World Bank), and Kane, E.J. (Boston College & NBER). “The 2007 Meltdown in Structured Securitization: ....”. Working Paper. 5 September 2008. CRO means credit rating organiza-tion, which includes the NRSROs.

The Financial Crisis: why, where it is going & how to fix it page 2 of 24 28 January 2008
1982 SEC begins requiring less disclosure3 for issuance of securities rated in the highest four rating categories of at least one NRSRO, e.g., at least BBB from Standard & Poors (“S&P:) or Baa3 from Moody’s Investor Service (“Moody’s”). It also shielded the NRSROs from liability.4 In 1992 it amends Rule 3a-7 to exempt from registration asset-backed securities that are in such categories (57 FR 56256, Nov. 27, 1992).
1984 The Secondary Mortgage Market Enhancement Act (Public Law 98-440) eases issu- ance requirements of asset-backed securities that are a “mortgage related security”, which it defines as one in the highest two rating categories of at least one NRSRO (e.g., at least Standard and Poors AA or Moody’s Aa3).
1987 Federal Reserve Bank (“Fed”) expanded its use of NRCRO ratings beyond require- ments for bank-portfolio (of marketable securities) to prudential rules of bank super- vision.5 It defined “externally rated” in Code of Federal Regulations Title 12 Part 325 Subpart B Appendix A (6.). That year, its Regulation T set the above-mentioned highest two categories as the standard for margin lending on securities.
1988 The international Basel I Accord is established with simplistic risk-weight ing of as- sets classes, and the major commercial banks react by: arbitraging this weighting to leverage their capital, and seeking the most profitable regulatory home around the world for each aspect of their operations.
1988 The first structured investment vehicle (“SIV”) is created by Citibank to take advan- tage of the above, and dozens of other SIVs follow. SIVs issued short-term commer- cial paper and mid-term notes to fund the purchase of much-longer-maturity CDOs, all off balance sheet. Some SIVs were funded instead by issuing tranches of their CDOs. Many hedge funds leveraged purchases of CDO with lines of credit.
1989 Department of Labor issues Prohibited Transaction Exemption 89-88 (54 FR 42582, 17 October 1989) to ERISA, that allows pension funds to invest in asset-backed se- curities rated in the above-mentioned highest two categories.
Financial Institutions Reform, Recovery and Enforcement Act of 1989 bans thrifts from buying bonds that are not in the above-mentioned highest four categories (PL 101-73 103 Stat.183, 12 U.S.C. 3331-3351, 9 August 1989).
1991 SEC amends Rule 2a-7 to require money market funds to hold 95%, instead of 0%, of assets in the highest short-term rating category of a NRSRO or in unrated assets of comparable quality. For S&P it is A-1 and for Moody’s it is P-1. See Investment Company Act Release No. 18005, 56 FR 8113, 27 February 1991.
2000 Department of Housing and Urban Development issued regulations for Freddie Mac and Fannie Mae, that significantly raised goals (with penalties for not reaching them) on their purchase of residential mortgage to low-income households from 2001 to 2004. No one seems to have dissented.6
These and similar events are explained in detail in the three insightful articles cited in foot-notes 2, 5, and 11.
3 SEC Securities Act Release No. 33-6383, 47 FR 11466, 16 March 1982. 4 Rule 436 {47 FR 1141, as amended 58 FR 62030, 23 November 1993] deems NRSRO ratings in a prospectus as not part of that prospectus for purpose of Section 7 and 11 of the Securities and Exchange Act, thus shielding NRSROs from expert-witness liability and the negligent standard of care. 5 Cantor, R. and Packer, F. “The Credit Rating Industry” Federal Reserve Bank of New York Quarterly Review, summer-fall 1994. 6 HUD’s Regulations of Fannie Mae and Freddie Mac: Final Rule, 31 October 2000, 65 FR 65044-65229.

The Financial Crisis: why, where it is going & how to fix it page 3 of 24 28 January 2008
(1.2) House Price Bubble: February 1997 to July 2006
The housing and credit bubbles that precipitated the financial crisis, were a perfect storm born in the confluence of:
(a.) Commercial and investment banks' and mortgage originator’s well-developed and in- genious exploitation of those unfortunate milestones,
(b.) NRSRO’s manipulation of their rating standards and mathematical models to maxi- mize fees for both advising security issuers and rating their issues,
(c.) Expansion of land use restrictions (which have been growing in areas like Providence RI, Boston MA, Monmouth NJ, Philadelphia, Seattle WA, and San Francisco since 1970) accounted for about 20% of the housing price rise from 1987 to 2006.7 Con- struction costs from 2000 to 2008 have risen an average of 4.8%/year compounded.8
(d.) A general and steep fall in interest rates from late 2000 to mid 2004,9
(e.) Rising incomes in a robust economy (except for March to November 2001),
(f.) Maturing of economically more-efficient financial conduits between ultimate lender and ultimate borrower,
(g.) 2007 change in US tax law and in accounting standards, and
(h.) Almost completely ineffective Fed, SEC, OHFEO, FDIC, and FINRA oversight.10
Millions of people, for the first time in their lives, qualified for home mortgages, and most others could qualify for much larger mortgages and more credit in general than was previ-ously possible. Investment and commercial banks sought all manner of loans to securitize and market as a CDO, as long as most of that CDO could be highly rated by an NRCRO.11 They did this to maximize fees and minimize both their capital engaged and liability for bad loans, under their windfall of regulatory changes and oversight. NRCROs developed ever-more clever statistical arguments to justify AAA and AA ratings for ever-larger parts of CDO cash streams, including CDOs backed by subprime loans. Before securitization, originators carefully scrutinized loans because they usually kept them and lived with the consequences of any defaults, all under the direct scrutiny of bank regulators. Now the bank regulators and the SEC entrusted the regulatory keys to the NRCROs. The latter used them to make record profits in parallel with the originators, securitizers (who usually were commercial and investment banks), and the marketers who sold the securitized bonds.
In particular, home mortgages were pooled into mortgage-backed securities (MBS), that 7 See the second paragraph of Section 5 of this remarkable article. Eisher, Theo S. “House Prices and Land Use Regula-tions: A Study of 250 Major US Cities”. Working Paper Version 2 May 2008. Forthcoming Northwest Journal of Business and Economics. http://depts.washington.edu/teclass/landuse/ 8 The Turner Building Cost Index measure the cost of building construction in the US (excluding land). This index is com-puted by the Turner Construction Company from labor rates and productivity, material prices, and the competitive condi-tion of the marketplace nationwide. It is widely used by the construction industry and by Federal and State governments. The Turner Construction Company is one of the largest construction management firms in the world. 9 Many adjustable-rate mortgages were indexed on 1-month Libor, which fell from 6.827% in November 2000 to 1.007% in April 2004, rose to 5.4975% in August 2007 and fell to 1.621 in November 2008. 10 Last four are: Office of Federal Housing Enterprise Oversight (independent regulator of Freddie Mac and Fannie Mae from inside HUD), Federal Deposit Insurance Corporation, and Financial Industry Regulatory Authority (Non-government organization formed from oversight departments of NASD and NYSE in 2007. The latter regulates their members and bro-ker-dealers and those of most US stock exchanges). 11 Two easy, short explanations of CDOs are provided in: Tavakoli, Janet. “Introduction to Collateralized Obligations”. Tavakili Structured Finance, Inc. Company handout 2003; and Accruedint. “How does a CDO work?”. Accrued Interest Website (accruedint.blogspot.com) posting of 12 March 2007.

The Financial Crisis: why, where it is going & how to fix it page 4 of 24 28 January 2008
were repackaged into CMOs (collateralized mortgage obligations). A CMO is a set of bonds where each bond is the right to a part of the entire MBS cash stream. It is one of many types of CDO. The resulting surge of easy credit fueled effective demand for consumer dur-ables and houses that: raised house prices 86.4% from November 2000 to July 2006 (64.2% adjusted for inflation); caused an increased in home and consumer durable produc-tion, and thus raised GDP (gross domestic product = value of all goods and services pro-duced in the US). This house price rise had several pernicious effects. It emboldened home borrowers, lenders, securitizers, and CDO salespeople. In particular, it lead amateur speculators (“flippers”), to borrow more often and larger, which bid up house prices still fur-ther, and worst of all, both masked and rewarded rushed, careless, and occasionally fraudulent lending. Some of these mortgages were home-equity lines that further fueled the surge in consumer-durables.
Such careless practices were epitomized by: three investment banks, namely Bear Stearns, Lehman Brothers, and Merrill Lynch, as well as, a prominent home-mortgage originator, New Century Financial Corp. (formerly NYSE NEW, now Pink-sheet NEWXQ). The 2007 Fortune Magazine Corporate Rankings for these firms were 138, 47, 22, and 700, respec-tively. On 1 January 2007, New Century was the second-largest US subprime home-mortgage originator, with 7,200 full-time staff and a $1.75 billion market capitalization. It filed for bankruptcy on 2 April 2007. On 16 March 2008, Bear Sterns and JP Morgan an-nounced a merger, that saved the latter from bankruptcy. On 15 September 2008, Lehman Brothers filed for bankruptcy, and Bank of America announced it would acquire of Merrill Lynch, which saved the latter from bankruptcy. The Fed and Treasury accommodated and subsidized the Bear-Morgan merger and the Merrill acquisition.
In this late-2000-to-early-2007 heyday of securitization, the major commercial and invest-ment banks continually improved their regulatory arbitrage. They devised ever-more effi-cient ways of minimizing the capital used and maximizing the fees earned. This was possi-ble because of the ever-growing demand for highly-rated CDOs, that in turn was fueled by the regulatory and legal changes, like milestones (i.) through (iv.) above. Caprio et al point out the SEC’s and Fed’s role in creating this demand: “On the demand side, the SEC and bank regulators set rules that fed a huge demand, by trusteed investors, for investment grade and other highly-rated debt.”1 These banks partnered with vast networks of sales forces that originated loans and others that placed the securitized bonds. These securitiza-tions were done nominally off their balance sheets (under Basil I) in league with NRCROs, which had strong profit incentives to overrate securitizations. The entire process proceeded under the blessing of, but with little or no scrutiny from, the SEC and bank regulators. The leverage, risk, and complexity of the securities those banks sold and held rose dramatically. All this is chronicled in two recent papers, which provide good explanations of the regula-tory, legal, and policy origins of the financial crisis.1,12
Hence, CDO volumes soared and their true average quality plummeted. In 2001 $330 bil-lion of new subprime, Alt-A, and home-equity-line residential mortgages were issued, which was 15% of all new mortgages on US residences. In 2004, it grew to $1.1 trillion and 37%, and peaked in 2006 at $1.4 trillion and 48%.13 From 1995 to 2005, mortgage-backed secu-rity (MBS) pools, that were collateralized by subprime home mortgages (excludes Alt-A and equity line), grew from $18.5 to $507.9 billion.14 The S&P Case/Shiller 10-city Composite
12 A Congressional Research Service Report for Congress by Getter, D. E., Jickling, M., Labonte, M., and Murphy, E.V. “Financial Crisis? The Liquidity Crunch of August 2007”, 21 September 2007. Order Code RL34182. 13 Inside Mortgage Finance, 2007 Mortgage Statistical Annual, vol. 1, p. 3. 14 These MBS are used to create mortgage-backed bond, pass-through securities, CMOs, real estate mortgage investment conduits, and stripped MBS. See footnote 2. CMO stands for collateralized mortgage obligation, which is the set bonds that are the rights to the cash stream from MBS.

The Financial Crisis: why, where it is going & how to fix it page 5 of 24 28 January 2008
Index was 75.43 at the start of the bubble in February 1997 and peaked in June 2006 at 226.29. This was a 12.61%/year compound increase. Inflation averaged about 2.21%/year compounded in that period. Hence, house prices (adjusted for inflation) rose 10.31%/year on average in the bubble.15
(1.3) House Price Bubble Burst
The US house bubble peaked in July 2006 and home prices fell nationwide 21.77% by Sep-tember 2008.16 So many home-mortgages defaulted by March 2007 that the (often circui-tous) pass-through payments to CMO and CDO holders fell notably. The first prominent CDO failures started with 90% and 100% deficiencies, respectively, in monthly cash flow to two Bear Stearns hedge funds17. These funds held leveraged subprime CDO positions, and in June 2007 began to close.
This spread panic into the rest of the CDO market in less than a month, and into other credit markets worldwide, and all the other financial markets by September 2008. Investor panic depressed many asset prices to irrational levels, and mark-to-market accounting rules18 then forced hedge funds and investment-bank proprietary traders to show losses, even on assets with steady cash flows, good collateral, and miniscule defaults. That led in-vestors to withdraw equity and loans to such funds and traders, and in some cases led counterparties to stop trading with them. Hence, the very people who could bring price dis-covery and rationality to the market were sidelined. Their absence unbridled the irrational fall in prices and thus exacerbated investor panic. Eventually the investors holding the MBS and CDOs, who foolishly trusted the regulators and their proxies, the NRCROs, lost far more money than the NRCRO, originators, and bankers made, and created the crisis.
The financial crisis is having several negative side effects, that will in turn, exacerbate the crisis. The most important of these is the destruction of mortgage collateral value. We are facing a repeat of the home-collateral loss from the 1980’s saving & loan crisis, on a vastly larger scale, as explain in Section (4.) below. Another effect is that the Government owning almost 80% of firms like AIG has made the management much less risk averse. Since re-ceiving a $150 billion bailout they are risking mostly the Government’s money. AIG is now taking enormous risk by selling commercial insurance at half the price of their competitors.
The essence of the financial crisis is the lack of investor confidence and trust in financial institutions and the information they provide. These institutions include fund managers, investment advisors, legal and accounting firms, rating agencies, credit-enhancement pro-viders, commercial and investment banks, as well as, Government regulators and officials. The panicked-investment climate led investors to shun assets not guaranteed by govern-ments, and employees to lose confidence in their future employment. The former sent the prices of such non-guaranteed assets plummeting, and the latter triggered a fall in con-sumption. Thus, businesses have had difficulty in both financing their production and in selling it. These two behaviors feed on each other and started the recent spiral of lower as-set prices, output, employment, and increased store closings.
15 We use the S&P Case/Shiller Index Compoiste 10-City Index CSXR because the OFHEO index has problems and the 20-city index was not computed before 2000. 16 June 2006 to September 2008 Composite 20 values of the S&P/Case-Shiller Home Price Index. 17 Two Cayman Island funds: Bear Stearns High-Grade Structure Credit Strategies Master Fund Ltd. and Bear Stearns High-Grade Structure Credit Strategies Enhanced Leverage Master Fund Ltd. 18 Rules that require assets to be valued (‘marked”) on balance sheets (daily in many cases) at the price at which it is traded, or in the absence of an observable price, at a theoretical equivalent value. Each such price change is an income event.
The Financial Crisis: why, where it is going & how to fix it page 6 of 24 28 January 2008
(2.) THE SPARK: “MARKET FAILURE” IN CDOs
Market failure is the economic condition defined by a free market not achieving efficient al-location of scarce resources. This efficient allocation is known to economists as a “Pareto- optimal allocation”, and is defined as an allocation for which no reallocation can make any market participant better off without making another worse off. It is equivalent to achieving a price equilibrium, in which everyone is holding the set of assets they want, given market prices and their budget constraint. Theoretically, in such an allocation, investors who are willing and able to pay the most for a given asset, like a CDO, are left holding it.
This definition of market failure is vague. Some economists and commentators describe a market as suffering from market failure when, in fact, that market merely has significant transaction costs that are overlooked and cause suboptimal allocation. The current mar-kets for CDOs, and Level III assets in general, suffer from three important transaction costs that, in part, explain the lack of trading and therefore of apparent market failure. I will la-bel these types of transaction costs: asset complexity, valuation complexity, and property- right complexity. These transaction costs are explained in Subsection (2.1) and their effects on the financial markets are described in Subsection (2.2) and Section (3.) below.
(2.1) TRANSACTION COSTS
While these explanations of transaction costs may seem tedious, they are crucial for grasp-ing the mechanics of the market failure that started the financial crisis. To understand the effects of these transaction costs on those markets, let us start from the simple and obvious premise that any particular asset is valued by an investor based on his or her expectations of that asset’s future cash stream.
(2.1.1) Asset-Complexity Transaction Cost
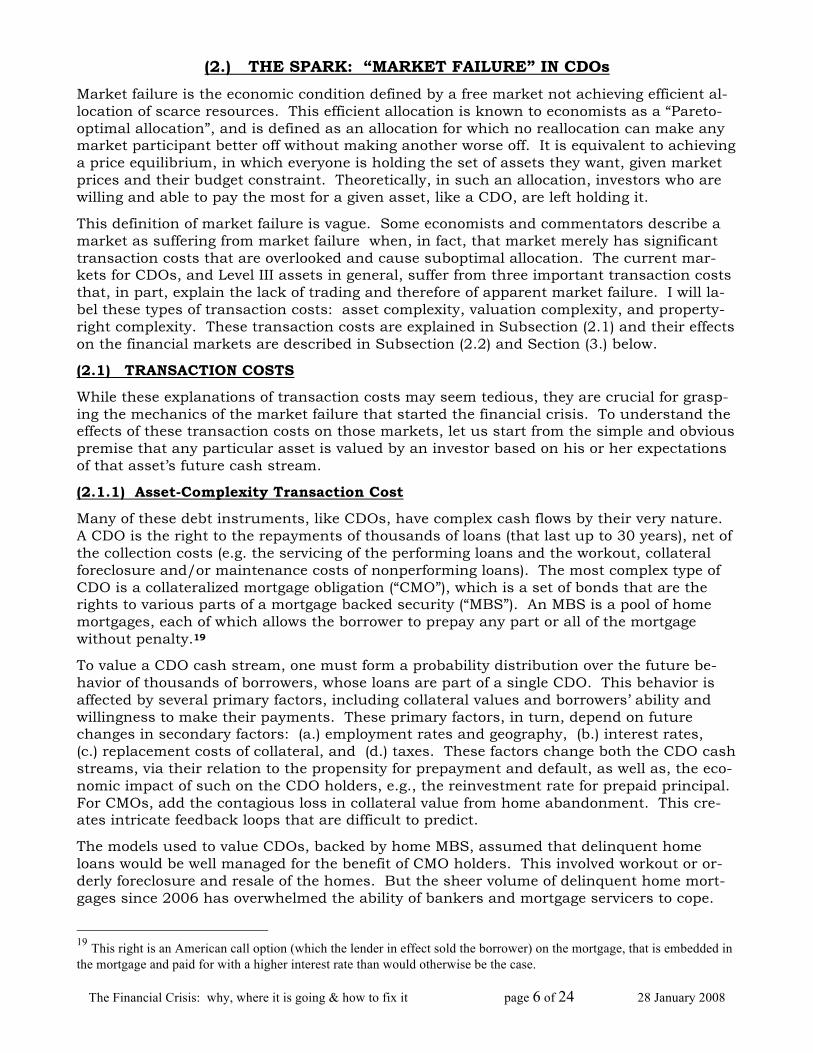
Many of these debt instruments, like CDOs, have complex cash flows by their very nature. A CDO is the right to the repayments of thousands of loans (that last up to 30 years), net of the collection costs (e.g. the servicing of the performing loans and the workout, collateral foreclosure and/or maintenance costs of nonperforming loans). The most complex type of CDO is a collateralized mortgage obligation (“CMO”), which is a set of bonds that are the rights to various parts of a mortgage backed security (“MBS”). An MBS is a pool of home mortgages, each of which allows the borrower to prepay any part or all of the mortgage without penalty.19
To value a CDO cash stream, one must form a probability distribution over the future be-havior of thousands of borrowers, whose loans are part of a single CDO. This behavior is affected by several primary factors, including collateral values and borrowers’ ability and willingness to make their payments. These primary factors, in turn, depend on future changes in secondary factors: (a.) employment rates and geography, (b.) interest rates, (c.) replacement costs of collateral, and (d.) taxes. These factors change both the CDO cash streams, via their relation to the propensity for prepayment and default, as well as, the eco-nomic impact of such on the CDO holders, e.g., the reinvestment rate for prepaid principal. For CMOs, add the contagious loss in collateral value from home abandonment. This cre-ates intricate feedback loops that are difficult to predict.
The models used to value CDOs, backed by home MBS, assumed that delinquent home loans would be well managed for the benefit of CMO holders. This involved workout or or-derly foreclosure and resale of the homes. But the sheer volume of delinquent home mort-gages since 2006 has overwhelmed the ability of bankers and mortgage servicers to cope.
19 This right is an American call option (which the lender in effect sold the borrower) on the mortgage, that is embedded in the mortgage and paid for with a higher interest rate than would otherwise be the case.

The Financial Crisis: why, where it is going & how to fix it page 7 of 24 28 January 2008
This has greatly reduced collateral value and lead to a contagion of foreclosures. In general, bankers and servicers are not able to efficiently deal with the delinquencies and collateral.
The highly-heterogeneous nature of CDOs is another part of this complexity. Just in the CMO variant of CDOs, there are many basic types of home loans, often in the same CMO: fixed rate, floating rate, hybrid (part fixed and float), low “teaser” fixed rate turning to higher fixed or floating rate, non-amortizing balloon payment loans, graduated payment, negative amortizing, “no documentation”, and “no-income verification”. This heterogeneity continues with the different homes that are mortgaged and the particular circumstances of those mortgages, including quality of the documentation involved, local real-estate markets, the income and economic circumstances of the borrower, and state laws, etc. This complexity is sometimes exacerbated by the partition of the CMO into many different bonds. Some of this partitioning creates additional risk, as in principal-only and interest-only bonds. When part or all of a CMO is paid off early, any principal-only bond holder is helped by earlier re-payment of principal, undiminished for the time value of money, whereas the interest-only bond holder is hurt by losing their payments for that part of the loan.
Hence, it is difficult for CDO investors to understand both the mechanics of the promised cash stream and a probability distribution over that stream. I recently reviewed a 15-page bid on valuing the bonds from a CMO. The bid was $240,000 to construct a model of the cash flow, and $64,000/month to maintain it. All of this increases the risk and cost of trading CDOs, to an even greater degree than the heterogeneity of the municipal and corpo-rate bonds does in those markets. It also makes investors more leery of coping with CDOs when their value changes in unexpected ways, because it is so difficult to appreciate their circumstances or to evaluate alternative strategies, e.g., holding, selling, or hedging.
(2.1.2) Valuation−Complexity Transaction Cost
A fundamental task of accounting is to assign a useful value to an asset. In November 2007, the Financial Accounting Standards Board issued Statement of Financial Accounting Standard (SFAS) 157. It required many firms to mark to market financial assets. The lack of a liquid CDO market has made this difficult and led to a disparity of values among hold-ers of the same instrument. The theoretical foundation of SFAS 157 is problematic.
The value of an asset to a firm depends in part on how it intends, and how it is able, to make use of that asset. In many cases, a firm intends to sell the asset and cannot make economic use of it in any other way. Consider a medical supply firm owning an X-ray ma-chine, with no ability to use it for anything but selling it. In contrast, a radiologist can use it either as a diagnostic tool, and thus earn a stream of marginal revenue from it, or sell it. Suppose the medical supply house can profitably sell it for $10,000 with $1,000 of addi-tional marketing costs, and the radiologist can use it to increase the present value of his or her cash flow by $20,000. Further suppose there is a tax credit on the machine for doctors, but not suppliers, worth $1,000 in present value. Then the machine’s economic value to the supply company is $9,000, but to the radiologist it is $21,000.
Real estate workers often use an analogous concept of “highest and best use” to describe the particular use of a property in valuing it. Note that these two values above do not vio-late the economic “law of one price”, but rather explain why the medical supply company is happy to sell a machine, and the radiologist is happy to buy it, for a $10,000 price. Some firms can never use an advantage associated with an asset, while others can. Such advan-tages include economies of scale or scope, marketing, technology edge, and regulatory or tax advantages. Thus, the net value of an asset and its associated tax credit differ across firms, and this often explains why some firms will sell to others. In Section (6.) below, changes to FASB 157 are suggested that will more closely reflect economic reality and will eliminate the accounting-driven part of the financial crisis.
The Financial Crisis: why, where it is going & how to fix it page 8 of 24 28 January 2008
(2.1.3) Property–Right Complexity Transaction Cost
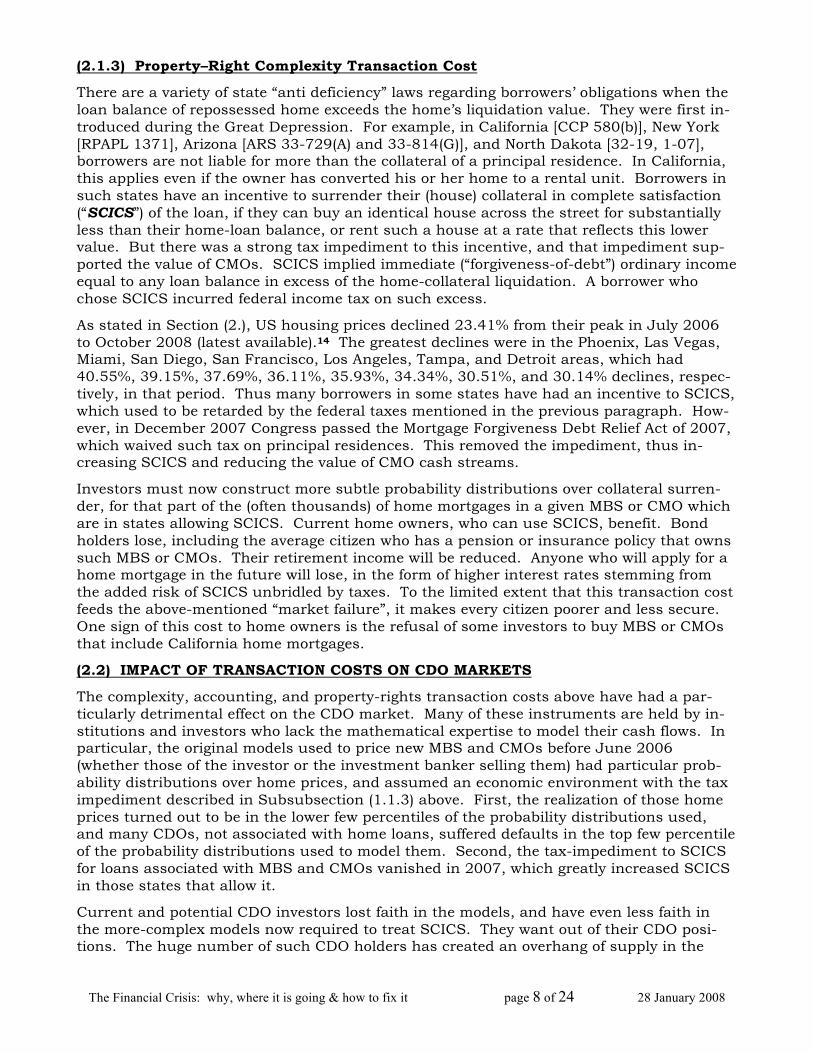
There are a variety of state “anti deficiency” laws regarding borrowers’ obligations when the loan balance of repossessed home exceeds the home’s liquidation value. They were first in-troduced during the Great Depression. For example, in California [CCP 580(b)], New York [RPAPL 1371], Arizona [ARS 33-729(A) and 33-814(G)], and North Dakota [32-19, 1-07], borrowers are not liable for more than the collateral of a principal residence. In California, this applies even if the owner has converted his or her home to a rental unit. Borrowers in such states have an incentive to surrender their (house) collateral in complete satisfaction (“SCICS”) of the loan, if they can buy an identical house across the street for substantially less than their home-loan balance, or rent such a house at a rate that reflects this lower value. But there was a strong tax impediment to this incentive, and that impediment sup-ported the value of CMOs. SCICS implied immediate (“forgiveness-of-debt”) ordinary income equal to any loan balance in excess of the home-collateral liquidation. A borrower who chose SCICS incurred federal income tax on such excess.
As stated in Section (2.), US housing prices declined 23.41% from their peak in July 2006 to October 2008 (latest available).14 The greatest declines were in the Phoenix, Las Vegas, Miami, San Diego, San Francisco, Los Angeles, Tampa, and Detroit areas, which had 40.55%, 39.15%, 37.69%, 36.11%, 35.93%, 34.34%, 30.51%, and 30.14% declines, respec-tively, in that period. Thus many borrowers in some states have had an incentive to SCICS, which used to be retarded by the federal taxes mentioned in the previous paragraph. How-ever, in December 2007 Congress passed the Mortgage Forgiveness Debt Relief Act of 2007, which waived such tax on principal residences. This removed the impediment, thus in-creasing SCICS and reducing the value of CMO cash streams.
Investors must now construct more subtle probability distributions over collateral surren-der, for that part of the (often thousands) of home mortgages in a given MBS or CMO which are in states allowing SCICS. Current home owners, who can use SCICS, benefit. Bond holders lose, including the average citizen who has a pension or insurance policy that owns such MBS or CMOs. Their retirement income will be reduced. Anyone who will apply for a home mortgage in the future will lose, in the form of higher interest rates stemming from the added risk of SCICS unbridled by taxes. To the limited extent that this transaction cost feeds the above-mentioned “market failure”, it makes every citizen poorer and less secure. One sign of this cost to home owners is the refusal of some investors to buy MBS or CMOs that include California home mortgages.
(2.2) IMPACT OF TRANSACTION COSTS ON CDO MARKETS
The complexity, accounting, and property-rights transaction costs above have had a par-ticularly detrimental effect on the CDO market. Many of these instruments are held by in-stitutions and investors who lack the mathematical expertise to model their cash flows. In particular, the original models used to price new MBS and CMOs before June 2006 (whether those of the investor or the investment banker selling them) had particular prob-ability distributions over home prices, and assumed an economic environment with the tax impediment described in Subsubsection (1.1.3) above. First, the realization of those home prices turned out to be in the lower few percentiles of the probability distributions used, and many CDOs, not associated with home loans, suffered defaults in the top few percentile of the probability distributions used to model them. Second, the tax-impediment to SCICS for loans associated with MBS and CMOs vanished in 2007, which greatly increased SCICS in those states that allow it.
Current and potential CDO investors lost faith in the models, and have even less faith in the more-complex models now required to treat SCICS. They want out of their CDO posi-tions. The huge number of such CDO holders has created an overhang of supply in the

The Financial Crisis: why, where it is going & how to fix it page 9 of 24 28 January 2008
market, which leads even mathematically-sophisticated and well-capitalized investors to fear that whatever the current price is, it will go lower.
This fear is accentuated by the recent experience of exactly such investors. Last year, many of them correctly determined that some high-quality CDOs were selling for less than the present value of any realistic probability distribution of their future cash flows. They pur-chased such CDOs, often with leverage. As the events described above unfolded, CDO prices fell still further below any rational valuation, even given those events. Most of these sophisticated investors are hedge funds or proprietary desks that must mark their CDOs to market. Thus, they have been showing their investors or parent organizations serious losses, which together with the lack of liquidity, have cut off their access to equity capital and borrowing. This despite the fact that the cash flow of these marked-down CDOs, from purchase to maturity, is very profitable. Hence the very market participants who might bring price discovery and liquidity to the market (and make a profit in the process), and thus Pareto efficiency, are out of the game. This explains the lack of a market in CDOs and what passes for “market failure”.
The spread of financial crisis from markets for assets that were previous overvalued to the markets for assets that have good cash flows, is in large part a mark-to-market accounting problem. Suggestion (E.) in Section (6.) would attenuate this problem, by allowing firms to value assets on a present value basis. Note that insurance companies have a very different regulatory regime, that does not use FASB 157, and as a consequence, they have been largely spared the financial panic of many other financial institutions. The problems with AIG stemmed from their London subsidiary, which was not under US insurance regulation.
(2.3) LEVEL III ASSETS
The problems described above are crystallized in the Level III assets held by major financial institutions. CDOs are now Level III assets. Level I assets are those assets for which there is a liquid-market price available. Level II assets are those assets that can be valued by a close proxy asset and a no-arbitrage argument. Level III assets are those assets with nei-ther. The latter require complex mathematical models and many assumptions.
At best, hedge-fund managers and the traders on proprietary trading desks, that own these assets, have good insight into their true value. But internal and external auditors, risk managers, rating agencies, and regulators are far less knowledgeable about their worth. Many Level III assets have been grossly over-rated by rating agencies. As if that were not bad enough, those same managers or traders that are responsible for marking their Level III assets to market, are paid fees or bonuses based on how much those marks rise each year. Thus, many Level III assets have been marked far above any reasonable measure of their worth. The CDO market failure immediately focused investors on these problems, making them undesirable, and thus virtually stopped trading in Level III assets.
Many of the major investment banks and other financial institutions with substantial Level III assets and high leverage, have overvalued Level III assets. This has occurred to such an extent that they were bankrupt, or could have quickly become so. They may own CDOs di-rectly and/or have exposure to them via credit-default swaps. Note that mathematical complexity masks reality enough so that many of these obligations were grossly overvalued by such proprietary desks, while other firms have recently marked the same assets at val-ues far below a rational present value of their cash flows. Sheer uncertainty is added to the already-scary credit markets by firms’ unpredictable adjustments to Level III values.
Examples of the July 2008 ratios of Level III assets to equity are reported by The Financial Times website FT.com ($s in billions): Citigroup ratio 1.05 = $135/$128; Goldman Sachs ratio 1.85 = $72/$39; Morgan Stanley ratio 2.51 = $88/$35; Bear Stearns ratio 1.54 = $20/$13 billion; and Merrill Lynch ratio 0.38 = $16/$42. Even if the illiquidity and over-

The Financial Crisis: why, where it is going & how to fix it page 10 of 24 28 January 2008
valuation of these assets has not made them bankrupt, they are in danger of spiraling to such a state in a few days if suspicions develop that their Level III are substantially overval-ued, because they will not be able to trade. Counterparties will not trade with them if: (i.) it is widely feared their assets may be marked down far further, or (ii.) if it is widely believed that any of several credit-worthiness measures drop below contractually-specified levels (a “credit event”) in any of their hundreds of bilateral ISDA (International Swap Dealers Asso-ciation) agreements. These measures involve mark-to-market values and various financial ratios. Worse yet, failing firms may default or delay payment on some obligations to other-wise solvent firms, leading to a cascade of insolvencies.
(3.) SPILLOVER TO ALL FINANCIAL MARKETS
(3.1) SPILLOVER TO FINANCIAL INSTITUTIONS’ BALANCE SHEETS
There is an enormous quantity of Level III assets (including CDOs backed by US home mortgages) widely held by the major participants in the US credit markets. These partici-pants include the commercial and investment banks, hedge funds, insurance companies, and other financial institutions around the world. Hence, the fall in Level III-asset prices (where these prices can be found), the lack of liquidity and price discovery, and the conse-quent uncertainty have combined to impair the balance sheets of these participants. This has recently reduced the ability (at least temporarily) of many prominent firms to act as counterparties to trades in the general credit markets.
Some of this risk of CDOs and other Level III assets has been passed from one financial in-stitution to another via credit-default swaps (“CDS”). The writers (issuers) of those CDSs did not fully factor the transaction costs described above into their valuations, and in gen-eral grossly under-estimated the risks. This had two pernicious effects. The first effect is that it gave comfort to many investors supplying capital to firms that purchased CDOs, be-cause much of the ultimate risk was insured, via these CDSs, by firms with high credit rat-ings. The most prolific issuer was London-based AIG Financial Products, which is a sub-sidiary of previously-AAA-rated AIG, that guaranteed its obligations. The second effect is that it spread potential insolvency to firms that were not otherwise heavily involved in CDOs, such as AIG and many of its counterparties.
(3.2) BALANCE SHEET EFFECTS ON FALLING & IRRATIONAL RELATIVE PRICES
The shock of such firms (like Bear Stearns, Merrill Lynch, Lehman Brothers, Morgan Stan-ley, AIG, and Goldman Sachs) suddenly being unworthy to trade with in September 2008, has contributed to a loss of investor faith in many of the institutions and mechanisms of the general credit markets. These investors wonder who they can trade with safely and just what they can count on after such a fall from grace of the financial titans. They have been fooled and disappointed by: investment banks who sold CDOs, mathematical models that valued such obligations, internal and external accountants and rating agencies that deter-mined or opined on their valuations, as well as, firms and funds that invested in such obli-gations. This has stifled many normal commercial activities of the credit markets, and brought on the specter of bankruptcy or Government bailout to many prominent firms.
A frightening consequence of this loss of faith is its contagion from CDOs to almost all non-government financial instruments: debt, equity, and commodity. That has led to a write- down of the value of privately-issued financial assets across the board, which has weakened corporate and hedge-fund balance sheets, and thus greatly impaired commerce. This will be an economic disaster if it persists. The switch of TARP policy in October 2008, from buy-ing illiquid fixed-income assets of financial institutions to injecting capital into those insti-tutions via preferred stock purchases, recognized this phenomena and its gravity.
US Treasury bonds are in great demand as the other markets are becoming far less liquid
The Financial Crisis: why, where it is going & how to fix it page 11 of 24 28 January 2008
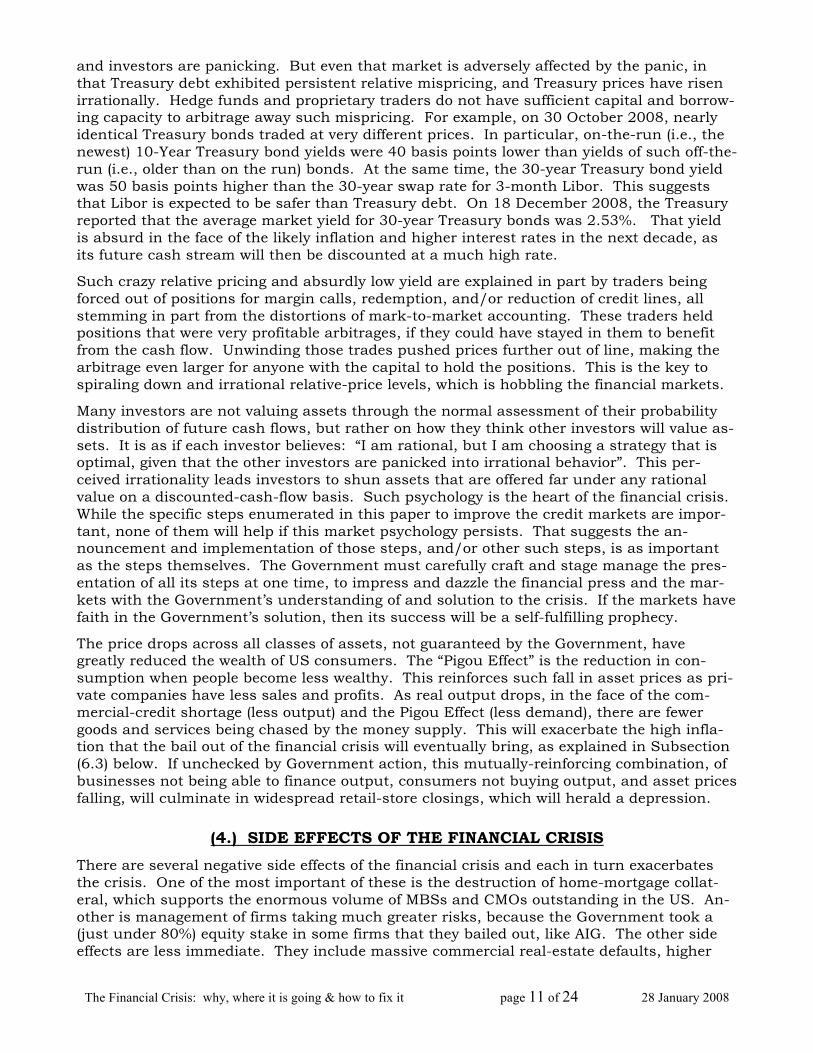
and investors are panicking. But even that market is adversely affected by the panic, in that Treasury debt exhibited persistent relative mispricing, and Treasury prices have risen irrationally. Hedge funds and proprietary traders do not have sufficient capital and borrow-ing capacity to arbitrage away such mispricing. For example, on 30 October 2008, nearly identical Treasury bonds traded at very different prices. In particular, on-the-run (i.e., the newest) 10-Year Treasury bond yields were 40 basis points lower than yields of such off-the-run (i.e., older than on the run) bonds. At the same time, the 30-year Treasury bond yield was 50 basis points higher than the 30-year swap rate for 3-month Libor. This suggests that Libor is expected to be safer than Treasury debt. On 18 December 2008, the Treasury reported that the average market yield for 30-year Treasury bonds was 2.53%. That yield is absurd in the face of the likely inflation and higher interest rates in the next decade, as its future cash stream will then be discounted at a much high rate.
Such crazy relative pricing and absurdly low yield are explained in part by traders being forced out of positions for margin calls, redemption, and/or reduction of credit lines, all stemming in part from the distortions of mark-to-market accounting. These traders held positions that were very profitable arbitrages, if they could have stayed in them to benefit from the cash flow. Unwinding those trades pushed prices further out of line, making the arbitrage even larger for anyone with the capital to hold the positions. This is the key to spiraling down and irrational relative-price levels, which is hobbling the financial markets.
Many investors are not valuing assets through the normal assessment of their probability distribution of future cash flows, but rather on how they think other investors will value as-sets. It is as if each investor believes: “I am rational, but I am choosing a strategy that is optimal, given that the other investors are panicked into irrational behavior”. This per-ceived irrationality leads investors to shun assets that are offered far under any rational value on a discounted-cash-flow basis. Such psychology is the heart of the financial crisis. While the specific steps enumerated in this paper to improve the credit markets are impor-tant, none of them will help if this market psychology persists. That suggests the an-nouncement and implementation of those steps, and/or other such steps, is as important as the steps themselves. The Government must carefully craft and stage manage the pres-entation of all its steps at one time, to impress and dazzle the financial press and the mar-kets with the Government’s understanding of and solution to the crisis. If the markets have faith in the Government’s solution, then its success will be a self-fulfilling prophecy.
The price drops across all classes of assets, not guaranteed by the Government, have greatly reduced the wealth of US consumers. The “Pigou Effect” is the reduction in con-sumption when people become less wealthy. This reinforces such fall in asset prices as pri-vate companies have less sales and profits. As real output drops, in the face of the com-mercial-credit shortage (less output) and the Pigou Effect (less demand), there are fewer goods and services being chased by the money supply. This will exacerbate the high infla-tion that the bail out of the financial crisis will eventually bring, as explained in Subsection (6.3) below. If unchecked by Government action, this mutually-reinforcing combination, of businesses not being able to finance output, consumers not buying output, and asset prices falling, will culminate in widespread retail-store closings, which will herald a depression.
(4.) SIDE EFFECTS OF THE FINANCIAL CRISIS
There are several negative side effects of the financial crisis and each in turn exacerbates the crisis. One of the most important of these is the destruction of home-mortgage collat-eral, which supports the enormous volume of MBSs and CMOs outstanding in the US. An-other is management of firms taking much greater risks, because the Government took a (just under 80%) equity stake in some firms that they bailed out, like AIG. The other side effects are less immediate. They include massive commercial real-estate defaults, higher

The Financial Crisis: why, where it is going & how to fix it page 12 of 24 28 January 2008
crime and drug-abuse rates, less state and local spending on infrastructure, less state and local, as well as, individual spending on education. Each of these will retard economic growth.
(4.1) HOME-COLLATERAL DESTRUCTION
A little-thought-about, but now-crucial, consideration in the value of extant CDOs, backed by home MBS, is the shortage of competent personnel to assess and negotiate “work outs” or to foreclose and resell collateral. In the best case a delinquent home mortgage is:
(i.) modified so the borrower remains in and maintains their home via mortgage modifica- tion or exchanged for a rental agreement (in a way that benefits both the homeowner and CMO holder), or
(ii.) foreclosed and the home maintained and resold for its market value in an orderly manner, without damage, disrepair, unnecessary ill effects on neighboring homes, or interruption of insurance and property-tax payments.
In the worst case, the absence of such personnel has resulted in needless home abandon-ment, which in turn has led to lower property values and contagious abandonment of neighboring homes. This has caused social trauma for the home-owning families involved, as well as, reduced the mortgage-collateral value as homes fell into disrepair, were vandal-ized, insurance and property taxes were unpaid, and municipalities seized homes.
Most home-mortgage companies and servicers appeared competent at originating, process-ing, and servicing home loans when sales were booming. However, they do not have the ex-pertise, staff, or organization to deal with workouts and foreclosures at the current scale of delinquencies. In general, such organizations lack even the ability and inclination to retain and manage well-qualified contractors to perform these services.
One frightening possibility in the next three years is that part of the savings & loan crisis will repeat. In particular, that there might be massive: (a.) home-mortgage delinquency, (b.) mortgage-originator failures, and (c.) numbers of unemployed mortgage salespeople be-coming mortgage-delinquency managers attempting the tasks in (i.) and (ii.) above. On av-erage, they would likely mirror the horrendous performance of unemployed savings and loan officers who became Resolution Trust Corporation (RTC) officers.
From the 1989 establishment of the RTC until all its assets were sold in 1995, 29.4% ($152.9 billion) of the $519.0 billion value, in thrift assets acquired by the RTC, were lost. This cost the Government $123.8 billion, and cost the owners and creditors of 1,043 failed thrift institutions $29.1 billion.20 That totals $191.4 billion in July 2008 dollars. This loss transpired in the very favorable housing and business environment during which the RTS operated (August 1989 to December 1995 inclusive). In that period the OFHE0’s repeat-purchase House Price Index rose every quarter, growing 27.04% in total and 3.90%/year on average, while real output (adjusted for inflation) grew 15.97%.21 This contrasts with much-less-favorable circumstance of the current crisis, in which house prices fell 21.77% since June 2006,22 and real GDP fell at a rate of 0.5%/year in the third quarter of 2008.
20 Weiss, N. Eric, “Government Interventions in Financial Markets: ...”. Congressional Research Service Report for Con-gress. 25 March 2008. Order Code RL34423. 21 This is the Office of Federal Housing Enterprise Oversight’s Repeat-Purchase House Price Index. GDP rose every quarter but one for a total 35.99% growth, which is an compounded average of 5.04%/year. Real GDP (i.e., GDP adjusted for inflation) in that period rose every quarter but two for a total 15.97% growth, which is a compounded average of 2.36%/year. 22 We used the S&P/Case-Shiller Home Price Index for this recent period because it is widely regarded as a better measure than the OFHEO Index, but could not use it for the 1989 to 1995 because it did not exist then.
The Financial Crisis: why, where it is going & how to fix it page 13 of 24 28 January 2008
Assume that only subprime, Alt-A, and home-equity home mortgages, that are currently outstanding, ever have any default. There are about $6.5 trillion of such loans, compared to the $0.649 trillion in assets acquired by the RTC in 1989 in July 2008 dollars. That is 10 times as much assets, and those assets have a much higher delinquencies. The same proportion of losses as the RTC suffered, with better assets in a much better economic cli-mate, will leave us with $2.941 trillion in lost collateral. That is more than 1/5 of the $14.5 trillion of US GDP (20.3% of all the US goods and services produced in 2008).
(4.2) RISK TAKING BY RESCUED FIRMS
The US Government now owns almost 80% of the equity in some rescued firms, like AIG. This has created a severe incentive-compatibility problem between the management of those firms and the Government as owner and as watch dog of the country’s economic health. The managers have little to lose and much to gain by taking big risks, as they share part of the profits but almost none of the losses. Private stockholders, who would otherwise police this behavior, are now largely replaced by Government owners, who have not the inclina-tion, skills or incentive to do such policing.
AIG in particular, has received a $150 billion Government bailout.23 Naturally, the manag-ers of AIG are putting that to use to make as much bonus and stock-option profit as possi-ble, without the usual oversight of private stockholders. These managers do not share much in the downside, and thus have a powerful incentive to take big risks with that money. After November 2008, AIG has been booking a surge of commercial-insurance pre-mium by quoting much lower prices than their competitors. Much of this business has been at half the rate of competitors.24 The competition has responded by lowering their prices, so we getting systematically the wrong incentives for risk taking by insurance buy-ers. Sadly, many businesses are buying AIG commercial insurance because the Govern-ment now stands behind them, instead of shying away from too-good-to-be-true prices that would ordinarily make them wary of the insurer’s ability to payout claims. It seems the Government has learned nothing from the lessons of the bad policy milestones and devel-opments [enumerated (i.) thru (vii.) and (a.) thru (f.) in Section (1.)], the perverse incentives they created, and bad economic outcomes that eventually resulted. Worse yet, other insur-ance companies are now pressed to lower their rates, all of which raises the probability of an insurance-underwriter crisis like the investment-banking crisis of 2008.
(5.) DELEVERAGING, WRITE−DOWNS, AND DEFLATION
We have not addressed two recent effects on the money supply: (i.) apparent deleveraging of US dollar debt, i.e., reduction in US-dollar loans outstanding, and (ii.) writing-down of US bank assets. Both phenomena are reported worldwide, and if true, represent dangers to the US economy, which offset temporarily the inflation dangers of the bailout described in Subsection (7. 3) below. Existing US-dollar loan balances are reportedly being repaid faster than the sum of: creation of new loans and the net increase in existing loan principal. As mentioned in Subsections (2.2) above, many financial assets are being written down as their market or perceived market value falls. In this analysis, we will divide US dollar loans to nonbanks into two classes: lending by nonbanks and lending by banks.
Changes in balances lent by nonbanks do not affect the money supply as their issue and repayment occurs by movement of money between the demand deposits of lenders and bor-rowers, thus not changing the total demand deposits outstanding. However, changes in 23 “AIG gets $150 billion government out; posts huge loss”. Reuters Business & Finance Section 10 November 2008. 24 I obtained this data from a few of the largest US commercial insurance brokers. It can only be verified by comparing the relative prices quoted of different insurance carriers like AIG, and by comparing current quotes with those made before August 2008.
The Financial Crisis: why, where it is going & how to fix it page 14 of 24 28 January 2008
bank lending does, according to classical economic theory, effect the money supply, as bor-rowers reduce their demand deposits to pay off loans. A $1 reduction does not increase as-sets of the bank, but rather frees up $0.10 of their reserves, so that the bank can lend that $1 again. If the bank does not lend that dollar, then the money supply is decreased (de-flated) by $1. That reduction is not increased by the money multiplier, even theoretically.
As US banks write down the value of their financial assets, their bank capital falls. How-ever, US banks must maintain 8% of assets in bank capital, and these assets (in the lan-guage of bank regulation) include demand deposits. Bank capital is bank assets minus bank liabilities. Thus, writing down an asset in a bank’s capital by $1 theoretically reduces the money supply by whatever reduction in lending occurs, up to a maximum possible re-duction (for banks fully lent out with respect to bank capital) of $1/0.08 = $12.50.
The factors in (i.) and (ii.) decrease the maximum possible money supply, and thus in the long run might offset money created in the bailout. But, US banks are not fully lent out, so the multiplier does not immediately come to bear. Thus loans create money more than vise versa.25 In any case, the Fed H.3, H.6, and H.8 Statistical Releases on 19 December 2008 show each measure of bank reserves and money supply (net assets of commercial banks, M1 and M2 money supply) rising over the last three months and in comparison to a year ago. The total credit extended, by US all commercial bank, rose from December 2007 to December 2008 7.26% to $9.9291 trillion. Furthermore, each of the 11 categories of US commercial loans outstanding on all US commercial bank balance sheets was higher in De-cember 2008 than in December 2007, except: “Other Residential” (−2.01%), “Fed Funds & Repo with brokers” (−18.91%), “Secured other” (−43.27%), and “Other loans and leases” (−2.14%). So, contrary to media reports, bank lending is not falling and there is no deflation.
(6.) RECOMMENDED GOVERNMENT ACTION
Government action should accomplish two tasks. First, it should immediately stop the gen-eral market panic, and bring rationality and price discovery to the financial markets. Sec-ond, it should do so in a way that minimizes the rise of inflation. However, the least possi-ble inflation in this situation will be high.
(6.1) Recommended Treasury Actions:
(A.) Purchase of preferred stock in US money-center banks and the principal Treasury dealers to bolster their balance sheets.
This will help restore counter-party worthiness of major financial institutions, which is a necessary, but not sufficient, condition for the financial markets to function. The Treasury has already done much of this.
(B.) Exchange certain existing MBS and CDOs (say “Treasury Blessed “Obligations” or “TBOs”), that are backed by at least 80% US collateral, from any holder for Treasury “warehouse receipts”. Make them more attractive and less mysterious to investors, auction them, and turn over the auction proceeds to the receipt holders.
(B.1) This is subject to a minimum size of the TBOs exchanged and of the issue involv- ed. Require, by law, issuers and servicers of any TBOs acquired to submit a report on the title and liens status of TBOs.
25 This point is part of an enlightening description of relationship of money supply, real output, and national debt. “In the real world banks make loans independent of reserve positions, then during the next accounting period borrow any needed reserves. The imperatives of the accounting system, as previously discussed, require the Fed to lend the banks whatever they need.” Mosler, Warren B. Soft Currency Economics, 1994. Available at www.gate.net/~mosler/ frame001.htm. In this case, reality follows Mosler’s theory, as widespread bank deleveraging did not reduce the money supply.
The Financial Crisis: why, where it is going & how to fix it page 15 of 24 28 January 2008
(B.2) Where feasible, combine the slices of common TBOs to reduce complexity.
(B.3) Assign collection of TBO’s underlying debt over 180 days delinquent to the IRS. The IRS should be funded for this service.
(B.4) Waive all Federal tax (inheritance tax too) on income from any instrument eligible to be a TBO. Encourage the state and local governments to do the same.
(B.5) Indemnify any holder of TBO from loss because of title or lien, with specified in- demnity-payment timing. Treasury should contract out title and lien checks be- fore auctioning the TBOs. The Treasury should be funded for this cost.
(B.6) Contract out TBO analysis, valuation, history, and public (internet) access to re- lated proprietary databases (e.g., those of Bear Stearns and USATitle). Contract the workout and collateral-management services for TBOs under a unified and consistent system. The Treasury should be funded for this cost.
(B.7) Immediately payout the cash stream as received from the TBOs to the receipt holders. After acquiring a substantial part of all US CDOs, an auctioning deci- sion should be made: will the TBOs fetch more as individual bonds or as part of a single homogenous issue. A holder of any such single issue would receive a share of all TB0’s cash stream. It is a question of whether complexity trumps homogeneity in the market. Auction off the TBOs accordingly.
This is aimed at avoiding the collateral losses discusses in section (4.) above.
(C.) Guarantee timely repayment of 80% of certain classes of new private loans to US bor- rowers, that meet certain minimum standards. These classes are those supporting key areas of the economy, like student, home, and auto loans. Apply (B.1) through (B.4) to the loans involved as if they were TBOs.
(D.) Encourage the Financial Accounting Standards Board to change SFAS 157. For each fixed-income asset independently, the holder should be able to book its value as the:
(D.1) current actual or inferred market price (via the market price of a close asset and a no-arbitrage argument), or
(D.2) present value of the holder’s intended expected-marginal cash flow attributable to that asset, using appropriate discount rates and risk adjustments.
(6.2) Recommended Congressional Actions:
(E.) Run a deficit at least as large as the 6.8% GDP shortfall from capacity, that was fore- cast by the Congressional Budget Office26 (“CBO”). This is $1.039 trillion, which is less than the CBO projection of $1.2 trillion for 2009, which excludes the two-year $0.819 trillion stimulus-package that will be spent in 2009 and 2110.
(F.) Congress accommodates (B.) above by amending the Mortgage Forgiveness Debt Relief Act of 2007 to waive recognition of ordinary income for debt forgiveness on primary residences only if: (E.1) borrower obtains consent of a servicer or substantial holder of the mortgage, or a bankruptcy court, associated with the debt in question; or (E.2) demonstrates to the IRS that he or she was the victim of any predatory lending.
This will remove the incentive to misuse SCICS described in Subsubsection (2.1.3) above, except where it is part of a resolution or untoward lending.
(G.) Legislate liability for valuations in major financial markets, including the major over-
26 Congressional Budget Office. “The Budget and Economic Outlook: Fiscal Years 2009 to 2019”. January 2009. Pub. No. 3187. This study was released 6 January 2009.

The Financial Crisis: why, where it is going & how to fix it page 16 of 24 28 January 2008
the-counter markets and hedge funds. Hold those responsible for valuing asset or li-ability in such markets liable civilly and criminally for substantial valuation errors at-tributable to substantial: negligence, conflict of interest, or fraud. This liability is to anyone or entity who suffers from such valuation. A valuation that meets the IRS “substantial authority” or the general “reasonable man” tests will exempt the valuer. But he or she will be responsible for being aware of the general complexity of the valuation involved to the extend of standard industry practice.
(6.3) Recommended Federal Reserve Actions:
(H.) Allow banks to post TBOs as reserves, up to some prudent limit.
(I.) In conjunction with the FDIC, require all US banks to lend 80% of their previous 5- year average in each major category of lending, as a condition of maintaining their FDIC insurance (with an exception process for banks in special circumstances).
(J.) For whatever period the Fed plans, pay interest on member bank reserves only up to the minimum reserve requirement for the volume of demand deposits the bank has. This will avoid an additional disincentive to lend.
(6.4) Recommended Actions for all the Entities Above
(K.) Hold a carefully-staged announcement by the President, Treasury Secretary, Fed Chairman, and Congressional Leaders. It should be thoroughly researched and plan- ned for maximum psychological impact on the financial markets before consumer and investor psychological is further shaken by widespread retail-store closings.
In implementing borrowing and guarantying of borrowing, there is an important tradeoff to ponder. The Treasury reduces the money supply when it borrows, but Government agen-cies and private companies do not. But the former borrows at a lower cost than the latter.27 As explained in Section (7.3) below, high inflation is a real danger of the bailout. Thus, Treasury borrowing temporarily reduces this danger. However, guaranteeing agency and private debt, instead of the Treasury borrowing directly, may be justified because it im-proves the liquidity of such debt. This lack of liquidity is the heart of the financial crisis.
(7.) SHORT-TERM EFFECTS OF GOVERNMENT ACTION
(7.1) Relation of Money Supply to Fed and Treasury Actions
In this analysis we will use the M1 definitions of the money supply. M1 is all the US-issued cash and coins in circulation and all the US-dollar demand deposits (checking accounts) in US banks. M2 is M1 plus US dollar-denominated: (a.) time deposits, money market mu-tual-fund shares, money market deposit accounts, and overnight repurchase agreements, all in the US, and (b.) overnight Eurodollar deposits (US-dollar demand deposits in foreign banks). If a bailout delivers an amount of money to bond or equity holders (other than US Government), then, through the money-multiplier effect, that amount is theoretically ex-panded.28 We also calculated the bailout effects on the M2 and MZM money supplies29 and
27 This is demonstrated by 30-year Ginnie Mae bonds (with full-faith-and-credit Government guarantee) trading with 2.6% higher yield than Treasury bonds in November 2008. Similarly, Crown corporations have illustrated this point by borrowing at higher rates than the Crown, e.g., the full-faith and credit bonds of the Canadian Mortgage and Housing Corporation (founded in 1944) has always paid higher interest rates than The Bank of Canada. 28 The Fed’s reserve requirements for demand deposits since 20 December 2007 have been 0%, 3%, and 10% for deposits under $9.3 million, between $9.3 and $43.9 million, and over $43.9 million, respectively.28 For time deposits it is 0%. Thus each bail-out dollar disbursed could theoretically produce up to $10 of new demand deposits (and infinite dollars of time deposits), since that dollar becomes an extra dollar of reserves when it is deposited, that will support up to $10 of new loans. These loans become new demand deposits and currency. See footnote 25.

The Financial Crisis: why, where it is going & how to fix it page 17 of 24 28 January 2008
found that they were proportional to the effects on M1, so we have omitted them here.
But, the emergence of sweep time-deposit accounts and other innovations has made reserve requirements less of a constraint and less important, and thus banks are less prone to lend to their limit.11 The M1 money multiplier is the ratio of M1 to currency and bank reserves, and it has fallen from about 3.1 in 1987 to about 1.2 now. The M2 money multiplier is the ratio of M2 to currency and bank reserves. It rose from 5.3 in 1987 to 8.6 in January 2007, and then gradually fell to 6.9 in October 2008. These multipliers have little effect in the short run, but might in the long run, similar to speed limits for very unhurried save drivers (who do not immediately drive faster when the speed limit is raised). Classical economic theory teaches: when a borrower pays money back to a (nonbank) lender, it: (a.) decreases the money supply by reducing the borrower’s checking account, and (b.) increases the money supply an equal amount by increasing the lender’s checking account. If the lender is a bank, then the money supply decrease does not reverse until it is lent out again. In a cash rescue, the borrowers do not repay and thus do not reduce their checking accounts, but a nonbank bond holder adds the government’s rescue payment (money created out of thin air) to their checking account. The money multiplier compounds that increase.
By law, the TARP must be funded by the Treasury issuing additional debt. As the Treasury buys assets from, or invests in (i.e., buys preferred stock of), financial institutions, there will be a rise in the demand deposits of those institutions. This rise will equal the fall in the demand deposits owned by the purchaser of that additional Treasury debt. Hence, there will be no immediate rise in the money supply. But the money supply will rise as that new debt delivers coupon and principal payments in the future. More importantly, the addi-tional Treasury debt issues will increase the total supply, and thus lower the value of such debt, i.e., raise Treasury interest rates. This in turn will raise all other US-dollar interest rates and crowd out some private borrowing. The Fed and the FDIC are also major players in the bail out, and their rescue payments will be pure increases in the money supply.
How much rates rise depends on many factors that determine the elasticity of interest rates with respect to the supply of Treasury debt. A key factor is the amount of money created by the Fed to accommodate the purchases of Treasury bonds. But, increasing the money sup-ply creates inflation, which raises interest rates. The Federal Home Loan Bank Board (“FHLBB”) also borrows but that does not count in the National Debt.
(7.2) Bail Out’s Effect On The Money Supply and National Debt
The New York Times Business Section featured “Tracking the Bailout: The Government’s Commitments” on 25 November 2008. It reported in trillions: (i.) $1.7 Fed loans; (ii.) $3.0 preferred stock and mortgage purchases by FDIC, Treasury, and FHBB ($0.60); and (iii.) $3.1 debt guarantees by Fed, Treasury, and FDIC. This is consistent with Government pronouncements before and since, and it totals $7.8 trillion. On 6 January 2008, the Con-gressional Budget Office (“CBO”) estimated a $1.2 trillion 2009 budget deficit, excluding the $819 Stimulus Package that was enacted on 28 January 2009. To calculate the impact of these Government policies on the money supply and the National Debt by 30 September 2011, we assume:
(Ι.) no guarantees in (iii.) are ever paid except the initial $100 billion Treasury guarantee on each of Freddie Mac’s and Fannie Mae’s losses, which have already occurred; (II.) loans in (i.) and purchases in (ii.) do not ever increase from these levels; (III.) financial bailout and stimulus package are implemented in 3 years; (IV.) CBO’s projection of $1.2 trillion/year Government deficit continues for 3 years and is
29 MZM is M2 minus small-denomination time deposits, plus institutional money-market mutual funds (that is those in-cluded in M3 but excluded from M2). It is, in effect, assets with instant (no-penalty) liquidity and virtually no risk.
The Financial Crisis: why, where it is going & how to fix it page 18 of 24 28 January 2008
financed by new debt; (V.) debt service payments30 on the Treasury new and previous National Debt for the next three fiscal years totals 6% and 8%, respectively, of such debt; and (VI.) Fed’s announced $620 billion temporary reciprocal-currency arrangements (swap lines) with foreign central banks is unchanged and fully used for 3 years.
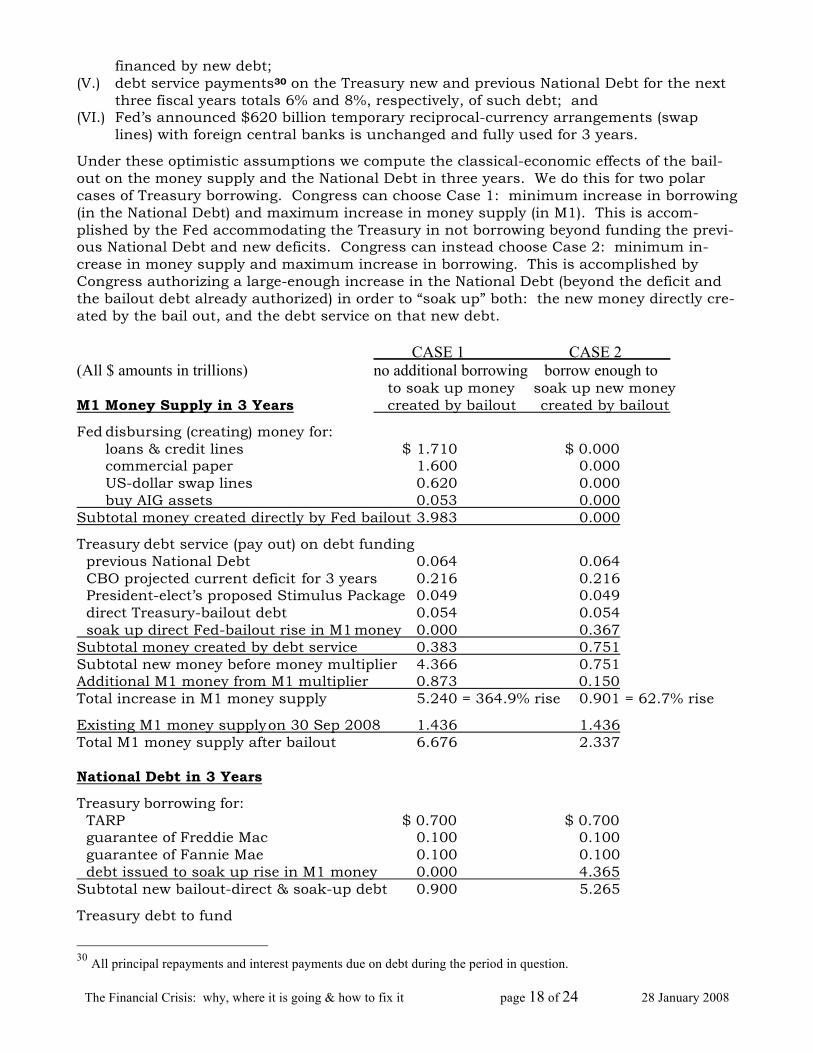
Under these optimistic assumptions we compute the classical-economic effects of the bail- out on the money supply and the National Debt in three years. We do this for two polar cases of Treasury borrowing. Congress can choose Case 1: minimum increase in borrowing (in the National Debt) and maximum increase in money supply (in M1). This is accom-plished by the Fed accommodating the Treasury in not borrowing beyond funding the previ-ous National Debt and new deficits. Congress can instead choose Case 2: minimum in-crease in money supply and maximum increase in borrowing. This is accomplished by Congress authorizing a large-enough increase in the National Debt (beyond the deficit and the bailout debt already authorized) in order to “soak up” both: the new money directly cre-ated by the bail out, and the debt service on that new debt. CASE 1 CASE 2 (All $ amounts in trillions) no additional borrowing borrow enough to to soak up money soak up new money M1 Money Supply in 3 Years created by bailout created by bailout
Fed disbursing (creating) money for: loans & credit lines $ 1.710 $ 0.000 commercial paper 1.600 0.000 US-dollar swap lines 0.620 0.000 buy AIG assets 0.053 0.000 Subtotal money created directly by Fed bailout 3.983 0.000
Treasury debt service (pay out) on debt funding previous National Debt 0.064 0.064 CBO projected current deficit for 3 years 0.216 0.216 President-elect’s proposed Stimulus Package 0.049 0.049 direct Treasury-bailout debt 0.054 0.054 soak up direct Fed-bailout rise in M1 money 0.000 0.367 Subtotal money created by debt service 0.383 0.751 Subtotal new money before money multiplier 4.366 0.751 Additional M1 money from M1 multiplier 0.873 0.150 Total increase in M1 money supply 5.240 = 364.9% rise 0.901 = 62.7% rise
Existing M1 money supply on 30 Sep 2008 1.436 1.436 Total M1 money supply after bailout 6.676 2.337 National Debt in 3 Years
Treasury borrowing for: TARP $ 0.700 $ 0.700 guarantee of Freddie Mac 0.100 0.100 guarantee of Fannie Mae 0.100 0.100 debt issued to soak up rise in M1 money 0.000 4.365 Subtotal new bailout-direct & soak-up debt 0.900 5.265
Treasury debt to fund
30 All principal repayments and interest payments due on debt during the period in question.

The Financial Crisis: why, where it is going & how to fix it page 19 of 24 28 January 2008
previous National Debt 0.802 0.802 CBO projected current deficit for 3 years 3.600 3.600 Stimulus Package 0.819 0.819 Subtotal new debt to cover debt service 5.221 5.221 Total new debt in 3 years 6.121 = 61.1% rise 10.487 = 104.6% rise
Existing 30 Sep 2008 National Debt 10.025 10.025 Total National Debt after bailout 16.146 20.512 CBO estimate27 GDP in 2011 15.137 15.137 CBO estimate 2011 National Debt/GDP ratio 106.7% 135.5% CBO existing 2008 National Debt/GDP ratio 70.1% 70.1%
$10.03 old
debt
$3.60 deficit at current pace
$0.90 bailout debt
$0.87 M1 multiplier
$3.98 Fed direct bailout
spending
$1.44 old M1 money supply
364.9% rise to $6.68
M1 Money Supply
CASE 1: SMALLER DEBT & LARGER MONEY SUPPLY IN 3 YEARS (all $ amounts in Trillions)
National Debt
debt service on: old debt service $0.06, deficit for = 3-years $0.216, Treasury direct bailout debt $0.05, Stimulus Package $0.49
61.1% rise to $16.15
$0.80 serve old debt
$0.82 Stimulus

The Financial Crisis: why, where it is going & how to fix it page 20 of 24 28 January 2008
(7.3) Likely Effect of Bailout Funding and Limitations of Treasury Borrowing
Congress has a choice between: Case 1 (364.8% higher M1 money supply and 60.9% higher National Debt), Case 2 (62.5% higher M1 money supply and 104.4% higher National Debt), or of something in between those two polar extremes. But there are limits to the market’s appetite for Treasury debt and thus the feasibility of Case 2. A larger supply of Treasury bonds will lower the market price of those bonds, and thus by definition raise in-
$10.03 old
debt
$3.60 deficit at current pace fore-
cast by CBO
$1.44 old M1 money supply
104.6% rise to $20.51
62.7% rise to $2.34
National Debt M1 Money Supply
CASE 2: LARGER DEBT & SMALLER MONEY SUPPLY
IN 3 YEARS (all $ amounts in Trillions)
$3.98 Fed direct bailout
spending
$4.37 debt “soaks up” new money from
Fed bailout & debt service on it
$0.90 bailout debt
$0.82 Stimulus $0.80 debt service on the =
debt service that funds previous National Debt
$0.75 = debt service on: previous National Debt $0.6, 3-year deficit $0.22, dir- ect bailout debt $0.05, Stimulus $0.05, soak-up debt $0.37
$0.15 M1 money = multiplier

The Financial Crisis: why, where it is going & how to fix it page 21 of 24 28 January 2008
terest rates, distinct from the rise in interest rates caused by inflating the money supply 62.5%. Furthermore, massive new Treasury debt will crowd out private borrowing that supports production and consumption. Thus, Treasury borrowing, to reduce the money supply, will reduce the goods and services being chased by the money supply, and thus raise inflation still further. The larger Case 2 debt minimizes M1 money supply growth at an average of 17.6%/year compounded for three years. But that, in turn, simply postpones creating even more money via far larger debt service.
To put these Cases 1 and 2 in perspective, US Gross Domestic Product (“GDP”) the $14.5 trillion/year of all domestic production goods and services. If the real production of goods and services (i.e., adjusted for inflation) does not rise in the next three year, a larger money supply will be chasing the same or less goods and services. Neoclassical monetary theory would have us predict that this will raise prices proportionally. However, we can choose a more forgiving economic theory. In the current age of sweep accounts and credit cards, it is wealth (i.e., Pigou effect), more than money supply, that drives aggregate demand against the output of goods and services, which in turn drives inflation. That is, we may be choos-ing how much and what to consume based on our wealth more than our cash balances. Since the increase in the money supply is not an increase in wealth, it alone may raise prices less than this minimum 17.6% increase in the money supply.
The more unambiguous and unavoidable threat of hyperinflation is that: National Debt soaring 104.4% in three years will flood the market with, and lower the price of, Treasury debt, i.e., raise interest rates. The extent of this rise in rates depends on the elasticity of Treasury debt (ratio of an increase in National Debt to average Treasury rate at the margin), or put another way, the depth of the world’s appetite for debt. From 7 to 12 January 2009, the major business news organizations reported an ominous decrease in that appetite (e.g., “China is losing its appetite for debt from the US”) based on quotes from officials in The Central Bank of China and from the official Chinese state news agency Xinhua.31
China holds about 6.1% of all US Treasuries debt outstanding. This does not bode well for the US being forced to double (Case 2 above) that debt in three years, in order to stave off a tripling of the money supply in that period (Case 1 above). This doubling will raise the ratio of National Debt to GDP above the previous peak of 110% in 1946 (end of World War II). The danger is that investor fear of inflation can feed on itself and create a run on US debt, particularly by major foreign holders, like China, that also expose Treasury rates to political considerations. Suppose all of these factors raise the average Treasury rate (in terms of the cost of funding) into the to 10% to 20% range experienced in the early 1980s. This would raise the interest expense of financing the $20.492 trillion National Debt (extant in 3 years under Case 2) to between $2.049 and $4.098 trillion/year, which is 13.1% and 26.2%, re-spectively, of 2008 GDP. That compares with about $412 billion of interest expense in 2008. These low and high estimated interest costs would equal 81.2% and 162.2%, respec-tively, of all Federal revenue received in 2008. Worse yet, federal revenue may fall in the next three years. The January 2009 CBO projection29 is for a 7.09% fall from 2008 to 2009.
It is the prospect of these immense costs that lead to the suggestion in Section (6.) (B.) above: that any large-scale CDO purchases, that maybe contemplated, should be paid for with warehouse receipts instead of money. Note, such comprehensive purchases are not part of the current bail out enumerated in (i.), (ii.), and (iii.) of Subsection (7.2) above from Treasury, Fed, or FDIC. The receipts approach will avoid raising the money supply even more than calculated in (7.2).
31 A Business Section article “U.S. debt is losing it appeal in China” by Keith Bradsher in both the The New York Times and (its sister paper) The International Herald Tribune, on 7 and 8 January 2009, respectively. In the Market Scan Section of Forbes.com, an article “China Not A Limitless Sponge For U.S. Debt” by Tina Wang on 19 January 2009.

The Financial Crisis: why, where it is going & how to fix it page 22 of 24 28 January 2008
I was asked to predict GDP, employment, and other economic statistics. They are not as easy or direct to compute as money supply and National Debt from the Government’s cur-rent bailout commitments. However, my estimate (assuming the Government does not re-store consumer and investor confidence soon) is based on: a comparison of the current economic situation with that of the less-favorable one in the early 1980s, and the perverse fixed-income price effects of hedge funds and proprietary trades in 2009 being forced to unwind trades that would be profitable if they could be financed. It is as follows. First, re-cord deficits as a proportion of tax revenue and GDP. Second, 10 to 20 for almost every-thing in one to three years: 20% of retail-store units close; 10% to 20% unemployment, in-flation, and 3-month Libor; 10% to 20% more poverty and crime; $20 per barrel oil; and 10% less GDP per capita. The latter two estimates are adjusted for inflation from 1 October 2008 prices.
(8.) LONG-TERM EFFECTS OF GOVERNMENT ACTION: TIPPING POINTS
If any of the scenarios described in Subsection (6.) above materializes, then the credit mar-kets and world opinion will expect prolonged inflation in the US. This will likely provoke two successive psychological-tipping points. These tipping points are similar in some ways to the fear of a bank failure that becomes a self-fulfilling prophecy, but are likely to be based on more-realistic fears. The mere prospect of these tipping points can cause inves-tors to act before it is justified by economic circumstances. This would cause foreign inves-tors to dump US debt or dollars before others do, accelerating the run into such a self-fulfilling prophecy.
(8.1) Foreigners Dump US-Dollar-Denominated Debt
Foreigners will stop wanting to hold US dollar-denominated debt because its value will be expected to dissolve with high inflation. To not hold such debt, they must sell it, i.e., ex-change it for US bank demand deposits. This implies US Government debt prices will fall, which raises US interest rates by definition. It also leaves foreigners with far more US dol-lars than they hold in equilibrium, which implies that they will sell the dollars for foreign currency. Thus, the dollar will fall sharply against foreign currencies and that raises the cost of imports and thus raise inflation still further. New reports are starting to report the first tendencies in this direction. On 8 January 2008, the International Herald Tribune Business with Reuters section had an article entitled “US debt is losing its appeal in China”. It included:
"All the key drivers of China's Treasury purchases are disappearing," said Ben Simpfendorfer, an economist in the Hong Kong office of the Royal Bank of Scotland. "There's a waning appetite for dollars and a waning appetite for Treasuries. And that complicates the outlook for interest rates." It reported that about 70% of China’s public holding of foreign debt is US dollar debt, i.e., about $1.43 trillion, and that China is expected to decrease it foreign debt holdings.”
(8.2) Foreigners Dump US Dollars
If the bailout leads to fear of high inflation, as suggested in Subsection (2.2) above, and US dollars are perceived by foreigners as falling against other currencies long term, then they will not want to hold US dollars. To stop holding dollars, foreigners will buy US goods and services with those dollars. That might seem fine for US producers, but the US economy will suffer “Seigniorage Shrinkage". Seigniorage is the profit a government makes on the money it creates, i.e., the value of the things it buys with the money it circulates (by buying goods and services) minus the cost of creating the money.
Seigniorage Shrinkage works as follows. Until now, foreigners have produced goods and services, which were consumed in the US and paid for in US dollars which were created at very low cost. But, the US sends foreigners less goods, services, and financial assets in re-
The Financial Crisis: why, where it is going & how to fix it page 23 of 24 28 January 2008
turn. The difference is that part of the US merchandise trade deficit held by foreigners as US dollars (paper money, coins, and US bank demand deposits) and used as a medium of exchange. This is a temporary gift from foreigners to US consumers, or more accurately an open-ended putable loan with a “negative interest rate” equal in magnitude to US inflation. If that magnitude gets too large or foreigners expectations of it get too large, they will switch to other currencies as a medium of exchange. To do this, they will buy US goods and serv-ices with US dollars that the US cannot consume. This reverses the beneficial seigniorage of the past, which in turn, lowers the US standard of living.
Foreigners spending US currency and demand deposits in the US will not increase the US money supply (since they are already counted in the money supply). But it will create de-mand pull on domestic prices, since it will be chasing US goods and services instead of fa-cilitating foreigner-to-foreigner transactions.
Note, much of this foreign-circulating US currency is paper money and coins (rather than demand deposits). The Fed estimates $778 billion of currency is in circulation, but does not have an accurate measure of this. About 90% of all $100 bills printed are sent to the New York Federal Reserve bank, mostly for shipment overseas. Several academic studies by the Federal Reserve Board of Governors and by private economic-policy research institutes (e.g., The National Center for Policy Analysis in Washington, DC) estimate foreign circula-tion of paper money and coins at 40% to 60% of the total. Whatever proportion of that be-ing spent in the U.S would raise the money supply by 20% to 30% of that proportion. That adds to the inflationary pressures explained above and points toward hyperinflation.
(9.) CONCLUSION
The US is facing the possibility of a classic depression, which is based entirely on investor and consumer expectations that there will be one. Such recession or depression are self-accelerating and self-fulfilling, and can only be diverted from their natural and disastrous course by the widespread expectation of decisive Government action. In particular, the Government should make a single dramatic presentation that convinces the American peo-ple that it will not happen. This means the public must be convinced that all the relevant parts of Government, working in unison, will take more-than-sufficient actions to prevent it.
This must be done before the next obvious harbinger of depression becomes apparent, the mass closing of retail stores across the US. Such closing will compound the panic from the spike in unemployment (1.9 million more unemployed from September to December 2008)32. The everyday spectacle of familiar retail stores out of business will greatly rein-force the current consumer and investor panic, that is the heart of the financial crisis, and will make it far harder to dispel that panic. Such closings are likely in the first quarter of 2009 since ocean shipping of dry raw materials has fallen off sharply in the last eight months and container ship rates (mostly for finished goods) are starting to plummet. Less raw material shipped to producers in 2008 implies less finished goods shipped to stores in 2009. This slowdown in raw-material shipping33 is working its way into finished-good transport, as container ship rental prices reached an all-time low in the third week of De-cember 2008 and unprecedented amounts of container shipping are being laid up.34 This
32 Given past experience, I expect the Bureau of Labor Statistics to revise upward their statistic, of 524,000 additional un-employed in December, by about 100,000. 33 The Baltic Dry Index BALDRY is the price measure of containerized ocean freight, produced by The Baltic Exchange in London. It fell 93.2% from 11,648 to 784 between 22 May to 22 December 2008. The ConTex index, produced by The Hamburg Ship Brokers Association, fell from 974 in May 2008 to 371 in the third week of December 2008. 34 On 22 December 2008, Bruce Barnard reported in the The Journal of Commerce Online that container-ship charter prices (adjusted for inflation) reached an all-time low. Rental of a 3,500 TEU gearless Panamax (container) carrier dropped

The Financial Crisis: why, where it is going & how to fix it page 24 of 24 28 January 2008
suggests retail stores will do far worse in 2009 than even the record-low sales of November and December 2008. The International Council of Shopping Centers estimated that sales fell 2% in each of those months (largest since records were first kept in 1969), and that 148,000 US stores will close in 2008, which shrinks the total by about 3%. The MasterCard SpendingPulse unit reports record 5.5% and 8% year-over-year drops in those months, re-spectively. Absent immediate and decisive Government action, retail stores will be faced with a two-pronged disaster in 2009. Consumers will purchase even less and stores will have much smaller shipments of goods to sell. This will further devastate both consumer and investor confidence, which is the stuff that depressions are made of.
The nine policy actions in Section (6.), and perhaps others, should be woven into a single carefully-staged and researched presentation to the public. As much effort should be com-mitted to that presentation as to the actions announced. It needs to be a psychological turning point for investors, employees, and consumers. Such a turning point will solve the crisis.
from $25,000/day to $15,000/day just in the third week of December 2008, and rental of a 2,750 TEU sub-Pananmax (con-tainer) carrier fell from $19,500/day in September 2008 to $10,500/day in December 2008.