The fatigue strength of welded, bolted and riveted … fatigue strength of welded, bolted and...
135
The fatigue strength of welded, bolted and riveted joints in high strength, low alloy steel Overbeeke, J.L.; Alting, T.J.; Flipsen, J.F.; Feringa, H.; Jonkers, P.A.M. Published: 01/01/1984 Document Version Publisher’s PDF, also known as Version of Record (includes final page, issue and volume numbers) Please check the document version of this publication: • A submitted manuscript is the author's version of the article upon submission and before peer-review. There can be important differences between the submitted version and the official published version of record. People interested in the research are advised to contact the author for the final version of the publication, or visit the DOI to the publisher's website. • The final author version and the galley proof are versions of the publication after peer review. • The final published version features the final layout of the paper including the volume, issue and page numbers. Link to publication Citation for published version (APA): Overbeeke, J. L., Alting, T. J., Flipsen, J. F., Feringa, H., & Jonkers, P. A. M. (1984). The fatigue strength of welded, bolted and riveted joints in high strength, low alloy steel. (EUT report. LSF, Laboratory for structural fatigue; Vol. THE-LSF-84-129). Eindhoven: Technische Hogeschool Eindhoven. General rights Copyright and moral rights for the publications made accessible in the public portal are retained by the authors and/or other copyright owners and it is a condition of accessing publications that users recognise and abide by the legal requirements associated with these rights. • Users may download and print one copy of any publication from the public portal for the purpose of private study or research. • You may not further distribute the material or use it for any profit-making activity or commercial gain • You may freely distribute the URL identifying the publication in the public portal ? Take down policy If you believe that this document breaches copyright please contact us providing details, and we will remove access to the work immediately and investigate your claim. Download date: 16. Jun. 2018
Transcript of The fatigue strength of welded, bolted and riveted … fatigue strength of welded, bolted and...
The fatigue strength of welded, bolted and riveted jointsin high strength, low alloy steelOverbeeke, J.L.; Alting, T.J.; Flipsen, J.F.; Feringa, H.; Jonkers, P.A.M.
Published: 01/01/1984
Document VersionPublisher’s PDF, also known as Version of Record (includes final page, issue and volume numbers)
Please check the document version of this publication:
• A submitted manuscript is the author's version of the article upon submission and before peer-review. There can be important differencesbetween the submitted version and the official published version of record. People interested in the research are advised to contact theauthor for the final version of the publication, or visit the DOI to the publisher's website.• The final author version and the galley proof are versions of the publication after peer review.• The final published version features the final layout of the paper including the volume, issue and page numbers.
Link to publication
Citation for published version (APA):Overbeeke, J. L., Alting, T. J., Flipsen, J. F., Feringa, H., & Jonkers, P. A. M. (1984). The fatigue strength ofwelded, bolted and riveted joints in high strength, low alloy steel. (EUT report. LSF, Laboratory for structuralfatigue; Vol. THE-LSF-84-129). Eindhoven: Technische Hogeschool Eindhoven.
General rightsCopyright and moral rights for the publications made accessible in the public portal are retained by the authors and/or other copyright ownersand it is a condition of accessing publications that users recognise and abide by the legal requirements associated with these rights.
• Users may download and print one copy of any publication from the public portal for the purpose of private study or research. • You may not further distribute the material or use it for any profit-making activity or commercial gain • You may freely distribute the URL identifying the publication in the public portal ?
Take down policyIf you believe that this document breaches copyright please contact us providing details, and we will remove access to the work immediatelyand investigate your claim.
Download date: 16. Jun. 2018
Eindhoven University of Technology
Laboratory for Structural Fatigue
Report THE-LSF 84-129
(ECSC-contract 7210 KD 605)
The fatigue strength of welded, bolted and riveted
joints in high strength, low alloy steel
by
J.L. Overbeeke
1n collaboration with
T.J. Alting
J.F. Flipsen
H. Feringa
P.A.M. Jonkers
Eindhoven University of Technology
Hoogovens IJmuiden
DAF Trucks
Nedschroef
Eindhoven University of Technology
This research was performed with financial aid of
the European Coal and Steel Community under
contract 7210 KD 605.
Eindhoven University of Technology
Lab. for Structural Fatigue
R~.QI.t_.J:!.m --=_1.~F.:._ .. = 84 - ) 22
Thc fatigue strength of welded, bolted and riveted joints In high strength,
low alloy steel.
by J.L. Overbceke et.al.
The application of HSLA-stcels In dynamically loaded structures as are
transport vehicles, depend for the greater part on the fatigue strength of
the structural joints.
Therefore an investigation was made into the quality with regard to fatigue
of welded, bolted and rlvet.ed joints in this type of steel.
Thc 2 specimens chosen were a joint with low excentricity (butt weld C.q.
double shear lap joint) and one with high excentricity (single shear lap
joint). The bolted and riveted joints had one connecting element.
The steel used was a micro-alloyed, thermomechanically treated steel to FeE
560 TM, with plate thickness 6 mm.
The program consisted of
- a technological evaluation together with screening fatigue tests.
determination of S-N data for constant amplitude and 2 types of random
amplitude loading for joints that shci~ed the better fatigue resistance . • : ..•• ,"'! t·~; .....
",,' .'J
For li~lde(Lioint.!'3_ the influence of the hardn(~s., oj ·tl~e con:3umable was ,. \ ~, , •. I: , j
evaluated, as this TM steels showed softening ~n"lhe HA~.-Of the 4
c()nsumables tested the one with highe;t ha'·r~~lj/~i1()~e~.1the better fatique
resistance.
The S-N curves for c.a. loading compared favourably with values from BS 5400 6 for similar joints. The Miner summations at N = 5.10 were 80% for the butt
welded joints and 150\ for the welded lap joints.
The j;>.o].j:~.9 __ iQ..il!t.~ were of the friction qrip type, and the flanqed head bolts
of class 10.9 and size MP were tightclwd by yield control. The platf!
2
surfaces were cleaned by blasting dnd coated with a corrOSIon resistitlg
high-friction prImer.
It could be shown that the type of ~urface blasting has some influence on
fatigue life. A smoother surface resulted in a higher endurance.
The friction under fatigue loading was about 80\ of ils static value. For
the doublR shear joints the fatigue limit wa~ higher than the maximum
frictional forces. It app~drcd that under r.a. loading the frjctional forces
were reduced strongly after that a small number of peaks had exceeded the
maximum frictional force by 10 to 20\. So for these friction grip joints the
design fatigue loads should also be based on the few high load excursions
that will occur during service loading.
In order to get high quality !iveted joints, high-strength rivets with
hardnesses up to HB 350 were developped. The rivet malerial was 18 MnB3 In
the Q and T condition.
Joints with rivets of hardness HS ~30 and 280 were evaluated ufter it was
established that tllcse rivets produced a proper degree of filling without
much deformation of the plate.
Joints with rivets HB 280 showed to be, at the same endurance, about 80\
stronger than the same joints with A.5-AI rivets.
Preparation of the joints appeared to be important because:
Thc type of surface blasting influences the fatigue life. A smoother surface
resulted in a higher endurance.
The use of a high-friction primer increases the fatigue strength about 20%
as compared to that when the usual corrosion resisting primers are used. The
use of punched holes in stead of drilled ones reduces the fatigue strpngth
by about 20%.
For riveted joints with punched holes, a high friction primer and HS 280
rivets, S-N curves for c.a. loading and r.a. loading were determined. The
Miner summations at N = 5.106 were about 40\.
3

Technische Hochschule Eindhoven
Ermudungslabor
Bericht THE - LSF - 84 - 129
Das Ermudungsverhalten von Schweiss-, Schraub- und Nietverbindungen
in hochfestem, niedriglegierten Stahl.
by J.L. Overbeeke et.al.
Zusammenfassung
Die Anwendung von modernen HSLA-St:ihlen in dynamisch belasteten
Konstruktionen wie Nutzfahrzeuge h~-ingt im uberwiegender Masse ab
von der Ermudungsfestigkeit der Verbindungen.
Es wurde deswegen eine Untersuchung durchgefuhrt nach der Qualitat
bezuglich Ermudungsverhaltens von geschweissten, geschraubten und
genieteten Verbindungen. Die 2 ausgewahlten Proben waren e1ne
Verbindung mit niedriger Exzentrizitat (Stumpfnaht bzw. Doppel
uberlappverbindung) und cine Verbindung mit hoher Exzentrizitat
(einfache Oberlappverbindung). Die geschraubten und genieteten
Verbindungen hatten nur ein Verbindungselement. Die Stahlsorte
war ein mikrolegierter, thermomechanisch bchandelter Stahl St E 560-TM,
in der Blechstarke 6 mm.
Das Programm umfasste:
- cine technologische Bewertung kombiniert mit vergleichenden Ermudungs
vorversuchen;
- Bestimmung von Wechselspannung - Lebensdauerdaten in Versuchen mit
konstanter Lastamplitude und mit 2 Typen von Randombelastungen fur
Verbindungen die siell in den Ermudungsversuchen besser bewahrten.
Fur die Schweissverbindungen wurde der Einfluss der Harte des Schweiss
gutes bestimmt, da diese TM-Stahle eine Erniedrigung der Harte in der
WEZ aufweisen. Von den 4 untersuchten Schweisszusatswerkstoffen hat der
Draht der im Schweiss gut die hochste Harte aufwies die besten Ermudungs
resultate hervorgebr:1cbt. Die S-N Linien fur Belastungen mit konstanL:r
Amplitude zeigten ein gunstiges Verhalten in hezu~ auf Werte aus
135 5400 ftlr :ihnliche Verhindungen.
4

Die Summierung nach Miner bei N = 5.106 was 80% fur die Stumpf
nahte und 150% fur die Uberlappverbindungen.
Die Schraubverbindungen waren vom glei tfes tern Type, und die Schrauben
mit Flansch der Klasse 10.9 und der Grosse MI2 wurden mit Dehnungs
steuerung vorgespannt. Die Blechoberflachen wurden gereinigt mittels
Strahlen und bedeckt mit einem korrosionsschutzenden gleitfesten
Primer.
Es liess sich heraustellen dass die Strahlungsbedingungen e~nen
bestimmten Einflusse hatten auf das Ermudungsverhalten. Eine glattere
Oberflache bedeutete eine langere Lebensdauer. Die Reibung unter
Schwingbelastung was ungefahr 80% vom statischen Werte.
Fur die Doppeluberlappverbindungen war die Schwingfestigkeit den
maximalen Reibungskraften uberlegen. Es stellte sich heraus dass
unter Randombelastung die Reibunp,skrafte erheblich reduziert wurden
nachdem eine beschrankte Anzahl von Spitz.erlhelClstungen die maximale
Reibungskrafte uberschritten hatte. Die Entwurf- Ermudungsbelastungen
fur diese gleitfeste Verbindungen sollten sich also ebenfalls basieren
auf den wenigen Spannungsspitzen die wahrend des Betriebes auftreten
werden.
Urn hochwertige Nietverbindungen herstellen zu konnen wurden hochfeste
Niete in Harten bis zu HB 350 entwickelt. Der Nietwerkstoff was 18 Mn B3
im vergutetem Zustand.
Verbindungen mit Nieten ~n Harten HB 230 und 280 wurden bewertet
nachdem es sich heraustellte dass mit diesen Nieten eine zufrieden
stellende Fullung erreicht werden konnte, ohne grossere Verformung
der Bleche.
- In Verbindungen mit HH 280 Nieten war die Ermudungsfestigkeit bei
gleicher Lebensdauer ungeGhr 80% hoher als in ahnlichen Verbindungen
mit A.5-Al Nieten.
Die Vorbehandlung der Verbindungen ist ein wichtiger Faktor. Die Strahl
bedingungen haben einen Einfluss auf die Ermudungslebensdauer. Eine
glattere Oberflache fuhrte zu einer langeren Lebensdauer. Mit der
Anwendung von einem gleitfestem Primer konnte eine Erhohung der
Ermudungsfestigkeit von rund 20% erreicht werden im Vergleich mit
normalen Korrosionsfesten Primern.
5

Die Anwendung von gestanzten Lochern anstatt gebohrten Lochern
reduziert die Ermudungsfestigkeit mit ungefahr 20%.
An Nietverhindungen mit gestnnzten Lochern, einem gleitfestem Primer
und HB 280 Nieten wurden S-N Linien ftir Belastungen mit konstanter
Belastung und fur Randombelastung bestirnrnt. . . 6 ..
De Surnmierung nach M~ner be~ N = 5.10 war ungefahr 40%.
6
Vniversite de Technologie de Eindhoven
Laboratoire de Fatigue des Structures
Rapport THE - LSF - 84 - 129
La resistance a la fatigue d'assemblages soudes, boulonnes et rives,
en acier a haute limite d'elasticite soudables.
par J.L. Overbeeke et.al.
Sommaire
L'utilisation d'aciers HLES pour des structures soumlses a des charges
dynamiques, comme les vehicules de transport, depend surtout de la
resistance a la fatigue des assemblages.
Vne etude a done ete effectuee a propos de la qualite des assemblages
soudes, boulonnes ou rives, en fatigue.
Les 2 eprouvettes choisies etaient: un assemblage a faible excentricite
(un soude bout a bout et un autre a recouvrement a cisaillement double)
et un assemblage a forte excentricite (assemblage a recouvrement a cisaillement simple). Les assemblages boulonnes et rives avaient un
element de connection.
L'acier utilise etait un micro-alliage traite thermomecaniquement pour
lui donner les proprietes de Fe 560 TM, d'une epaisseur de plaque de
6 mm.
Le programme a ete Ie suivant:
Vne evaluation technologique prealable ainsi que des essalS de
fatigue selectifs.
- La determination de courbes S-N, en amplitude constante et peur
2 types d'amplitudes aH~atoires, pour les assemblages qui presentaient
la meilleure resistance a la fatigue.
Pour les assemblagessoudes, l'influence de la durete du metal d'apport
a ete evaluee, comme ces aciers TM s'adoucissaient dans la zone de
transformation. C'est Ie plus dur des 4 metaux d'apport qui a fait preuve
de la meilleure resistance a la fatigue.
Les courbes S-N pour des charges d'amplitude constante etaient
favorables en comparaison avec les valeurs indiquees dans BS 5400 pour
des assemblages comparables. La somme des rapports d'apres Miner a
N = 5.106 etait 80% pour les assemblages soudes bout a bout et 150%
pour les assemblages soudes a recouvrement,
Les assemblages boulonnes etaient du type antiderapant et les boulons
a tete ailee de la classe 10.9 et de la taille MI2 etaient serres par
contrale de deformation plastique. Les surfaces des plaques ont ete
nettoyees par grenaillage et revetues d"une couche prirnaire resistant
a la corrosion et aux frottements eleves.
On pourrait montrer que le type de grenaili'age de la surface a quelque
influence sur la duree de vie. Vne meilleure endurance a resulte d'une
surface plus lisse.'Le frottement SOliS charge de fatigue etait environ
80% de sa valeur sous charge statique. Pour les assemblages a
cisaillement double, la limite de fatigue etait plus elevee que les
forces de frottement maximum. 11 est apparu que sous charge d'amplitude
aleatoire, les forces de frottement .etaient fortement reduites apres
qu'un petit nombre de pics aient depasse 1a force de frottement maximum
de 10 a 20%.Aussi, pour ces assemblages antiderapants, les charges de
fatigue utilisees pour les projets devraient aussi etre basees sur les
quelques apparitions de charge elevee qui peuvent survenir au cours
du service.
Afin d'obtenir des assemblages ,rives de haute qualite, des rivets a haute resistance et de duretes allant jusqu'a HB 350 ont ete con~us.
Le materiau des rivets etait 18 Mn B3, trempe et revenu.
- Les assemblages avec rivets de durete HB 230 et 280 ant ete
evalues, apres qu'on se soit assure que ces rivets remplissaient
convenab lement la plaque sans trop la deformer.
- Les assemblages avec rivets HB 280 se sont montres, a la meme
endurance, environ 80% plus resistants que les memes assemblages
avec des rivets A.5-Al.
La preparation de ces assemblages s 'est revelee importante car:
Le type de grenaillage de la surface influence la duree de vie de
fatigue. Vne surface plus lisse a donne une plus grande endurance.
L'utilisatian d'une cauche primaire resistant aux frottements
eleves augmente la limite de fatigue environ de 20% par rapport a
8
l'utilisation de couches resistant a la corrosion habituelles.
L'utilisation de trous poin~onnes au lieu de trous fores reduit
la limite de fatigue environ de 20%. Pour les assemblages rives
avec des trous poin~onnes, une couche primaire resistant aux
frottements eleves et des rivets HB 280, on a determine les
courbes S-N pour des charges d'amplitudes constante et aleatoire.
La somme des rapports d'apres Miner aN = 5.106 etait environ 40%.
9
List of symbols
A
e
m
N
N
n
n
q
R
S
Sa
S a eq T
T a
a
a o
Indices
a
a eq
rrns
f
area of cross section
gross area of cross section
diameter
Youngs modulus N/rnrn2
plastic component of strain
diametral plastic strain
force, kN
hardness
irregularity factor for random loading, see App. A
stress concentration factor
fatigue notch factor
exponent of Basquins equation
endurance, number of cycles to failure
average endurance based on log N
number of cycles
strain hardening exponent
crestfactor, F IF (here: q ~ 5,26) max rms stress ration, S . Is
m~n max nominal tensile stress (F/A etc.)
nominal tensile stress amplitude
equivalent S , see par. 3.3.1. a
nominal shear stress
nominal shear stress amplitude
plate thickness coefficient of static friction
coefficient of friction under fatigue conditions
standard deviation
real (local) normal stress, N/rnrn2
constant in a = a en o
real (local) shear stress N/rnrn2
total elongation (%) in a tensile test
amplitude
equivalent amplitude, see par. 3;'3.1.
rootmean square value of a signal
fatigue limit (amplitude)
10
List of symbols: continued
f eq
r
d
equivalent fatigue limit
rupture
diametral
11
-1-
The fatigue strength of welded, bolted and riveted joints 1n high
strength, low alloy steel.
by J.L. Overbeeke et.al.
Contents
List of symbols
1. Introduction
1.1. General
1.2. Joining techniques
1.3. Strength considerations
1.4. The research program
2. Plate material, specimens and experimental details
3.
2.1. Plate material
2.2.
2.3.
2. I. I. Composition
2.1.2. Mechanical properties
2.1.3. Fatigue strength
Specimens
2.2. I. Types of specimens
2.2.2. Welded speC1mens
2.2.3. Bolted and riveted speC1mens
Experimental details
Welded joints
3. I. Welding parameters
3.2. Consumables
3.3. Evaluation tests
3.3. I. Experimental
3.3.2. SG-2 Consumable
3.3.3. 1% Ni Consumable
3.3.4. q% Ni Consumable
3.3.5. 2!% Ni Consumable
3.4. Selection of the optimum joint
12
4
4
4
5
6
7
7
7
7
8
10
10
10
10
I I
12
12
12
14
14
IS
16
16
17
18
c Q)
> o .s::::. -0 c Q)
+-'
Q)
.~ III .... Q)
.:::: c :::l Q)
.s::::. u III
c .s::::. u Q) +-'
~
o o
"'0 c: C1J
"'0 c: o N
~
7.
- -?-
Evaluation of riveted joints
7. I. Rivet material
7.2. Rive tabi li ty
7.3. Reference fatigue tests
7.4. Surface conditions
7.5. Static strength
~d joints
~ loading
loading,
~ loading
Loading,
I joints
loading
oading
loading
oading
on A.5-Al
7.6. Endurance evaluation tests at R
7.6. I. Rivet quality
7.6.2. Surface coating
7.6.3. Surface preparation
7.7. Summary and conclusions
13
J 0.99 and J 0.71
J 0.99 and J 0.71
rivets
-J.
Page
20
20
20
21
21
22
23
24
24
25
25
25
26
28
28
28
29
29
29
30
30
33
33
33
35
35
36
37
37
38
39
40
-3-
8. S-N data for joints made with HS-rivets of hardness HB280
8. I. Choice of joints details
8.2. Types of fatigue loading and failure
8.3. Double shear lap joints
8.3.1. Constant amplitude loading
3.3.2. Random amp 1 i tude loading, J
8.4. Single shear lap joints
8.4.1. Constant amplitude loading
8.4.2. Random amplitude loading, J
8.5. Failure modes
8.6. Punched holes versus drilled holes
9. Discussion and comparison of the results
9. 1. General
9.2. Influence of joint configuration
9.2.1. Welded joints
9.2.2. Friction grip joints
9.2.3. Riveted joints
9.3. Cumulative damage
9.4. Load transfer capacity
9.4.1. Static strength
0.99 and J
0.99 and J
9.4.2. Fatigue loading, low excentricity joints
9.4.3. Fatigue loading, high excentricity joints
10. Conclusions
References
Appendix A
Appendix B
Tables
Figures
14
0.71
0.71
Page
41
41
41
42
42
42
43
43
44
44
45
46
46
46
47
47
47
48
49
49
49
50
52
-4-
1. Introduction
1.1. General
In industry there is a strong tendency to use materials with a higher yield
strength, because this can lead to a reduction in energy consumption, to
reduced weight penalties (e.g. space crafts, span of bridges) and/or to a
more economic production and a higher efficiency in service (transport
vehicles).
with regard to the use of steels for structural application this tendency is
very pronounced. Type Fe 360 steel, applied throughout formerly, has been
replaced for a considerable part by type Fe 510, which allows a 50% increase
in static design level.
This latter steel is, speaking in general terms, the highest plain carbon
steel that is easily weldable.
Weldable structural steels with higher yield strengths have been developed
by micro-alloying together with thermo-mechanically controlled rolling
processes (HSLA steels). Until now, however, these typical types of steels
are used only on a very limited scale because of:
- welding techniques and welding scedules for these types of steel are still
under development,
lack of design experience as far as the specific material behaviour is
concerned,
- lack of experience with regard to the fatigue behaviour of joints.
1.2. Joininq techniques
It is well known that the resistance against fatigue failure of structural
joints depends very much on the quality of its production.
This is in particular true for welded joints, and although strictly
controlled welding conditions need not be a drawback in a number of
applications, there remain numerous cases where such conditions cannot be
met in practice.
In such cases, other methods of joining can be advantageous, in order to
better utilize the fatigue strength of the plain material.
Well known and reliable joining methods other than welding are:
15

-5-
bolted connections, especially the friction grip ones with pretensioned
H.T. bolts,
- riveted connections.
Although riveted joints are nowadays often regarded as obsolete, they are
used in truck industry as efficient and low-cost connections.
The major drawbacks viz.
- a close pitch tolerance, necessary for long rivet-patterns, and
- the excessive noise from the riveting hammer
have been overcome by numerically controlled drilling or punching and the
use of hydraulic actuators to cold-press the rivet.
1.3. Strength considerations
In order to utilize a material with high yield strength properly, the joints
have to match its quality.
For welded joints this is not a real problem, as H.S. consumables are
available, although, as said before, welding techniques are still under
development. For friction grip joints, construction industry and especially
truck industry restricts itself in general to class 10.9 H.T. bolts, because
of the susceptability to hydrogen cracking and/or stress corrosion cracking
of higher strength bolts.
Although torque controlled class 10.9 bolts allow a reasonable clamping
force for friction grip joints, higher clamping forces would be most
welcome.
For riveted joints the situation is different because up to now H.S. rivets
were not available. However, metallurgical developments in alloying steel
have provided steels that combine a high yield strength with a large
formability.
Within this research program, use was made of a boron manganese steel to
produce H.S. rivets, matched to the strength of the high yield steel plate.
1.4. The research program
As the application of HSLA steels in structures depends for the greater part
on the fatigue resistance of the structural joints and, at least at the time
of setting up this program, only a very limited amount of fatigue data was
available, a research program was established with the following aims:
16
-6-
1. Technological evaluation of different joining methods, viz. welded,
bolted and riveted connections.
2. Comparision of the fatigue resistance by screening tests of elementary
joints that had shown to be technologically sound.
3. Production of fatigue data for those joints that showed the better
fatigue resistance. As the behaviour of joints can be very sensitive to
the type of fatigue loading, fatigue data were produced for constant
amplitude loading as well as for 2 different kinds of service-type
loading. The details of these pseudo random load histories are given in
Appendix A.
For this program, HSLA steel plate complying with FeE 560 TM (EU 149), was
used in a thickness of 6 mm throughout.
Two elementary joints, viz. one with low and one with high stress
concentrations, were used for each joining method.
The details and the results obtained from this program are reported below.
17
-7-
2. Plate material, specimen~ and experimental details
2.1. Plate material
The plate material complies with FeE560-TM according to EU 149.
Its thickness was 6.0 < t < 6.1 mm.
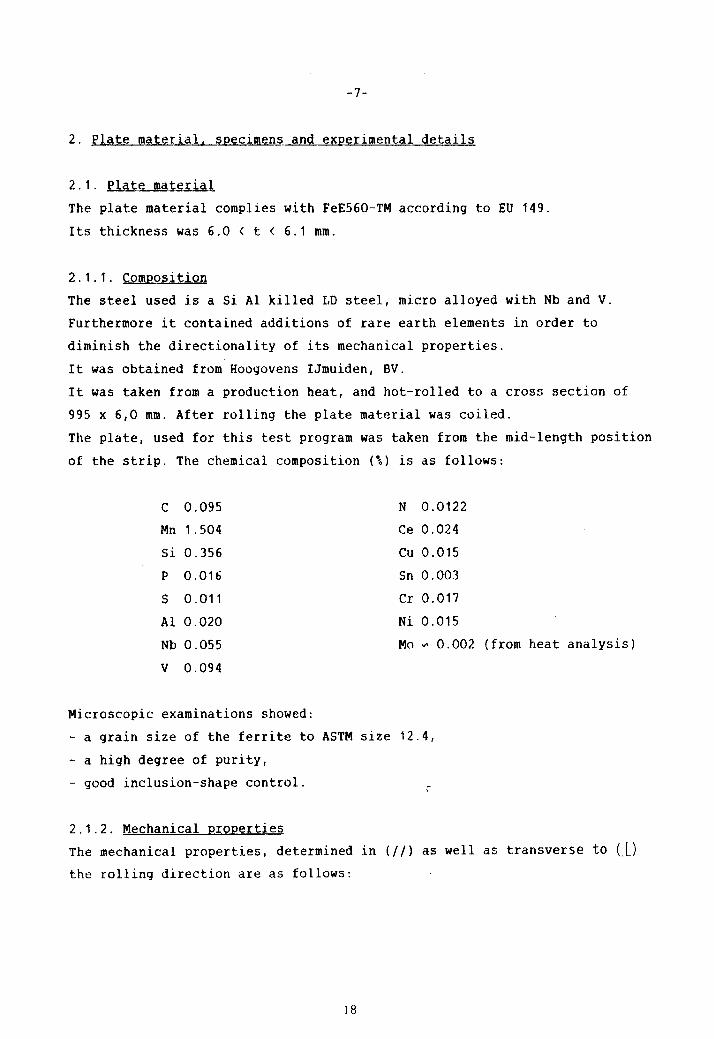
2.1.1. Composition
The steel used is a Si Al killed LO steel, micro alloyed with Nb and V.
Furthermore it contained additions of rare earth elements in order to
diminish the directionality of its mechanical properties.
It was obtained from Hoogovens IJmuiden, BV.
It was taken from a production heat, and hot-rolled to a cross section of
995 x 6,0 mm. After rolling the plate material was coiled.
The plate, used for this test program was taken from the mid-length position
of the strip. The chemical composition (%) is as follows:
C 0.095 N 0.0122
Mn 1.504 Ce 0.024
Si 0.356 Cu 0.015
P 0.016 Sn 0.003
S 0.011 Cr 0.017
Al 0.020 Ni 0.015
Nb 0.055 Mo ~ 0.002 (from heat analysis)
V 0.094
Microscopic examinations showed:
- a grain size of the ferrite to ASTM size 12.4,
- a high degree of purity,
- good inclusion-shape control.
2.1.2. Mechanical properties
The mechanical properties, determined in (II) as well as transverse to (1) the rolling direction are as follows:
18
-8-
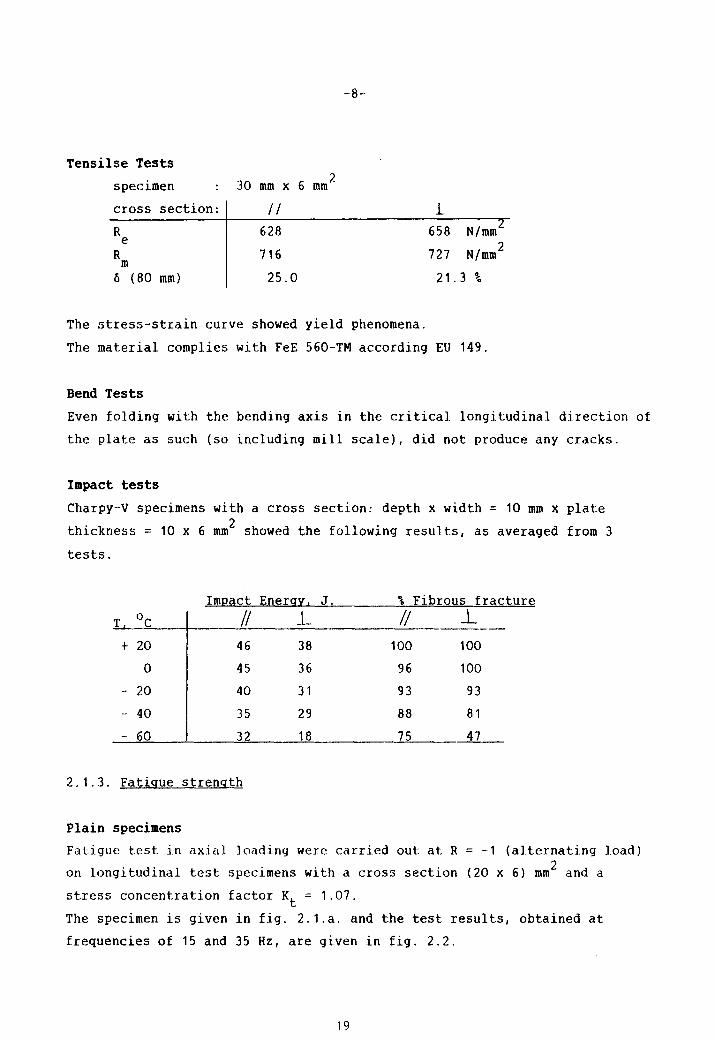
Tensilse Tests
specimen 30 6 2 mm x mm
cross section: /I 1 R 628 658 N/mm
e 2 R 716 727 N/mm
m [) (80 mm) 25.0 21.3 ~o
The stress-strain curve showed yield phenomena.
The material complies with FeE 560-TM according EU 149.
Bend Tests
Even folding with the bending axis in the critical longitudinal direction of
the plate as such (so including mill scale), did not produce any cracks.
Impact tests
Charpy-V specimens with a cross section: depth x width = 10 mm x plate 2 thickness = 10 x 6 mm showed the following results, as averaged from 3
tests.
ImQact Energ~, J. % Fibrous fracture
T °c /1 1.. II .l .=..L-
+ 20 46 38 100 100
0 45 36 96 100
- 20 40 31 93 93
- 40 35 29 88 81
- 60 32 18 75 47
2.1.3. Fatigue strength
Plain specimens
Fatigue test in axial loading were carried out at R = -1 (alternating load)
on longitudinal test specimens with a cross section (20 x 6) mm 2 and a
stress concentration factor Kt = 1.07.
The specimen is given in fig. 2.1.a. and the test results, obtained at
frequencies of 15 and 35 Hz, are given in fig. 2.2.
19
-9-
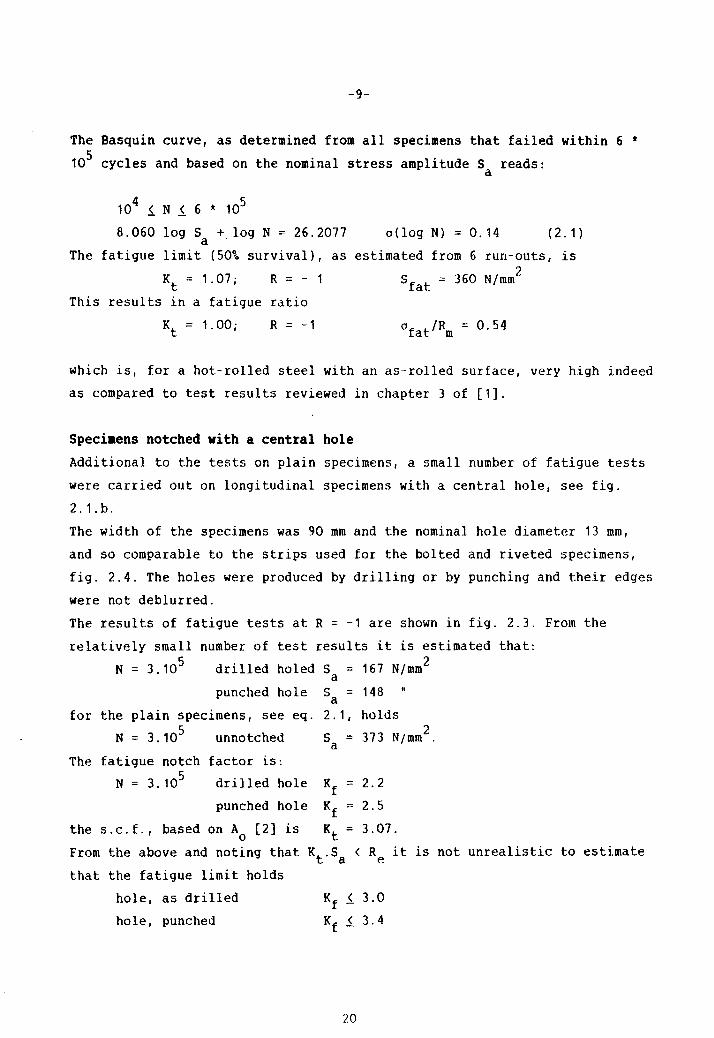
The Basquin curve, as determined from all specimens that failed within 6 * 105 cycles and based on the nominal stress amplitude S reads:
a
104 i N i 6 * 105
8.060 log S + log N == 26.2077 o(log N) = 0.14 (2.1) a The fatigue limit (50% survival), as estimated from 6 run-outs, is
Kt
== 1.07; R == - Sfat = 360 N/mm2
This results in a fatigue ratio
Kt == 1.00; R = -1
which is, for a hot-rolled steel with an as-rolled surface, very high indeed
as compared to test results reviewed in chapter 3 of [1].
Speciaens notched with a central hole
Additional to the tests on plain specimens, a small number of fatigue tests
were carried out on longitudinal specimens with a central hole, see fig.
2.1. b.
The width of the specimens was 90 mm and the nominal hole diameter 13 mm,
and so comparable to the strips used for the bolted and riveted specimens,
fig. 2.4. The holes were produced by drilling or by punching and their edges
were not deblurred.
The results of fatigue tests at R == -1 are shown in fig. 2.3. From the
relatively small number of test results .it is estimated that:
N = 3.105 drilled holed S == 167 N/mm2 a
punched hole Sa == 148
for the plain specimens, see eq.
N == 3.105 unnotched
The fatigue notch factor is:
N == 3.105 drilled hole
punched hole
the s.c.f., based on Ao [2] is
2. 1 , holds
Sa == 373 N/mm2.
Kf
2.2
Kf == 2.5
Kt == 3.07.
From the above and noting that Kt,Sa < Re it is not unrealistic to estimate
that the fatigue limit holds
hole, as drilled
hole, punched
20
-10-
2.2. specimens
After uncoiling and straightening, the material was delivered in plates of
2.000 mm length. From these plates transverse strips of 995 mm width were
cut of appropriate sizes.
2.2.1. Types of specimens
As this research program was intended to give basic information on joining
techniques, simple joints of basic configuration were used.
For the welded joints, this is a continuous weld transverse to the loading
direction, while for the bolted and riveted joints this is one bolt or one
rivet respectively.
Two types of specimens were adopted, viz:
a. A specimen with the least possible excentricity, which is for the welded
joint a butt-weld and for the bolted or the riveted joint a double shear
lap joint.
b. A specimen with high excentricity which meant a lap joint with 2 fillet
welds for the welded specimens, and a single shear lap joint for the
bolted or riveted specimens.
The dimensions of the specimens used are given in fig. 2.4.
2.2.2. Welded specimens
For the production of welded specimens, the short ends of the strips, see
fig. 2.5. were connected with heavy tack welds before welding.
Furthermore a heavy jig (plate thickness 25 mm) was used to prevent axial
and angular misalignment as much as possible.
After welding, specimens of 95 mm wide were produced by sawing.
It should be mentioned that the weld was always transverse to the rolling
direction of the plate.
2.2.3. Bolted and riveted specimens
From the strips of 995 wide, strips of 95 mm width were produced by
cutting. This cutting produces some warping, which could be accomodated by
the grips of the fatigue machines, but also some bending.
To minimize the influence of this bending, the specimens were assembled in
the way shown in fig. 2.6. The holes necessary for the bolted joints were
21
-11-
drilled, while those for the riveted joints were drilled (evaluation
program) or punched (S-N data program).
2.3. Experimental details
Fatigue tests were carried out with
- a Schenck sub-resonance machine, capacity 200 kN, at 30-40 cps.
- 2 MTS/Dowty servohydraulic machines, capacity 250 kN, at 20-30 cps.
- 2 Amsler servocontrolled resonance machines, capacity 100 kN, at ~ 150
cps.
The latter 4 machines have free rotating grips and can accommodate any
twisting of the specimens. However, the twisting of all the specimens was
negligible.
All machines have stiff grips with regard to bending, so that the ends of
the specimens are almost clamped.
So the (angular) misalignment of the specimens due to welding or due to the
cutting of the strips, see par. 2.2.3., introduced some static bending.
For the excentric lap joints, filler plates were used, and the way the
specimens were mounted in the grips is shown in fig. 2.7.
The pseudo-random load sequences used were generated in accordance with the
references [A1] and [A2] of Appendix A. A special microprocessor was used
for this purpose. During most fatigue tests the response of the servo
controlled fatigue machine was checked against the input signal by a Nicolet
digital scope.
22
-12-
3. Welded joints
3.1. Welding parameters
Metal Active Gas welding was applied throughout, and all welds were made by
mechanized welding with a Hobart type RC-607 machine. The gas used for
shielding consisted of 80% Argon - 20% CO2, as advised by the producers of
consumables in order to reduce spatter. In all cases, the plates were in a
horizontal position, while the torch was in the vertical position for the
butt welds and at 45 0 for the fillet welds.
Torch position in the welding direction was 100 to 15 0 pushing. Furthermore
both first and second weld runs were made when the plate was at room
temperature.
Butt welds
At first, trials were made to produce a low-cost butt weld using unprepared
(square) plate edges. This resulted in oversize reinforcements in all cases,
so the following edge preparation was adopted:
After bevelling the plate edges mechanically to an opening angle of 500, the
first pass was made. Then, after the opposite sides were bevelled to a 500
opening angle by grinding out, the closing pass was made.
Fig. 3.1. visualizes the procedure.
This method produced, as could be expected, oversizes of the weld acceptable
according to DIN 8563-III class BS.
Fillet welds
The fillet welds were, except for the torch position, made in the same way
as the butt welds. So welding current, -voltage and -speed were the same for
the butt welds and for the fillet welds.
No edge preparation was applied, and the thin but hard mill scale on the
bottom plate was not removed.
3.2. Consumables
Basic criterion for the selection of consumbables was the hardness of the
plate and that of its H.A.Z. These values are
plate HV5 ~ 240 to 250
23
-13-
HAZ HV5 ~ 210 a 220
It should be noted that, for the stronger grades of micro alloyed TM steel
plate, the hardness of the HAZ shows a drop as compared to the parent
material.
So, as a first round, two consumables were selected with hardnesses of the
as welded material of HVS ~ 2S0, so equal to the plate material, and of HVS
~ 270. In a second round, two more consumables were selected, one with a
hardness about equal to that of the heat effected zone, HVS ~ 220, and one
with a hardness much higher than that of the parent material, viz. HV5 ~
290.
The specifications of these four commercially available consumables as taken
from producers catalogues, are given in table 3.1.
They are hereafter named after their DIN classification or after their
Nickel content as:
ame
SG 2
1 %
1.5%
2.5%
Ni
Ni
Ni
v 220
250
270
290
Several trial runs were made with each consumable in order to
- avoid lack of fusion,
- optimize the weld profile,
- minimize the amount of spatter.
The welding conditions used to make the specimens are given in table 3.2.
Lack of fusion Some butt welds showed, after sectioning, some lack of fusion at the bottom
of the second pass. Analysis showed that this occurred only when depth of
grinding out (by hand) of the first pass, was deeper than ~ 3 mm.
By a closer control of the grinding procedure, this fault could be
avoided.
Fillet welds did not show a technical lack of fusion except for the 1.5 % Ni
consumable (see also par. 3.3.). However, the penetration at the weld root
was low for the 2 consumables with the highest hardnesses.
24
-14-
Spatter
Severe spattering was observed during some trial runs, and welding
conditions minimizing this were sought for.
According to the steelmaker, the rare earth treatment used for this steel,
see par. 2.1.1., often aggravates this phenomenon.
3.3. Evaluation tests
3.3.1. Experimental
After optimizing the welding conditions as far as possible, strips of 995 mm
wide were welded together and from these, longitudinal test specimens were
made by sawing for tensile testing and for fatigue testing, see par. 2.5.
All tensile specimens had a parallel section of 120 mm, while those with
butt welds were dressed flush.
The dimension of the specimens used for fatigue testing are given in fig.
2.4.
All fatigue tests were carried out at R = -1 and axial loading.
As the lap joint, fig. 2.7., is a highly excentric joint, the bending
stresses in the plates were measured extensively, in order to determine the
nominal maximum stresses near the weld toe. The procedure and some of the
results are described in Appendix B.
From strain measurements, see Appendix B, it was deduced that the resulting
stress caused by axial loading and secundary bending together was:
0a = (2.42 ± 0.16)Sa·
Note that this stress is not a hotspot stress, see App. B, as the distance
of the place were the stress was measured is 20 mm, that is about 3 x the
plate thickness, away from the weld toe.
In view of the above, the S-N plots for the lap joints carry 2 scales on
their ordinate, viz:
and
S a,eq 2.42 Sa' = maximum nominal stress in the plate.
25
-15-
5 is the stress scale that is applicable when these welded lap joints a.eq are tested in bending.
As the butt-welded joints also had some unavoidable angular misalignment,
the real stresses in the plate were measured in a limited number of cases.
It appeared that the stresses in the plate at the face with the dominating
fatigue crack were about 10% higher than the nominal axial stress.
An example is given in Appendix B.
In view of this small difference, no correction was made.
3.3.2. SG2 Consumable
Weld appearance
The appearance of the weld was very smooth. The oversize of the butt weld
was low (~ 1 mm). The toe angle of the fillet weld was ~ 135°, although the
toe radius was rather sharp. The amount of spatter was low, and the few
spatters that were there, were smaller than 0.4 mm. The microhardness (HV5)
of the welds was 210 to 230.
Static tests on butt welds
The static strength of the specimens with dressed flush butt welds was, Rm =
698 ± 5 N/mm2 and slightly below that of the parent material (R = 716 m N/mm2). Fracture was through the weld, but the elongation (1 = 80 mm) at
fracture was as high as 13 + 2%.
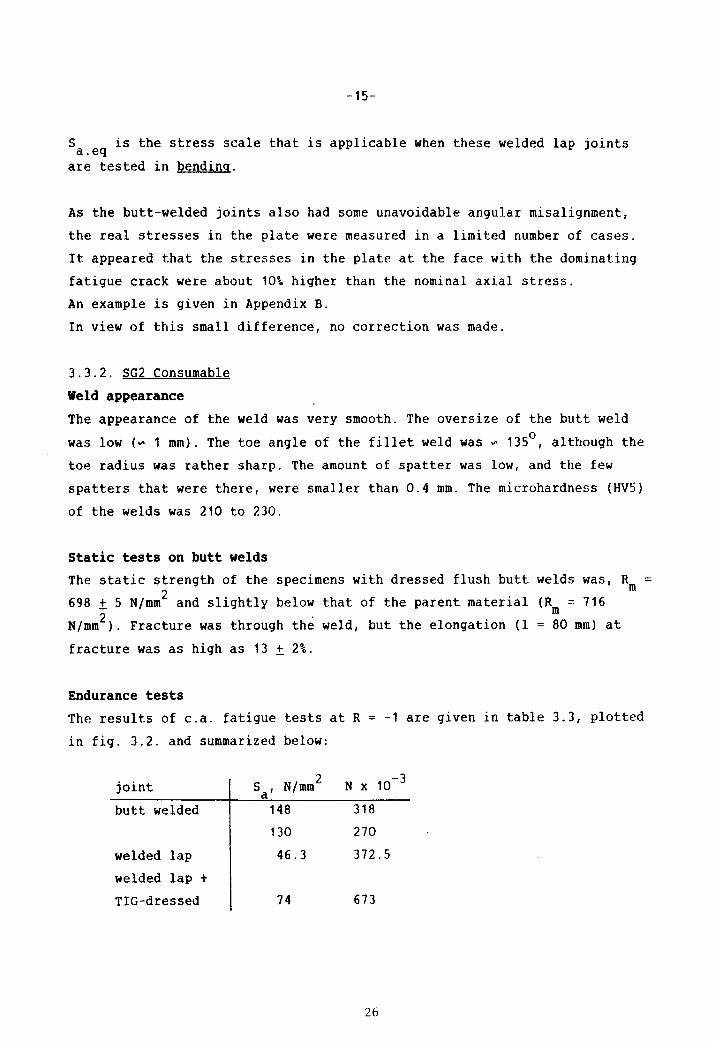
Endurance tests The results of c.a. fatigue tests at R = -1 are given in table 3.3, plotted
in fig. 3.2. and summarized below:
joint S , N/mm 2 N x 10-3 a
butt welded 148 318
130 270
welded lap 46.3 372 .5
welded lap +
TIG-dressed 74 673
26
··16-
For the lap joints, fatigue cracks initiated from tiny « 0.2 mm deep) spots
with lack of fusion at the weld toe.
As these welds showed the shortest endurances of all welds tested, 3 of the
available specimens were TIG-dressed by hand following the recommendations
given in [3].
The improvement reached, see above, is estimated at a factor 2 in stress
range, so of the same order as reported in [3].
As TIG-dressing was not a part of this program, no further attention was
given to this type of improvement.
3.3.3. 1% Ni consumable
Weld appearance
The appearance of the weld was qualified as rather rough for mechanized
welding.
The oversize of the butt weld was just acceptable according to DIN 8560 (2
mm) .
The toe angle of the fillet weld wa~ 1200.
The amount of spatter was rather high. The size of the spatters was up to 3
mm and they were fused to the plate material.
The microhardness (HV5) of the welds was ~ 250.
Static tests on butt welds
Ihe static strength of the butt welds was: Rm = 740 i 15 N/mm2. Failure was
through the plate material just outside the HAZ.
Endurance tests
Results of c.a. fatigue tests on butt welds at R = -1 are given in table
3.4. and plotted in fig. 3.3. From this table it appears that all but one
specimen failed from cracks initiated from spatters. The scatter of the
results, see fig. 3.3., is high; endurances of about 3 * 105 were measured
at S = 148 N/mm2 and at S = 92.6 N/mm2. In view of the above, no lap a a joints were tested.
3.3.4. 1.5 % Ni consumable
Weld appearance
27
-17-
The appearance of the weld was normal, but spatters were observed on all
specimens. The oversize of the butt weld was acceptable. The toe angle of
the fillet weld was 1200 and some lack of fusion was observed at the weld
toe. The microhardness of the weld was HV5 = 260 to 270.
Static tests on butt welds
The tensile strength of the butt welds was R = 752 ± 8 N/mm2. Failure was m
through the plate material and just outside the HAZ.
Endurance tests
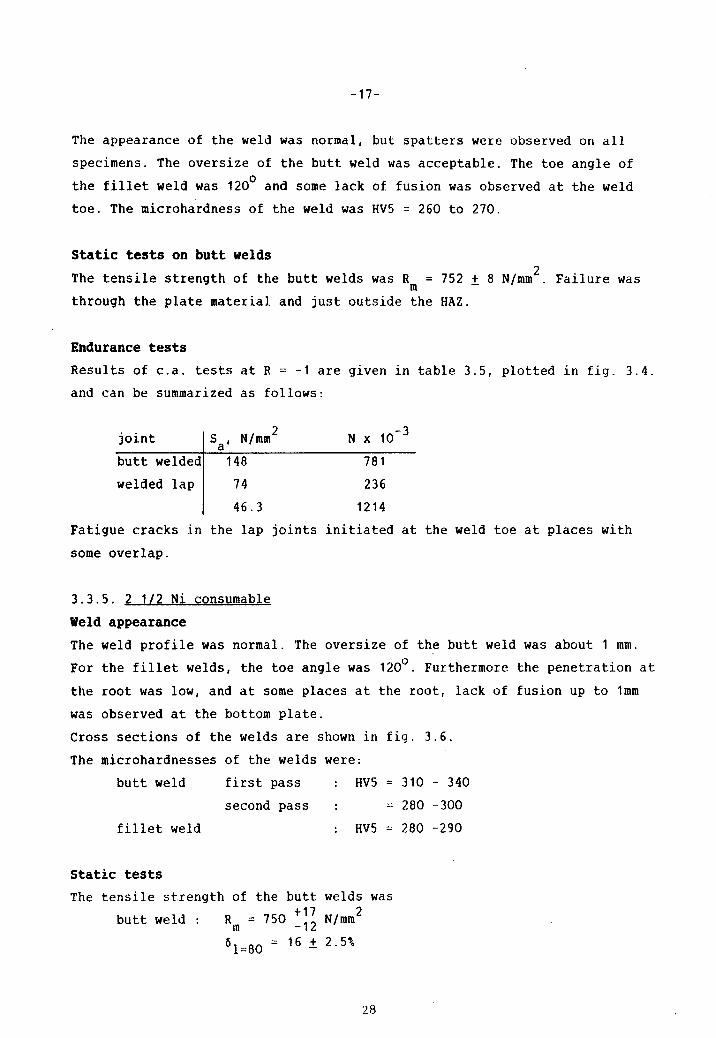
Results of c.a. tests at R = -1 are given in table 3.5, plotted in fig. 3.4.
and can be summarized as follows:
joint S , N/mm 2 N x 10-3 a
butt welded 148 781
welded lap 74 236
46.3 1214
Fatigue cracks in the lap joints initiated at the weld toe at places with
some overlap.
3.3.5. 2 1/2 Ni consumable
Weld appearance
The weld profile was normal. The oversize of the butt weld was about 1 mm.
For the fillet welds, the toe angle was 120°. Furthermore the penetration at
the root was low, and at some places at the root, lack of fusion up to 1mm
was observed at the bottom plate.
Cross sections of the welds are shown in fig. 3.6.
The microhardnesses of the welds were:
butt weld
fillet weld
Static tests
first pass
second pass
The tensile strength of the butt
butt weld: R = 750 +17 In -12
HV5 = 310 - 340
= 280 -300
HV5 = 280 -290
welds was
N/mm2
61=80 = 16 ± 2.5%
28
-18-
failure: plate material outside HAZ
fillet weld: R = 716 N/mm2 m failure: plate material outside HAZ.
Endurance tests
Results of c.a. tests at R = -1 are given in table 3.6, plotted in fig. 3.5.
and can be summarized as follows:
joint S , N/mm 2 N x 10-3 a
butt welded 148 1344
185 529
welded lap 74 236
46.3 3586
For the fillet welds, several cracks initiated from a spatter at the fusion
line. When this was not the case, initiation was from places were, at the
toe, very shallow « 0.2 mm) lack of fusion was observed. This shallow lack
of fusion could not be observed before testing, but it appeared from the
fracture surfaces.
3.4. Selection of the optimum joint
From the results, given in par. 3.3, the quality of the different joints was
evaluated as follows:
Tensile strength
The tensile strength of all welded joints was sufficiently high and all
fractures took place in the plate, outside the HAZ except for the SG 2 joint
where fracture was across the weld at a stress only fractionally lower than
the tensile strength of the plate material itself.
Also the elongation was sufficient in all cases. For the SG2 joint it was
13\ while for the other joints yield and failure took place in the plate
material outside the HAZ.
So from static point of view all welds were satisfactory.
Hardness
29
-19-
The hardness varied for the different welds from HV5 ~ 220 (SG 2) to HV5 ~
290/330 (second and first pass of the 2 1/2 Ni consumable), while the
hardness of the plate material was HV5 ~ 245. As could be expected, this
hardness has no influence on the static strength as long as failure takes
place in the plate material.
Fatique strenqth
In fig. 3.7. and 3.8. the fatigue results of the evaluation series, are
plotted for the butt joints and for the lap joints respectively. It is clear
that the SG2 type joints have the lowest fatigue resistance. The 1% Ni type
joints showed fatigue failures from apparently unavoidable large spatters, a
large scatter of results and a fatigue resistance that is estimated to be
hardly any better than that of the SG 2 weld.
The 1.5 % Ni type butt welded joints showed a large improvement with regard
of the SG2 and the 1 % Ni type joint. The fillet welded joints however,
showed a lack of fusion at the weld toe. In spite of several trials at
different welding conditions, no improvement could be reached. Therefore
this type of joint was regarded as not acceptable.
The 2.5 % Ni type joints gave the best overall performance. Their fatigue
strength was, depending on stress level, equal to or better than that of the
1.5 % Ni type, the weld profile was acceptable, and spatters outside the
fusion-line zone did not introduce crack initiation.
Therefore, it was decided to use these 2.5 % Ni type joints to produce S-N
data. A summary of these arguments is given in table 3.7.
30
-20-
4. S-N data for 2.5 % Ni type-welded ioints
Joints, welded with a 2.5 % Ni type consumable were selected, see par 3.4.
to determine S-'N curves in order to produce fatigue data, suitable to be
used in the design stage.
As discussed in par. 1.4, 3 types of loading were used, viz.
- constant amplitude loading,
random loading, J = 0.99, see Appendix A,
- random loading, J = 0.71, see Appendix A.
All tests were performed in axial loading at R = -1.
4.1. Butt welded joints
The production of the specimens is described in par. 2.2 and the dimensions
are given in fig. 2.4. In view of the grip failures experienced during the
evaluation tests, see table 3.6., the specimens were waisted to a width of
75 mm as is also shown in fig. 2.4 All specimens had some angular
misalignment, and as a consequence, fatigue crack initiations took place at
the hollow side of the specimens for 90\ of the tests. All fracture
surfaces showed multiple crack initiation.
4.1.1. Constant amplitude loading
The results of constant amplitude fatigue tests at R = -1 are given in table
4.1.a. and plotted in fig. 4.1. From this figure it appears that 2
specimens, one at Sa = 222 and one at Sa = 266, had a relatively low
endurance. This was apparently caused by a linear misalignment of ~ 0.75 mm,
while the axial misalignment of all other specimens was below 0.25 mm., (see
also Appendix B for the bending stresses).
The Basquin equation, determined by linear regression from the test results,
including those from par. 3.3.5., but without those from the 2 specimens
with excessive excentricity, is:
5.47 log Sa + log N = 18.390.
31
-21-
This line is given 1n fig 4.1. too, together with the class 0 lines of BS
5400 [5].
The difference between the two needs no comment, but it appears that the
results from the 2 excentric specimens are very close to this mean D-line,
although they are still far off from the D-2 s.d. line.
This emphasized the importance of carefull welding techniques.
The fatigue limit (50% survival) is estimated at
R = -1
4.1.2. Random amplitude loading, J = 0.99 and J = 0.71
Random fatigue tests were carried out using 2 different spectra,
characterized by J = 0.99 and J = 0.71 respectively (see Appendix A) and R -.
-1. The results are given in table 4.1.h. and plotted in fig. 4.2. on the
base of SRMSversus N, the number of positive going zero crossings.
The maximum stress in the specimens loaded at the highest SRMS was about 10%
below general yield
q x S = 5.26 x 10⁵ < 628 rms 2 = R , N/mm . e
The Basquin equation, determined by linear regression using all test results
is as follows:
J = 0.99 8.90 log S + log N 23.139 rms J = 0.71 8.22 log S + log N = 21.719 rms 2
The ratio of the endurances at S = 80 N/mm is: rms
1.59 * 106/1.190 * 10
6 = 1.34
4.2. Welded lap joints
The production of the specimens is described in par. 2.2. and the dimensions
are given in fig. 2.4.
For the clamping of these specimens in the grips of the machines, filler
plates were used, see fig. 2.7., to prevent an initial bending moment.
As these lap joints are excentric, the axial loading leads also to rather
high secundary bending moments.
These were measured by frictional-strain gages as described in App. B.
32
-22-
Measurements were taken from the plate at about 20 mm from the weld toe.
The ratio of maximum fiber stress amplitude, 0 , calculated with E ~ 210.000 a N/mm2, and the nominal axial stress amplitude, S , as averaged from 10 a specimens was
This means that, when these specimens had been tested in bending in stead of
in axial loading, the stress scale would have been Sb d' ~ 2.42 x en Ing S . 1.AS the majority of fatigue tests on welded joints are performed in aXla bending, the equivalent stresses for bend tests, Sa are given too in eq. figs. 4.3 and 4.4.
4.2.1. Constant amplitude loading
The results of constant amplitude fatigue tests at R
4.2.a. and plotted in fig. 4.3.
-1 are given in table
Normally, fatigue failure initiated from the weld toe. However, at lower
stress levels failure through the weld did occur in 2 cases at very high
endurances. Four high-endurance specimens with weld toe failures were
analysed and 2 of them showed also macro-cracks from the weld root.
The explanation of this phenomena could be as follows:
Due to the welding process the load transfer through the two welds is
unequal.
At higher stress amplitudes, a redistribution by plasticity takes place, and
the stresses at the toe determine the endurance.
At lower stress amplitudes, cracks will start at a weld root and a load
redistribution can be now achieved by plasticity and/or by the reduced
stiffness of the partially cracked weld (unless its fracture thoughness is
exceeded) after which the weld toe is critical again.
At low stress amplitudes, a stress redistribution is hardly possible and the
cracks growing from the root will determine the endurance.
The Basquin ~quation for weld-toe failure, based on endurances N < 106
3.16 log Sa + log N - 11.308.
The endurance limit (50% survival) is estimated at
33
Root or toe failure
Toe failure
-23-
Sf ::; 43 N/mm2
Sf ::; 55 N/mni2
The F2-line according to BS 5400 [5], applicable for transverse, load
carrying fillet welds when the effect of the weld ends is low, is for
comparison also plotted in fig. 4.3. on the base of Sb d" = S en l.ng a eq The difference between this line and the experiments needs no comment.
4.2.2. Random amplitude loading. J = 0.99 and J = 0.71
Random fatigue tests were carried out using the same spectra as used for the
butt welded joints.
No weld-root failures were observed, which is consistent with the
explanation given in par. 4.2.1.
The results are given in table 4.2.b. and plotted in fig. 4.4. on the base
of S versus N. The maximum stress in the plate, see par. 3.4.2. at the rms highest Srms used was
2.42·q·\ms 2.42 it 5.266 it 50 = 636 N/mm2
and about equal to R =- 628 N/mm 2 e
The Basquin equations based on all specimens, are
J 0.99 4.37 log Srms + log N .- 12.358
J = 0.71 4.55 log S + log N = 12.729 rms
J =- 0.71 + 0.99 4.48 log Srms + log N =- 12.567
The last equation is given because of the small differences in endurance
between both spectra, together with the relatively small number of specimens
per spectrum.
In fig. 4.4. only this last equation is plotted for reasons of clarity.
34
-24-
5. Bolted joints
5.1. Introduction
Friction grip type bolted joints are known to perform better than other
bolted connections. They are used quite often in industry and calculation
methods for design purposes are available [6/ 7/ 8].
Necessary for efficient friction grip type joints are
- a high coefficient of friction between the plates,
- a high clamping force.
A high coefficient of friction, together with the necessary protection
against corrosion can be reached by the use of special primers. These so
called high-friction primers show a static coefficient of friction that
exceeds the value of 0/55 [9].
A high clamping force can be reached by pretensioning the bolt, and high
strength bolts are mandadory in this respect. The bolts and nuts used for
this purpose throughout in structures comply to class 10.9 according to DIN
ISO 898.
The clamping force is, at least in Europe, usually generated by applying a
controlled torque to the nut, so that the axial stress in the bolt is
about 70% of the minimum RpO / 2 ' However, as the greater part of the applied
torque is necessary to overcome the frictional forces/the accuracy of this
method is not very large, despite the use of hard washers, etc.
Another method of pretensioning that is coming into use for friction grip
joints is that of strain controlled torqueing. Under this method the ratio
of the increment of the torque versus the increment of the angular
displacement is measured continuously. When this ratio shows an appreciable
drop, e.g. a factor 1/3 to 1/2/ the yield strength of the bolt is reached
and the torqueing is stopped.
This method is practically independent of the frictional forces under the
nut or the bolt head, and also of the friction in the screw thread as long
as this friction has its normal low value (~ = 0.10 - 0.18) [6J. The
principles are shown in fig. 5.1.
So with yield control the bolt is utilized up to the RpO/2 of the material
in stead of only up to about 0.7 * RpO/2 min. as with torque control, and
furthermore the need for special washers is no longer there, because the
35
-25-
tension in the bolt is practically independent of the different frictional
forces.
Therefore, in this investigation, flanged nuts and flange-head bolts of
class 10.9 were used together with yield-controlled tightening, in order to
get a high-efficiency joint as well with regard to handling and mounting as
with regard to material utilization.
5.2. Joint preparation
5.2.1. Plate material
The specimen were built up from strips, 90 x 230 mm, see fig. 2.4., provided
with drilled holes, ¢ 13 -h12 mm.
The surfaces of the strips were (after drilling) cleaned either by corund
blasting or shot blasting to SA 2.5 - 3 according to SIS 05-5900 or DIN
55928-4.
Corund blasting was used because it can be applied in the open, outside the
workshop. Corund grainsize diameter was 1.4 - 2.0 mm, and the resulting
surface roughness of the strips was R ~ 15 ~m. a Shot blasting is a normal workshop practice. The steelshot diameter was 0.4
- 0.9 mm, and the resulting surface roughness was Ra ~ 5 ~m.
The primer used was a 2 component alkali-zinc silicate primer based on zinc
powder and alkali silicate. This primer complies with DBB-TL 918.385 [9],
and so has a static coefficient of friction ~ > 0.55.
This primer is called ·primer BM.
As a reference, tests were also carried out with a red washprimer based on
polyvinylbutyral with phosphoric acid as a hardener dissolved in organic
solvents, furtheron called "primer Aft. This type of primer is often used in
transport industry.
The thickness of the coatings was 40 ± 9 ~m as .measured with a Monimeter,
using coated unblasted strips as a reference.
5.2.2. Bolts and nuts
The shape of the flanged nuts and flange-headed bolts of size M12 x 40
mm complied with ISO-DP4161 and ISO-DP4162 respectively. The material used
was:
36
-27-
The influence of the different blasting processes used is negligible when
the same primer is use.
The load at slip for the double shear lap joints is about 1.85 x that for
the single shear ones. This is probably due to a somewhat uneven
distribution of the load between the 2 shear faces.
- The load at slip is very uniform, although there are large variations in
the applied torque. This shows that yield control is a reliable method to
pretension bolts
38
-26-
Bolt Nut
Designation
Reference
32B3 C45Pb
ISO 4954 type E5 DIN 17200
The nuts were hot formed and heat treated to grade 10 according ISO 898-2.
The bolts were cold formed and heat treated to grade 10.9, according ISO
898-1, viz: 31 < HRC < 39 and R > 1040 N/mm2. m The hardness of the bolts was 34 < HRC <36, while their tensile strength was
Rm = 1060 to 1160 N/mm2.
Bolts and nuts were provided with a yellow passivated layer of electrolytic
zinc, 5-8 ~m thick. Furthermore the screw thread of the bolts were treated
with a fatty-acid soap for conservation and to provide lubrication.
The bolts were tightened using a yield-control wrench, type Unbrako SPS
Wrench 125.
The principles of this apparatus are descibed in par. 5.1.
The clamping force from the bolt could not be measured because of the short
clamping length (2 x 6 or 3 x 6 mm). However, from comparison of the
elongation of the bolts due to torqueing with the elongation of the bolts in
a tensile test, the clamping force is estimated to be about 80 kN.
5.2.3. Static shear tests
Static tests were carried out on the single and double shear lap joints with
different conditions of the plate surface. (It is clear that these tests did
not comply with [10].)
The following combinations were used:
corund blast + primer B
shot blast
shot blast
+ primer B
+ primer A.
The mounting of the specimens in the machine is shown in fig. 2.7.
The results are given in table 5.1.
From this table it appears that
- The load at slip, when using primer A is about 0.53 of that when using
primer B.
- Even the load at failure is influenced by the primer used. With primer A,
the load at failure is about 10% lower than with primer B.
37
-28-
6. Fatigue tests on friction grip joints
Due to the different behaviour of the friction grip joints as compared to
the welded- and the riveted joints, there is no real difference between
the evaluation tests and the tests to produce S-N data. Therefore all
fatigue tests are discussed in this chapter.
The mounting of the specimens in the machine is shown in fig. 2.7.
6.1. Double shear lap ioints
6.1.1. Constant amplitude loading
Two series of constant amplitude fatigue tests were carri.ed out on double
shear lap joints. For both series primer B was used as a coating. The
difference between the series was the type of blasting (see par. 5.2.1) viz.
corund- versus shot blasting. During the first series (corund blast, see
table 6.1) it was tried to determine the endurance at different loads.
However, it appeared that no fatigue failures could be produced for
endurances up to 107 cycles because of the occurence of cyclic slip. From
table 6.1 it is estimated that the minimum friction force under fatigue
conditions is 75 kN, because at 70 kN only runouts were met, while at 80 kN
there were 2 runouts and 4 failures from cyclic slip. So the cyclic friction
of these double shear lap joints is, see table 5.1.b, ~ 80\ of the static
friction.
The second series (shot blast, table 6.2) was tested in a different way. As
from the first series it appeared that a specimen would become a runout when
no cyclic slip occurred within 100.000 cycles, the load was increased after
every 100.00 cycles until cyclic slip occurred.
From table 6.2. a minimum dynamic friction force of 75 to 80 kN can be
deduced on the base of 4 out of 5 specimens, which is more than 90% of the
static friction reported in table 5.1b.
From measurements see table 6.2, it appears that the static load that can be
carried by friction after occurrence of cyclic slip is 45 to 50 kN.
With regard to the premature failure of the last specimen, the possibility
of a highly uneven load transfer through the plates due to an improper
mounting in the fatigue machine cannot be excluded for this specimen.
39
-29-
6.1.2. Random amplitude loading
As with constant amplitude loading no fatigue failures could be generated,
loading with random varying amplitudes cannot give new information as long
as the peak loads are lower than the friction forces. However, for design
purposes it is very important to know whether the design load of a friction
grip joint must be based on the few high peaks in the load spectrum or can
be related to the more moderate peaks. Therefore some tests were carried out
under a pseudo-random loading (block length 2150 cycles, J ~ 0.71; crest
factor 3.16) of which the maximum peak load exc~eded 75 kN.
At a maximum peak load of 80 kN the number of peaks exceeding 75 kN was 6
per 1000.
At a maximum peak load of 90 kN the number of peaks exceeding 75 kN was 24
per 1000.
From the results, given ih table 6.3a it follows that:
Peak loads between 75 and 80 kN cause cyclic slip after 6300 to 140.400
cycles, which means after 38 to 842 exceedings of F = 75 kN. a Peak loads between 75 and 90 kN cause cyclic slip after 4.000 to 68.600
cycles, which means after 96 to 1646 exceedings of Fa = 75 kN.
It follows that the desi~n load of a ftiction grip bolted joint should
be based on the high loads within the spectrum that occur only very
seldom (say 10 times) during the full lif~ of the structure involved.
6.2. Single shear lap joints
6.2.1. Constant amplitude loading
As for the double shear joints, two series of c.a. fatigue tests were
carried out which only differed from each other by the applied blasting. The
results of these series are given in table 6.4a and b. Furthermore tests
were carried out on joints coated with a low friction primer (primer A). The
results of these tests are given in table 6.4.c.
From table 6.4.c. it appears that for primer A the minimum dynamic friction
is 15 kN which is, see table 5.1.a., only 66% of the static friction force.
At that level no fatigue failures did occur for endurances exceeding 107 .
The minimum dynamic friction for primer B is estimated, see table 6.4., at
37.5 kN when the surface is corund blasted (2 x slip and 5 x plate failure
40
-30-
at 40kN) and 37.5 to 40 kN when the surface is shot blasted (no slip and 3 x
plate failure at 40 kN). So the dynamic friction is ~ 80\ of the static
friction, as was found for the double shear joints.
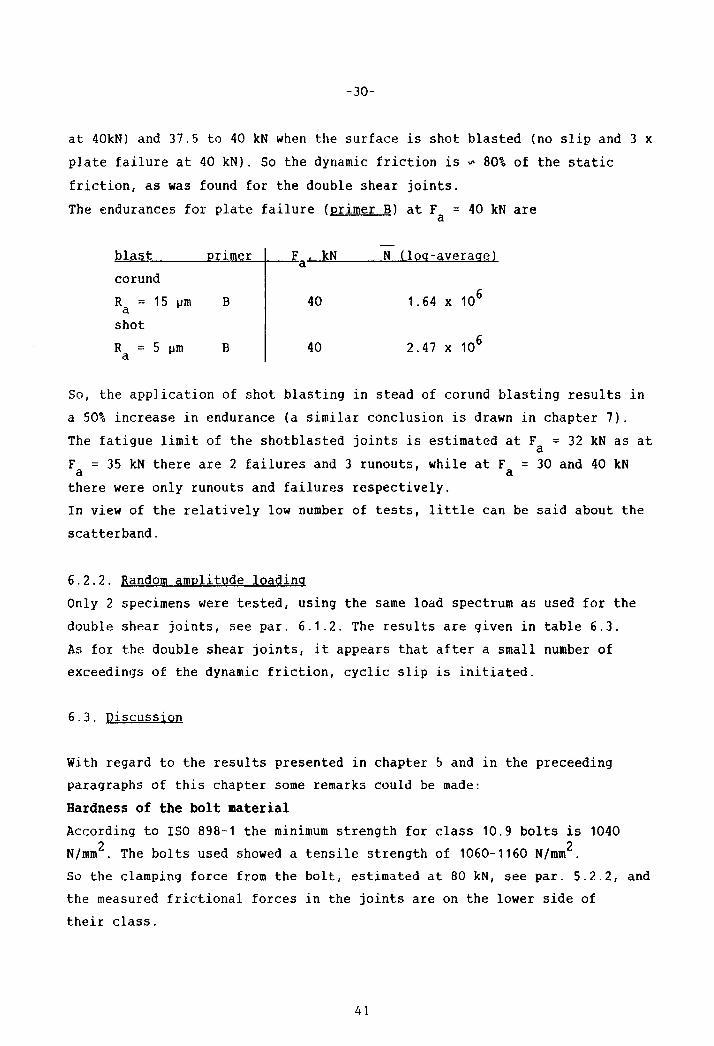
The endurances for plate failure (primer B) at F = 40 kN are a
last rimer N (log-average)
corund
R = 15 ~m B a 40 1.64 x 10⁶
shot
R = 5 ~m B a 40 2.47 x 10⁶
So, the application of shot blasting in stead of corund blasting results in
a 50% increase in endurance (a similar conclusion is drawn in chapter 7).
The fatigue limit of the shotblasted joints is estimated at F = 32 kN as at a Fa = 35 kN there are 2 failures and 3 runouts, while at Fa = 30 and 40 kN
there were only runouts and failures respectively.
In view of the relatively low number of tests, little can be said about the
scatterband.
6.2.2. Random amplitude loading
Only 2 specimens were tested, using the same load spectrum as used for the
double shear joints, see par. 6.1.2. The results are given in table 6.3.
As for the double shear joints, it appears that after a small number of
exceedings of the dynamic friction, cyclic slip is initiated.
6.3. Discussion
With regard to the results presented in chapter 5 and in the preceeding
paragraphs of this chapter some remarks could be made:
Hardness of the bolt material
According to ISO 898-1 the minimum strength for class 10.9 bolts is 1040
N/mm2. The bolts used showed a tensile strength of 1060-1160 N/mm2.
So the clamping force from the bolt, estimated at 80 kN, see par. 5.2.2, and
the measured frictional forces in the joints are on the lower side of
their class.
41
-31-
Single or double shear lap joints
It is apparent that the friction in a double shear lap joint is less than
twice the friction in a single shear joint. As the strips were produced by
cutting they were not entirely flat, and this could lead to an uneven
distribution of the load across the plates in the case of a double shear lap
joint (see fig. 2.6 and 2.7). From strain measurements with frictional
strain gages, it is calculated that the load transfer per plate was betweeen
5 and 10% larger/smaller than the average load.
Friction after cyclic slip
In a few cases the static friction was measured after the occurrence of
cyclic ~lip, see table 6.2 and 6.4.c. It appears that this residual friction
is of the order of 0.6 to 0.7 of its initial value.
In a few other cases the fatigue load was reduced to a lower value after
cyclic slip occurred, see table 6.4.a. and c. A load reduction of 35%
appeared sufficient to restore the friction grip conditions. Whether a
residual friction after cyclic slip of about 0.65 of the maximum friction is
a general feature is not known, but is reassuring that the joint retains the
greater part of its friction capacity after cyclic slip and also that in not
any case signs of working loose were observed for these flanged nuts and
bolts.
Friction after cyclic loading
It is sometimes assumed that the maximum friction is increased during a
(c.a.) fatigue test due to (localised) fretting.
From the reported experiments there are indications that the reverse is
true, because in a nu'illber of cases, see e. g. ta.ble 6.2, cyclic slip only
develloped after more than 50.000 cycles.
Influence of blasting condition In par. 6.2.1. it was deduced that blasting with steelshot resulted in
a larger endurance than when corund was used as a blast. It is obvious that
the resulting quality of the steel surface is more important than the way it
is produced. From the blasting, 2 effects are regarded as important, viz:
the surface roughness and the amount of peening.
42
-32-
Now the surface rougness after shotblasting was about R = 5 ~m while after a
corund blasting it was only R = 15 ~m. a
The amount of peening due to the blasting is unknown, but it can be argued
that a heavier blasting medium can produce more strain hardening and
compressive surface stresses than a lighter one. A smoother surface as well
as more peening will have a retarding effect on the formation of microcracks
from fretting fatigue and can easily increase the endurance to the extent
given in par. 6.2.1.
Design considerations
According to DAS-Richtlinie 010 [8], the clamping force of class 10.9 bolts
is 50 kN (torque control) and the allowable fatigue load on friction grip
joints is 18 kN per surface (~ = 0.5, safety factor 1.40).
For the joints investigated here the clamping force from 10.9 bolts in
yield control was about 80 kN and the limit for cyclic slip about 37.5 kN.
After applying the safety factor of 1.4, the allowable fatigue load for
these friction grip joints becomes 27 kN, which is 50% higher than that
according to DASt-010. It is very clear that, in order to utilize the
capacity of high strength structural steels, improvements in joining
techniques as are investigated here, are mandatory.
Whether friction grip type joints are really suitable for the construction
involved, depends on the type of structure itself and on the load spectrum
it will meet in service. As the overload capacity of friction grip joints
appears to be low, see par. 6.1.2., the dimensioning of these joints must be
based on the (few) high load excursions encountered during service life.
43
-33-
7. Evaluation of riveted joints
7.1. Rivet material
From the different types of low-alloy steels, in use for manufacturing bolts
etc., the nNederlandse Schroefboutenfabriek", as a participant in this
research program, selected the micro-alloyed steel 18 Mn 84 on the base of
its deformability and hardenability. Its chemical composition is given in
table 7.1.a. This material complies with class E2 steel according to ISO
4954 (steels for cold heading and cold extruding). Round head rivets
according to DIN 124 were produced by cold heading from this material by
standard industrial practice and heat treated to different hardnesses.
A Europatent for this innovation is applied for.
All rivets were electroplated with a layer of zinc, 5-8 ~m thick, and yellow
passivated.
Rivets from this material proved adequate and a complete range of hardnesses
190 1 HB 1 350 could be used to form joints. Within this range no cracks
were observed in the most critical parts of the formed rivet, viz.: the rim
of the conical counterhead and the fixed head-shaft radius.
The dimensions of the rivets are given in fig. 7.1.
Tensile tests were performed on this material in the quenched and tempered
condition. Tempering temperatures were 400, 500 and 600 °c resp. and the
results are given in table 7.1.b.
During the tensile tests, the diametral strain was also measured at regular
intervals in order to determine its strain-hardening properties. The
parameters 00
and n of Nadai relation
o = a en a
were determined by linear regression from measurements up to ed < 0.35, the
limit of usability of the gage, see table 7.1c. As the Bridgeman correction
factor [11] is still small for ed 1 0.35, it was not applied here.
7.2. Rivetability
Rivets, tempered to different hardnesses were used to produce joints. The
riveting was done by cold-pressing in a tension/compression machine under
load control, after it was established by measurement that the speed of
44
-34-
deformation of hydraulic rams Ilsed in industrial riveting was about 10
mm/sec and too low to cause dynamic strain-rate effects.
As a counter head, a conical head was used with the dimensions as given in
fig. 7.1.
Most rivetability tests were performed with punched holes. The head of the
rivet was always at the wide side of the punched hole, as this situation is
known to be critical as well for the degree of filling as with regard to
fatigue.
The force, necessary to produce a conical counter head according to fig.
7.1. and a proper filling of the hole proved to be, at least for a material
with a low degree of strain hardening as used here,
F ~ 2 Rm . AO'
At F ~ Rm.AO' the rivet fills the hole without filling its irregularities.
At F ~ 1.75 Rm.AO the conical head is formed for the greater part and
sometimes complies already with the minimum diameter. However the
irregularities of the holes are not yet filled sufficiently.
From F ~ 1.75 to 2RmAO' the filling of the hole is completed, together with
the final shape of the head.
Now for a riveted connection 2 aspects are important, viz.
- the filling of the hole and
- the deformation of the plate material.
A good filling is necessary because otherwise the rivet works loose under
service conditions and looses its bearing capacity.
The deformation of the hole, which is largest below the counter head, see
fig. 7.2., may cause bulgeing of the plate so that at the next rivet hole in
the pattern an unacceptable gap between the plates is formed.
It is quite clear that these 2 effects are contradictious.
Sectioning joints, made with rivets of different hardnesses revealed, see
table 7.2. and fig. 7.2., that with rivets with hardnesses 230 < HB < 280 to
310 a good quality riveted joint can be made. Higher hardnesses cause
excessive deformation of the plate material. For fatigue evaluation, rivets
with HB = 233 and 280 were chased, because
- their tempering temperature is within the usual range of tempering
temperatures viz. 500-600 °c,
45
-35-
- when HB = 233, the maximum force is 250 kN and equal to the force in use
for A.5-AI rivets (see par. 7.3) viz. 250 kN;
- when HB = 280, the maximum force is 400 kN, and the versatility of an
industrial riveting tool of thisc size is still reasonable.
7.3. Reference fatigue tests on A.5-AI rivets
As a reference for the results of the HS rivets, a number of fatigue tests
were performed on joints made with rivets to ISO 4954 class A.5-AI steel.
These rivets are used quite often for building chassis. The joints used were
single shear lap joints and their dimensions are given in fig. 2.4. In order
to gather some insight into the influence of the surface condition of the
plate and of a possible effect of deblurring punched holes, 4 series of
nominally 6 specimens each were tested, viz.:
Hole quality
- as drilled
- drilled and beveled 1/2 mm x 45 0
Plate surface
- surface as received (thin mill scale)
- surface shot-blasted (SA 2.5) and coated with 40 ~m wash primer (primer A,
see par. 7.4.) after drilling (so the holes were treated too).
The condensed results are given in table 7.3.
The conclusions drawn from these series are:
- Beveling the holes with 1/2 mm x 45 a decreases the endurance with a
factor 3, when the surface is untreated. Deblurring punched holes will
probably produce a similar effect.
- Coating the plate and hole surfaces with a wash primer reduces the
endurance with a factor 4 when the holes are not beveled and a factor 4.5
when the holes arc beveled. The deterioration of the rather soft primer
apparently causes the rivets to work loose during fatigue loading and has
a detrimental effect on the endurance.
7.4. Surface conditions
To start with, it should be mentioned that transport vehicles need a
protective coating in order to protect the steel from corrosion by water and
road-salt. According to experience from service a protective coating is
also preferred at the interface of the parts of the joints. As riveted
46
-36-
joints have a low clamping force this interface coating is more or less
mandatory.
Therefore, because of the detrimental effect of wash primer A on the
endurance, see par. 7.3, a seperate evaluation program was set up in order
to determine the influence of different coatings on the endurance and on the
static strength of joints riveted with HS rivets.
The following primers were used:
A. a red washprimer based on polyvinylbutyral with phosphoric acid as a
hardener, dissolved in organic solvents.
B. a 2-component alkali-zinc silicate primer based on zinc powder and
alkali-silicate.
This is a high-friction primer that complies with DBB-TL 918.385 [9].
c. a 2-component zinc-rich primer based on epoxy-resin with a polyamide
crosslinker as a second component.
o. a one-component zinc-rich primer based on epoxy-ester, cured at elevated
temperature.
The primers A, C and D were applied after the steel surface was cleaned by
shot blasting to SA 2.5 - 3. The surface roughness was Ra ~ 5 ~m.
The primer B was applied, with the exception of series E14, after blasting
with corund grit (SA 2.5 - 3). The surface roughness was Ra ~ 15 ~m.
The thickness of the paint was in all cases 35 to 45 ~m, as measured with a
Monimeter, using primered plates with an as-rolled surface as a reference.
Table 7.4 gives a survey of the test series. The joint used was a single
shear lap joint according to fig. 2.4.b. The holes were drilled and the
hardness of the rivet was HB 233 or HB 280.
7.5 Static strength
Tensile tests were carried out on single- and double shear lap joints having
2 different surface preparations, 3 rivet hardnesses and 2 hole production
methods, viz. punching and drilling. The results are given in table 7.S. and
7.6. From these results it follows that:
47
-37
the surface condition of plate and hole has only a minor influence on the
static strength of the joint.
there is a systematic, although small, difference between joints with
bored holes and joints with punched holes. The latter configuration yields
a fractionally higher static strength. This is probably due to the
increase in hole diameter due to the punching prqcess.
On the average, the shear strength of the rivets, based on a rivet-diameter
of 13 mm and bored holes, is:
material
A.5-Al
E2 (18Mn 84)
HB 233
HB 280
single shear double shear
~ 340 ~ 300
'" 470
'" 565
'" 450
'" 540
7.6. Endurance evaluation tests at R = -1
The results of fatigue tests on the 8 different test series, within the
evaluation program for surface conditions, are given in table 7.7 through
7.14. Most specimens failed from shear of the rivet. Other types of failures
can be read from these tables. All tests were carried out on a servo
controlled Vibrophore at frequencies around 150 cps. For all series, the
average endurance, log N, was determined together with the standard
deviation o(log NJ. In view of the low number of specimens per series, this
standard deviation is not very reliable, but nevertheless it gives an
impression of the spread in results.
In order to make a survey possible, a compilation of all results is given in
table 7.15. and in fig. 7.3. From these, the following conclusions can be
drawn:
7.6.1. Rivet quality
A comparison of Series E1 (table 7.3.' with series E13 and E15 (table 7.15)
which have the same or about the same surface condition, shows
Ri vet Load I kN I if * 106 a (log N) series
48
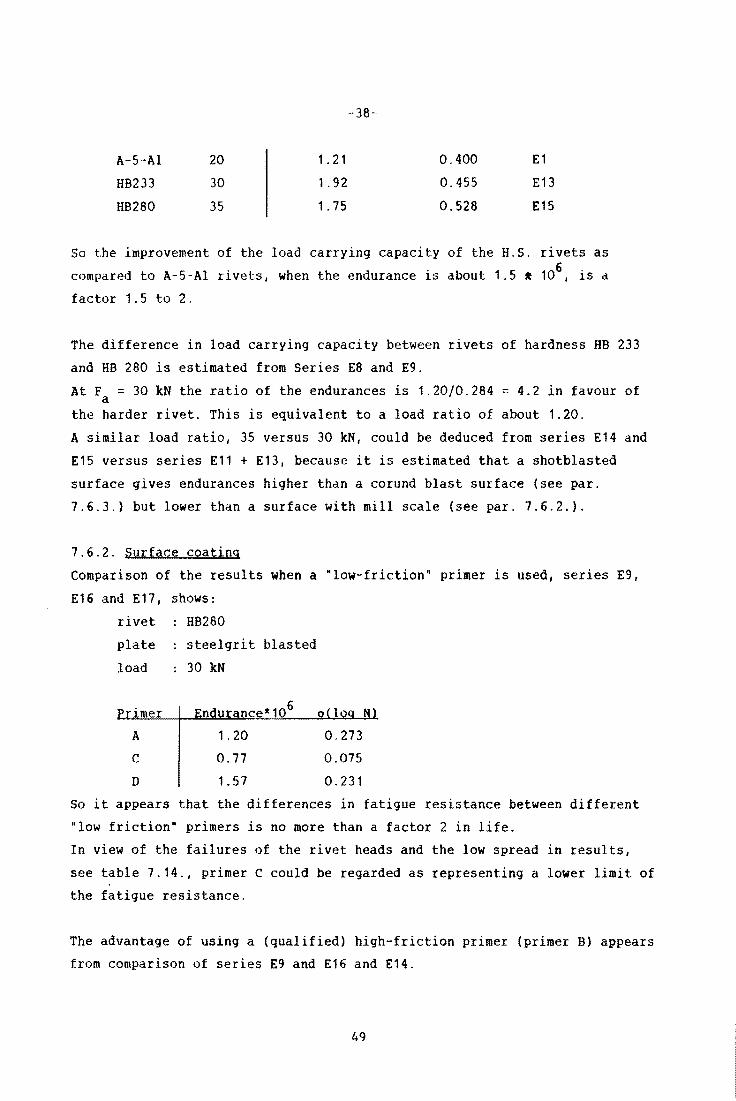
A-5-AI
HB233
HB280
20
30
35
1 .21
1.92
1.15
-38-
0.400
0.455
0.528
E1
E13
E15
So the improvement of the load carrying capacity of the H.S. rivets as
compared to A-5-AI rivets, when the endurance is about 1.5 ~ 106 , is a
factor 1.5 to 2.
The difference in load carrying capacity between rivets of hardness HB 233
and HB 280 is estimated from Series E8 and E9.
At Fa = 30 kN the ratio of the endurances is 1.2010.284 = 4.2 in favour of
the harder rivet. This is equivalent to a load ratio of about 1.20.
A similar load ratio, 35 versus 30 kN, could be deduced from series E14 and
E15 versus series E11 + E13, because it is estimated that a shotblasted
surface gives endurances higher than a corund blast surface (see par.
1.6.3.) but lower than a surface with mill scale (see par. 1.6.2.),
1.6.2. Surface coating
Comparison of the results when a "low-friction" primer is used, series E9,
E16 and E11, shows:
rivet
plate
load
rimer
A
C
D
HB280
steelgrit blasted
30 kN
1. 20
0.11
1. 51
0.213
0.015
0.231
So it appears that the differences in fatigue resistance between different
"low friction" primers is no more than a factor 2 in life.
In view of the failures of the rivet heads and the low spread in results,
see table 1.14., primer C could be regarded as representing a lower limit of
the fatigue resistance.
The advantage of using a (qualified) high-friction primer (primer B) appears
from comparison of series E9 and E16 and E14.
49
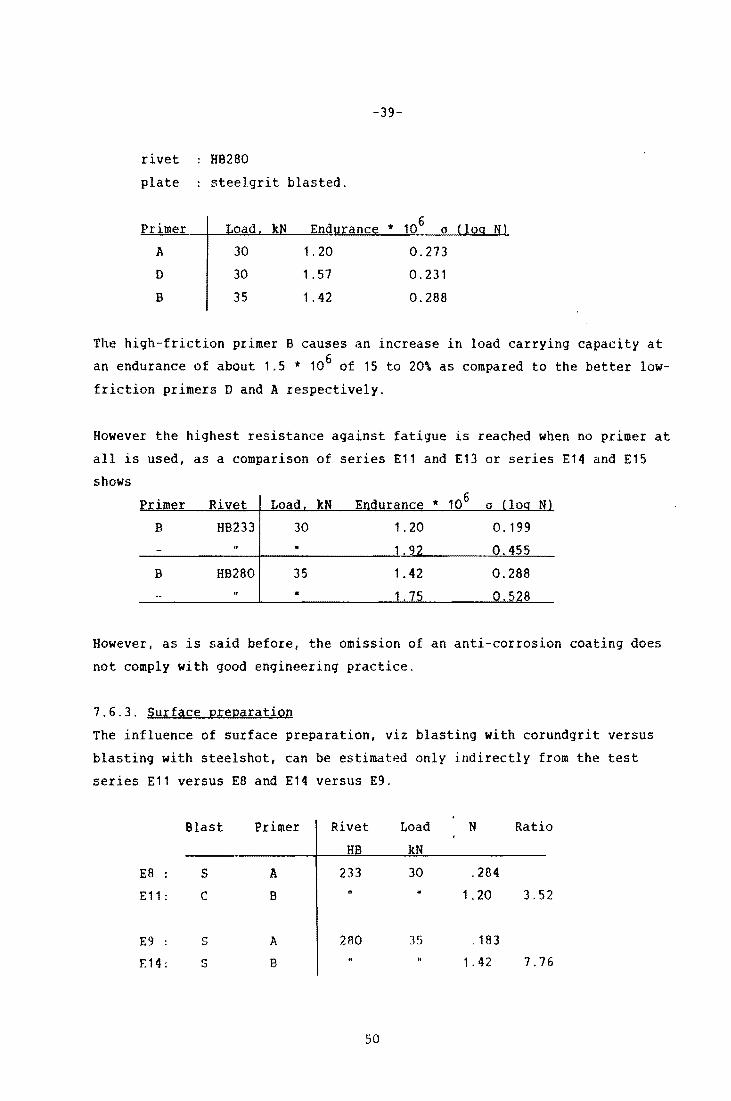
-39-
rivet HB280
plate steelgrit blasted.
Primer 106 0
A 30 1.20 0.273
0 30 1.57 0.231
B 35 1. 42 0.288
The high-friction primer B causes an increase in load carrying capacity at
an endurance of about 1.5 11< 106 of 15 to 20\ as compared to the better low
friction primers 0 and A respectively.
However the highest resistance against fatigue is reached when no primer at
all is used, as a comparison of series E11 and E13 or series E14 and E15
shows
Load kN E durance 11< 106 0
B HB233 30 1.20 0.199 u 1.92 0.455
B HB280 35 1.42 0.288 • .7 0.528
However, as is said before, the omission of an anti-corrosion coating does
not comply with good engineering practice.
7.6.3. Surface preparation
The influence of surface preparation, viz blasting with corundgrit versus
blasting with steelshot, can be estimated only indirectly from the test
series E11 versus E8 and E14 versus E9.
Blast Primer Rivet Load N Ratio
HB kN
E8 : S A 233 30 .284
E11: C B H 1.20 3.52
E9 : 5 A 280 35 .183
F.14: S B 1. 42 7.76
50
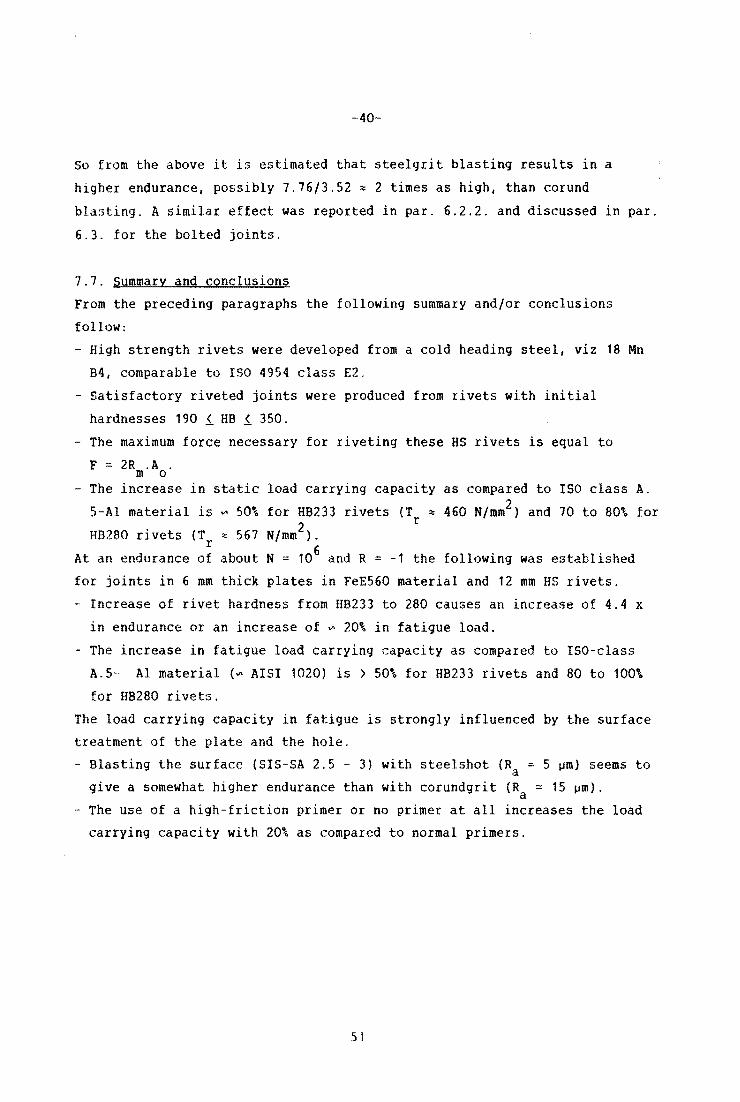
-40-
50 from the above it is estimated that steelgrit blasting results in a
higher endurance, possibly 7.76/3.52 ~ 2 times as high, than corund
blasting. A similar effect was reported in par. 6.2.2. and discussed in par.
6.3. for the bolted joints.
7.7. Summary and conclusions
From the preceding paragraphs the following summary and/or conclusions
follow:
- High strength rivets were developed from a cold heading steel, viz 18 Mn
B4, comparable to ISO 4954 class E2.
- Satisfactory riveted joints were produced from rivets with initial
hardnesses 190 i HB i 350.
The maximum force necessary for riveting these HS rivets is equal to
F 2R.A. m 0
The increase in static load carrying capacity as compared to ISO class A.
5-AI material is ~ 50% for H8233 rivets (T ~ 460 N/mm2) and 70 to 80% for 2 r
HB280 rivets (T • 567 N/mm ). r 6
At an endurance of about N = 10 and R :: -1 the following was established
for joints in 6 mm thick plates in FeE560 material and 12 mm HS rivets.
- Increase of rivet hardness from HB233 to 280 causes an increase of 4.4 x
in endurance or an increase of ~ 20\ in fatigue load.
- The increase in fatigue load carrying capacity as compared to ISO-class
A.5- Al material (~ AISI 1020) is > 50\ for HB233 rivets and 80 to 100%
for H8280 rivets.
The load carrying capacity in fatigue is strongly influenced by the surface
treatment of the plate and the hole.
Blasting the surface (SIS-SA 2.5 3) with steelshot (Ra : 5 ~m) seems to
give a somewhat higher endurance than with corundgrit (R = 15 ~m). a - The use of a high-friction primer or no primer at all increases the load
carrying capacity with 20\ as compared to normal primers.
51
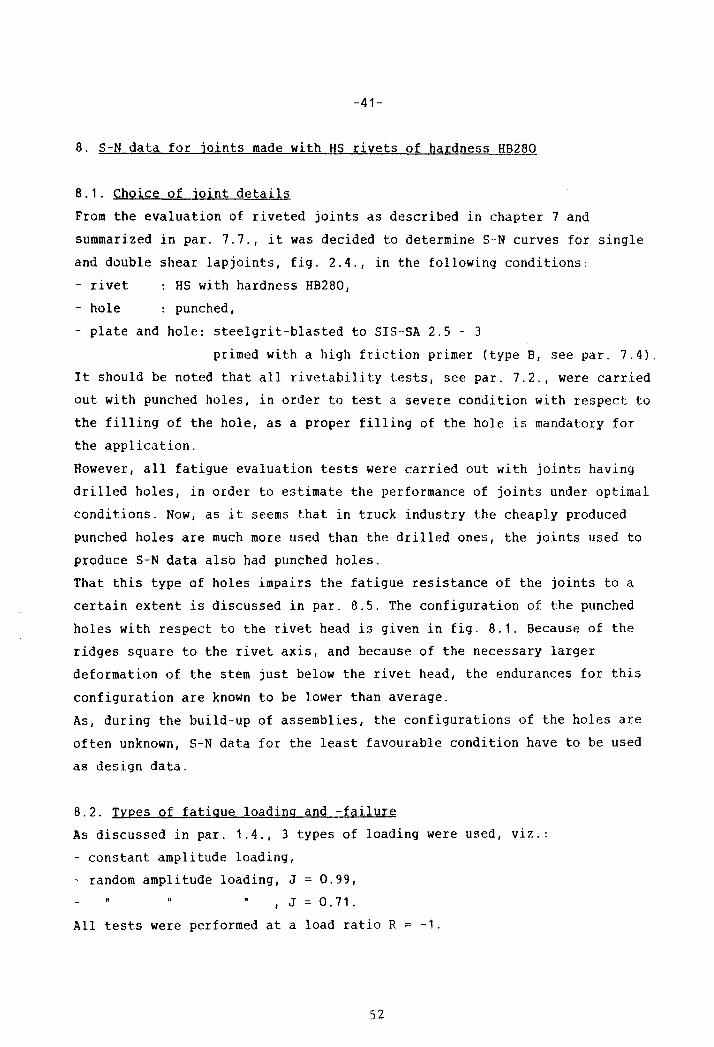
-41-
8. S-N data for joints made with HS rivets of hardness H8280
8.1. Choice of joint details
From the evaluation of riveted joints as described in chapter 7 and
summarized in par. 7.7., it was decided to determine S-N curves for single
and double shear lapjoints, fig. 2.4., in the following conditions:
- rivet HS with hardness HB280,
- hole punched,
- plate and hole: steelgrit-blasted to SIS-SA 2.5 - 3
primed with a high friction primer (type 8, see par. 7.41.
It should be noted that all rivetability tests, see par. 7.2., were carried
out with punched holes, in order to test a severe condition with respect to
the filling of the hole, as a proper filling of the hole is mandatory for
the application.
However, all fatigue evaluation tests were carried out with joints having
drilled holes, in order to estimate the performance of joints under optimal
conditions. Now, as it seems that in truck industry the cheaply produced
punched holes are much more used than the drilled ones, the joints used to
produce S-N data also had punched holes.
That this type of holes impairs the fatigue resistance of the joints to a
certain extent is discussed in par. 8.5. The configuration of the punched
holes with respect to the rivet head is given in fig. 8.1. Because of the
ridges square to the rivet axis, and because of the necessary larger
deformation of the stem just below the rivet head, the endurances for this
configuration are known to be lower than average.
As, during the build-up of assemblies, the configurations of the holes are
often unknown, S~N data for the least favourable condition have to be used
as design data.
8.2. Types of fatigue loading and -failure
As discussed in par. 1.4., 3 types of loading were used, viz.:
- constant amplitude loading,
random amplitude loading, J ~ 0.99,
J 0.71.
All tests were performed at a load ratio R ~ -1.
52

-42-
Random loading on assemblies, as are riveted joints, are important because
of the possibility of different modes of failure in fatigue.
For riveted joints it is known that there are, generally speaking, 3 types
of failure mode, viz.:
a. failure from too high bearing pressures,
b. shear of the rivet,
c." cracks in the plate emanating from the hole.
Fig. S.2. shows these regions in the S-N diagram. Furthermore from the
following paragraphs another failure mode appears, viz.:
d. failure from cracks growing from the stress concentration below the rivet
head.
The different failure modes are discussed further in par. 8.5.
8.3. Double shear lap joints
8.3.1. Constant amplitude loading
The results of constant amplitude fatigue tests at R -1 are given in table
S.1a. and plotted in fig. 8.3.
The Basquin equation, calculated by linear regression for N < 5 x 10⁶ reads
or
5,S03 log Fa + log N = 15,709
5,S03 log T + log N = 19,057. a
The fatigue limit is estimated to be somewhat higher than F = 30 kN or T ~ a a 113 N/mm2.
8.3.2. Random amplitude loading. J = 0.99 and 0.71
The results of random load fatigue tests are given in the tables S.l.b. and
8.1.c. and plotted in fig. 8.4. From table S.1. it follows that with peak
loads in exceedance of q.F = 5.26 x 15 ~ 80 kN, failure of the joints was rms due to axial play because of hole ovalisation. The tests were aborted when
the axial play was more than 0.3 mm. It is clear that this value is an
arbitrary one. other limits of play will result in a lower or a slightly
higher endurance. At F k = 80 kN the nominal bearing pressure Sp in the pea hole of the center plate is:
S = so * 103/6 x 13 = 1025 N/mm2 p
S3
-43--
which is ~ 1.60 * R 2 of the plate material. po, The nominal shear in the rivet is when F k = 80 kN, only
2· pea Trivet ~ 300 N/mm
at F rms = 15 kN and F k = 80 kN, "shear" failure did occur. pea noted that the It should be runouts at F = 12 dnd 13.5 kN (F = 63 and rms max
71 kN) are still far above the fatigue limit of about 30 kN, see table
8.1 .a.
In view of the rather small number of specimens and the apparent lining-up
of the endurances, see fig. 8.4., one Basquin type equation was used to
represent all result~, viz:
8.01 log Frms + log N ~ 16.291
8.01 log T + log N = 20.904 rms This equation could be used as the base of a design curve for endurances
106 < N < 107
8.4. Single shear lap ioints
8.4.1. Constant amplitude loading
The results of constant amplitude fatigue tests at R = -1 are given in table
8.2.a. and plotted in fig. 8.5. The Basquin equation, calculated by linear
regression for endurances N < 5.106
or
7.43 log F + log N a 16,982
7.43 log Ta + log N ~ 23,498
The fatigue limit cannot be estimated, as the knee of the S-N curve probably
will be beyond N ~ 5 x 10⁶ .
From table 8.2.a. it appears that most failures orignated from underneath
the head of the rivet. Only at the very high endurances, N > 5 x 10⁶, shear
failure occurs.
Furthermore, at high loadamplitudes and the high testing frequency (150 Hz)
used, excessive heating-up - that is a rivet temperature in excess of 100 DC
- took place.
54
-44-
It is thought that, because of the anticipated low clamping force between
the plates, this energy dissipation into heat is mainly due to movements
between the rivet and the holes.
8.4.2. Random amplitude loading. J = 0.99 and 0.71
The results of random amplitude fatigue tests are given in the tables 8.2.b.
and c. and plotted in fig. 8.6.
From fig. 8.6. it folows again (see par. 8.3.2.) that there is no real
difference in endurance between the 2 spectra used. The failure mode was
again under the rivet head except at the highest load used, Frms = 17 kN.
When F = 17 kN and q = 5.26, the maximum load in the spectrum is 89 kN rms and in excess of the static strength, see table 7.5. of 78 kN. So the life
of these 2 specimens is apparently determined by a peak exceeding the
stabilized shear strength of the joint.
The Basquin equation for rivet-head failure determined by linear regression
reads:
9.71 log F + log N = 16,633 rms 9.71 log T rms + log N = 25,130
At F = 8.5 kN, and Fmax = 44.7 kN, no failure was observed for endurances rms 6
up to 55 x 10 . However, as the fatigue limit for constant amplitude loading
is below F = 30 kN, see table 8.2.a., these "runouts" should fail under a continued testing.
8.5. Failure modes
For pin-hole connections, as are riveted joints, it is known that there are,
in general, 3 types of failure, viz.
a. failure from hole elongation due to high bearing pressures.
This normally occurs at high loads and consequently low endurances.
b. failure in the shear plane ("shear failure").
Two types of failure can occur, viz.
1. failure due to repeated plastic shear deformation of the rivet (so at
high loads),
2. failure from fretting fatigue inside the holes due to bending and
shear of the rivet, see fig. 8.7. This mode of failure implicates that
the rivet-stem is clamped into the hole by a thight fit.
This latter mode was the normal type of faiure experienced during the
evaluation program, for which all holes were drilled.
55
-45-
c. failure from cracks in the plate emanating from a hole.
This happens when the stresses in the plate are high in comparison to the
stresses in the rivet. Normally it occurs in multi-rivet joints and
then depends on the pitch. Only one plate failure (series E14) was
observed here.
d. failure of the rivet head. When the fit between the rivet and the hole is
not tight enough, the rivet is not really clamped into the hole. The
bending moments on the rivet stem are then partly balanced by axial
forces on the head, and fatigue failure at the severe stress
concentration below the fixed head of the ri~et will occur, see fig. 8.8.
It should be noted that ·popped off" heads are very well known by users of
riveted structures.
The cause of this type failure can be
plastic deformation of the hole, usually in an excentric joint,
- displacements of intermediate soft layers, as are most paints,
- lack of filling because of holes that are not properly aligned or are
tapered due to punching.
This type of failure occured throughout during the S-N data program for the
(excentric) single shear lap joints.
8.6. Punched holes versus drilled holes
In fig. 8.9., the results from Series E14, see fig. 7.3. or table 7.11. nre
plotted into fig. 8.5.
At F 35 kN or T = 264 N/mm2 the single shear lap joints with drilled a a holes, series E14, show an endurance that is 4.4 times the endurance of the
joints with punched holes. So the beneficial influence of the high-friction
primer is almost washed out (compare with Series E9, fig. 7.3.) by the
negative influence of punching in stead of drilling holes.
56
-46-
9. Discussion and comparison of the results
9.1. General
In this chapter a comparison is made between the different joints used in
this investigation. Before doing so 2 important remarks should be made:
a. Each joining method has its own merits, and the choice depends to the
greater part on the type of construction, the situation and the equipment
available at the site or assembly line ..
E.g. it is very unlikely that a 40 tons riveting press (-"hammer") would
be available at work in the field.
b. The intention of this investigation, see chapter 1, was to evaluate the
basic fatigue strength of different joints. Therefore only one connecting
element was used for the bolted or riveted joints, although the size of
the specimen (width 90 mm, rivet and bolt ~ 12 mm) allowed 2 parallel
connecting elements and/or 2 connecting elements in series. However, the
use of 2 or 4 connecting elements implicates that the load transfer per
element is unknown and no basic information about the intrinsic strength
per element would become available*) .
On the other hand the welded connections had welds across the full width
of the specimens. From the above it follows that a comparison between
welded connection and bolted or riveted ones is not really possible.
'*) Connections with more than one element will be investigated in a follow
up research program.
9.2. Influence of joint configuration
The difference between the 2 specimen configurations, see fig. 2.4., used
for each connection, is primarily the excentricity and from this a
difference in secundary bending stresses and in stress concentration.
One specimen, viz. the single lap joint, is an "as simple as possible"
joint, the other one, the butt weld C.q. the double shear lap joints, is an
"as good as possible" joint.
Most structural joints will be somewhere between these two.
In the following a comparison is made between the 2 specimens for each type
of joint.
57
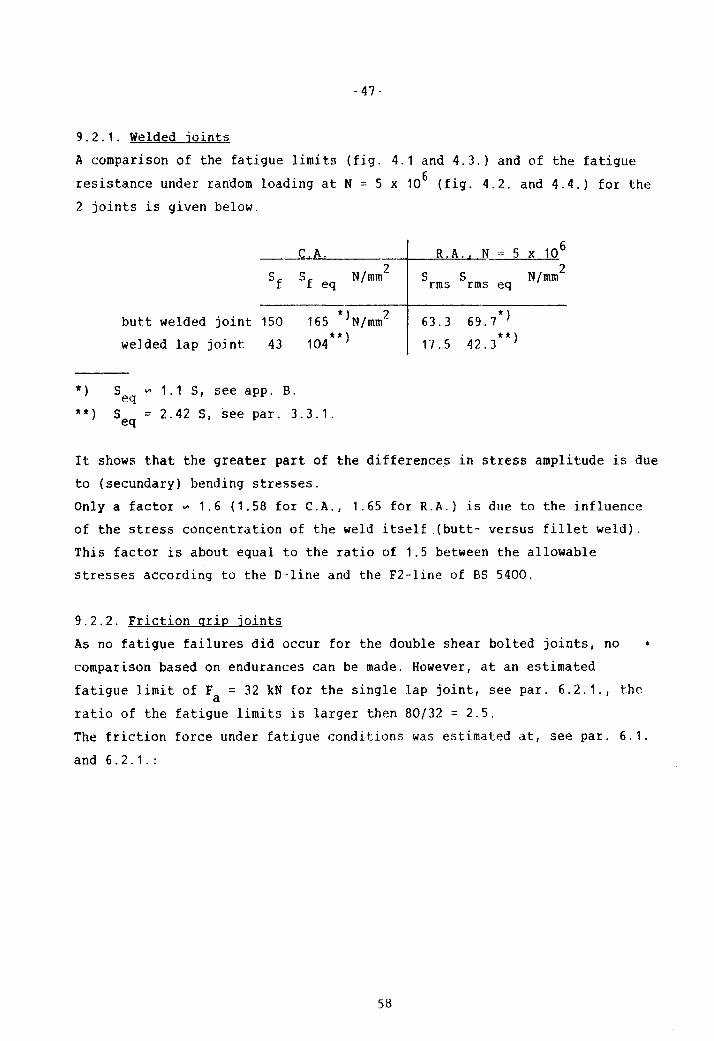
-47-
9.2.1. Welded joints
A comparison of the fatigue limits (fig. 4.1 and 4.3.) and of the fatigue
resistance under random loading at N = 5 x 10⁶ (fig. 4.2. and 4.4.) for the
2 joints is given below.
C.A. R.A. N = 5 x 10⁶
Sf S N/mm 2 S S N/mm 2
f eq rms rms eq
butt welded joint 150 165 t)N/mm 2 63.3 69.7*)
welded lap joint 43 104 ttl 17.5 42.3 ttl
t) Seq ~ 1.1 S, see app. B.
tt) Seq = 2.42 S, see par. 3.3.1.
It shows that the greater part of the differences in stress amplitude is due
to (secundary) bending stresses.
Only a factor ~ 1.6 (1.58 for C.A., 1.65 for R.A.) is due to the influence
of the stress concentration of the weld itself .(butt- versus fillet weld).
This factor is about equal to the ratio of 1.5 between the allowable
stresses according to the D-line and the F2-line of BS 5400.
9.2.2. Friction grip joints
As no fatigue failures did occur for the double shear bolted joints, no
comparison based on endurances can be made. However, at an estimated
fatigue limit of Fa = 32 kN for the single lap joint, see par. 6.2.1., the
ratio of the fatigue limits is larger then 80/32 = 2.5.
The friction force under fatigue conditions was estimated at, see par. 6.1.
and 6.2.1.:
58
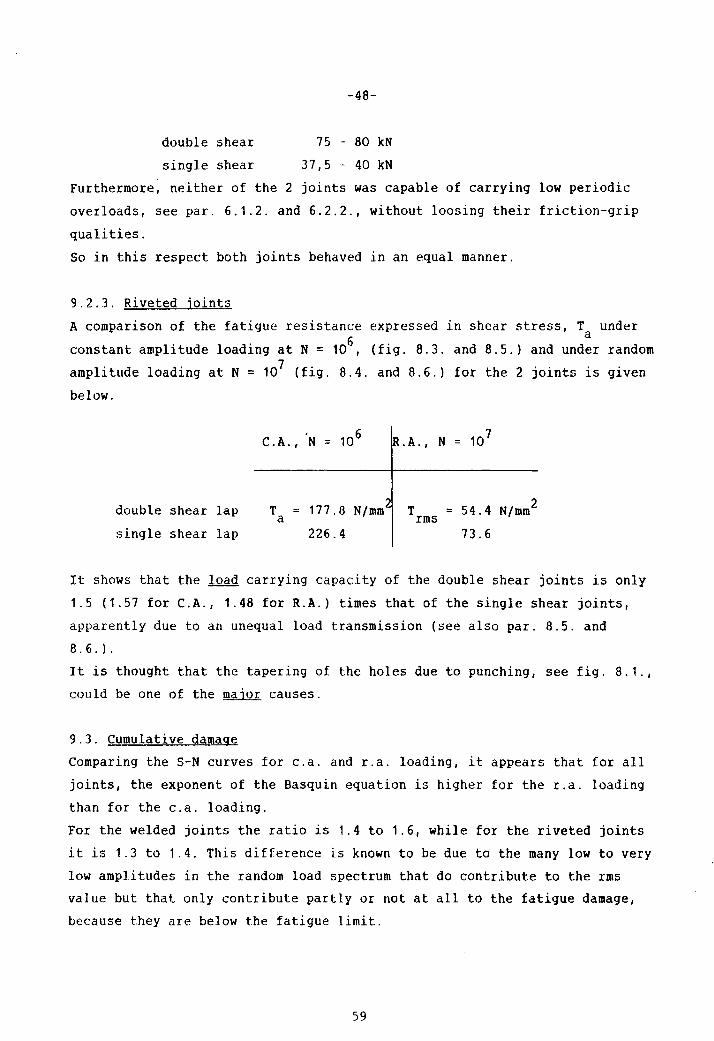
-48-
double shear 75 - 80 kN
single shear 37,S - 40 kN
Furthermore, neither of the 2 joints was capable of carrying low periodic
overloads, see par. 6.1.2. and 6.2.2., without loosing their friction-grip
qualities.
So in this respect both joints behaved in an equal manner.
9.2.3. Riveted joints
A comparison of the fatigue resistance expressed in shear stress, T under a constant amplitude loading at N = 106, (fig. 8.3. and 8.5.) and under random
amplitude loading at N = 107 (fig. 8.4. and 8.6.) for the 2 joints is given
below.
double shear lap
single shear lap
C.A., N = 106
T a 177.8 N/mm2
226.4
R.A., N
T = 54.4 N/mm2 rms 73.6
It shows that the load carrying capacity of the double shear joints is only
1.5 (1.57 for C.A., 1.48 for R.A.) times that of the single shear joints,
apparently due to an unequal load transmission (see also par. 8.5. and
8.6. ).
It is thought that the tapering of the holes due to punching, see fig. 8.1.,
could be one of the maior causes.
9.3. Cumulative damage
Comparing the 5-N curves for c.a. and r.a. loading, it appears that for all
joints, the exponent of the Basquin equation is higher for the r.a. loading
than for the c.a. loading.
For the welded joints the ratio is 1.4 to 1.6, while for the riveted joints
it is 1.3 to 1.4. This difference is known to be due to the many low to very
low amplitudes in the random load spectrum that do contribute to the rms
value but that only contribute partly or not at all to the fatigue damage,
because they are below the fatigue limit.
59
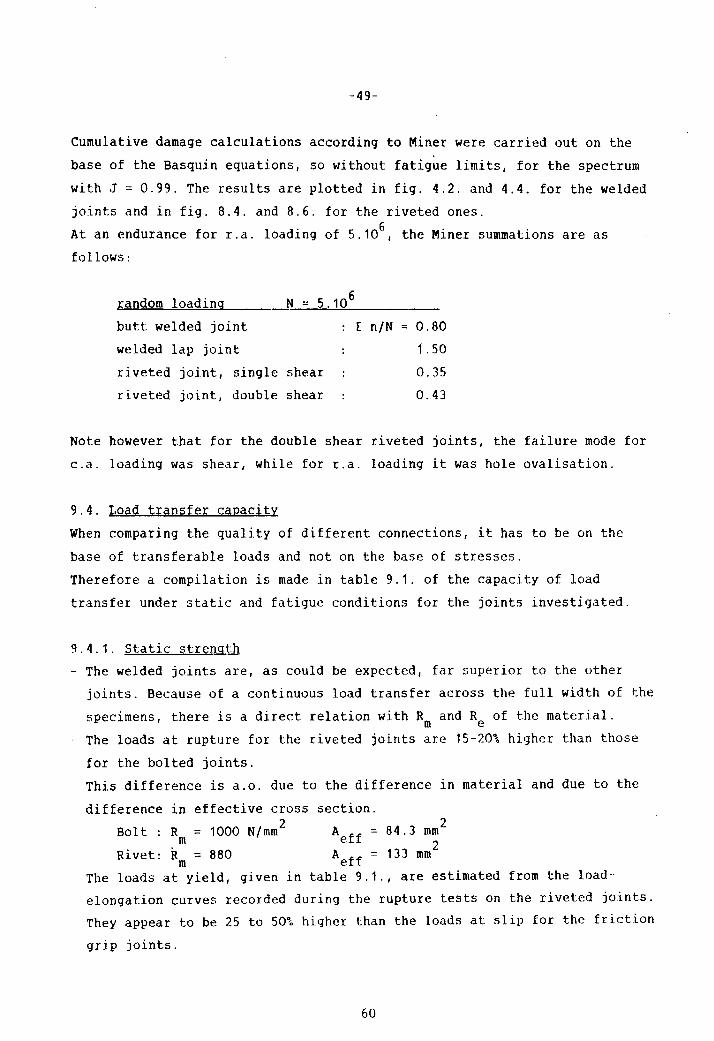
-49-
Cumulative damage calculations according to Miner were carried out on the
base of the Basquin equations, so without fatigue limits, for the spectrum
with J = 0.99. The results are plotted in fig. 4.2. and 4.4. for the welded
joints and in fig. 8.4. and 8.6. for the riveted ones.
At an endurance for r.a. loading of 5.106, the Miner summations are as
follows:
random loading
butt welded joint
welded lap joint
N = 5.106
riveted joint, single shear
riveted joint, double shear
[ nlN = 0.80
1.50
0.35
0.43
Note however that for the double shear riveted joints, the failure mode for
c.a. loading was shear, while for r.a. loading it was hole ovalisation.
9.4. Load transfer capacity
When comparing the quality of different connections, it has to be on the
base of transferable loads and not on the base of stresses.
Therefore a compilation is made in table 9.1. of the capacity of load
transfer under static and fatigue conditions for the joints investigated.
9.4.1. Static strength
- The welded joints are, as could be expected, far superior to the other
joints. Because of a continuous load transfer across the full width of the
specimens, there is a direct relation with Rm and Re of the material.
The loads at rupture for the riveted joints are 15-20\ higher than those
for the bolted joints.
This difference is a.o. due to the difference in material and due to the
difference in effective cross section.
Bolt: R = 1000 N/mm2 A = 84.3 mm 2 m eff
Rivet: km = 880 Aeff = 133 mm2
The loads at yield, given in table 9.1., are estimated from the load
elongation curves recorded during the rupture tests on the riveted joints.
They appear to be 25 to 50\ higher than the loads at slip for the friction
grip joints.
60
-50-
9.4.2. Fatigue loading. low excentricity joints
The maximum load on the friction grip joints, see table 9.1.A., is limited
by the maximum dynamic frictional forces and not by the number of cycles.
Comparing the joints on this base, that is the fatigue limit, it appears
from table 9.1.A. that the butt welded joint and the double shear bolted
joints have about the same quality (81 versus 75 kN).
However under random loading, the limitations due to the maximum frictional
force are a serious drawback, as the high peakloads determine the applicable
F (see par. 6.1.2.). rms Table 9.1.A. shows that at N = 107 and the load spectra as used here (q =
5.26) the Frms of the bolted and the riveted joint are about equal, but only
about 42% of the F for the butt weld. rms It should be remembered however that the true fatigue limit, N ~ ~ in table
9.1., of the welded and of the riveted joints is the C.A. fatigue limit
divided by the crest factor.
Generalising it can be said that:
- friction grip joints are, in comparison with riveted joints, only of
advantage when the crest factor of the service loads is low, or when
number of cylces is very high ( > 107) ,
the
- butt welded joints are superior to both the bolted and the riveted joints
used here. See however the remarks made in par. 9.1.
9.4.3. Fatigue loading, high excentricity joints
For the friction grip joints, the same limitations of F as mentioned in max par. 9.4.2. is applicable.
Comparing the joints on the base of the fatigue limit it appears from table
9.1.B. that the fatigue strength of the welded lap joint is only ~ 75% of
the bolted one (32 versus 23 kN). Comparison with the riveted joints is
possible at N = 106. At this endurance the riveted joint has about 80\ of
the estimated load carrying capacity of the bolted one.
Under random loading and N = 107 it appears that the load carrying capacity
of the welded and the rived joint are about equal (9.4 versus 9.8 kN) and
about 1.5 x the capacity of the bolted joint. Again it is remarked that the
true fatigue limit, N ~ ~, is ihe C.A. fatigue limit divided by the crest
factor.
61
-51-
Generalising it can be said that for single shear lap joints:
- friction grip bolts are, in comparison with riveted and with fillet welded
joints only of advantage when the crest factor of the service loads are
low, or when the number of cycles is very high,
- the high cycle load carrying capacity of riveted and filled welded lap
joints are comparable.
As spot welding is another often applied joining technique in truck
industry, and fatigue results from the same type of single shear lap joint
are available from literature [13, 14, 15], these are given in Table 9.1.C.
in comparison with those for the riveted joints. It should be noted that the
material used for spot welding was FeE 420, and that the quoted results are
not necessarily valid for a microalloyed steel FeE 560 TM as used here.
However, the differences are large enough to conclude that heavy-duty spot
welds can, except with regard to their rupture strength, in no way meet the
fatigue load carrying capacity of riveted ones.
62
-52-
10. Conclusions
In order to improve the application of HSLA steels an investigation was done
into the fatigue strength of welded, bolted and riveted joints in a micro
alloyed steel, grade FeE 560 TM, with plate thickness 6 mm.
Joining methods were evaluated and a high strength rivet was developped.
Fatigue tests were carried out under constant amplitude and under 2 types of
Random Amplitude loading, J = 0.99 and 0.71 resp., on joints with low
excentricity (butt welded c.q. double shear lap) and high excentricity
(single lap).
From this investigation the following conclusions are drawn:
Welded joints
In view of a decreased hardness of the HAZ of T.M. treated steelplate, tests
were carried out with 4 consumables of hardnesses ranging from HV5 = 220 to 290.
- For some consumables excessive spattering was encountered.
- The static strength of the joints was satisfactory in all cases.
- The 2 1/2 % Ni consumable with a hardness HV5 = 290 showed the best fatigue results.
- S-N data for welds with this consumable were produced for C.A. loading and for R.A. loading.
The S-N curves for C.A. loading compared favourably with the relevant ones of BS 5400.
Friction grip bolted joints
- Torqueing the flanged head bolts and nuts, class 10.9, size M12, under
yield control resulted in reproducable frictional forces.
- Surface cleaning by shot blast instead of corund blast produces a smoother
surface and an increase in endurance of about 50% .
. - The durable friction under fatigue loading was about 80% of the static friction and 37.5 to 40 kN per shear plane.
- However repeated slip from incidental high loads during random amplitude fatigue loading reduces the friction appreciable.
63
-53-
- Therefore the design loads of friction grip joints have to be based on the
few high peaks of the load spectrum.
Riveted joints
- Rivets with hardnesses up to HB 350 suitable for riveting joints in H.S.
steels were developped from the micro-alloyed steel 18 Mn S3 in the Q and
T condition.
- Matching rivet hardnesses for FeE 560 TM steel were HS 230 and HB 280.
- Riveted joints with rivets HS 280 showed, at the same endurance, to be ~
80% stronger than the same joints with A.5-Al rivets.
Preparation of the joint is important:
- Surface cleaning by shotblast in stead of corund blast produces a smoother
surface and an increase in endurance of roughly 50\.
- The use of a high-friction primer increases the fatigue resistance with
about 20% as compared to usual anti-corrosion primers.
- Punched holes reduce the fatigue resistance with about 20\ as compared to
drilled ones.
- S-N data for C.A. and R.A. loading were produced for joints with punched
holes, a shot blast surface, a high-friction primer and HS 280 rivets.
Comparison of the joints
- In general, the welded joints, welded across the full specimen width,
showed a better fatigue strength than the bolted and riveted joints with a
single connecting element.
_ The static properties of joints, riveted with H.S. rivets HS 280,
supersede those of friction grip joints with 10.9 bolts torqued in yield
control. _ The overload capacity of friction-grip bolted joints under conditons of
random loading is low. _ Riveted joints with H.T. rivets showed a good fatigue resistance and can,
under service-type loading, be of advantage as compared to bolted joints.
64
References
I. T. R. Gurney
2. R.E. Peterson
3. P.J. Haagensen
Fatigue of welded structures.
2nd ed. Cambridge University Press, 1979.
Stress concentration factors.
John Wiley and Sons, 1974.
Improvement of the Fatigue strength of
welded joints.
CEC Conference on Steel in Offshore
Structures, Paris 1981.
4. F. Watkinson, P.H. Bodger and J.D. Harrison
5. BS 5400
6. Richtlinie VDI 2230
The fatigue strength of welded joints in
high strength steels and methods for its
improvement.
W.I. Conf. on fatigue of Welded Structures
Brighton, 1970.
Systematische Berechnung hochbeanspruchter
Schraubenverbindungen.
VDI-Verlag, 1977.
7. ed: VDI-Gesellschaft Konstruction und Entwicklung:
8. DASt-Richtlinie 010
9. Deutsche Bundesbahn
Gestaltung und Berechnung hochbeanspruchter
Schraubenverbindungen.
Handbuch VDI-Lehrgang BW 32-04-06, 1978.
Anwendung hochfester Schrauben im Stahlbau.
Stahlbau Verlag GmbH, Koln 1974.
Anstrichstoffe auf Alkali-Silikat-Grundlage
mit Zinkstaub fur Reibflachen gleitfester
Verb indungen.
DBB-TL 918.300 Blatt 85, Mai 1976.
65
10. ed: Conv. Eur. de la Construction Metallique:
II. G.H. Junker
12. P.W. Bridgman
European recommendations for the use of
high-strength friction grip bolts in
structural steelwork.
CECM-X-70-8E, 3rd ed., 1971.
Die Montagemethode - ein Konstruktions
kriterium bei hochbeanspruchten Schraub
verbindungen.
VDI-Zeitschrift ~ (1979) 113-123.
Studies in large plastic flow and fracture.
McGraw-Hill, 1952.
13. J.L. Overbeeke and J. Draisma:
14. J.L. Overbeeke
15. J.L. Overbeeke
Fatigue charateristics of heavt-duty spot
welded lap joints.
Metal Construction and British Welding
Journal ~ (1974) p. 213-219.
Fatigue of spot-welded lap joints.
Metal Construction~, 5 (1974) p. 212-215.
The fatigue behaviour of heavy-duty
spot-welded lap joints under random
loading conditions.
Final Report to CECA convention 6210-45/6/602,
1976,
or
Welding Research International, 2, 1977,
p. 254-276.
66
-Al-
Random amplitude loading
A.1. Load sequences
The random load sequences that were applied in thj s investigation are
the sequences that are recommended as standard random load sequences by the
LBF and the IABG [A1].
The generation of these load sequences, that is the sequence of successive
peaks and troughs, by digital computer is described in detail in [A2].The
different sequences are charactedized by their irregularity factor J.
number of peaks J = number of positive going zero crossings
Of the irregularity factors mentioned in [A1], viz. J = 0.994; 0.706 and
0.314, the first two were applied.
The sequence with J = 0.994 can be regarded as a Gaussian process within a
narrow frequency band. The peak and range distribution is of the Rayleigh
type. It stands for the random excitation of structures with low damping
capacity (e.g. welded structures) that vibrate around their resonance
frequency.
An example of the load sequences is given in fig. A.1.
The sequence with J = 0.706 can be regarded as a Gaussian process within a
wider frequency band. It stands for the random excitation of a structure
with medium damping capacity (e.g. half critical viscous damping) as are
frames of transport vehicles with shock absorbers.
Particulars of the load sequences are:
1. The frequency distribution of level crossings is equal to that of a
stationary Gauss process.
2. The sequence length (block length) contains 106 positive going zero
crossings (cycles).
3. The sequence is exactly repeatable. All peaks and troughs together with
the sequence of these peaks and troughs are given.
4. There are 32 load levels for the full range.
67

-A2-
5. The occurence of the highest (lowest) load level is 1 times per block and
the rms value (time average) of a sinusoidal signal is 1 : 5.25652 of the
max. load level (crest factor, q ~ 5.25652).
A.2. Random load fatigue tests
For a number of random load fatigue tests carried o~t in this investigation, 6 the endurance was below the block length, N ,of 10 cycles.
o In view of this, the short term properties of the random load sequences were
investigated by analyzing sub-blocks of 100,000 cycles. It appeared that
these short term properties were about equal to those of the full block.
E.g. the irregularity factor for sub-blocks of 100,000 cycles varied between
0.704 and 0.708 while for the block of 106 cycles, J = 0.706.
This means that, to the opinion of the writer, the measured endurances below
106 need no correction because the possible influences of the short-term
variations of the statistical properties of the load spectrum are small to
very small as compared to the scatter due to material- and production
variables.
A.3. Cumulative damage
Cumulative damage calcuations according to Miner were carried out for the
load sequence with J = 0.994. This sequence approaches a Rayleigh
distribution of ranges, therefore a damage calculation is independent of the
countinq method.
When the S-·N curve is of the Basquin type, and Sf = 0
then the expected or average endurance N according to Miners Rule is:
Where E(Sm, is the mth statistical moment of the probability density of the a
amplitudes
68
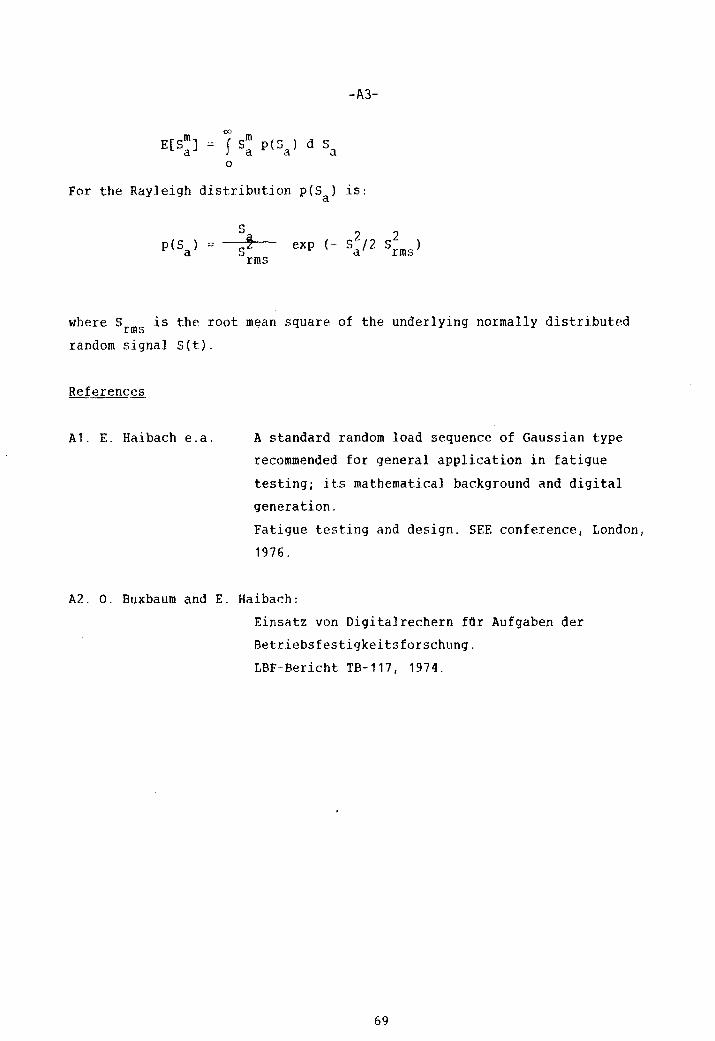
-A3-
For the Rayleigh distribution p(S ) is: a
S
S~ rms
where S is the root mean square of the underlying normally distributed rms random signal S(t).
A1. E. Haibach e.a. A standard random load sequence of Gaussian type
recommended for general application in fatigue
testing; its mathematical background and digital
generation.
Fatigue testing and design. SEE conference, London,
1976.
A2. O. Buxbaum and E. Haibach:
Einsatz von Digitalrechern ffir Aufgaben der
Betriebsfestigkeitsfolschung.
LBF-Bericht TB-117, 1974.
69
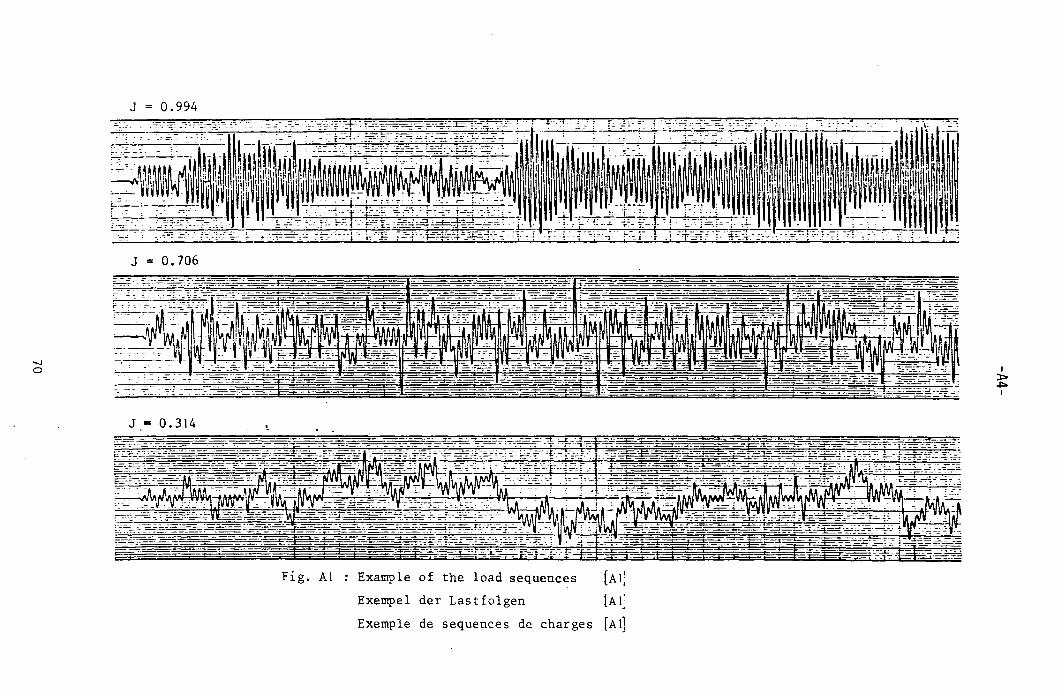
....... o
J 0.994
J = 0.706
J • 0.314
Fig. AI : Example of the load sequences (AI]
Exempel der Lastfolgen {AI]
Exemple de sequences de charges [AI]
I ~ ~ I
-81-
Appendix B Secundary bending stresses.
Strain measurements
Secundary bending stresses caused by the excentricity of the joint or by the
misalignment of the weld were measured by friction gages, TML type CBF-6 and
springloaded holder TML type FGH-1, see fig. B.l.
These gages are strain gages embedded in a rubber pad. This pad is provided
with a high friction coating of fine grit. When they are pressed by hand
against a surface, the friction between pad and surface makes the strain
gage follow the surface strain. Friction gages are very suitable for
measuring dynamic strain amplitude:,.
Accuracy
The accuracy under axial fatigue conditions was checked against glued-on
strain gages and proved to be +0/-5\.
The accuracy of strain measurements at the surface of the joints during the
fatigue tests was 0/-10\, as calculated from measurements at both sides of
the plate together with the nominal stress S . The test frequency was ~ 30 a cps and the transverse stroke of the surface up to 0.5 mm.
Maximum fiber stress
For a large number of specimens the strain was measured during fatigllc
testing. The place of measurement was in the centerline of the specimen at
~ 20 mm from the weld toe.
As this distance is about 3x the plate thickness, the stress concentration
at the toe cannot influence the measurements. The measured strain is equal
to
€ E a o a S + Sb d' a - en Ing
Youngs'modullls is taken as E
const.. * S a
2 10 , 000 N / mm 2 .
Some results for butt welded joints are given in fig. B.2.
From the measurements it appeared that for:
- the butt welded joints the increase in maximum fiber stress amplitude was
on the average 10\.
0a ~ 1.10 Sa'
71
-82-
- the welded lap joints the maximum fiber stress amplitude, averaged from 10
specimens, was:
o = (2.42 + 0.16) S . n - a
72
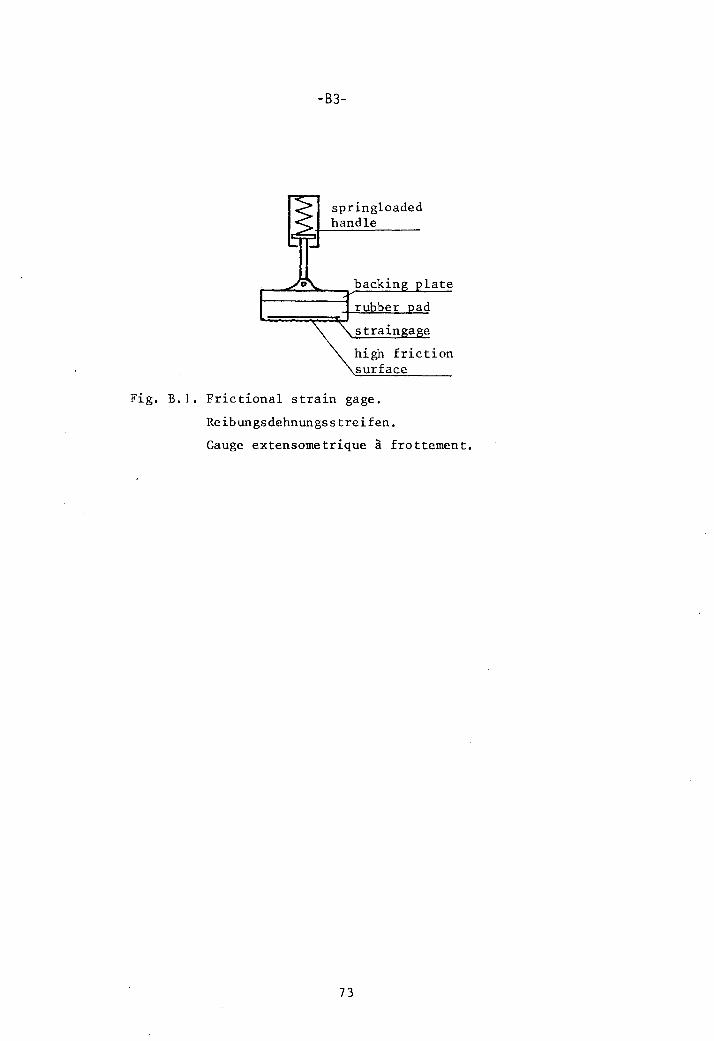
-B3-
springloaded handle
late
high friction surface
Fig. B.l. Frictional strain gage.
Reibungsdehnungsstreifen.
Gauge extensometrique a frottement.
73
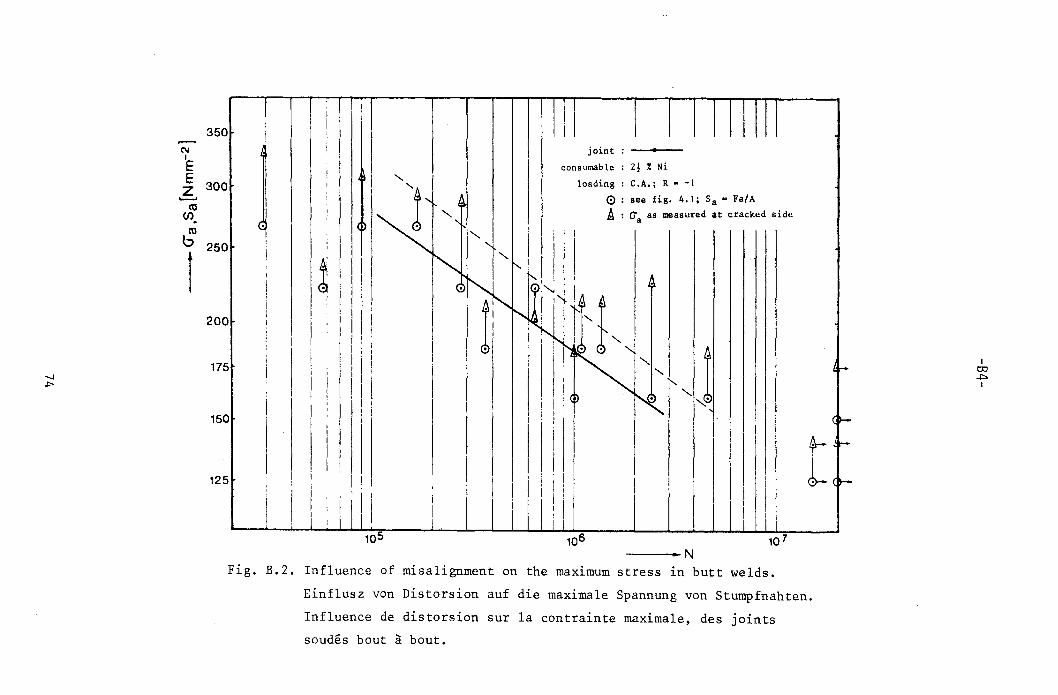
C'II I
E E Z '--'
ro 00.
ro
350
300
b 250
1 200
175
150
125
1 r : I I I I I
joint : •
I consumab le : 2! % Ni
I • ", loading: C.A.; R ~ -\
" (~I~ '-~ '- Iii I r ~:'.:i~':~:::::O:::~d ,id.
«II '" l'-,,~ III ~ 'I' ! I ~ ""I f '" : I ,I ! 1 II II 1 A~~: ~~ '~111"1
I·)I!: I i~i ':
\1 i I • i I IN' . I" 1 'j I I Ii" I, l i i I~ I 1> I "",.
I Ii, I I . i I
i II: iii i ! I II! I
Ir.
(~
t. t-~ ---.. N
Fig. B.2. Influence of misalignment on the maximum stress in butt welds.
Einflusz von Distorsion auf die maximale Spannung von Stumpfnahten.
Influence de dis torsion sur la contrainte maximale, des joints
soudes bout a bout.
I OJ -"'"
I
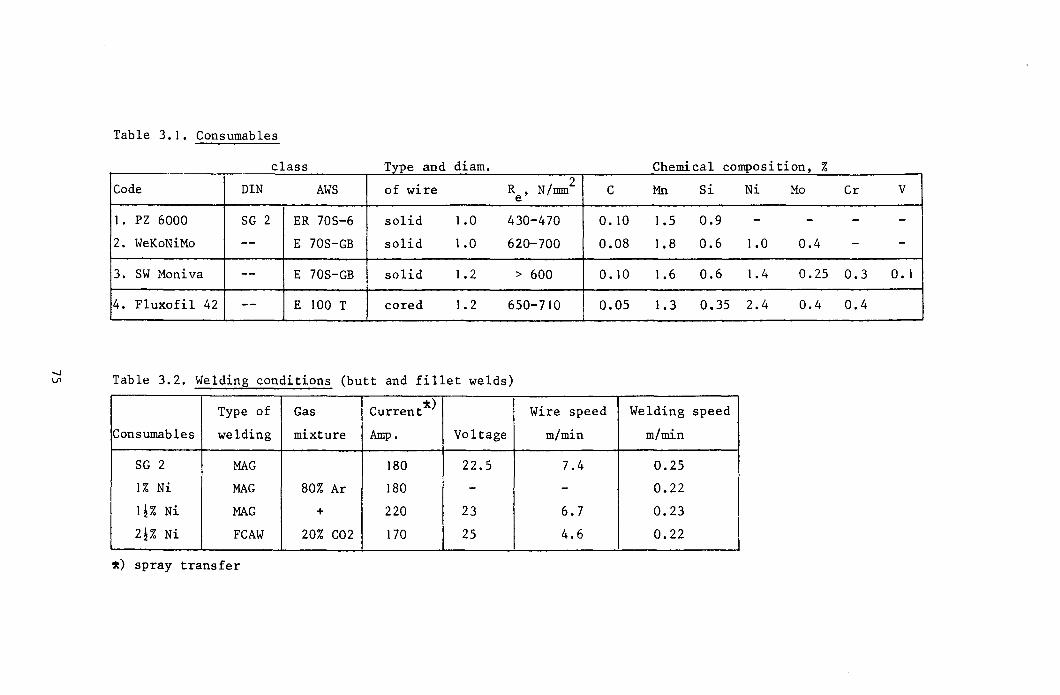
Table 3.1. Consumables
class Type and diam. Chemical composition, %
Code DIN AWS of wire R , N/mm 2 C Mn Si Ni Mo Cr V e
1. PZ 6000 SG 2 ER 70S-6 solid 1.0 430-470 0.10 1.5 0.9 - - - -
2. \.JeKoNiMo -- E 70S-GB solid 1.0 620-700 0.08 1.8 0.6 1.0 0.4 - -
3. SW Moniva -- E 70S-GB solid 1.2 > 600 0.10 1.6 0.6 1.4 0.25 0.3 0.1
4. Fluxofil 42 -- E 100 T cored 1.2 650-710 0.05 1.3 0.35 2.4 0.4 0.4 I
...... ~ Table 3.2. Welding conditions (butt and fillet welds)
Type of Gas Current*) Wire speed Welding speed
Consumables welding mixture Amp. Voltage m/min m/min
SG 2 MAG 180 22.5 7.4 0.25
1% Ni MAG 80% Ar 180 - - 0.22
q% Ni MAG + 220 23 6.7 0.23
2!% Ni FCAW 20% CO2 170 25 4.6 0.22
*) spray transfer
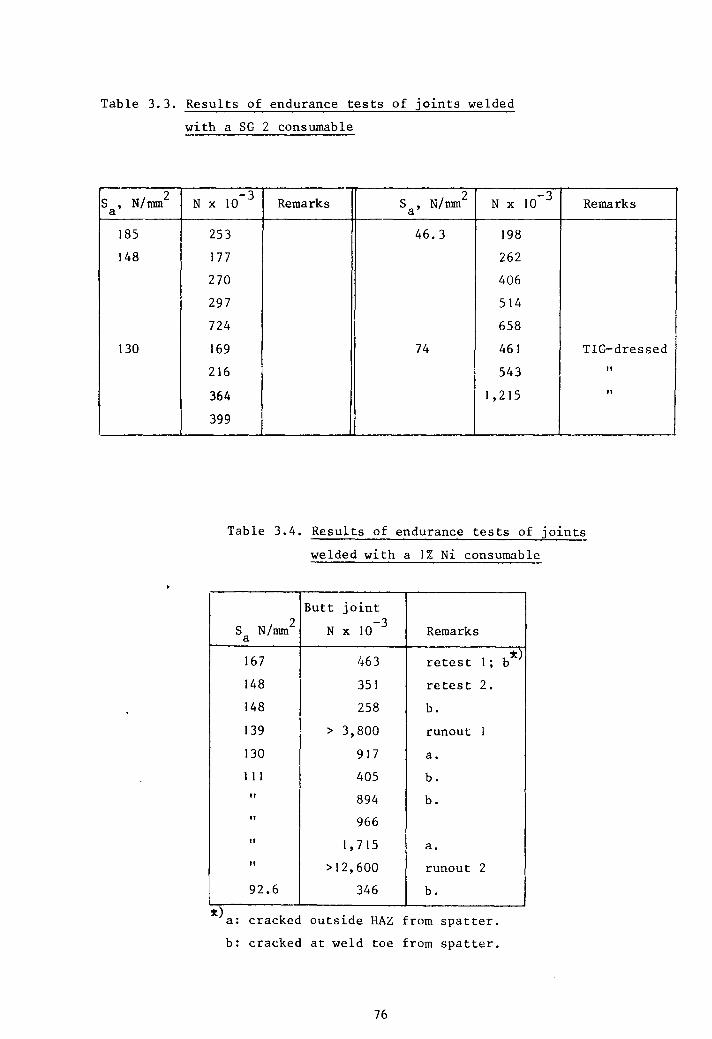
Table 3.3. Results of endurance tests of joints welded
with a SG 2 consumable
S , N/nnn 2 N a
185
148
130
x 10- 3 Remarks S , N/nnn 2 N x 10-3 Remarks a
253 46.3 198
177 262
270 406
297 514
724 658
169 74 461 TIG-dressed
216 543 " 364 1,215 " 399
Table 3.4. Results of endurance tests of joints
welded with a 1% Ni consumable
Butt joint
S N/mm 2 a N x 10-3
Remarks
167 1+63 retest 1 ; b~'
148 351 retest 2.
148 258 b.
139 > 3,800 runout 1
130 917 a.
111 405 b.
" 894 b.
" 966
" 1,715 a.
" >12,600 runout 2
92.6 346 b.
%) a: cracked outside HAZ from spatter.
b: cracked at weld toe from spatter.
76
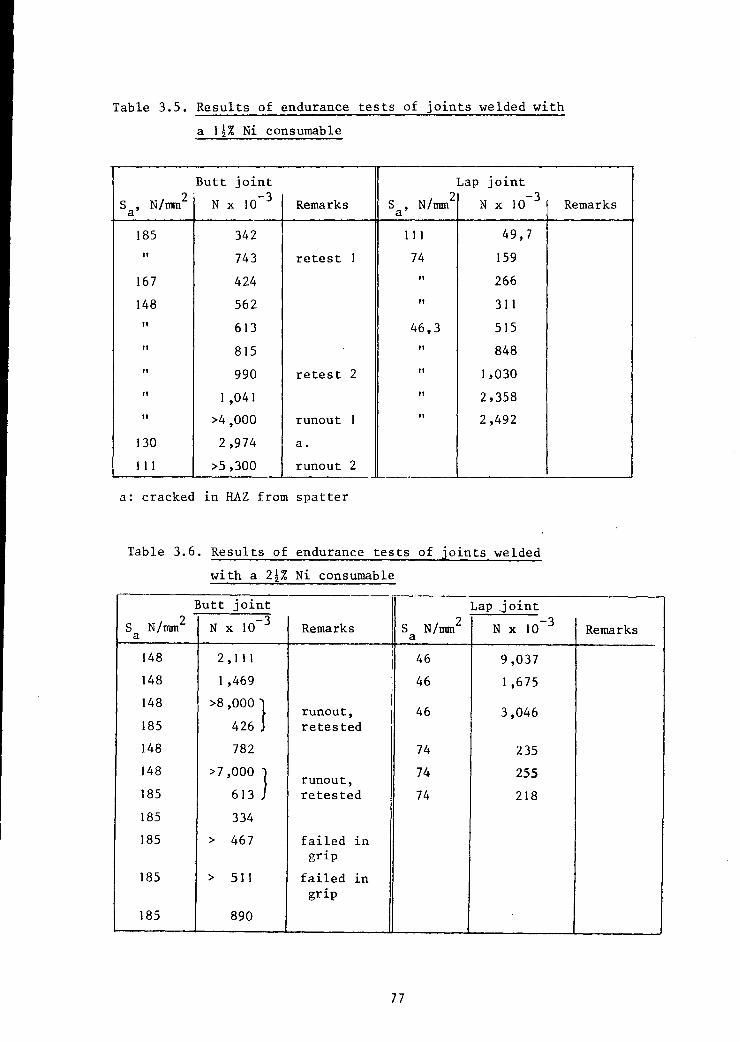
Table 3.5. Results of endurance tests of joints welded with
a I~% Ni consumable
Butt joint Lap joint
s , N/mm 2· N x 10-3 Remarks S , N/mm
2 N x 10-3
a a
185 342 III 49,7
" 743 retest I 74 159
167 424 " 266
148 562 " 311
" 613 46,3 515
" 815 " 848
" 990 retest 2 " 1,030
" I ,041 " 2,358
" >4,000 runout I " 2,492
130 2,974 a.
I I I >5,300 runout 2
a: cracked ~n HAZ from spatter
Table 3.6. Results of endurance tests of joints welded
with a 2!% Ni consumable
Butt joint Lap joint
s a N/mm 2 N x 10-3 Remarks S N/nun a 2 N x 10-3
148 2, I I I 46 9,037
148 I ,469 46 1,675
148 >8,000 } 46 runout, 3,046 185 426 retested
148 782 74 235
148 >7,000 } 74 255 runout, 185 613 retested 74 218
185 334
185 > 467 failed in grip
185 > 511 failed ~n grip
185 890
77
Remarks
Remarks
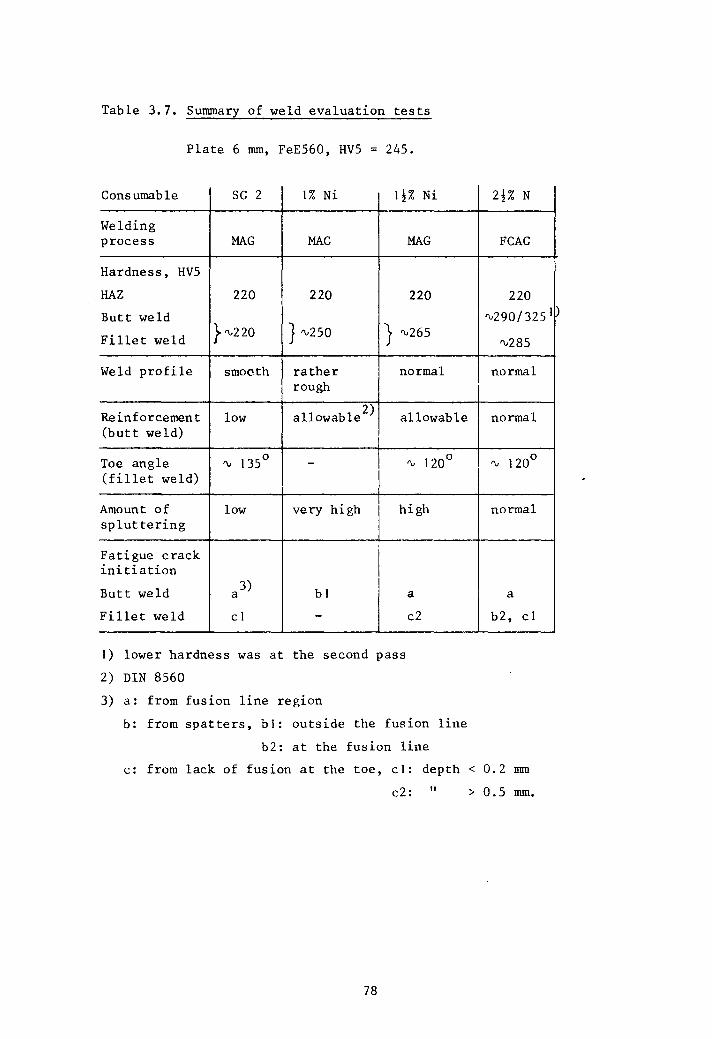
Table 3.7. Summary of weld evaluation tests
Plate 6 mm, FeE560, HV5 = 245.
Consumable SG 2 1% Ni \!% Ni
Welding process MAG MAG MAG
Hardness, HV5
HAZ 220 220 220
Butt weld
Fillet weld } '\,220 } '\,250 } '\,265
Weld profile smoo.th rather normal rough
Reinforcement low allowable 2) allowable (butt weld)
Toe angle '\, 1350 - '\, 1200
(fillet weld)
Amount of low very high high spluttering
I
Fatigue crack initiation
Butt weld a 3)
bl a
Fillet weld cl - c2
I) lower hardness was at the second pass
2) DIN 8560
3) a: from fusion line region
b: from spatters, bl: outside the fusion line
b2: at the fusion line
2~% N
FCAG
220
'\,290/325 ID
'\,285
normal
normal
'\, 1200
normal
a
b2, cl
c: from lack of fusion at the toe, cl: depth < 0.2 mm
c2: " > 0.5 mm.
78
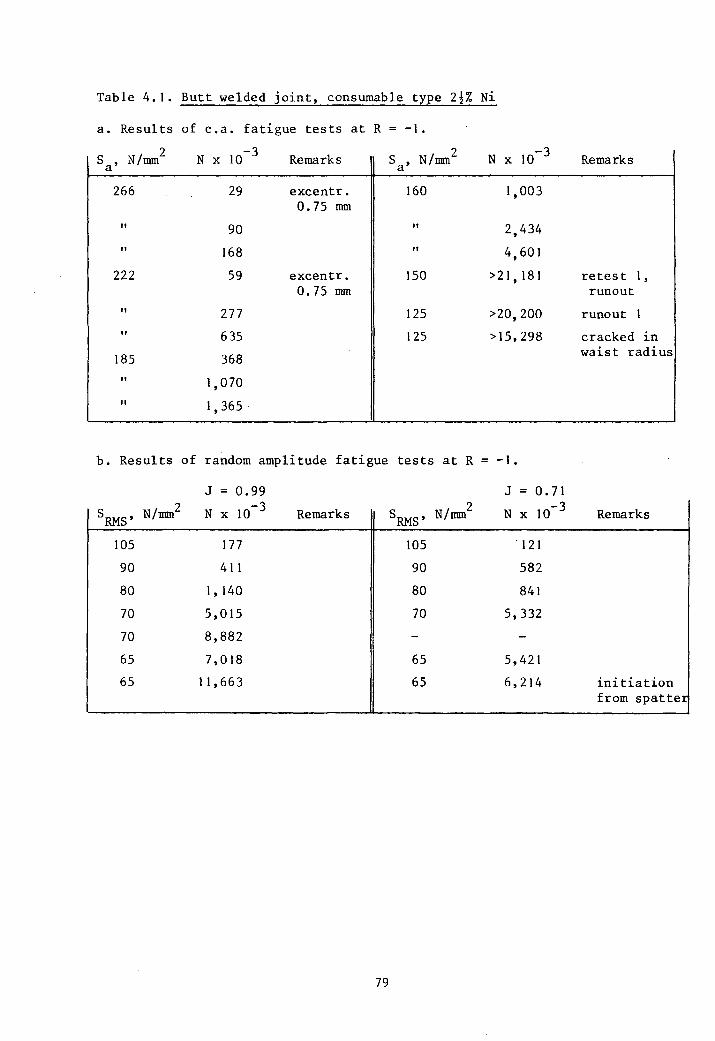
Table 4.1. Butt welded joint, consumable type 2~% Ni
a. Results of c.a. fatigue tests at R -},
S , N/rom 2 N x 10-3 Remarks S , N/rom 2 N x 10-3 a a
266 29 excentr. 160 1,003 0.75 rom
" 90 " 2,434
" 168 " 4,601
222 59 excentr. 150 >21, 181 0.75 rom
" 277 125 >20,200
" 635 125 >15,298
185 368
" 1,070
" 1,365 .
b. Results of random amplitude fatigue tests at R -1.
J 0.99 J 0.71
SRMS' N/nm/ N x 10-3 Remarks SRMS' N/nnn 2 N x 10-3
105 177 105 121
90 411 90 582
80 1, 140 80 841
70 5,015 70 5,332
70 8,882
65 7,018 65 5,421
65 11,663 65 6,214
79
Remarks
retest 1, runout
runout 1
cracked in waist radius
Remarks
initiation from spatter
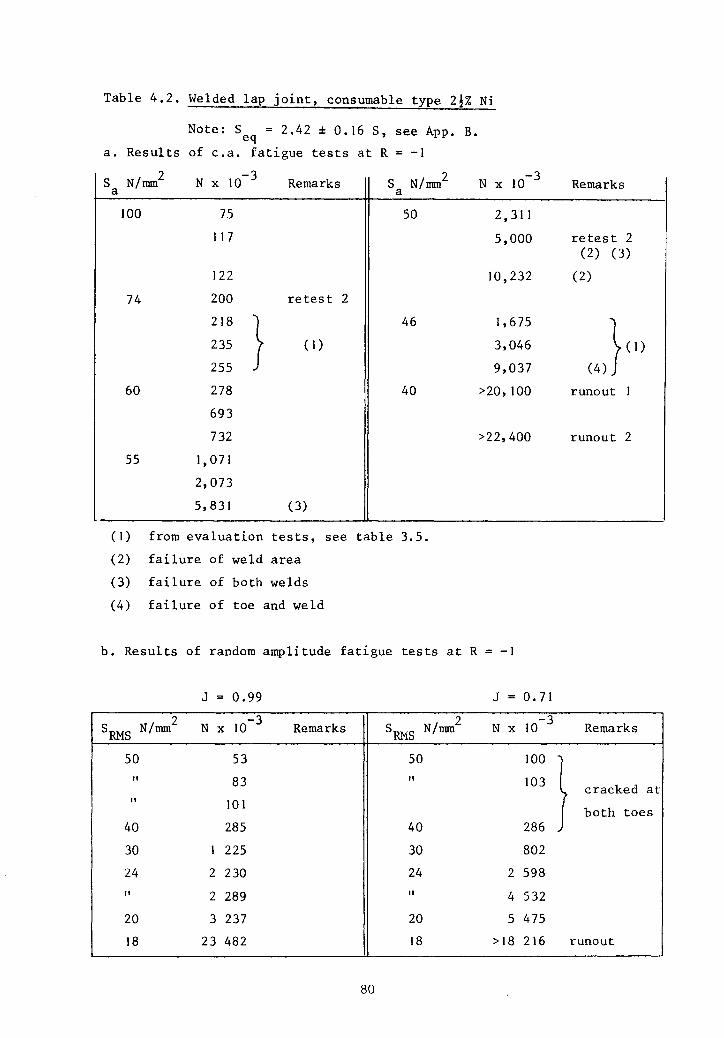
Table 4.2. Welded lap joint, consumable type 2!% Ni
Note: S = 2.42 ± O. 16 S, see App. B. eq a. Resul ts of c.a. fatigue tests at R -I
S N/mm 2 N x 10- 3 Remarks a S N/mm 2 a N x 10-3
Remarks
100 75 50 2,311
117 5,000 retest 2 (2) (3)
122 10,232 (2)
74 200 retest 2
218 } 46 1,675
235 ( I) 3,046
255 9,037 }
(I)
(4)
60 278 40 >20, 100 runout I
693
732 >22,400 runout 2
55 1,071
2,073
5,831 (3)
( I) from evaluation tests, see table 3.5.
(2) failure of weld area
(3) failure of both welds
(4) failure of toe and weld
b. Results of random amplitude fatigue tests at R -I
J 0.99 J 0.71
SRMS N/nnn 2 N x 10-3 Remarks SRMS N/nnn
2 N x 10-3 Remarks
50 53 50 100
I " 83 " 103 cracked at " 101 both toes
40 285 40 286
30 I 225 30 802
24 2 230 24 2 598
" 2 289 " 4 532
20 3 237 20 5 475
18 23 482 18 >18 216 runout
80
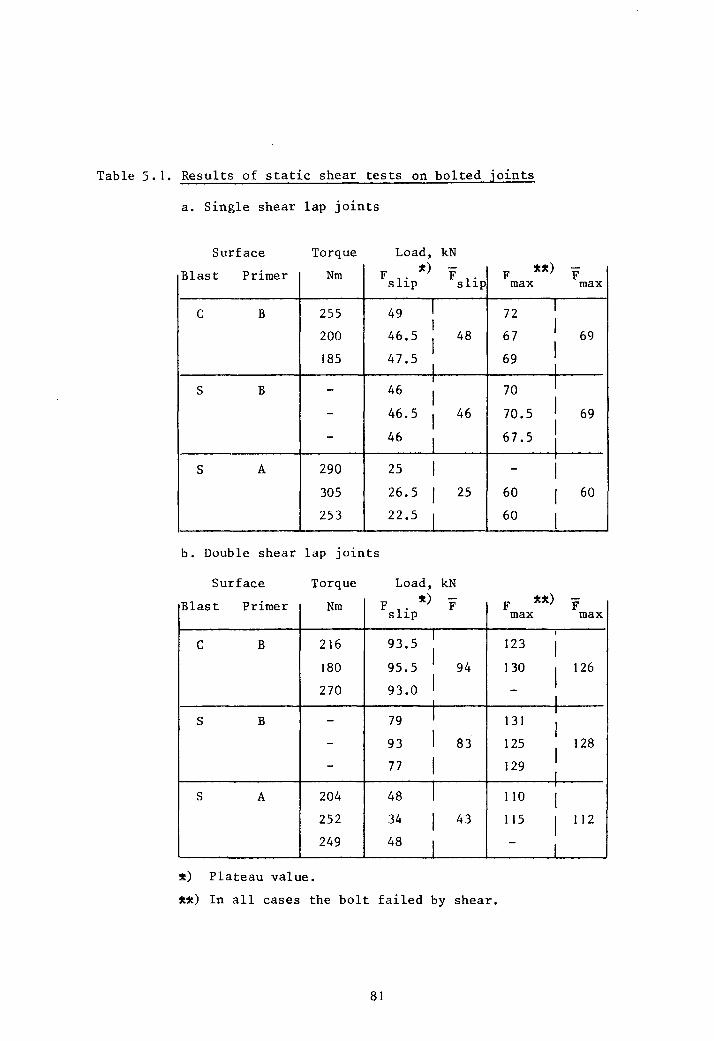
Table 5.1. Results of static shear tests on bolted joints
a. Single shear lap joints
Surface Torque
Blast Primer Nm
C B 255
200
185
S B ---
S A 290
305
253
b. Double shear lap joints
Surface Torque
Blast Primer Nm
C B 216
180
270
S B --
-
S A 204
252
249
x) Plateau value.
Load, kN x) -
F l' F l' s ~p s ~p
49 I I
46.5 I
48
47.5 I I
46 I 46.5 I 46
46 I 25 I 26.5 I 25
22.5 I
Load, kN x) -F . F sl1p
I 93.5
I 95.5 94
93.0 I
79 I
93 I 83
77 I 48 I 34 I 43
48 I
xx) In all cases the bolt failed by shear.
81
F xx) max
72
67
69
70
70.5
67.5
-60
60
F max
123
130
-
131
125
129
110
115
-
-F max
I
I 69 I I I I 69 I I I I 60
I
-F max
I
I
I 126
I I
I I
128
I
I I 112
I
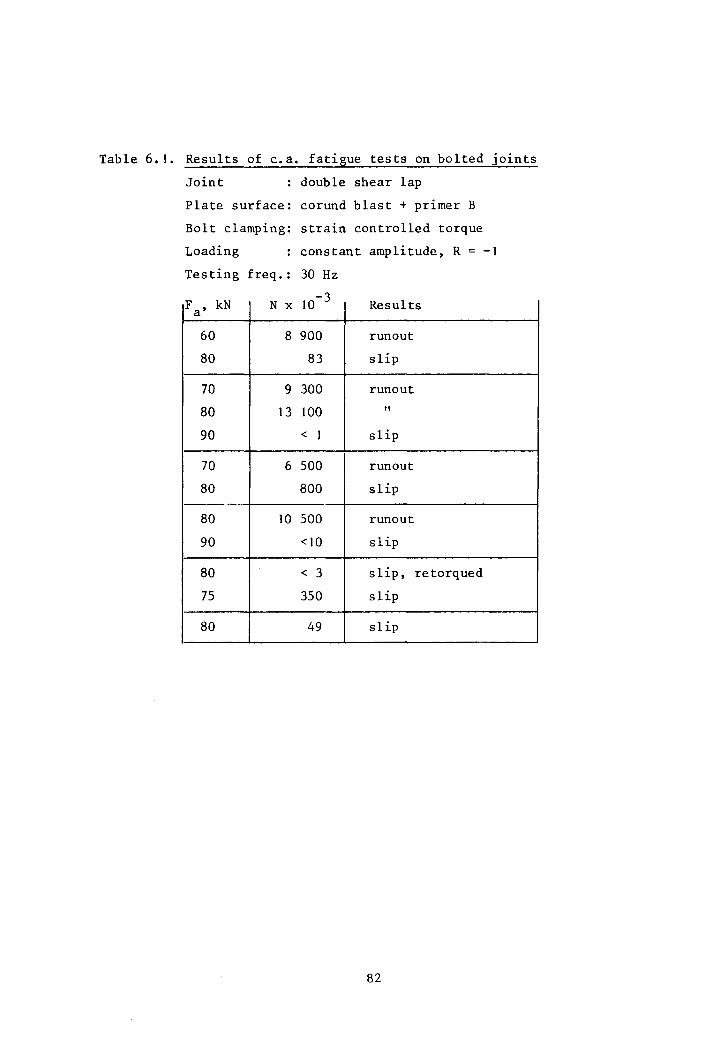
Table 6.1. Results of c.a. fatigue tests on bolted joints
Joint double shear lap
Plate surface: corund blast + primer B
Bolt clamping: strain controlled torque
Loading constant amplitude, R = -1
Testing freq.: 30 Hz
Fa' kN N x 10 -3 Results
60 8 900 run out
80 83 slip
70 9 300 runout
80 13 100 " 90 < 1 slip
70 6 500 runout
80 800 slip
80 )0 500 runout
90 <10 slip
80 < 3 slip, retorqued
75 350 slip
80 49 slip
82
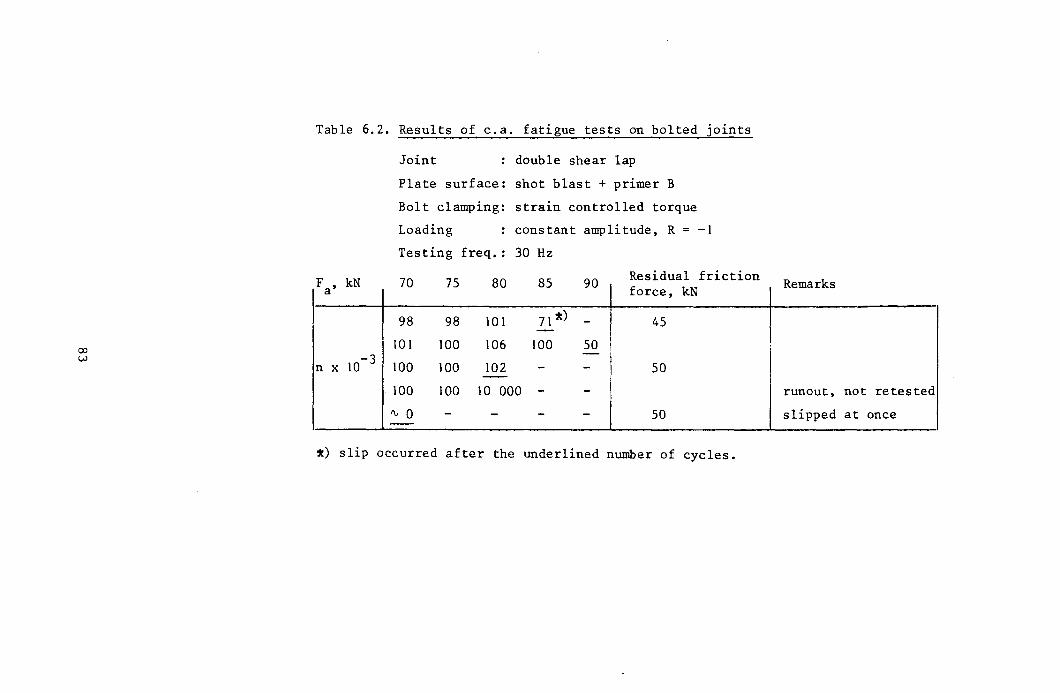
Table 6.2. Results of c.a. fatigue tests on bolted joints
F a' kN
n x 10 -3
Joint double shear lap
Plate surface: shot blast + primer B
Bolt clamping: strain controlled torque
Loading constant amplitude, R = -1
Testing freq.: 30 Hz
70 75 80 85 90 Residual friction force, kN
98 98 101 7I ~) - 45 -101 100 106 100 50 I -
I 100 100 102 - - 50 --100 100 10 000 - -IV 0 - - - - 50 --
~) slip occurred after the underlined number of cycles.
Remarks
runout, not retested
slipped at once
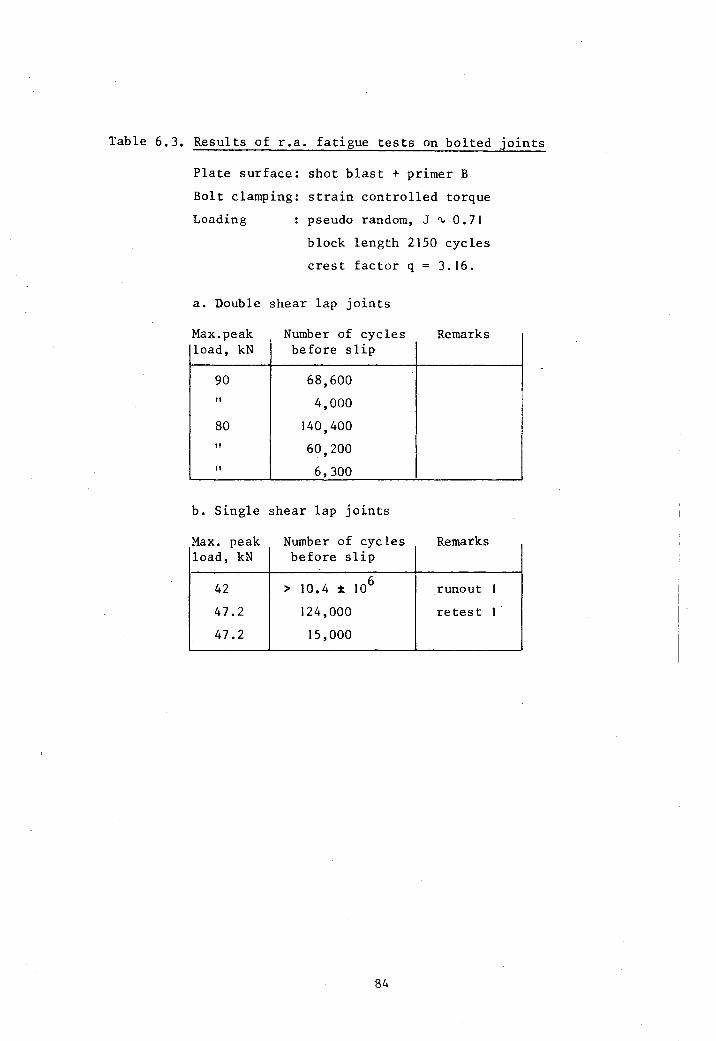
Table 6.3. Results of r.a. fatigue tests on bolted joints
Plate surface: shot blast + primer B
Bolt clamping: strain controlled torque
Loading pseudo random, J '" 0.71
block length 2150 cycles
crest factor q = 3.16.
a. Double shear lap joints
M ax.pea k N b urn er 0 f cyc 1 es R emar ks load, kN before slip
90 68,600
" 4,000
80 140,400
" 60,200
" 6,300
b. Single shear lap joints
Max peak . Number of cycles Remarks load, kN before slip
42 > 10.4 :l 106 runout 1
47.2 124,000 retest 1
47.2 15,000
84
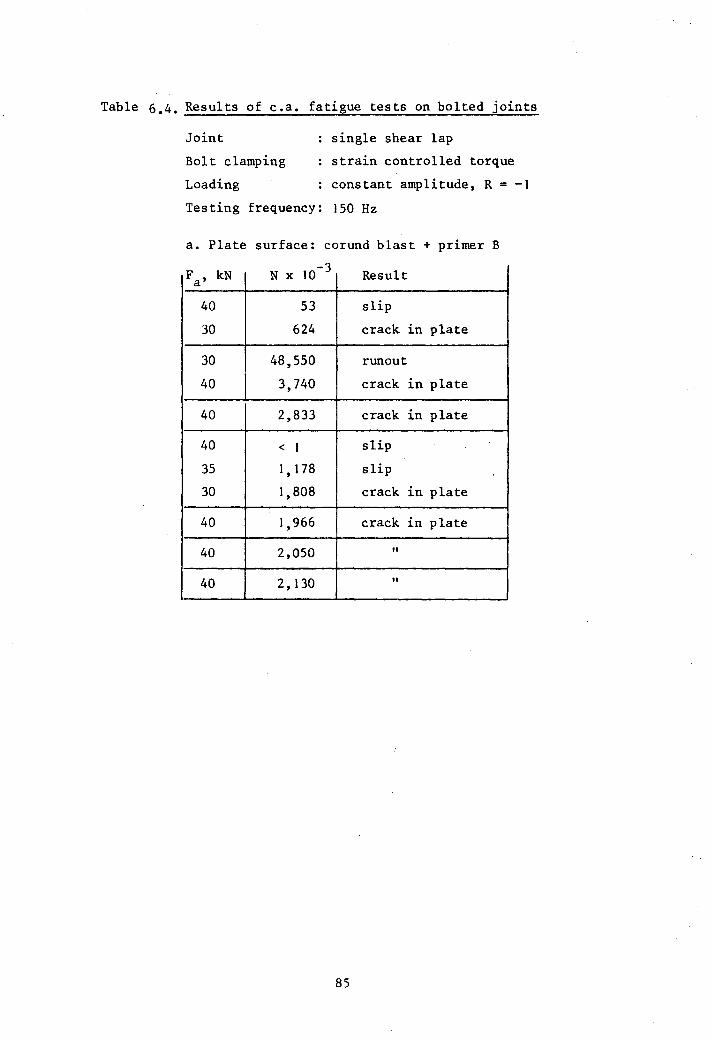
Table 6.4. Results of c.a. fatigue tests on bolted joints
Joint
Bolt clamping
Loading
single shear lap
strain controlled torque
constant amplitude, R = -1
Testing frequency: 150 Hz
a. Plate surface: corund blast + primer B
-F , kN N x 10 Result a 3
40 53 slip
30 624 crack in plate
30 48,550 runout
40 3,740 crack in plate
40 2,833 crack in plate
40 < 1 slip
35 1, 178 slip
30 1,808 crack in plate
40 1,966 crack in plate
40 2,050 "
40 2,130 "
85
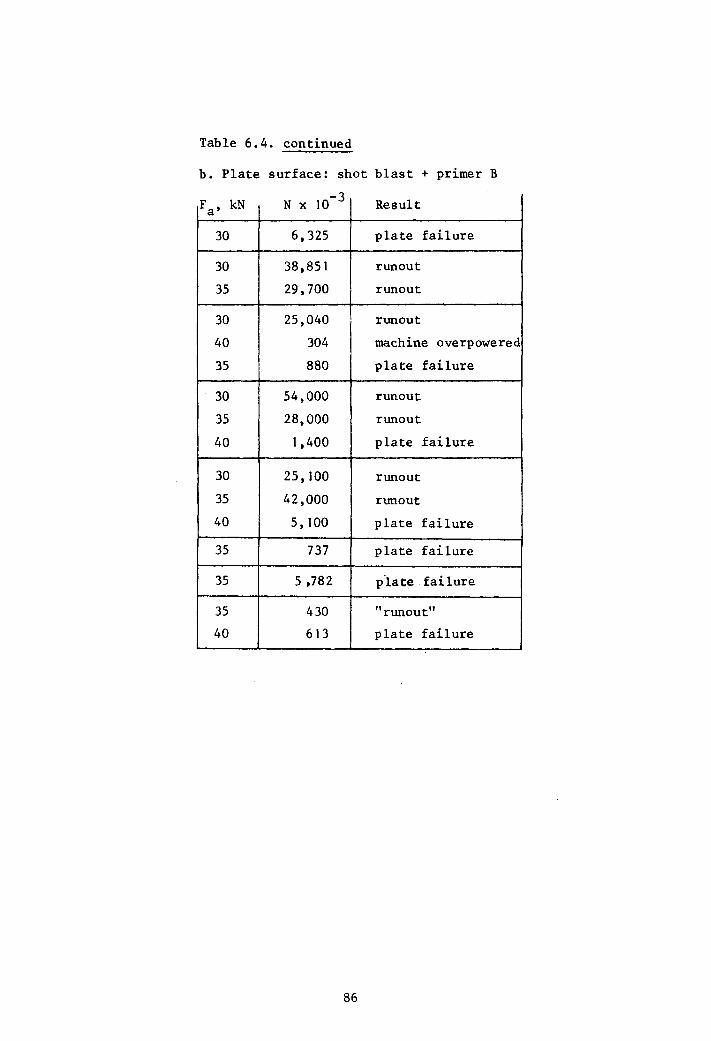
Table 6.4. continued
b. Plate surface: shot blast + primer B
Fa' kN N x 10-3 Result
30 6,325 plate failure
30 38,851 runout
35 29,700 runout
30 25,040 runout
40 304 machine overpowered
35 880 plate failure
30 54,000 runout
35 28,000 runout
40 1,400 plate failure
30 25,100 runout
35 42,000 runout
40 5,100 plate failure
35 737 plate failure
35 5,782 ptate- failure
35 430 "runout"
40 613 plate failure
86
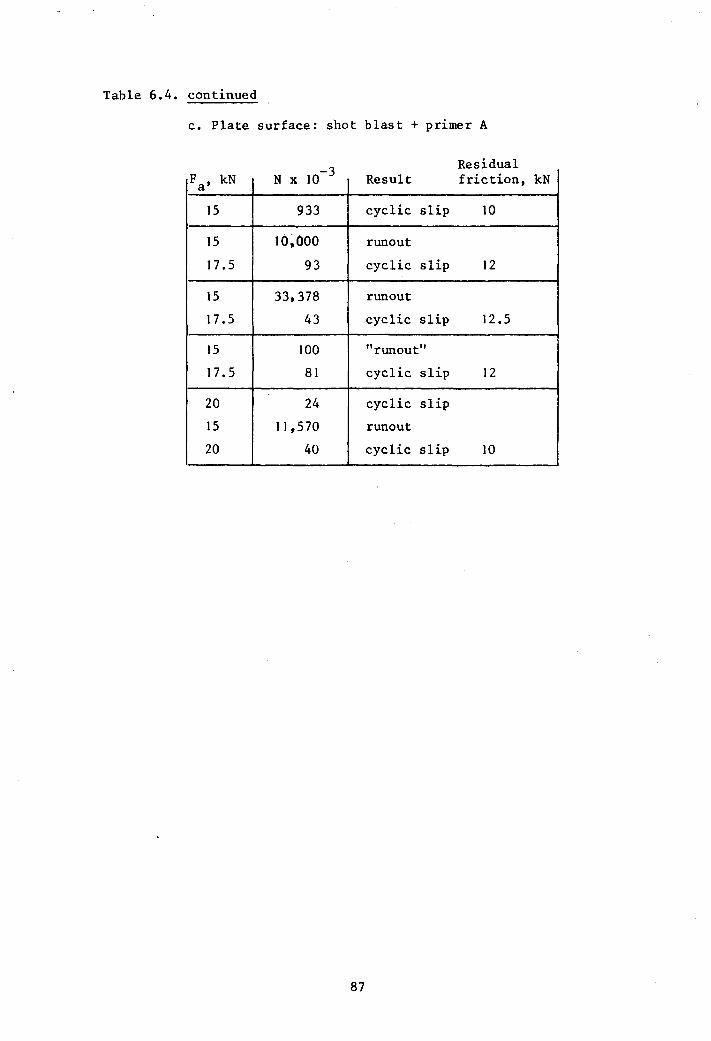
Table 6.4. continued
c. Plate surface: shot blast + primer A
- friction, F a' kN N x 10 Result kN 3 Residual
15 933 cyclic slip 10
15 10~-OOO runout
17.5 93 cyclic slip 12
15 33,378 runout
17.5 43 cyclic slip 12.5
15 100 "runout"
17.5 81 cyclic slip 12
20 24 cyclic slip
15 11,570 runout
20 40 cyclic slip 10
87
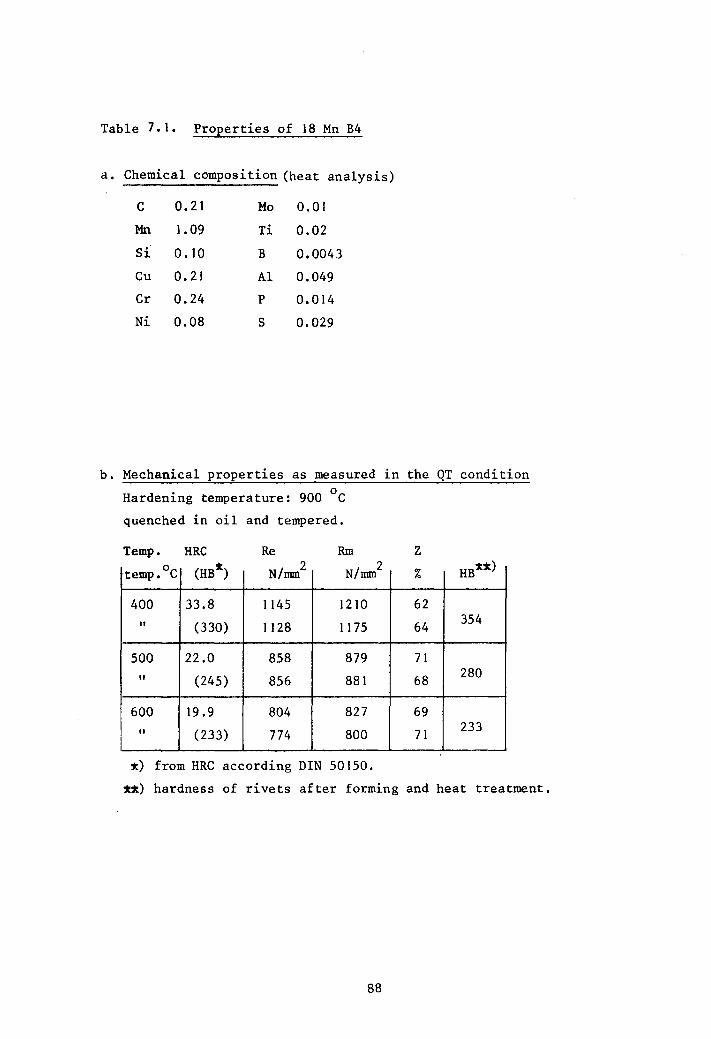
Table 7.1. Properties of 18 Mn B4
a. Chemical composi tion (heat analysis)
C 0.21 Mo 0.01
Mn 1.09 Ti 0.02
Si 0.10 B 0.0043
Cu 0.21 Al 0.049
Cr 0.24 P 0.014
Ni 0.08 S 0.029
b. Mechanical properties as measured in the QT condition
Hardening temperature: 900 °c quenched in oil and tempered.
Temp. HRC Re Rm z 0 temp. C (HB ) N/mm 2 N/mm 2
% HB
400 33.8 1145 1210 62
" (330) 1128 1175 64 354
500 22.0 858 879 71
" (245) 856 881 68 280
600 19.9 804 827 69
" (233) 774 800 71 233
~) from HRC according DIN 50150.
~~) hardness of rivets after forming and heat treatment.
88
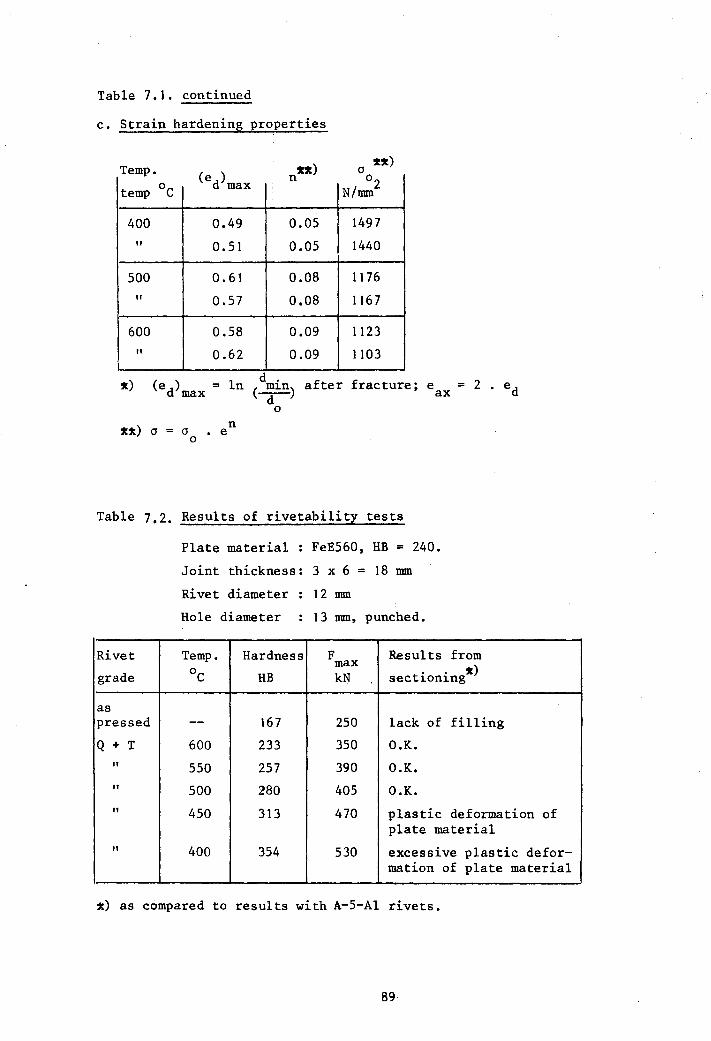
Table 7.1. continued
c. Strain hardening properties
Temp. ( ) n) ed max n 0
temp °c N/rmn2
400 0.49 0.05 1497
" 0.51 0.05 1440
500 0.61 0.08 1176
" 0.57 0.08 1167
600 0.58 0.09 1123
" 0.62 0.09 1103
x) (ed)max = In (d:in) after fracture; eax = 2 • ed o
xx) a = a o
n e
Table 7.2. Results of rivetability tests
Rivet
grade
as pressed
Q + T
" " "
"
Plate material : FeE560, HB = 240.
Joint thickness: 3 x 6 = 18 mm
Rivet diameter
Hole diameter
Temp. Hardness
°c HB
-- 167
600 233
550 257
500 280
450 313
400 354
12 mm
13 rnm, punched.
F Results from max . . x) kN sect10n1ng
250 lack of filling
350 O.K.
390 O.K.
405 O.K.
470 plastic deformation of plate material
530 excessive plastic defor-mation of plate material
x) as compared to results with A-5-Al rivets.
89
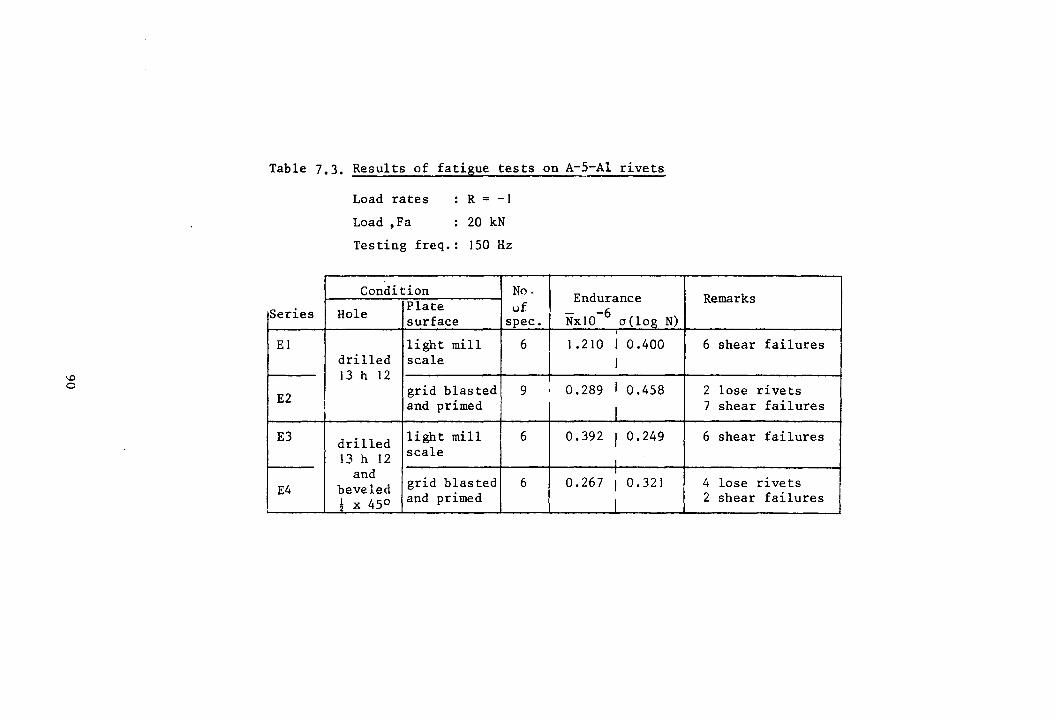
Table 7.3. Results of fatigue tests on A-5-Al rivets
Series
EI
E2 I
E3
E4
Load rates
Load ,Fa
R = -I
20 kN
Testing freq.: 150 Hz
Condition
Hole Plate No. uf
surface spec.
light mill 6 drilled scale 13 h 12
grid blasted 9 and primed
drilled light mill 6
13 h 12 scale
and grid blasted 6 beveled
! x 45 0 and primed
Endurance - -6 NxlO O'(log N)
I
1.210 I 0.400 I
0.289 I 0.458
I 0.392 I 0.249
I
0.267 I 0.321
I
Remarks
6 shear failures
2 lose rivets 7 shear failures
6 shear failures
4 lose rivets 2 shear failures
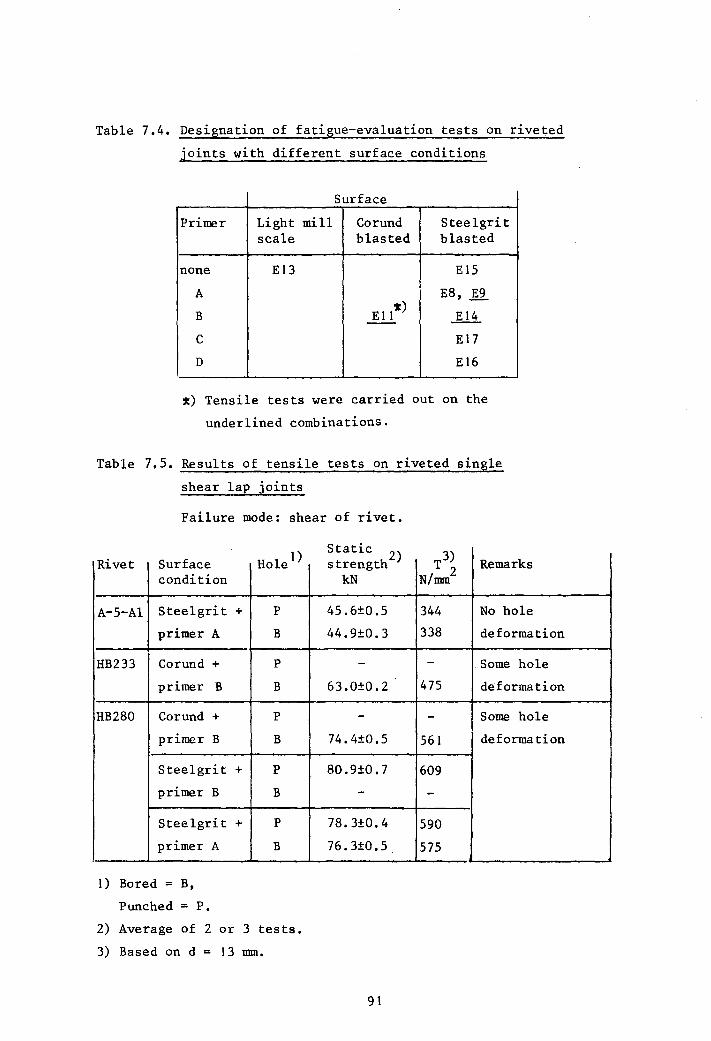
Table 7.4. Designation of fatigue-evaluation tests on riveted
joints with different surface conditions
Surface
Primer Light mill Gorund Steelgrit scale blasted blasted
none E13 E15
A E8, ~
B E 11*) .ID!L G E17
D EI6
*) Tensile tests were carried out on the
underlined combinations.
Table 7.5. Results of tensile tests on riveted single
shear lap joints
Failure mode: shear of rivet.
Rivet Surface Hole 1) a ~c 2)
T3) Remarks strength condition kN N/mm.2
St t·
A-5-Al Steelgrit + P 45.6±0.5 344 No hole
primer A B 44.9±0.3 338 deformation
HB233 Gorund + P - - Some hole
primer B B 63.0±0.2 475 deformation
HB280 Gorund + P - - Some hole
primer B B 74.4±0.5 561 deformation
Steelgrit + P 80.9±0.7 609
primer B B - -Steelgrit + P 78.3±0.4 590
primer A B 76.3±0.5 575
I) Bored = B,
Punched = P.
2) Average of 2 or 3 tests.
3) Based on d 13 mm..
91
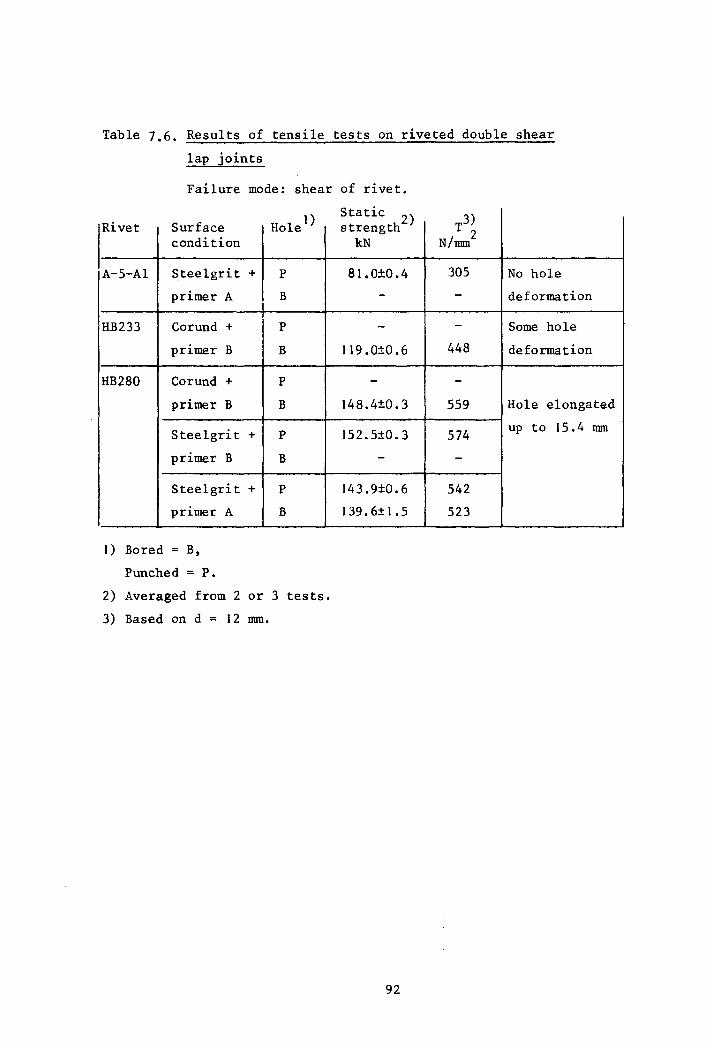
Table 7.6. Results of tensile tests on riveted double shear
lap joints
Failure mode: shear of rivet.
Rivet Surface condition
A-S-Al ~teelgrit +
primer A
HB233 Corund +
primer B
HB280 Corund +
primer B
Steelgrit +
primer B
Steelgrit +
primer A
I) Bored = B,
Punched = P.
Hole 1)
P
B
P
B
P
B
P
B
P
B
2) Averaged from 2 or 3 tests.
3) Based on d = 12 mm.
Statlc 2 strength )
kN
81.0±0 .4
-
-119.0±0.6
-148.4±0.3
152.5±0.3
-
143.9±0.6
139. 6± 1.5
92
T3) N/mm2
305 No hole
- deformation
- Some hole
448 deformation
-559 Hole elongated
574 up to 15.4 mm
-
542
523
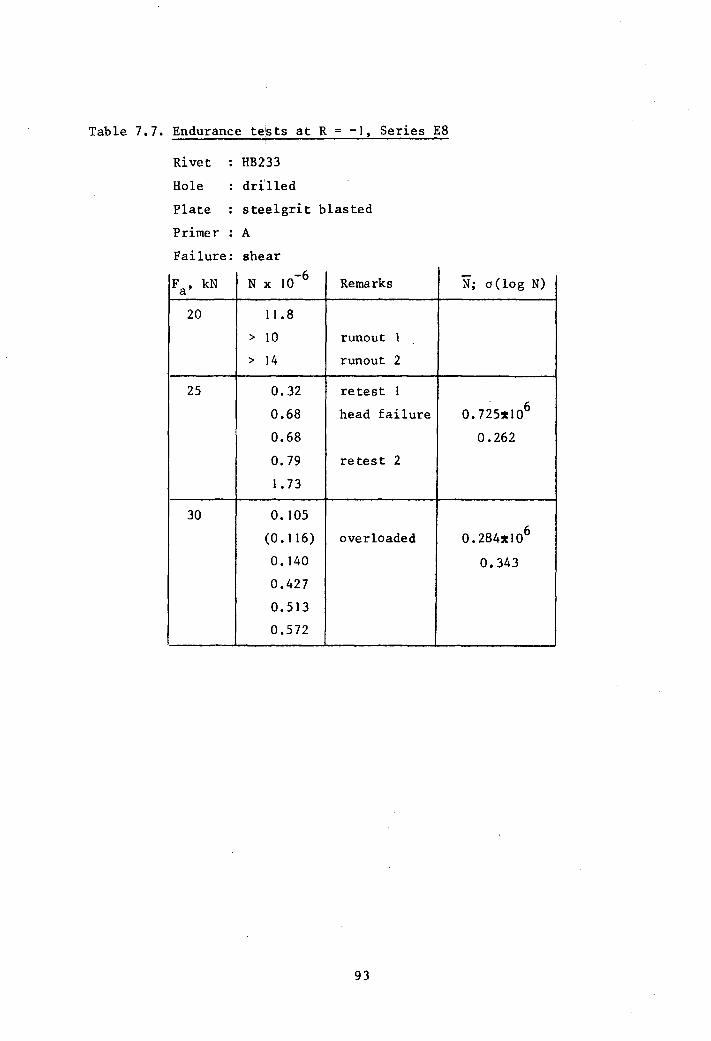
Table 7.7. Endurance te!s ts at R - I, Series E8
Rivet HB233
Hole dri'lled
Plate steelgrit blasted
Primer A
Failure: shear
N x 10-6 Remarks - a(log N) Fa' kN N;
20 11.8
> 10 runout 1
> 14 runout 2
25 0.32 retest 1
0.68 head failure O. 725~106 0.68 0.262
0.79 retest 2
I. 73
30 0.105
(0.116) overloaded 0.284:t106
0.140 0.343
0.427
0.513
0.572
93
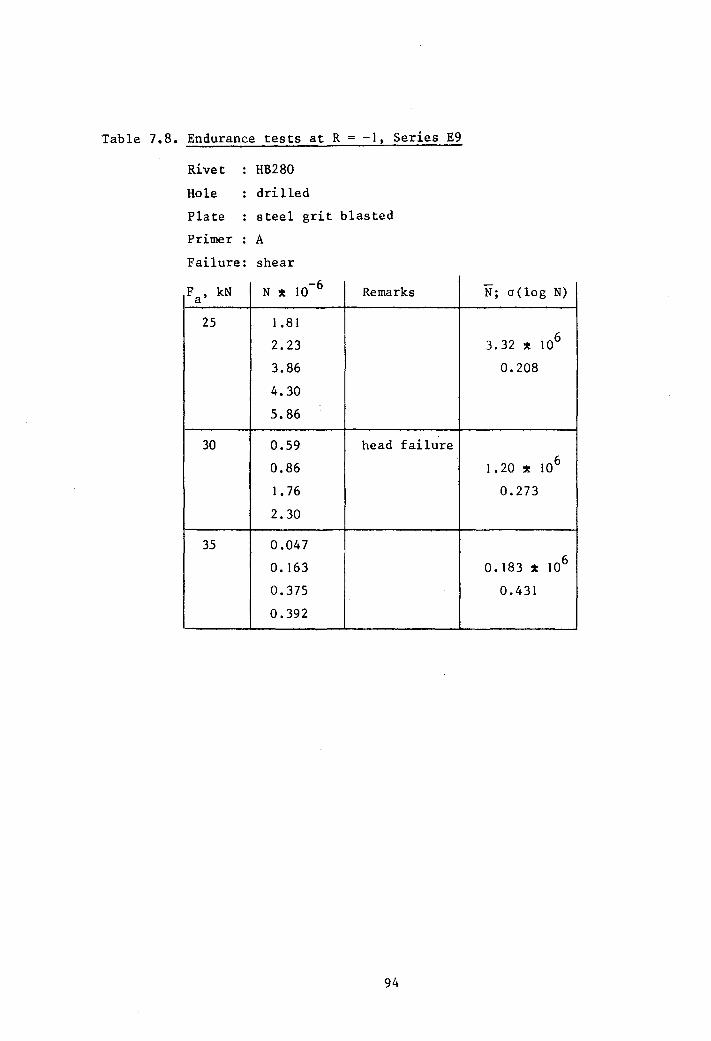
Table 7.B. Endurance tests at R = -1, Series E9
Rivet HB2BO
Hole drilled
Plate steel grit blasted
Primer A
Failure: shear
F , kN N * 10-6 Remarks - cr (log N) N· a ,
25 1.81
2.23 3.32 * 106
3.B6 0.20B
4.30
5.B6
30 0.59 head failure
0.B6 1.20 * 106
1. 76 0.273
2.30
35 0.047
0.163 0.183 * 106
0.375 0.431
0.392
94
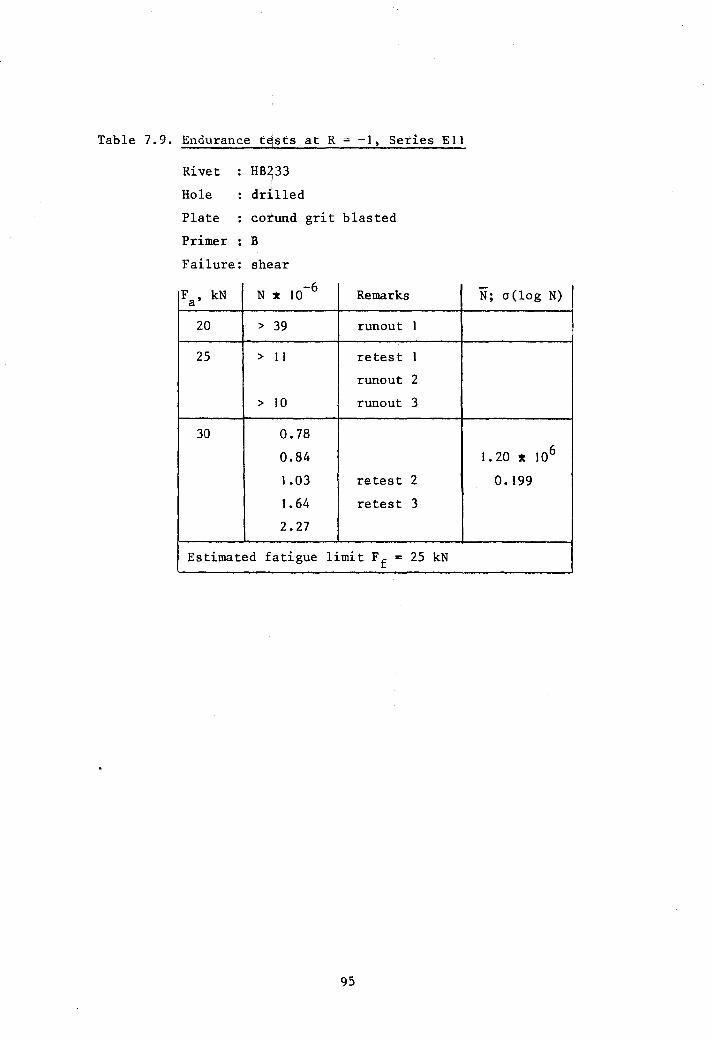
I Table 7.9. Endurance t~sts at R -I, Series Ell
Rivet HB233 , Hole ddlled
Plate cotund grit blasted
Primer B
Failure: shear
F , kN N x 10-6 - cr(log N) Remarks N· a ,
20 > 39 runout 1
25 > 11 retest I
runout 2
> 10 runout 3
30 0.78
0.84 1. 20 x 106
1.03 retest 2 0.199
1.64 retest 3
2.27
Estimated fatigue limit F f = 25 kN
95
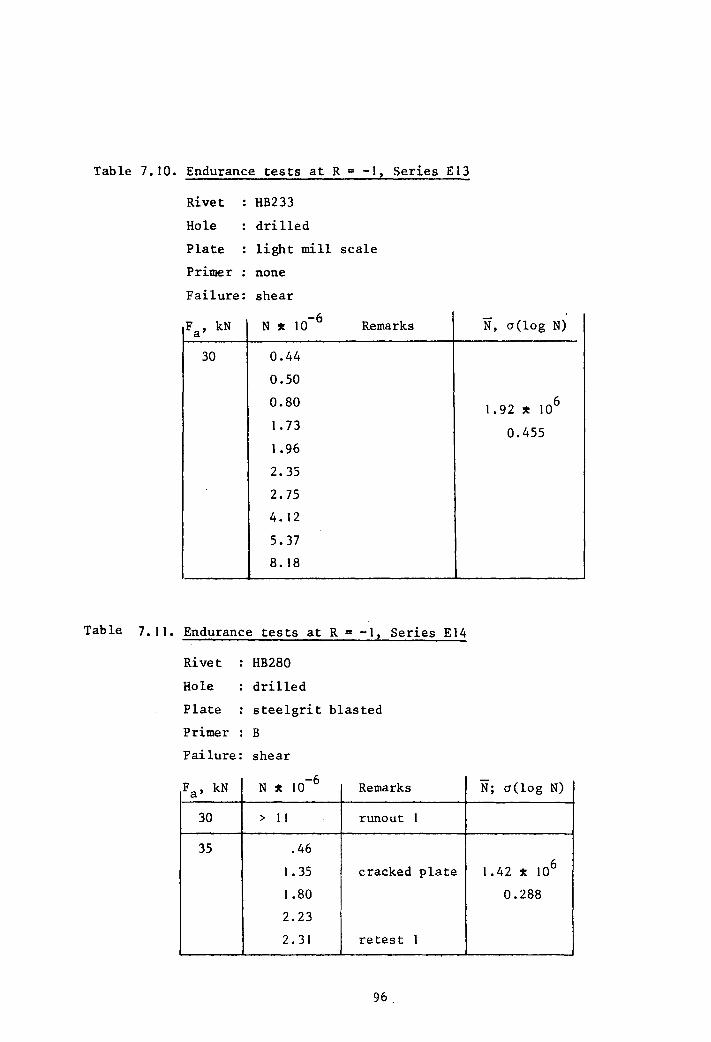
Table 7.10. Endurance tests at R = -I, Series EI3
Rivet HB233
Hole drilled
Plate light mill scale
Primer none
Failure: shear
Fa' kN N :t 10-6 Remarks
30 0.44
0.50
0.80
I. 73
1.96
2.35
2.75
4.12
5.37
8.18
Table 7. II. Endurance tests at R = -I, Series EI4
Rivet HB280
Hole drilled
Plate steelgrit blasted
Primer B
Failure: shear
Fa' kN N :t 10-6 Remarks
30 > II runout I
35 .46
1.35 cracked plate
1.80
2.23
2.3\ retest 1
96
N, a(log N)
1.92 :t 106
0.455
-N' , a(log N)
1.42:t106
0.288
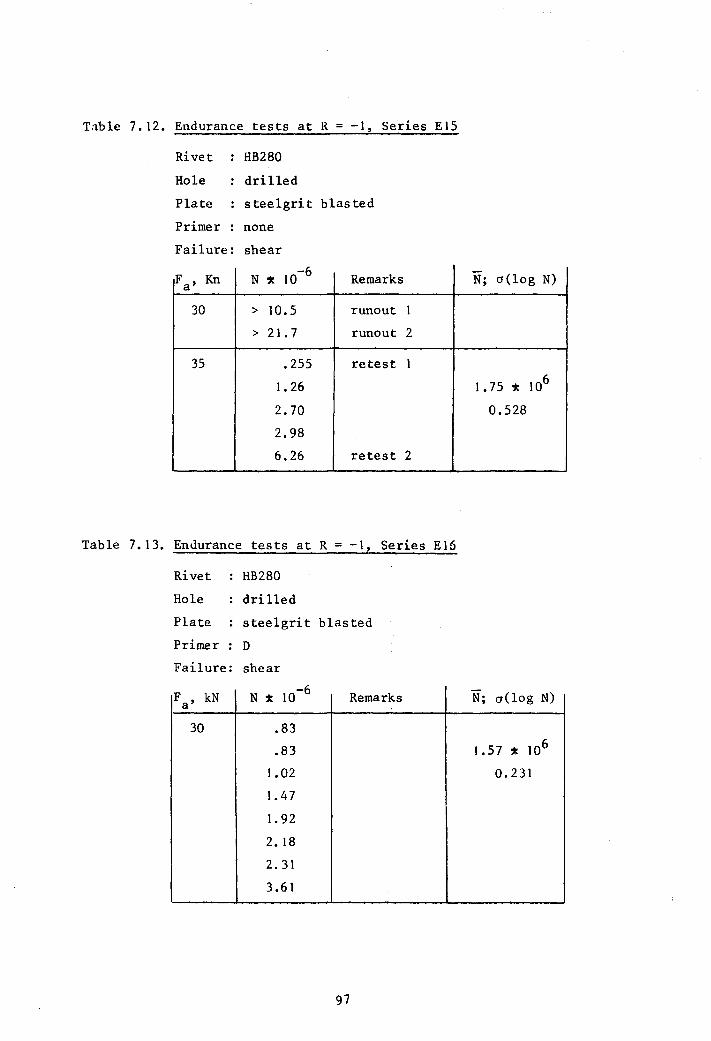
Table 7.12. Endurance tests at R -I, Series EI5
Rivet HB280
Hole drilled
Plate steelgrit blasted
Primer none
Failure: shear
N ~ 10-6 - o(log N) F a' Kn Remarks N;
30 > 10.5 runout 1
> 21.7 runout 2
35 .255 retest 1
1. 26 1.75 ~ 106
2.70 0.528
2.98
6.26 retest 2
Table 7.13. Enuurance tests at R -I, Series EI5
Rivet HB280
Hole drilled
Plate steelgrit blasted
Primer D
Failure: shear
F , kN N ~ 10-6 - o(log N) Remarks N' a ,
30 .83
.83 1.57 ~ 106
1.02 0.231
1. 47
1. 92
2. 18
2.31
3.61
97
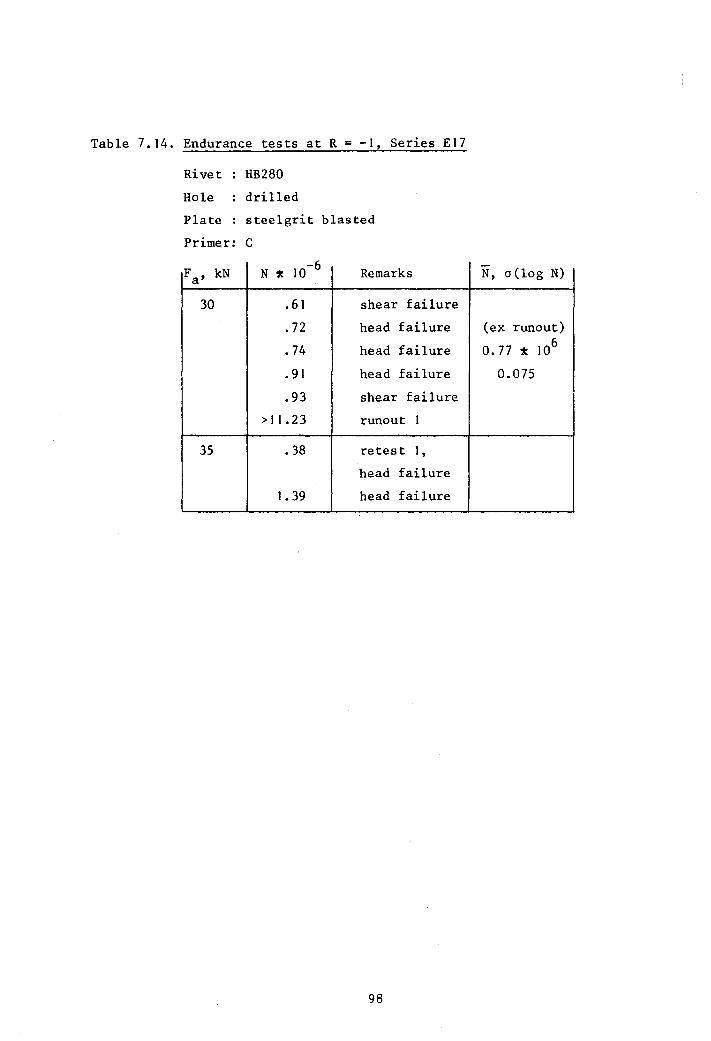
Table 7.14. Endurance tests at R
Rivet HB280
drilled
-1, Series E17
Hole
Plate steelgrit blasted
Primer: C
F a' kN N * 10-6 Remarks
30 .61 shear failure
.72 head failure
.74 head failure
.91 head failure
.93 shear failure
> 11.23 runout 1
35 .38 retest 1 ,
head failure
1. 39 head failure
98
-N, C1 (log N)
(ex runout)
0.77 * 106
0.075
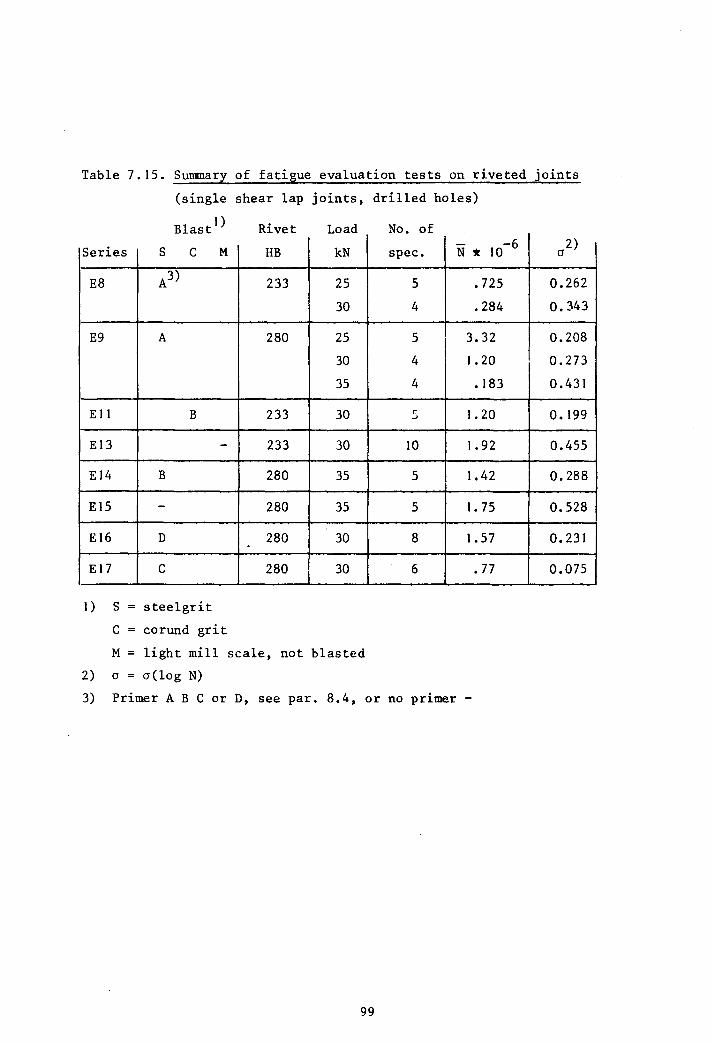
Table 7.15. Summarl of fati~ue evaluation tests on riveted joints
(single shear lap joints, drilled holes)
Blast l ) Rivet Load No. of
Series - 10-6 2) S c M HB kN spec. N * a
E8 A3) 233 25 5 .725 0.262
30 4 .284 0.343
E9 A 280 25 5 I
3.32 0.208
30 4 1. 20 0.273
35 4 .183 0.431
Ell B 233 30 5 1. 20 0.199
EI3 - 233 30 10 1. 92 0.455
EI4 B 280 35 5 1. 42 0.288
E15 - 280 35 5 1. 75 0.528
EI6 D 280 30 8 1.57 0.231
EI7 C 280 30 6 .77 0.075
I) S steelgrit
C corund grit
M = light mill scale, not blasted
2) a = a(log N)
3) Primer ABC or D, see par. 8.4, or no primer -
99
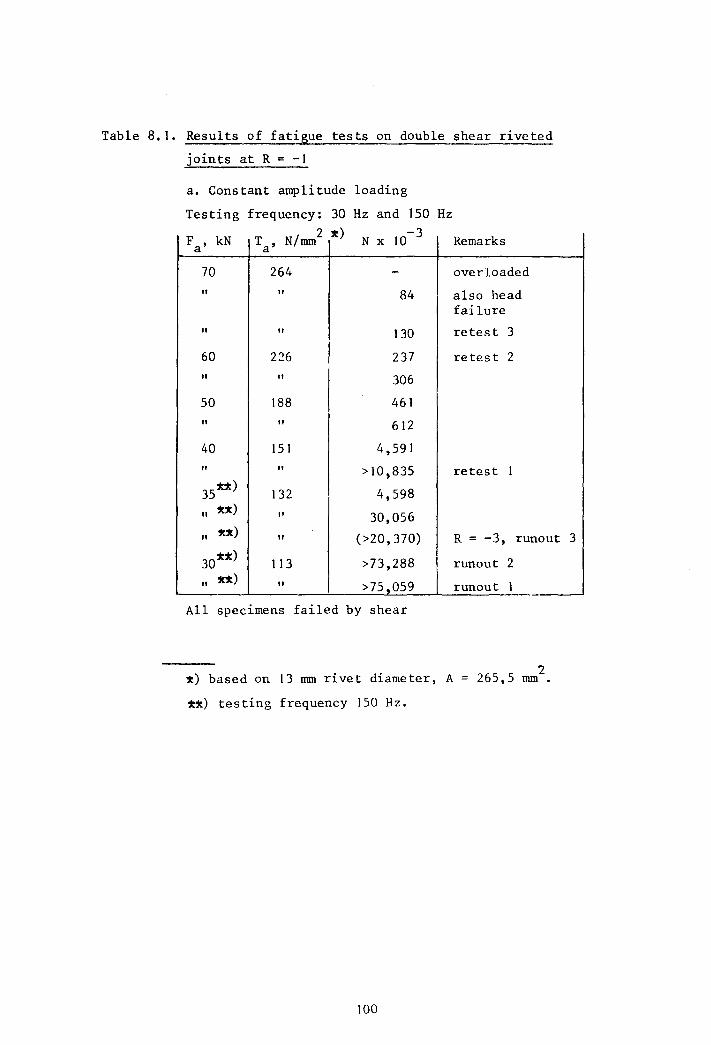
Table 8.1. Results of fatigue tests on double shear riveted
joints at R = -1
a. Constant amplitude loading
Testing frequency: 30 Hz and 150 Hz 2 x) 3
T , N/mrn -
F , kN N x 10 a a
70 264 -
Remarks
overloaded
" " 84 also head
" " 130
60 226 237
" " 306
50 188 461
" " 612
40 151 4,591
" " >10,835
35xx) 132 4,598 " xx) " 30,056
" xx)
" (>20,370)
30*x) 113 >73,288 " xx) " >75,059
All specimens failed by shear
x) based on 13 mrn rivet diameter, A
xx) testing frequency 150 Hz.
100
failure
retest 3
retes t 2
retest 1
R = -3, runout
runout 2
runout 1
2 265,5 mrn .
3
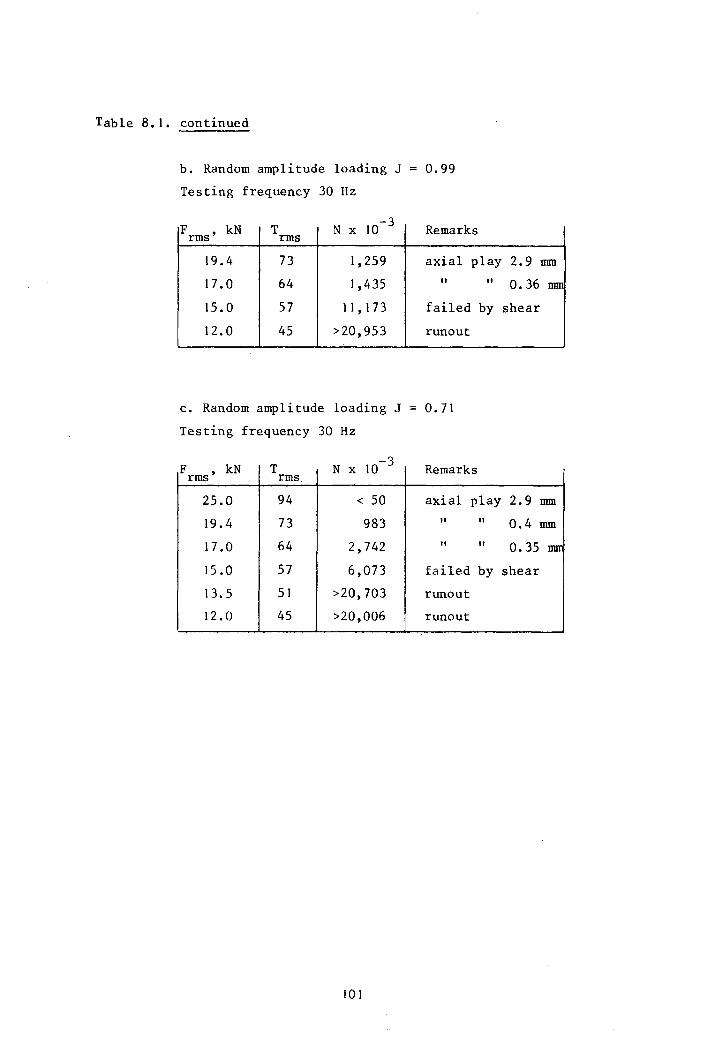
Table 8.1. continued
b. Random amplitude loading J = 0.99
Testing frequency 30 Hz
F rms' kN T N x 10 -3 Remarks rms
19.4 73 1,259 axial
17.0 64 1,435 " 15.0 57 11,173 failed
12.0 45 >20,953 runout
c. Random amplitude loading J 0.71
Testing frequency 30 Hz
play
"
by
F , kN T N x 10 -3 Remarks rms rms
25.0 94 < 50 axial play
19.4 73 983 " " 17.0 64 2,742 " " 15.0 57 6,073 failed by
13.5 51 >20,703 runout
12.0 45 >20,006 runout
101
2.9 nun
0.36 nun
shear
2.9 nun
0.4 nun
0.35 nm
shear
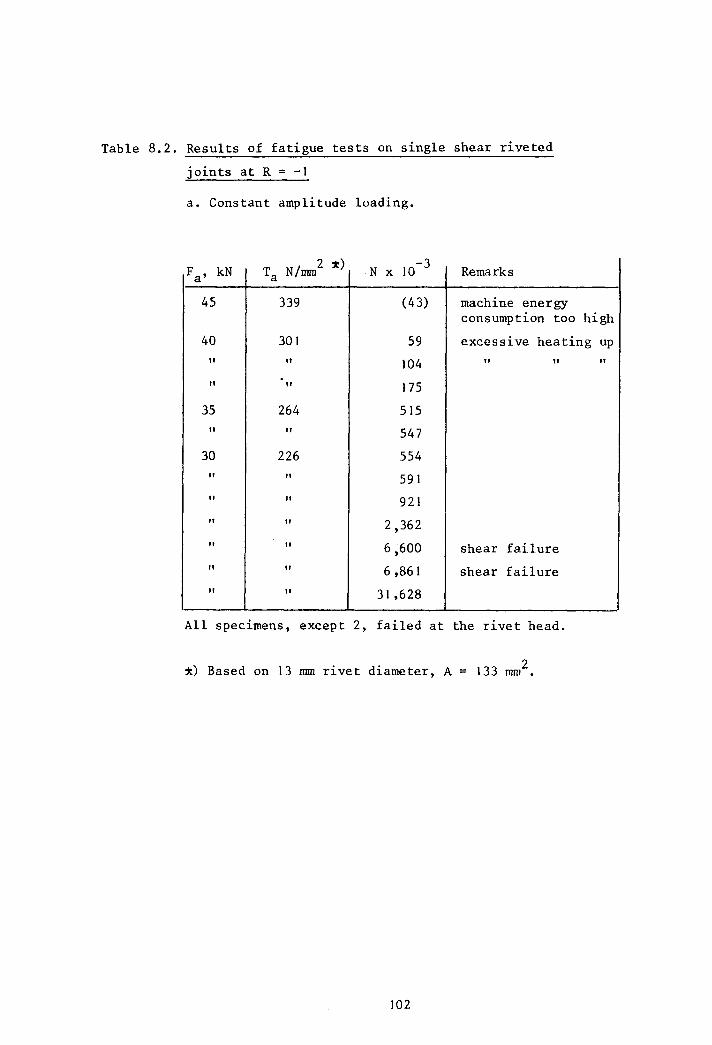
Table 8.2. Results of fatigue tests on single shear riveted
joints at R = -I
a. Constant amplitude loading.
F kN Ta N/nnn 2 ~) N x 10-3 Remarks a'
45 339 (43) machine energy consumption too high
40 301 59 excessive heating up
" " 104 " " . " " 175
35 264 SIS
" " 547
30 226 554
" " 591
" " 921
" " 2,362
" " 6~600 shear failure
" " 6,86 I shear failure
" " 3 I ,628
All specimens, except 2, failed at the rivet head.
~) Based on 13 mm rivet diameter, A
102
2 133 mm .
"
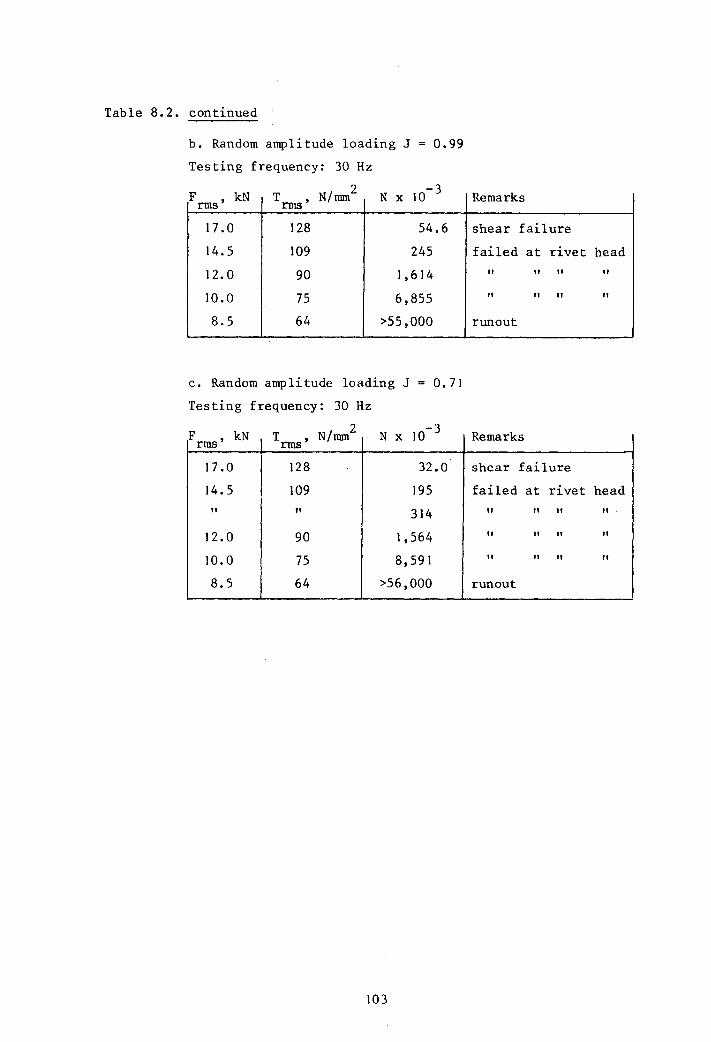
Table 8.2. continued
b. Random amplitude loading J 0.99
Testing frequency: 30 Hz
F , kN T rms' Nnun N x 10 rms / 2 -3
17.0 128 54.6
14.5 109 245
12.0 90 1,614
10.0 75 6,855
8.5 64 >55,000
c. Random amplitude loading J 0.71
Testing frequency: 30 Hz
F kN T N/ 2 N rms' rms' nun x
17.0 128 32.0
14.5 109 195
" " 314
12.0 90 1,564
10.0 75 8,591
8.5 64 >56,000
103
Remarks
shear failure
failed at rivet head
" " " "
" " " " runout
R k emar s
shear failure
failed at rivet head
" " " "
" " " " " " " "
run out
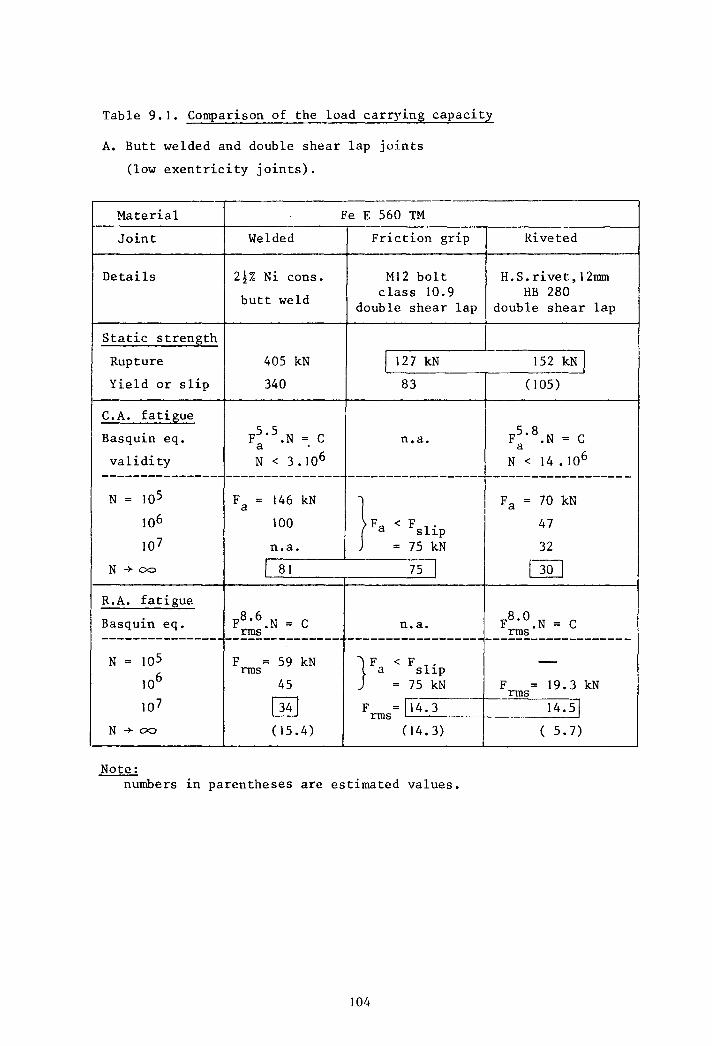
Table 9. I. Comparison of the load carry~ng capacity
A. Butt welded and double shear lap joints
(low exentricity joints).
Material Fe E 560 TM
Joint Welded Friction grip
Details 2!% Ni cons. MI2 bolt
butt weld class 10.9 double shear lap
Static strength
Rupture 405 kN I 127 kN
Yield or slip 340 83
C.A. fatigue
Basquin eq. F5 . 5 .N = C n.a. a validity N < 3.106
---------------- --------------- ------------------N = 105 F = 146 kN
}Fa a
106 100 < F slip 10 7 n.a. = 75 kN
N + 00 l 81 75 I R.A. fatigue
Basquin eq. F8 •6 .N rms = C n.a.
---------------- --------------- ------------------N = 105 F = 59 kN } Fa < F slip
106 rms
45 = 75 kN
[ill 107 F =[4.3 rms . ---N + 00 (15.4) (14.3)
Note: numbers in parentheses are estimated values.
104
Riveted
H.S.rivet,12nnn HB 280
double shear lap
152 kN
(105)
F5•8 .N a = C
N < 14 • 106
-------------------Fa = 70 kN
I
47
32
[JQJ
F8•O.N rms = C
-------------------
-F = 19.3 kN rms
14.51
( 5.7)
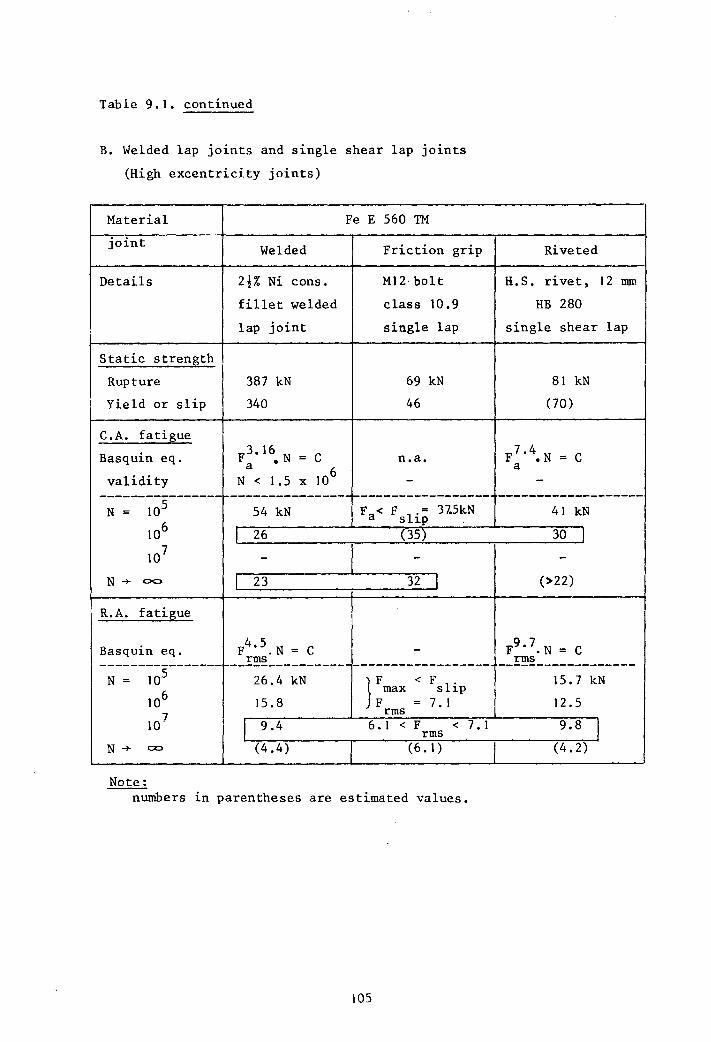
Table 9.1. continued
B. Welded lap joints and single shear lap joints
(High excentricity joints)
Material Fe E 560 TM
joint Welded Friction grip
Details 2!% Ni cons. M12 bolt
fillet welded class 10.9
lap joint single lap
Static strength
Rupture 387 kN 69 kN
Yield or slip 340 46
C.A. fati~ue
Basquin eq. F3• 16 N = C n.a. a •
106
validity N < 1.5 x -----------------~----------------~-----------------
N = 105 54 kN Fa< F 1'= 3l5kN
106 s ~p
I 26 (35)
107 - I -N + DO I 23 32 I
R.A. fatigue
Basquin eq. F4•5 , N = C ---~~--------------------------- ------------------
N = 105 26.4 kN } F < F slip 106 max
15.8 F - 7.1 7 rms
10 I 9.4 6.1 < F < 7.1 rms N+ 00 (4.4) (6.1)
Note: numbers in parentheses are estimated values.
105
Riveted
H.S. rivet, 12 nnn
HB 280
single shear lap
81 kN
(70)
F 7 .4. N = C a -
-------------------41 kN
30 I - I
(>22)
F9 . 7.N = C rms ------------------15.7 kN
12.5
9.8 I (4.2)
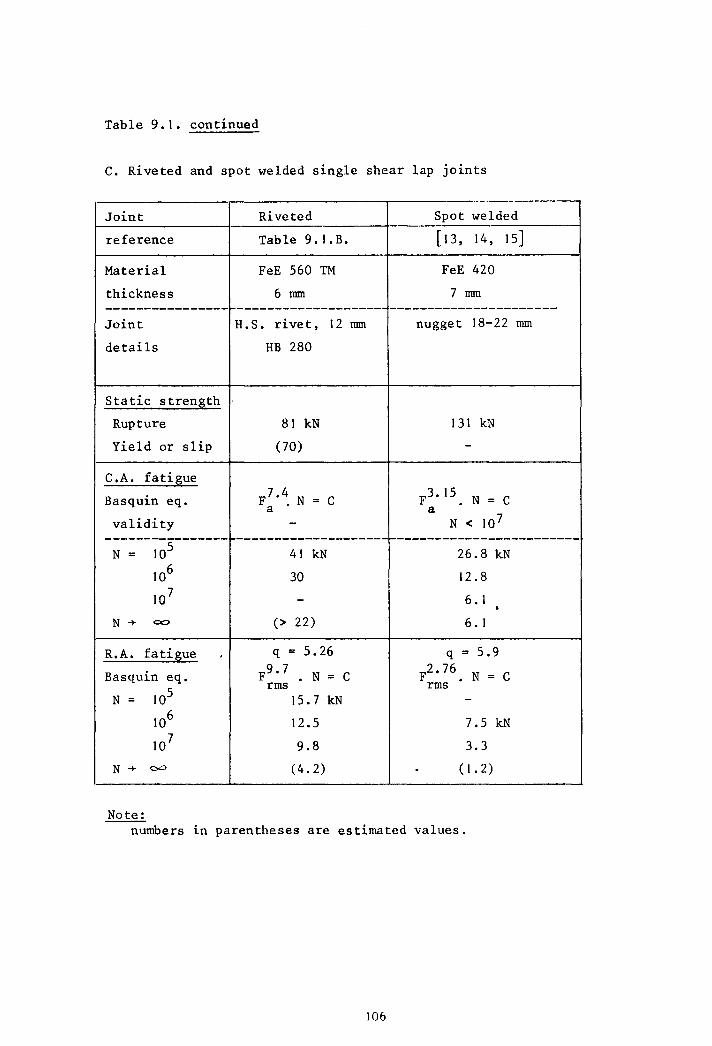
Table 9.1. continued
c. Riveted and spot welded single shear lap joints
Joint Riveted Spot welded
reference Table 9.I.B. [13, 14, 15]
Material FeE 560 TM FeE 420
thickness 6 nun 7 nun ---------------- ------------------- ----------------------Joint H.S. rivet, 12 nun nugget 18-22 nun
details HB 280
Static stren~th
Rupture 81 kN 131 kN
Yield or slip (70) -
C.A. fati~ue
Basquin eq. F7•4 N = C F3. 15. N = C a . a validity - N < 10 7
---------------- --------------------~------------------------N = 105 41 kN 26.8 kN
106 30 12.8
107 - 6.1 •
N -+ 00 (> 22) 6.1
R.A. fati~ue q = 5.26 q = 5.9
Basquin eq. F9 •7 . N = C F2 • 76 • N = C
105 rms rms
N = 15.7 kN -106 12.5 7.5 kN
107 9.8 3.3
N-+ 00 (4.2) . (1.2)
Note: numbers in parentheses are estimated values.
106
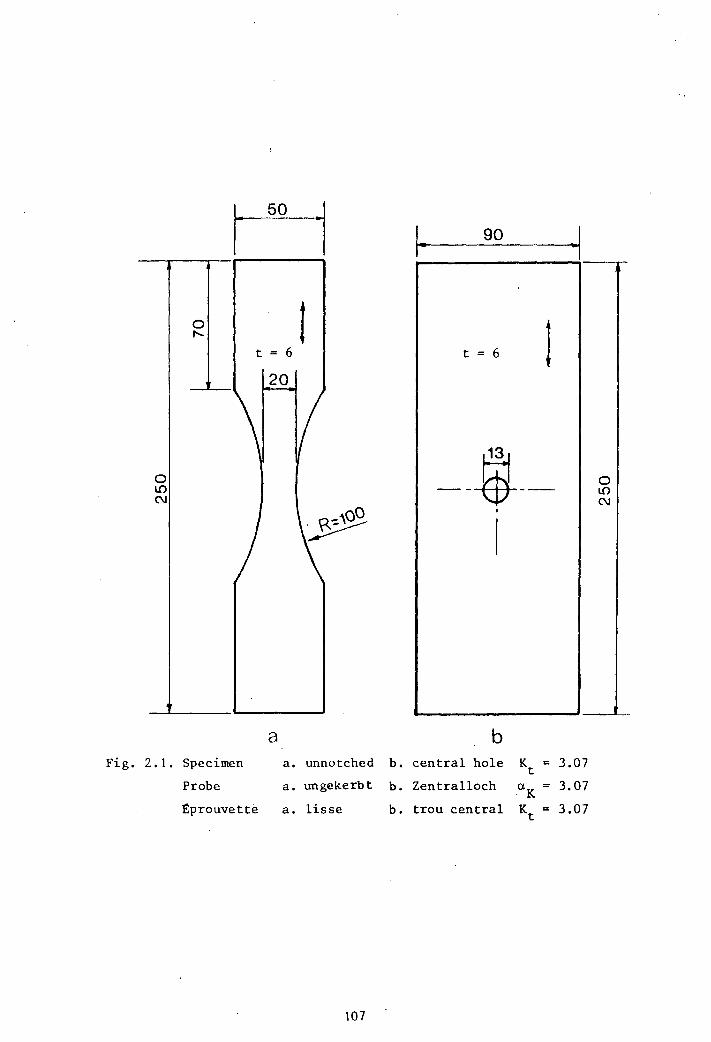
Fig.
o LO N
2.1.
II o ,.....
t = 6
20
a Specimen a.
Probe a.
£prouvette a.
I
unnotched
ungekerbt
lisse
107
b.
b.
b.
I- 90
t = 6 I
~ 0 ---$--- LO N
I
I
b central hole Kt 3.07
Zentralloch a. K 3.07
trou central Kt = 3.07
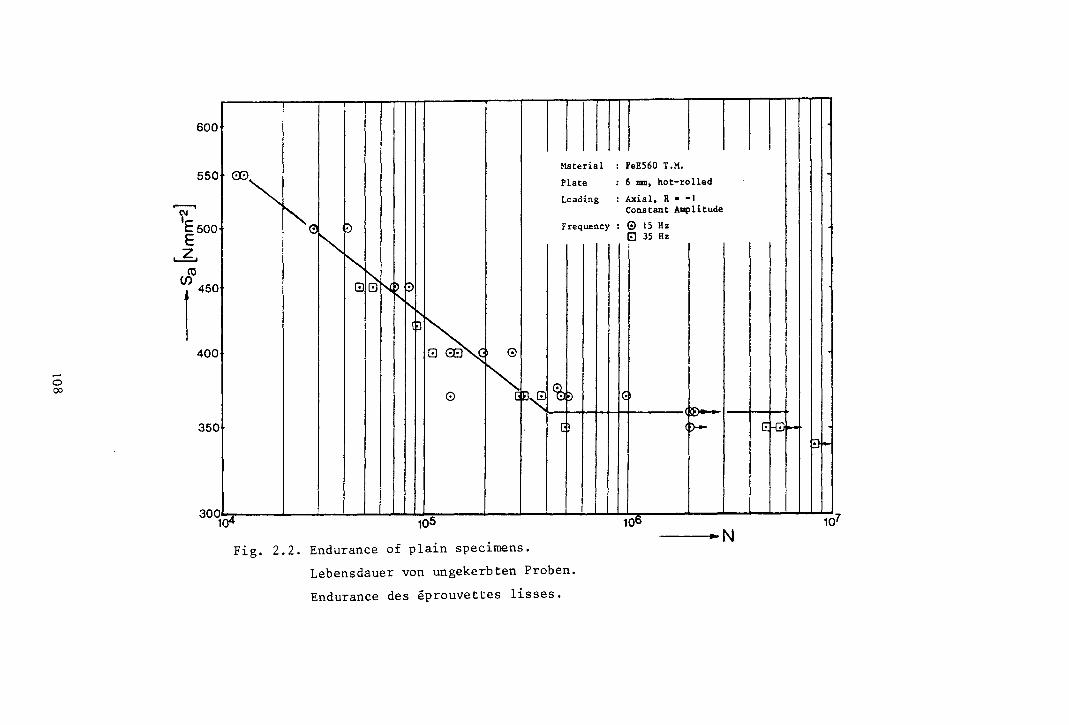
60 0
Material 0 ffi -'" Plate
~<:l Loading
'" ~ Frequency
~ ~ 0 N ~/::)
f'r-. f'.
~~ G
~ 0 f~ ~~
55
400
350 [
104 5 10 300
Fig. 2.2. Endurance of plain specimens.
Lebensdauer von ungekerbten Proben.
Endurance des eprouvettes lisses.
: FeE560 T.M.
: 6 mil. hot-rolled
: Axial. R • -I Constant Amplitude
: G> 15 Hz GJ 35 Hz
IG be-I"-
P- ~ ~ ~ ...:.
I!J~
;.,~ 10 -----N
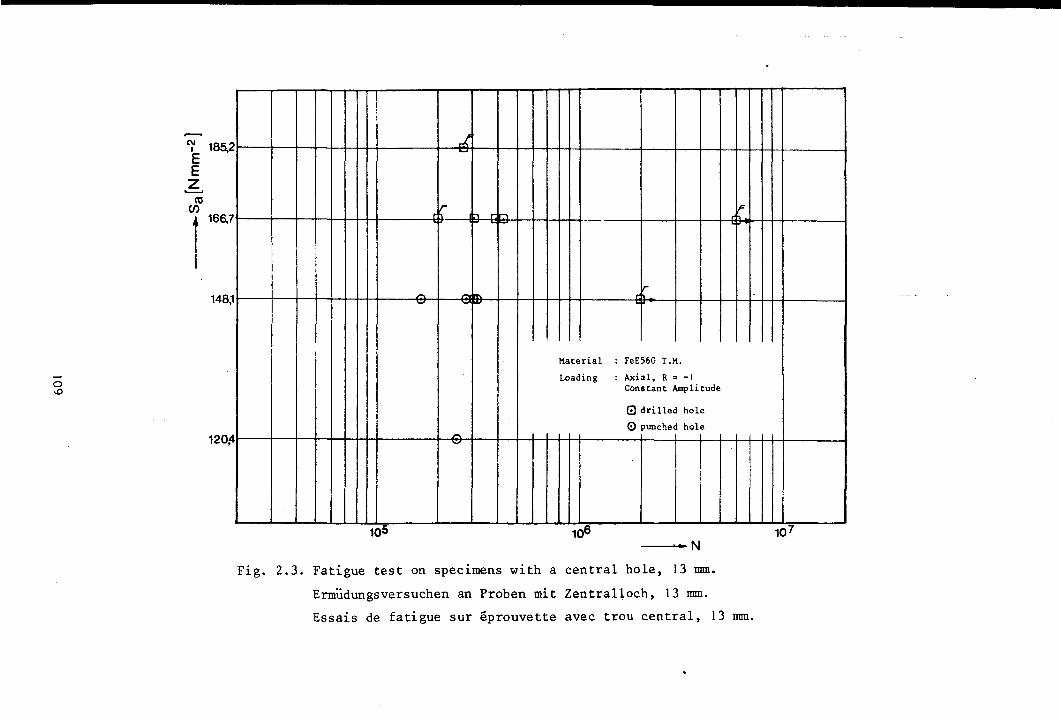
~ 185,2 E E Z ~
('0 -C/) r 166.7
148,1
120;4
" .....
rr :"I ~ n =-
r r.. '" '" ~ ~ ..,
Material : FeE560 r.M. Loading : Axial, R = -\
Constant Amplitude
[!] drilled hole
o punched hole r.. ....,
--..... ·~N
Fig. 2.3. Fatigue test on specimens with a central hole, 13 mm.
F
Ermudungsversuchen an Proben mit Zentralloch, 13 mm.
Essais de fatigue sur eprouvette avec trou central, 13 mm.
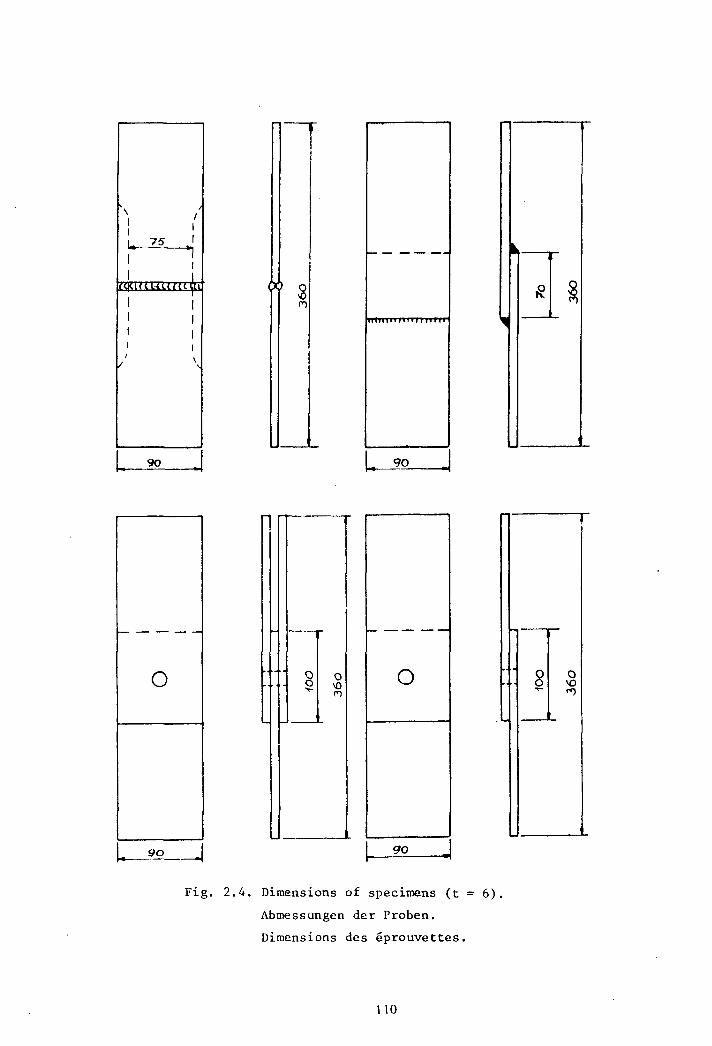
\ I I I 1
l.. 75 I
I i 1
>----.-I J
l(J(. c1d.1. . ~l
I I I I I I 1 1
I \ II
L 90
f------ ----- ,_r-
o o \() !"l
o
I. 90
.... 1-'-
Fig. 2.4. Dimensions of specimens (t 6).
Abmessungen der Proben.
Dimensions des eprouvettes.
\ \0
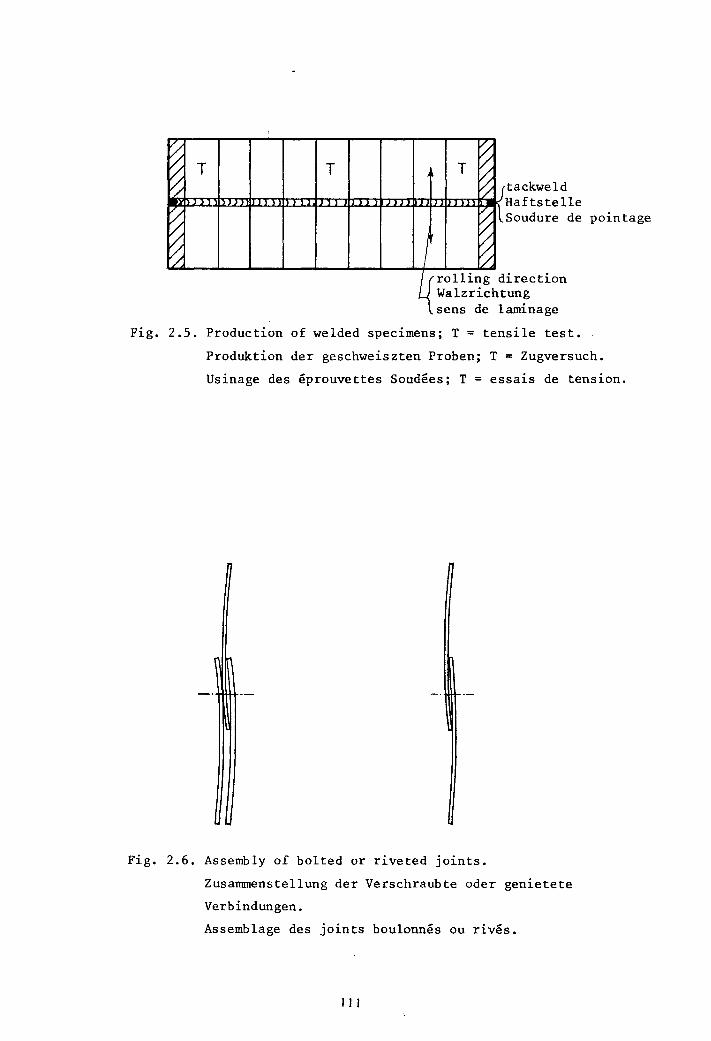
~ T T ~ 'L
~ ~ ~
T ~ ~ '/
% ~ / ~
l
tackweld Haftstelle Soudure de pointage
4rOlling d Walzricht
irection ung aminage sens de 1
Fig. 2.5. Production of welded specimens; T = tensile test.
Produktion der geschweiszten Proben; T = Zugversuch.
Usinage des eprouvettes Soudees; T = essais de tension.
Fig. 2.6. Assembly of bolted or riveted joints.
Zusannnenstellung der Verschraubte oder genietete
Verbindungen.
Assemblage des joints boulonnes ou rives.
III
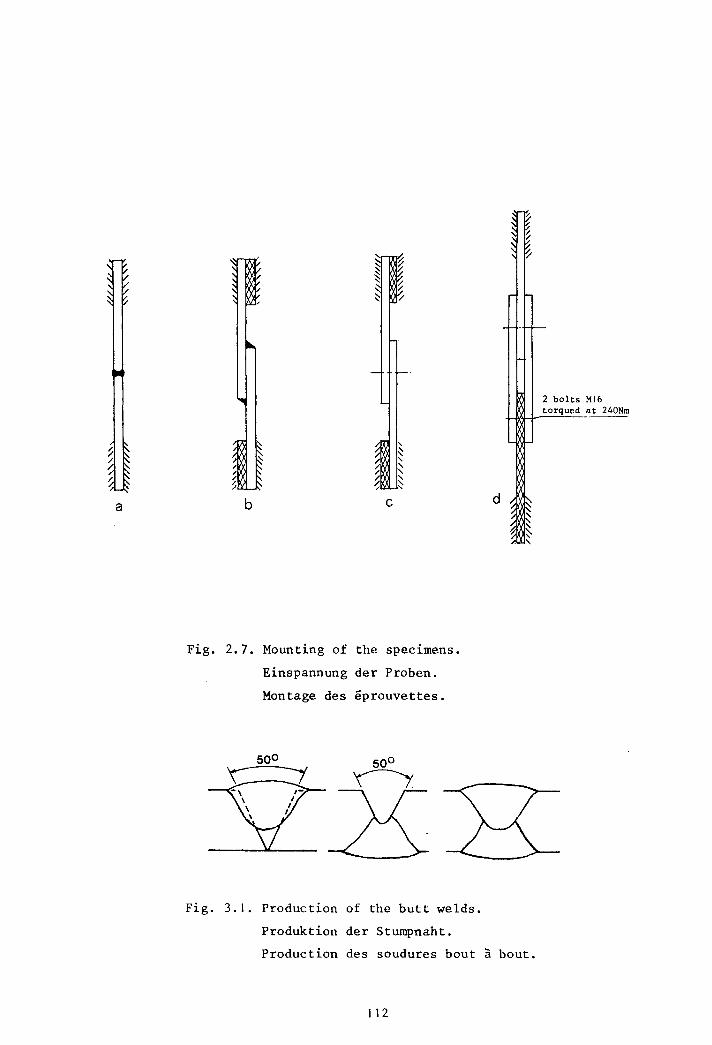
a
" " ~ .- " " .- " ~ ~ b c
Fig. 2.7. Mounting of the specimens.
Einspannung der Proben.
Montage des eprouvettes.
Fig. 3.1. Production of the butt welds.
Produktion der Stumpnaht.
d ~ ~ ~ ~ ~
~. ~ "
Production des soudures bout a bout.
112
2 bolts MI6 torqued at 240Nm
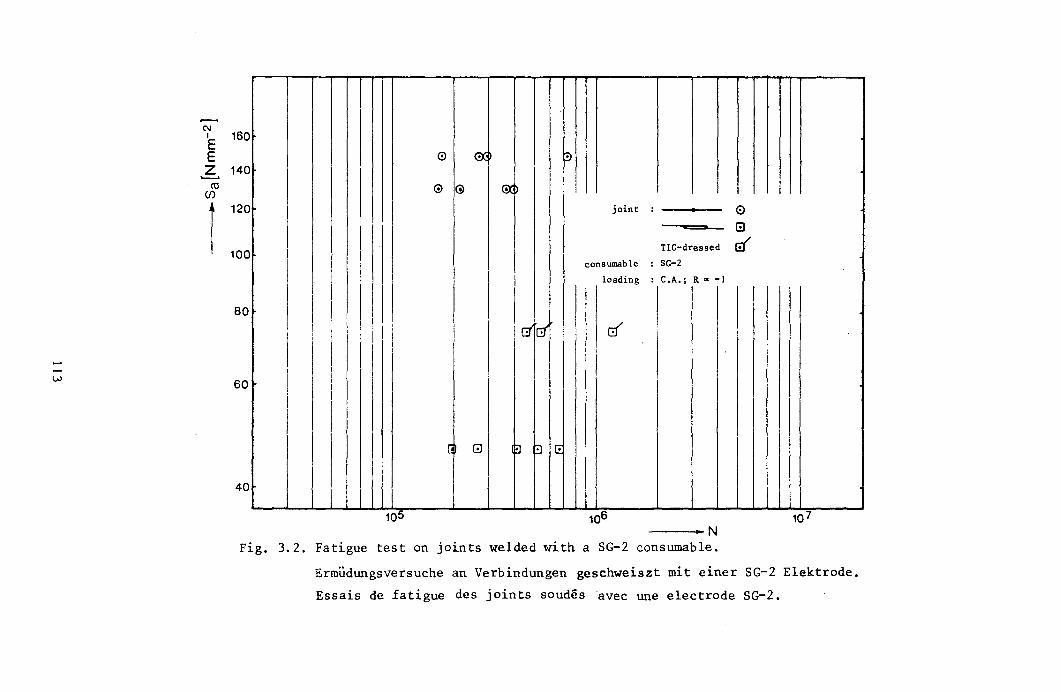
C\I I
E E Z ~
(IJ (j)
1
160
0 0:: ~I 0 0 GX! I
140
120 joint : • 0 8
100 I TIG-dressed r:f
I I
consumable : S(}-2 ,
I I i loading :C.A.;R--l
I I III , I II I I I ! ' I I i \
I iii ,
!c:r' rc:f if I I I I I I' I I
80
60 I I
G (!] ~ ~ t!:
40
10 10 10 6 10 7
----<·~N
Fig. 3.2. Fatigue test on joints welded with a SG-2 consumable.
Ermudungsversuche an Verbindungen geschweiszt mit einer SG-2 Elektrode.
Essais de fatigue des joints soudesavec une electrode SG-2.
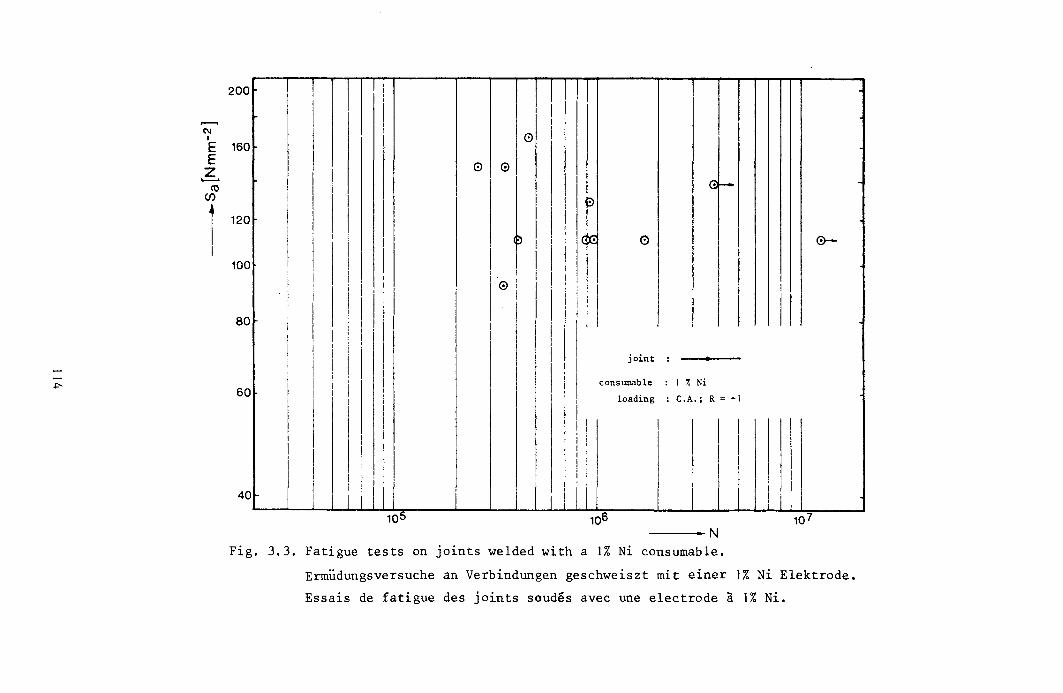
C\I I
E E Z ~
<U (f)
1
200
160
I I I
I II I I I
I 01 !
0 <:>
I I G: -120
100
80
i
i ~
I I I I
~ I I'~
0 0-I I I I I
I 1 : II i ! I i i <:>
I I , I
I I II j I I 1
i I I I !
III i joint : •
I I I consumable : 1 % Ni I I I
I I I
I I loading :C.A.;R=-l
I I I
I ! I I I I
I ! . I I I :
I I i I I I t I I I !
60
40
--_a N
Fig. 3.3. Fatigue tests on joints welded with a 1% Ni consumable.
Ermudungsversuche an Verbindungen geschweiszt mit einer 1% Ni Elektrode.
Essais de fatigue des joints soudes avec une electrode a 1% Ni.
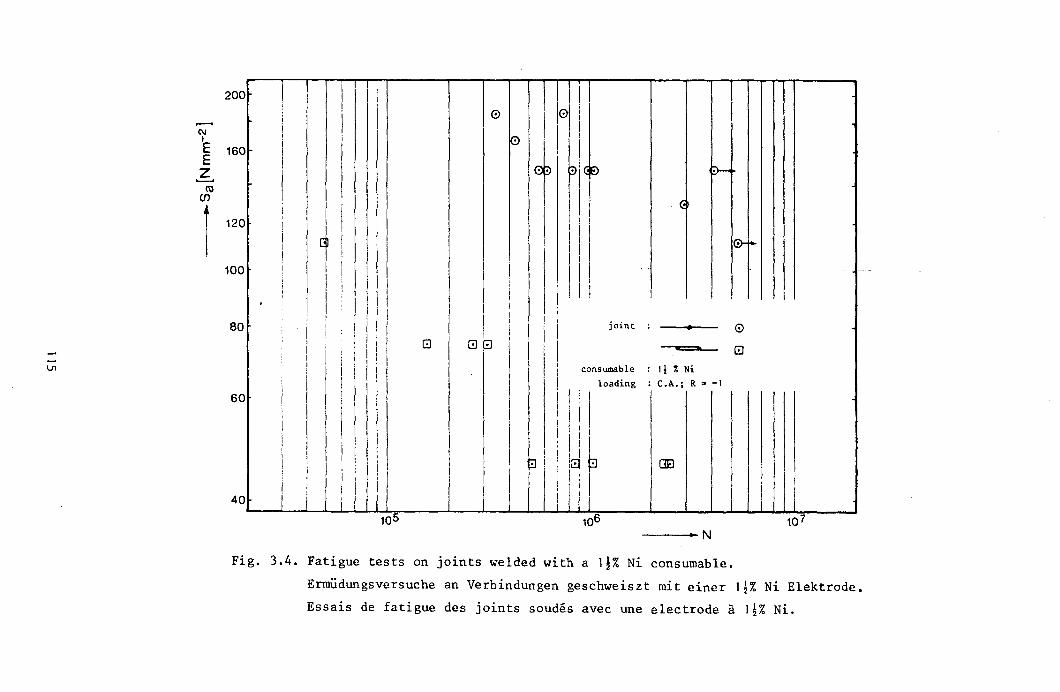
N I
E E
6 «l
CJ)
1
200 1 !
i
160
120
100
80
60
o
I I I I i
I
joint : •
consumable
loading
! i I
III
: Ii % Ni :C.A.;R~-I
o EJ
I I I I I I ,
40~-L_~i_L!i~i~~I'~i~ __ ~~I~~~~\_~ilw ij1ur~' ____ ~~ __ ~~~ui~I~I~ __ ~ 105 106 10 7
---.. N
Fig. 3.4. Fatigue tests on joints welded with a l~% Ni consumable.
Ermudungsversuche an Verbindungen geschweiszt mit einer l!% Ni Elektrode.
Essais de fatigue des joints soudes avec une electrode a l!% Ni.
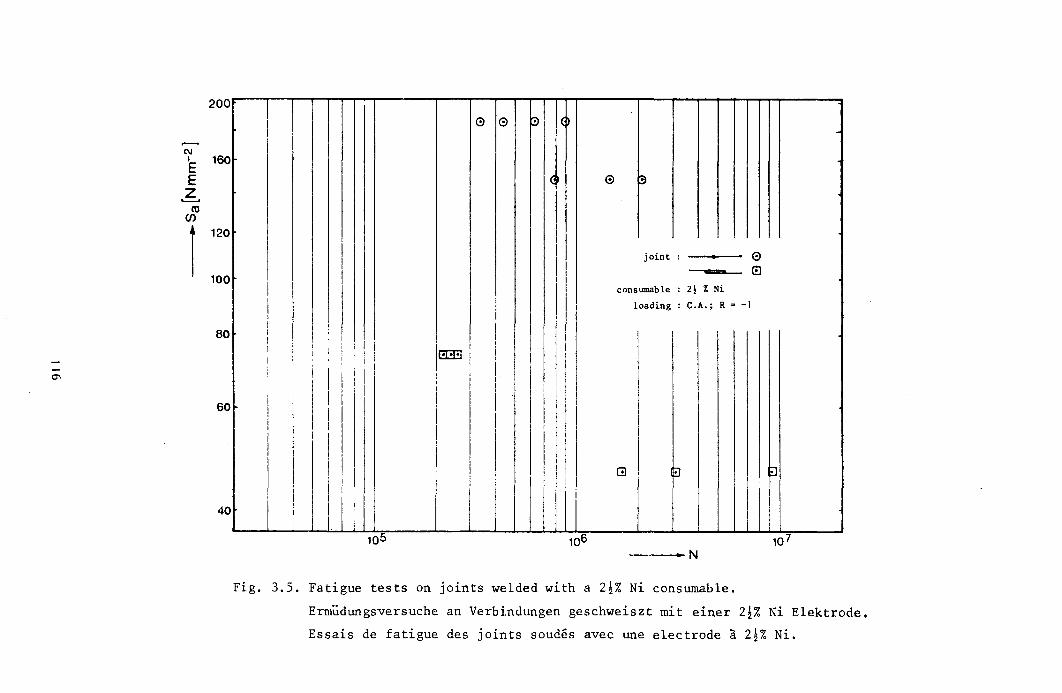
200
N I 160 E E
6 co
CJ)
1 120
100
80
60
40
I
i I
I
I
I
I I
: i ! ! [
i
I
I 833 !
I
o 0 ~ll~
I
I I I II I
Iii i i [ I
I I
II , I I I ; i I
joint :
consumable : 2\ % Ni
loading: C.A.; R ~ -J
I I
i ~
I I ----. N
Fig. 3.5. Fatigue tests on joints welded with a 24% Ni consumable.
Ermudungsversuche an Verbindungen geschweiszt mit einer 2!% Ni Elektrode.
Essais de fatigue des joints soudes avec une electrode a 2!% Ni.
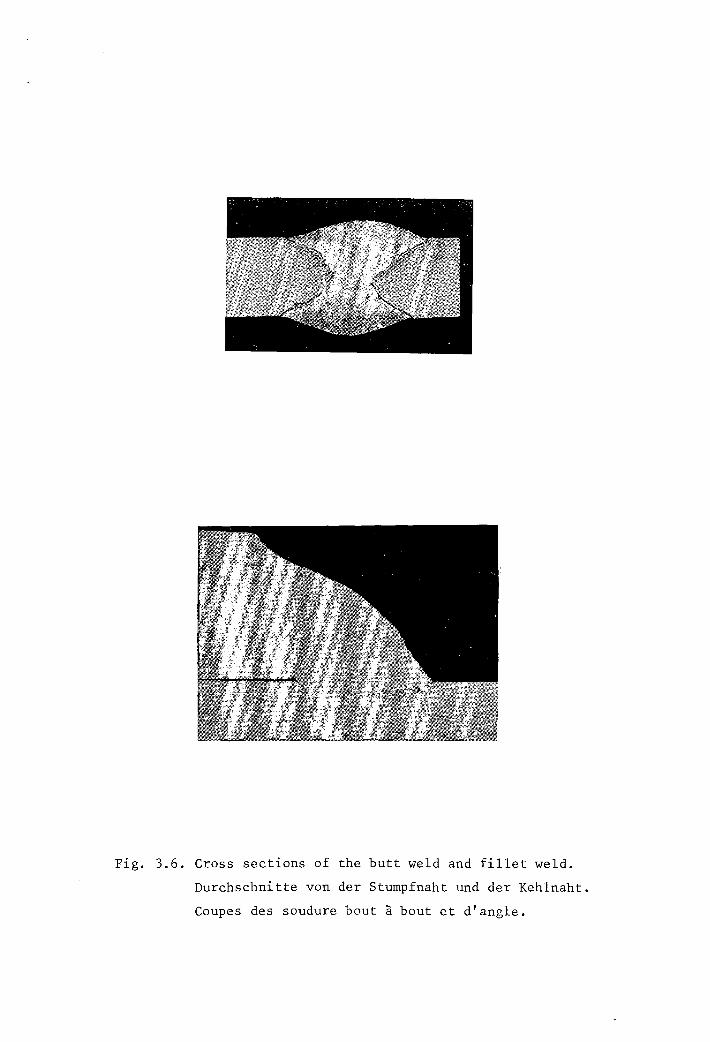
Fig. 3.6. Cross sections of the butt weld and fillet weld.
Durchschnitte von der Stumpfnaht und der Kehlnaht.
Coupes des soudure bout a bout et d'angle.
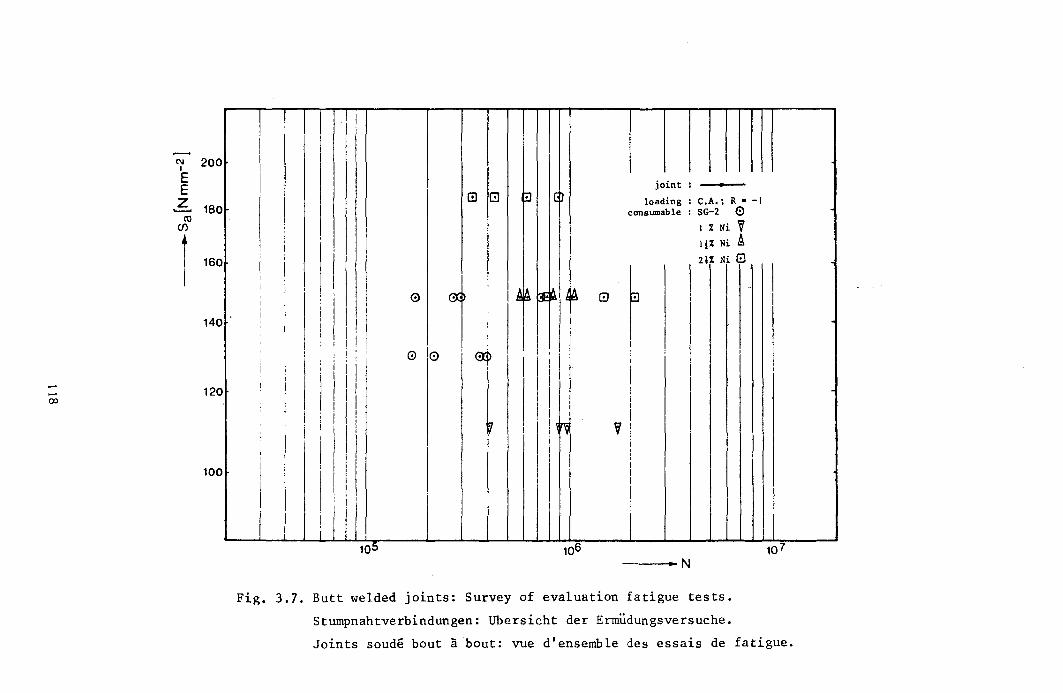
1 i ;
N 200 I
joint : • G G !l (!) loading: C.A.; R·-l
consumable : SG-2 0 1 % Ni VI
E E Z 180 .........
CO C/)
120
, q% Ni A
I 2\% Ni 8
I
i I
r , ,
A~ -A ,
I I 0 I :i! ~I L: 8 I
I I
i I
I i I I I 1 I I I
I
, o 10 ~ :
I j I I i
II I
j
, I
III II I I I i I, I !
~ j ! ~r~ iii I 'V
I
I I I
1 160
140
I
I 100
I : I I
I I I j j
---·~N
Fig. 3.7. Butt welded joints: Survey of evaluation fatigue tests.
Stumpnahtverbindungen: Ubersicht der Ermudungsversuche.
Joints soude bout about: vue d'ensemble des essais de fatigue.
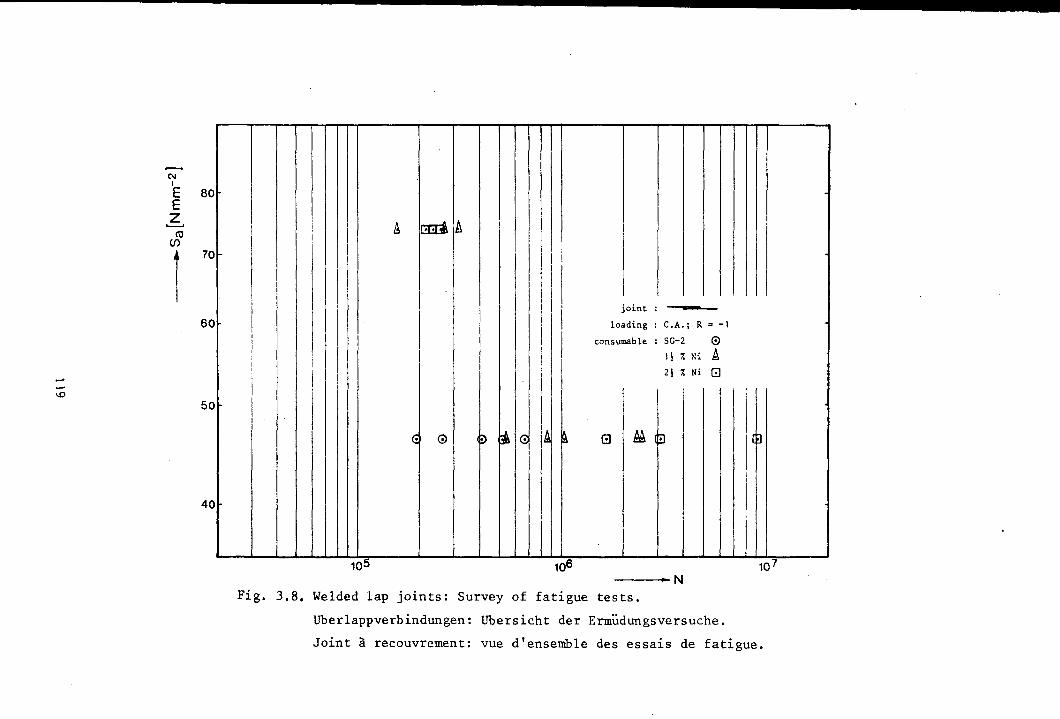
C\I I
E E Z ...........
til Cf)
1
80
70
60
50
40
! A mA ,
I I I
I i
I I I
I I
I
I i
I I joint :
I I
loading : C .A.; R = -I
I I I cons umab le : SG-2 0 I
i I I! 7. Ni It. I I
I I I I 21 % Ni (!]
I
<! (!) ~ [A c3 ~ ~ G M ~ (~
,5 10 10 6 10
----- N Fig. 3.B. Welded lap joints: Survey of fatigue tests.
Uberlappverbindungen: Ubersicht der Ermudungsversuche.
Joint a recouvrement: vue d'ensemble des essais de fatigue.
7
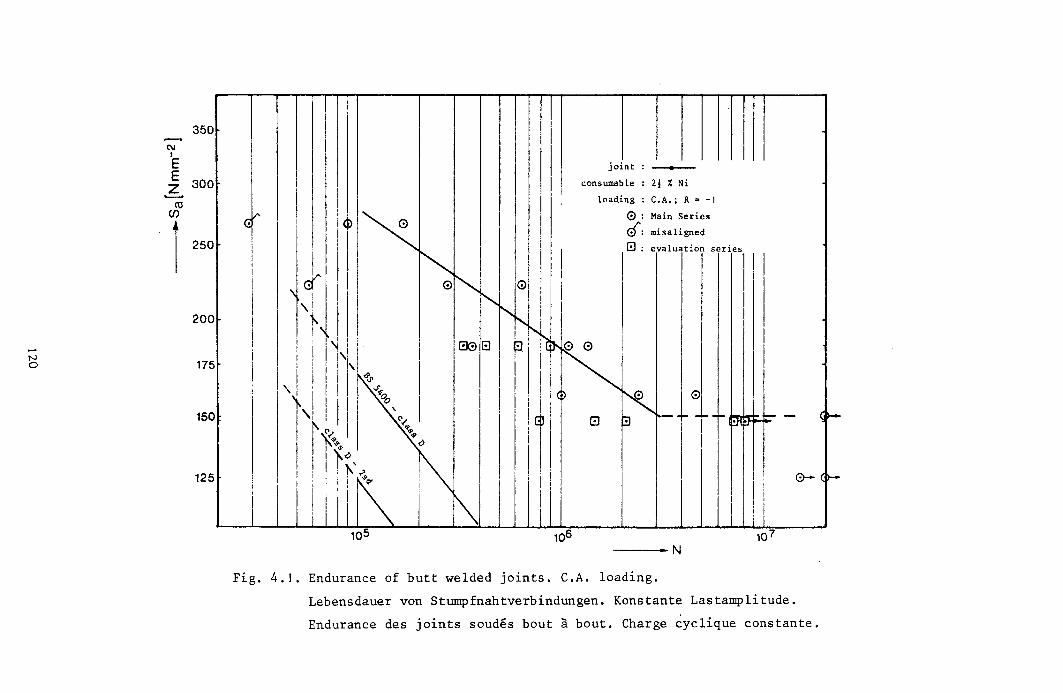
-N o
C\j I
350
E E 6 300 ro
CJ)
r 250
200
175
150
125
I
~
, i
i
joint: _ .... _
consumable : 21 % Ni
loaqing : C.A.; R ~ -1
~ : Main Series
d': misaligned
G : evaluation series
--_0 N
Fig. 4.1. Endurance of butt welded joints. C.A. loading.
Lebensdauer von Stumpfnahtverbindungen. Konstante Lastamplitude.
Endurance des joints soudes bout a bout. Charge ~yclique constante.
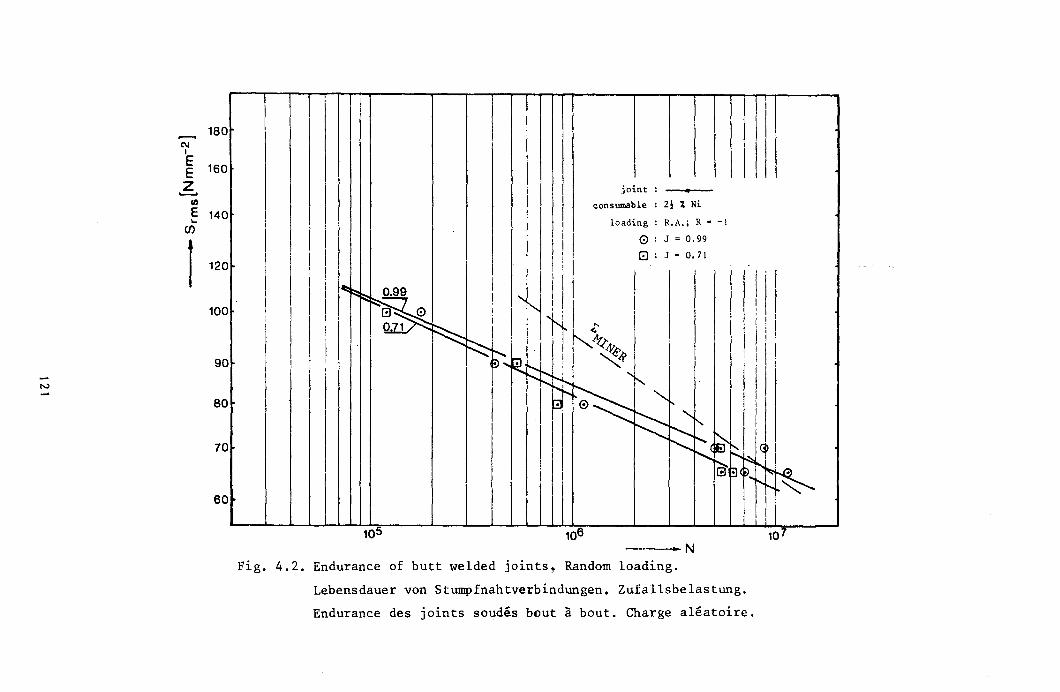
180 C\I I
E 160 E
6 III
E 140 '-
C/)
I 120
100
90
N
80
70
60
joint : •
consumable : 21 % Ni
loading: R.A.; R = -I
o : J = 0.99
! i I 8 : J z 0.71
, 1 I
I I i
I i I ! i
I I I i
---·N Fig. 4.2. Endurance of butt welded joints~ Random loading.
Lebensdauer von Stumpfnahtverbindungen. Zufallsbelastung.
Endurance des joints soudes bout a bout. Charge aleatoire.

tv tv
(\j I
E E Z ~
ro (J)
1
120
100
90
80
70
60
50
40
0-Q)
CO 200 Cf)
175 1 I
I 150 !
125
100
1 ! I
8'\ I ~. I CB:X:>\
II I . , iii I
r~J's
~ ru-~
G
C'e;
""I
1
joint: ~
consumable : 2! % Ni
loading: C.A.; R.-I
GJ : Main Series
~ : evaluation series
---·-N Fig. 4.3. Endurance of welded lap joints. C.A. loading.
Lebensdauer von geschweiszten Uberlappverbindungen. Konstante Lastamplitude.
Endurance des joints a recouvrement soudes. Charge cyclique constante.
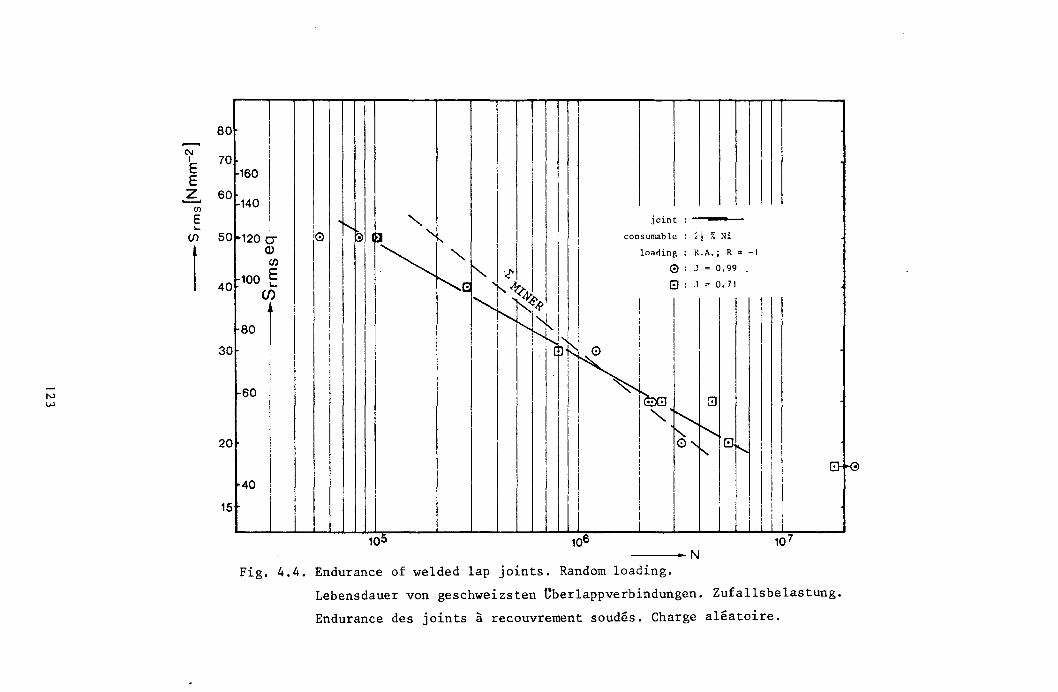
C\I I
E E Z ~
(/)
E .... (j)
I
80
70 160
60 140
50 1200-(l)
rn 100 E
40 ~ (/)
30 80 1 I
20
15
I ~
60 I
I
40 I
I
j 0 in t : ---._"""-"
consumable : il % Ni
loading: R.A.; R = -I
o : J = 0.99
0: .! = 0.71
I I i i
---·~N
Fig. 4.4. Endurance of welded lap joints. Random loading.
Lebensdauer von geschweizsten Uberlappverbindungen. Zufallsbelastung.
Endurance des joints a recouvrement soudes. Charge aleatoire.
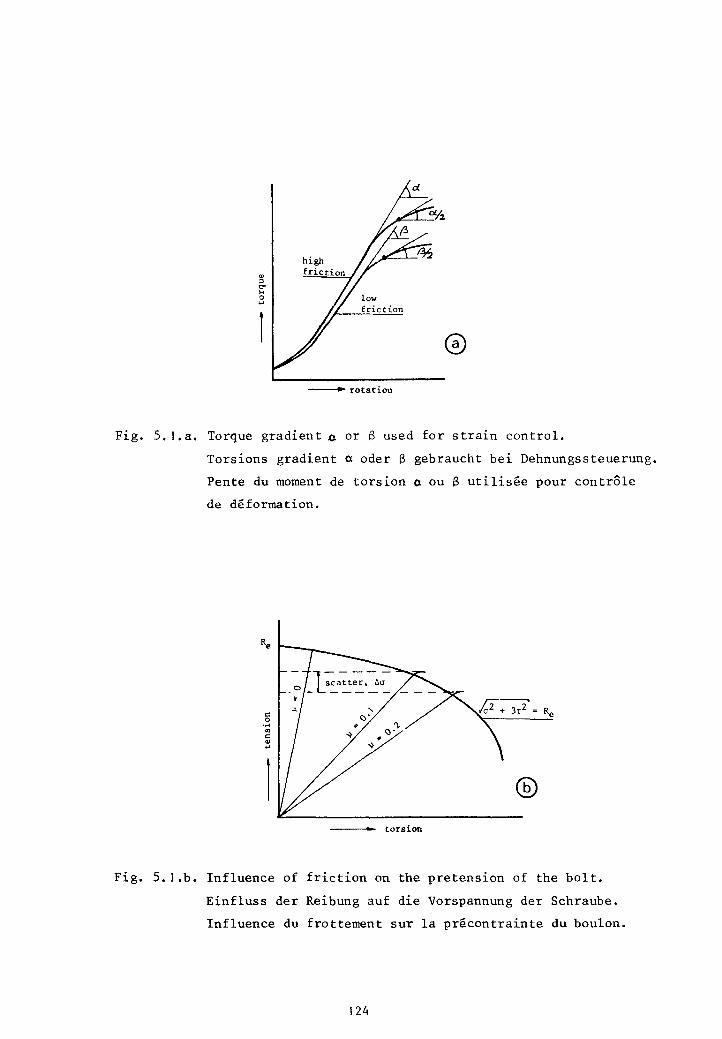
Q) :l C' ... o ...
1
-rotation
Fig. 5.I.a. Torque gradient 0 or B used for strain control.
Torsions gradient a oder B gebraucht bei Dehnungssteuerung.
Pente du moment de torsion 0 ou B utilisee pour contrale
de deformation.
--_ ... - torsion
Fig. 5. I.b. Influence of friction on the pretension of the bolt.
Einfluss der Reibung auf die Vorspannung der Schraube.
Influence du frottement sur la precontrainte du boulon.
124
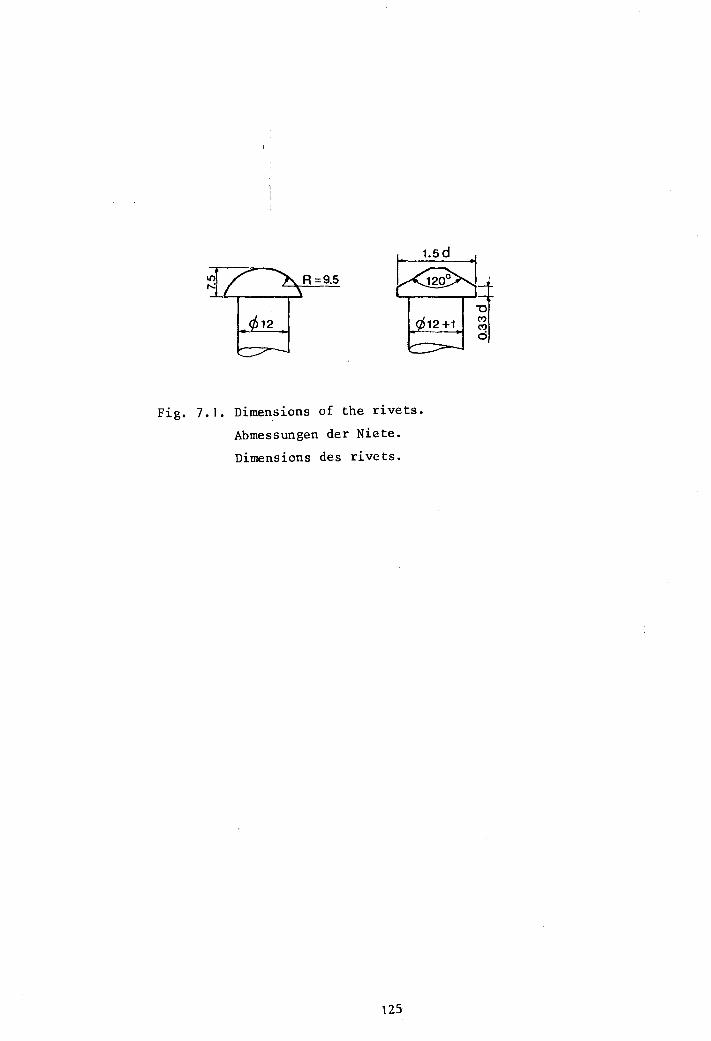
R=9.5
¢12+1
Fig. 7.1. Dimensions of the rivets.
Abmessungen der Niete.
Dimensions des rivets.
\25
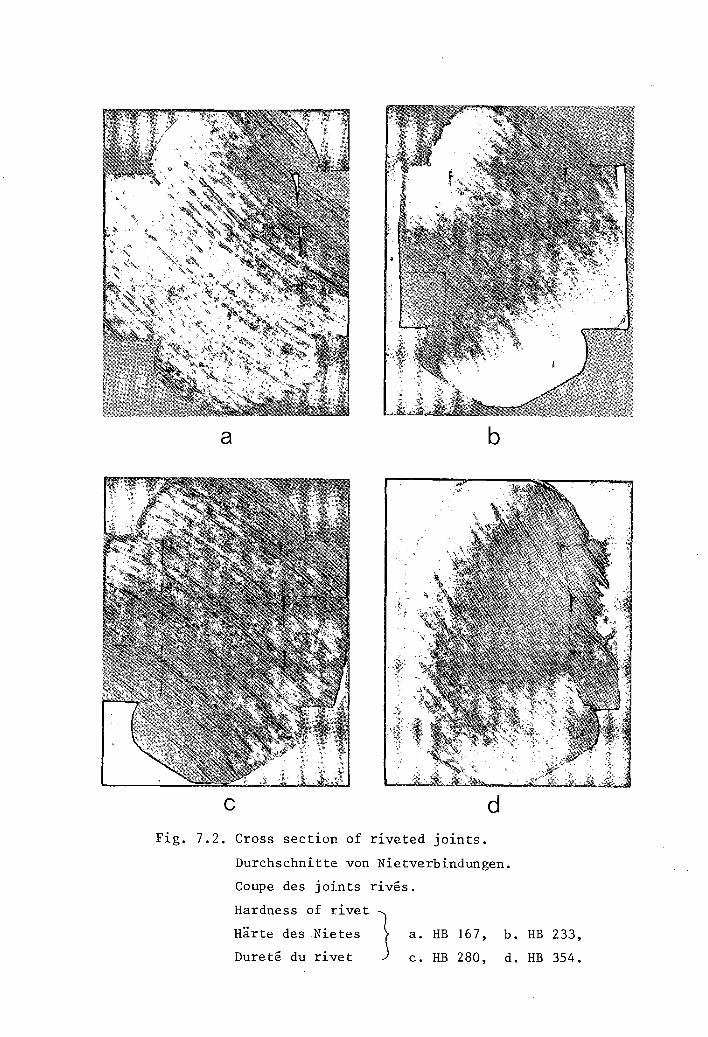
a b
c d Fig. 7.2. Cross section of riveted joints.
Durchschnitte von Nietverbindungen.
Coupe des joints rives.
Hardness of rivet J Harte des Nietes
Durete du rivet
a. HB 167, b. HB 233,
c. HB 280, d. HB 354.
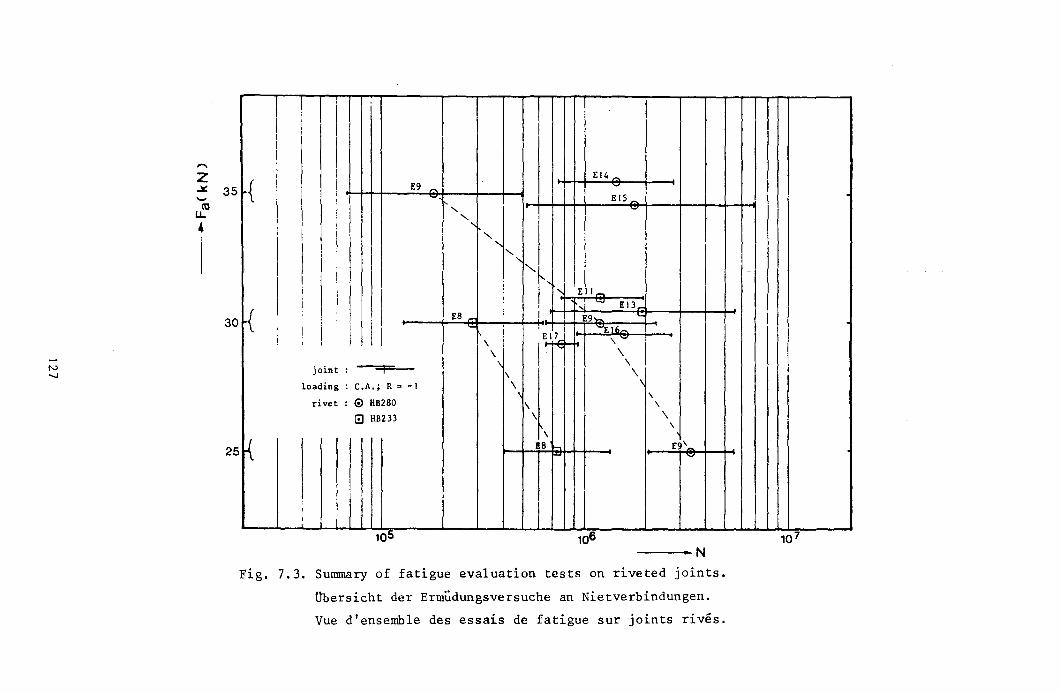
z ~ 35 ..... m
u.
1
30
25
1 I , i I I
I I I
I EI4 _
{ I I E9 ~ '" I
i
I ..., EI5 ,
'~" "<:7
1 -....., I
! I
I I 1
I
I
" I ! " " i EII_
! I , =
-{ , EI3_
I E8 ,.,. I E9 __ '-
i I I II ~ i ""E 16~ I I \ i E~~ it \ , I : I
\ \
joint -I \ \ :
\ \ loading : C.A.; R Q-I \ , rivet : ® 8B280 \ \
G 8B233 \ \ , \
{ I £8 h E9' t"" ~
I I 11 I
---· ... N
Fig. 7.3. Summary of fatigue evaluation tests on riveted joints.
Ubersicht der Ermudungsversuche an Nietverbindungen.
Vue d'ensemble des essais de fatigue sur joints rives.
-
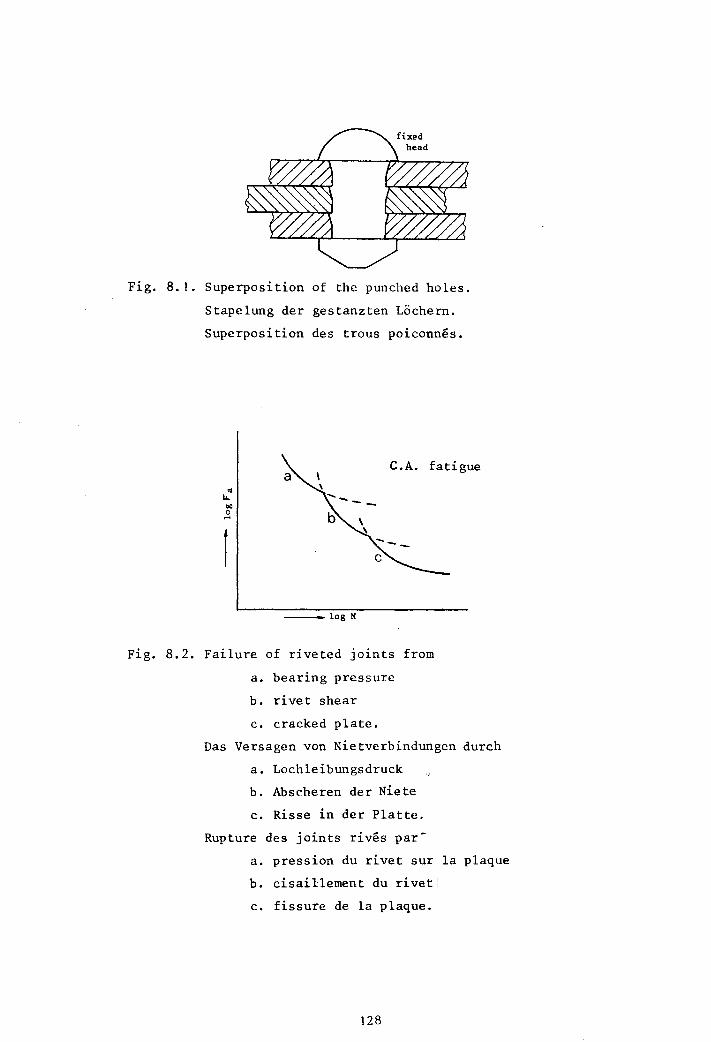
Fig. 8. I. Superposition of the punched holes.
Stapelung der gestanzten Lochern.
Superposition des trous poiconnes.
.. IL 00 o ....
C.A. fatigue
.. log N
Fig. 8.2. Failure of riveted joints from
a. bearing pressure
b. rivet shear
c. cracked plate.
Das Versagen von Nietverbindungen durch
a. Lochleibungsdruck
b. Abscheren der Niete
c. Risse in der Platte.
Rupture des joints rives par-
a. pression du rivet sur la plaque
b. cisaillement du rivet:
c. fissure de la plaque.
128
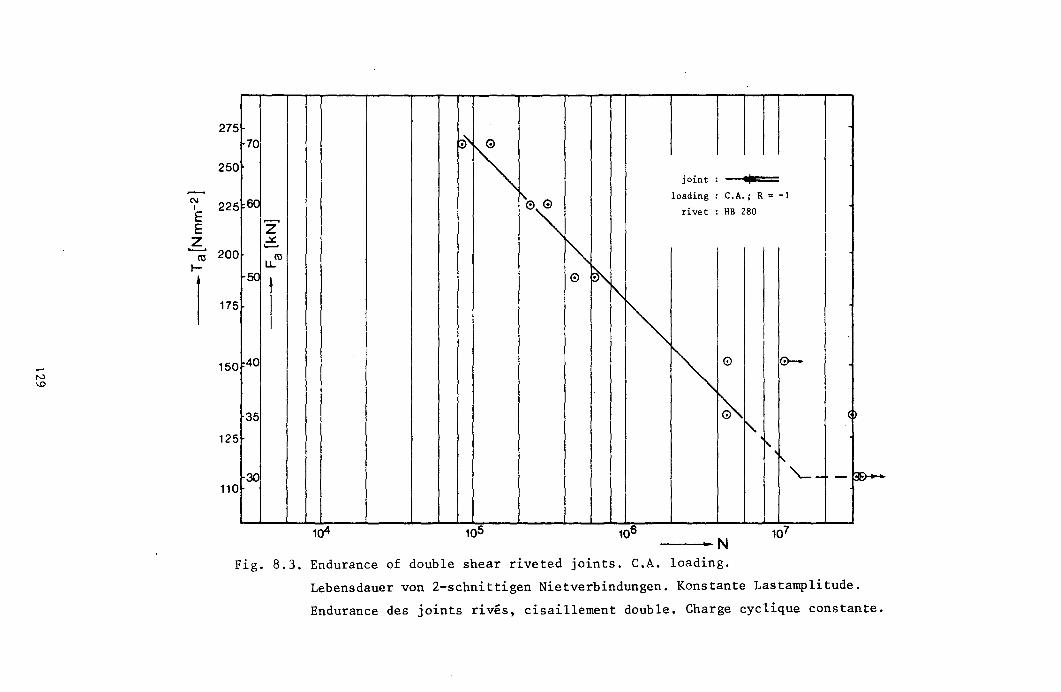
N I
E E Z ...........
ro l-
I N
'"
70 ~,
~ joint : I
60 '. loading : C.A.; R = -I
0~ rivet: HB 280
Z .::t:.
~ .......
ro l.L
~ .5C
1
0 ~
~
275
250
225
200
175
~ 40 0 0-
~ 35 ~
"-
150
125 I' I'
30 '--- -~ 110
-----o .. -N Fig. 8.3. Endurance of double shear riveted joints. C.A. loading.
Lebensdauer von 2-schnittigen Nietverbindungen. Konstante Lastamplitude.
Endurance des joints rives, cisaillement double. Charge cyclique constante.
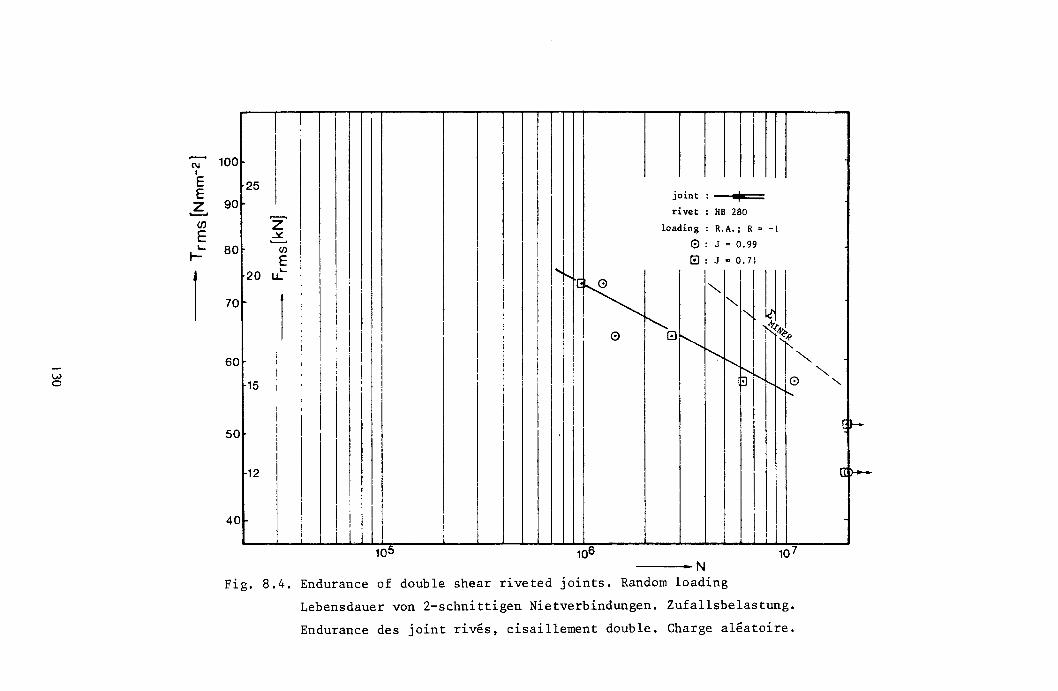
w o
N I
E E Z -.... (/J
E ~ .....
1
100
90
80
70
60
50
40
25
I I
I
en E
20 l.L~
15
12
I
I I I
I
I
Ii
joint : I rivet: HB 280
loading: R.A.; R = -I
o : J = 0.99
0:J~0.71
T'G,~ I"" ~ U I I "'-. +
i II 0 0""--...,." i 1" II ~'~,~ ",
il ,
I i
-----N Fig. 8.4. Endurance of double shear riveted joints. Random loading
Lebensdauer von 2-schnittigen Nietverbindungen. Zufallsbelastung.
Endurance des joint rives, cisaillement double. Charge aleatoire.
~r
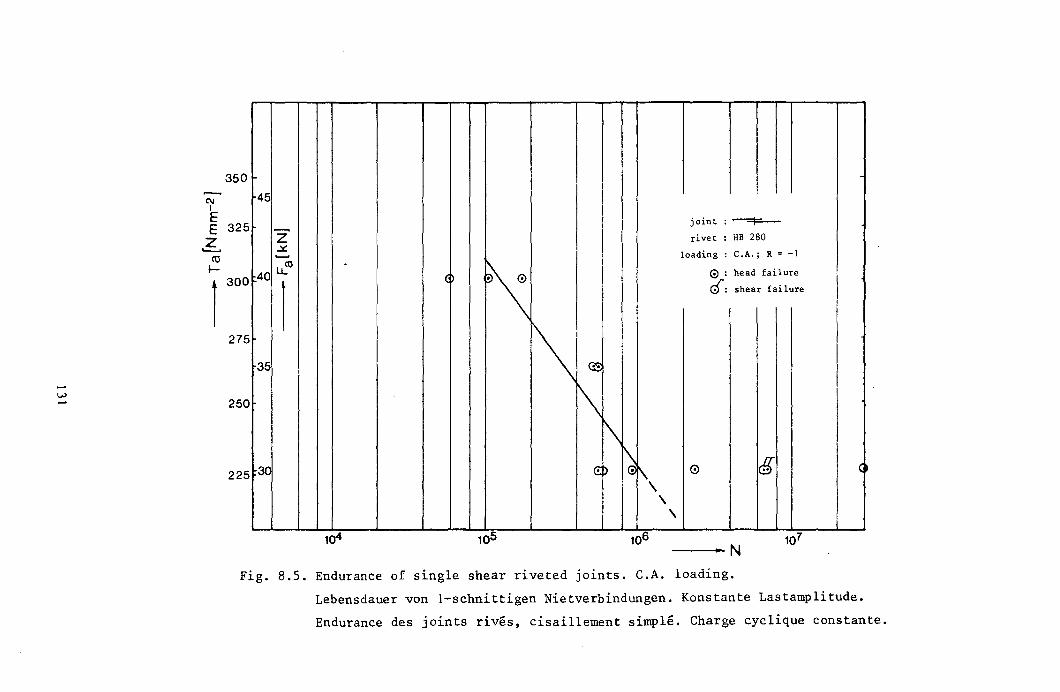
C\j I
E
350
E 325 Z ~
CO t-
roo 275
250
225
45
Z .::t: ........
40 l.L CO
(
~ 35 \ 3C
104
joint : I rivet : HB 280
loading: C.A.; R = -I
o : head failure
~: shear failure
I I I
m
i\ \
<!:D ~ ~\ 0 g (
\ \
-----0 .. _ N
Fig. 8.5. Endurance of single shear riveted joints. C.A. loading.
Lebensdauer von I-schnittigen Nietverbindungen. Konstante Lastamplitude.
Endurance des joints rives, cisaillement simple. Charge cyclique constante.
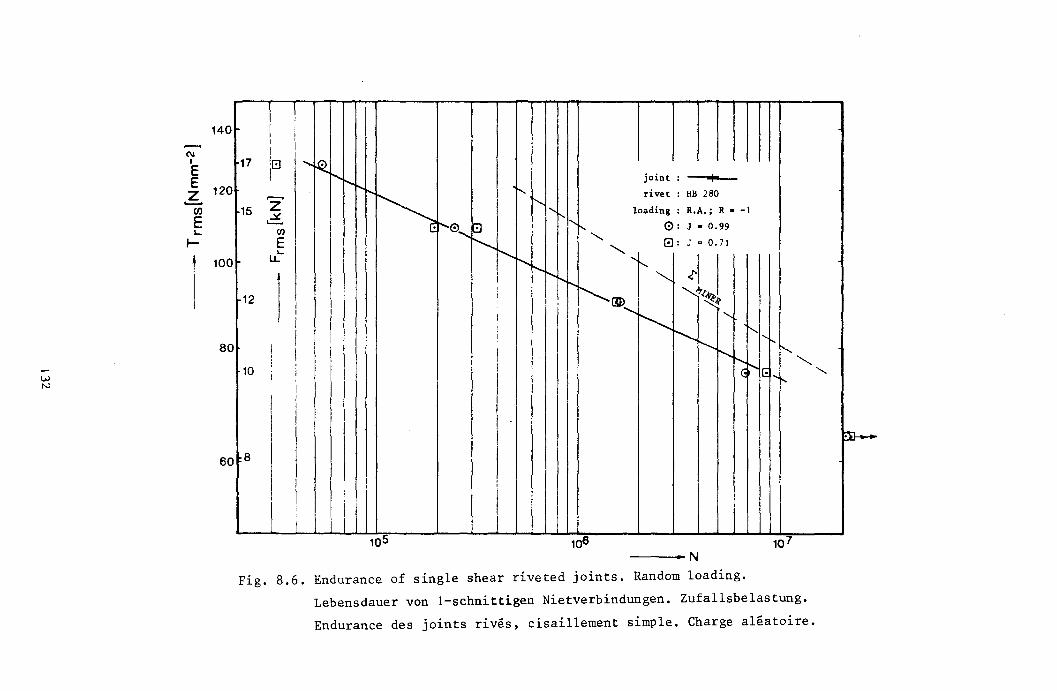
140
C\I I
E E 120 Z ~
en E ....
I-
100
80
60
I 1 i I I I 17 'G ...... ~ I ............ join t : I
........ .... 1'--
0 i'- rivet: HB 280
15 Z r-.-.. , ~
~I r"1' loading: R.A.; R. -I
'---' "0 ....... (f) r--, 0: J - 0.99
E I i'-.....r-...,
G: J = 0.71 ... '-...., LL r.....~ ~I I
i'-r--"-
" I
1'-- ............... , ,
"r.f~<l' 12 i j I I [ID ........
I I
I ............... " ,
i i r..........:-....... t'--..
I'
\ i I I r--.... ....... I
I r..... '-.... 10 i I , I <! t--.. I
I I ', ... , I
I i I I I I i
8
i
I I , , I
10 5 ----.. N
Fig. 8.6. Endurance of single shear riveted joints. Random loading.
Lebensdauer von I-schnittigen Nietverbindungen. Zufallsbelastung.
Endurance des joints rives, cisaillement simple. Charge aleatoire.
"-
t:»--
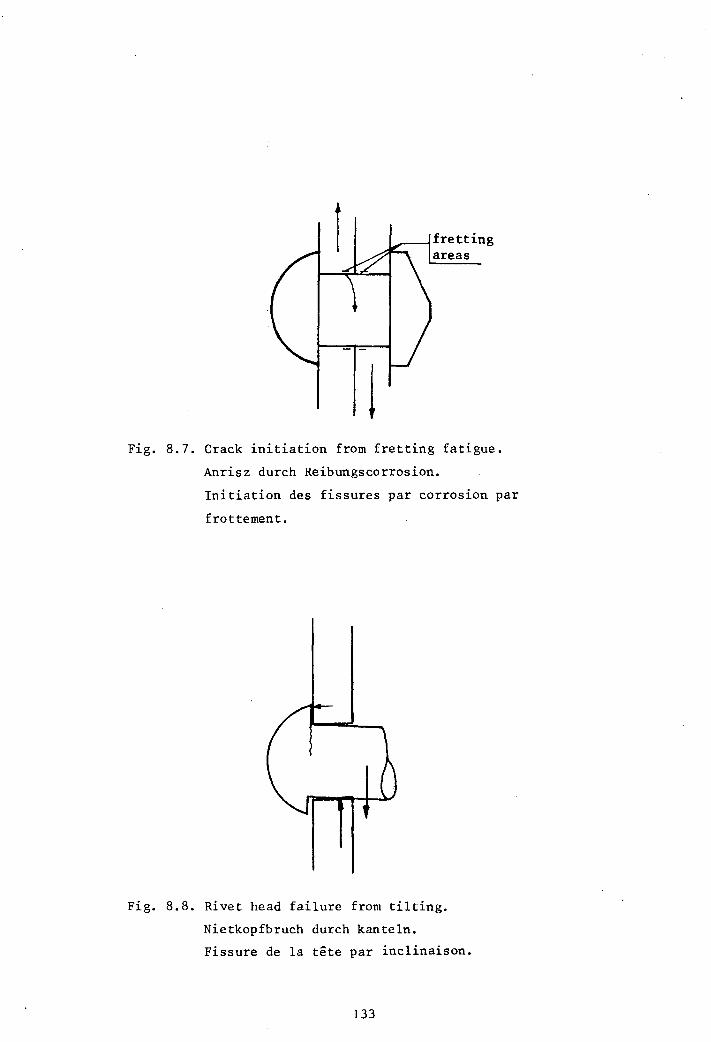
........ _---, fretting areas
Fig. 8.7. Crack initiation from fretting fatigue.
Anrisz durch Reibungscorrosion.
Initiation des fissures par corrosion par
frottement.
Fig. 8.8. Rivet head failure from tilting.
Nietkopfbruch durch kante1n.
Fissure de 1a tete par inc1inaison.
133
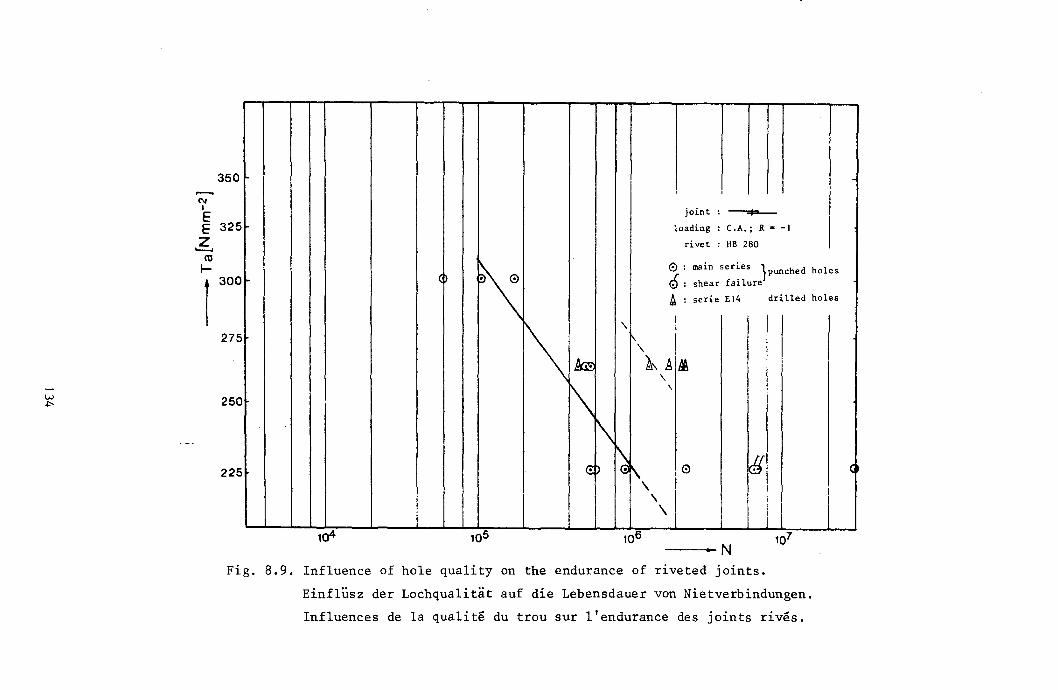
350
joint : I loading : C.A.; R· -I
rivet : HB 280
(P
~ o : main series JPunched holes o : shear failure
A : serie E 14 drilled holes
I I
!\ ,
I
r'-, I ~ A\ Ai!i\ ,
275
1\ \
250
225 <!:
\ ) ~ 1\, 0 8 <i
\ \
104 ---·-N
Fig. 8.9. Influence of hole quality on the endurance of riveted joints.
Einflusz der Lochqualitat auf die Lebensdauer von Nietverbindungen.
Influences de la qualite du trou sur l'endurance des joints rives.