The Fast Radio Burst FRB 20201124A in a star forming ...
11
Astronomy & Astrophysics manuscript no. main ©ESO 2021 November 12, 2021 Letter to the Editor The Fast Radio Burst FRB 20201124A in a star forming region: constraints to the progenitor and multiwavelength counterparts L. Piro 1 , G. Bruni 1 , E. Troja 2, 3 , B. O’Connor 2, 3, 4, 5 , F. Panessa 1 , R. Ricci 6, 7 , B. Zhang 8 , M. Burgay 9 , S. Dichiara 2, 3 , K. J. Lee 10 , S. Lotti 1 , J. R. Niu 11 , M. Pilia 9 , A. Possenti 9, 12 , M. Trudu 9, 12 , H. Xu 10 , W. W. Zhu 11 , A. S. Kutyrev 2, 3 , and S. Veilleux 2 1 INAF – Istituto di Astrofisica e Planetologia Spaziali, via Fosso del Cavaliere 100, 00133 Rome, Italy e-mail: [email protected] 2 Department of Astronomy, University of Maryland, College Park, MD 20742-4111, USA 3 Astrophysics Science Division, NASA Goddard Space Flight Center, 8800 Greenbelt Rd, Greenbelt, MD 20771, USA 4 Department of Physics, The George Washington University, 725 21st Street NW, Washington, DC 20052, USA 5 Astronomy, Physics, and Statistics Institute of Sciences (APSIS), The George Washington University, Washington, DC 20052, USA 6 INAF – Istituto di Radioastronomia, Via Gobetti 101, I-40129, Bologna, Italy 7 Istituto Nazionale di Ricerca Metrologica (INRiM) - Strada delle Cacce 91, I-10135 Torino, Italy 8 Department of Physics and Astronomy, University of Nevada, 89154, Las Vegas, NV, USA 9 INAF – Osservatorio Astronomico di Cagliari, via della Scienza 5, I-09047 Selargius (CA), Italy 10 Kavli Institute for Astronomy and Astrophysics, Peking University, Beijing 100871, China 11 National Astronomical Observatories, Chinese Academy of Sciences, Beijing 100012, China 12 Department of Physics, Università di Cagliari, S.P. Monserrato-Sestu km 0,700, I-09042 Monserrato (CA), Italy Received; accepted: ABSTRACT We present the results of a multiwavelength campaign of FRB 20201124A, the third closest repeating fast radio burst recently localized in a nearby (z = 0.0978) galaxy. Deep VLA observations led to the detection of quiescent radio emission, also marginally visible in X-rays with Chandra. Imaging at 22 GHz allowed us to resolve the source on a scale of & 1 00 and locate it at the position of the FRB, within an error of 0.2 00 . EVN and e-MERLIN observations sampled small angular scales, from 2 to 100 mas, providing tight upper limits on the presence of a compact source and evidence for diffuse radio emission. We argue that this emission is associated with enhanced star formation activity in the proximity of the FRB, corresponding to a star formation rate of ≈ 10 M yr -1 . The surface star formation rate at the location of FRB 20201124A is two orders of magnitude larger than typically observed in other precisely localized FRBs. Such a high SFR is indicative of this FRB source being a new-born magnetar produced from a SN explosion of a massive star progenitor. Upper limits to the X-ray counterparts of 49 radio bursts observed in our simultaneous FAST, SRT and Chandra campaign are consistent with a magnetar scenario. Key words. Stars: magnetars – Radio continuum: galaxies – Galaxies: star formation – X-rays: galaxies – X-rays: bursts 1. Introduction Fast radio bursts (FRB) are bright radio flashes of ms duration (Lorimer et al. 2007; Petroff et al. 2019; Cordes & Chatter- jee 2019), located at cosmological distances. Hundreds of these events have now been discovered (The CHIME/FRB Collabora- tion et al. 2021), yet their progenitor systems remain unknown. A leading candidate source is a highly magnetized neutron star (NS), known as magnetar (Popov & Postnov 2010; Katz 2016; Metzger et al. 2017; Beloborodov 2017; Kumar et al. 2017; Wa- diasingh & Timokhin 2019; Lyubarsky 2021; Yang & Zhang 2021), as supported by the recent detection of FRB-like radio bursts from a soft gamma-ray repeater in our galaxy (Scholz & Chime/Frb Collaboration 2020; Bochenek et al. 2020; Li et al. 2021; Mereghetti et al. 2020). However, the heterogeneous envi- ronment of FRBs and their empirical distinction in two classes (repeaters and non-repeaters) leave the door open to multiple progenitor channels (Zhang 2020). Accurate and rapid localizations of FRBs are key to trigger multiwavelength follow-up observations, which provide vital in- formation on the FRB host galaxy, its distance scale, the broad band spectrum of the burst and the presence on any quiescent emission associated to the flaring source. However, FRBs span a wide range of distances, and the majority are too far to place any meaningful constraints on persistent emission or associated X-ray bursts. Therefore, we organized a follow-up program to focus on the closest events (z . 0.1) localized to an accuracy of at least . 10 00 . Starting from March 21, 2021 the repeating source FRB 20201124A was reported to be in an active state (Chime/Frb Collabortion 2021; Kumar et al. 2021), with con- tinued activity over the next few months. We initiated our mul- tiwavelength campaign soon after the FRB localization and the unambiguous identification of its host galaxy (Day et al. 2021a; Law et al. 2021; Wharton et al. 2021b) that, at a redshift z ∼ 0.098 (Kilpatrick et al. 2021), meets our selection criteria. Article number, page 1 of 11 arXiv:2107.14339v2 [astro-ph.HE] 11 Nov 2021
Transcript of The Fast Radio Burst FRB 20201124A in a star forming ...

Astronomy & Astrophysics manuscript no. main ©ESO 2021November 12, 2021
Letter to the Editor
The Fast Radio Burst FRB 20201124A in a star forming region:constraints to the progenitor and multiwavelength counterparts
L. Piro1, G. Bruni1, E. Troja2, 3, B. O’Connor2, 3, 4, 5, F. Panessa1, R. Ricci6, 7, B. Zhang8, M. Burgay9, S. Dichiara2, 3, K.J. Lee10, S. Lotti1, J. R. Niu11, M. Pilia9, A. Possenti9, 12, M. Trudu9, 12, H. Xu10, W. W. Zhu11, A. S. Kutyrev2, 3, and S.
Veilleux2
1 INAF – Istituto di Astrofisica e Planetologia Spaziali, via Fosso del Cavaliere 100, 00133 Rome, Italye-mail: [email protected]
2 Department of Astronomy, University of Maryland, College Park, MD 20742-4111, USA3 Astrophysics Science Division, NASA Goddard Space Flight Center, 8800 Greenbelt Rd, Greenbelt, MD 20771, USA4 Department of Physics, The George Washington University, 725 21st Street NW, Washington, DC 20052, USA5 Astronomy, Physics, and Statistics Institute of Sciences (APSIS), The George Washington University, Washington, DC 20052,
USA6 INAF – Istituto di Radioastronomia, Via Gobetti 101, I-40129, Bologna, Italy7 Istituto Nazionale di Ricerca Metrologica (INRiM) - Strada delle Cacce 91, I-10135 Torino, Italy8 Department of Physics and Astronomy, University of Nevada, 89154, Las Vegas, NV, USA9 INAF – Osservatorio Astronomico di Cagliari, via della Scienza 5, I-09047 Selargius (CA), Italy
10 Kavli Institute for Astronomy and Astrophysics, Peking University, Beijing 100871, China11 National Astronomical Observatories, Chinese Academy of Sciences, Beijing 100012, China12 Department of Physics, Università di Cagliari, S.P. Monserrato-Sestu km 0,700, I-09042 Monserrato (CA), Italy
Received; accepted:
ABSTRACT
We present the results of a multiwavelength campaign of FRB 20201124A, the third closest repeating fast radio burst recently localizedin a nearby (z = 0.0978) galaxy. Deep VLA observations led to the detection of quiescent radio emission, also marginally visible inX-rays with Chandra. Imaging at 22 GHz allowed us to resolve the source on a scale of & 1′′ and locate it at the position of the FRB,within an error of 0.2′′. EVN and e-MERLIN observations sampled small angular scales, from 2 to 100 mas, providing tight upperlimits on the presence of a compact source and evidence for diffuse radio emission. We argue that this emission is associated withenhanced star formation activity in the proximity of the FRB, corresponding to a star formation rate of ≈ 10 M�yr−1. The surface starformation rate at the location of FRB 20201124A is two orders of magnitude larger than typically observed in other precisely localizedFRBs. Such a high SFR is indicative of this FRB source being a new-born magnetar produced from a SN explosion of a massive starprogenitor. Upper limits to the X-ray counterparts of 49 radio bursts observed in our simultaneous FAST, SRT and Chandra campaignare consistent with a magnetar scenario.
Key words. Stars: magnetars – Radio continuum: galaxies – Galaxies: star formation – X-rays: galaxies – X-rays: bursts
1. Introduction
Fast radio bursts (FRB) are bright radio flashes of ms duration(Lorimer et al. 2007; Petroff et al. 2019; Cordes & Chatter-jee 2019), located at cosmological distances. Hundreds of theseevents have now been discovered (The CHIME/FRB Collabora-tion et al. 2021), yet their progenitor systems remain unknown.A leading candidate source is a highly magnetized neutron star(NS), known as magnetar (Popov & Postnov 2010; Katz 2016;Metzger et al. 2017; Beloborodov 2017; Kumar et al. 2017; Wa-diasingh & Timokhin 2019; Lyubarsky 2021; Yang & Zhang2021), as supported by the recent detection of FRB-like radiobursts from a soft gamma-ray repeater in our galaxy (Scholz &Chime/Frb Collaboration 2020; Bochenek et al. 2020; Li et al.2021; Mereghetti et al. 2020). However, the heterogeneous envi-ronment of FRBs and their empirical distinction in two classes(repeaters and non-repeaters) leave the door open to multipleprogenitor channels (Zhang 2020).
Accurate and rapid localizations of FRBs are key to triggermultiwavelength follow-up observations, which provide vital in-formation on the FRB host galaxy, its distance scale, the broadband spectrum of the burst and the presence on any quiescentemission associated to the flaring source. However, FRBs spana wide range of distances, and the majority are too far to placeany meaningful constraints on persistent emission or associatedX-ray bursts. Therefore, we organized a follow-up program tofocus on the closest events (z. 0.1) localized to an accuracy ofat least . 10′′.
Starting from March 21, 2021 the repeating sourceFRB 20201124A was reported to be in an active state(Chime/Frb Collabortion 2021; Kumar et al. 2021), with con-tinued activity over the next few months. We initiated our mul-tiwavelength campaign soon after the FRB localization andthe unambiguous identification of its host galaxy (Day et al.2021a; Law et al. 2021; Wharton et al. 2021b) that, at a redshiftz∼ 0.098 (Kilpatrick et al. 2021), meets our selection criteria.
Article number, page 1 of 11
arX
iv:2
107.
1433
9v2
[as
tro-
ph.H
E]
11
Nov
202
1

A&A proofs: manuscript no. main
In this paper we present (§2) the results of our multi-instrument observations of FRB 20201124A in radio with theVery Large Array (VLA), the European VLBI Network (EVN),the enhanced Multi Element Remotely Linked InterferometerNetwork (e-MERLIN), the Five-hundred-meter Aperture Spher-ical radio Array (FAST), the Sardinia Radio Telescope (SRT),the upgraded Giant Metrewave Radio Telescope (uGMRT), inX-ray with the Neil Gehrels’ Swift Observatory (Swift) and theChandra X-ray Observatory (CXO), and in the optical with theLowell Discovery Telescope (LDT). In §3 we present the detec-tion of a quiescent source associated to FRB 20201124A in radioand X-rays and discuss its origin. In §4 we discuss our results inthe context of the properties of the local and host galaxy environ-ments and their implications for the progenitors of FRBs, withparticular regard to the magnetar scenario. In §5 we present theresults of the simultaneous observation of FAST, SRT and Chan-dra, aimed at detecting X-ray counterparts of radio bursts, anddiscuss implications on the central engine. We summarize ourconclusions in §6.
2. Observations
2.1. Radio
We searched for a persistent radio source associated to the FRBwith the Jansky Very Large Array (JVLA). Observations werecarried out under program (SG9112; PI: Piro) at multiple fre-quencies between April 9 and June 22 (see Appendix A). A ra-dio source, consistent with the FRB position, was detected witha flux of (340 ± 30) µJy at 3 GHz (Ricci et al. (2021), see alsoWharton et al. (2021a); Ravi et al. (2021)). VLA monitoringof this source revealed that the radio emission is not variable,but persistent. However, the initial VLA D configuration did nothave the sufficient resolution to resolve its angular extent. There-fore, we imaged the field using various beam sizes with the EVN(≈ 2 mas), e-MERLIN (≈ 50 − 100 mas) and VLA (≈ 1′′). OurEVN and e-MERLIN campaigns (Appendix C) did not detectany compact source over angular scales ranging from 2 mas to60 mas. At the host redshift of z≈0.098, this corresponds to aprojected linear size from 3 to 110 pc, and implies that the per-sistent radio emission is extended with an angular size & 0.1′′, asalso independently reported by Marcote et al. (2021); Ravi et al.(2021).
High-frequency (22 GHz) VLA observations, carried out inC configuration, partially resolve the source at the scale of &1′′.As shown in Fig. 1, the centroid of the radio emission coincideswith the precise FRB position derived by EVN observations(Marcote et al. 2021) within our location accuracy of 0.2′′. Theradio source is elongated over ≈ 2′′ at a position angle of 140◦.Its centroid displays marginal evidence of an offset of 0.42′′ fromthe galaxy center, more evident when the peak of the radio emis-sion (5 sigma level) is considered. At the redshift of z=0.0978(see Appendix E), the offset of the radio source from the galaxycenter would correspond to 0.8 kpc and its extension to ≈ 3 kpc.
To extend the frequency coverage at low frequencies, we car-ried out uGMRT observations on July 21 and 24, 2021 (projectcode ddtC194; PI: Bruni), using the band-3 (260-500 MHz)and band-2 (125-250 MHz) receivers, respectively. We detectedthe source as an unresolved component with a flux density of1.7±0.2 mJy at 380 MHz. The summary of our radio observa-tions is in Tab.A.1.
2.2. Optical
Observations with the Ultra-Violet Optical Telescope (UVOT)on-board Swift were performed on April 6, 2021 (PI: Piro, TargetID: 14258) in u-band with a total exposure 9.9 ks. We utilized theuvotimsum task within HEASoft v. 6.27.2 to coadd multipleexposures, and extracted the photometry with the uvotsourcetool using a circular aperture of 3′′ radius. In the stacked image,we derive an upper limit u & 22.8 AB mag.
On April 21, 2021 we obtained optical spectroscopy of theputative host galaxy using the DeVeny spectrograph mounted onthe 4.3m Lowell Discovery Telescope (LDT) for a total expo-sure of 4×600 s. DeVeny was configured with the 300 g mm−1
grating and a 1.5′′slit width, covering the FRB location. Thespectrum covers wavelengths 3600 Å - 8000 Å at a dispersion of2.2 Å pix−1. The resulting spectrum, derived as described in Ap-pendix E, is displayed in Figure F.2. Emission lines (Tab.E.1), in-dicative of on-going star-formation, are detected at λobs ≈ 7207,7230, 7374, and 7391 Å which we associate to Hα, the [NII]doublet, and the [SII] doublet at a redshift z = 0.0978 ± 0.0002consistent with previous estimates (Ravi et al. 2021; Fong et al.2021).
2.3. X-ray
Observations with the Swift X-ray Telescope (XRT) were carriedout as part of the Swift Guest Investigator Program (PI: Piro).Data were collected in Photon Counting (PC) mode starting onApril 6, 2021 for a total of 9.9 ks exposure (Appendix B). Nosource was detected at the location of the FRB down to a 3 σupper limit < 1.3 × 10⁻³ cts s−1 (0.3-10 keV). We convert thisvalue into an unabsorbed flux < 1.0 × 10⁻¹³ erg cm−2 s−1 (0.3-10 keV) assuming an absorbed power-law with photon index Γ =2.0 and a Galactic hydrogen column density NH = 4.5 × 10²¹
cm−2 (Willingale et al. 2013).Deeper imaging of the field was carried out with the Chandra
X-ray Observatory (CXO) observations under Director’s Discre-tionary Time (DDT). The observations (ObsID: 25016; PI: Piro)occurred on April 20, 2021 for a total of 29.7 ks. Our analysis(Appendix B) was performed in the 0.5− 7 keV energy range. Ablind search with wavdetect did not find any source at the FRBposition, however a targeted search revealed a weak X-ray de-tection. We used a circular source region of 1′′radius centered atthe EVN position (Marcote et al. 2021) and, within this region,measured a total of 3 photons. We estimate a background levelof .0.25 cts from nearby source-free regions and a source sig-nificance of 99.7% (3 σ Gaussian equivalent; Kraft et al. 1991).
The observed 0.5-7.0 keV count-rate 1.0+0.7−0.6 × 10⁻⁴ cts s−1
is converted into flux using the same absorbed power-law modeldescribed above. For a photon index Γ = 2.0, the unabsorbedflux in the 2-10 keV band is FX = 1.3+0.9
−0.8 × 10⁻¹⁵ erg cm−2 s−1
corresponding to a luminosity of LX = (3.1 ± 1.9) 1040erg s−1.
2.4. FRB searches
We have organized a simultaneous coverage of the Chandraobservation with FAST and SRT aimed at searching for X-raycounterparts of bursts from FRB 20201124A(Appendix H). Theradio facilities covered two separated periods for a total of 60%of the 8.3 hour Chandra observation. A total of 49 radio bursts(48 by FAST, 1 by SRT), with fluences in the range 0.017- 13 Jyms and with an average duration of about 19 ms were observed.We do not find any significant coincidences with the 3 X-ray
Article number, page 2 of 11

L. Piro et al.: FRB 20201124A
s
18 pc
EVN
Fig. 1. Imaging and location of FRB 20201124A from radio to X-rays. Left panel: The VLA image at 22 GHz presented in this work (in colors),with contours indicating the 3, 4, and 5 sigma significance levels. The FWHM is reported in the lower-left corner; SDSS host galaxy centroid andhalf-light radius (red); CXO extraction region (white), centered on the EVN FRB position (yellow cross) Right panel: e-MERLIN image at 5GHz of the persistent radio source region, showing no detection. Contours are from the VLA image at 22 GHz. The cross indicates the location ofFRB 20201124A from EVN observations (Marcote et al. 2021). The FWHM is reported in the lower-left corner. The inset shows the EVN imagefrom our campaign (25×25 mas) with no detection at the FRB location, also at 5 GHz.
photons detected by Chandra. The closest FRB-X-ray photontime difference is 314 s. (Fig.2).
3. Origin of the radio emission
We argue that the extended radio source is associated to a starforming region in the host galaxy and exclude an AGN origin, asdiscussed in Appendix G (see also Ravi et al. 2021; Fong et al.2021). Radio emission from star formation in normal and star-burst galaxies is due to the combination of synchrotron emissionfrom cosmic ray electrons produced in supernova remnants, thatdominates below ≈ 20 GHz, described by a power law with aslope αS , and a flat free-free emission and its associated low fre-quency absorption ν f f ,abs (see Appendix D). In our source, thespectrum from 0.15 GHz to 22 GHz is well described by a powerlaw with αS = 0.76 ± 0.07, with no evidence of low frequencyabsorption or thermal emission (Fig.3). Such a spectrum is con-sistent with that observed in star-forming galaxies (Tabatabaeiet al. 2017; Klein et al. 2018). The star formation rate associatedto this source can be derived using the standard correlation relat-ing SFR to radio luminosity, SFR=
L1.4GHz1.6×1028ergs−1Hz−1 M�yr−1 (Mur-
phy et al. 2011). From the observed flux (Tab.A.1) and the cor-responding luminosity L(1.4GHz)=(1.7±0.2)×1029erg s−1Hz−1
we derive SFR≈ 10M�yr−1.The X-ray data are also in agreement with emission from a
star forming region. X-ray emission is expected from the pop-ulation of low mass (LMXB) and high-mass X-ray binaries(HMXB). By adopting standard correlations linking SFR to X-ray luminosity (Fragos et al. 2013; Ranalli et al. 2003) one ex-pects a 2-10 keV luminosity in the range LX ≈ (3 − 10) ×1040 erg s−1, consistent with the Chandra measurement (§2.3and Appendix B).
Consistent values of the SFR and the key properties of thehost galaxy are derived from optical spectroscopy and the spec-tral energy distribution (SED) modeling (Appendices E and F).The best fit parameters describing the galaxy are: a high in-
trinsic extinction AV = 1.3 ± 0.2 mag, symbolic of a dustygalaxy, a sub-solar metallicity Z� = 0.46 ± 0.25, an e-foldingtime τ = 4.3+3.6
−2.5 Gyr, a moderate stellar mass log(M∗/M�) =
9.78 ± 0.08, an old stellar population tm = 1.5+0.5−0.4 Gyr, and a
star-formation rate SFR = 4.3 ± 0.5 M� yr−1. The best fit modelspectrum is shown in Fig.3. From optical spectroscopy we de-rive a redshift z = 0.0978 ± 0.0002 and an Hα line luminosity,L(Hα) = (4.5 ± 0.8) × 1041erg s−1, corresponding to SFRHα =2.3±0.4 M� yr−1. As discussed in Appendix E, the Hα luminos-ity can underestimate the total SFR for observational reasons.Physical reasons can further reduce the SFRHα compared to theradio-derived SFR. Radio is also sensitive to heavily obscuredstar-formation and, in addition, it captures longer star-formingages, up to 100 Myr (Condon 1992), whereas optical traces re-cent star formation, up to 10 Myr. The mismatch between optical(low SF) and radio (high SF) may be interpreted as a contribu-tion from heavily obscured SF or as a post starburst episode, thatis 100 Myr ago the SFR was as high as 10 M�yr−1 but it rapidlydeclined and within 10 Myr was less than 2 M�yr−1. A decreaseof the SFR at a recent age is also suggested by a non paramet-ric modelization of the star forming history (Fong et al. 2021),indicating that the SFR was higher in the past galaxy’s history(although at a value not as large as the radio-derived SFR) be-fore decreasing by a factor of two ≈ 30 Myr ago. We concludethat the properties of the radio, optical and X-ray emission areconsistent with those expected by star formation.
4. The local star forming environment as a clue tothe progenitor
The properties of the local environment and of the host of FRBprovide a major clue on their progenitors. Different progeni-tor channels are expected to yield distinct distributions of lo-cation, local environment and host galaxy properties (e.g. Mar-galit et al. 2019). In this regard, FRB 20201124A exhibits someremarkable features. We find that it is located, with an accu-
Article number, page 3 of 11

A&A proofs: manuscript no. main
0.30 0.33 0.36 0.39 0.42 0.45 0.48 0.51 0.54Elapsed days (MJD-59324)
2
4
6
8
Phot
on e
nerg
y (k
eV)
FASTSRTChandra
Fig. 2. Search for X-ray counterparts of bursts from FRB 20201124A.Top panel: The brightest FRB simultaneous with our Chandra observa-tion was observed by SRT at T = 59324.44738212(12) MJD (reported atinfinite frequency in Barycentric Dynamical Time units), with a width=10 ms, a fluence = 13 Jy ms, and DM = 421 ± 4 pc cm−3. Bottompanel: Arrival times of FRBs detected by FAST (gray lines) and SRT(blue line) compared to the arrival times of Chandra photons (red cir-cles) coincident with the FRB position. The X-ray event closest to anFRB occurs 314 s after the SRT detected FRB.
racy of 360 pc, at the center of the most prominent region ofstar formation in the host galaxy, which is observed in the ra-dio with SFR≈ 10 M�yr−1. This structure, elongated by about3 kpc and at a distance of 0.8 ± 0.4 kpc from the center of thehost galaxy embeds the FRB and might be associated to a spiralarm. The average star formation surface density at the location ofthe FRB (Fig.4), ΣS FR(FRB) = 3.3 M�yr−1kpc−2, is two ordersof magnitude larger than observed in all other FRB , with theexception FRB 20121102A that, with SFR≈ 0.2 − 0.4 M� yr−1
and a size of 0.68 kpc (Bassa et al. 2017) has ΣS FR(FRB) ≈1 M�yr−1kpc−2 (see also Mannings et al. 2021) comparable toFRB 20201124A. Such large surface star formation rates aresimilar to those observed in Galactic star forming regions (Evanset al. 2009). This region exhibits also an elevated local star for-mation rate in comparison to the mean global value of the host
108 1010 1012 1014 1016 1018
Observed Frequency (Hz)10 5
10 3
10 1
101
103
105
Flux
Den
sity
(Jy
)
F0.76
F1.0
ChandraSDSS2MASSWISEVLAuGMRT
Fig. 3. Broadband radio to X-ray spectral energy distribution ofFRB 20201124A. We show the best fit models to the radio (AppendixD), optical and infrared (Appendix F), and X-ray data (Appendix B) ingray. The dotted line represents the X-ray spectrum expected from thestar formation derived from the optical SED modeling. It is dominatedby a population of HMXB with a spectrum ≈ ν−1 (Fragos et al. 2013).The downward magenta triangle represents the uGMRT upper limit at200 MHz. The gray square represents the uGMRT data at 650 MHzpublished by Wharton et al. (2021a).
Fig. 4. Local star formation rate density ΣS FR(FRB) forFRB 20201124A (this work; magenta bar) compared to the sam-ple of FRBs (from Mannings et al. (2021) with the exception ofFRB 20121102A at 1 M� yr−1 kpc−2, derived from Bassa et al. (2017),see text). Arrows represent upper limits, and solid blue bars representmeasurements contained in each bin width.
1 ( ΣS FR(FRB20201124A)ΣS FR(host) & 16), while in most FRB the local SFR is
comparable to the average of the host (Mannings et al. 2021).The properties of FRB 20201124A, particularly its location
within a region of intense star formation, favour a prompt for-mation channel, with the magnetar formed from the SNe of amassive star. Systematic studies of host properties (Heintz et al.2020; Bochenek et al. 2021), including the distribution of stellarmasses and star formation rates, find a wide range of host prop-erties. They concluded that, although this variety can underline adiversity of progenitor channels, the observed global propertiesare consistent with a predominant population of young magne-tars from core-collapse SNe. In this context, the global SFR andstellar mass derived for the host of FRB 20201124A (Fig.F.1)
1 Estimated by dividing the total SFR of the galaxy derived from Hαwith the area (at half light radius) of the galaxy, 19 kpc2
Article number, page 4 of 11
L. Piro et al.: FRB 20201124A
are in agreement with a young magnetar formation from a corecollapse SNe.
With regard to the local environment, this progenitor sce-nario would predict that FRBs should be preferentially locatednearby to the brightest star forming regions of their host galaxies,as we observe in the case of FRB 20201124A. In contrast, HSTobservations of precisely localized FRBs show that while FRBpositions are consistent with spiral arms, they are not located onthe most active star forming regions (Bhandari et al. 2020; Man-nings et al. 2021; Chittidi et al. 2020). On a closer scale it is alsoexpected that the positions would be coincident or at small offsetfrom star forming regions. This is due to the limited age (<10kyr) of the active phase of the magnetar and its kick velocity af-ter birth (e.g. Tendulkar et al. 2021). However, two of the knownrepeaters, FRB 20180916B and FRB 20121102A are found at anoffset of ≈ 250 pc from the center of the closest star formingknots, a distance too large to be consistent with a young magne-tar progenitor (Bassa et al. 2017; Tendulkar et al. 2021). We findthat FRB 20201124A is consistent with being at the center of theSFR although, given the error in the position, one cannot excludean offset of ≈ 200pc. In such a case, an age of 0.5 Myr would beexpected for a typical kick velocity of ≈ 400km s−1, questioninga young magnetar origin. In conclusion, the properties of the en-vironment of FRB 20201124A, from the host galaxy scale downto the local environment are consistent with those expected froma young magnetar progenitor from a SNe.
Considering the pieces of evidence discussed above, it is dif-ficult to draw any definitive conclusion on FRB progenitors. Dif-ferent channels for the formation of magnetar progenitors canexplain the broad distribution of properties of the host and lo-cal environment. In this scenario FRB 20201124A representsthe clear example of a young magnetar progenitor from a corecollapse SN. The recent association of FRB 20200120E with aglobular cluster indicates that at least another formation chan-nel is present, with young magnetars produced from accretioninduced collapse of white dwarfs or binary mergers of neutronstars (Kirsten et al. 2021). Nonetheless, the fact that the otherwell localized FRBs are close to star forming regions, suggests apredominant channel associated with star formation (e.g. Ioka &Zhang 2020; Tendulkar et al. 2021) but with a broader range ofSFR and offsets, in which FRB 20201124A would then representthe extreme in the distribution of local SFR.
5. Limits to X-ray counterparts of FRBs
Notwithstanding the significant progress obtained via the studyof the environment, and the increasing number of precise loca-tions that will be available in the future, high resolution imagingof the local environment of FRBs provides only circumstantialevidence on the central source of FRBs. A key step forward maycome from the identification of the counterpart of FRBs at otherwavelengths.
Although our simultaneous coverage of the Chandra obser-vation with FAST and SRT observations does not find any sig-nificant association of bursts from FRB 20201124Awith X-rayphotons (Appendix H), it sets upper limits on the X-ray coun-terparts that can be confronted with a magnetar origin. We placea 5σ upper limit EX . 6 × 1045 erg in the 2-10 keV range onthe X-ray energy of a burst at the time of any radio burst andEX . 1.6 × 1046 erg at any time during the Chandra observa-tion. We derive a tighter upper limit EX . 1.1 × 1044 erg as-suming that X-ray bursts of similar fluence are emitted at thetime of each radio burst. In Tab.H.1 we compare the limits withtwo other repeaters FRB 20121102A (Scholz et al. 2017) and
FRB 20180916B (Scholz et al. 2020). The most constraininglimit for X-ray bursts in coincidence with FRB is EX . 1.6×1045
erg for a single burst in FRB 20180916B and EX . 1.1 × 1044
erg in FRB 20201124A, assuming that all FRB have an associ-ated X-ray burst. This corresponds to an upper limit on the ratioof the flare energy in X-rays to radio EX/ER . 5 × 10⁵, and to aradio-to-X-ray spectral index αRX & 0.4 (F(ν) ∝ ν−α).
X-ray bursts of known magnetars have isotropic energiesmuch smaller than 1045 erg. The energy of the X-ray burst as-sociated with FRB-like events from the Galactic magnetar SGR1935+2154 is ∼ 1040 erg (Li et al. 2021). Even for the mostenergetic giant flares detected from three known magnetars, theisotropic energies only reached a few times 1044 erg (Woods &Thompson 2006). One may imagine more energetic X-ray flaresfor cosmological FRBs. If we assume that FRBs all have the X-ray-to-radio energy ratio as observed in FRB-like events fromthe Galactic magnetar SGR 1935+2154, i.e. EX/ER = 3.6 × 10⁴
(Bochenek et al. 2020), the upper limit EX/ER . 5 × 10⁵ derivedfrom our observations is still consistent with such an assumption.We therefore draw the conclusion that the magnetar flaring ori-gin of FRBs for this source cannot be disfavored and is consistentwith the available data.
6. Conclusions
In this paper we have presented the results of a campaign involv-ing nine facilities from radio to X-rays, and aimed at constrain-ing the multiwavelength properties of the quiescent and flaringemission of FRB 20201124A, the third closest repeater recentlylocalized.
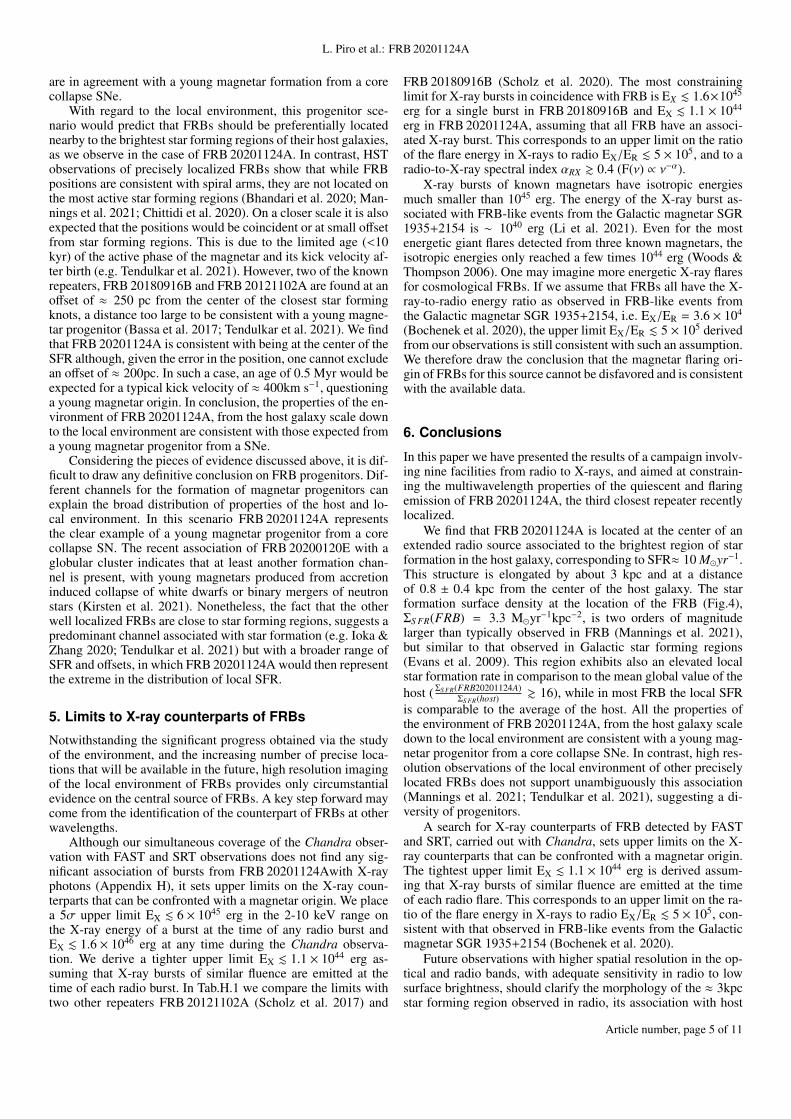
We find that FRB 20201124A is located at the center of anextended radio source associated to the brightest region of starformation in the host galaxy, corresponding to SFR≈ 10 M�yr−1.This structure is elongated by about 3 kpc and at a distanceof 0.8 ± 0.4 kpc from the center of the host galaxy. The starformation surface density at the location of the FRB (Fig.4),ΣS FR(FRB) = 3.3 M�yr−1kpc−2, is two orders of magnitudelarger than typically observed in FRB (Mannings et al. 2021),but similar to that observed in Galactic star forming regions(Evans et al. 2009). This region exhibits also an elevated localstar formation rate in comparison to the mean global value of thehost ( ΣS FR(FRB20201124A)
ΣS FR(host) & 16), while in most FRB the local SFRis comparable to the average of the host. All the properties ofthe environment of FRB 20201124A, from the host galaxy scaledown to the local environment are consistent with a young mag-netar progenitor from a core collapse SNe. In contrast, high res-olution observations of the local environment of other preciselylocated FRBs does not support unambiguously this association(Mannings et al. 2021; Tendulkar et al. 2021), suggesting a di-versity of progenitors.
A search for X-ray counterparts of FRB detected by FASTand SRT, carried out with Chandra, sets upper limits on the X-ray counterparts that can be confronted with a magnetar origin.The tightest upper limit EX . 1.1 × 1044 erg is derived assum-ing that X-ray bursts of similar fluence are emitted at the timeof each radio flare. This corresponds to an upper limit on the ra-tio of the flare energy in X-rays to radio EX/ER . 5 × 10⁵, con-sistent with that observed in FRB-like events from the Galacticmagnetar SGR 1935+2154 (Bochenek et al. 2020).
Future observations with higher spatial resolution in the op-tical and radio bands, with adequate sensitivity in radio to lowsurface brightness, should clarify the morphology of the ≈ 3kpcstar forming region observed in radio, its association with host
Article number, page 5 of 11

A&A proofs: manuscript no. main
galaxy structures such as spiral arms, and further resolve its finestructure, so to test the young magnetar scenario with a finermeasurement of the offset between the FRB and the SFR region.Acknowledgements. We acknowledge support from a grant PRIN-INAF SKA-CTA 2016. The National Radio Astronomy Observatory is a facility of the Na-tional Science Foundation operated under cooperative agreement by AssociatedUniversities, Inc. We thank the staff of the GMRT that made these observationspossible. GMRT is run by the National Centre for Radio Astrophysics of theTata Institute of Fundamental Research. The European VLBI Network is a jointfacility of independent European, African, Asian, and North American radio as-tronomy institutes. Scientific results from data presented in this publication arederived from the following EVN project code(s): RP032A. e-MERLIN is a Na-tional Facility operated by the University of Manchester at Jodrell Bank Obser-vatory on behalf of STFC. We thank the Swift and Chandra staff for the supportin carrying out the ToO observations. The Sardinia Radio Telescope (SRT) isfunded by the Department of University and Research (MIUR), the Italian SpaceAgency (ASI), and the Autonomous Region of Sardinia (RAS) and is operatedas National Facility by the National Institute for Astrophysics (INAF). We thankan anonymous referee for useful comments.
ReferencesAggarwal, K., Agarwal, D., Kania, J. W., et al. 2020, Journal of Open Source
Software, 5, 2750Barsdell, B. R., Bailes, M., Barnes, D. G., & Fluke, C. J. 2012, MNRAS, 422,
379Bassa, C. G., Tendulkar, S. P., Adams, E. A. K., et al. 2017, ApJ, 843, L8Beloborodov, A. M. 2017, ApJ, 843, L26Bhandari, S., Sadler, E. M., Prochaska, J. X., et al. 2020, ApJ, 895, L37Biggs, A. D., Younger, J. D., & Ivison, R. J. 2010, MNRAS, 408, 342Bochenek, C. D., Ravi, V., Belov, K. V., et al. 2020, Nature, 587, 59Bochenek, C. D., Ravi, V., & Dong, D. 2021, ApJ, 907, L31Bolli, P., Orlati, A., Stringhetti, L., et al. 2015, Journal of Astronomical Instru-
mentation, 4, 1550008Cardelli, J. A., Clayton, G. C., & Mathis, J. S. 1989, ApJ, 345, 245Chabrier, G. 2003, PASP, 115, 763Chime/Frb Collaboration. 2021, The Astronomer’s Telegram, 14497, 1Chime/Frb Collabortion. 2021, The Astronomer’s Telegram, 14497, 1Chittidi, J. S., Simha, S., Mannings, A., et al. 2020, arXiv e-prints,
arXiv:2005.13158Condon, J. J. 1992, ARA&A, 30, 575Conroy, C., Gunn, J. E., & White, M. 2009, ApJ, 699, 486Cordes, J. M. & Chatterjee, S. 2019, ARA&A, 57, 417Cutri, R. M., Wright, E. L., Conrow, T., et al. 2021, VizieR Online Data Catalog,
II/328Day, C. K., Bhandari, S., Deller, A. T., Shannon, R. M., & Moss, V. A. 2021a,
The Astronomer’s Telegram, 14515, 1Day, C. K., Bhandari, S., Deller, A. T., Shannon, R. M., & Moss, V. A. 2021b,
The Astronomer’s Telegram, 14515, 1Dye, S., Eales, S. A., Aretxaga, I., et al. 2008, MNRAS, 386, 1107Evans, Neal J., I., Dunham, M. M., Jørgensen, J. K., et al. 2009, ApJS, 181, 321Ferland, G. J., Porter, R. L., van Hoof, P. A. M., et al. 2013, Rev. Mexicana
Astron. Astrofis., 49, 137Fong, W.-f., Dong, Y., Leja, J., et al. 2021, ApJ, 919, L23Fragos, T., Lehmer, B. D., Naoz, S., Zezas, A., & Basu-Zych, A. 2013, ApJ, 776,
L31Gajjar, V., Siemion, A. P. V., Price, D. C., et al. 2018, ApJ, 863, 2Grimm, H. J., Gilfanov, M., & Sunyaev, R. 2003, MNRAS, 339, 793He, C., Ng, C. Y., & Kaspi, V. M. 2013, ApJ, 768, 64Heintz, K. E., Prochaska, J. X., Simha, S., et al. 2020, ApJ, 903, 152Ibar, E., Ivison, R. J., Biggs, A. D., et al. 2009, MNRAS, 397, 281Ioka, K. & Zhang, B. 2020, ApJ, 893, L26Johnson, B. D., Leja, J. L., Conroy, C., & Speagle, J. S. 2019, Prospector: Stellar
population inference from spectra and SEDsKale, R. & Ishwara-Chandra, C. H. 2021, Experimental Astronomy, 51, 95Katz, J. I. 2016, ApJ, 826, 226Kennicutt, Robert C., J. 1998, ARA&A, 36, 189Kilpatrick, C. D., Fong, W., Prochaska, J. X., et al. 2021, The Astronomer’s
Telegram, 14516, 1Kirsten, F., Marcote, B., Nimmo, K., et al. 2021, arXiv e-prints,
arXiv:2105.11445Klein, U., Lisenfeld, U., & Verley, S. 2018, A&A, 611, A55Kraft, R. P., Burrows, D. N., & Nousek, J. A. 1991, ApJ, 374, 344Kumar, P., Lu, W., & Bhattacharya, M. 2017, MNRAS, 468, 2726Kumar, P., Shannon, R. M., Moss, V., Qiu, H., & Bhandari, S. 2021, The As-
tronomer’s Telegram, 14502, 1
Law, C., Tendulkar, S., Clarke, T., Aggarwal, K., & Bethapudy, S. 2021, TheAstronomer’s Telegram, 14526, 1
Lehmer, B. D., Basu-Zych, A. R., Mineo, S., et al. 2016, ApJ, 825, 7Leja, J., Johnson, B. D., Conroy, C., van Dokkum, P. G., & Byler, N. 2017, ApJ,
837, 170Li, C. K., Lin, L., Xiong, S. L., et al. 2021, Nature Astronomy, 5, 378Licquia, T. C. & Newman, J. A. 2015, ApJ, 806, 96Lorimer, D. R., Bailes, M., McLaughlin, M. A., Narkevic, D. J., & Crawford, F.
2007, Science, 318, 777Lorimer, D. R. & Kramer, M. 2004, Handbook of Pulsar Astronomy (Cambridge,
UK: Cambridge University Press)Lyubarsky, Y. 2021, Universe, 7, 56Mannings, A. G., Fong, W.-f., Simha, S., et al. 2021, ApJ, 917, 75Marcote, B., Kirsten, F., Hessels, J. W. T., et al. 2021, The Astronomer’s Tele-
gram, 14603, 1Margalit, B., Berger, E., & Metzger, B. D. 2019, ApJ, 886, 110McMullin, J. P., Waters, B., Schiebel, D., Young, W., & Golap, K. 2007, in As-
tronomical Society of the Pacific Conference Series, Vol. 376, AstronomicalData Analysis Software and Systems XVI, ed. R. A. Shaw, F. Hill, & D. J.Bell, 127
Mendel, J. T., Simard, L., Palmer, M., Ellison, S. L., & Patton, D. R. 2014, ApJS,210, 3
Mereghetti, S., Savchenko, V., Ferrigno, C., et al. 2020, ApJ, 898, L29Metzger, B. D., Berger, E., & Margalit, B. 2017, ApJ, 841, 14Murphy, E. J., Condon, J. J., Schinnerer, E., et al. 2011, ApJ, 737, 67O’Connor, B., Troja, E., Dichiara, S., et al. 2021, MNRAS, 502, 1279Panessa, F. & Giroletti, M. 2013, MNRAS, 432, 1138Parma, P., Murgia, M., Morganti, R., et al. 1999, A&A, 344, 7Petroff, E., Hessels, J. W. T., & Lorimer, D. R. 2019, A&A Rev., 27, 4Popov, S. B. & Postnov, K. A. 2010, in Evolution of Cosmic Objects through
their Physical Activity, ed. H. A. Harutyunian, A. M. Mickaelian, &Y. Terzian, 129–132
Prandoni, I., Murgia, M., Tarchi, A., et al. 2017, A&A, 608, A40Prescott, M. K. M., Kennicutt, Robert C., J., Bendo, G. J., et al. 2007, ApJ, 668,
182Rajwade, K., Stappers, B., Williams, C., et al. 2020, in Ground-based and Air-
borne Instrumentation for Astronomy VIII, ed. C. J. Evans, J. J. Bryant, &K. Motohara, Vol. 11447, International Society for Optics and Photonics(SPIE), 78 – 85
Ranalli, P., Comastri, A., & Setti, G. 2003, A&A, 399, 39Ransom, S. M. 2001, PhD thesis, Harvard UniversityRavi, V., Law, C. J., Li, D., et al. 2021, arXiv e-prints, arXiv:2106.09710Ricci, R., Piro, L., Panessa, F., et al. 2021, The Astronomer’s Telegram, 14549,
1Saintonge, A., Catinella, B., Cortese, L., et al. 2016, MNRAS, 462, 1749Schlafly, E. F. & Finkbeiner, D. P. 2011, ApJ, 737, 103Schober, J., Schleicher, D. R. G., & Klessen, R. S. 2017, MNRAS, 468, 946Scholz, P., Bogdanov, S., Hessels, J. W. T., et al. 2017, ApJ, 846, 80Scholz, P. & Chime/Frb Collaboration. 2020, The Astronomer’s Telegram,
13681, 1Scholz, P., Cook, A., Cruces, M., et al. 2020, ApJ, 901, 165Shepherd, M. C. 1997, in Astronomical Society of the Pacific Conference Series,
Vol. 125, Astronomical Data Analysis Software and Systems VI, ed. G. Hunt& H. Payne, 77
Skrutskie, M. F., Cutri, R. M., Stiening, R., et al. 2006, AJ, 131, 1163Tabatabaei, F. S., Schinnerer, E., Krause, M., et al. 2017, ApJ, 836, 185Taggart, K. & Perley, D. A. 2021, MNRAS, 503, 3931Tendulkar, S. P., Gil de Paz, A., Kirichenko, A. Y., et al. 2021, ApJ, 908, L12The CHIME/FRB Collaboration, :, Amiri, M., et al. 2021, arXiv e-prints,
arXiv:2106.04352van Dokkum, P. G. 2001, PASP, 113, 1420Wadiasingh, Z. & Timokhin, A. 2019, The Astrophysical Journal, 879, 4Wharton, R., Bethapudi, S., Gautam, T., et al. 2021a, The Astronomer’s Tele-
gram, 14529, 1Wharton, R., Bethapudi, S., Marthi, V., et al. 2021b, The Astronomer’s Telegram,
14538, 1Willingale, R., Starling, R. L. C., Beardmore, A. P., Tanvir, N. R., & O’Brien,
P. T. 2013, MNRAS, 431, 394Woods, P. M. & Thompson, C. 2006, Soft gamma repeaters and anomalous X-ray
pulsars: magnetar candidates, Vol. 39, 547–586Yang, G., Boquien, M., Buat, V., et al. 2020, MNRAS, 491, 740Yang, Y.-P. & Zhang, B. 2021, ApJ, 919, 89Zhang, B. 2020, Nature, 587, 45
Article number, page 6 of 11

L. Piro et al.: FRB 20201124A
Appendix A: VLA discovery of a quiescent radiosource
We pointed the FRB position from Day et al. (2021b) with theVLA on April 9, May 11, and June 22, 2021 (project codeSG9112). The first two runs were performed in D-configuration,while the latter in C. The observing bands were S (2-4 GHz) andX (8-12 GHz) for the first epoch, S, C (4-8 GHz), and X for thesecond one, and L (1-2 GHz), X, and K (18-26 GHz) for the thirdone (see Tab. A.1 for a summary). The calibrator 3C 147 wasused both for amplitude scale and bandpass corrections, whilethe phase calibrator paired to the target was J0534+1927 forthe first two epochs (∼ 9◦ apart), and J0431+2037 for the thirdone (∼ 10◦ apart), due to the configuration change. Data werereduced with the Common Astronomy Software Applicationspackage (CASA; McMullin et al. 2007). We processed the rawdata with pipeline version 5.6.2. The calibrated visibilities werethen imaged with the task TCLEAN, applying natural weightingto optimize sensitivity.
A constant radio source was detected in the different epochs,offset by ∼3.3 arcsec with respect to the Day et al. (2021b) lo-calization, but consistent with later ones (Ricci et al. 2021). Theflux density was consistent within errors in the different epochs,at the common frequencies of 3, 9, and 11 GHz (see Tab. A.1).The estimated radio luminosity is L5 GHz = 3 × 1038 erg s−1. Themorphology is unresolved at angular resolutions larger than ∼1′′,while the 22 GHz observations in C-configuration from the latestepoch revealed an elongated emission region, with an extensionof ∼2′′. A Gaussian fit with a single component results in a de-convolved size of 2.2±0.6×0.5±0.3′′, with a position angle of140±8◦, confirming the resolved morphology. The componentis centered at RA 05:08:03.50±0.01s, Dec +26:03:38.36±0.18′′,consistent with the position of the FRB. The astrometric accu-racy was estimated by adopting a conservative VLA positionaluncertainty of 10% of the FWHM2 (0.11′′), and summing that inquadrature with the peak location error from the Gaussian fit. Weobtained a total uncertainty for the Gaussian centroid location of±0.21′′.
Appendix B: X-ray imaging with Swift and Chandra
We carried out observations (PI: Piro) with Swift/XRT in PCmode starting at 2021-04-06 19:47:02 UT and ending at 2021-04-07 14:53:17 UT for a total of 9.9 ks exposure under ObsIDs00014258001 and 00014258002. The data were processed usingthe xrtpipeline task, and the individual ObsIDs were stackedusing XSELECT. Results are presented in §2.3.
Chandra X-ray Observatory (CXO) observations (ObsID:25016; PI: Piro), carried out under Director’s Discretionary Time(DDT), occurred on April 20, 2021 for a total of 29.7 ks. Datawere processed using the Chandra Interactive Analysis of Ob-servations (CIAO v. 4.13; Fruscione et al. 2006) software andthe latest calibration database (CALDB v. 4.9.4). Our analysis wasperformed in the 0.5−7 keV energy range. The native astrometryof the image was corrected by aligning 2 common point sourcesin the Sloan Digital Sky Survey (SDSS) Catalog. We restrictedthese sources to those within 2.5 arcmin of the Chandra/ACIS-S3 detector’s optical axis. This resulted in an astrometric shift by0.5′′, with tie uncertainty ∼ 0.25′′. Further analysis of the astro-metric uncertainty using a total of 4 common point sources withSDSS, including those at & 2.5 arcmin from the optical axis of
2 https://science.nrao.edu/facilities/vla/docs/manuals/oss/performance/positional-accuracy
ACIS-S3, yielded a consistent astrometric solution and did notchange the result.
A weak X-ray detection at the position of the EVN VLBI(Marcote et al. 2021) with a 0.5-7.0 keV count-rate of 1.0+0.7
−0.6 ×
10−4 cts s−1 corresponds to a luminosity of LX = (3.1 ± 1.9) 1040
erg s−1, assuming that absorption is limited to our Galaxy (§2.3).If we also take into account the large DM=421 ± 4 associatedto the FRB (Appendix H), the intrinsic absorption componentcould be as high as NH,z ≈ 1.2× 1022 cm−2 (He et al. 2013). Thiswould imply an unabsorbed flux FX ≈ 1.8 × 10⁻¹⁵ erg cm−2 s−1
(2-10 keV) and a luminosity LX ≈ 4 × 1040erg s−1.These values fit well within the correlation between FIR and
X-ray luminosities in star-forming galaxies (Ranalli et al. 2003),and imply a recent star formation rate SFR = 10+11
−7 M� yr−1
(Lehmer et al. 2016). Whereas radio and FIR indicators probethe SFR over ≈100 Myr timescales, studies of local star-forminggalaxies show that the dominant component of the X-ray emis-sion are high-mass X-ray binaries (HMXBs) associated with ayoung (.30 Myr) stellar population (Grimm et al. 2003).
Appendix C: Follow-up of the persistent radiosource with EVN, e-MERLIN, and uGMRT
Following the detection of a persistent radio source with theVLA, we triggered a Very Long Baseline Interferometry (VLBI)campaign involving the European VLBI Network (EVN) and theenhanced Multi Element Remotely Linked Interferometer Net-work (e-MERLIN). EVN observations were performed on May12th, 2021, in e-VLBI mode with the standard setup at 5 GHz(project code RP032A, PI: Panessa). The array was composedby 9 EVN antennas (IR, BD, SV, HH, SH, O8, EF, WB, JB) plus6 from e-MERLIN (JL, PI, KN, DE, DA, CM). The data ratewas 2 Gbps for all antennas except for SV and BD (1 Gbps),and the e-Merlin array (512 Mbps). This reflected into differ-ent bandwidths, from 0.1 to 0.5 GHz. Sources J0237+2848 andJ0555+3948 were used as fringe finders at the beginning/end ofthe experiment, while J0502+2516 for target phase-referencing(1.4◦ apart). A total on-source time of 4 hours was reached.Data were reduced with the Astronomical Image ProcessingSystem (AIPS) software, following standard calibration proce-dures for continuum data. Visibilities were then imaged using theDIFMAP software (Shepherd 1997), applying natural weighting.The obtained angular resolution was 3.5×1.7 mas, with a posi-tion angle of 7.15◦. The RMS was 9 µJy/beam.
We did not detect any compact source above a confidencelevel of 6 sigma, resulting in an upper limit of 54 uJy/beam. Thisresult confirms with deeper observations the previous one fromthe PRECISE project (Marcote et al. 2021), also obtained withthe EVN but at 1.4 GHz. Those authors concluded that the natureof the emission detected with the VLA must be of extended na-ture, not being visible at VLBI resolution. From non-detectionson the shortest baseline of the array (Effelsberg-Westerbork;∼270 km) they could estimate an angular size &140 mas for theextended emission, corresponding to a projected linear size &260pc. In our observation, the sub-array composed by e-MERLINantennas plus JB - i.e. the array baselines more sensitive to ex-tended emission - gave an angular resolution of 60×36 mas, andan RMS of 43 µJy/beam (applying natural weighting). Consider-ing a threshold of 6 sigma, the e-MERLIN non-detection impliesa surface brightness <0.045 Jy/kpc2.
Given the results of the EVN run, we performed deeper ob-servations with e-MERLIN at 5 GHz on July 11, 2021 (DDTproject DD11007, PI: Bruni), with the aim of recovering the SFR
Article number, page 7 of 11

A&A proofs: manuscript no. main
Table A.1. Journal of radio observations of the quiescent source associated with FRB 20201124A.
Telescope Date Frequency Bandwidth Time on source Flux density FWHM(dd/mm/yyyy) (GHz) (GHz) (min) (µJy) (′′)
uGMRT 24/07/2021 0.19 0.125 45 <3600 21.6×10.4uGMRT 21/07/2021 0.38 0.24 98 1700±200 7.0×4.9VLA-D 09/04/2021 3 2 28 340±30 18.0×16.1
9 2 33 150±10 7.4×6.7VLA-D 11/05/2021 3 2 38 335±18 31.7×16.9
5 2 11 259±10 20.2×11.47 2 11 165±11 18.5×8.29 2 22 159±7 10.4×6.8
11 2 22 126±10 8.4×5.4VLA-C 22/06/2021 1.5 1 14 706±76 12.8×12.1
9 2 10 142±12 2.6×2.611 2 10 104±14 2.3×2.122 8 26 78±8 1.1×1.0
e-MERLIN 11/07/2021 5 0.5 500 <85 0.085×0.045EVN 12/05/2021 5 0.1-0.5 245 <54 0.0035×0.0017
emission at an intermediate scale between our previous VLA andEVN observations. The run originally included also 1.5 GHz,the frequency band where most of the flux density was expected,however the sensitivity was hampered by the lack of suitable, un-resolved, phase calibrators near to target. At 5 GHz, we observedwith the full 512 MHz bandwidth, for a total of ∼11 hours on tar-get, reaching an RMS of 17 µJy/beam. The phase calibrator wasJ0506+2141, with an angular separation of 4.4◦. The angular res-olution, applying natural weighting, was 85×45 mas. Also at thissensitivity, no emission was detected at a significance level largerthan 5 sigma (see Fig. 1), implying a surface brightness <0.008Jy/kpc2.
To further complete the frequency coverage on the persis-tent radio source, we requested DDT observations with the up-graded Giant Metrewave Radio Telescope (uGMRT). Observa-tions were carried out on July 21 and 24, 2021 (project codeddtC194, PI: Bruni), using the band-3 (260-500 MHz) and band-2 (125-250 MHz) receivers, respectively. The amplitude scaleand bandpass calibrations were performed on 3C 147, while theadopted phase calibrator was J0534+1927. Data were reducedwith the CAPTURE pipeline (Kale & Ishwara-Chandra 2021). Inband-3, the final image RMS was 50 µJy/beam, and the angularresolution 7.0′′×4.9′′. We detected the source as an unresolvedcomponent with a flux density of 1.7±0.2 mJy. Band-2 was ham-pered by radio frequency interferences, with more than 50% ofdata flagged on each antenna. The final image showed no detec-tion at an RMS level of 1.2 mJy/beam, resulting in a 3σ upperlimit of 3.6 mJy. The angular resolution was 21.6′′×10.4′′.
Appendix D: The radio spectrum from starformation in the host galaxy
Star-forming galaxies emit both thermal (free-free) and non-thermal (synchrotron) radiation in the radio regime. The syn-chrotron component, resulting from SNR, dominates at frequen-cies up to about 20 GHz, while free-free emission becomes sig-nificant at higher frequencies (Klein et al. 2018). At low fre-quencies, typically well below 1 GHz, free-free absorption takesplace (Schober et al. 2017). The resulting spectrum is thus de-scribed as
Fν = CS [ν
GHz]−αs e−τ f f + C f f [
ν
GHz]2(1 − e−τ f f ) (D.1)
with
τ f f (ν) = [ν
ν f f ,abs]−2.1 (D.2)
The first term in the equation is the synchrotron component,modelled with a power law with a slope of αs. The second, flattercomponent, ∝ ν−0.1 in the optically thin regime, is due to free-free emission. In fig.3 we present the best fit model on our VLAand GMRT data (Tab.A.1). The radio spectrum is dominated bythe synchrotron component with αs = 0.76 ± 0.07, no evidenceof absorption and an upper limit (3σ) of . 10% of the thermalfraction at 1.4 GHz. Those values are consistent with the rangeobserved in radio spectra of star forming galaxies (Tabatabaeiet al. 2017).
Appendix E: Optical spectroscopy
We obtained optical spectroscopy of the putative host galaxy ofFRB 20201124A on 2021-04-21 starting at 03:18:35.51 with theDeVeny spectrograph mounted on the 4.3-m LDT for a total ex-posure of 4×600 s. DeVeny was configured with the 300 g mm−1
grating and a 1.5′′slit width. The slit was aligned at position an-gle 63◦ East of North and covers the location of the FRB deter-mined by the EVN VLBI localization. However we note that thewidth of the slit does not cover completely either the full exten-sion of persistent radio source or the host galaxy. We reduced thedata using standard procedures in the IRAF package to performbias subtraction, flat field correction, and cosmic ray removalwith L.A.Cosmic (van Dokkum 2001).
The spectrum was calibrated using the spectrophotometricstandard star Feige 34. The resulting spectrum is displayed inFigure F.2. We detect emission features at λobs ≈ 7207, 7230,7374, and 7391 Å associated to Hα, the [NII] doublet, and the[SII] doublet. Given the sensitivity of these observations, ournon-detection of Hβ or Oxygen lines is consistent with the fluxesreported by Fong et al. (2021). Using the observed lines, we de-rive a redshift z = 0.0978±0.0002. Line properties were derivedby fitting the lines with Gaussian functions using the specutilspackage in Python. The emission line fluxes were corrected forGalactic extinction E(B−V) = 0.63 mag (Schlafly & Finkbeiner2011) assuming a Cardelli et al. (1989) extinction law. The lineproperties are reported in Table E.1.
Article number, page 8 of 11

L. Piro et al.: FRB 20201124A
Table E.1. Host galaxy emission line properties from our optical spec-troscopy with LDT/DeVeny. These values are corrected for Galactic ex-tinction E(B − V) = 0.63 mag (Schlafly & Finkbeiner 2011).
Line λobs Flux[Å] [10−15 erg cm−2 s−1]
Hβ 5345.1 < 2.9Hα 7206.8 7.4 ± 1.3NIIλ6585 7229.6 3.9 ± 1.1SIIλ6718 7373.5 2.9 ± 0.7SIIλ6732 7391.3 2.2 ± 0.7
From the Hα emission line, we derived an SFRHα = 0.89 ±0.16 M� yr−1 (Kennicutt 1998), assuming a Chabrier initial massfunction (IMF, Chabrier 2003). From the analysis of the hostgalaxy’s spectral energy distribution (SED; Appendix F) we in-ferred a global value of AV ∼ 1.3 mag for the intrinsic extinc-tion. By applying this correction to our spectrum, the optically-derived SFR is SFRHα = 2.3 ± 0.4 M� yr−1.
Appendix F: Galaxy SED analysis
We modeled the spectral energy distribution (SED) of the hostgalaxy using prospector (Johnson et al. 2019) and the method-ology outlined in O’Connor et al. (2021). We made use ofarchival photometry from SDSS, the Two Micron All Sky Survey(2MASS; Skrutskie et al. 2006), and the Wide-field Infrared Sur-vey Explorer (WISE; Cutri et al. 2021). This photometry coversoptical and near-infrared wavelengths ugrizJHK in addition totwo WISE infrared bands (W1 and W2). We exclude the WISEW3 and W4 photometry due to the uncertainty surrounding ther-mal dust emission models (see, e.g., Leja et al. 2017). Fromthe archival SDSS/u-band image, we derive a 3σ upper limitu & 22.0 mag on an underlying source. This is consistent withthe deeper limit from Swift/UVOT (u & 22.8 mag), which we in-clude in our modeling. We also include the measured Hα emis-sion line flux as pseudo narrow-band photometry in order to bet-ter constrain the SFR. The photometry was corrected for Galac-tic extinction in the direction of the FRB, E(B − V) = 0.63 mag(Schlafly & Finkbeiner 2011), prior to modeling with prospec-tor. We adopt a Chabrier (2003) IMF with integration limitsof 0.08 and 120 M� (imf_type = 1), an intrinsic dust atten-uation using the extinction law of Cardelli et al. (1989) andaccounting for both additional dust in nebular regions (dust1)and diffuse dust throughout the galaxy (dust1), and a delayed-τ (sfh=4) star-formation history characterized by an e-foldingtimescale, τ. We account for the contribution of nebular emissionusing the photoionization code Cloudy (Ferland et al. 2013). Thesynthetic spectral energy distributions (SEDs) corresponding tothese models were computed with the flexible stellar populationsynthesis (FSPS) code (Conroy et al. 2009). The free parametersin these models are the total stellar mass formed M, the age tageof the galaxy, the e-folding timescale τ, the intrinsic reddeningAV , and the metallicity Z∗. We adopt uniform priors in log tage,log τ, log Z, E(B − V) as in Mendel et al. (2014, cf. their Table2). From these parameters, we derive the stellar mass, M∗, themass-weighted stellar age, tm, and the star-formation rate, SFR.
The best fit model spectrum is shown in Figure 3, the cor-ner plot in Figure F.3 and the best fit parameters reported inSect.3. We note that the mass-weighted stellar age and stellarmass are slightly smaller compared to those presented by Raviet al. (2021) and Fong et al. (2021). We find that this is likely dueto different model assumptions within prospector. We com-
7 8 9 10 11log(M * /M )
12
11
10
9
8
7
log(
sSFR
/yr
1 )
SF Main SequenceCCSNeSLSNeLGRBNon-repeating FRBsRepeating FRBsMilky WayFRB 20201124A
Fig. F.1. Specific star formation (SFR normalized to the total mass ofthe galaxy) of FRB 20201124A (magenta star), other repeating FRBs(light blue circles), non-repeating FRBs (dark blue circles) from Heintzet al. (2020) and our own Galaxy (light purple pentagon; Licquia &Newman 2015). For FRB 20201124A we display the sSFR derived fromradio observations (Appendix A) with a magenta star, and a dashedline connects this value to the magenta circle representing the sSFRderived from optical spectroscopy (Appendix E and Fig.F.2). We alsodisplay the populations of other astrophysical transients for referenceby including the low redshift (z < 0.3) populations of long Gamma-rayBursts (LGRBs; small blue diamonds), core-collapse supernovae (CC-SNe; small gray circles), and superluminous supernovae (SLSNe; smallgray squares) from Taggart & Perley (2021). These values are com-pared to the low redshift (z < 0.05) star forming main sequence fromSaintonge et al. (2016) displayed by a solid line. Our object is locatedwell above the star formation main sequence, above which galaxies haveenhanced star formation efficiencies.
pare the stellar mass and star formation rate to the host galaxiesof CCSNe, LGRBs, and other FRBs in Fig. F.1.
The X-ray luminosity expected from such a galaxy is derivedas follows. There are three main components of galaxy X-rayemission: low-mass X-ray binaries (LMXB), high-mass X-raybinaries (HMXB), and hot gas. The strengths of these compo-nents can be modeled as a function of galaxy properties such asM∗ and SFR. We adopt the recipe from Fragos et al. (2013) andYang et al. (2020):
log(LLXRB2−10keV/M∗) = f (tm), (F.1)
log(LHXRB2−10keV/S FR) = g(Z∗), (F.2)
log(Lhot0.5−2keV/S FR) = 38.9 (F.3)
where luminosities are in erg s−1. The functions f (tm) and g(Z∗)are given in Fragos et al. (2013). Substituting the best fit val-ues one obtains L(2−10keV) = (5 ± 2) × 1040 erg s−1, consistentwith the observed X-ray luminosity. This emission is dominated(80%) by the HMXB component associated with young stellarpopulations.
Article number, page 9 of 11

A&A proofs: manuscript no. main
Fig. F.2. LDT/DeVeny optical spectrum of the host galaxy ofFRB 20201124A at z = 0.0978 ± 0.0002. The spectrum (solid purpleline) has been smoothed with a Gaussian kernel. Dashed black linesindicate the expected location of emission lines at this redshift; we donot observe Oxygen lines or Hβ. The inset figure shows a zoom on theregion of the detected emission lines between 7150 and 7450 Å. Thespectrum is not corrected for Galactic extinction.
AV = 1.26+0.220.20
0.40.81.2
Z/Z
Z/Z = 0.46+0.260.25
9.60
9.75
9.9010
.05
log(
M*/
M)
log(M * /M ) = 9.78+0.080.07
1
2
3
4
5
t m [G
yr]
tm [Gyr] = 1.48+0.540.39
2
4
6
8
[Gyr
]
[Gyr] = 4.30+3.562.54
0.8 1.2 1.6 2.0
AV
34567
SFR
0.4 0.8 1.2
Z/Z9.6
09.7
59.9
010
.05
log(M * /M )1 2 3 4 5
tm [Gyr]2 4 6 8
[Gyr]3 4 5 6 7
SFR
SFR = 4.33+0.540.56
Fig. F.3. Corner plot demonstrating the results of our prospectormodeling of the host galaxy SED as outlined in Appendix F.
Appendix G: Origin of the persistent emission fromradio to X-rays
Our EVN observation demonstrated that the emission is ex-tended and that the bulk of the radio emission must arise onscales larger than about 200 pc. We argue that this emissionis produced by star formation in the host galaxy. First, theradio luminosity in galaxies is correlated with SFR (Murphyet al. 2011) as SFR=
L1.4GHz1.7×1028erg s−1Hz−1 M�yr−1 that, in the case
of FRB 20201124A gives SFR≈ 10M�yr−1. This is consistentwith the value derived from X-rays, and also in agreement with
the smaller values derived from from optical/IR (2-4 M�yr−1),considering that the radio may include additional emission fromheavily obscured star formation (Prescott et al. 2007; Dye et al.2008) or from enhanced star formation that may have occurredover the longer time scale ( . 100 Myr) probed by radio obser-vations (Condon 1992). Furthermore, the radio spectrum in the0.4-10 GHz range has a slope of 0.76 ± 0.07, that is consistentwith the average of 0.7 ± 0.4 observed in star forming galaxies(Ibar et al. 2009).
Alternative scenario involving a low-surface-brightnessAGN-driven radio emission, e.g. jets, are unlikely (Biggs et al.2010). A low-luminosity radio quiet AGN, like low-ionizationnuclear emission-line regions and Seyfert galaxies would becharacterized by a more compact morphology (e.g., Panessa &Giroletti 2013). A small fraction of radio active nuclei are in theso-called dying or remnant phase. The active phase of a radioAGN can last several tens of Myr, after which the nuclear ac-tivity stops and the source starts to fade away (e.g., Parma et al.1999). The core and the jets disappear and only the lobes re-main visible, radiating their energy away. Such a scenario canaccount for the non-detection of the compact core component.However, the observed properties of the extended radio sourcein FRB 20201124A are markedly different from those observedin the remnant phase of radio galaxies. First, the radio spectrumof the remnant of Radio Loud (RL) AGN is much brighter atlower frequency, with a very steep spectrum (α & 1 above a fewhundred MHz), due to the exponential cut-off from rapidly cool-ing electrons. Furthermore, the physical size of the region andthe total radio power associated with remnants are respectivelyabout two and three orders of magnitude larger than observed inour case, excluding this scenario.
Appendix H: Chandra limits on X-ray counterpartsof FRB detected by FAST and SRT
We have organized a simultaneous coverage of the Chandra ob-servation with FAST and SRT observations aimed at searchingfor X-ray counterparts of FRB. Chandra observation took placeon April 20, from 5:28 to 13:50 UT and lasted for 8.3 hrs.
SRT (Bolli et al. 2015; Prandoni et al. 2017) observedFRB 20201124A on 20 April 2021 for 3 hours starting at 10:30UT. Observations were performed both at 1.5 GHz and 330MHz. Data at 1.5 GHz were recorded with the ATNF digitalbackend PDFB33 in search mode over an effective bandwidth of420 MHz split into 1 MHz channels. Total intensity data were 2-bit sampled every 100 µs. Data at 330 MHz were recorded withthe ROACH1 digital backend in baseband mode over a band-width of 64 MHz which was subsequently split into 0.25 MHzchannels. The raw data were coherently dedispersed (removingthe intrachannel smearing only) at the DM of the FRB (DM =413 pc cm−3, as quoted by, i.e., Chime/Frb Collaboration 2021)and the resulting total intensity data were 8-bit sampled every128 µs. A search for single pulses was performed on the data us-ing the spandak pipeline4 (Gajjar et al. 2018). The pipeline usesrfifind from the presto package5 (Ransom 2001) for high-levelradio frequency interference (RFI) excision. It then performs afirst search for bursts through Heimdall (Barsdell et al. 2012).A DM range from 0 to 1000 pc cm−3 was searched for at 1.5GHz using a maximum window size for matched-filtering of 130
3 http://www.srt.inaf.it/media/uploads/astronomers/dfb.pdf4 https://github.com/gajjarv/PulsarSearch5 https://github.com/scottransom/presto
Article number, page 10 of 11

L. Piro et al.: FRB 20201124A
ms. In the case of the coherently dedispersed 330 MHz data, afiner search was performed in the DM range 400–450 pc cm−3,with a maximum window size of 260 ms. The pipeline finallyperforms sifting of the dedispersed data and produces plots forthe surviving candidates. Each candidate found by Heimdall atDMs within the range 400–450 pc cm−3 was visually examined.In order to validate genuine candidates, we ran an ad-hoc pro-gram with more sensitive RFI excision procedures optimized forSRT data. This program searches for the most corrupted fre-quency channels in the DM zero data using the spectral kurto-sis algorithm, with 5σ thresholding, as provided by the softwarepackage your 6 (Aggarwal et al. 2020). It then applies baselinesubtraction and normalizes the data for the average bandpass. Acheck for possible corrupted temporal bins due to the presence ofimpulsive RFI is then performed with inter-quantile range miti-gation, similarly to Rajwade et al. (2020). Finally, it dedispersesthe data to the derived DM and smooths them via a 2D Gaus-sian filter. A single candidate not resembling RFI was found inthe data at 1.5 GHz at barycentric time 10:44:13.815 TDB (re-ported at infinite frequency) at a DM compatible with that ofFRB 20201124A: DM = 421± 4 pc cm−3. The burst had a signal-to-noise ratio S/N = 27.3 and a width W = 10 ms, resulting ina fluence F = 13 ± 3 Jy ms. Since the data are uncalibrated, theestimated fluence of the burst was calculated using the modifiedradiometer equation (see e.g. Lorimer & Kramer 2004) adoptingan antenna gain of 0.55 K/Jy, a system temperature of 30 K. Noburst was observed in the data at 330 MHz either simultaneouslywith the burst at 1.5 GHz (with the time series both shifted to in-finite frequency in order to remove the delay introduced by DMat the two different frequencies), or at any other time during theobserving session, down to a limiting fluence of 7 Jy ms.
FAST carried out a 55-day observational campaign startingfrom April 1st 2021, soon after the CHIME alert (Chime/FrbCollabortion 2021). More than 1600 FRB bursts were detectedin 1.0-1.5 GHz frequency band. The details of FAST observa-tions will be reported in a separate paper (H. Xu et al. 2021, inpreparation). During the Chandra observation FAST observedfor 2 hours (8:00-10:00 UT) detecting 48 bursts with fluences inthe range 0.017-5.5 Jy ms (median=0.22 Jy ms; average= 0.65Jy ms) and duration from 4 ms to 49 ms (median=14 ms; aver-age=19 ms).
We have searched for coincidences with the 3 X-ray pho-tons detected by Chandra. The X-ray photon arrival times werebarycenter corrected using the barycorr task within HEASoftv. 6.27.2. The closest FRB-X-ray photon time difference is314 s. Considering the number of burst and the count ratethe probability of a random association is close to 100%, thuswe can exclude a significant coincidence with a FRB. We de-rive a 5σ upper limit on the X-ray fluence of the FRB as fol-lows (Scholz et al. 2017). For an X-ray burst arriving at thetime of a FRB we obtain an upper limit of 14 counts (at 5sigma (Kraft et al. 1991) that corresponds to an upper limitof F(2 − 10keV) = 2.5 × 10⁻¹⁰erg cm−2 on the fluence, and ofE=6 × 1045 erg on the X-ray burst energy, assuming the X-rayspectrum described in Appendix B. As the Chandra backgroundis negligible, this limit is independent of the duration of the FRBup to the difference in arrival time of the closest Chandra pho-ton (Scholz et al. 2017). In order to derive the upper limit for anX-ray burst occurring at a later time than 314 s after an FRB,we consider the number of trials and derive the single-trial con-fidence level that is used to compute the upper limit followingthe prescription of Kraft et al. (1991). The number of trials is
6 https://github.com/thepetabyteproject/your/
Table H.1. Limits on X-ray bursts energy associated to FRBs
FRB EXRB EXRB,N NFRB Ref.[erg] [erg]
20121102A . 4 × 1046 . 4 × 1045 10 120180916B . 1.6 × 1045 . 1.6 × 1045 1 220201124A . 6 × 1045 . 1.1 × 1044 49 3
References. (1) Scholz et al. (2017); (2) Scholz et al. (2020); (3) thiswork
equal to the duration of the observation divided by the flare du-ration. Assuming a typical duration of 19 msec, comparable tothe radio burst, and considering the negligible background, wederive an upper limit of 29 counts, corresponding to a fluence. 5 × 10⁻¹⁰erg cm−2 and energy E. 1.6 × 1046 erg). Under theassumption that X-ray bursts are emitted for each of the 49 radiobursts, we can stack individual limits to derive an upper limit of0.3 cts. The corresponding upper limits on the fluence and en-ergy of the putative X-ray bursts are thus 5 × 10⁻¹²erg cm−2 andEX . 1.1 × 1044 erg. This corresponds to an upper limit on theratio of the flare energy in X-rays to radio EX/ER . 5 × 10⁵, andto a radio-to-X-ray spectral index αRX & 0.4 (F(ν) ∝ ν−α). InTab.H.1 we compare the limits derived on the X-ray burst as-sociated to FRBs with two repeating FRBs (FRB 20121102A;Scholz et al. 2017, and, FRB 20180916B; Scholz et al. 2020).Overall, the most constraining observations for X-ray bursts incoincidence with FRB is EX . 1.6 × 1045 erg for a single burstin FRB 20180916B and EX . 1.1×1044 erg in FRB 20201124A,assuming that all FRB have an associated XRB.
Article number, page 11 of 11