The Farmer-to-Farmer Extension Approach in Malawi: … The Farmer-to-Farmer Extension Approach in...
47
The Farmer-to-Farmer Extension Approach in Malawi: A Survey of Lead Farmers Stanley Khaila, Frank Tchuwa, Steven Franzel and Brent Simpson
Transcript of The Farmer-to-Farmer Extension Approach in Malawi: … The Farmer-to-Farmer Extension Approach in...
The Farmer-to-Farmer Extension Approach in Malawi: A Survey of Lead Farmers
Stanley Khaila, Frank Tchuwa, Steven Franzel and Brent Simpson
ii
The Farmer-to-Farmer Extension Approach in Malawi: A Survey of Lead Farmers
Stanley Khaila, Frank Tchuwa, Steven Franzel and Brent Simpson
iii
LIMITED CIRCULATION
Correct citation: Khaila S, Tchuwa F, Franzel S, Simpson S. 2015.The Farmer-to-Farmer Extension Approach in Malawi: A Survey of Lead Farmers. ICRAF Working Paper No. 189. Nairobi, World Agroforestry Centre. DOI: http://dx.doi.org/10.5716/WP14200.PDF Titles in the Working Paper Series aim to disseminate interim results on agroforestry research and practices and stimulate feedback from the scientific community. Other publication series from the World Agroforestry Centre include: Technical Manuals, Occasional Papers and the Trees for Change Series. Published by the World Agroforestry Centre United Nations Avenue PO Box 30677, GPO 00100 Nairobi, Kenya Tel: +254(0)20 722 4000, via USA +1 650 833 6645 Fax: +254(0)20 722 4001, via USA +1 650 833 6646 Email: [email protected] Website: www.worldagroforestry.org
© World Agroforestry Centre, Brent Simpson, and MEAS Project. This work is licensed under a Creative Commons Attribution 3.0 Unported License. This Discussion Paper was produced as part of the United States Agency for International Development (USAID) project “Modernizing Extension and Advisory Services” (MEAS, www.meas-extension.org). Leader with Associates Cooperative Agreement No. AID-OAA-L-10-00003. The report was made possible by the generous support of the American people through USAID. The contents are the responsibility of the authors and do not necessarily reflect the views of USAID or the United States government. Users are free to share — to copy, distribute and transmit the work and to remix — to adapt the work, under the following condition: Attribution — users must attribute the work to the authors, but not in any way that suggests that the authors endorse the user or the user’s use of the work. The views expressed in this publication are those of the authors and not necessarily those of the World Agroforestry Centre. Technical editing by Leslie Johnson, Michigan State University.

iv
THE AUTHORS
Stanley Khaila and Frank Tchuwa work for the Institute for Economic and Social Research (IfESOR), Bunda College, Lilongwe, Malawi.
Steven Franzel works for the World Agroforestry Centre, Nairobi, Kenya.
Brent Simpson works for Michigan State University, East Lansing, Michigan, USA.
ACKNOWLEDGEMENTS
We are grateful to the farmers, lead farmers, government, non-profit organizations, and private-sector organizations that participated in the survey for their assistance and cooperation. During the fieldwork. Funding support for this study was provided by the United States Agency for International Development (USAID) project “Modernizing Extension and Advisory Services” (MEAS, www.meas-extension.org) and the CGIAR Research Program on Policies, Institutions, and Markets. This work was undertaken as part of the CGIAR Research Program on Policies, Institutions, and Markets (PIM) led by the International Food Policy Research Institute (IFPRI). This publication has not gone through IFPRI’s standard peer-review procedure. The opinions expressed here belong to the authors, and do not necessarily reflect those of PIM, IFPRI, ICRAF, CGIAR, MEAS, USAID or the United States government.
v
ACRONYMS ADD Agricultural Development Division
AEDO Agricultural extension development officer
EPA Extension planning area
FAO Food and Agriculture Organization of the United Nations
FBO Faith-based organization
FGD Focus group discussion
GoM Government of Malawi
ICRAF World Agroforestry Centre
IfESOR Institute for Economic and Social Research
IFPRI International Food Policy Research Institute
IICA Inter-American System for agriculture, the Inter-American Institute for Cooperation on Agriculture
LF Lead farmer
MEAS Modernizing Extension and Advisory Services
NPO Non-profit organization
PIM Policies, Institutions and Markets
PRA Participatory Rural Appraisal
SMS Short Message Service
SPSS Statistical Package for Social Sciences
TLC Total Land Care
USA United States of America
USAID United States Agency for International Development
vi
TABLE OF CONTENTS
ACRONYMS .................................................................................................................................. v LIST OF TABLES ......................................................................................................................... vi LIST OF FIGURES ....................................................................................................................... vii SUMMARY ................................................................................................................................... ix 1. BACKGROUND AND OBJECTIVES ................................................................................... 1 2. METHODOLOGY ................................................................................................................... 1
2.1 Sample ................................................................................................................................ 1 2.2 Data collection ................................................................................................................... 4 2.3 Data analysis ..................................................................................................................... 4
3. LITERATURE REVIEW ......................................................................................................... 4 4. SURVEY FINDINGS .............................................................................................................. 6
4.1 Demographics .................................................................................................................... 6 4.2 Criteria for selecting lead farmers ..................................................................................... 8 4.3 Activities of and technologies disseminated by lead farmers ......................................... 10 4.4 Training lead farmers ...................................................................................................... 14 4.5 Contextual factors of farmer-to-farmer extension services ............................................. 18 4.6 Lead farmer performance and compensation .................................................................. 25 4.7 Factors that motivate lead farmers .................................................................................. 27 4.8 Challenges and opportunities of the lead farmer approach ............................................. 30
5. IMPLICATIONS OF THE STUDY FINDINGS ON POLICY AND PRACTICE ............... 31 REFERENCES .............................................................................................................................. 34
LIST OF TABLES Table 1. Distribution of the lead farmers in the survey ................................................................... 2 Table 2. Organizational affiliations of lead farmers in the survey .................................................. 3 Table 3. Farmers participating in the focus group discussions of the study ................................... 4 Table 4. Gender of respondents by type of organization ................................................................ 6 Table 5. Cross-tabulation of marital status by sex .......................................................................... 6 Table 6. Educational achievements of lead farmers. ....................................................................... 7 Table 7. The year in which respondents became lead farmers ........................................................ 8 Table 8. Selection of lead farmers ................................................................................................... 9 Table 9. Selection of lead farmers by type of organization ............................................................ 9 Table 10. Activities of lead farmers. ............................................................................................. 11 Table 11. Technologies disseminated by lead farmers. ................................................................ 12 Table 12. Types of initial training received by lead farmers. ....................................................... 15 Table 13. Length of initial training for lead farmers. .................................................................... 15 Table 14. Topics covered during initial training of lead farmers. ................................................. 16 Table 15. Technical topics covered during initial training of lead farmers. ................................. 16 Table 16. Additional training received by lead farmers. ............................................................... 17 Table 17. Participation in exchange visits or study tours by lead farmers. ................................... 18 Table 18. How lead farmers identify training needs. .................................................................... 19 Table 19. Clientele of the lead farmers. ........................................................................................ 19

vii
Table 20. Frequency with which lead farmers meet fellow farmers. ............................................ 20 Table 21. Where do you train the farmers you work with? ........................................................... 20 Table 22. Mode of transport used by lead farmers to reach other farmers. .................................. 21 Table 23. Modes of communication used by lead farmers. .......................................................... 22 Table 24. Records kept by lead farmers. ....................................................................................... 22 Table 25. Number of supervisors of lead farmer. ......................................................................... 23 Table 26. Training materials that lead farmers receive ................................................................. 24 Table 27. Demonstration materials lead farmers received. ........................................................... 24 Table 28. Lead farmer relationship with extension staff ............................................................... 25 Table 29. Number of farmers trained by lead farmers. ................................................................. 26 Table 30. Payments received when lead farmers attend meetings. ............................................... 27 Table 31. Income earned from activities related to being a lead farmer. ...................................... 27 Table 32. Reasons for becoming a lead farmer by type of organization. ...................................... 28 Table 33. Reasons for becoming a lead farmer by gender. ........................................................... 28 Table 34. Reasons for remaining a lead farmer. ........................................................................... 29 Table 35. Reasons for remaining a lead farmer by gender. ........................................................... 30 Table 36. Challenges faced by lead farmers. ................................................................................ 30
LIST OF FIGURES Figure 1. Education achievements of lead farmers by gender. ....................................................... 7 Figure 2. The years the respondents became lead farmers by gender. ............................................ 8 Figure 3. Desirable characteristics in lead farmers ....................................................................... 10 Figure 4. Activities carried out by lead farmers in various types of organizations ....................... 12 Figure 5. Technologies disseminated by lead farmers from different types of organizations. ..... 13 Figure 6. Domains and types of additional training received by lead farmers. ............................. 17 Figure 7. Participation in exchange visits and study tours by gender. .......................................... 18
LIST OF PHOTOS Photo 1. A farmer in Neno District stands in his maize field. ....................................................... 14

viii
ix
SUMMARY Research on extension approaches can help extension services improve their effectiveness and efficiency in serving farmers. The farmer-to-farmer extension approach, though widely used, has been little studied. The objective of this study was to characterize the approach from the perspective of the farmers involved, usually called lead farmers. We describe their activities and support given to them, identify factors that motivate them and assess the challenges they face. The study is part of a broader one examining farmer-to-farmer extension in Malawi, Cameroon and Kenya. The results are based on a survey of 203 lead farmers working with 19 organizations. The survey covered five districts: one in the Northern Region and two districts each in the Central and Southern regions. The majority (78 percent) of the lead farmers were from the public sector, 19 percent were from non-profit, non-governmental organizations, and 3 percent were private- sector. Lead farmers are relatively youthful, averaging 42 years. About 41 percent of lead farmers are women, and 29 percent of women lead farmers are single. About 78 percent of lead farmers are members of farmer groups. About 56 percent of them have completed primary school, and most of the remaining have undergone some primary school education. Respondents indicated that the most important characteristics for being a lead farmer were to be hard-working (76 percent), an active farmer (52 percent) and interested in helping others (34 percent). Most (75 percent) were selected to be lead farmers by their communities or groups; 17 percent were selected by extension staff members, and 8 percent by other means. About 40 percent served a farmer group or groups; the others served a village or villages. The main activities included training (96 percent), providing advice (35 percent), establishing demonstration plots (32 percent) and monitoring other farmers’ use of the technologies/practices being promoted (30 percent). Most of the training that lead farmers receive is informal or conducted during meetings; only 9 percent said they underwent residential training. About 70 percent received training in technical subjects as well as communication/extension skills. About 44 percent received some additional training after working for some time and 41 percent participated in study tours. There were minor differences in training between types of organizations. Most lead farmers meet the farmers they work with once a week or every two weeks during the cropping season. About half conduct training sessions at demonstration plots. About 44 percent use personal cell phones for communicating with farmers or supporting field staff; the proportion was about the same for men and women. Most (85 percent) keep records, particularly of progress
x
on action plans. About 82 percent reported that they collaborate a lot with government extension staff. About 43 percent, particularly those in NPOs, receive training materials such as notebooks, pens and written materials to support their work. About 54 percent receive demonstration materials such as seed, fertilizer and implements. About 28 percent reported earning some income related to their activities as lead farmers, either through selling seed or other inputs, through payments received for providing extension services or through sales of products from demonstration plots that were considerably higher than what they would have normally produced. Only 12 percent reported receiving per diems or allowances for attending meetings, and only 8 percent were reimbursed for such expenses. Lead farmers stated that their main challenges were lack of transport (62 percent), limited budget (18 percent) and low adoption rates of the technologies/practices that they were promoting (17 percent). Lead farmer programs can help some organizations increase the number of women providing extension services because it is often easier to recruit women lead farmers than to recruit women field staff. For example, whereas only 21 percent of the field staff of the Department of Extension and Advisory Services are women, almost twice that proportion, 40 percent, of lead farmers are women. There is no statistical difference between the number of farmers that men and women train – each typically trains 20 to 25 farmers per year. However, women train more women than do men; women comprise 62 percent of those farmers trained by women while only 55 percent are trained by men. Thus, lead farmer programs help increase women’s participation in providing extension services as well as access to them. The farmers’ main reasons for becoming lead farmers were to increase their own knowledge (58 percent) and to help others (altruism) (56 percent). Altruism was cited by slightly more men than women. Farmers’ reasons for remaining lead farmers were somewhat different. Altruism was highest (58 percent), while increasing their own knowledge declined to 38 percent, perhaps because new knowledge was not very forthcoming after initial training. Income-generating activities emerged as the third most important reason (14 percent), as some lead farmers found ways to earn cash from selling seed, training and other services. There was little difference between men and women in reasons for remaining a lead farmer. Extension managers reported that social status was an important reason for becoming and remaining a farmer trainer, but only 4-5 percent of lead farmers gave this as a reason, perhaps because they felt uncomfortable stating this as a reason.

xi
Several important implications for policy and practice were identified. The study results reveal many positive aspects about the approach and implementation support that it receives in Malawi. Priorities for future development include:
• Reaffirming the role of groups and communities in selecting and monitoring lead farmers.
• Improving the training of lead farmers, including more emphasis on initial training, training in needs assessment, and more additional in-service training including study tours, exchange visits and exposure to additional new technologies.
• Providing low-cost incentives to address lead farmers’ two main motivations for becoming and remaining lead farmers – knowledge and altruism. Helping farmers earn cash from associated activities is also becoming more important.
• Providing material support in the form of low-cost items that lead farmers use, such as notebooks, pens, brochures and reading materials.
• Reimbursing or compensating lead farmers for the real expenditures that they incur in carrying out their duties, so that they are not also financially subsidizing the extension organizations that they work with.
• Highlighting and reinforcing the important role that lead farmer programs play in improving gender balance in extension, both for increasing the number of women providing extension services and improving women’s access to such services.
Finally, more research is needed on low-cost ways to improve effectiveness of lead farmers, and forums are needed where practitioners can share experiences in implementing such programs. Extension managers, lead farmers and trainees should all be involved in finding ways to improve the effectiveness and efficiency of programs using the lead farmer approach. Key words: agricultural extension, lead farmers, farmer-to-farmer extension, gender
1
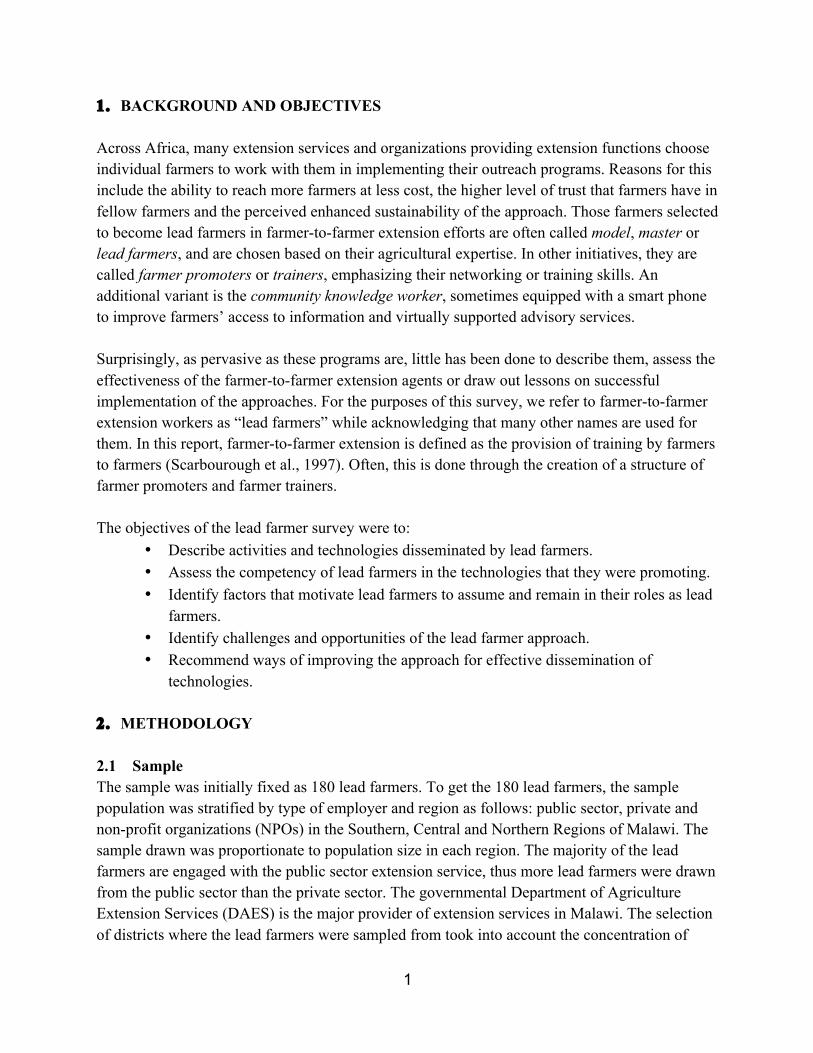
1. BACKGROUND AND OBJECTIVES Across Africa, many extension services and organizations providing extension functions choose individual farmers to work with them in implementing their outreach programs. Reasons for this include the ability to reach more farmers at less cost, the higher level of trust that farmers have in fellow farmers and the perceived enhanced sustainability of the approach. Those farmers selected to become lead farmers in farmer-to-farmer extension efforts are often called model, master or lead farmers, and are chosen based on their agricultural expertise. In other initiatives, they are called farmer promoters or trainers, emphasizing their networking or training skills. An additional variant is the community knowledge worker, sometimes equipped with a smart phone to improve farmers’ access to information and virtually supported advisory services. Surprisingly, as pervasive as these programs are, little has been done to describe them, assess the effectiveness of the farmer-to-farmer extension agents or draw out lessons on successful implementation of the approaches. For the purposes of this survey, we refer to farmer-to-farmer extension workers as “lead farmers” while acknowledging that many other names are used for them. In this report, farmer-to-farmer extension is defined as the provision of training by farmers to farmers (Scarbourough et al., 1997). Often, this is done through the creation of a structure of farmer promoters and farmer trainers. The objectives of the lead farmer survey were to:
• Describe activities and technologies disseminated by lead farmers. • Assess the competency of lead farmers in the technologies that they were promoting. • Identify factors that motivate lead farmers to assume and remain in their roles as lead
farmers. • Identify challenges and opportunities of the lead farmer approach. • Recommend ways of improving the approach for effective dissemination of
technologies. 2. METHODOLOGY 2.1 Sample The sample was initially fixed as 180 lead farmers. To get the 180 lead farmers, the sample population was stratified by type of employer and region as follows: public sector, private and non-profit organizations (NPOs) in the Southern, Central and Northern Regions of Malawi. The sample drawn was proportionate to population size in each region. The majority of the lead farmers are engaged with the public sector extension service, thus more lead farmers were drawn from the public sector than the private sector. The governmental Department of Agriculture Extension Services (DAES) is the major provider of extension services in Malawi. The selection of districts where the lead farmers were sampled from took into account the concentration of
2
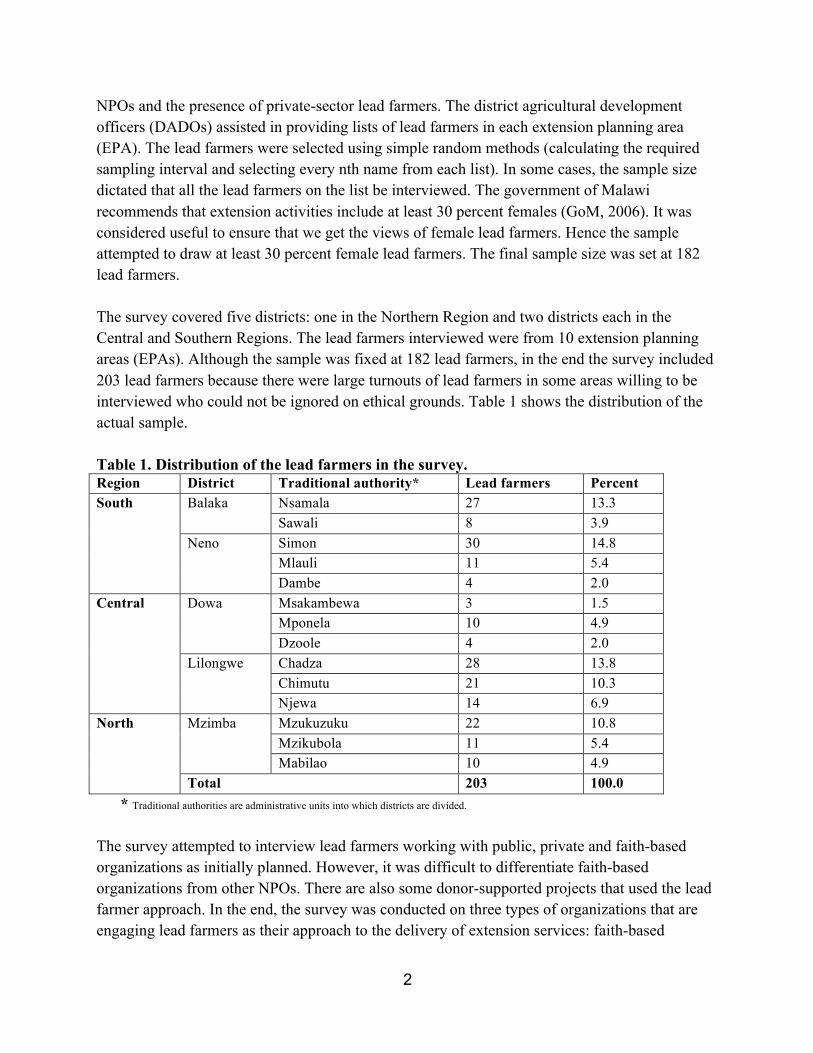
NPOs and the presence of private-sector lead farmers. The district agricultural development officers (DADOs) assisted in providing lists of lead farmers in each extension planning area (EPA). The lead farmers were selected using simple random methods (calculating the required sampling interval and selecting every nth name from each list). In some cases, the sample size dictated that all the lead farmers on the list be interviewed. The government of Malawi recommends that extension activities include at least 30 percent females (GoM, 2006). It was considered useful to ensure that we get the views of female lead farmers. Hence the sample attempted to draw at least 30 percent female lead farmers. The final sample size was set at 182 lead farmers. The survey covered five districts: one in the Northern Region and two districts each in the Central and Southern Regions. The lead farmers interviewed were from 10 extension planning areas (EPAs). Although the sample was fixed at 182 lead farmers, in the end the survey included 203 lead farmers because there were large turnouts of lead farmers in some areas willing to be interviewed who could not be ignored on ethical grounds. Table 1 shows the distribution of the actual sample. Table 1. Distribution of the lead farmers in the survey. Region District Traditional authority* Lead farmers Percent South Balaka Nsamala 27 13.3
Sawali 8 3.9 Neno Simon 30 14.8
Mlauli 11 5.4 Dambe 4 2.0
Central Dowa Msakambewa 3 1.5 Mponela 10 4.9 Dzoole 4 2.0
Lilongwe Chadza 28 13.8 Chimutu 21 10.3 Njewa 14 6.9
North Mzimba Mzukuzuku 22 10.8 Mzikubola 11 5.4 Mabilao 10 4.9
Total 203 100.0 * Traditional authorities are administrative units into which districts are divided.
The survey attempted to interview lead farmers working with public, private and faith-based organizations as initially planned. However, it was difficult to differentiate faith-based organizations from other NPOs. There are also some donor-supported projects that used the lead farmer approach. In the end, the survey was conducted on three types of organizations that are engaging lead farmers as their approach to the delivery of extension services: faith-based
3
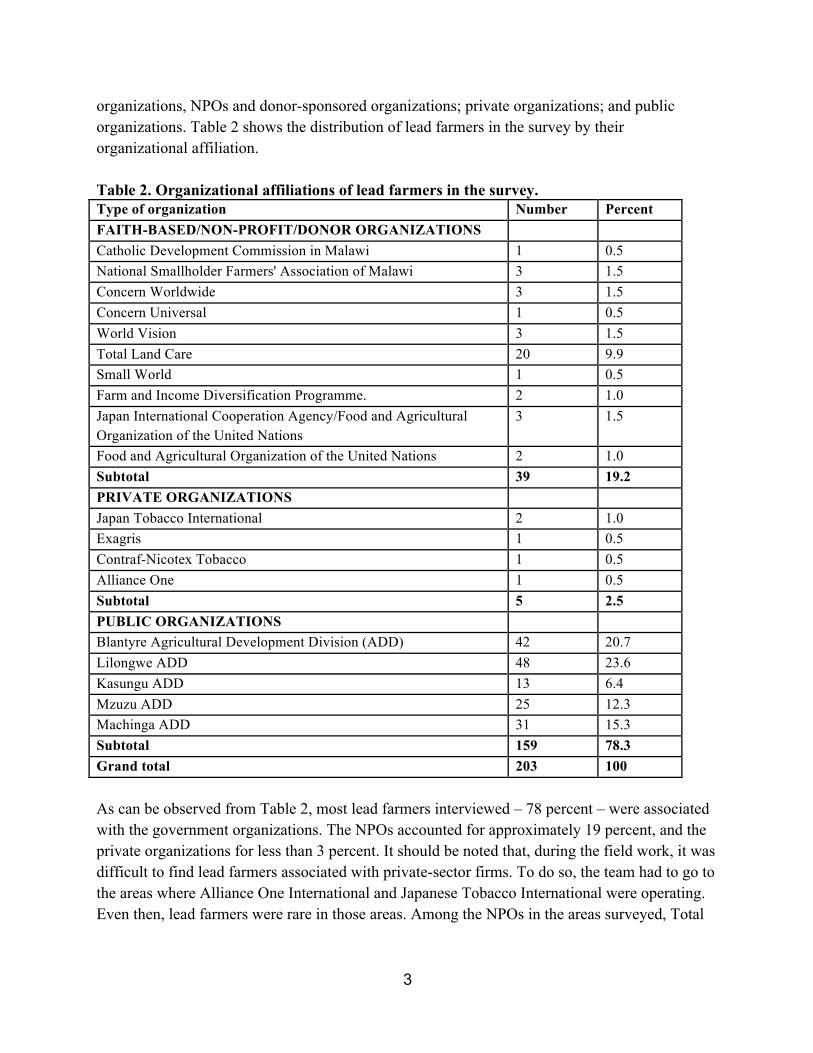
organizations, NPOs and donor-sponsored organizations; private organizations; and public organizations. Table 2 shows the distribution of lead farmers in the survey by their organizational affiliation. Table 2. Organizational affiliations of lead farmers in the survey. Type of organization Number Percent FAITH-BASED/NON-PROFIT/DONOR ORGANIZATIONS Catholic Development Commission in Malawi 1 0.5 National Smallholder Farmers' Association of Malawi 3 1.5 Concern Worldwide 3 1.5 Concern Universal 1 0.5 World Vision 3 1.5 Total Land Care 20 9.9 Small World 1 0.5 Farm and Income Diversification Programme. 2 1.0 Japan International Cooperation Agency/Food and Agricultural Organization of the United Nations
3 1.5
Food and Agricultural Organization of the United Nations 2 1.0 Subtotal 39 19.2 PRIVATE ORGANIZATIONS Japan Tobacco International 2 1.0 Exagris 1 0.5 Contraf-Nicotex Tobacco 1 0.5 Alliance One 1 0.5 Subtotal 5 2.5 PUBLIC ORGANIZATIONS Blantyre Agricultural Development Division (ADD) 42 20.7 Lilongwe ADD 48 23.6 Kasungu ADD 13 6.4 Mzuzu ADD 25 12.3 Machinga ADD 31 15.3 Subtotal 159 78.3 Grand total 203 100 As can be observed from Table 2, most lead farmers interviewed – 78 percent – were associated with the government organizations. The NPOs accounted for approximately 19 percent, and the private organizations for less than 3 percent. It should be noted that, during the field work, it was difficult to find lead farmers associated with private-sector firms. To do so, the team had to go to the areas where Alliance One International and Japanese Tobacco International were operating. Even then, lead farmers were rare in those areas. Among the NPOs in the areas surveyed, Total
4
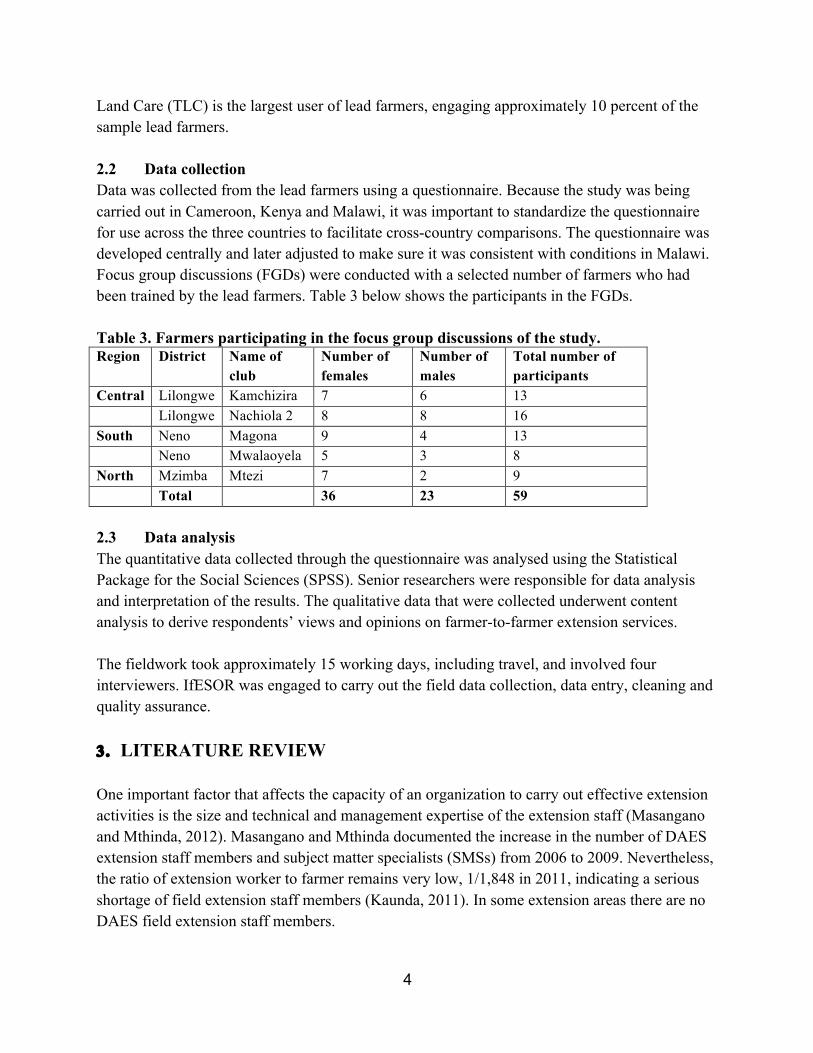
Land Care (TLC) is the largest user of lead farmers, engaging approximately 10 percent of the sample lead farmers. 2.2 Data collection Data was collected from the lead farmers using a questionnaire. Because the study was being carried out in Cameroon, Kenya and Malawi, it was important to standardize the questionnaire for use across the three countries to facilitate cross-country comparisons. The questionnaire was developed centrally and later adjusted to make sure it was consistent with conditions in Malawi. Focus group discussions (FGDs) were conducted with a selected number of farmers who had been trained by the lead farmers. Table 3 below shows the participants in the FGDs. Table 3. Farmers participating in the focus group discussions of the study. Region District Name of
club Number of females
Number of males
Total number of participants
Central Lilongwe Kamchizira 7 6 13 Lilongwe Nachiola 2 8 8 16 South Neno Magona 9 4 13 Neno Mwalaoyela 5 3 8 North Mzimba Mtezi 7 2 9 Total 36 23 59 2.3 Data analysis The quantitative data collected through the questionnaire was analysed using the Statistical Package for the Social Sciences (SPSS). Senior researchers were responsible for data analysis and interpretation of the results. The qualitative data that were collected underwent content analysis to derive respondents’ views and opinions on farmer-to-farmer extension services. The fieldwork took approximately 15 working days, including travel, and involved four interviewers. IfESOR was engaged to carry out the field data collection, data entry, cleaning and quality assurance. 3. LITERATURE REVIEW One important factor that affects the capacity of an organization to carry out effective extension activities is the size and technical and management expertise of the extension staff (Masangano and Mthinda, 2012). Masangano and Mthinda documented the increase in the number of DAES extension staff members and subject matter specialists (SMSs) from 2006 to 2009. Nevertheless, the ratio of extension worker to farmer remains very low, 1/1,848 in 2011, indicating a serious shortage of field extension staff members (Kaunda, 2011). In some extension areas there are no DAES field extension staff members.
5
Garforth (2011) noted that, globally, most research on farmers’ access to information and advice on new technology points to ”other farmers” within the locality as their most proximate source, particularly at the point of decision about whether to make a change in their food production system. This reality affirms the theory of diffusion of innovations developed by Everett Rogers (Rogers, 2003) and is the main reason for the successful use of the farmer-to-farmer or lead farmer approach. Mulwafu & Krishnankutty (2012) noted that the lead farmer approach had numerous benefits. They noted that the lead farmers provide a focal point in the community for introducing new technologies, for building farmer capacity, and as an entry point for service providers, such as input suppliers. Farmer trainers also help increase farmers’ networking and linkages in the communities and enhance the exchange of knowledge and sharing of experiences for increasing agricultural production. Lead farmers help in changing attitudes of the farmers, who motivate and encourage one another in adopting technologies. Because of trust, closeness and shared common attributes, farmers tend to be inclined to learn from fellow farmers. Lead farmers also serve as an entry point for other development initiatives. According to the Government of Malawi (2010), an opportunity exists for farmers – lead farmers – to play a role as extension service providers in the new framework of service provision. A lead farmer is defined as an individual farmer who has been selected by the community to perform technology-specific farmer-to-farmer extension and is trained in the use of the technology. For the approach to be successful, this document also advocates for the use of community awareness-raising meetings and participatory rural appraisals (PRAs) to orient communities in the use of the lead farmer approach. The lead farmer approach is widely popular in Malawi, as indicated by its widespread use. Masangano and Mthinda (2012) in a survey of 37 field extension programs found that 78 percent of them used the lead farmer approach. Of those organizations that used the approach, 66.7 percent perceived it to be effective and attributed this to issues of sustainability of activities initiated and community empowerment resulting in increased adoption rates of innovations. It was noted that lead farmers act as role models, which motivates others to try various innovations in their own fields.
6
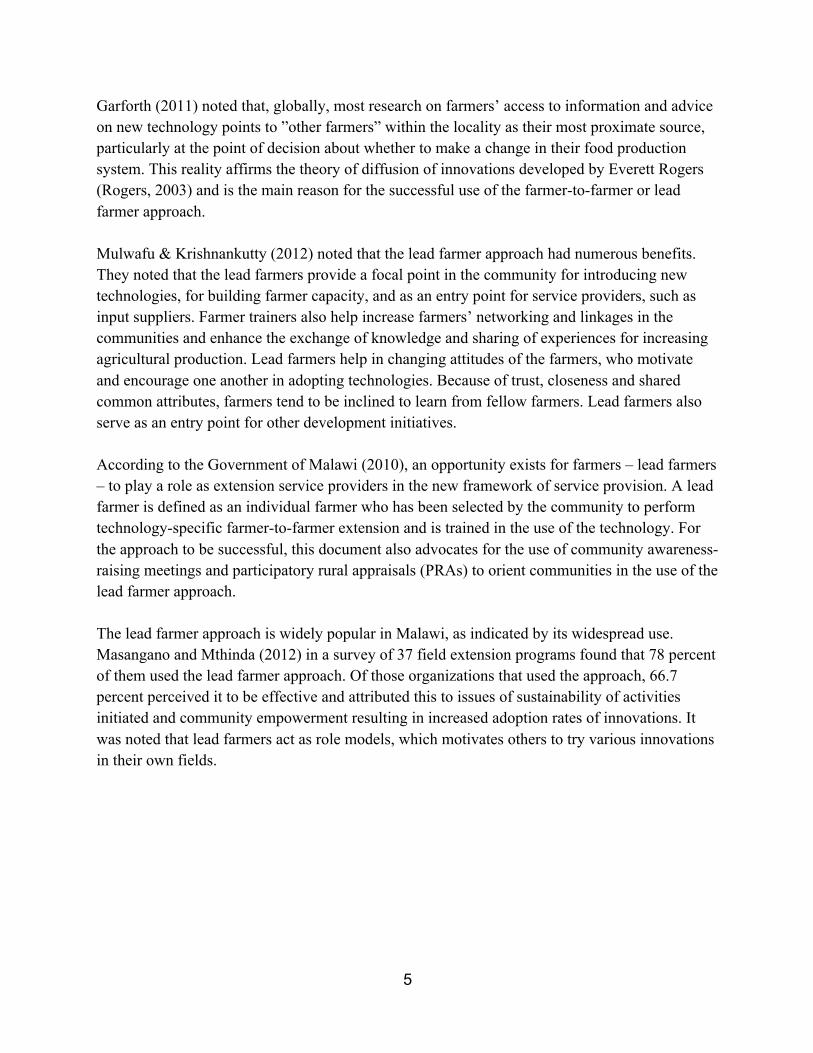
4. SURVEY FINDINGS 4.1 Demographics The questionnaire results show that lead farmers are relatively youthful. The average age is 42 years, the mode is 35 years, the minimum age is 21, and the maximum is 76. The average age of men was 44.2 years, and the average for women was 38 years. The majority (59 percent) of lead farmers in the sample are men. The sample has more female lead farmers than the general population because purposive sampling was applied to ensure a significant representation of this group (Table 4). Lead farmers working with DAES account for 78 percent of the sample, and 40 percent of them are women. The percentage of women lead farmers differs depending on the type of organization. The NPOs sampled had a slightly higher percentage of female lead farmers (46.2 percent). The private sector may be biased in favor of male lead farmers – only one out of five lead farmers was a woman (Table 4). The sample of lead farmers from the private sector, however, was very small (five). Other possible explanations may be the relatively high education requirement for provision of extension services in the private sector or the fact that most farmers working as growers with private companies are male. This area requires further investigation. Table 4. Gender of respondents by type of organization.
Organization Male Female Total Number Percent Number Percent Number Percent
Public 95 59.7 64 40.3 159 100 NPOs 21 53.8 18 46.2 39 100 Private 4 80.0 1 20 5 100 Total 120 59.1 83 40.9 203 100
As can be observed from Table 5, 87 percent of the total sample of lead farmers are married. Of the total sample, less than 2 percent of the male lead farmers are single. In contrast, approximately 29 percent of the female lead farmers are single. The data also shows that approximately 23 percent of the respondents, mostly married women, are not heads of households; the rest are household heads. Table 5. Cross-tabulation of marital status by sex. Marital status of respondents Male Female Total Married 98.3 71.1 87.2 Single (never married) 0.8 3.6 2.0 Single (divorced) 0.0 6.0 2.5 Single (widowed) 0.8 13.3 5.9 Single (separated) 0.0 6.0 2.5 Total 100.0 100.0 100.0

7
The majority of respondents (78 percent) are members of some kind of group or club. Slightly more males (80 percent) than females (76 percent) are members of groups or clubs. An analysis of the names of the clubs suggests that the clubs represent a variety of agricultural businesses (e.g., crop, fisheries etc.). Some level of education is often deemed necessary by the organizations selecting lead farmers. Many lead farmers are required to keep records, which requires basic literacy skills. In the sample of lead farmers, only 3 percent have either no education or have informal education only (see Table 6). A large majority (64 percent) have either some primary education or completed primary school education. Furthermore, 32 percent have secondary school education. Table 6. Educational achievements of lead farmers. Level Numbers Percent No formal education 5 2.5 Informal education only 1 .5 Some primary school 84 41.4 Primary school completed 46 22.7 Some secondary school/high school 55 27.1 Secondary school completed 10 4.9 Postsecondary qualification 2 1.0 Total 203 100.0 Disaggregated by gender the data on education levels among lead farmers sampled shows that 34 percent of male and 52 percent of female lead farmers attended some primary school, and 23 percent of both males and females completed primary school education (Figure 1). Only a few (3 percent) of male and female lead farmers have not received any formal education.
Figure 1. Education achievements of lead farmers by gender.
3%
5%
41%
23%
27%
5%
1%
3%
0%
34%
23%
33%
7%
1%
2%
1%
52%
23%
18%
2%
1%
No formal schooling
Informal schooling only
Some primary school
Primary school completed
Some secondary school/high school
Secondary school completed
Post secondary qualification
Female
Male
All
8
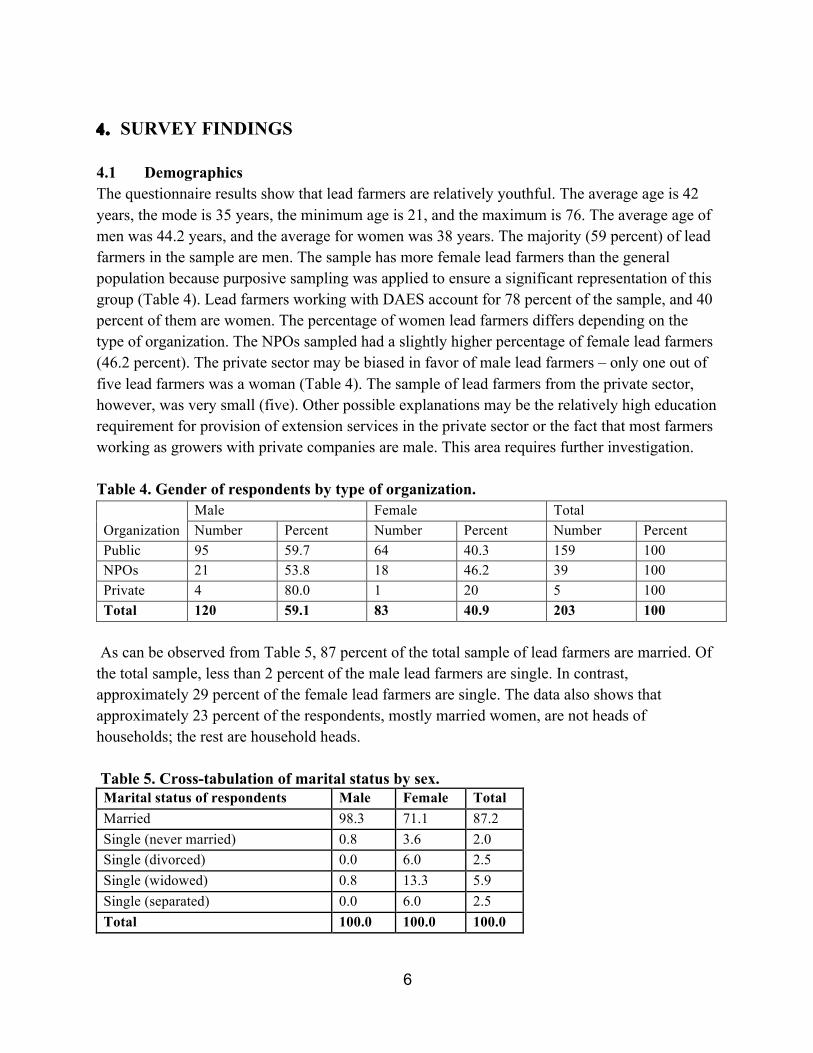
4.2 Criteria for selecting lead farmers It is important to note that the farmer-to-farmer approach has been in use for over 10 years in Malawi. For instance, in our sample of lead farmers, five had become lead farmers between 1994 and 2000. Since then, the number of farmers joining farmer-to-farmer programs has steadily increased. In our survey, about 7 percent joined between 2001 and 2005, and 30 percent between 2006 and 2010. The remainder and majority became lead farmers between 2011 and 2013/14 (see Table 7). This finding is in agreement with other studies. Kundhlande et al. (2014) reported that the use of the farmer-to-farmer approach dates back to the 1990s. The report notes that the majority of the extension organizations started using the lead farmer approach between 2003 and 2011. Table 7. The year in which respondents became lead farmers. Year Number Percent Before 2000 5 2.5 2001-2005 15 7.4
2006-2010 60 29.6
2011 to date 123 60.6
Total 203 100.0
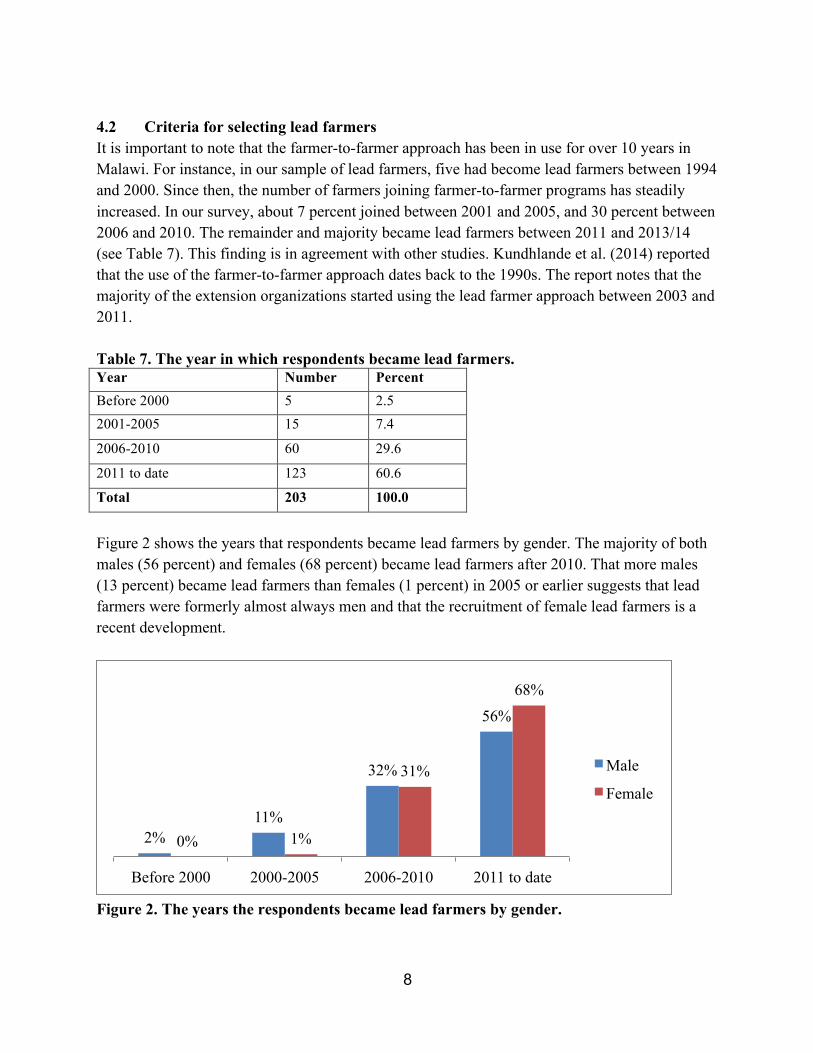
Figure 2 shows the years that respondents became lead farmers by gender. The majority of both males (56 percent) and females (68 percent) became lead farmers after 2010. That more males (13 percent) became lead farmers than females (1 percent) in 2005 or earlier suggests that lead farmers were formerly almost always men and that the recruitment of female lead farmers is a recent development.
Figure 2. The years the respondents became lead farmers by gender.
2% 11%
32%
56%
0% 1%
31%
68%
Before 2000 2000-2005 2006-2010 2011 to date
Male
Female
9
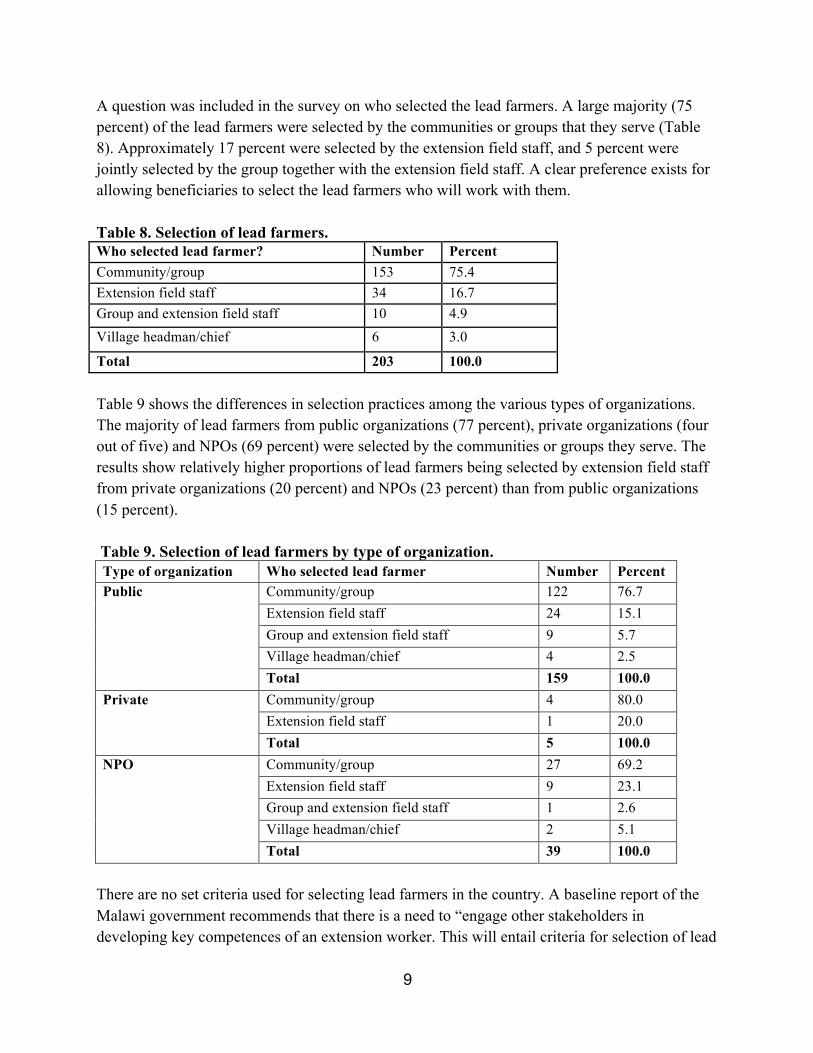
A question was included in the survey on who selected the lead farmers. A large majority (75 percent) of the lead farmers were selected by the communities or groups that they serve (Table 8). Approximately 17 percent were selected by the extension field staff, and 5 percent were jointly selected by the group together with the extension field staff. A clear preference exists for allowing beneficiaries to select the lead farmers who will work with them. Table 8. Selection of lead farmers. Who selected lead farmer? Number Percent Community/group 153 75.4 Extension field staff 34 16.7 Group and extension field staff 10 4.9 Village headman/chief 6 3.0 Total 203 100.0 Table 9 shows the differences in selection practices among the various types of organizations. The majority of lead farmers from public organizations (77 percent), private organizations (four out of five) and NPOs (69 percent) were selected by the communities or groups they serve. The results show relatively higher proportions of lead farmers being selected by extension field staff from private organizations (20 percent) and NPOs (23 percent) than from public organizations (15 percent). Table 9. Selection of lead farmers by type of organization. Type of organization Who selected lead farmer Number Percent Public Community/group 122 76.7
Extension field staff 24 15.1 Group and extension field staff 9 5.7 Village headman/chief 4 2.5 Total 159 100.0
Private Community/group 4 80.0 Extension field staff 1 20.0 Total 5 100.0
NPO Community/group 27 69.2 Extension field staff 9 23.1 Group and extension field staff 1 2.6 Village headman/chief 2 5.1 Total 39 100.0
There are no set criteria used for selecting lead farmers in the country. A baseline report of the Malawi government recommends that there is a need to “engage other stakeholders in developing key competences of an extension worker. This will entail criteria for selection of lead
10
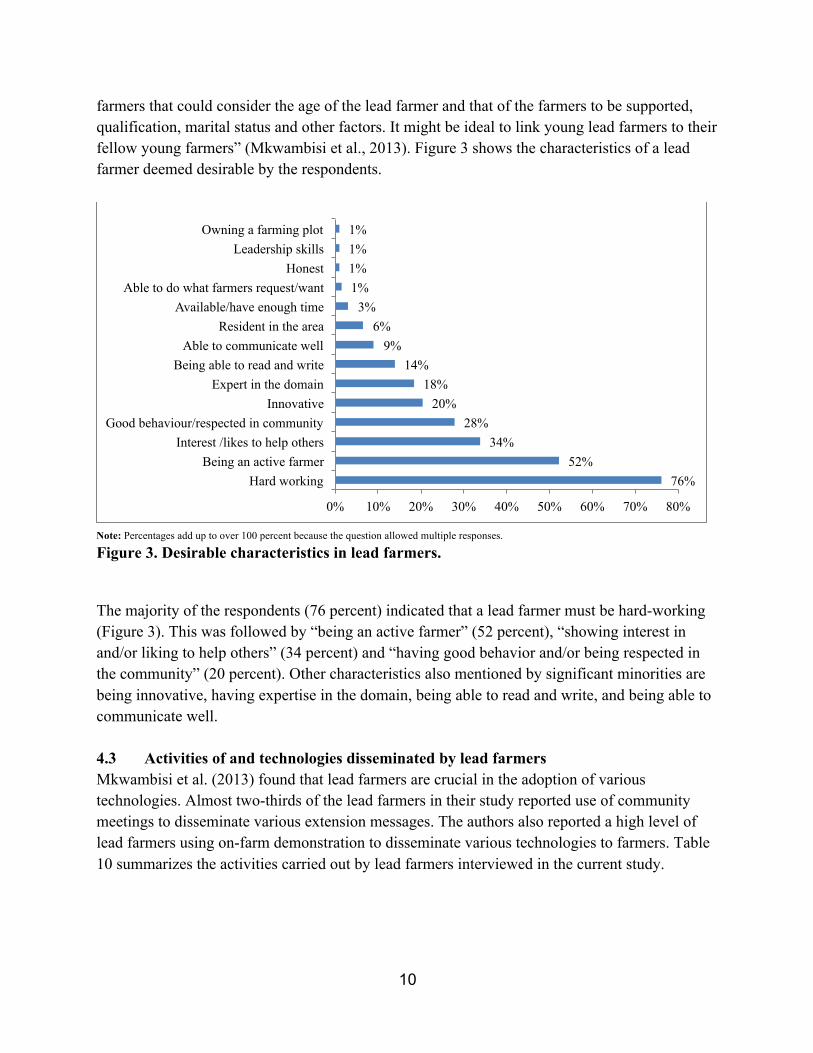
farmers that could consider the age of the lead farmer and that of the farmers to be supported, qualification, marital status and other factors. It might be ideal to link young lead farmers to their fellow young farmers” (Mkwambisi et al., 2013). Figure 3 shows the characteristics of a lead farmer deemed desirable by the respondents.
Note: Percentages add up to over 100 percent because the question allowed multiple responses.
Figure 3. Desirable characteristics in lead farmers. The majority of the respondents (76 percent) indicated that a lead farmer must be hard-working (Figure 3). This was followed by “being an active farmer” (52 percent), “showing interest in and/or liking to help others” (34 percent) and “having good behavior and/or being respected in the community” (20 percent). Other characteristics also mentioned by significant minorities are being innovative, having expertise in the domain, being able to read and write, and being able to communicate well. 4.3 Activities of and technologies disseminated by lead farmers Mkwambisi et al. (2013) found that lead farmers are crucial in the adoption of various technologies. Almost two-thirds of the lead farmers in their study reported use of community meetings to disseminate various extension messages. The authors also reported a high level of lead farmers using on-farm demonstration to disseminate various technologies to farmers. Table 10 summarizes the activities carried out by lead farmers interviewed in the current study.
76% 52%
34% 28%
20% 18%
14% 9%
6% 3%
1% 1% 1% 1%
0% 10% 20% 30% 40% 50% 60% 70% 80%
Hard working Being an active farmer
Interest /likes to help others Good behaviour/respected in community
Innovative Expert in the domain
Being able to read and write Able to communicate well
Resident in the area Available/have enough time
Able to do what farmers request/want Honest
Leadership skills Owning a farming plot
11
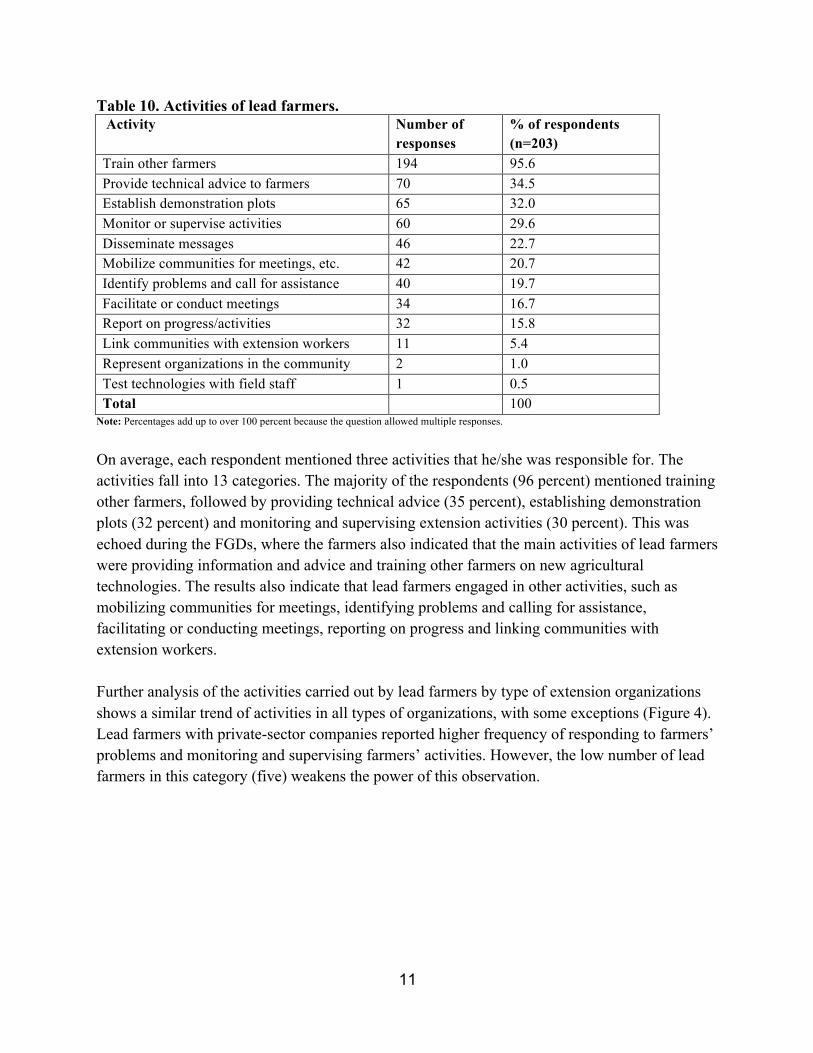
Table 10. Activities of lead farmers. Activity Number of
responses % of respondents (n=203)
Train other farmers 194 95.6 Provide technical advice to farmers 70 34.5 Establish demonstration plots 65 32.0 Monitor or supervise activities 60 29.6 Disseminate messages 46 22.7 Mobilize communities for meetings, etc. 42 20.7 Identify problems and call for assistance 40 19.7 Facilitate or conduct meetings 34 16.7 Report on progress/activities 32 15.8 Link communities with extension workers 11 5.4 Represent organizations in the community 2 1.0 Test technologies with field staff 1 0.5 Total 100
Note: Percentages add up to over 100 percent because the question allowed multiple responses.
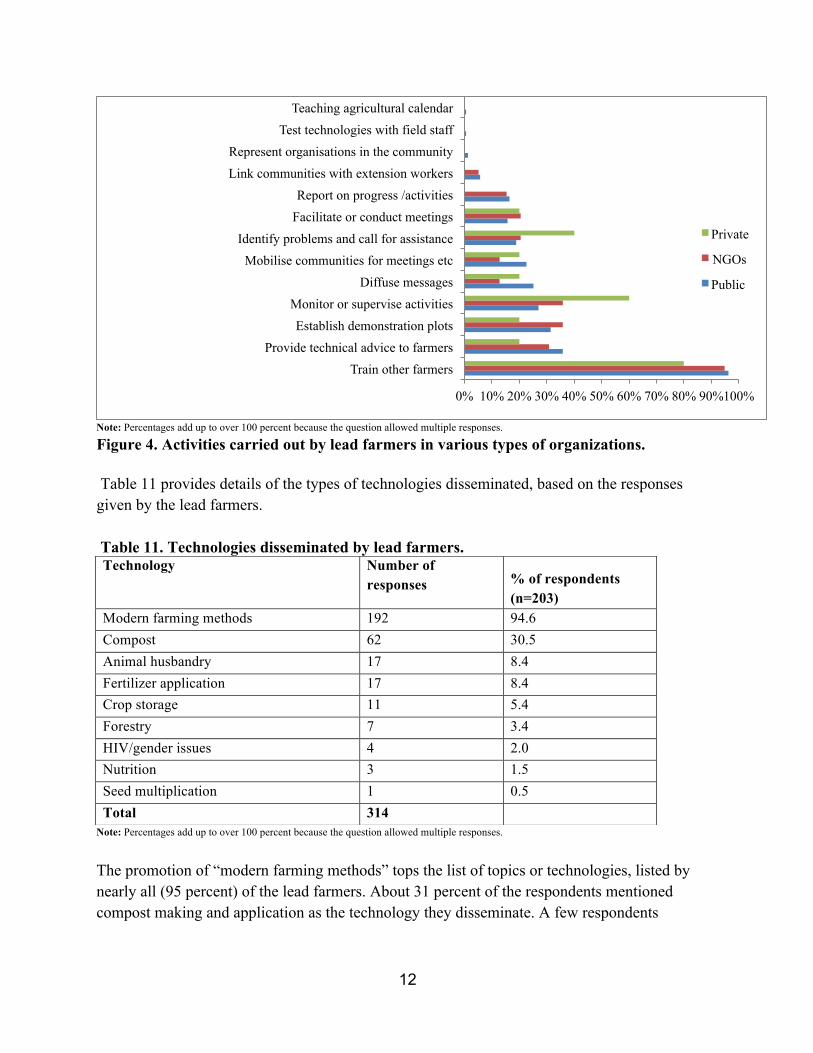
On average, each respondent mentioned three activities that he/she was responsible for. The activities fall into 13 categories. The majority of the respondents (96 percent) mentioned training other farmers, followed by providing technical advice (35 percent), establishing demonstration plots (32 percent) and monitoring and supervising extension activities (30 percent). This was echoed during the FGDs, where the farmers also indicated that the main activities of lead farmers were providing information and advice and training other farmers on new agricultural technologies. The results also indicate that lead farmers engaged in other activities, such as mobilizing communities for meetings, identifying problems and calling for assistance, facilitating or conducting meetings, reporting on progress and linking communities with extension workers. Further analysis of the activities carried out by lead farmers by type of extension organizations shows a similar trend of activities in all types of organizations, with some exceptions (Figure 4). Lead farmers with private-sector companies reported higher frequency of responding to farmers’ problems and monitoring and supervising farmers’ activities. However, the low number of lead farmers in this category (five) weakens the power of this observation.
12
Note: Percentages add up to over 100 percent because the question allowed multiple responses.
Figure 4. Activities carried out by lead farmers in various types of organizations. Table 11 provides details of the types of technologies disseminated, based on the responses given by the lead farmers. Table 11. Technologies disseminated by lead farmers.
Note: Percentages add up to over 100 percent because the question allowed multiple responses.
The promotion of “modern farming methods” tops the list of topics or technologies, listed by nearly all (95 percent) of the lead farmers. About 31 percent of the respondents mentioned compost making and application as the technology they disseminate. A few respondents
0% 10% 20% 30% 40% 50% 60% 70% 80% 90% 100%
Train other farmers Provide technical advice to farmers
Establish demonstration plots Monitor or supervise activities
Diffuse messages Mobilise communities for meetings etc
Identify problems and call for assistance Facilitate or conduct meetings Report on progress /activities
Link communities with extension workers Represent organisations in the community
Test technologies with field staff Teaching agricultural calendar
Private
NGOs
Public
Technology Number of responses % of respondents
(n=203) Modern farming methods 192 94.6 Compost 62 30.5 Animal husbandry 17 8.4 Fertilizer application 17 8.4 Crop storage 11 5.4 Forestry 7 3.4 HIV/gender issues 4 2.0 Nutrition 3 1.5 Seed multiplication 1 0.5 Total 314
13
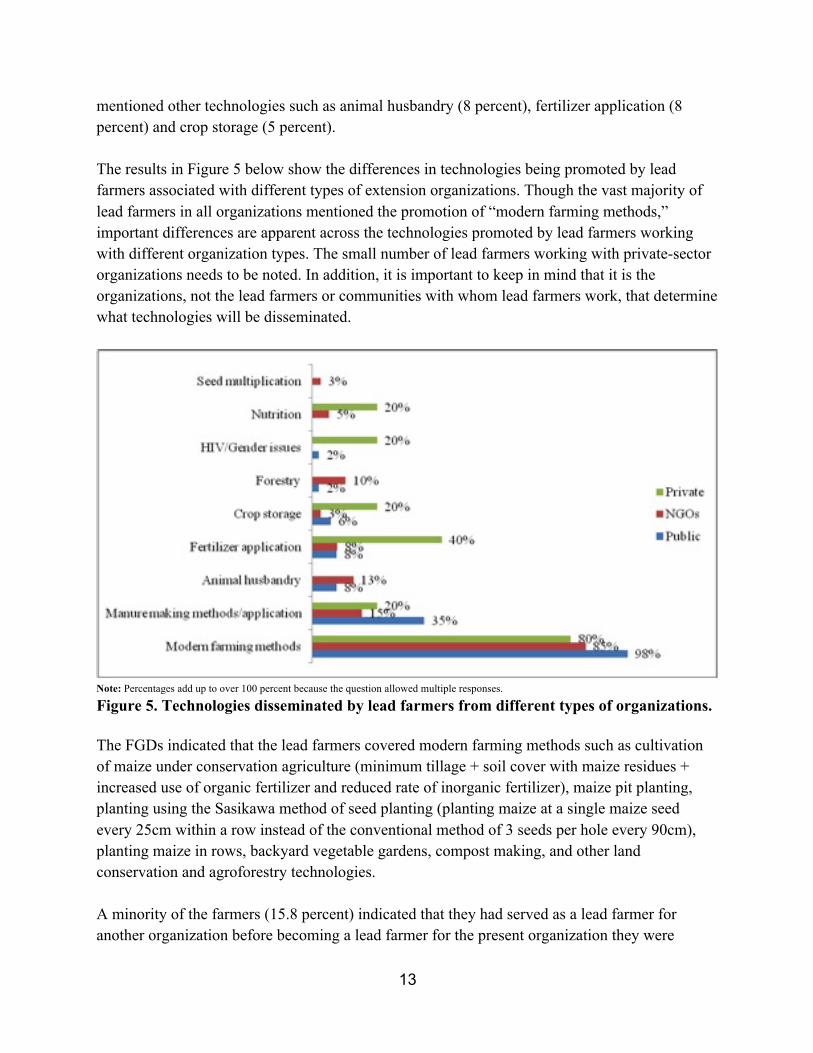
mentioned other technologies such as animal husbandry (8 percent), fertilizer application (8 percent) and crop storage (5 percent). The results in Figure 5 below show the differences in technologies being promoted by lead farmers associated with different types of extension organizations. Though the vast majority of lead farmers in all organizations mentioned the promotion of “modern farming methods,” important differences are apparent across the technologies promoted by lead farmers working with different organization types. The small number of lead farmers working with private-sector organizations needs to be noted. In addition, it is important to keep in mind that it is the organizations, not the lead farmers or communities with whom lead farmers work, that determine what technologies will be disseminated.
Note: Percentages add up to over 100 percent because the question allowed multiple responses.
Figure 5. Technologies disseminated by lead farmers from different types of organizations. The FGDs indicated that the lead farmers covered modern farming methods such as cultivation of maize under conservation agriculture (minimum tillage + soil cover with maize residues + increased use of organic fertilizer and reduced rate of inorganic fertilizer), maize pit planting, planting using the Sasikawa method of seed planting (planting maize at a single maize seed every 25cm within a row instead of the conventional method of 3 seeds per hole every 90cm), planting maize in rows, backyard vegetable gardens, compost making, and other land conservation and agroforestry technologies. A minority of the farmers (15.8 percent) indicated that they had served as a lead farmer for another organization before becoming a lead farmer for the present organization they were
14
working with. Some of them (22.2 percent) were serving as lead farmers for more than one organization. Kundhlande et al. (2014) noted that some organizations do not allow their lead farmers to work for other organizations.
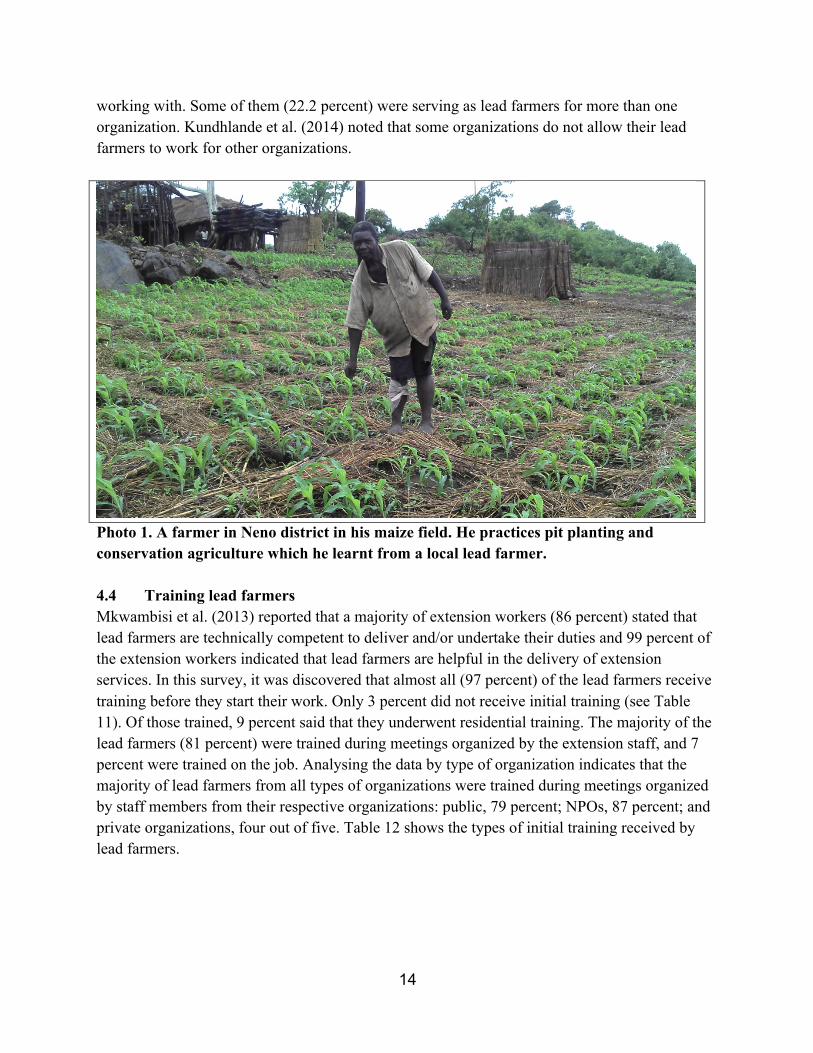
Photo 1. A farmer in Neno district in his maize field. He practices pit planting and conservation agriculture which he learnt from a local lead farmer. 4.4 Training lead farmers Mkwambisi et al. (2013) reported that a majority of extension workers (86 percent) stated that lead farmers are technically competent to deliver and/or undertake their duties and 99 percent of the extension workers indicated that lead farmers are helpful in the delivery of extension services. In this survey, it was discovered that almost all (97 percent) of the lead farmers receive training before they start their work. Only 3 percent did not receive initial training (see Table 11). Of those trained, 9 percent said that they underwent residential training. The majority of the lead farmers (81 percent) were trained during meetings organized by the extension staff, and 7 percent were trained on the job. Analysing the data by type of organization indicates that the majority of lead farmers from all types of organizations were trained during meetings organized by staff members from their respective organizations: public, 79 percent; NPOs, 87 percent; and private organizations, four out of five. Table 12 shows the types of initial training received by lead farmers.
15
Table 12. Types of initial training received by lead farmers. Types of training % of respondents by type of organization
% of all respondents (n=203)
Public (n=159)
NPOs (n=39) Private (n=5)
Residential 9.4 10.1 5.1 20 On-the-job 6.9 7.5 5.1 - During meetings with field staff 80.8 79.2 87.2 80 No training 3 3.1 2.6 - Total 100 100 100 100
When asked about the duration of the initial training, 45 percent said the training lasted one day; about 19 percent said two to three days, 9 percent said four days or more, and 27 percent said that their training was for more than five days (Table 13). A similar pattern in the reported duration of training exists when the data are analyzed by type of extension organizations. Table 13. Length of initial training for lead farmers. Length of training % of respondents by type of organization
% of all responses (n=196)
Public (n= 153)
NPOs (n=38)
Private (n=5)
1 day 45.4 47.1 39.5 40 2-3 days 18.9 17 26.3 20 4-5 days 8.7 7.8 13.2 -
More than 5 days 27 28.1 21.1 40 Total 100 100 100 100
When lead farmers were asked what types of topics were covered during training, 69 percent of the respondents mentioned technical topics, such as farming methods, and 70 percent mentioned non-technical topics such as communication, extension and facilitation skills (Table 14). Similar results are observed when the data is analyzed by the type of organization to which the lead farmers belong.

16
Table 14. Topics covered during initial training of lead farmers. Topics covered % of respondents by
organizations
Number of responses
% of all respondents (n=197)
Public (n=154)
NPOs (n=38)
Private (n=5)
Technical 136 69 66.9 78.9 60 Communication, extension and /or facilitation 138 70.1 69.5 71.1 80
Note: Percentages add up to over 100 percent because the question allowed multiple responses.
The technical topics covered in training are shown in Table 15. As may be expected, the list of topics mirrors those reported in Table 9 on the technologies that lead farmers reported promoting, confirming that lead farmers are in fact trained on the technologies they disseminate. Table 15. Technical topics covered during initial training of lead farmers. Technical topics % of respondents by
organization Number of
responses % of all respondents (n=139)
Public (n=106)
NPOs (n=38)
Private (n=3)
Compost 43 30.9 34.9 20
Livestock husbandry
13 9.4 9.4 6.7
Modern farming methods
125 89.9 89.9 86.7 33.3
Fertilizer application
9 6.5 6.5 3.3 33.3
Nutrition 3 2.2 2.2 6.7 33.3 Crop storage 1 0.7 0.7
Note: Percentages add up to over 100 percent because the question allowed multiple responses. In addition, the number of respondents in the private sector was so small that it is difficult to generate meaningful interpretation from the results.
Results in Table 16 show that a majority of the lead farmers (56 percent) received only an initial training and did not get any additional in-service training. A cross-tabulation analysis shows that even the 3 percent of the lead farmers who did not receive initial training did not receive any training later on.

17
Table 16. Additional training received by lead farmers.
If received additional training % by type of organization Number Percent Public (n=159) NPOs (n=39) Private (n=5) Yes 89 43.8 45.9 35.9 40 No 114 56.2 54.1 64.1 60 Total 203 100 100 100 100
The most common type of additional training reported by lead farmers was through meetings with field staff members (92 percent of those receiving additional training). Other types included on-the-job (20 percent) and residential training (8 percent). The data in Figure 6 again shows that the topics/domains covered during the additional training attended by lead farmers mirror the activities that they reported in their extension duties. Most of the lead farmers who attended additional training (92 percent) indicated that they received such training during meetings organized by field extension staff.
Figure 6. Domains and types of additional training received by lead farmers. That farmers learn better from fellow farmers has long been recognized and constitutes the core assumption of the farmer-to-farmer extension approach. The efficacy of farmer-to-farmer learning is also one of the reasons why exchange visits and study tours to other farmers’ fields are used in many extension programs. This issue was investigated in the survey, and the results are given in Table 17. Surprisingly a large majority of the lead farmers (59 percent) across all types of extension organizations have not been involved in exchange visits or study tours.
76.7% 17.8%
7.8% 5.6%
3.3% 2.2%
1.1% 1.1% 1.1% 1.1% 1.1% 1.1%
Farming methods Manure application
Farming as a business Managerial skills
Livestock husbandry Gross margins
Transportation of products Village savings and loans
Processing Chemical application
Nutrition Agroforestry
18
Table 17. Participation in exchange visits or study tours by lead farmers. If lead farmer participates % by type of organization Number % Public (n=159) NPOs (n=39) Private (n=5) Yes 83 40.9 41.5 41 20 No 120 59.1 58.5 59 80 Total 203 100 100 100 100
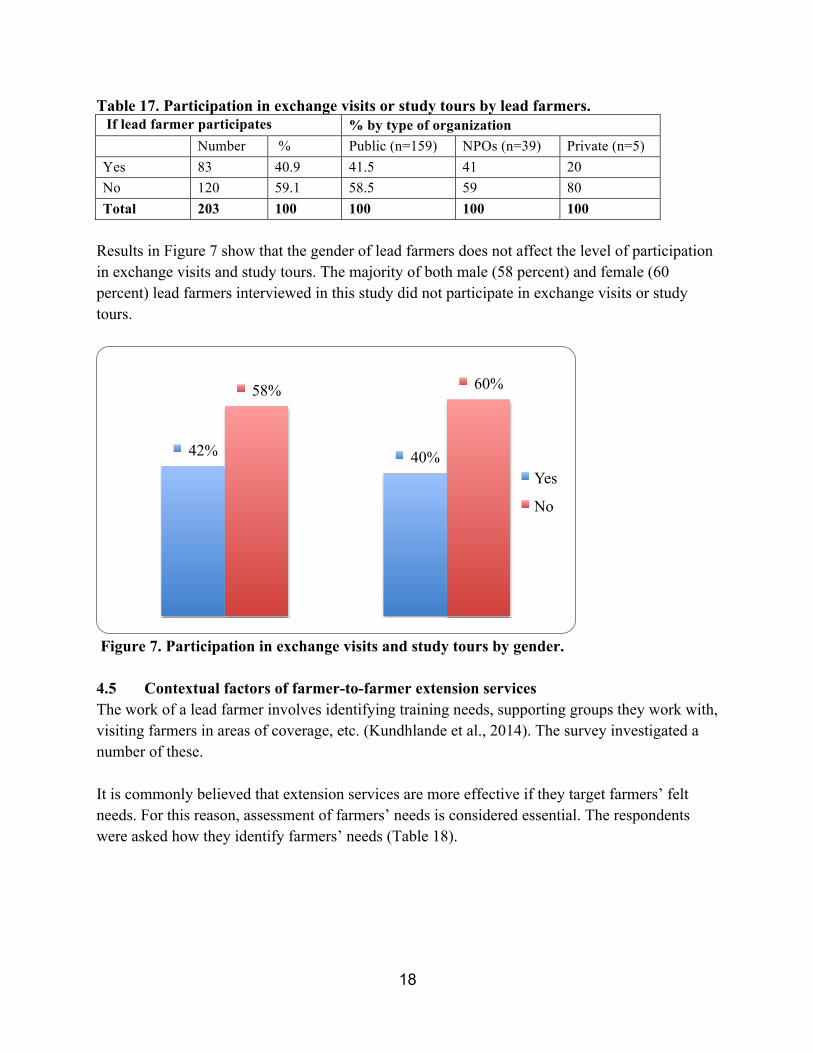
Results in Figure 7 show that the gender of lead farmers does not affect the level of participation in exchange visits and study tours. The majority of both male (58 percent) and female (60 percent) lead farmers interviewed in this study did not participate in exchange visits or study tours.
Figure 7. Participation in exchange visits and study tours by gender. 4.5 Contextual factors of farmer-to-farmer extension services The work of a lead farmer involves identifying training needs, supporting groups they work with, visiting farmers in areas of coverage, etc. (Kundhlande et al., 2014). The survey investigated a number of these. It is commonly believed that extension services are more effective if they target farmers’ felt needs. For this reason, assessment of farmers’ needs is considered essential. The respondents were asked how they identify farmers’ needs (Table 18).
42% 40%
58% 60%
Yes
No
19
Table 18. How lead farmers identify training needs. How do you identify training needs? % of respondents by type of
organization
Number of responses
% of all respondents (n=203)
Public (n=159)
NPOs (n=39)
Private (n=5)
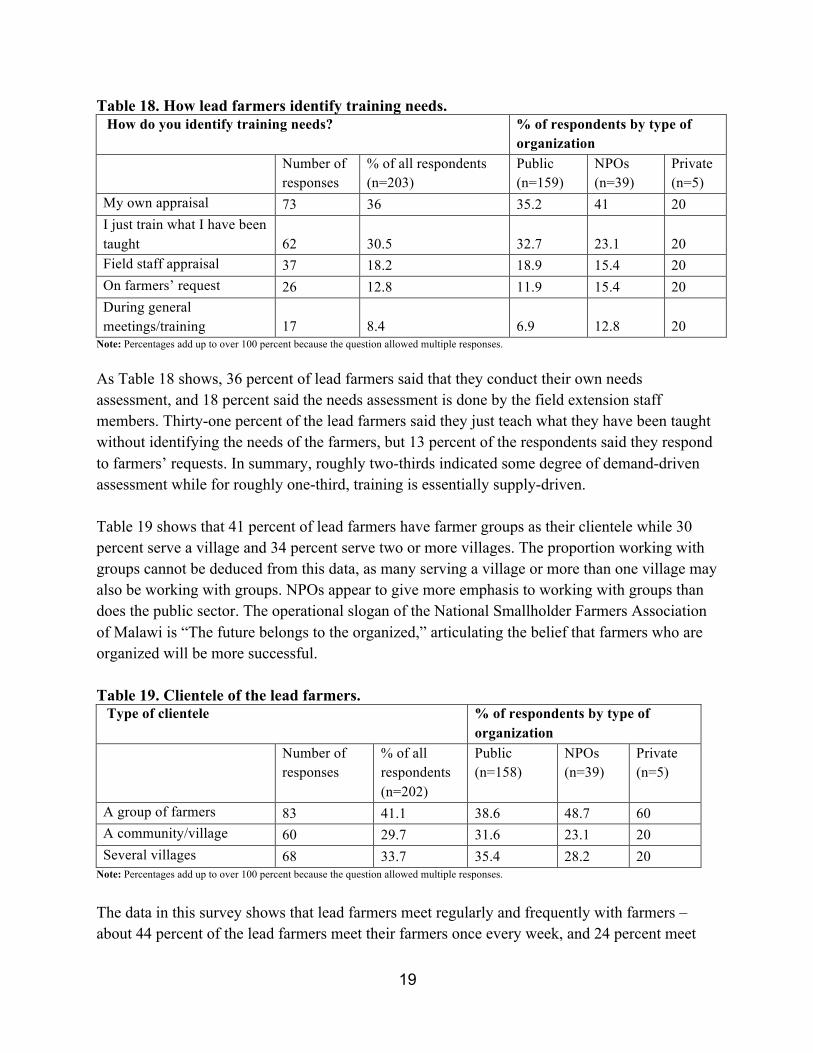
My own appraisal 73 36 35.2 41 20 I just train what I have been taught 62 30.5 32.7 23.1 20 Field staff appraisal 37 18.2 18.9 15.4 20 On farmers’ request 26 12.8 11.9 15.4 20 During general meetings/training 17 8.4 6.9 12.8 20
Note: Percentages add up to over 100 percent because the question allowed multiple responses. As Table 18 shows, 36 percent of lead farmers said that they conduct their own needs assessment, and 18 percent said the needs assessment is done by the field extension staff members. Thirty-one percent of the lead farmers said they just teach what they have been taught without identifying the needs of the farmers, but 13 percent of the respondents said they respond to farmers’ requests. In summary, roughly two-thirds indicated some degree of demand-driven assessment while for roughly one-third, training is essentially supply-driven. Table 19 shows that 41 percent of lead farmers have farmer groups as their clientele while 30 percent serve a village and 34 percent serve two or more villages. The proportion working with groups cannot be deduced from this data, as many serving a village or more than one village may also be working with groups. NPOs appear to give more emphasis to working with groups than does the public sector. The operational slogan of the National Smallholder Farmers Association of Malawi is “The future belongs to the organized,” articulating the belief that farmers who are organized will be more successful. Table 19. Clientele of the lead farmers. Type of clientele % of respondents by type of
organization
Number of responses
% of all respondents (n=202)
Public (n=158)
NPOs (n=39)
Private (n=5)
A group of farmers 83 41.1 38.6 48.7 60 A community/village 60 29.7 31.6 23.1 20 Several villages 68 33.7 35.4 28.2 20
Note: Percentages add up to over 100 percent because the question allowed multiple responses.
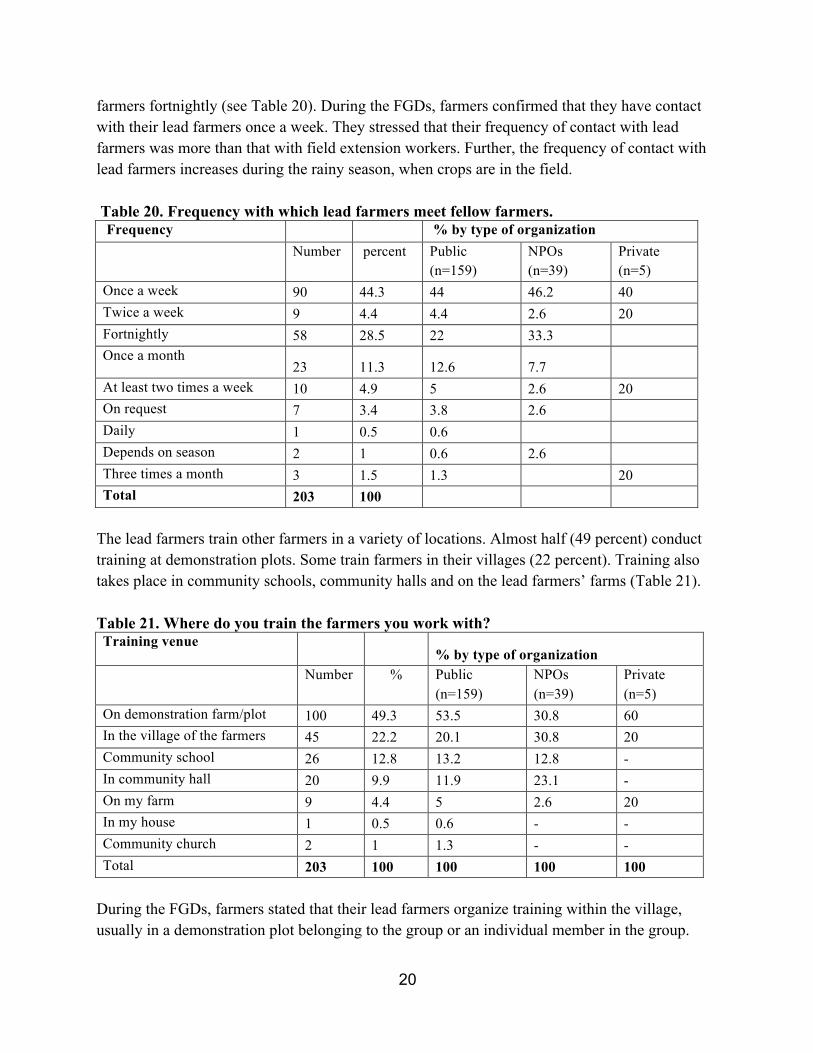
The data in this survey shows that lead farmers meet regularly and frequently with farmers – about 44 percent of the lead farmers meet their farmers once every week, and 24 percent meet
20
farmers fortnightly (see Table 20). During the FGDs, farmers confirmed that they have contact with their lead farmers once a week. They stressed that their frequency of contact with lead farmers was more than that with field extension workers. Further, the frequency of contact with lead farmers increases during the rainy season, when crops are in the field. Table 20. Frequency with which lead farmers meet fellow farmers. Frequency % by type of organization
Number percent Public
(n=159) NPOs (n=39)
Private (n=5)
Once a week 90 44.3 44 46.2 40 Twice a week 9 4.4 4.4 2.6 20 Fortnightly 58 28.5 22 33.3 Once a month
23 11.3 12.6 7.7 At least two times a week 10 4.9 5 2.6 20 On request 7 3.4 3.8 2.6 Daily 1 0.5 0.6 Depends on season 2 1 0.6 2.6 Three times a month 3 1.5 1.3 20 Total 203 100
The lead farmers train other farmers in a variety of locations. Almost half (49 percent) conduct training at demonstration plots. Some train farmers in their villages (22 percent). Training also takes place in community schools, community halls and on the lead farmers’ farms (Table 21). Table 21. Where do you train the farmers you work with? Training venue
% by type of organization
Number % Public
(n=159) NPOs (n=39)
Private (n=5)
On demonstration farm/plot 100 49.3 53.5 30.8 60 In the village of the farmers 45 22.2 20.1 30.8 20 Community school 26 12.8 13.2 12.8 - In community hall 20 9.9 11.9 23.1 - On my farm 9 4.4 5 2.6 20 In my house 1 0.5 0.6 - - Community church 2 1 1.3 - - Total 203 100 100 100 100
During the FGDs, farmers stated that their lead farmers organize training within the village, usually in a demonstration plot belonging to the group or an individual member in the group.
21
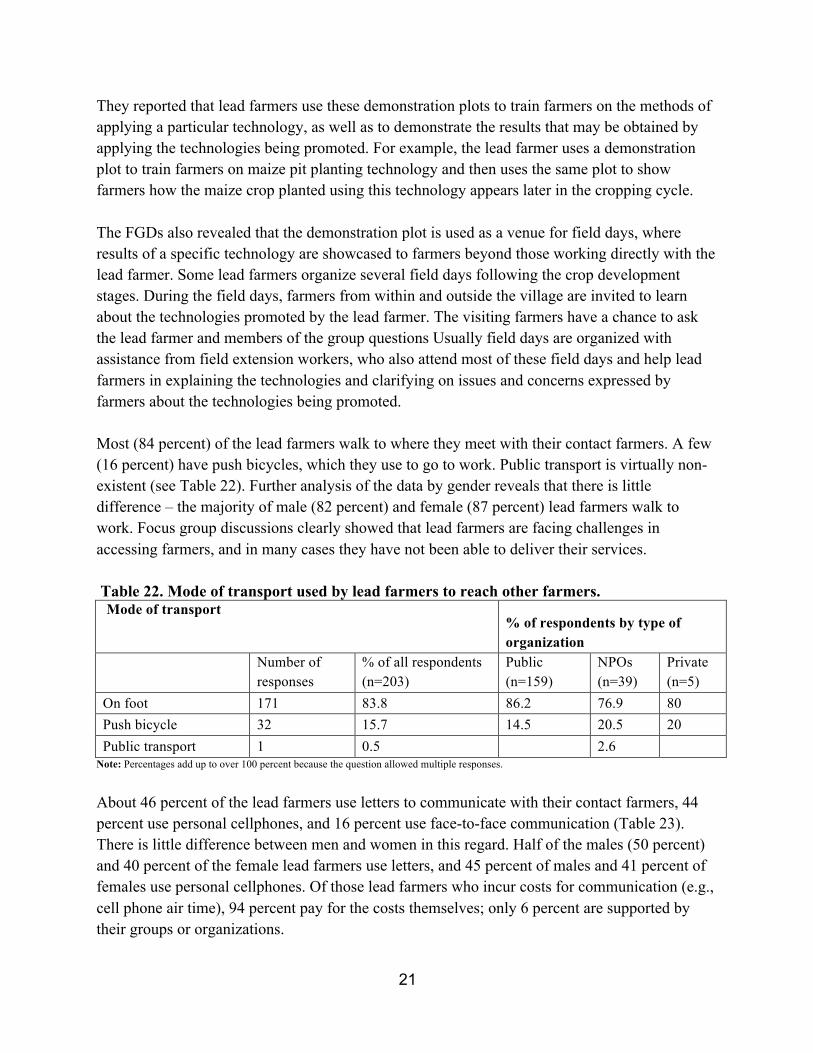
They reported that lead farmers use these demonstration plots to train farmers on the methods of applying a particular technology, as well as to demonstrate the results that may be obtained by applying the technologies being promoted. For example, the lead farmer uses a demonstration plot to train farmers on maize pit planting technology and then uses the same plot to show farmers how the maize crop planted using this technology appears later in the cropping cycle. The FGDs also revealed that the demonstration plot is used as a venue for field days, where results of a specific technology are showcased to farmers beyond those working directly with the lead farmer. Some lead farmers organize several field days following the crop development stages. During the field days, farmers from within and outside the village are invited to learn about the technologies promoted by the lead farmer. The visiting farmers have a chance to ask the lead farmer and members of the group questions Usually field days are organized with assistance from field extension workers, who also attend most of these field days and help lead farmers in explaining the technologies and clarifying on issues and concerns expressed by farmers about the technologies being promoted. Most (84 percent) of the lead farmers walk to where they meet with their contact farmers. A few (16 percent) have push bicycles, which they use to go to work. Public transport is virtually non-existent (see Table 22). Further analysis of the data by gender reveals that there is little difference – the majority of male (82 percent) and female (87 percent) lead farmers walk to work. Focus group discussions clearly showed that lead farmers are facing challenges in accessing farmers, and in many cases they have not been able to deliver their services. Table 22. Mode of transport used by lead farmers to reach other farmers. Mode of transport
% of respondents by type of organization
Number of responses
% of all respondents (n=203)
Public (n=159)
NPOs (n=39)
Private (n=5)
On foot 171 83.8 86.2 76.9 80 Push bicycle 32 15.7 14.5 20.5 20 Public transport 1 0.5 2.6
Note: Percentages add up to over 100 percent because the question allowed multiple responses.
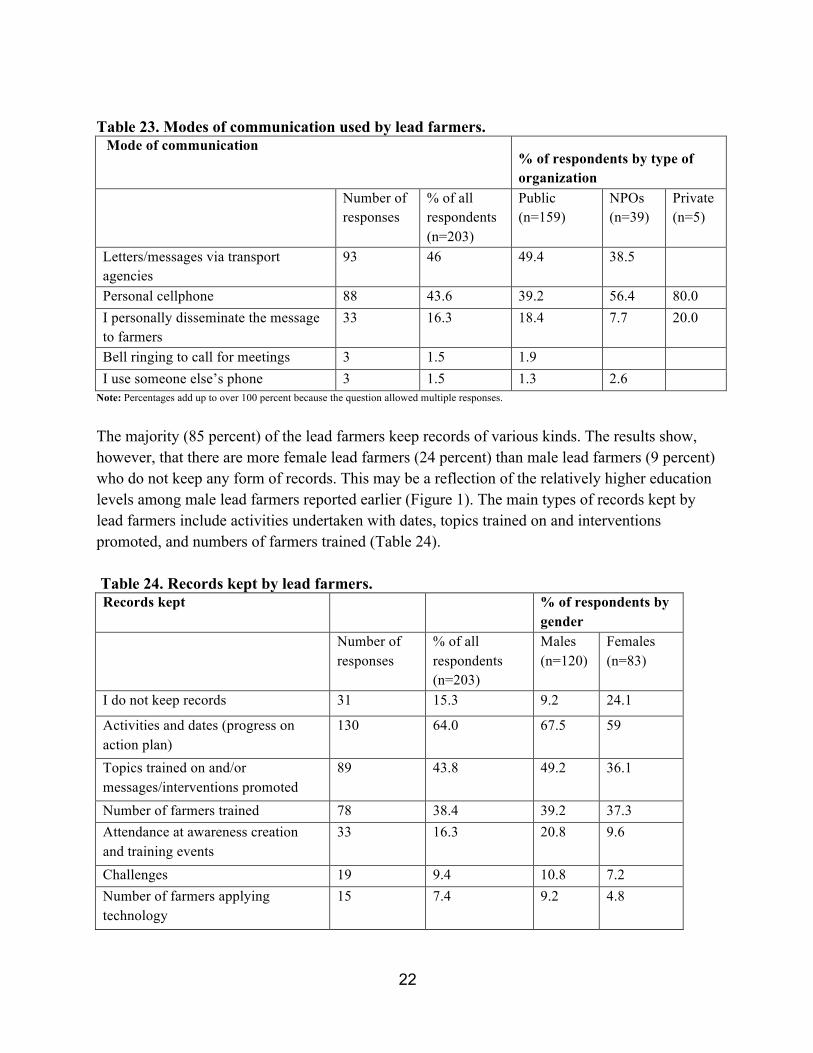
About 46 percent of the lead farmers use letters to communicate with their contact farmers, 44 percent use personal cellphones, and 16 percent use face-to-face communication (Table 23). There is little difference between men and women in this regard. Half of the males (50 percent) and 40 percent of the female lead farmers use letters, and 45 percent of males and 41 percent of females use personal cellphones. Of those lead farmers who incur costs for communication (e.g., cell phone air time), 94 percent pay for the costs themselves; only 6 percent are supported by their groups or organizations.
22
Table 23. Modes of communication used by lead farmers. Mode of communication
% of respondents by type of organization
Number of responses
% of all respondents (n=203)
Public (n=159)
NPOs (n=39)
Private (n=5)
Letters/messages via transport agencies
93 46 49.4 38.5
Personal cellphone 88 43.6 39.2 56.4 80.0 I personally disseminate the message to farmers
33 16.3 18.4 7.7 20.0
Bell ringing to call for meetings 3 1.5 1.9 I use someone else’s phone 3 1.5 1.3 2.6
Note: Percentages add up to over 100 percent because the question allowed multiple responses.
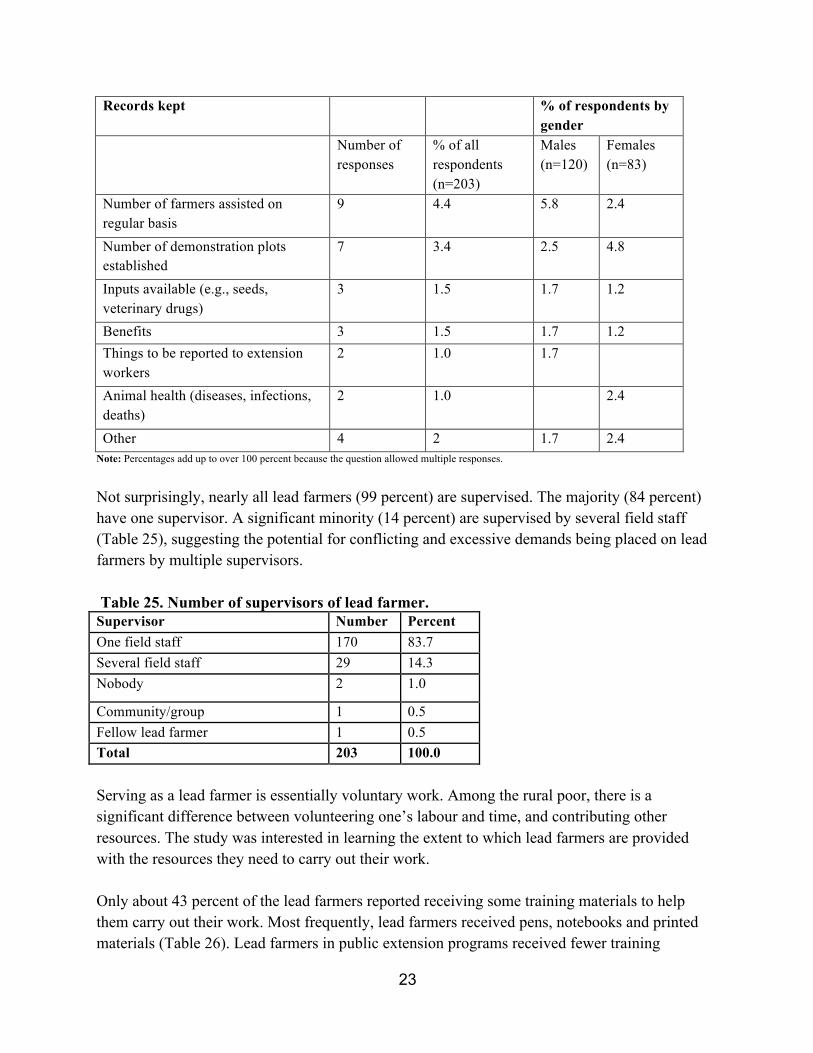
The majority (85 percent) of the lead farmers keep records of various kinds. The results show, however, that there are more female lead farmers (24 percent) than male lead farmers (9 percent) who do not keep any form of records. This may be a reflection of the relatively higher education levels among male lead farmers reported earlier (Figure 1). The main types of records kept by lead farmers include activities undertaken with dates, topics trained on and interventions promoted, and numbers of farmers trained (Table 24). Table 24. Records kept by lead farmers. Records kept % of respondents by
gender
Number of responses
% of all respondents (n=203)
Males (n=120)
Females (n=83)
I do not keep records 31 15.3 9.2 24.1
Activities and dates (progress on action plan)
130 64.0 67.5 59
Topics trained on and/or messages/interventions promoted
89 43.8 49.2 36.1
Number of farmers trained 78 38.4 39.2 37.3 Attendance at awareness creation and training events
33 16.3 20.8 9.6
Challenges 19 9.4 10.8 7.2 Number of farmers applying technology
15 7.4 9.2 4.8
23
Records kept % of respondents by gender
Number of responses
% of all respondents (n=203)
Males (n=120)
Females (n=83)
Number of farmers assisted on regular basis
9 4.4 5.8 2.4
Number of demonstration plots established
7 3.4 2.5 4.8
Inputs available (e.g., seeds, veterinary drugs)
3 1.5 1.7 1.2
Benefits 3 1.5 1.7 1.2 Things to be reported to extension workers
2 1.0 1.7
Animal health (diseases, infections, deaths)
2 1.0 2.4
Other 4 2 1.7 2.4 Note: Percentages add up to over 100 percent because the question allowed multiple responses.
Not surprisingly, nearly all lead farmers (99 percent) are supervised. The majority (84 percent) have one supervisor. A significant minority (14 percent) are supervised by several field staff (Table 25), suggesting the potential for conflicting and excessive demands being placed on lead farmers by multiple supervisors. Table 25. Number of supervisors of lead farmer. Supervisor Number Percent One field staff 170 83.7 Several field staff 29 14.3 Nobody 2 1.0
Community/group 1 0.5 Fellow lead farmer 1 0.5 Total 203 100.0 Serving as a lead farmer is essentially voluntary work. Among the rural poor, there is a significant difference between volunteering one’s labour and time, and contributing other resources. The study was interested in learning the extent to which lead farmers are provided with the resources they need to carry out their work. Only about 43 percent of the lead farmers reported receiving some training materials to help them carry out their work. Most frequently, lead farmers received pens, notebooks and printed materials (Table 26). Lead farmers in public extension programs received fewer training

24
materials, compared with those working with NPOs. The results of this study agree with those of Mkwambisi et al. (2013), who found that lead farmers are not adequately supported with training materials. Table 26. Training materials that lead farmers receive. Materials % of respondents by organization type
Number of responses
% of respondents (n=203)
Public (n=159)
NPOs (n=39)
Private (n=5)
Pens 30 14.8 10.1 35.9 0 Notebooks 27 13.3 9.4 30.8 0 Booklets/handbooks/manuals 12 5.9 3.8 15.5 0 Flip charts + markers 4 2.0 1.3 5.1 0 Posters 3 1.5 1.9 0 0 Bags 3 1.5 0.6 2.6 20 Nothing 116 57.1 63.5 30.8 40
Note: Percentages add up to over 100 percent because the question allowed multiple responses.
About 54 percent receive demonstration materials, such as seed, fertilizer or implements. Lead farmers working with the government received seed and fertilizer more frequently than those with NPOs, while those with NPOs were more likely to receive implements and chemicals. Table 27. Demonstration materials lead farmers received.
Materials
% of respondents by organization type
Number of
responses
% of all respondents
(n=203)
Public (n=159)
NPOs (n=39)
Private (n=5)
Seed 85 42 42 38 60 Fertilizer 55 27 28 23 20 Seedlings 8 4 4 5 0 Protective clothing 3 1 1 5 0 Cutlass 1 0 1 0 0 Watering cans 7 3 1 10 20 Show cards 3 1 2 0 0 Chemicals 17 8 6 15 20 Hoes 13 6 3 18 20 Goats 1 0.5 1 0 0 None 93 46 50 31 40
Note: Percentages add up to over 100 percent because the question allowed multiple responses.
25
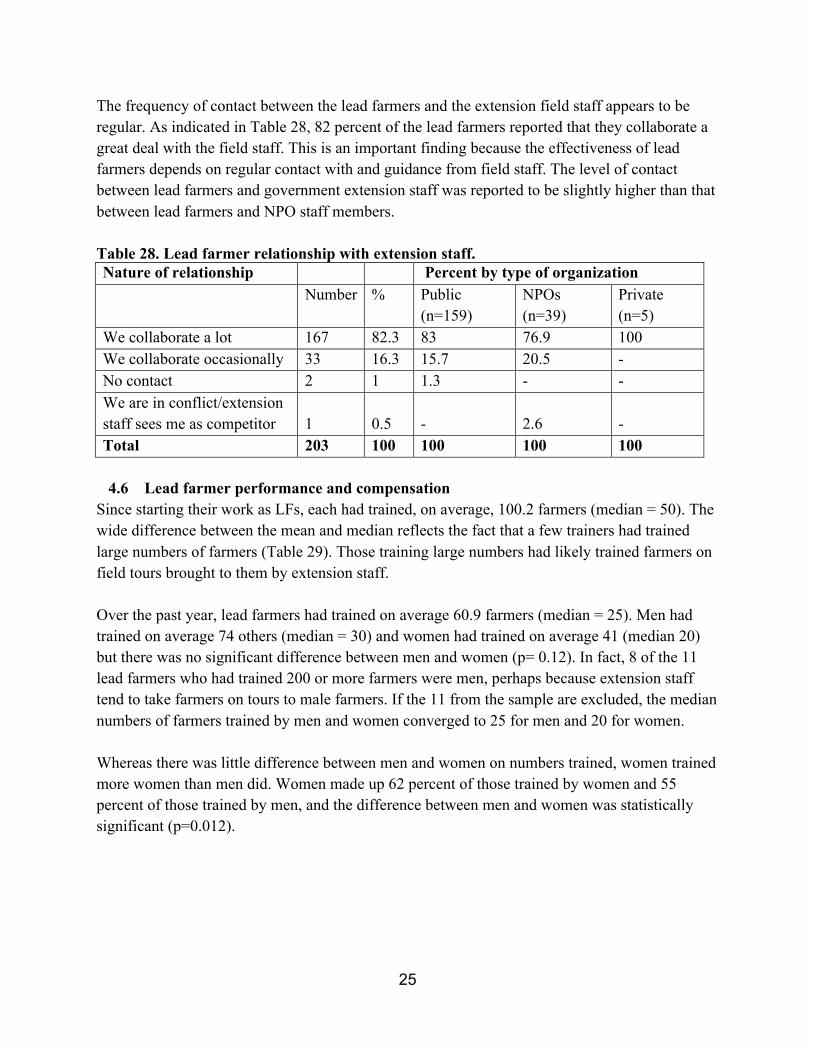
The frequency of contact between the lead farmers and the extension field staff appears to be regular. As indicated in Table 28, 82 percent of the lead farmers reported that they collaborate a great deal with the field staff. This is an important finding because the effectiveness of lead farmers depends on regular contact with and guidance from field staff. The level of contact between lead farmers and government extension staff was reported to be slightly higher than that between lead farmers and NPO staff members. Table 28. Lead farmer relationship with extension staff. Nature of relationship Percent by type of organization
Number % Public
(n=159) NPOs (n=39)
Private (n=5)
We collaborate a lot 167 82.3 83 76.9 100 We collaborate occasionally 33 16.3 15.7 20.5 - No contact 2 1 1.3 - - We are in conflict/extension staff sees me as competitor 1 0.5 - 2.6 - Total 203 100 100 100 100
4.6 Lead farmer performance and compensation
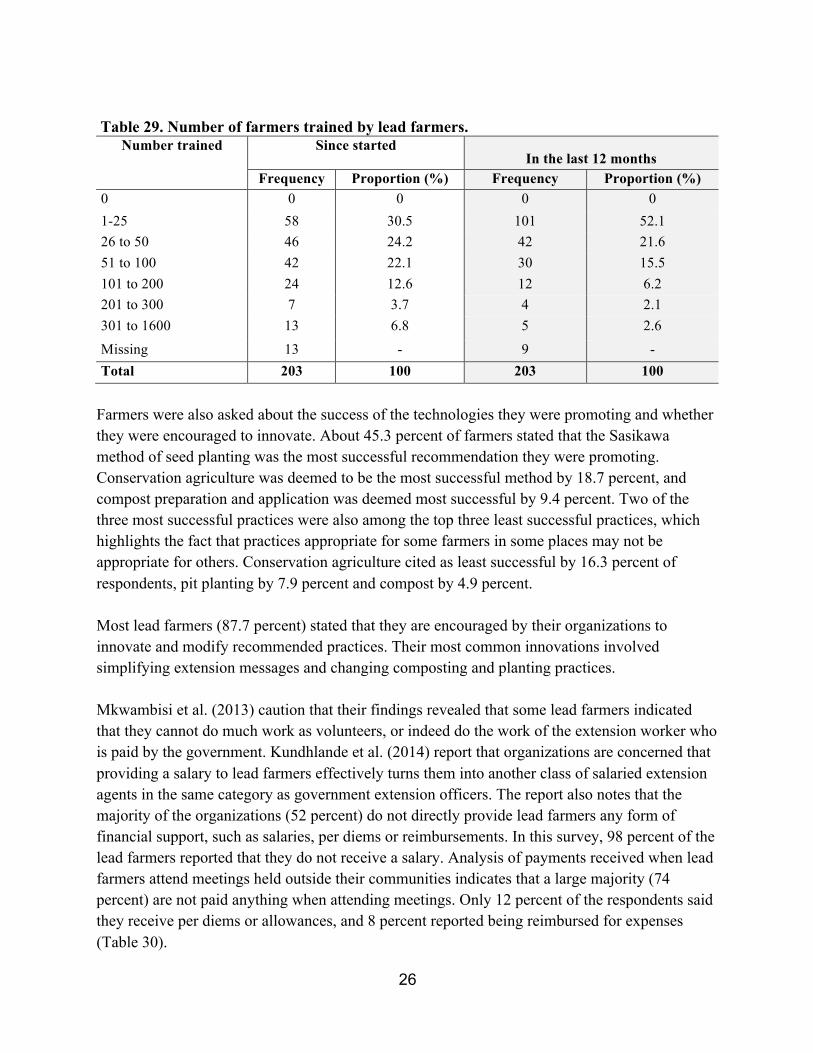
Since starting their work as LFs, each had trained, on average, 100.2 farmers (median = 50). The wide difference between the mean and median reflects the fact that a few trainers had trained large numbers of farmers (Table 29). Those training large numbers had likely trained farmers on field tours brought to them by extension staff. Over the past year, lead farmers had trained on average 60.9 farmers (median = 25). Men had trained on average 74 others (median = 30) and women had trained on average 41 (median 20) but there was no significant difference between men and women (p= 0.12). In fact, 8 of the 11 lead farmers who had trained 200 or more farmers were men, perhaps because extension staff tend to take farmers on tours to male farmers. If the 11 from the sample are excluded, the median numbers of farmers trained by men and women converged to 25 for men and 20 for women. Whereas there was little difference between men and women on numbers trained, women trained more women than men did. Women made up 62 percent of those trained by women and 55 percent of those trained by men, and the difference between men and women was statistically significant (p=0.012).
26
Table 29. Number of farmers trained by lead farmers.
Number trained Since started In the last 12 months
Frequency Proportion (%) Frequency Proportion (%) 0 0 0 0 0 1-25 58 30.5 101 52.1 26 to 50 46 24.2 42 21.6 51 to 100 42 22.1 30 15.5 101 to 200 24 12.6 12 6.2 201 to 300 7 3.7 4 2.1 301 to 1600 13 6.8 5 2.6
Missing 13 - 9 - Total 203 100 203 100
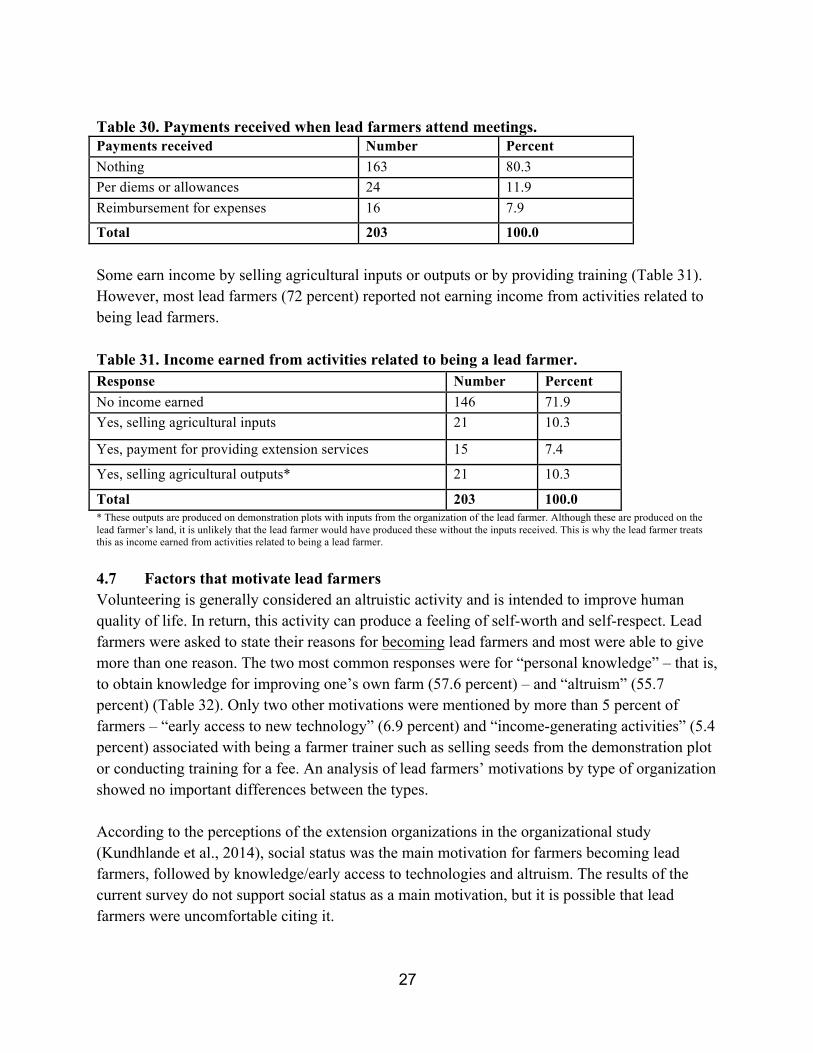
Farmers were also asked about the success of the technologies they were promoting and whether they were encouraged to innovate. About 45.3 percent of farmers stated that the Sasikawa method of seed planting was the most successful recommendation they were promoting. Conservation agriculture was deemed to be the most successful method by 18.7 percent, and compost preparation and application was deemed most successful by 9.4 percent. Two of the three most successful practices were also among the top three least successful practices, which highlights the fact that practices appropriate for some farmers in some places may not be appropriate for others. Conservation agriculture cited as least successful by 16.3 percent of respondents, pit planting by 7.9 percent and compost by 4.9 percent. Most lead farmers (87.7 percent) stated that they are encouraged by their organizations to innovate and modify recommended practices. Their most common innovations involved simplifying extension messages and changing composting and planting practices. Mkwambisi et al. (2013) caution that their findings revealed that some lead farmers indicated that they cannot do much work as volunteers, or indeed do the work of the extension worker who is paid by the government. Kundhlande et al. (2014) report that organizations are concerned that providing a salary to lead farmers effectively turns them into another class of salaried extension agents in the same category as government extension officers. The report also notes that the majority of the organizations (52 percent) do not directly provide lead farmers any form of financial support, such as salaries, per diems or reimbursements. In this survey, 98 percent of the lead farmers reported that they do not receive a salary. Analysis of payments received when lead farmers attend meetings held outside their communities indicates that a large majority (74 percent) are not paid anything when attending meetings. Only 12 percent of the respondents said they receive per diems or allowances, and 8 percent reported being reimbursed for expenses (Table 30).
27
Table 30. Payments received when lead farmers attend meetings. Payments received Number Percent Nothing 163 80.3 Per diems or allowances 24 11.9 Reimbursement for expenses 16 7.9
Total 203 100.0 Some earn income by selling agricultural inputs or outputs or by providing training (Table 31). However, most lead farmers (72 percent) reported not earning income from activities related to being lead farmers. Table 31. Income earned from activities related to being a lead farmer. Response Number Percent No income earned 146 71.9 Yes, selling agricultural inputs 21 10.3
Yes, payment for providing extension services 15 7.4
Yes, selling agricultural outputs* 21 10.3
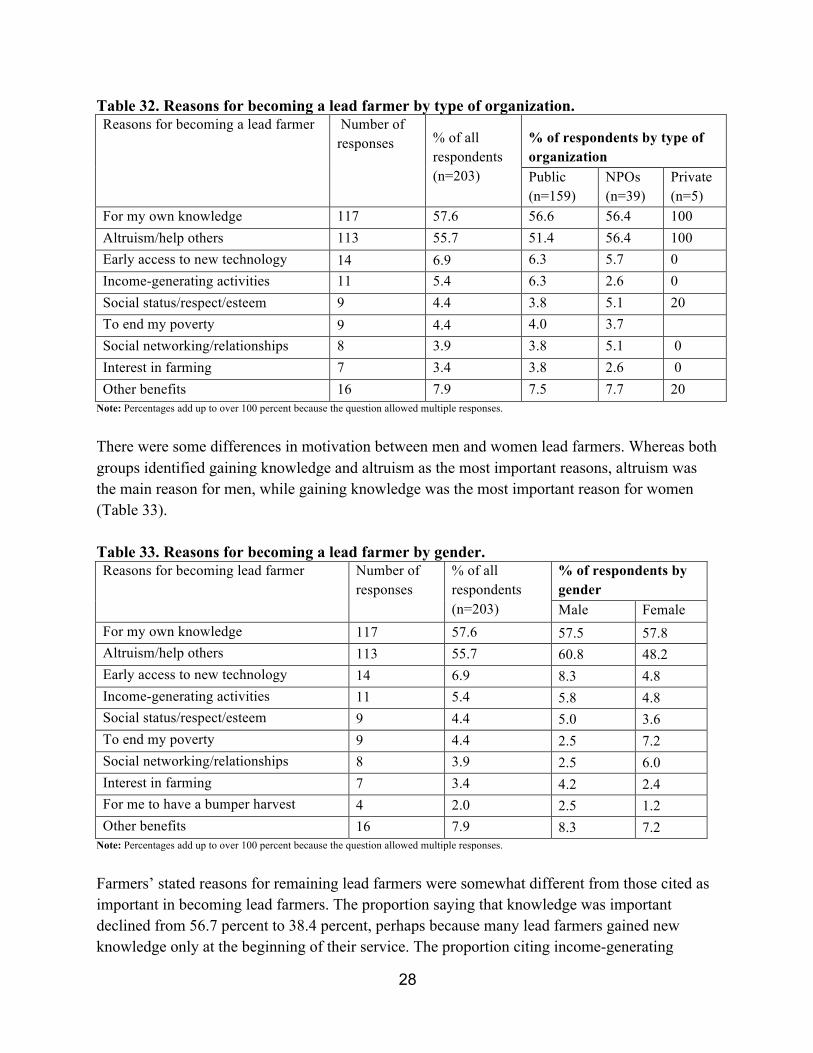
Total 203 100.0 * These outputs are produced on demonstration plots with inputs from the organization of the lead farmer. Although these are produced on the lead farmer’s land, it is unlikely that the lead farmer would have produced these without the inputs received. This is why the lead farmer treats this as income earned from activities related to being a lead farmer. 4.7 Factors that motivate lead farmers Volunteering is generally considered an altruistic activity and is intended to improve human quality of life. In return, this activity can produce a feeling of self-worth and self-respect. Lead farmers were asked to state their reasons for becoming lead farmers and most were able to give more than one reason. The two most common responses were for “personal knowledge” – that is, to obtain knowledge for improving one’s own farm (57.6 percent) – and “altruism” (55.7 percent) (Table 32). Only two other motivations were mentioned by more than 5 percent of farmers – “early access to new technology” (6.9 percent) and “income-generating activities” (5.4 percent) associated with being a farmer trainer such as selling seeds from the demonstration plot or conducting training for a fee. An analysis of lead farmers’ motivations by type of organization showed no important differences between the types. According to the perceptions of the extension organizations in the organizational study (Kundhlande et al., 2014), social status was the main motivation for farmers becoming lead farmers, followed by knowledge/early access to technologies and altruism. The results of the current survey do not support social status as a main motivation, but it is possible that lead farmers were uncomfortable citing it.
28
Table 32. Reasons for becoming a lead farmer by type of organization. Reasons for becoming a lead farmer Number of
responses % of all respondents (n=203)
% of respondents by type of organization Public (n=159)
NPOs (n=39)
Private (n=5)
For my own knowledge 117 57.6 56.6 56.4 100 Altruism/help others 113 55.7 51.4 56.4 100 Early access to new technology 14 6.9 6.3 5.7 0 Income-generating activities 11 5.4 6.3 2.6 0 Social status/respect/esteem 9 4.4 3.8 5.1 20 To end my poverty 9 4.4 4.0 3.7 Social networking/relationships 8 3.9 3.8 5.1 0 Interest in farming 7 3.4 3.8 2.6 0 Other benefits 16 7.9 7.5 7.7 20
Note: Percentages add up to over 100 percent because the question allowed multiple responses.
There were some differences in motivation between men and women lead farmers. Whereas both groups identified gaining knowledge and altruism as the most important reasons, altruism was the main reason for men, while gaining knowledge was the most important reason for women (Table 33). Table 33. Reasons for becoming a lead farmer by gender. Reasons for becoming lead farmer Number of
responses % of all respondents (n=203)
% of respondents by gender Male Female
For my own knowledge 117 57.6 57.5 57.8 Altruism/help others 113 55.7 60.8 48.2 Early access to new technology 14 6.9 8.3 4.8 Income-generating activities 11 5.4 5.8 4.8 Social status/respect/esteem 9 4.4 5.0 3.6 To end my poverty 9 4.4 2.5 7.2 Social networking/relationships 8 3.9 2.5 6.0 Interest in farming 7 3.4 4.2 2.4 For me to have a bumper harvest 4 2.0 2.5 1.2 Other benefits 16 7.9 8.3 7.2
Note: Percentages add up to over 100 percent because the question allowed multiple responses.
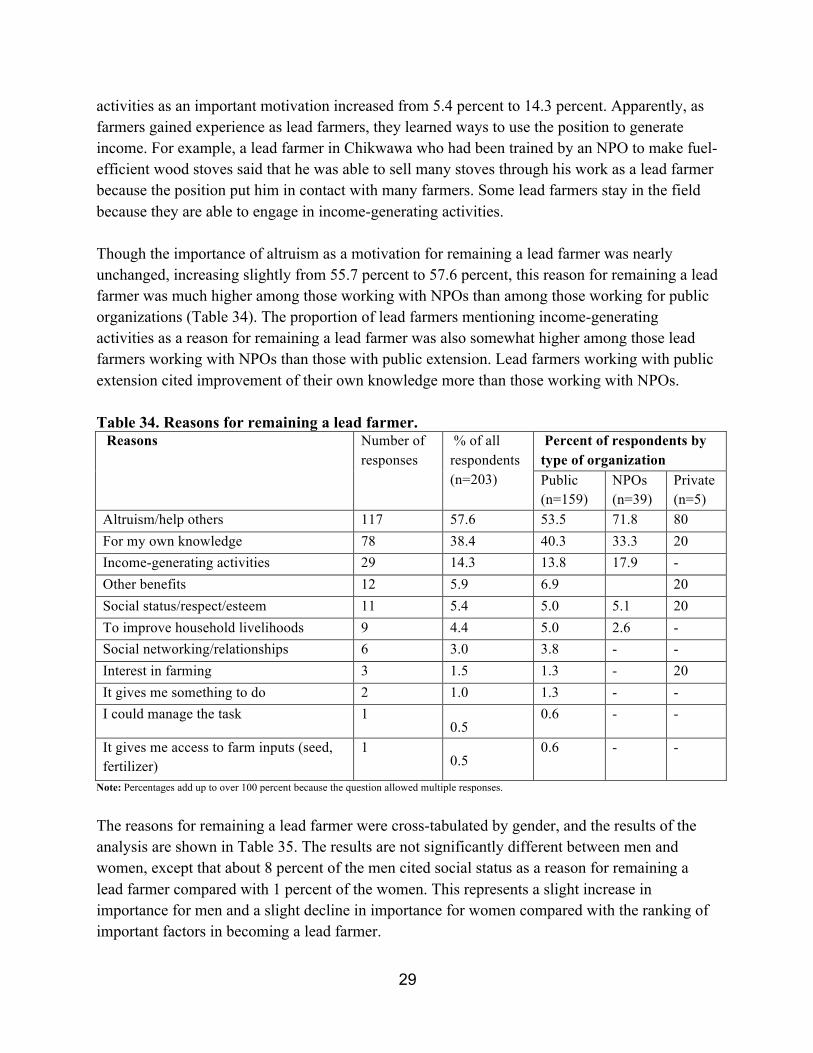
Farmers’ stated reasons for remaining lead farmers were somewhat different from those cited as important in becoming lead farmers. The proportion saying that knowledge was important declined from 56.7 percent to 38.4 percent, perhaps because many lead farmers gained new knowledge only at the beginning of their service. The proportion citing income-generating
29
activities as an important motivation increased from 5.4 percent to 14.3 percent. Apparently, as farmers gained experience as lead farmers, they learned ways to use the position to generate income. For example, a lead farmer in Chikwawa who had been trained by an NPO to make fuel-efficient wood stoves said that he was able to sell many stoves through his work as a lead farmer because the position put him in contact with many farmers. Some lead farmers stay in the field because they are able to engage in income-generating activities. Though the importance of altruism as a motivation for remaining a lead farmer was nearly unchanged, increasing slightly from 55.7 percent to 57.6 percent, this reason for remaining a lead farmer was much higher among those working with NPOs than among those working for public organizations (Table 34). The proportion of lead farmers mentioning income-generating activities as a reason for remaining a lead farmer was also somewhat higher among those lead farmers working with NPOs than those with public extension. Lead farmers working with public extension cited improvement of their own knowledge more than those working with NPOs. Table 34. Reasons for remaining a lead farmer. Reasons
Number of responses
% of all respondents (n=203)
Percent of respondents by type of organization Public (n=159)
NPOs (n=39)
Private (n=5)
Altruism/help others 117 57.6 53.5 71.8 80 For my own knowledge 78 38.4 40.3 33.3 20 Income-generating activities 29 14.3 13.8 17.9 - Other benefits 12 5.9 6.9 20 Social status/respect/esteem 11 5.4 5.0 5.1 20 To improve household livelihoods 9 4.4 5.0 2.6 - Social networking/relationships 6 3.0 3.8 - - Interest in farming 3 1.5 1.3 - 20 It gives me something to do 2 1.0 1.3 - - I could manage the task 1
0.5 0.6 - -
It gives me access to farm inputs (seed, fertilizer)
1 0.5
0.6 - -
Note: Percentages add up to over 100 percent because the question allowed multiple responses.
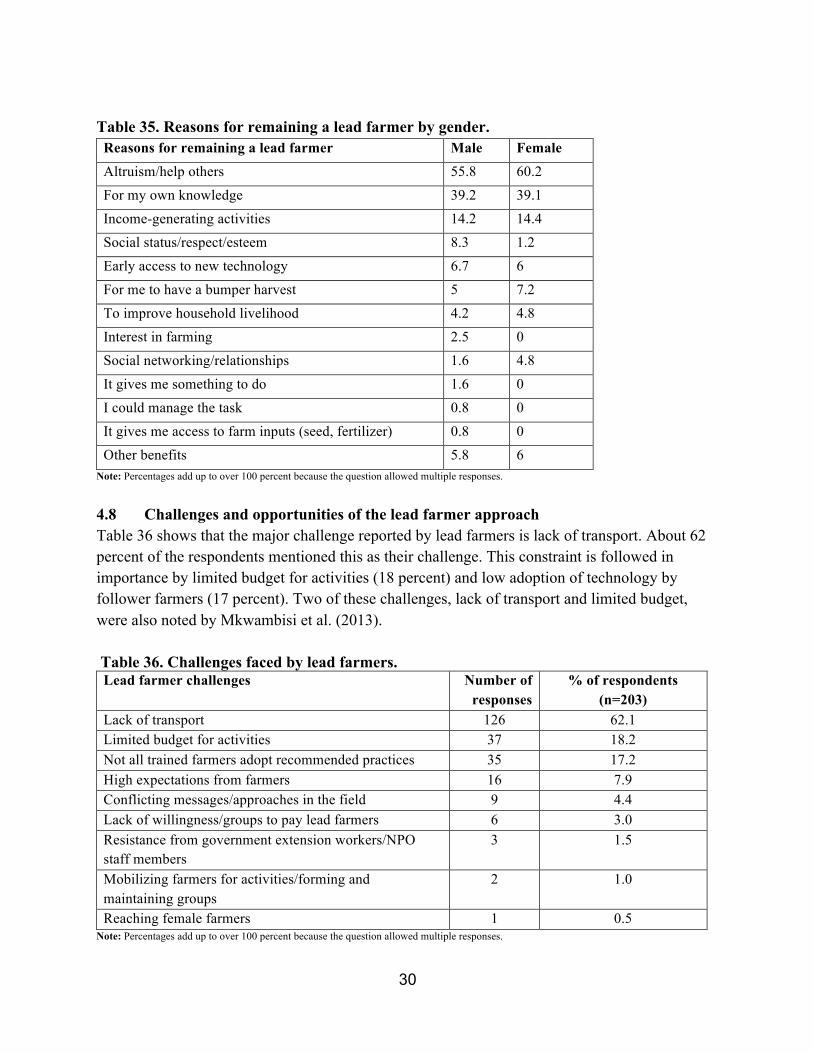
The reasons for remaining a lead farmer were cross-tabulated by gender, and the results of the analysis are shown in Table 35. The results are not significantly different between men and women, except that about 8 percent of the men cited social status as a reason for remaining a lead farmer compared with 1 percent of the women. This represents a slight increase in importance for men and a slight decline in importance for women compared with the ranking of important factors in becoming a lead farmer.
30
Table 35. Reasons for remaining a lead farmer by gender. Reasons for remaining a lead farmer Male Female Altruism/help others 55.8 60.2
For my own knowledge 39.2 39.1
Income-generating activities 14.2 14.4
Social status/respect/esteem 8.3 1.2
Early access to new technology 6.7 6
For me to have a bumper harvest 5 7.2
To improve household livelihood 4.2 4.8
Interest in farming 2.5 0
Social networking/relationships 1.6 4.8
It gives me something to do 1.6 0
I could manage the task 0.8 0
It gives me access to farm inputs (seed, fertilizer) 0.8 0
Other benefits 5.8 6 Note: Percentages add up to over 100 percent because the question allowed multiple responses.
4.8 Challenges and opportunities of the lead farmer approach Table 36 shows that the major challenge reported by lead farmers is lack of transport. About 62 percent of the respondents mentioned this as their challenge. This constraint is followed in importance by limited budget for activities (18 percent) and low adoption of technology by follower farmers (17 percent). Two of these challenges, lack of transport and limited budget, were also noted by Mkwambisi et al. (2013). Table 36. Challenges faced by lead farmers. Lead farmer challenges Number of
responses % of respondents
(n=203) Lack of transport 126 62.1 Limited budget for activities 37 18.2 Not all trained farmers adopt recommended practices 35 17.2 High expectations from farmers 16 7.9 Conflicting messages/approaches in the field 9 4.4 Lack of willingness/groups to pay lead farmers 6 3.0 Resistance from government extension workers/NPO staff members
3 1.5
Mobilizing farmers for activities/forming and maintaining groups
2 1.0
Reaching female farmers 1 0.5 Note: Percentages add up to over 100 percent because the question allowed multiple responses.
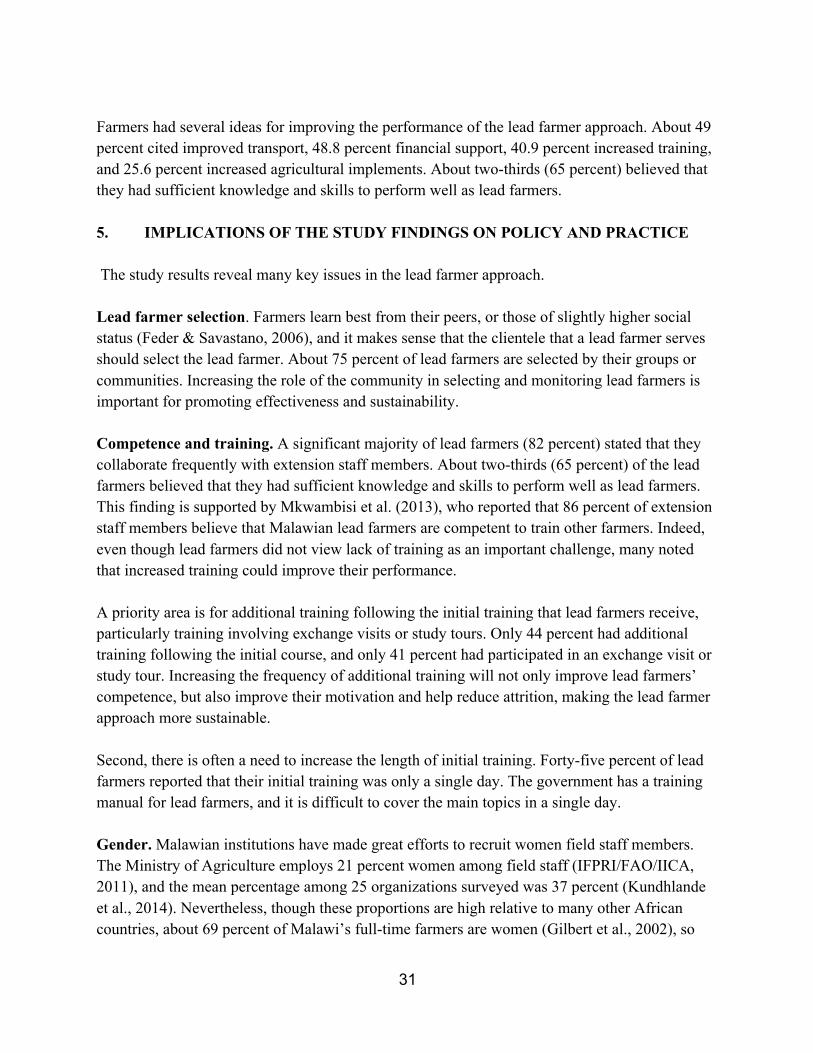
31
Farmers had several ideas for improving the performance of the lead farmer approach. About 49 percent cited improved transport, 48.8 percent financial support, 40.9 percent increased training, and 25.6 percent increased agricultural implements. About two-thirds (65 percent) believed that they had sufficient knowledge and skills to perform well as lead farmers. 5. IMPLICATIONS OF THE STUDY FINDINGS ON POLICY AND PRACTICE The study results reveal many key issues in the lead farmer approach. Lead farmer selection. Farmers learn best from their peers, or those of slightly higher social status (Feder & Savastano, 2006), and it makes sense that the clientele that a lead farmer serves should select the lead farmer. About 75 percent of lead farmers are selected by their groups or communities. Increasing the role of the community in selecting and monitoring lead farmers is important for promoting effectiveness and sustainability. Competence and training. A significant majority of lead farmers (82 percent) stated that they collaborate frequently with extension staff members. About two-thirds (65 percent) of the lead farmers believed that they had sufficient knowledge and skills to perform well as lead farmers. This finding is supported by Mkwambisi et al. (2013), who reported that 86 percent of extension staff members believe that Malawian lead farmers are competent to train other farmers. Indeed, even though lead farmers did not view lack of training as an important challenge, many noted that increased training could improve their performance. A priority area is for additional training following the initial training that lead farmers receive, particularly training involving exchange visits or study tours. Only 44 percent had additional training following the initial course, and only 41 percent had participated in an exchange visit or study tour. Increasing the frequency of additional training will not only improve lead farmers’ competence, but also improve their motivation and help reduce attrition, making the lead farmer approach more sustainable. Second, there is often a need to increase the length of initial training. Forty-five percent of lead farmers reported that their initial training was only a single day. The government has a training manual for lead farmers, and it is difficult to cover the main topics in a single day. Gender. Malawian institutions have made great efforts to recruit women field staff members. The Ministry of Agriculture employs 21 percent women among field staff (IFPRI/FAO/IICA, 2011), and the mean percentage among 25 organizations surveyed was 37 percent (Kundhlande et al., 2014). Nevertheless, though these proportions are high relative to many other African countries, about 69 percent of Malawi’s full-time farmers are women (Gilbert et al., 2002), so
32
higher proportions of women among field staff members are justified. The proportion of women lead farmers in the Ministry of Agriculture was 40 percent, almost double the proportion of women field staff; an indication that the lead farmer program can help increase the overall proportion of women involved in training farmers in Malawi. In other organizations, the mean proportion of women farmer trainers is 37 percent, the same as in their field staff. One approach used successfully in Uganda to increase the proportion of women lead farmers was to recruit spouses of male lead farmers (J. Kugonza, personal communication, 2014). The findings also suggest that women farmer trainers help increase women’s access to extension services. Whereas women comprise 55 percent of those trained by men, they comprise 62 percent of those trained by women and this difference is statistically significant. Thus farmer trainers help increase women’s participation in providing extension services as well as access to them. Motivation and compensation. Lead farmers’ main motivations for becoming and remaining lead farmers were to improve their knowledge of farming and to help others. Improving one’s knowledge was less of a motivation for remaining a lead farmer than for becoming one, perhaps because many lead farmers are engaged in technology promotion efforts for a single technology and receive little additional training after recruitment. The survey results also show that motivations for becoming lead farmers varied, with some giving more importance to knowledge and others, particularly men, to altruism. These results show the importance of finding out which motivations are most important to an organization’s lead farmers and providing low-cost incentives for keeping them motivated. For those trainers interested in altruism, means of recognition such as certificates, T-shirts and public recognition/appreciation from local leaders are important. Training, literature, exchange visits and study tours with innovative farmers are important for those interested in improving their knowledge. Interviewers suspect that social status is a more important motivation than lead farmers were willing to admit. Most of the motivations mentioned above for altruistic lead farmers should also be relevant for those interested in social status. Interestingly, the proportion of farmers citing income earned, from providing training or selling other products and services, increased from 5 percent when becoming a farmer trainer to 14 percent among motivations to remain a farmer trainer. Evidently, as they gain experience as a lead farmer, some farmers are finding ways to earn cash in association with their activities. For those interested in earning income from associated services, organizations can help link lead farmers to clients interested in buying their goods and services. Only 2 percent of lead farmers receive a salary and indeed the Ministry of Agriculture discourages organizations from paying salaries because it would reduce the motivation of lead farmers in other programs. Only 12 percent receive per diems or allowances when attending
33
meetings. Most received no materials to help them in their work, and less than 17 percent received farm inputs, implements, pens, notebooks or reading materials. Providing material support does involve costs, but some of the above could prove important for both helping lead farmers become more effective, and motivating them, reducing attrition and making the program more sustainable. Finally, more research is needed on ways to improve the effectiveness of lead farmers, and forums are needed for practitioners to share experiences in implementing such programs and perhaps, form associations. Extension managers, lead farmers and trainees should all be involved in finding ways to improve the effectiveness and efficiency of lead farmer programs.
34
REFERENCES Feder G, Savastano S. 2006. The role of opinion leaders in the diffusion of new knowledge: the case of integrated pest management. World Development 34(7): 1287–300.
Garforth C. 2011. Education, training and extension for food producers: Foresight Project on Global Food and Farming. Futures Science review: SR16B, Reading: University of Reading.
Gilbert RA, Sakala WD, Benson TD. 2002. Gender Analysis of a nationwide cropping system trial survey in Malawi African Studies Quarterly Volume 6, Issues 1&2, 223-242.
Government of Malawi. 2006. Farmer Organisation Development Guidelines. Lilongwe, Malawi: Ministry of Agriculture and Food Security.
Government of Malawi. 2010. Lead Farmer Concept Guidelines. Lilongwe, Malawi. Ministry of Agriculture and Food Security, Department of Agriculture Extension Services (DAES).
IFPRI/FAO/IICA. 2011. Worldwide Extension Study. http://www.worldwideextension.org/ africa/malawi/-malawi. International Food Policy Research Institute, Food and Agricultural Organization and Inter-American Institute for Cooperation on Agriculture. Accessed on 9 November 2014.
Kaunda E. 2011. National case study on extension and advisory services: Malawi. Paper presented at the International Conference on Innovations in Extension and Advisory Services: Linking Knowledge to Policy and Action, November 15-18, 2011, Nairobi, Kenya. http://www.slideshare.net/ctaspace/malawi-case-study-presented-in-nairobi-conferencenov-2011. Accessed on 9 November 2014.
Kundhlande G, Franzel S, Simpson B, Gausi E. 2014. Farmer-to-farmer extension approach in Malawi: A survey of organizations. ICRAF Working Paper No. 183. Nairobi, World Agroforestry Centre. . http://www.worldagroforestry.org/downloads/publications/pdfs/WP14391.PDF
Masangano C, Mthinda C. 2012. Pluralistic extension system in Malawi, IFPRI Discussion Paper 01171. April 2012.
Mkwambisi D, Khaila S, Mthinda C, Mulwafu A, Chikowi M. 2013. Baseline Draft Report for the Agriculture Technology Transfer of the Malawi Agricultural Sector Wide Approach Support Project (ASWAp-SP). The Millennium Centre For Research and Development, Malawi.
Mulwafu AO, Krishnankutty J. 2012. Prospects of the lead farmer concept for improved livestock development among rural communities in Malawi. Indian Research Journal of Extension Education, Special Issue (Volume I), January 2012.
Rogers EM. 2003. Diffusion of Innovations, New York: Free Press.
Scarbourough V, Killough S, Johnson DA, Farrington J (eds). 1997. Farmer-led extension: concepts and practices. London: Intermediate Technology Publications.
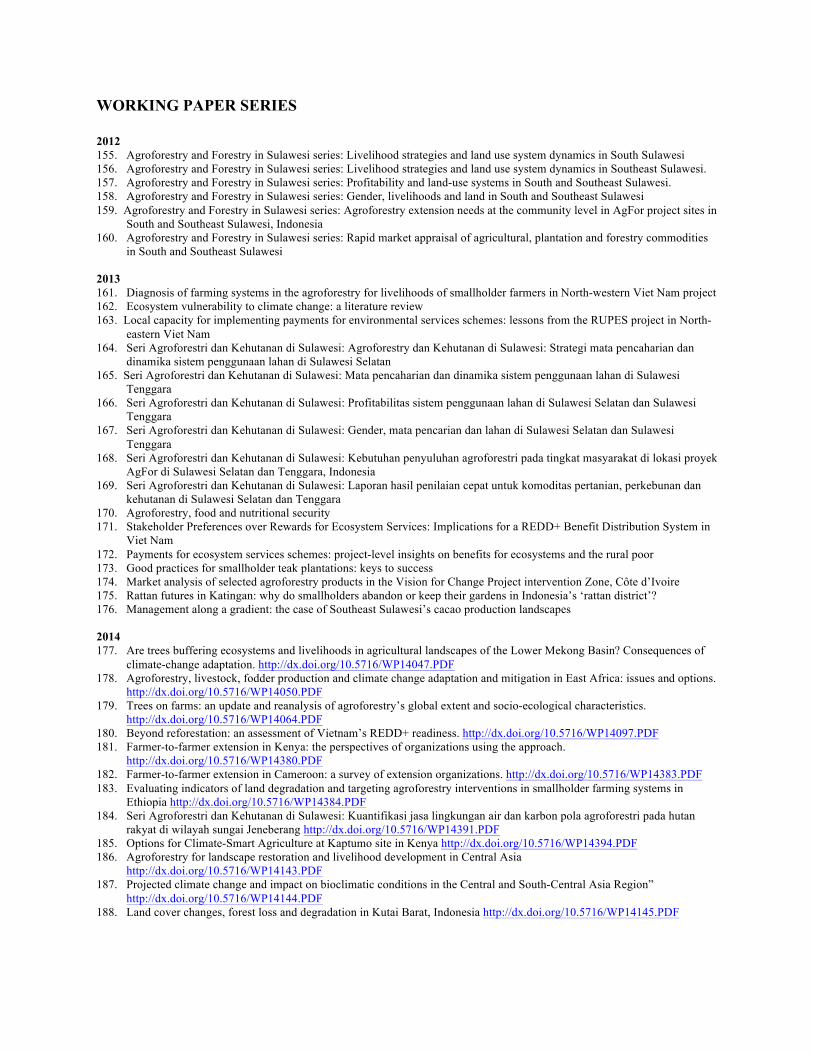
35
WORKING PAPER SERIES 2012 155. Agroforestry and Forestry in Sulawesi series: Livelihood strategies and land use system dynamics in South Sulawesi 156. Agroforestry and Forestry in Sulawesi series: Livelihood strategies and land use system dynamics in Southeast Sulawesi. 157. Agroforestry and Forestry in Sulawesi series: Profitability and land-use systems in South and Southeast Sulawesi. 158. Agroforestry and Forestry in Sulawesi series: Gender, livelihoods and land in South and Southeast Sulawesi 159. Agroforestry and Forestry in Sulawesi series: Agroforestry extension needs at the community level in AgFor project sites in
South and Southeast Sulawesi, Indonesia 160. Agroforestry and Forestry in Sulawesi series: Rapid market appraisal of agricultural, plantation and forestry commodities
in South and Southeast Sulawesi 2013 161. Diagnosis of farming systems in the agroforestry for livelihoods of smallholder farmers in North-western Viet Nam project 162. Ecosystem vulnerability to climate change: a literature review 163. Local capacity for implementing payments for environmental services schemes: lessons from the RUPES project in North-
eastern Viet Nam 164. Seri Agroforestri dan Kehutanan di Sulawesi: Agroforestry dan Kehutanan di Sulawesi: Strategi mata pencaharian dan
dinamika sistem penggunaan lahan di Sulawesi Selatan 165. Seri Agroforestri dan Kehutanan di Sulawesi: Mata pencaharian dan dinamika sistem penggunaan lahan di Sulawesi
Tenggara 166. Seri Agroforestri dan Kehutanan di Sulawesi: Profitabilitas sistem penggunaan lahan di Sulawesi Selatan dan Sulawesi
Tenggara 167. Seri Agroforestri dan Kehutanan di Sulawesi: Gender, mata pencarian dan lahan di Sulawesi Selatan dan Sulawesi
Tenggara 168. Seri Agroforestri dan Kehutanan di Sulawesi: Kebutuhan penyuluhan agroforestri pada tingkat masyarakat di lokasi proyek
AgFor di Sulawesi Selatan dan Tenggara, Indonesia 169. Seri Agroforestri dan Kehutanan di Sulawesi: Laporan hasil penilaian cepat untuk komoditas pertanian, perkebunan dan
kehutanan di Sulawesi Selatan dan Tenggara 170. Agroforestry, food and nutritional security 171. Stakeholder Preferences over Rewards for Ecosystem Services: Implications for a REDD+ Benefit Distribution System in
Viet Nam 172. Payments for ecosystem services schemes: project-level insights on benefits for ecosystems and the rural poor 173. Good practices for smallholder teak plantations: keys to success 174. Market analysis of selected agroforestry products in the Vision for Change Project intervention Zone, Côte d’Ivoire 175. Rattan futures in Katingan: why do smallholders abandon or keep their gardens in Indonesia’s ‘rattan district’? 176. Management along a gradient: the case of Southeast Sulawesi’s cacao production landscapes 2014 177. Are trees buffering ecosystems and livelihoods in agricultural landscapes of the Lower Mekong Basin? Consequences of
climate-change adaptation. http://dx.doi.org/10.5716/WP14047.PDF 178. Agroforestry, livestock, fodder production and climate change adaptation and mitigation in East Africa: issues and options.
http://dx.doi.org/10.5716/WP14050.PDF 179. Trees on farms: an update and reanalysis of agroforestry’s global extent and socio-ecological characteristics.
http://dx.doi.org/10.5716/WP14064.PDF 180. Beyond reforestation: an assessment of Vietnam’s REDD+ readiness. http://dx.doi.org/10.5716/WP14097.PDF 181. Farmer-to-farmer extension in Kenya: the perspectives of organizations using the approach.
http://dx.doi.org/10.5716/WP14380.PDF 182. Farmer-to-farmer extension in Cameroon: a survey of extension organizations. http://dx.doi.org/10.5716/WP14383.PDF 183. Evaluating indicators of land degradation and targeting agroforestry interventions in smallholder farming systems in
Ethiopia http://dx.doi.org/10.5716/WP14384.PDF 184. Seri Agroforestri dan Kehutanan di Sulawesi: Kuantifikasi jasa lingkungan air dan karbon pola agroforestri pada hutan
rakyat di wilayah sungai Jeneberang http://dx.doi.org/10.5716/WP14391.PDF 185. Options for Climate-Smart Agriculture at Kaptumo site in Kenya http://dx.doi.org/10.5716/WP14394.PDF 186. Agroforestry for landscape restoration and livelihood development in Central Asia
http://dx.doi.org/10.5716/WP14143.PDF 187. Projected climate change and impact on bioclimatic conditions in the Central and South-Central Asia Region”
http://dx.doi.org/10.5716/WP14144.PDF 188. Land cover changes, forest loss and degradation in Kutai Barat, Indonesia http://dx.doi.org/10.5716/WP14145.PDF
The World Agroforestry Centre is an autonomous, non-profit research organization whose vision is a rural transformation in the developing world as smallholder households increase their use of trees in agricultural landscapes to improve food security, nutrition, income, health, shelter, social cohesion, energy resources and environmental sustainability. The Centre generates science-based knowledge about the diverse roles that trees play in agricultural landscapes, and uses its research to advance policies and practices, and their implementation that benefit the poor and the environment. It aims to ensure that all this is achieved by enhancing the quality of its science work, increasing operational efficiency, building and maintaining strong partnerships, accelerating the use and impact of its research, and promoting greater cohesion, interdependence and alignment within the organization.
United Nations Avenue, Gigiri • PO Box 30677 • Nairobi, 00100 • Kenya Telephone: +254 20 7224000 or via USA +1 650 833 6645
Fax: +254 20 7224001 or via USA +1 650 833 6646Email: [email protected] • www.worldagroforestry.org