TESIS DOCTORAL Firm Strategies behind the Establishment of ...
The Family Behind the Family Firm:Evidence from Successions in Danish Firms*
Morten BennedsenCopenhagen Business School and CEBR
Kasper NielsenUniversity of Copenhagen and CEBR
Daniel WolfenzonStern School of Business
First draft March 15, 2004 – This draft December, 2004
Abstract
We investigate the causal link between family structure and the succession decision in privatebusiness using a unique dataset of the universe of privately held firms in Denmark from 1995 to2002 that contains information on the controlling families. We show that there is a causal effectof number of children on the probability of family succession. We also document that familysuccession is significantly lower when all offspring are female. To show that these results are notspurious, we use instrumental variables and also run the regressions on a sub-sample in which thelikelihood of simultaneity is reduced. We also find that more ‘factions’ in the family (measuredas the owner having been married more than once) reduce the succession probability. We showthat the correlation between family succession and the owner’s number of marriages is not drivenby reverse causality, by conflicts between the owner and previous spouses, and by the direct effectof divorce. Consistent with the multiple factions theory, we find that the largest reduction in theprobability of family transition occurs when the owner has been married more than once and haschildren with each of the spouses.
*We thank CEBR (www.cebr.dk) and the Danish Social Science Research Foundation for financialsupport under the research project GOCOW. We also thank the participants at the GovernanceWorkshop at Stern, Francisco Perez-Gonzales and David Yermack for comments.

1 Introduction
Economists have long acknowledged that the structure of the family plays a crucial role in important
economic decisions. There is a vast literature documenting that family size (number of children)
affects demand patterns, labor supply, portfolio choices, and the demand for housing among other
things (for a summary, see Browning, 1992). Parent’s divorce has been linked to offspring’s lower
levels of school achievement and participation in the labor market (for a summary see Del Boca,
2003). Furthermore, sibling sex composition has been shown to affect educational attainment and
earnings (Butcher and Case, 1994).
There is a large body of anecdotal evidence suggesting that corporate decisions in family firms
are also driven by the structure and internal politics of the controlling family.1 However, there is
no systematic evidence on the link between family circumstances and corporate decisions.2 The
objective of this paper is to provide such evidence. In particular, we focus on the succession decision:
whether or not to leave the firm to a family member.
Understanding this decision is important for a number of reasons. First, family firms constitute
a large fraction of the firms in most economies. For example, La Porta, Lopez de Silanes and Shleifer
(1999) document that, using a strict definition of control, 30% of the largest publicly traded firms
in the 27 countries in their sample are controlled by a family3 Even among the S&P 500 firms,
Anderson and Reeb (2003) document that approximately a third are family firms.
Second, it has been shown that the identity of the successor (family member or outsider) has
performance implications at the firm level and even at the economy level. Perez-Gonazalez (2004)
show that performance of firms in which control is inherited by a family member of the CEO
suffers relative to cases in which the CEO position passes to an unrelated party. Villalonga and1Ward (1987) writes “This reflects a fourth basic truth that we will return to again and again, namely, that
family circumstances critically influence the choice of business strategy” (page 8). Gersick et al.(1997) provide thefollowing examples: “An estate planning attorney may be puzzle by a client’s reluctance to implement the mostrational distribution plan, until she considers the client’s conflicts between his desires as a parent (to treat eachoffspring equally) and as a business owner (to consolidate control in one successor). Similarly, an apparently illogicalexpansion strategy for a growing company may make sense only when one understands the needs of co-ownerssiblings to keep their divisions equal size, no matter what” (Page 5). A different example is the case of S.C. Johnson& Company. To avoid potential conflicts among siblings, Samuel Curtis Johnson, the controlling shareholder, dividedthe firm in three legally independent firms and gave one to each one of his three interested children (The New YorkTimes, August 22, 1999).
2Bertrand, Johnson, Samphantarak and Schoar (2004) also analyses the effect of family structure and dynamicson corporate decisions. The current paper and Bertrand et al. (2004) were written simultaneously.
3Similar results about the prevalence of family firms are reported by Claessens, Fan and Lang (2000) and Faccioand Lang (2002).
1

Amit (2004) show that the value of firms run by heirs of the founder is lower than that of firms in
which the CEO is not a family member. Morck, Strangeland and Yeung (2000) show that overall
economic growth can be hampered in economies in corporate control is inherited. Finally, Casselli
and Gennaioli (2002) present a model of the effect of family succession on total factor productivity
and find in simulations that the effect can be sizable.
Third, establishing a link between family characteristics and family succession might help ex-
plain the incidence of family firms –both across countries and in the time series– as a function
of fertility, divorce rates, etc.4 This is specially important in light of the demographic trends in
Europe. For example, in Denmark, the fertility rate has declined from 2.22 in 1940 to 1.77 in 2000.
The number of divorces per 1,000 people increased from 0.9 in 1940 to 2.7 by the year 2000. As we
show below, one of the effects of these changes is reduced family transitions.
We assembled a dataset that includes the universe of privately held limited liability corporations
registered in Denmark. Our dataset includes balance sheet and income statement figures for all
firms from 1995 to 2002. It also contains the names and, in many cases, the stakes of all owners.
What makes our dataset unique is that we were able to obtain the family tree of each owner
together with personal information about all family members. In total we have information for
approximately 1 million people. The family tree allows us to identify family firms. In addition,
we use the family information –number and gender of children and marital status– to test specific
theories about the how family circumstances affects the succession decision.
In terms of family structure, we find that the probability of family succession initially increases
with the number of children. However, the effect turns negative for the fourth and subsequent
children. We also test whether gender of the children affects family transition. We find that family
transition is less frequent in families in which all children are female.
Even though the fertility decision and the succession decisions are taken on average 40 years
apart, it is possible that number of children is an endogenous variable (e.g., entrepreneurs who
want to transfer control in the future have more children today so as to maximize the probability4Family firm scholars argue that cross country differences in the prevalence of family firms can be traced back
to family circumstances: “Stronger family traditions and limited competing career opportunities have made Europeand Latin America a more fertile ground for [family firms with cousins-owners]. In the United States, with its strongemphasis on entrepreneurship, independence, mobility and focus on the nuclear rather than the extended family, thebulk of family firms that survive past the first generation are more likely to subdivide and recycle to [firms with asingle owner] and [firms with sibling-owners” Gersick et al. 1997, page 53, emphasis added).
2
of family succession). To solve this potential endogeneity problem, we use two methods. First,
we use an instrumental variable approach. The first instrument we use is whether the first two
children are of the same sex. It has been argued (Angrist and Evans, 1998) that parents exhibit a
preference for a mixed sibling-sex composition. Thus, parents with either two boys or two girls are
more likely to have a third child. The other instrument we use is the age of the wife at the time
of the marriage. This instrument uses the fact that fertility is decreasing in the age of the mother.
The second method we use is to select a sample of entrepreneurs who founded their firms ten years
after having their last child. Presumably, in this sample, the simultaneity of the fertility and the
succession decision is mitigated. Using these methods we confirm the causal effect of family size on
succession.
We also explore the possibility that “family politics” affects the succession decision. It is well
known that the transition from the second to the third generation is less likely than the transition
from the first to the second generation. For various reasons, this reduced probability of transition
might be related to the increased complexity of the family, i.e., higher number of branches (Gersick
et al., 1997). For example, it is well known that the head of the family is averse to favoring one
of his/her relatives. If this aversion is sufficiently strong, the head of the family might opt for an
outsider. It is possible that this aversion is stronger (and hence family transition less likely) when
the potential candidates to the CEO position belong to different branches of the family as opposed
to a single branch. Second, it could be that anticipating fighting between the family branches, the
head of the family decides to nominate an outsider.
Because the number of firms in our data in which more than one generation is involved is rather
small, we use the number of marriages of the owner. The family of the owner with each of the
spouses approximates the idea of family branches discussed in the literature. Also, because in
Denmark it is common for couples not to marry, we also look at family firm owners with children
with one and multiple partners.
As the theory predicts, the effect of multiple marriages on the probability of family succession is
negative and statistically significant. We also show that the correlation between family succession
and the owner’s number of marriages is not driven by reverse causality, by conflicts between the
owner and previous spouses, and by the direct effect of divorce. Consistent with the multiple
factions (or branches) theory, we find that the strongest reduction in the probability of family
3

transition occurs when the owner not only has been married more than once, but also has children
with multiple spouses.
Overall, our results indicate that family structure and politics are important determinants of
the probability of transition. In fact, in our regressions, family variables are always economically
and statistically significant whereas firm level variables (performance, industry concentration, etc)
are only sometimes significant.
Our paper is related to a growing body of literature in economics about family firms. Burkart,
Panuzi and Shleifer (2003) show that when there are non-transferable private benefits due to weak
investor protection families may choose family succession even when family members have lower
ability than potential outside managers. Family owners may prefer CEOs from within the family
if they have altruistic motives and trust their descendants (Chami 2001). Children invest relation-
specific human capital in the firm during their upbringing, which may be an advantage that can
be exploited in managing the firm later on in their life (Bhattacharya and Ravikumar 2001). The
latter paper together with Casselli and Gennaioli (2003) also point to that the presence of capital
market imperfections may favor within family management relative to outside managers.
Related to our study is a series of empirical papers that estimate the consequences of family
and/or founder controlled firms. The evidence on the impact of family control on firm performance
is mixed. Anderson and Reeb (2003) find a positive performance effect when family members serve
as CEOs relative to outside CEOs. Adams, Almeida and Ferreira (2003) support this insight using
an instrumental variable approach. Perez-Gonzales (2002) finds a large and negative impact of firm
value when the CEO position is inherited within a family. Villalonga and Amit (2004) find that
firm value is higher when the founder runs the firm, lower when a professional manager does it and
lowest when a heir is at the helm of the corporation. McConaughy,Matthews and Mistra (1998),
McConaughy, Henerson and Mistra (2001) and Palia and Ravid (2002) find a positive impact on
market value and performance of having firms managed by their founders. Nelson (2003) studies
founder influence at initial public offerings and finds that the stock market pays a higher price for
founder-managed firms. Finally, the Johnson et al. (1985) study of sudden executive deaths finds
that there is a significant positive stock price reaction to a sudden death of a founding executive
manager.
Finally, there is a large literature on family firms in business organization. Many contributions
4
owe to the classic studies of family firms by Levinson (1971) and transition of power in family
firms by Barnes and Hershon (1976). Recent books by Gersick et al. (1997), Lansberg (1999) and
Ward (1987) provide rich discussions and insightful cases of the many challenges that family firms
have during a generational transition. This literature focuses on family organization and family
development as key factors in determining how family businesses develop.
The paper proceeds as follows. The next section describes the data. Section 3 provides some
stylized facts about privately held family firms. Section 4 contains the statistical analysis and
section 5 concludes.
2 Data description
In this section we describe the sources of data and the procedures we followed to construct our
dataset. We also provide descriptive statistics.
2.1 Firm data
We use two sources of firm data. The first is Købmandsstandens Oplysningsbureau’s dataset
(“KOB” dataset). KOB is a private firm that uses the annual reports that all limited liability firms
are required to file with the Ministry of Economics and Business Affairs to compile this dataset. The
dataset contains accounting, management and ownership information of all the registered limited
liability joint stock companies in Denmark.5 These annual reports include items from firms’ income
statement (e.g. sales, profits) and balance sheet (e.g. book value of assets, debt and equity). Firms
are also required to furnish the Ministry of Economic and Business Affairs with the name of the
CEO and all current board members. Finally, firms are required to file ownership information.
Although the official requirement is that firms list the names of shareholders with an equity stake
above 5%, many firms also include the actual stakes of the large shareholders. In 65.9% of the firms
we can account for 90% or more of the voting rights. For firms with two or more shareholders the
corresponding figure is 29.6%. KOB started this dataset in 1995 and the last year available is 2002.
Because each annual report has to include accounting information for the previous three years, we
have accounting data from 1993 to 2002. However, for all other data the window is 1995 to 2002.5In addition to the limited liability joint stock company form (Aktieselskabet) firms can also register as a An-
partsselskab, which is similar to the the German GMBH or the US S-corporation. We exclude this latter corporateform from the analysis due to lack of data.
5
The second source comes from the agency Erhvervs- og Selskabsstyrelsen under the Ministry
of Economic and Business Affairs (“E&S” dataset). Under Danish company law, when a firm is
founded, it must report the name of the founders, the CEO and all board members to this agency.
In addition, firms are required to file any change in the CEO and board positions with the agency
within 2 weeks of the actual change. The E&S dataset is compiled from all these reports. Even
though firms have been required to file these reports for many decades, the dataset is available in
electronic format only since 1986. As a result, for firms founded after 1986, we have information
about the founders, CEOs (current and past) and board members (current and past). However,
for firms founded before 1986 we do not have information on founders or on board members that
have not been replaced from 1986. Practically, this is not a serious limitation. Because the KOB
dataset also contains the names of all board members from year 1995 to 2002, we can ascertain
how many board members are not present in the E&S dataset. The figure is smaller than 5%.
Even though the board member information is already in the KOB dataset, we use the E&S
dataset because, in addition to the names of CEOs, board members and founders, the E&S dataset
contains their CPR number, a personal identification number similar to the Social Security number
in the United States. We were able to get the CPR numbers, although for privacy reasons, these
are not available to the public.
We restrict our sample to closely held joint stock companies that are both in the KOB and E&S
datasets in the window from 1995 to 2002. We use consolidated accounting information for firms
with 100% owned subsidiaries. When other corporations hold stakes in a firm, we go back to get
the ultimate owners. Since we have the entire universe of Danish firms, the corporate owner of a
firm in our sample is very likely to be in our sample as well.6
2.2 Family data
Our source for family information is the CPR agency in the Ministry of Interior, the government
department that administers the CPR numbers. For every person whose CPR number we submit,
this agency provides us with the name, address, date of birth and date of death (if any). We also get
the names and CPR numbers of the person’s immediate relatives: parents, siblings, and children.6Except when the corporate owner is a non-Danish corporation or in the very few cases in which the corporate
owner have not complied with the law and has not filed an annual report with the Ministry of Economic and BusinessAffairs.
6

In addition, we obtain the entire history of marriages and divorces: names and CPR numbers of
current and previous spouses and dates of marriages and divorce.
Since the focus of our study is on family ownership, we need to construct the family tree for the
owners of the firm. The KOB database has ownership information. Unfortunately, this database
only has the names of the owners but not the their CPR number. Thus, we cannot link the KOB
dataset with the information provided by the CPR agency. The E&S dataset does have CPR
numbers, but it does not have the list of owners. To solve this problem, we proceed as follows.
Form the E&S dataset, we obtain the names and CPR numbers of current and all past CEOs,
current and past board members, and founders and submit their CPR number to the CPR agency.
In this first round we submit almost 352,000 CPR numbers. In a second round, we submit the CPR
numbers of the immediate relatives of the people in the first round. Thus we are able construct an
extended family tree with grandparents, cousins, etc. The total number of individuals for which
we have data is approximately 1 million. This is equivalent to around 20% of the current Danish
population. Next, for each firm, we construct a list that pools all family members of the CEOs
(current and past), board members (current and past), and founders. Using the names, we try to
match owners (from KOB) to this list of family members. We can assign a CPR number to all the
owners that we match. With the CPR number we gain access to the family tree information. Our
matching procedure is very efficient. In about 87.2% of the firms, we are able to match at least one
owner.7
Conditional on getting the CPR number, our methodology to identify family members is more
precise than using the last name. For example, our method can identify daughters that have
changed their last name, sons and daughters in law, cousins with different last names, and even
partners who are not married but have joint children.8
7It is important to get family information for CEO board members and founders before matching owners toincrease the efficiency of the marching procedure. It is common, for example, for a parent to retain ownership but tohave his children run the firm. In this case, the children but not the father appears in the E&S database. However,because we obtain the name and CPR number of all people with family relations to persons in E&S, we will be ableto match the father.
8We identify partners who are not married but have children (a common family situation in Denmark) because,in the first round we get the name and CPR number of the child and in the second step, when we submit the child’sCPR number, we get the name of both parents, whether or not they are married.
7

3 Descriptive statistics
3.1 Family and non-family firms
We first identify family firms. In most of the following analysis we classify a firm as a family firm
if the members of a single family hold more than 50% of the voting shares. Non-family firms are
those in which no single family holds a majority of the voting shares. These can be firms in which
no family holds more than 50% of the voting shares or firms in which the majority shareholder
is a foundation, a foreign corporation or the State. We only classify firms with personal owners
as non-family firms when we can check, using the family tree information provided by the CPR
agency, that the owners are not family members. When we do not have the complete family tree
for all shareholders (for example because we were not able to match the name of the owner with the
E&S dataset) we classify the firm as undecided. In this category we also include firms for which we
do not have the actual distribution of ownership stakes of the owners and firms where the control
contest is tied (i.e, two families holding 50% each).
We use a 50% threshold for control as opposed to the lower thresholds (10% or 20%) used in
empirical analysis of publicly held corporations. The reason for this difference lies in the different
ownership structures of closely held and publicly held firms. In a publicly held firm, a shareholder
with a large minority stake, say 10% to 20%, can have effective control because the rest of the
shareholder are so dispersed that collective action problems prevent them from exercising their
control. However, because the number of shareholders in a close corporation is smaller (in our
sample the average number of shareholders is only 1.73), it is less likely that shareholders will face
severe collective action problems and, as a result, a 50% stake is needed to achieve control (see
Bennedsen and Wolfenzon, 2000).
There are several definitions of family firms (see, e.g., Villalonga and Amit, 2004). They include
different combinations of family ownership, management, and control. Our definition is based only
on control. The ownership dimension is not particularly useful in the context of closely held
corporations. If we were to apply the definition that a family firm is one in which a family holds a
large stake, say 20% or larger, we would end up classifying most firms as family firms. Regarding
the management dimension, we show in section 6, that our results are unchanged when we use a
more strict definition of family firm that requires that a family both control the firm and some of
8

its members be involved in management.
Table 1 shows the number of firms that fall in each category for the year 2002. Out of a total of
47,355 corporations in that year, we classify 77.5% as family firms, 5.6% as non-family firms, and
we were not able to classify the remaining 17%. We further classify family firms into two groups.
The fist group is composed of family firms in which a single member of the family is a shareholder.
In the second group, there are more than one member of the controlling family in the ownership of
the firm. Because defining family variables (number of children, marital status, etc.) is easier and
less controversial when it refers to a single individual, we use mostly the first group in the analysis
that follows.
Table 1 shows that a large fraction of the closely held firms in Denmark are controlled by a single
family. Family firms are prevalent across all firms sizes –although they are more common among
the smallest firms– and all ages (tables not shown). When we separate firms into size quintiles,
family firms appear more often in the smallest quintile (82.5%) but they are still very prevalent in
the largest quintile (67%). Regarding age, family firms constitute 74.7% of the firms in the younger
age quintile and 80% of the oldest.
Table 1 also shows that family firms appear to be slightly more profitable. The average ROA
for all family firms (single owner and multiple owner) is 5.5% compared with 5.2% for the non-
family firms. In terms of number of owners, family firms have fewer shareholders. Of course, this is
expected because firms with a single shareholder are classified as family firms under our definition.
However, even conditional on the number of shareholders being two or higher, the number of
shareholders is lower for family firms. Finally, Table 1 shows that there is a significant overlap
between control and management. More than 90% of the firms have CEO from the controlling
family.
3.2 Succession
In most of the paper we focus on the decision to transfer of CEO position to a family member or
to an manager outside the family. We identify changes in the CEO position from one year to the
next by comparing the CPR number of the CEO in adjacent years. In section 6 we show that our
results are unchanged when we focus on ownership transition.
On average, about 1% of family firms have a CEO transition in a given year. The reason why
9

this number is so low (compared to the corresponding number for publicly held firms) is that all
recently incorporated firms appear in the dataset. Thus, our dataset contains a large fraction of
very young firms that never make it to their first succession. Table 2 shows the number of CEO
transitions in every year from 1995 to 2002. Panel A shows all the CEO transitions in family firms
that we are able to identify. Panel B shows the number of CEO transitions in firms for which we
have the complete family tree information of the controlling family. We have 3,169 transitions in
family firms in which a single member of the controlling family is a shareholder and 522 transitions
in family firms in which multiple members of the controlling family are shareholders. We use the
sample of 3,169 transitions in most of the following analysis.
Table 3 shows firm and family characteristics by the identity of the new CEO. Out of 3,169
transitions, 794 (25%) are family transitions. Within this category, 325 are transitions to the next
generation (children, step children and children in law), 415 transitions are to a family member
in the same generation (spouse and siblings) and 54 are to a relative of the previous generation
(parents).
Comparing firm characteristics, Table 3 shows that firms in which the new CEO is a family
member are considerably smaller, older and less profitable than firms in which the new CEO is an
outsider. In terms of family characteristics, owners of firms that name a CEO from the family are
less likely to be divorced, less likely to have been married multiple times and have significant more
children than owners of firms in which the new CEO is a non-family member.
4 The effect of family structure on succession
In this section we consider the effect of family structure (number of children and gender composition)
on the succession decision.
We use two measures of the endogenous variable CEO transition. One is Family transition to
all generations, which is a dummy variable that takes the value of one when the new CEO belongs
to the controlling owner’s family. There is a potential problem with this variable, namely that
transitions to family members of the same generation might not be a final decision but can be a
temporary arrangement until the next generation is old enough tot manage the firm. Supporting
this conjecture is the fact that Table 3 shows that the number of adult children at the time of “lateral
transitions” is significant lower than the number of adult children at the time of a transition to the
10
next generation.
To address this problem, we drop all family transitions to both the same generation and the
previous generation and define the variable Family transition to next generation, which is a dummy
variable that takes the value of one when the new CEO is a child, step child or child in law of the
controlling owner.
4.1 Univariate analysis
Table 4 shows the probability of family succession conditional on the number of children (panel A)
and the number of adult children (panel B). The probability of transition increases monotonically
as the number of children is raised from 0 to 3 in both panels and for both measures of family
succession. In 3 out of the four cases, the probability of family succession decreases for controlling
shareholders having four or more children.
The positive impact of children is not surprising. With more children, there is a higher prob-
ability that one of them will be talented enough and willing to take over the CEO position. The
negative impact of the fourth and subsequent children is puzzling. It could be that, from the point
of view of the children, the higher number of siblings reduces the probability of getting the CEO
position and hence negatively affects incentives to invest in the human capital necessary to run the
firm. This rises the probability that, at the time of succession, no child is capable of taking the
reins of the firm. Another possibility is related to the fact that, typically, the ownership of the
firm is evenly split among all the children. talented children will not be willing to commit their
human capital to the family firm for a small fraction of the proceeds. Currently, we are testing
these hypothesis.
Moving to gender composition, Table 5 shows the probability of family transition conditional
on children’s gender composition. Panel A shows that family transition is less frequent in families
in which all children are females. This result is stronger for the variable Family transition to the
next generation: in families with at least one male offspring the family transition frequency is close
to 17.2%, whereas in families in which all children are female this probability is only 6.9%. In panel
B, we confirm this pattern by restricting attention to children above 20 years.
11

4.2 Multivariate analysis
Table 6 present two sets of multivariate probit analysis. The first three columns of Table 6 show
the result of a probit analysis on the variable family transition to the next generation. Because
families with no children do not have the option of family transition to the next generation, we
drop them from these regressions. The last three columns show the results of a probit analysis on
the variable family transition to all generations on the unrestricted transition sample.
We use two specifications for number of children and gender distribution. In the first specifi-
cation we define Number of adult children as the number of children of the controlling family aged
20 or above at the time of the transition. We also include number of adult children squared. We
add a gender dummy, All adult children are females. Our second specification measure number of
male and female children independently.9
In columns 3 and 6 we use the first specification and add a number of controls. Firm size is
book value of assets measured in million Danish kroner (equivalent to 135,000 euros). Firm age
is measured as number of years since the firm was established. Profitability is industry adjusted
returns on assets, defined as operating profit over book value of assets minus the mean 2-digit SIC
industry return on assets. Industry competition is the Herfindahl-Index, which sums the squares
of each firm’s market share within the industry. Our last two control variables are: Old CEO in
Family and Gender composition of industry workforce. The former is a dummy that takes the value
of one when the departing CEO belongs to the controlling family. The latter variable measures the
ratio of women in the industry workforce.
In all specifications, the insights from the univariate analysis are confirmed. In columns 1,3,
4, and 6, Number of adult children is always positive and highly significant. This effect is also
economically significant. Ignoring the quadratic effect, one additional child around the average of
approximately 2 children increase the likelihood of family transition to children by almost 20%.
Number of adult children squared is always negative and statistically significant implying that
the marginal effect of additional children on family transition eventually becomes negative. The
dummy variable for all adult children are daughters is negative and statistically significant.
In columns 2 and 5, both number of adult sons and number of adult daughters are positive9In addition to the presented table using children above 20 years, we did also run the regressions using the number
of children independently of their age. This did not change the results presented in the tables.
12

and significant. However, the coefficient on number of sons is around two times the coefficient on
number of daughters.
In terms of the control variables, the most significant results relate to size and industry concen-
tration. Larger firms and firms in competitive industries are less likely to be transferred to a family
member. This could be driven by the fact that managerial ability is more important in these firms
and so the family simply chooses the person with the highest ability. Only in rare circumstances
will this person be a family member.
We sum up by concluding that our data shows a statistical correlation between management
transition on one side and the number of children, and gender composition of children on the other.
4.3 Causality
Our previous results do not prove a causal effect of number of children on family transition. The
correlation uncovered might be driven by the reverse causality or unobserved variables. It is possi-
ble, for example, that owners who want ensure a family transition in the future have more children
today. It is also possible that unobserved characteristics (e.g., being a ‘family man’ or a ‘family
woman’) drive both the high number of children and the family transition decision.
The issue of endogeneity of number of children in other economic decisions have been discussed
in the literature. The classical example is that the fertility decision is endogenous in a regression of
women’s labor supply. It is worth observing, however, that in our setting, the endogeneity problem
is potentially less severe. The fertility and the succession decision are taken, on average, 30-40 years
apart. Hence, it requires significant foresight of the young business owner to incorporate this at
the time that family size is decided. In contrast, in the example of women’s labor supply referred
to above, the participation and fertility decisions are taken simultaneously: a woman that can find
or has a job might decide not to have children.
In any case, we try to address the endogeneity problem as follows. We follow Angrist and Evans
(1998) in instrumenting the number of children using gender composition of the first two children.
This is potentially a good instrument because the gender of the first two children is randomly
assigned. In addition, Angrist and Evans (1998) document that parents like to have children of
both gender. As a result, when the first two are of the same gender, the probability of having a
third one is higher. Because this argument only works for couples that are still married, we focus
13
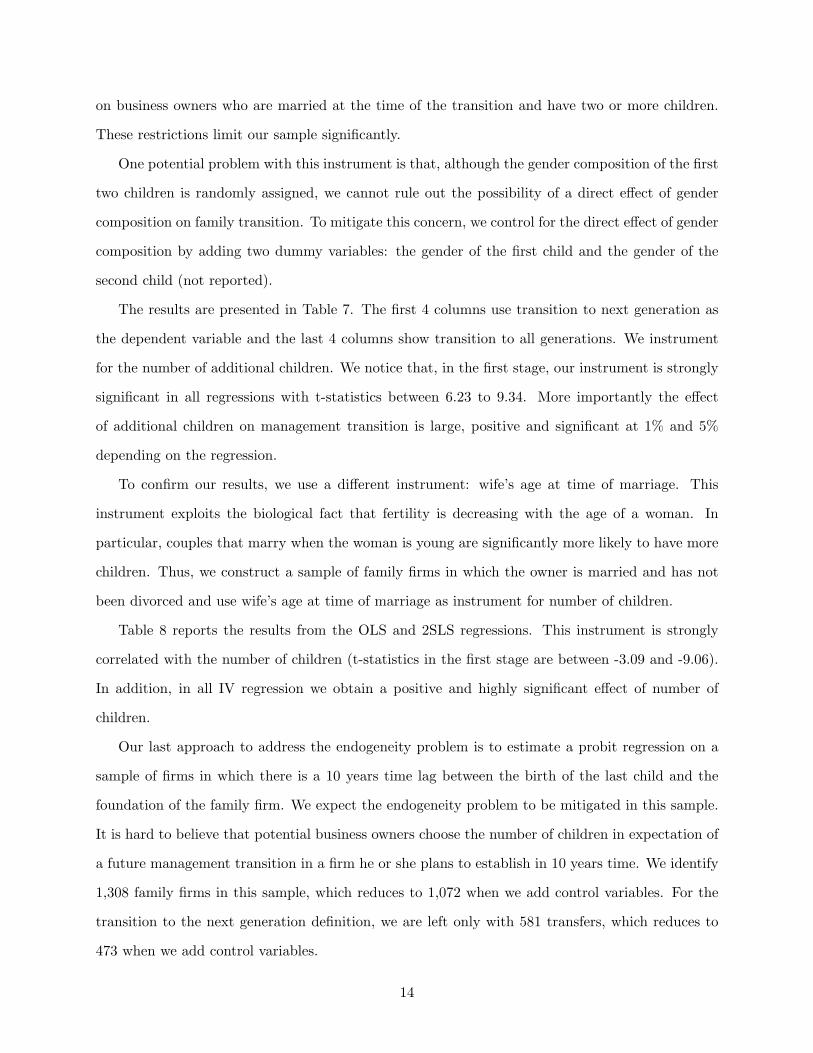
on business owners who are married at the time of the transition and have two or more children.
These restrictions limit our sample significantly.
One potential problem with this instrument is that, although the gender composition of the first
two children is randomly assigned, we cannot rule out the possibility of a direct effect of gender
composition on family transition. To mitigate this concern, we control for the direct effect of gender
composition by adding two dummy variables: the gender of the first child and the gender of the
second child (not reported).
The results are presented in Table 7. The first 4 columns use transition to next generation as
the dependent variable and the last 4 columns show transition to all generations. We instrument
for the number of additional children. We notice that, in the first stage, our instrument is strongly
significant in all regressions with t-statistics between 6.23 to 9.34. More importantly the effect
of additional children on management transition is large, positive and significant at 1% and 5%
depending on the regression.
To confirm our results, we use a different instrument: wife’s age at time of marriage. This
instrument exploits the biological fact that fertility is decreasing with the age of a woman. In
particular, couples that marry when the woman is young are significantly more likely to have more
children. Thus, we construct a sample of family firms in which the owner is married and has not
been divorced and use wife’s age at time of marriage as instrument for number of children.
Table 8 reports the results from the OLS and 2SLS regressions. This instrument is strongly
correlated with the number of children (t-statistics in the first stage are between -3.09 and -9.06).
In addition, in all IV regression we obtain a positive and highly significant effect of number of
children.
Our last approach to address the endogeneity problem is to estimate a probit regression on a
sample of firms in which there is a 10 years time lag between the birth of the last child and the
foundation of the family firm. We expect the endogeneity problem to be mitigated in this sample.
It is hard to believe that potential business owners choose the number of children in expectation of
a future management transition in a firm he or she plans to establish in 10 years time. We identify
1,308 family firms in this sample, which reduces to 1,072 when we add control variables. For the
transition to the next generation definition, we are left only with 581 transfers, which reduces to
473 when we add control variables.
14
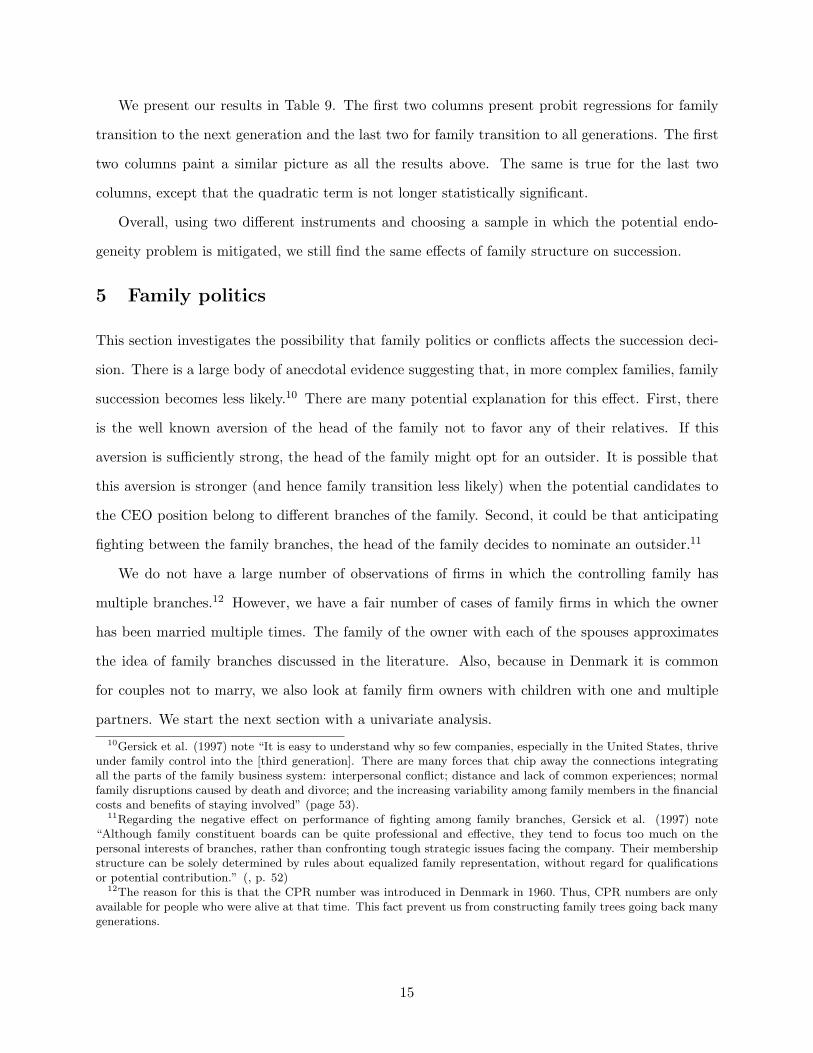
We present our results in Table 9. The first two columns present probit regressions for family
transition to the next generation and the last two for family transition to all generations. The first
two columns paint a similar picture as all the results above. The same is true for the last two
columns, except that the quadratic term is not longer statistically significant.
Overall, using two different instruments and choosing a sample in which the potential endo-
geneity problem is mitigated, we still find the same effects of family structure on succession.
5 Family politics
This section investigates the possibility that family politics or conflicts affects the succession deci-
sion. There is a large body of anecdotal evidence suggesting that, in more complex families, family
succession becomes less likely.10 There are many potential explanation for this effect. First, there
is the well known aversion of the head of the family not to favor any of their relatives. If this
aversion is sufficiently strong, the head of the family might opt for an outsider. It is possible that
this aversion is stronger (and hence family transition less likely) when the potential candidates to
the CEO position belong to different branches of the family. Second, it could be that anticipating
fighting between the family branches, the head of the family decides to nominate an outsider.11
We do not have a large number of observations of firms in which the controlling family has
multiple branches.12 However, we have a fair number of cases of family firms in which the owner
has been married multiple times. The family of the owner with each of the spouses approximates
the idea of family branches discussed in the literature. Also, because in Denmark it is common
for couples not to marry, we also look at family firm owners with children with one and multiple
partners. We start the next section with a univariate analysis.10Gersick et al. (1997) note “It is easy to understand why so few companies, especially in the United States, thrive
under family control into the [third generation]. There are many forces that chip away the connections integratingall the parts of the family business system: interpersonal conflict; distance and lack of common experiences; normalfamily disruptions caused by death and divorce; and the increasing variability among family members in the financialcosts and benefits of staying involved” (page 53).
11Regarding the negative effect on performance of fighting among family branches, Gersick et al. (1997) note“Although family constituent boards can be quite professional and effective, they tend to focus too much on thepersonal interests of branches, rather than confronting tough strategic issues facing the company. Their membershipstructure can be solely determined by rules about equalized family representation, without regard for qualificationsor potential contribution.” (, p. 52)
12The reason for this is that the CPR number was introduced in Denmark in 1960. Thus, CPR numbers are onlyavailable for people who were alive at that time. This fact prevent us from constructing family trees going back manygenerations.
15

5.1 Univariate analysis
Table 10 shows the family transition frequencies conditional on marital status. We divide the
owners into four marital groups: The first consists of owners who have never been married. Less
than 3% of the owners in this group have children and, on average, they are younger than the
other groups. The second group consists of owners who are married and have not been previously
divorced. The third group consists of owners who are currently divorced. Finally, the fourth
group consists of owners who have been married at least twice. Panel A shows that probability of
transition to the next generation is highest in the married group, slightly lower for the divorced
group and much lower for the group of owners with multiple marriages. Panel B shows that when
we focus on transfers to all generations, owners with multiple marriages have a lower frequency of
family transition relative to the owners who are still in their first marriage. The divorced and not
remarried group now has the lowest family transfer frequency. This is probably due to the fact that
there are fewer spouse to spouse transitions among the group of divorced owners.
The right hand side of Table 10 divides the owners depending on the number of partners with
which they have children (one or multiple partners). The frequency of generational transfer is
almost twice as large for owners with children from a single partner.
These univariate results are consistent with the idea that multiple branches reduce the proba-
bility of family succession.
5.2 Multivariate analysis
Table 11 presents the results of four probit regressions. The dependent variable is family transition
and we use the same set of covariates as in Table 6. In all regressions, the coefficient on the
variable Multiple Marriages is negative and significant at either the 1% or the 5% level. The sign
and statistically significance of the coefficients of variables measuring family structure remain the
same.
5.3 Isolating the mechanism
We showed above that there is a negative correlation between Multiple Marriages and family
succession. We argued that this correlation is driven by the increase in the number of factions
inside the family. However there might be other reasons that explain this correlation. In this
16
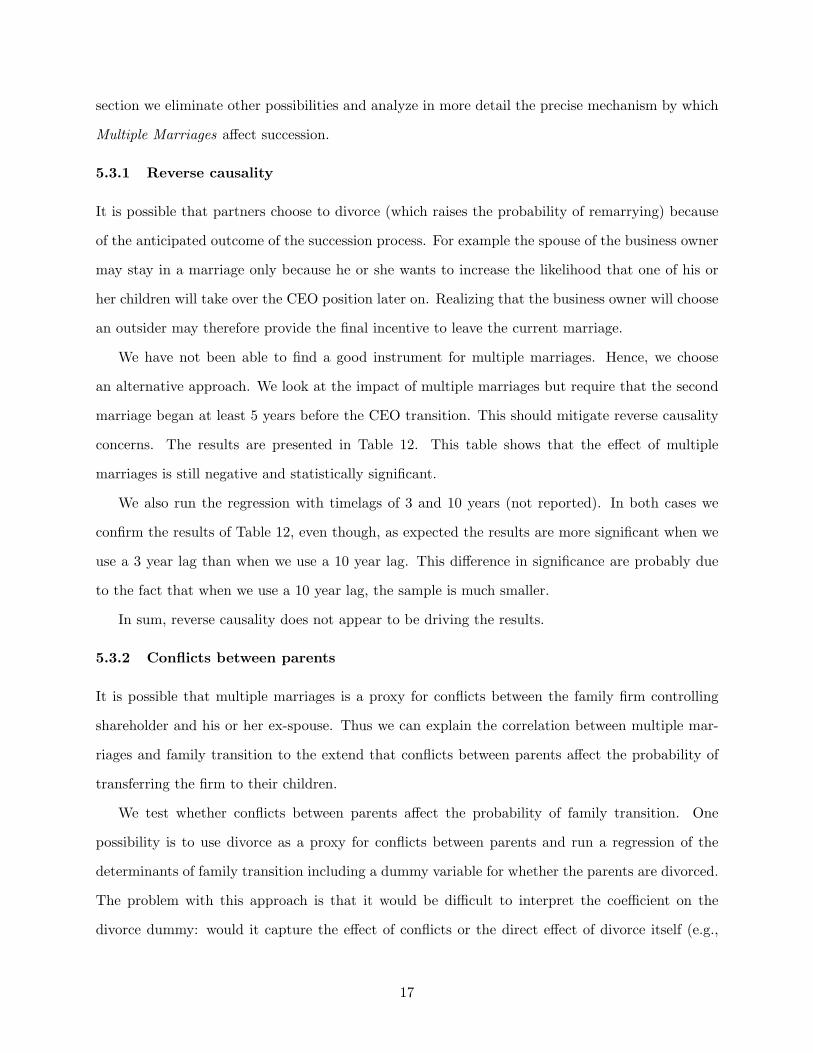
section we eliminate other possibilities and analyze in more detail the precise mechanism by which
Multiple Marriages affect succession.
5.3.1 Reverse causality
It is possible that partners choose to divorce (which raises the probability of remarrying) because
of the anticipated outcome of the succession process. For example the spouse of the business owner
may stay in a marriage only because he or she wants to increase the likelihood that one of his or
her children will take over the CEO position later on. Realizing that the business owner will choose
an outsider may therefore provide the final incentive to leave the current marriage.
We have not been able to find a good instrument for multiple marriages. Hence, we choose
an alternative approach. We look at the impact of multiple marriages but require that the second
marriage began at least 5 years before the CEO transition. This should mitigate reverse causality
concerns. The results are presented in Table 12. This table shows that the effect of multiple
marriages is still negative and statistically significant.
We also run the regression with timelags of 3 and 10 years (not reported). In both cases we
confirm the results of Table 12, even though, as expected the results are more significant when we
use a 3 year lag than when we use a 10 year lag. This difference in significance are probably due
to the fact that when we use a 10 year lag, the sample is much smaller.
In sum, reverse causality does not appear to be driving the results.
5.3.2 Conflicts between parents
It is possible that multiple marriages is a proxy for conflicts between the family firm controlling
shareholder and his or her ex-spouse. Thus we can explain the correlation between multiple mar-
riages and family transition to the extend that conflicts between parents affect the probability of
transferring the firm to their children.
We test whether conflicts between parents affect the probability of family transition. One
possibility is to use divorce as a proxy for conflicts between parents and run a regression of the
determinants of family transition including a dummy variable for whether the parents are divorced.
The problem with this approach is that it would be difficult to interpret the coefficient on the
divorce dummy: would it capture the effect of conflicts or the direct effect of divorce itself (e.g.,
17

divorce settlement). Moreover, while it is clear that before the divorce there are conflicts between
the parents, it is not clear whether the conflict still exist after the divorce.
To isolate the effect of parental conflicts, we construct a sample of all business owners who are
married at the time of the transition. We construct a dummy variable Divorce after the transition
that takes the value of 1 if a divorced occurred two years after the transition. Because it is very
likely that the conflicts that lead to divorce are present two years prior to the actual divorce, our
variable captures parental conflicts. Moreover, because the parents are not divorced at the time of
the transition, we can be certain that the coefficient is not driven by the direct effects of divorce.
Table 13 shows our results. Our variable for parental conflicts is insignificant when we analyze
transition to the next generation. Therefore, it appears that parental conflicts do not have an effect
on the probability of leaving the firm to the next generation. The coefficient on parental conflicts
is negative and statistically significant when the dependent variable is transition to all generations.
The reason is transition to all generations includes transition to an spouse. Obviously, there are
fewer transitions to an spouse in the presence of parental conflicts.
In sum, at least for transition to the next generation, parental conflicts are not a channel by
which multiple marriages affect the probability of family succession.
5.3.3 The direct effects of divorce
One last channel, not related to our factions in the family story, by which multiple marriages
can affect the probability of transition is that divorce itself (e.g., the divorce settlement) affects
succession. Because most of the owners who have been married more than once have had a divorce,
it is possible that the correlation we uncovered is driven by the direct effect of divorce on succession.
To address this concern, we constructed a sample of family firms with owners that have been
married at least once and created the dummy variable: Divorced but not remarried (the category
with no dummy attached is the sample of owners who are still married). We estimated a probit
using the standard set of covariates and this dummy variable (actually, in Table 14, we include
two other dummies Multiple marriages with children with one partner and Multiple marriages with
children with multiple partners that we use in the next section). Results are presented in Table 14.
For transition to the next generation, the coefficient on Divorced but never remarried is statistically
insignificant. Thus, relative to owners who are still married, divorce has no effect on succession to
18

the next generation.
5.3.4 Multiple spouses and children with multiple partners
We further confirm our theory by testing additional implications that can be derived from it.
We propose that more than one faction in the family might lead to a lower probability of family
transition either because the head of the family is reluctant to choose from among two or more
different camps, or because an outsider will mitigate the inevitable fighting for the firm resources
among the factions. If any of these two stories is true, an additional implication is that the
probability of family succession should be even lower among the group of owners who have been
married more than once but that, in addition, have children with multiple spouses. Under the
first explanation, this is because an owner who has been married multiple times but has children
only with one spouse does not face the problem of choosing a child from different camps. Under
the second explanation, if these factions have, in addition to the spouse, other members, then the
fighting for resources could be more severe.
Table 14 shows the results. Both the coefficients on Multiple marriages with children with one
partner and on Multiple marriages with children with multiple partners are negative and significant.
However, the magnitude of the second coefficient is much larger (although the difference is not
statistically significant). In a second set of regressions, we define the dummy variables Multiple
marriages with sons with one partner and on Multiple marriages with sons with multiple partners.
Both coefficients are negative and significant, but now the difference is higher (however, it is still
not significant).
6 Robustness
We perform two robustness test. The first relates to the definition of succession. In the previous
analysis, we identified a succession with the change in the CEO position and defined a family
succession when the new CEO is a member of the controlling family. However, a succession will
also involve transfer of the owner’s equity stake in the firm. We used this alternative definition
in Table 15. We defined a succession as the introduction of a new shareholder. We classified the
succession as a family succession when the new shareholder is a member of the controlling family.
Using this new definition, we estimated probit regressions similar to those in Table 6. The results
19
are shown in Table 15. As can be seen from this table, overall, the qualitative results are not
changed.
The second robustness test relates to the definition of family firm. To this end, we used a more
strict definition of family firm. In addition to requiring that a family control more than 50% of the
firm, we require that there be at least two members of the controlling family among the owners,
the CEO and board members. We estimated probits similar to those of page 6 in this subsample.
The results are shown in Table 16. Again, qualitatively, the results do not change.
7 Conclusions
This paper uses a unique dataset to investigate the effect of family structure and politics on the
decision whether to leave the firm to a family member. It shows that both structure and politics
of the family are statistically and economically important determinants of succession. In addition
the paper documents that there is a causal connection between these factors and succession. We
argue that understanding this decision is important because the identity of the successor has been
shown to influence performance.
More generally, the paper presents one example in which knowing the family behind the firm
is important to understanding corporate decisions. There are many other instances in which the
family plays an important role on the corporate side. For example, sibling rivalries are supposed to
reduce value, family members provide capital to the firm and thus share risk, etc. Studying these
other corporate decision from the viewpoint of the family behind the firm is left for future research.
20

References
Adams, Renee B., Heitor Almeida, Daniel Ferreira (2003), Founder-CEOs and firm performance,Working Paper, Stockholm School of Economics.
Anderson, Ronald C., and David M. Reeb, 2003, Founding-family ownership and firm performance:Evidence from the S&P 500, Journal of Finance 58, 1301-1328.
Anderson, Ronald C., Mansi A. Sattar and David M. Reeb, 2003, Founding family ownership andthe agency cost of debt, Journal of Financial Economics 68, 263-285.
Angrist, Joshua D. and William N. Evans, 1998, Children and their parents’ labor supply: Evi-dence from exogenous variation in family size, American Economic Review 88, 450-77.
Barnes, Louis B. and Simon A. Hershon, 1976, Transferring power in the family business, HarvardBusiness Review 54, 105-114.
Becker, Gary, A treatise on the family, 1991. Enlarged Edition (Cambridge, Mass.: HarvardUniversity Print).
Bennedsen, Morten and Daniel Wolfenzon, 2000, The balance of power in closely held corporations,Journal of Financial Economics 58, 113-139.
Bergstrom, Theodore C., 1997, A Survey of theories of the family, Handbook of Population andFamily Economics, Elsevier Science.
Bertrand, Marianne, Simon Johnson, Samphantarak and Antoinnete Schoar, 2004, Mixing familywith business: A study of thai business groups and the families behind them, working paper.
Bhattacharya, Utpal and B. Ravikumar, 2001, Capital market and the evolution of family business,Journal of Business 74: 187-220.
Bhattacharya, Utpal and B. Ravikumar, 2002, From cronies to professionals: The evolution offamily firms, Working Paper, University of Indiana.
Burkart, Mike, Fausto Panunzi and Andrei Shleifer, 2003. Family firms, The Journal of Finance58, 2167-2202.
Butcher, Kristin F. and Anne Case, 1994, The effect of sibling sex composition on women’seducation and earnings, The Quarterly Journal of Economics, 109, 531-563.
Browning; Martin, 1992, Children and household economic behavior, Journal of Economic Liter-ature, 30, 1434-1475.
Casselli, Francesco and Nicola Gennaioli, 2003, Dynastic management, NBER Working Paper No.9442.
Chami, Ralph and IMF Institute, 2001, What is different about family businesses?, IMF WorkingPapers 01/70, International Monetary Fund
Claessens, Stijn, Joseph Fan and Larry Lang, 2000, The separation of ownership and control inEast Asian corporations, Journal of Financial Economics 58, 81-112.
Cronqvist, Henrik and Mattias Nilsson, 2003, Agency costs of controlling minority shareholders,Journal of Financial and Quantitative Analysis 38, 695-719.
21

Del Boca, Daniela, 2003, Mothers, fathers and children after divorce: The role of institutions,Journal of Population Economics, 16, 399-422.
Faccio, Mara and Larry Lang, 2002, The ultimate ownership of Western European corporations,Journal of Financial Economics 65, 365-395.
Gersick, Kelin E., John A. Davis, Marion McCollom Hampton, and Ivan Lansberg, 1997, Gener-ation to generation: Life cycles of the family business, Harvard Business School Press.
Grossman and Oliver Hart, 1980, Take-over bids, the free rider problem and the theory of thecorporation, Bell Journal of Economics, 11, 42-64.
Johnson, W. Bruce, Robert Magee, Nandu Nagarajan, and Herry Newman, 1985, An analysis ofthe stock price reaction to sudden executive Death: Implications for the management labormarket, Journal of Accounting and Economics, 7, 151-174.
La Porta, Rafael, Florencio Lopez de Silanes, and Andrei Shleifer, 1999, Corporate ownershiparound the world, Journal of Finance 54, 471-517.
Lansberg, Ivan, 1999, Succeeding Generations: Realizing the Dream of Families in Business,Harvard Business School Press.
Levinson, David, 1971, Conflicts that plague family businesses, Harvard Business Review, March-April 1971.
Levinson, David, 1978, The Seasons of a Man’s Life. New York: Ballantine Books
Levinson, David, 1996, The Seasons of a Woman’s Life. New York: Ballantine Books
MassMutual Financial Group, 2003, American family business survey.
McConaughy, Daniel L., Charles H. Matthews, Anne S. Fialko, 2001, Founding family-controlledfirms: Performance, risk, and value, Journal of Small Business Management, 39, 31-49.
McConaughy, Walker, Henerson, Jr., and Mistra, 1998, Founding family controlled firms: effe-ciency and value. Review of Financial Economics, 1, 1-19.
Morck, R., X. Strangeland, and B. Yeung, 2000, Inherited wealth, corporate control, and economicgrowth, in Concentrated Corporate Ownership, Randall, M. (ed.), The University of ChicagoPress.
New York Times, 1999, Father divides a business to keep the children united, August 22, 1999,section 3, p.g. 3.1
Palia, Darius and S. Abraham Ravid, 2002, The role of founders in large companies: entrenchmentor valuable human capital?, Working paper, Rutgers University.
Perez-Gonzalez, Francisco, 2002, Inherited control and firm performance, Working paper, ColumbiaUniversity.
Shanker, Melissa C. and Joseph H. Astrachan, 1996, Myths and realities: Family businesses’contribution to the US economy – A framework for assessing family business statistics, FamilyBusiness Review, 9, 107-123.
Smith, Brian F. and Ben Amoako-Adu, 1999, Management succession and financial performanceof family controlled firms, Journal of Corporate Finance, 5, 341-368.
22

Villalonga, Belen and Raphael Amit, 2004, How do family ownership, management and controlaffect firm value?, Harvard Business School and Wharton working paper.
Weiss, Yoram, 1997, The formation and dissolution of families: Why marry? Who marries whom?And what happens upon divorce, Handbook of Population and Family Economics, ElsevierScience.
Ward, John L., 1987, Keeping the family business healthy: How to plan for continuing growth,profitability and family leadership, Jossey-Bass, San Francisco.
23

Table 1, Firm Characteristics in 2002 by Type of Control This table reports mean and (median) descriptive statistics of firms controlled by a family, firms in which no family has control, and firms we were unable to classify in either of these two groups. We define control using a 50% (of votes) threshold. We distinguish between two types of family-controlled firms: those in which only one family member is a shareholder and those in which multiple members of the family are shareholders. The category unable to classify include firms we could not classify due to tied ownership (i.e. two families owning 50 pct. of the votes each) or missing information on the distribution of votes.
Family-controlled No controlling family
Unable to classify
Single family member is
shareholder
Multiple family members are shareholders
N, firms (total = 47,355) 30,147 6,542 2,630 8,036 Distribution (%) 63.7 13.8 5.5 17.0 Book value of assets in 1,000 €
1,163 (261)
3,297 (587)
24,603 (653)
3,148 (466)
Firm age
13.1 (11.0)
17.7 (14.0)
14.0 (8.0)
13.2 (9.0)
Return on assets (%)
5.7 (3.9)
4.6 (3.5)
5.2 (3.4)
5.2 (4.1)
Number of ultimate owners
1.03 (1.00)
2.54 (2.00)
3.52 (3.00)
3.12 (2.00)
CEO from the controlling family (%) 90.8 95.0

Table 2, CEO Transitions in Family Firms, 1995-2002 This table shows the number of CEO transitions that occurred in family controlled firms from 1995 to 2002. We define control using a 50% (votes) threshold. We distinguish between two types of family-controlled firms: those in which only one family member is a shareholder and those in which multiple members of the family are shareholders. Panel A includes all family firms with a CEO transition between 1995 and 2002, whereas Panel B includes the sub-sample of firms for which we were able to identify the family members’ CPR number and thereby obtain the complete family tree information.
1995 to
1996
1996 to
1997
1997 to
1998
1998 to
1999
1999 to
2000
2000 to
2001
2001 to
2002
Total
Panel A: All family controlled firms Single fam. Member owner Multiple fam. members owners
772 133
763 179
544 129
304 70
250 64
552 147
472 114
3,657 836
Panel B: Family controlled firms with complete family tree information Single fam. Member owner Multiple fam. members owners
686 83
639 101
459 76
261 45
221 39
493 96
410 82
3,169 522

Table 3, Family and firm characteristics of the sample of firms with a CEO transition This table shows descriptive statistics on family-controlled firms with a single family member as owner that experienced a CEO transition between 1995 and 2002 and for which we were able to obtain complete family information of the owners. We also present information about the family behind the firm. We define family transition as transitions to the next generation (children, step children and children in law), same generation (spouse and siblings) and to the previous generation (parents). Adult children includes children that were aged over 20 or above at the time of the transition. Panel A presents data on firm characteristics. Panel B presents data on the family behind the firm. All family statistics relate to the family of the controlling owner.
Transition to Family member Non-family
member
All transitions
Next Generation
Same generation
Previous Generation
All family transitions
Panel A: Firm characteristics
Mean book value of assets in 1,000 € 1,062 825 530 901 1,718 1,511
Mean firm age 18.7 12.5 8.6 14.8 13.1 13.5
Mean return on assets (%) 5.7 6.8 1.0 6.0 6.5 6.5 Panel B: The family behind the firm Retiring CEO
Age %Male %Family
60.4 82.2 95.1
52.9 73.0 96.7
34.6 87.0 92.6
54.7 77.8 95.8
50.4 83.7 76.1
51.5 82.2 81.0
New CEO Age %Male
34.1 83.4
51.0 37.3
57.5 75.9
44.5 58.8
46.3 86.9
45.8 79.9
Owner
Divorced (%) Multiple marriages (%)
13.5 9.5
14.2 13.3
5.6 5.6
13.4 11.2
17.0 15.4
16.1 14.4
Number of children 2.43 2.08 0.98 2.15 1.74 1.84 Number of daughters Number of adult children
0.96 2.35
0.96 1.43
0.50 0.00
0.93 1.71
0.86 0.95
0.88 1.14
Number of firms
325
415
54
794
2,375
3,169

Table 4, Family Transition and Number of Children This table shows the frequency of family transitions in family-controlled firms in which a single member of the controlling family is a shareholder conditional on the number of children. Under the columns labeled Family transition to next generation, we only include family transitions to children, step children and children in law. In these columns, CEO transitions to spouses, siblings and parents are not considered transitions (see section 3). Under the columns Family transition to all generations we include all types of family transitions (i.e., to all types of children, spouse, siblings and parents). The frequency of family transition (%FT) is the number of firms with family transition over the total number of transitions. In Panel A we count all children, whereas in Panel B we only count children that were aged 20 or above at the time of the transition. Number of children Family transition to next generation Family transition to all generations
N %FT N %FT
Panel A, All children 0 543 0.0 604 10.6 1 349 9.7 413 23,7 2 1,077 13.6 1,295 28.1 3 552 19.9 648 31.8 4+ 178 18.0 209 30.8 All 2,699 12.0 3,169 25.1 Panel B, Adult children 0 1,233 0.6 1,426 14.0 1 387 9.0 445 20.9 2 684 21.6 831 35.5 3 322 34.8 376 44.1 4+ 73 31.5 91 45.1 All 2,699 12.0 3,169 25.1

Table 5, Succession and gender composition of children This table shows the frequency of family transitions in family-controlled firms in which a single member of the controlling family is a shareholder conditional on the gender composition of the owner’s children. Under the columns labeled Family transition to next generation, we only include family transitions to children, step children and children in law. In these columns, CEO transitions to spouses, siblings and parents are not considered transitions (see section 3). Under the columns Family transition to all generations we include all types of family transitions (i.e., to all types of children, spouse, siblings and parents). The frequency of family transition (%FT) is the number of firms with family transition over the total number of transitions. Panel A we count all children, whereas Panel B we only count children that were aged 20 or above at the time of the transition. Family transition to next generation Family transition to all generations
N %FT N %FT Panel A: All children At least one son 1,681 17.2 2,003 30.5 All daughters 475 6.9 562 21.4 All 2,156 14.9 2,565 28.5 Panel B: Adult children At least one son 1,103 26.0 1,309 37.7 All daughters 363 8.5 434 23.5 All 1,466 21.7 1,743 34.1
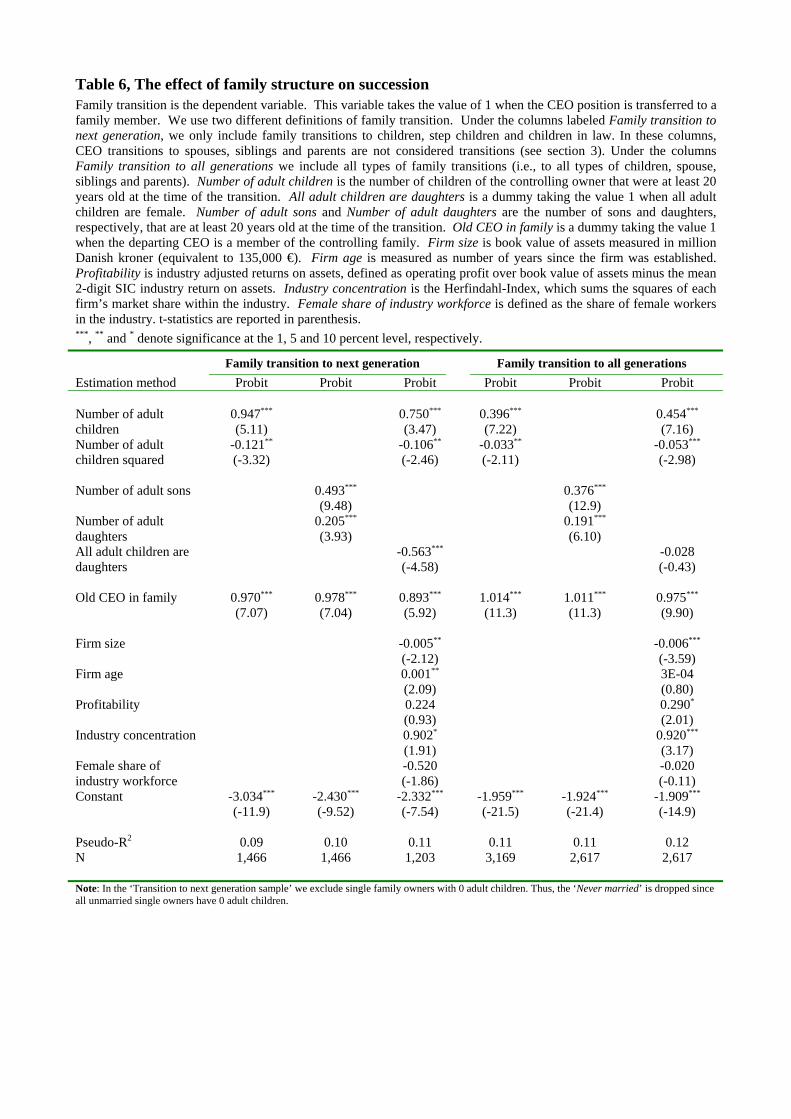
Table 6, The effect of family structure on succession Family transition is the dependent variable. This variable takes the value of 1 when the CEO position is transferred to a family member. We use two different definitions of family transition. Under the columns labeled Family transition to next generation, we only include family transitions to children, step children and children in law. In these columns, CEO transitions to spouses, siblings and parents are not considered transitions (see section 3). Under the columns Family transition to all generations we include all types of family transitions (i.e., to all types of children, spouse, siblings and parents). Number of adult children is the number of children of the controlling owner that were at least 20 years old at the time of the transition. All adult children are daughters is a dummy taking the value 1 when all adult children are female. Number of adult sons and Number of adult daughters are the number of sons and daughters, respectively, that are at least 20 years old at the time of the transition. Old CEO in family is a dummy taking the value 1 when the departing CEO is a member of the controlling family. Firm size is book value of assets measured in million Danish kroner (equivalent to 135,000 €). Firm age is measured as number of years since the firm was established. Profitability is industry adjusted returns on assets, defined as operating profit over book value of assets minus the mean 2-digit SIC industry return on assets. Industry concentration is the Herfindahl-Index, which sums the squares of each firm’s market share within the industry. Female share of industry workforce is defined as the share of female workers in the industry. t-statistics are reported in parenthesis. ***, ** and * denote significance at the 1, 5 and 10 percent level, respectively. Family transition to next generation Family transition to all generations Estimation method Probit Probit Probit Probit Probit Probit Number of adult children
0.947***
(5.11) 0.750***
(3.47) 0.396***
(7.22) 0.454***
(7.16) Number of adult children squared
-0.121**
(-3.32) -0.106**
(-2.46) -0.033**
(-2.11) -0.053***
(-2.98) Number of adult sons 0.493***
(9.48) 0.376***
(12.9)
Number of adult daughters
0.205***
(3.93) 0.191***
(6.10)
All adult children are daughters
-0.563***
(-4.58) -0.028
(-0.43) Old CEO in family 0.970***
(7.07) 0.978***
(7.04) 0.893***
(5.92) 1.014***
(11.3) 1.011***
(11.3) 0.975***
(9.90) Firm size -0.005**
(-2.12) -0.006***
(-3.59)
Firm age 0.001**
(2.09) 3E-04
(0.80) Profitability 0.224
(0.93) 0.290*
(2.01) Industry concentration 0.902*
(1.91) 0.920***
(3.17) Female share of industry workforce
-0.520 (-1.86)
-0.020 (-0.11)
Constant -3.034***
(-11.9) -2.430***
(-9.52) -2.332***
(-7.54) -1.959***
(-21.5) -1.924***
(-21.4) -1.909***
(-14.9) Pseudo-R2 0.09 0.10 0.11 0.11 0.11 0.12 N 1,466 1,466 1,203 3,169 2,617 2,617 Note: In the ‘Transition to next generation sample’ we exclude single family owners with 0 adult children. Thus, the ‘Never married’ is dropped since all unmarried single owners have 0 adult children.

Table 7, Succession decision with same gender dummy as the source of exogenous variation in family size The sample is constructed from family-controlled firms in which a single member of the controlling family is a shareholder. Following Angrist and Evans (1998) we keep only the firms in which the owner is still married and has at least two adult children. Family transition is the dependent variable. This variable takes the value of 1 when the CEO position is transferred to a family member. We use two different definitions of family transition. Under the columns labeled Family transition to next generation, we only include family transitions to children, step children and children in law. In these columns, CEO transitions to spouses, siblings and parents are not considered transitions (see section 3). Under the columns Family transition to all generations we include all types of family transitions (i.e., to all types of children, spouse, siblings and parents). The instrumented variable is Number of additional children which is the number of children in excess of 2. The instrument is Same gender, defined as a dummy taking the value 1 when the first two children have the same gender. Similarly to Angrist and Evans (1998) we add two dummies for the gender of each of the first two children to the list of exogenous covariates. All adult children are daughters is a dummy taking the value 1 if all adult children are female. Old CEO in family is a dummy taking the value 1 if the departing CEO is a member of the controlling family. Where indicated we include the following unreported control variables: Firm size, Profitability, Industry concentration and Female share of industry (see Table 6 for definitions). t-statistics are reported in parenthesis. The table only reports the second stage regression for 2SLS. We report the t-statistic on the instrument, Same gender, from the first stage regression at the bottom of each panel. ***, ** and * denotes significant at the 1, 5 and 10 percent level, respectively. Family transition to next generation Family transition to all generations Estimation method OLS 2SLS OLS 2SLS OLS 2SLS OLS 2SLS Same gender dummy as instrument for Number of additional children Estimation method OLS 2SLS OLS 2SLS OLS 2SLS OLS 2SLS Number of additional children
0.074***
(3.08) 0.292***
(3.52) 0.063**
(2.56) 0.321***
(2.69) 0.059***
(2.57) 0.258***
(3.16) 0.051**
(1.99) 0.311**
(2.82) All adult children are daughters
-0.101*
(-1.70) 0.013 (0.18)
-0.113***
(-1.68) 0.001 (0.01)
-0.074***
(-1.28) 0.035 (0.48)
-0.065(-1.03)
0.059 (0.70)
Old CEO in family 0.292***
(6.67) 0.291***
(6.31) 0.290***
(5.74) 0.304***
(5.58) 0.416***
(9.06) 0.415***
(8.71) 0.412***
(7.82) 0.426***
(7.56) Control variables NO NO YES YES NO NO YES YES Constant -0.030
(-0.54) -0.189**
(-2.29) 0.006 (0.07)
-0.163 (-1.48)
0.006 (0.11)
-0.139*
(-1.69) 0.006 (0.08)
-0.170 (-1.58)
t-statistic on instrument (8.80) (6.23) (9.34) (7.08) N 769 769 636 636 940 940 786 786

Table 8, Succession decision with wife’s age at marriage as the source of exogenous variation in family size The sample is constructed from family-controlled firms in which a single member of the controlling family is a shareholder. From this initial sample, we keep only the firms in which the owner is still married and has not been divorced at the time of the CEO transition. Family transition is the dependent variable. This variable takes the value of 1 when the CEO position is transferred to a family member. We use two different definitions of family transition. Under the columns labeled Family transition to next generation, we only include family transitions to children, step children and children in law. In these columns, CEO transitions to spouses, siblings and parents are not considered transitions (see section 3). Under the columns Family transition to all generations we include all types of family transitions (i.e., to all types of children, spouse, siblings and parents). The instrumented variable is Number of adult children, which is the number of children that were at least 20 years old.. We use Wife’s age at marriage as an instrument. All adult children are daughters is a dummy that takes the value 1 when all adult children are female. Old CEO in family is a dummy taking the value 1 if the departing CEO is a member of the controlling family. Where indicated, we include the following unreported control variables: Firm size, Profitability, Industry concentration and Female share of industry (see Table 6 for definitions). t-statistics are reported in parenthesis. The table only reports the second stage regression for 2SLS. We report the t-statistic on the instrument from the first stage regression at the bottom of each panel. ***, ** and * denotes significant at the 1, 5 and 10 percent level, respectively. Family transition to next generation Family transition to all generations Estimation method OLS 2SLS OLS 2SLS OLS 2SLS OLS 2SLS Wife’s age at marriage dummy as instrument for Number of adult children Number of adult children 0.079***
(5.42) 0.424***
(2.66) 0.069***
(4.22) 0.419**
(2.21) 0.057***
(5.93) 0.188***
(3.84) 0.059***
(5.40) 0.185***
(3.36) All adult children are daughters
-0.108***
(-3.95) 0.068 (0.78)
-0.119***
(-3.82) 0.069 (0.64)
-0.033 (-1.43)
0.147**
(2.09) -0.028(-1.08)
0.149*
(1.85) Old CEO in family 0.148***
(4.99) 0.150***
(4.06) 0.149***
(4.48) 0.158***
(3.76) 0.193***
(7.63) 0.190***
(7.16) 0.189***
(6.72) 0.186***
(6.33) Control variables NO NO YES YES NO NO YES YES Constant -0.088**
(-2.06) -0.844**
(-2.40) -0.017 (-0.30)
-0.794*
(-1.87) 0.007 (0.24)
-0.243**
(-2.49) 0.004 (0.09)
-0.254**
(-2.13) t-statistic on instrument (-3.64) (-3.09) (-9.06) (-8.27) N 996 996 825 825 1,833 1,833 1,520 1,520

Table 9, Succession in firms founded ten years after the owner’s last child was born The sample is constructed from family-controlled firms in which a single member of the controlling family is a shareholder. From this initial sample, we keep only the firms that were founded 10 years after the owner’s last child was born. Family transition is the dependent variable. This variable takes the value of 1 when the CEO position is transferred to a family member. We use two different definitions of family transition. Under the columns labeled Family transition to next generation, we only include family transitions to children, step children and children in law. In these columns, CEO transitions to spouses, siblings and parents are not considered transitions (see section 3). Under the columns Family transition to all generations we include all types of family transitions (i.e., to all types of children, spouse, siblings and parents). Number of adult children is the number of children that were at least 20 years old. All adult children are daughters is a dummy that takes the value 1 when all adult children are female. Old CEO in family is a dummy taking the value 1 if the departing CEO is a member of the controlling family. Where indicated, we include the following unreported control variables: Firm size, Profitability, Industry concentration and Female share of industry (see Table 6 for definitions). t-statistics are reported in parenthesis. ***, ** and * denotes significant at the 1, 5 and 10 percent level, respectively. Family transition to next generation Family transition to all generations Estimation method Probit Probit Probit Probit Number of adult children
1.678***
(4.31) 1.822***
(4.01) 0.223**
(2.01) 0.310**
(2.48) Number of adult children squared
-0.228***
(-3.26) -0.262***
(-3.18) 0.004 (0.16)
-0.020 (-0.69)
All adult children are daughters
-0.598***
(-2.96) -0.764***
(-3.15) -0.185 (-1.39)
-0.228 (-1.54)
Old CEO in family 1.230***
(5.11) 1.044***
(4.05) 1.065***
(7.31) 1.037***
(6.29) Control variables NO YES NO YES Constant -4.316***
(-7.57) -4.171***
(-6.22) -1.817***
(-9.18) -1.908***
(-7.62) Pseudo-R2 0.18 0.20 0.11 0.13 N 581 473 1,308 1,072
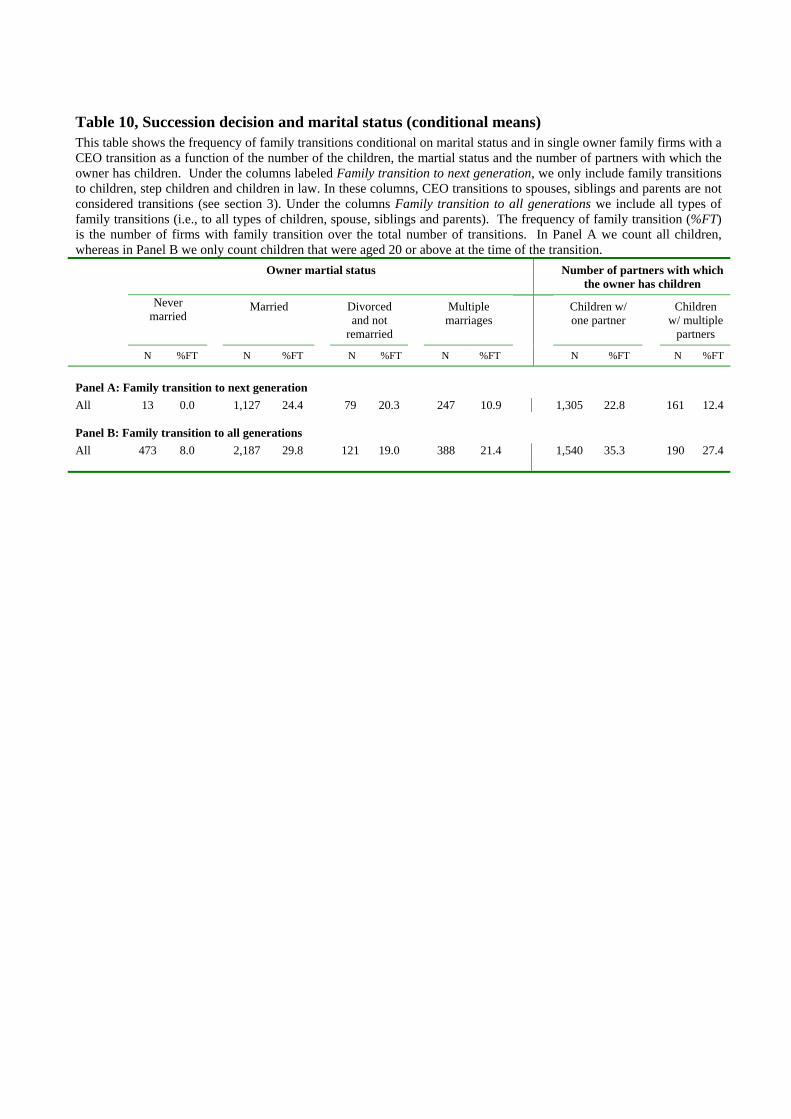
Table 10, Succession decision and marital status (conditional means) This table shows the frequency of family transitions conditional on marital status and in single owner family firms with a CEO transition as a function of the number of the children, the martial status and the number of partners with which the owner has children. Under the columns labeled Family transition to next generation, we only include family transitions to children, step children and children in law. In these columns, CEO transitions to spouses, siblings and parents are not considered transitions (see section 3). Under the columns Family transition to all generations we include all types of family transitions (i.e., to all types of children, spouse, siblings and parents). The frequency of family transition (%FT) is the number of firms with family transition over the total number of transitions. In Panel A we count all children, whereas in Panel B we only count children that were aged 20 or above at the time of the transition. Owner martial status Number of partners with which
the owner has children
Never married
Married Divorced and not
remarried
Multiple marriages
Children w/ one partner
Children w/ multiple
partners
N %FT N %FT N %FT N %FT N %FT N %FT
Panel A: Family transition to next generation All 13 0.0 1,127 24.4 79 20.3 247 10.9 1,305 22.8 161 12.4 Panel B: Family transition to all generations All 473 8.0 2,187 29.8 121 19.0 388 21.4 1,540 35.3 190 27.4

Table 11, Succession decision and marital status (probit regression)
Family transition is the dependent variable. This variable takes the value of 1 when the CEO position is transferred to a family member. We use two different definitions of family transition. Under the columns labeled Family transition to next generation, we only include family transitions to children, step children and children in law. In these columns, CEO transitions to spouses, siblings and parents are not considered transitions (see section 3). Under the columns Family transition to all generations we include all types of family transitions (i.e., to all types of children, spouse, siblings and parents). Number of adult children is the number of children of the controlling owner that were at least 20 years old at the time of the transition. All adult children are daughters is a dummy taking the value 1 when all adult children are female. Number of adult sons and Number of adult daughters are the number of sons and daughters, respectively, who are at least 20 years old at the time of the transition. Multiple marriages is a dummy taking the value 1 if the single controlling owner has been divorced and has remarried before the time of transition. Old CEO in family is a dummy taking the value 1 when the departing CEO is a member of the controlling family. Firm size is book value of assets measured in million Danish kroner (equivalent to 135,000 €). Firm age is measured as number of years since the firm was established. Profitability is industry adjusted returns on assets, defined as operating profit over book value of assets minus the mean 2-digit SIC industry return on assets. Industry concentration is the Herfindahl-Index, which sums the squares of each firm’s market share within the industry. Female share of industry workforce is defined as the share of female workers in the industry. t-statistics are reported in parenthesis. ***, ** and * denote significance at the 1, 5 and 10 percent level, respectively. Family transition to next generation Family transition to all generations Estimation method Probit Probit Probit Probit Number of adult children
0.739***
(3.87) 0.713***
(3.29) 0.297***
(4.85) 0.368***
(5.36) Number of adult children squared
-0.093**
(-2.51) -0.099**
(-2.29) -0.019 (-1.14)
-0.039**
(-2.15) All adult children are daughters
-0.535***
(-4.84) -0.566***
(-4.62) -0.119*
(-1.92) -0.101 (-1.48)
Multiple marriages -0.414***
(-3.49) -0.321**
(-2.53) -0.230***
(-2.89) -0.216**
(-2.47) Old CEO in family 0.937***
(6.75) 0.856***
(5.67) 0.983***
(10.9) 0.943***
(9.52) Firm size -0.005**
(-2.13) -0.007***
(-3.65)
Firm age 0.001**
(2.03) 3E-04
(0.83) Profitability 0.206
(0.85) 0.279*
(1.92) Industry concentration 0.937**
(1.98) 0.892***
(3.06) Female share of industry workforce
-0.482*
(-1.71) 0.020
(0.11) Constant -2.545***
(-9.48) -2.225***
(-7.14) -1.733***
(-16.3) -1.728***
(-12.7) Pseudo-R2 0.12 0.11 0.12 0.13 N 1,466 1,203 3,169 2,617

Table 12, Succession with exogenous marital status Family transition is the dependent variable. This variable takes the value of 1 when the CEO position is transferred to a family member. We use two different definitions of family transition. Under the columns labeled Family transition to next generation, we only include family transitions to children, step children and children in law. In these columns, CEO transitions to spouses, siblings and parents are not considered transitions (see section 3). Under the columns Family transition to all generations we include all types of family transitions (i.e., to all types of children, spouse, siblings and parents). Number of adult children is the number of children of the controlling owner that were at least 20 years old at the time of the transition. All adult children are daughters is a dummy taking the value 1 when all adult children are female. Multiple marriage at least 5 years before transition is a dummy taking the value 1 if the owner remarried at least 5 years before the time of transition. Old CEO in family is a dummy taking the value 1 when the departing CEO is a member of the controlling family. Where indicated, we include the following unreported control variables: Firm size, Profitability, Industry concentration and Female share of industry (see Table 6 for definitions). ***, ** and * denote significance at the 1, 5 and 10 percent level, respectively. Family transition to next generation Family transition to all generations Estimation method Probit Probit Probit Probit Number of adult children
0.735***
(3.86) 0.715***
(3.30) 0.295***
(4.81) 0.366***
(5.35) Number of adult children squared
-0.092**
(-2.49) -0.099**
(-2.30) -0.018 (-1.11)
-0.039**
(-2.13) All adult children are daughters
-0.536***
(-4.86) -0.565***
(-4.61) -0.119*
(-1.91) -0.099 (-1.45)
Multiple marriage at least 5 years before transition
-0.326***
(-2.61) -0.230*
(-1.71) -0.159*
(-1.87) -0.151 (-1.60)
Old CEO in family 0.950***
(6.86) 0.872***
(5.78) 0.993***
(11.0) 0. 954***
(9.63) Control variables NO YES NO YES Constant -2.571***
(-9.57) -2.253***
(-7.22) -1.753***
(-16.5) -1.747***
(-12.9) Pseudo-R2 0.11 0.11 0.12 0.12 N 1,466 1,203 3,169 2,617
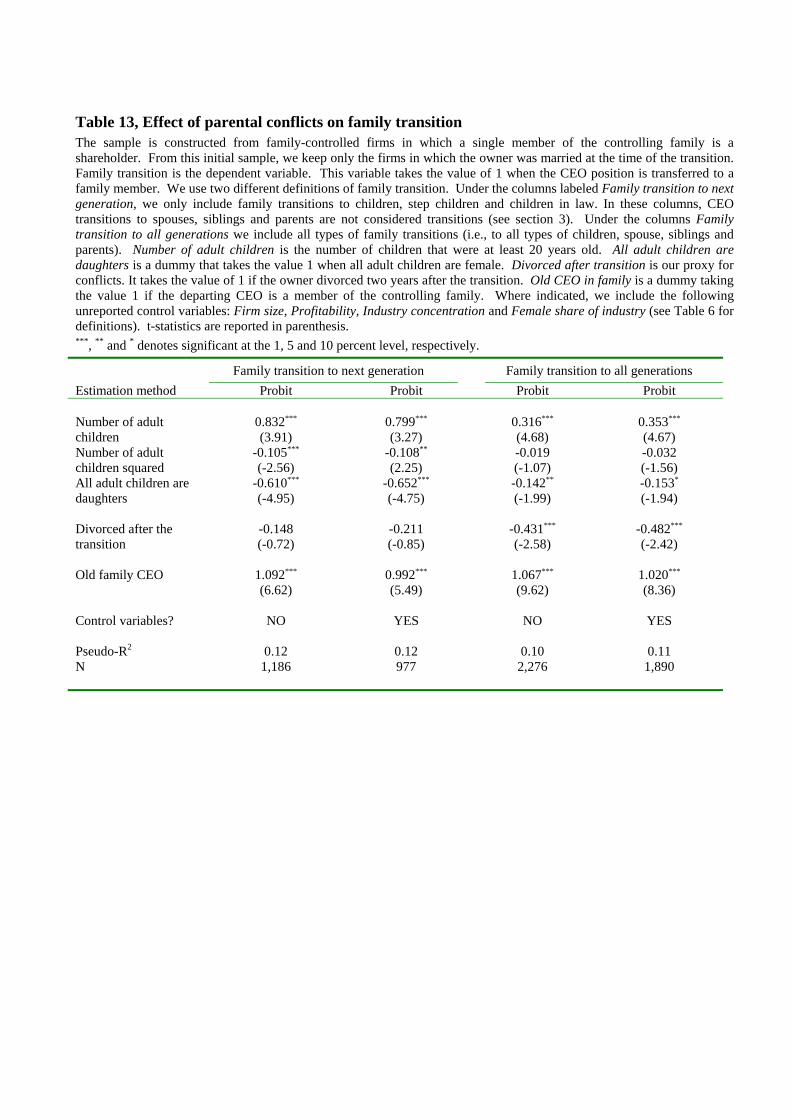
Table 13, Effect of parental conflicts on family transition The sample is constructed from family-controlled firms in which a single member of the controlling family is a shareholder. From this initial sample, we keep only the firms in which the owner was married at the time of the transition. Family transition is the dependent variable. This variable takes the value of 1 when the CEO position is transferred to a family member. We use two different definitions of family transition. Under the columns labeled Family transition to next generation, we only include family transitions to children, step children and children in law. In these columns, CEO transitions to spouses, siblings and parents are not considered transitions (see section 3). Under the columns Family transition to all generations we include all types of family transitions (i.e., to all types of children, spouse, siblings and parents). Number of adult children is the number of children that were at least 20 years old. All adult children are daughters is a dummy that takes the value 1 when all adult children are female. Divorced after transition is our proxy for conflicts. It takes the value of 1 if the owner divorced two years after the transition. Old CEO in family is a dummy taking the value 1 if the departing CEO is a member of the controlling family. Where indicated, we include the following unreported control variables: Firm size, Profitability, Industry concentration and Female share of industry (see Table 6 for definitions). t-statistics are reported in parenthesis. ***, ** and * denotes significant at the 1, 5 and 10 percent level, respectively. Family transition to next generation Family transition to all generations Estimation method Probit Probit Probit Probit Number of adult children
0.832***
(3.91) 0.799***
(3.27) 0.316***
(4.68) 0.353***
(4.67) Number of adult children squared
-0.105***
(-2.56) -0.108**
(2.25) -0.019 (-1.07)
-0.032 (-1.56)
All adult children are daughters
-0.610***
(-4.95) -0.652***
(-4.75) -0.142**
(-1.99) -0.153*
(-1.94) Divorced after the transition
-0.148 (-0.72)
-0.211 (-0.85)
-0.431***
(-2.58) -0.482***
(-2.42) Old family CEO 1.092***
(6.62) 0.992***
(5.49) 1.067***
(9.62) 1.020***
(8.36) Control variables? NO YES NO YES Pseudo-R2 0.12 0.12 0.10 0.11 N 1,186 977 2,276 1,890

Table 14, Family conflicts: the effect of having children with multiple spouses on succession The sample is constructed from family-controlled firms in which a single member of the controlling family is a shareholder. From this initial sample, we keep only the firms in which the owner has been married at least once. Family transition is the dependent variable. This variable takes the value of 1 when the CEO position is transferred to a family member. We use two different definitions of family transition. Under the columns labeled Family transition to next generation, we only include family transitions to children, step children and children in law. In these columns, CEO transitions to spouses, siblings and parents are not considered transitions (see section 3). Under the columns Family transition to all generations we include all types of family transitions (i.e., to all types of children, spouse, siblings and parents). Number of adult children is the number of children of the controlling owner that were at least 20 years old at the time of the transition. All adult children are daughters is a dummy taking the value 1 when all adult children are female. Divorced, but never remarried is a dummy taking the value 1 if the single owner is divorced and has not remarried. Multiple marriages but children with one partner is a dummy taking the value 1 if the single owner has been divorced and has remarried, but only has children from one spouse. Multiple marriages and children with multiple partners is a dummy taking the value 1 if the family owner has been divorced, has remarried and has children with multiple partners. Multiple marriages but sons with one partner is a dummy taking the value 1 if the single owner has been divorced and has remarried, but only has sons from one marriage. Multiple marriages and sons with multiple partners is a dummy taking the value 1 if the family owner has been divorced, has remarried and has sons with multiple partners. Old CEO in family is a dummy taking the value 1 if the departing CEO was a family member. Where indicated we include the following unreported control variables: Firm size, Profitability, Industry concentration and Female share of industry (see Table 6 for definitions. t-statistics are reported in parenthesis. t-statistics are reported in parenthesis. ***, ** and * denote significance at the 1, 5 and 10 percent level, respectively. Family transition to
next generation Family transition to
all generations Estimation method Probit Probit Probit Probit Probit Probit Number of adult children 0.724***
(3.80) 0.700***
(3.21) 0.714***
(3.29) 0.307***
(4.92) 0.371***
(5.32) 0.373***
(5.36) Number of adult children squared
-0.089**
(-2.40) -0.095**
(-2.18) -0.098**
(-2.28) -0.021 (-1.26)
-0.041**
(-2.21) -0.042**
(-2.27) Divorced, but never remarried
-0.040 (-0.23)
-0.021 (-0.11)
-0.023 (-0.12)
-0.339**
(-2.41) -0.310*
(-1.91) -0.311*
(-1.93) Multiple marriages but children w/ one partner
-0.324**
(-2.40) -0.251*
(-1.73) -0.192**
(-2.09) -0.198**
(-1.998)
Multiple marriages and children w/ multiple partners
-0.682**
(-2.90) -0.526**
(-2.14) -0.403***
(-2.70) -0.327**
(-1.98)
Multiple marriages and sons w/ one partner
-0.275**
(-2.03) -0.212**
(-2.28) Multiple marriages and sons w/ multiple partners
-0.620*
(-1.83) -0.368
(-1.57) All adult children are daughters
-0.534***
(-4.81) -0.567***
(-4.62) -0.570***
(-4.64) -0.133**
(-2.03) -0.130*
(-1.79) -0.132*
(-1.82) Old CEO in family 0.936***
(6.72) 0.856***
(5.64) 0.854***
(5.63) 0.971***
(10.2) 0.934***
(8.87) 0.933***
(8.86) Control variables NO YES YES NO YES YES Constant -2.536***
(-9.40) -2.213***
(-7.08) -2.227 (-7.12)
-1.706***
(-15.2) -1.683***
(-11.8) -1.681***
(-11.7) Pseudo-R2 0.12 0.11 0.11 0.10 0.10 0.10 N 1,466 1,203 1,203 2,696 2,234 2,234

Table 15, Determinants of Ownership Transition
We use a sample of single family member family firms where a new owner entered the firm. Family transition is the dependent variable, defined as a dummy taking the value 1 when one of the new owners belongs to the next generation and to all generations of the family, respectively. We use two different samples of family firms, Ownership transition to next generation, which includes all transitions to outsiders and only family transitions to the next generation, and Ownership transition to all generations, which includes all transitions to outsiders and all family transitions (see Section 2 for further details). Number of adult children is the number of children of the single controlling owner that was aged 20 at the time of the transition. Never married is a dummy taking the value 1 if the single owner never has been married. Multiple marriages is a dummy taking the value 1 if the single controlling owner has been divorced and has remarried before the time of transition. All adult children are daughters is a dummy taking the value 1 if all adult children are daughters. Number of male children and Number of female children are the number of adult male and female children, respectively. Old CEO in family is a dummy taking the value 1 if the departing CEO was a family member. Firm size is book value of assets measured in million Danish kroner (equivalent to 135,000 €). Firm age is measured as number of years since the firm was established. Profitability is industry adjusted returns on assets, defined as operating profit over book value of assets minus the mean 2-digit SIC industry return on assets. Industry concentration is the Herfindahl-Index, which sums the squares of each firm’s market share within the industry. Female share of industry workforce is defined as the share of female in the workforce within the industry. t-statistics are reported in parenthesis. ***, ** and * denote significance at the 1, 5 and 10 percent level, respectively. Ownership transition to
next generation Ownership transition to
all generations Estimation method Probit Probit Probit Probit Number of adult children
0.489***
(3.90) 0.462***
(3.39) 0.831***
(11.1) 0.849***
(10.3) Number of adult children squared
-0.059**
(-2.49) -0.059**
(-2.26) -0.124***
(-7.82) -0.132***
(-7.46) Never married
-0.302*
(-1.90) -0.226 (-1.37)
Multiple marriages -0.286***
(-3.95) -0.220***
(-2.74) -0.259***
(-3.97) -0.216**
(-3.00) All adult children are daughters
-0.466***
(-6.10) -0.448***
(-5.32) -0.524***
(-7.39) -0.511***
(-6.59) Old CEO in family 1.414***
(14.9) 1.418***
(13.2) 1.175***
(12.7) 1.188***
(11.4) Control variables NO YES NO YES
Constant -2.081***
(-11.7) -1.960***
(-9.35) -2.520***
(-19.2) -2.361***
(-15.1) Pseudo-R2 0.14 0.13 0.25 0.25 N
2,454 1,958 4,830 3,825
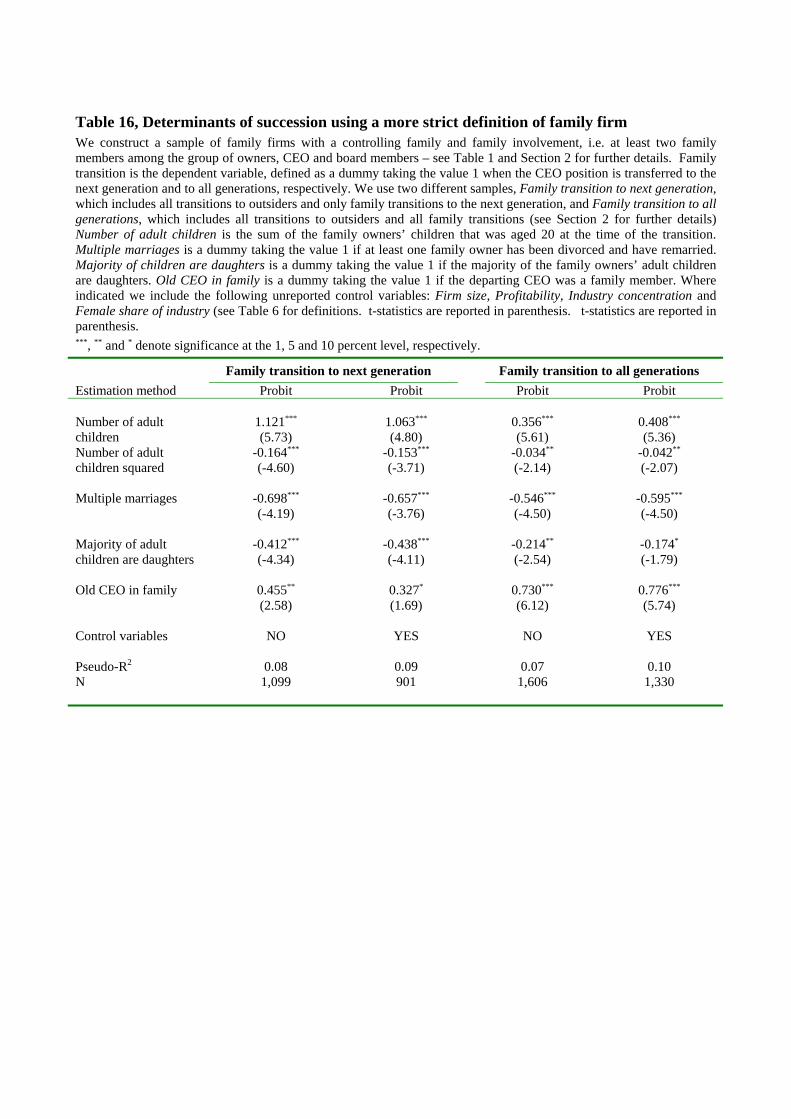
Table 16, Determinants of succession using a more strict definition of family firm We construct a sample of family firms with a controlling family and family involvement, i.e. at least two family members among the group of owners, CEO and board members – see Table 1 and Section 2 for further details. Family transition is the dependent variable, defined as a dummy taking the value 1 when the CEO position is transferred to the next generation and to all generations, respectively. We use two different samples, Family transition to next generation, which includes all transitions to outsiders and only family transitions to the next generation, and Family transition to all generations, which includes all transitions to outsiders and all family transitions (see Section 2 for further details) Number of adult children is the sum of the family owners’ children that was aged 20 at the time of the transition. Multiple marriages is a dummy taking the value 1 if at least one family owner has been divorced and have remarried. Majority of children are daughters is a dummy taking the value 1 if the majority of the family owners’ adult children are daughters. Old CEO in family is a dummy taking the value 1 if the departing CEO was a family member. Where indicated we include the following unreported control variables: Firm size, Profitability, Industry concentration and Female share of industry (see Table 6 for definitions. t-statistics are reported in parenthesis. t-statistics are reported in parenthesis. ***, ** and * denote significance at the 1, 5 and 10 percent level, respectively. Family transition to next generation Family transition to all generations Estimation method Probit Probit Probit Probit Number of adult children
1.121***
(5.73) 1.063***
(4.80) 0.356***
(5.61) 0.408***
(5.36) Number of adult children squared
-0.164***
(-4.60) -0.153***
(-3.71) -0.034**
(-2.14) -0.042**
(-2.07) Multiple marriages -0.698***
(-4.19) -0.657***
(-3.76) -0.546***
(-4.50) -0.595***
(-4.50) Majority of adult children are daughters
-0.412***
(-4.34) -0.438***
(-4.11) -0.214**
(-2.54) -0.174*
(-1.79) Old CEO in family 0.455**
(2.58) 0.327*
(1.69) 0.730***
(6.12) 0.776***
(5.74) Control variables NO YES NO YES Pseudo-R2 0.08 0.09 0.07 0.10 N 1,099 901 1,606 1,330