THE FALCON METHOD - OsztalekPortfolio.comosztalekportfolio.com/files/TFM_October17_X3H5.pdf ·...
38
FALCON METHOD NEWSLETTER October 2017 THE
Transcript of THE FALCON METHOD - OsztalekPortfolio.comosztalekportfolio.com/files/TFM_October17_X3H5.pdf ·...

FALCON METHODNEWSLETTER
October 2017
THE
The FALCON Method Newsletter October 2017
The FALCON Method Newsletter is published as an information service. Nothing presented herein is, or is intended to constitute specific investment advice. Please read the full disclaimer at the end of the newsletter.
I arrived in Miami on September 5th and right at the airport, an Uber driver told me that the city was prepar-ing for a Category 5 hurricane named Irma. The situa-tion seemed so serious that I couldn’t even buy bottled water anywhere. Pretty exciting short stay I was looking forward to.
I always have my Kindle with me when I travel and this time I was reading the book Thinking, Fast and Slow by Nobel laureate Daniel Kahneman. This is a classic that explains the two systems that drive the way we think. (System 1 is fast, intuitive, and emotional; System 2 is slower, more deliberative, and more logical.) Our cogni-tive biases can be understood only by knowing how the two systems shape our judgments and decisions. This, of course, has much to do with investing where 90% of the puzzle is about psychology and managing our inborn cognitive issues.
I thought it was a nice coincidence that I was reading about this particular topic while watching the hurricane panic unfold from the first row. I’m a practical guy so let me bring up some examples that grabbed my attention and can be useful for us, investors.
First, consider the following description of a U.S. res-ident called Steve: “Steve is very shy and withdrawn, invariably helpful but with little interest in people or in the world of reality. A meek and tidy soul, he has a need for order and structure, and a passion for detail.” Do you think Steve is a farmer or a librarian? Most people opt for the librarian answer as the described personality fits the stereotypical librarian. Nearly no one considers that there are more than 20 male farmers for each male librarian in the United States which makes it almost certain that more “meek and tidy” souls will be found on
Hurricane Irma, my Kindle, and some valuable lessonsHistorical data proves that value stocks (that are out of favor thus priced cheap) outperform story stocks that are all over the news. Regardless of the facts, people have trouble buying the cheap stocks and they flock to the overhyped shares instead.
tractors than at library information desks. The problem is that most of us never thought of the base rate (the underlying statistics) when picking an answer. We made a quick, intuitive decision (System 1) instead of activat-ing our analysis mode (System 2).
The same is true for stock picking. Historical data proves that value stocks (that are out of favor thus priced cheap) outperform story stocks that are all over the news. Regardless of the facts, people have trouble buying the cheap stocks and they flock to the overhyped shares instead. Look at the current top story titled “Re-tail is dead”! The standard reaction is to buy the prevail-ing story stock (in this case Amazon that is supposed to conquer the whole universe) and panic-sell the ones like Target that become dirt cheap as a result. The base rate clearly shows that your chances are better if you invest in the value stocks; just like with picking the farmer an-swer in the previous question. The underlying odds will prevail but most people simply ignore them and make up stories to back up their emotional decisions. (System 1 thinking, again.)
Now back to Miami where the story on the surface was scary. The media fueled the hysteria and people were preparing to leave the city at all costs. (A fast, emotional decision, typical of System 1 thinking.) As a European, I’m not too familiar with hurricanes so the first thing I did was speak with the locals like our host to gather some information. I was told that as long as we ob-served the basic rules the probability of personal injury was negligible. The only high probability issue we had to face was being stuck in Miami for several days without electricity and water. So I knew what I could possibly expect and I most certainly wanted to avoid such an
2
The FALCON Method Newsletter October 2017
The FALCON Method Newsletter is published as an information service. Nothing presented herein is, or is intended to constitute specific investment advice. Please read the full disclaimer at the end of the newsletter.
inconvenient situation. But not at all costs! Now that I knew the base rate (that my life was not in danger) this hugely affected the price I was willing to pay to reschedule my flight back home. (This slower analytical thinking–the activation of System 2–requires that you overcome the instant emotional reactions of System 1.) Whoever neglected the base rate and got overwhelmed by the depressing “we’re all going to die” story ended up paying more than 10K euros for a one-way flight to Europe, while I could snatch a ticket at a reasonable price by keeping calm and refreshing the Skyscanner site minute by minute for the new flights added. Could you keep your cool in such a situation?
I consider this Irma example a mini-panic compared to what will happen in the media once the stock market enters a healthy correction phase (that is long overdue) or an outright bear market. That is the exact situation when you must be able to focus on the base rate and scoop up the quality stocks that go on sale regardless of the “end of the world” stories that will be all over the place. Freeing yourself from the emotional story and ac-tivating your System 2 thinking is easier said than done, as I experienced with Irma.
Base rate neglect is far from the only irrationality we are born with. Imagine that you discover a stock with a divi-dend yield that is higher than the market average and an adequate dividend coverage. What’s your first impres-sion? Kahneman observed that the sequence in which we observe characteristics matters; even if it is often determined by chance. The halo effect increases the weight of first impressions, sometimes to the point that subsequent information is mostly wasted. Regardless of how embarrassing it sounds, I am ready to admit that I have caught myself with stocks “almost bought” when I noticed that I hadn’t even run through all the steps of my system before making that decision. We absolutely need a checklist and a structured decision-making pro-cess, otherwise, we are doomed to failure. Sticking to an evidence-based system like the FALCON Method is the best we can do.
I believe in lifelong learning, this is why I read 50-70 books per year. I absolutely loved how Kahneman de-scribed the process of learning which is (in most cases) all about pattern recognition. Reading is about pattern
recognition, where words are the patterns. Playing chess is the same but situations there are like very long words so the patterns take longer to recognize. Now you know why becoming a chess champion requires much more time than learning to read. While reading this part of the book I instantly realized that what I’m doing with stock selection is built on pattern recognition as well. There are certain elements of a “winning situation” and the more experienced you are the better you recognize them and are able to profit from the opportunities. It is no coincidence that the components of the FALCON Method are focusing on the most important elements of “winning situations”.
If patterns are difficult to recognize learning can take extremely long. However, instant feedback can speed up the process. Imagine that a young schoolboy misreads a word and the teacher instantly corrects him. It doesn’t take long to get the pattern recognition right under such circumstances: easy patterns plus instant feedback. Well, the stock market is not that kind to us. On the one hand, the feedback is far from instant, on the other hand, even bad decisions can lead to good outcomes and good decisions can lead to bad outcomes. (Have a look at the process-outcome matrix in The FALCON Method book!)
Because of complex patterns and delayed feedback it can take ages to figure out how to do things right on the stock market. Kahneman’s words: “Skill doesn’t become perfect all at once, and on the way to near perfection some mistakes are made with great confidence.” Some very expensive mistakes I must add. Learning never stops; I am continuously fine-tuning my process and humbly accept what psychologist Jonathan Haidt said: “The emotional tail wags the rational dog.” I know that my best chance of success is to concentrate on an ev-idence-based stock selection system and do not let the tons of biases throw me off the right track. I hope I can help you on this journey.
As Daniel Kahneman reveals brain recordings indicate that buying at especially low prices is a pleasurable event. So it’s about time to see what the FALCON spots this time!
3

The FALCON Method Newsletter October 2017
The FALCON Method Newsletter is published as an information service. Nothing presented herein is, or is intended to constitute specific investment advice. Please read the full disclaimer at the end of the newsletter.
Summary (aka the Lazy Investor’s Guide)
Changes from last month:Eastman Chemical (EMN) has lost its place since the recent run-up in price not only erased the double-dip potential but pulled its FCF yield down to a level where our absolute threshold criterion was not met. Omnicom Group (OMC) is the new name on our list with excellent operating metrics. Read the Closing Thoughts section for more details and the name of the eleventh stock that nearly made it onto the list.The consistency of the underlying stock selection method is reflected in the stability of the Top10 list. Stocks that fall out of the Top10 are holds, not sells. Selling occurs rarely; only when a stock becomes extremely overvalued, or if it reduces its dividend. You will get an email alert if any of the stocks in the FALCON Portfolio become a sell.
Top pick(s) of the month:
My favorite stock is still Tanger Outlets (SKT) for the reasons you are all familiar with by now. As a close second Omnicom (OMC) has catapulted right into the FALCON Portfolio since a company with such exceptional operating metrics is a gift at the present valuation. Not to mention that a dividend increase is on the horizon. I would still buy CVS Health (CVS), Lowe’s (LOW), W.W. Grainger (GWW) and Target (TGT). I’m not saying that these stocks will never be available at lower prices – something that nobody knows – but they do represent excellent values at the moment and this is all a long-term investor should care about. Six top quality companies at fair or better prices in the current market environment; that’s more than we could wish for.
The next newsletter publishes on Sunday, November 5th, 2017.
If you only have a few minutes for the newsletter or do not wish to go into the details of any specific stock this is the page you need.
Here is the list of Top10 stocks of the FALCON Method for October 2017:
You can learn about the meaning of the indicators included in the table on the Glossary page of the newsletter. (The ‘score’ column shows how close the rankings are. The highest ranked stock always has a score of 100.)
StockTicker
SymbolPrice Score
Dividend Yield
Sharehold-er Yield
FCF YieldPayout Ratio
FCF Payout
ROIC
CVS Health CVS $81.32 100 2.5% 7.8% 11.1% 37% 22% 8.7%
Lowe's Companies LOW $79.94 97 2.1% 7.2% 7.2% 41% 29% 14.0%
L Brands LB $41.61 94 5.8% 7.3% 6.1% 70% 94% 20.3%
IBM IBM $145.08 82 4.1% 7.3% 8.5% 47% 49% 17.8%
Tanger Factory Outlet SKT $24.42 72 5.6% 5.6% - - - -
Whirlpool WHR $184.44 71 2.4% 6.1% 5.4% 40% 45% 7.5%
Target TGT $59.01 70 4.2% 10.6% 14.5% 48% 29% 11.9%
W.W. Grainger GWW $179.75 68 2.9% 9.5% 6.8% 56% 42% 12.5%
Schweitzer-Mauduit Intl SWM $41.46 66 4.1% 4.1% 6.5% 71% 63% 5.6%
Omnicom Group OMC $74.07 59 3.0% 7.0% 10.4% 44% 29% 16.3%
Average 3.7% 7.3% 8.5% 51% 45% 12.7%
S&P 500 2,519.36 1.9% 3.8% 4.2% 44% 46% 11.7%
4
The FALCON Method Newsletter October 2017
The FALCON Method Newsletter is published as an information service. Nothing presented herein is, or is intended to constitute specific investment advice. Please read the full disclaimer at the end of the newsletter.
Table of ContentsHurricane Irma, my Kindle, and some valuable lessons .........................................................................................2
Summary (aka the Lazy Investor’s Guide) ............................................................................................................4
Table of Contents ..................................................................................................................................................5
Analysis of the Top10 Stocks ................................................................................................................................6
CVS Health (CVS) ............................................................................................................................................................................. 6
Lowe’s Companies (LOW) ............................................................................................................................................................. 9
L Brands (LB) ..................................................................................................................................................................................12
International Business Machines Corporation (IBM) .............................................................................................................15
Tanger Factory Outlet Centers (SKT) ........................................................................................................................................17
Whirlpool Corporation (WHR) ......................................................................................................................................................19
Target Corporation (TGT) .............................................................................................................................................................22
W.W. Grainger (GWW) ...................................................................................................................................................................25
Schweitzer-Mauduit International (SWM) ................................................................................................................................28
Omnicom Group (OMC) ................................................................................................................................................................30
Complete Ranking ...............................................................................................................................................32
The FALCON Portfolio .........................................................................................................................................33
Glossary ..............................................................................................................................................................34
How to use the newsletter? .................................................................................................................................36
Closing Thoughts ................................................................................................................................................37
Disclaimer ...........................................................................................................................................................38
5
The FALCON Method Newsletter October 2017
The FALCON Method Newsletter is published as an information service. Nothing presented herein is, or is intended to constitute specific investment advice. Please read the full disclaimer at the end of the newsletter.
Analysis of the Top10 Stocks
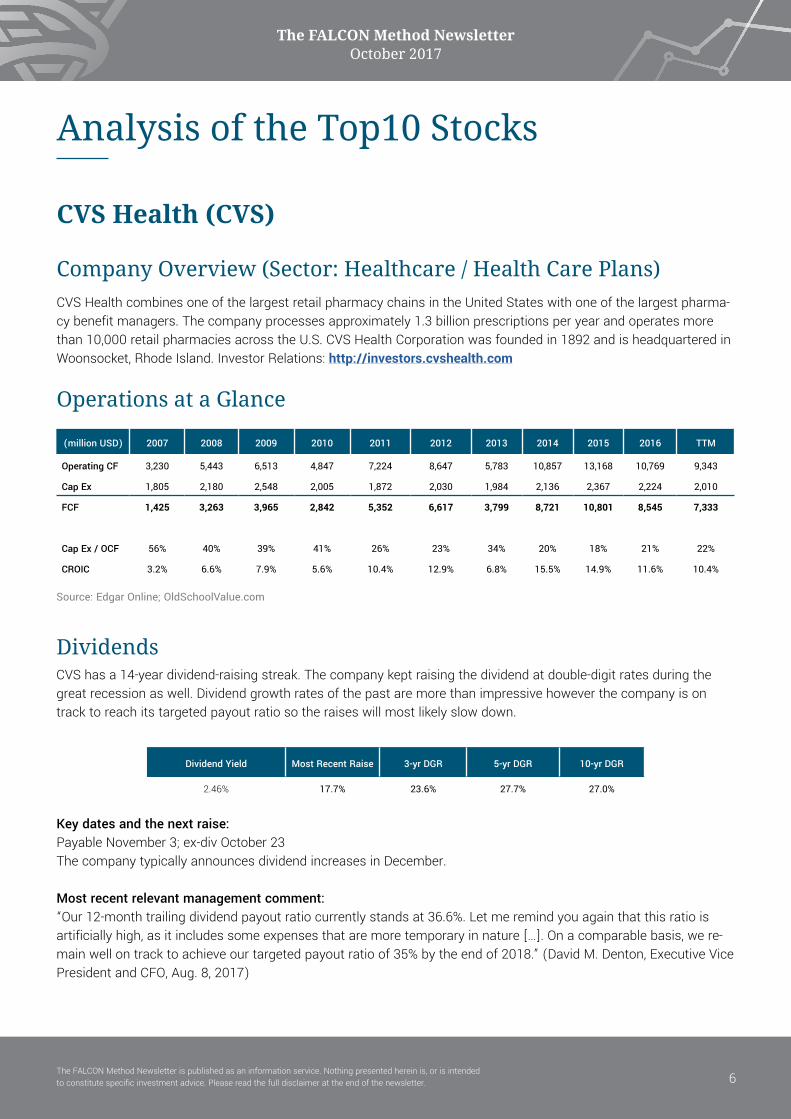
CVS Health (CVS)
Company Overview (Sector: Healthcare / Health Care Plans)CVS Health combines one of the largest retail pharmacy chains in the United States with one of the largest pharma-cy benefit managers. The company processes approximately 1.3 billion prescriptions per year and operates more than 10,000 retail pharmacies across the U.S. CVS Health Corporation was founded in 1892 and is headquartered in Woonsocket, Rhode Island. Investor Relations: http://investors.cvshealth.com
Operations at a Glance
(million USD) 2007 2008 2009 2010 2011 2012 2013 2014 2015 2016 TTM
Operating CF 3,230 5,443 6,513 4,847 7,224 8,647 5,783 10,857 13,168 10,769 9,343
Cap Ex 1,805 2,180 2,548 2,005 1,872 2,030 1,984 2,136 2,367 2,224 2,010
FCF 1,425 3,263 3,965 2,842 5,352 6,617 3,799 8,721 10,801 8,545 7,333
Cap Ex / OCF 56% 40% 39% 41% 26% 23% 34% 20% 18% 21% 22%
CROIC 3.2% 6.6% 7.9% 5.6% 10.4% 12.9% 6.8% 15.5% 14.9% 11.6% 10.4%
Dividend Yield Most Recent Raise 3-yr DGR 5-yr DGR 10-yr DGR
2.46% 17.7% 23.6% 27.7% 27.0%
DividendsCVS has a 14-year dividend-raising streak. The company kept raising the dividend at double-digit rates during the great recession as well. Dividend growth rates of the past are more than impressive however the company is on track to reach its targeted payout ratio so the raises will most likely slow down.
Source: Edgar Online; OldSchoolValue.com
Key dates and the next raise:Payable November 3; ex-div October 23The company typically announces dividend increases in December.
Most recent relevant management comment:“Our 12-month trailing dividend payout ratio currently stands at 36.6%. Let me remind you again that this ratio is artificially high, as it includes some expenses that are more temporary in nature […]. On a comparable basis, we re-main well on track to achieve our targeted payout ratio of 35% by the end of 2018.” (David M. Denton, Executive Vice President and CFO, Aug. 8, 2017)
6

The FALCON Method Newsletter October 2017
The FALCON Method Newsletter is published as an information service. Nothing presented herein is, or is intended to constitute specific investment advice. Please read the full disclaimer at the end of the newsletter.
My take on the dividend profile: CVS Health used to be a low-yielder with double-digit raises. The Amazon hysteria and uncertainties about the healthcare sector made the current yield higher than usual. In my opinion, the company can announce one or two spectacular dividend raises until it reaches the targeted payout ratio. Increases will be in line with EPS or FCF growth afterwards. The dividend is extra safe. (CVS stock provided a higher than 2.5% yield in 9.6% of the time within the last 5 years.)
Valuation
OpinionThe reasons of the selloff are uncertainties about the healthcare sector, the Amazon-effect and the announcement that certain changes to the company’s distribution network will result in more than 40 million retail prescriptions shifting out of its stores on an annualized basis. An increasing percentage of prescriptions are being filled by cheaper generic drugs which takes away from the company’s revenue while benefiting the patients. Positives: demographics support the healthcare sector, CVS has an accelerated share repurchase program in place and reaching the targeted dividend payout ratio allows for 1-2 spectacular increases before the end of 2018. The investor is paid to wait while management gets the company back to the growth path. I foresee 11-13% total annualized rate of return, including dividends, based on earnings estimates and a normal PE multiple of 15. CVS narrowed its full-year adjusted EPS guidance range thus raising the midpoint. So far in fiscal 2017, the company has repurchased $4 billion of its stock, which amounts to ~5% of the current market capitalization. As soon as the market gains confidence that CVS can return to growth next year the current valuation multiples will be a thing of the past. In the meantime, the company provides tons of support for the share price with the large buybacks. What’s not to like here? No meaningful updates since last month’s newsletter. (Disclosure: I own CVS in my personal portfolio.)
current 3yr 5yr 10yr 15yr 20yr
P/E 13.8 13.5 18.0 15.4 16.9 17.7
P/OCF 8.2 8.4 11.7 11.1 12.4 13.6
P/FCF 12.5 10.8 15.8 17.3 21.7 -
P/EBITDA 6.7 6.5 8.7 7.4 7.7 8.0
Source: S&P Capital IQ, FAST GraphsCurrent figures are based on blended ratios, meaning a weighted average of the most recent actual reported earnings plus the closest quarterly forecast earnings. (This is not the same as the often stale TTM data. See the definition of ‘blended P/E’ in Glossary for more info.)
The historical chart of the trailing twelve month (TTM) dividend yield is backward looking by definition, while dividend yields mentioned in the other sections of this analysis are based on the forward 12-month dividend figures. This explains the difference.
7

The FALCON Method Newsletter October 2017
The FALCON Method Newsletter is published as an information service. Nothing presented herein is, or is intended to constitute specific investment advice. Please read the full disclaimer at the end of the newsletter.
Price Dividend Yield FCF Yield (TTM) Shareholder Yield (TTM) FCF Payout % EPS payout % ROIC
81.32$ 2.5% 11.1% 7.8% 22.1% 36.9% 8.7%
Key Data
8
The FALCON Method Newsletter October 2017
The FALCON Method Newsletter is published as an information service. Nothing presented herein is, or is intended to constitute specific investment advice. Please read the full disclaimer at the end of the newsletter.
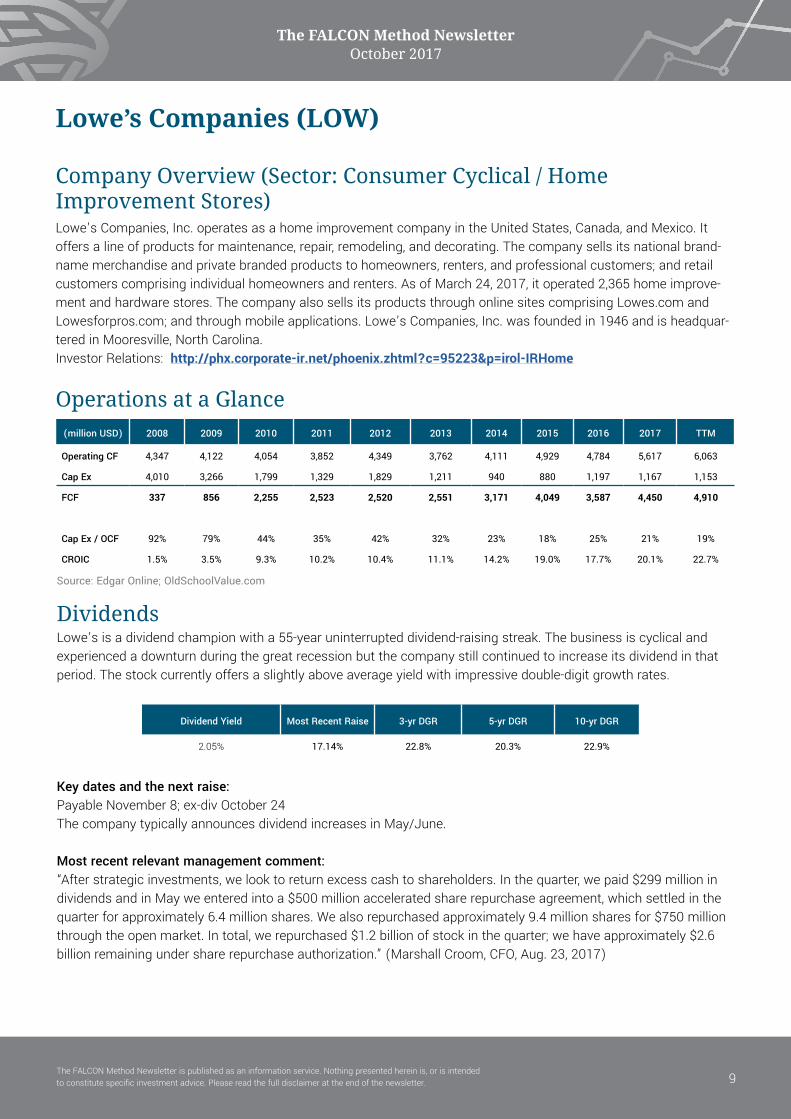
Lowe’s Companies (LOW)
Company Overview (Sector: Consumer Cyclical / Home Improvement Stores)Lowe’s Companies, Inc. operates as a home improvement company in the United States, Canada, and Mexico. It offers a line of products for maintenance, repair, remodeling, and decorating. The company sells its national brand-name merchandise and private branded products to homeowners, renters, and professional customers; and retail customers comprising individual homeowners and renters. As of March 24, 2017, it operated 2,365 home improve-ment and hardware stores. The company also sells its products through online sites comprising Lowes.com and Lowesforpros.com; and through mobile applications. Lowe’s Companies, Inc. was founded in 1946 and is headquar-tered in Mooresville, North Carolina. Investor Relations: http://phx.corporate-ir.net/phoenix.zhtml?c=95223&p=irol-IRHome
Operations at a Glance (million USD) 2008 2009 2010 2011 2012 2013 2014 2015 2016 2017 TTM
Operating CF 4,347 4,122 4,054 3,852 4,349 3,762 4,111 4,929 4,784 5,617 6,063
Cap Ex 4,010 3,266 1,799 1,329 1,829 1,211 940 880 1,197 1,167 1,153
FCF 337 856 2,255 2,523 2,520 2,551 3,171 4,049 3,587 4,450 4,910
Cap Ex / OCF 92% 79% 44% 35% 42% 32% 23% 18% 25% 21% 19%
CROIC 1.5% 3.5% 9.3% 10.2% 10.4% 11.1% 14.2% 19.0% 17.7% 20.1% 22.7%
Dividend Yield Most Recent Raise 3-yr DGR 5-yr DGR 10-yr DGR
2.05% 17.14% 22.8% 20.3% 22.9%
DividendsLowe’s is a dividend champion with a 55-year uninterrupted dividend-raising streak. The business is cyclical and experienced a downturn during the great recession but the company still continued to increase its dividend in that period. The stock currently offers a slightly above average yield with impressive double-digit growth rates.
Source: Edgar Online; OldSchoolValue.com
Key dates and the next raise:Payable November 8; ex-div October 24The company typically announces dividend increases in May/June.
Most recent relevant management comment:“After strategic investments, we look to return excess cash to shareholders. In the quarter, we paid $299 million in dividends and in May we entered into a $500 million accelerated share repurchase agreement, which settled in the quarter for approximately 6.4 million shares. We also repurchased approximately 9.4 million shares for $750 million through the open market. In total, we repurchased $1.2 billion of stock in the quarter; we have approximately $2.6 billion remaining under share repurchase authorization.” (Marshall Croom, CFO, Aug. 23, 2017)
9

The FALCON Method Newsletter October 2017
The FALCON Method Newsletter is published as an information service. Nothing presented herein is, or is intended to constitute specific investment advice. Please read the full disclaimer at the end of the newsletter.
Valuation current 3yr 5yr 10yr 15yr 20yr
P/E 18.4 18.3 21.8 19.7 18.6 20.1
P/OCF 11.7 11.4 13.0 10.9 11.0 11.9
P/FCF 15.4 14.4 16.5 15.2 41.1 -
P/EBITDA 8.6 8.6 9.4 7.9 7.9 8.7
Source: S&P Capital IQ, FAST GraphsCurrent figures are based on blended ratios, meaning a weighted average of the most recent actual reported earnings plus the closest quarterly forecast earnings. (This is not the same as the often stale TTM data. See the definition of ‘blended P/E’ in Glossary for more info.)
The historical chart of the trailing twelve month (TTM) dividend yield is backward looking by definition, while dividend yields mentioned in the other sections of this analysis are based on the forward 12-month dividend figures. This explains the difference.
OpinionLowe’s is operating in a market where smaller competitors have much less bargaining power with suppliers and are unable to match the broad assortment of inventory and in-store product presentations that this company can afford. What is this if not a moat? The dominant player in the segment is Home Depot which might be the reason why the market underappreciates Lowe’s stock. In fact, consumers have few reasons not to head to Lowe’s or Home Depot for their home improvement needs and if the competition were that intense, neither of these companies would be in a position to increase prices and still enjoy healthy growth in transactions. There is no Amazon disruption here, Lowe’s is spending nearly half of the company-wide capital expenditures on its online omni-channel sales platform. Housing trends are supportive at the moment but the company’s ability to hit its growth targets is largely tied to the health of the overall economy, and specifically the construction industry. Interest rate increases can be a headwind and I consider the numerous acquisitions risky. Combined with its margin expansion plans and the aggressive share buybacks, Lowe’s believes it can achieve 15% annual EPS growth in the coming years. According to management’s 35% dividend payout ratio target, this should result in 15% to 20% annual dividend growth. I foresee an annualized total return of 12-14% if the growth materializes and the valuation multiple stays the same. Despite consistently strong results, the home improvement retailer tends to miss earnings expectations by wide margins so the latest quarterly miss was no real surprise. Growth rates look healthy and the post-earnings share
My take on the dividend profile: The starting yield is a little low for my taste but the healthy coverage ratios together with the spectacular growth of the underlying business support the thesis that Lowe’s can be the engine of income growth in a portfolio. (LOW stock provided a higher than 2.0% yield in 5.8% of the time within the last 5 years.)
10

The FALCON Method Newsletter October 2017
The FALCON Method Newsletter is published as an information service. Nothing presented herein is, or is intended to constitute specific investment advice. Please read the full disclaimer at the end of the newsletter.
Key Data
Price Dividend Yield FCF Yield (TTM) Shareholder Yield (TTM) FCF Payout % EPS payout % ROIC
79.94$ 2.05% 7.2% 7.2% 28.7% 41.1% 14.0%
price drop was probably based on the company’s guidance, which sees a deceleration in the second half of the year. Lower gross margins due to promotional activity and discussion of longer store hours are something to keep watching. Hurricanes have given a lift to the share price recently but Lowe’s is still a long-term buy at the current level. No meaningful updates since last month’s newsletter. (Disclosure: I own Lowe’s stock in my personal portfolio.)
11
The FALCON Method Newsletter October 2017
The FALCON Method Newsletter is published as an information service. Nothing presented herein is, or is intended to constitute specific investment advice. Please read the full disclaimer at the end of the newsletter.
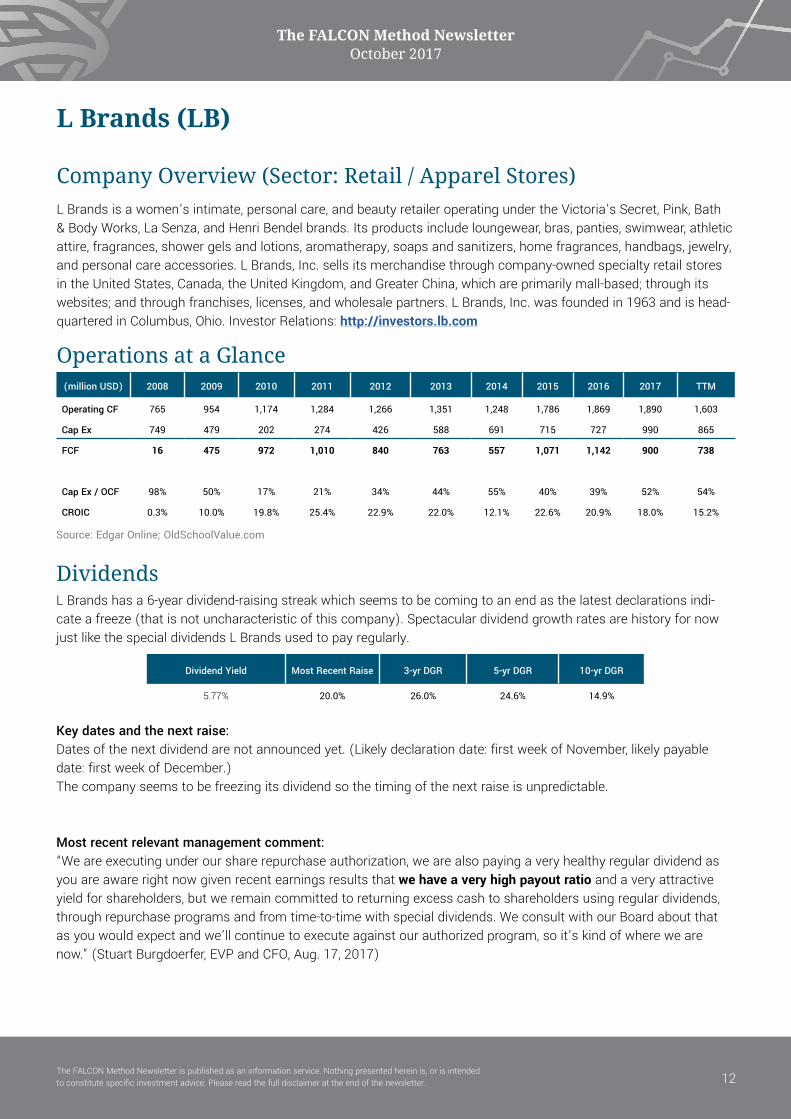
L Brands (LB)
Company Overview (Sector: Retail / Apparel Stores)L Brands is a women’s intimate, personal care, and beauty retailer operating under the Victoria’s Secret, Pink, Bath & Body Works, La Senza, and Henri Bendel brands. Its products include loungewear, bras, panties, swimwear, athletic attire, fragrances, shower gels and lotions, aromatherapy, soaps and sanitizers, home fragrances, handbags, jewelry, and personal care accessories. L Brands, Inc. sells its merchandise through company-owned specialty retail stores in the United States, Canada, the United Kingdom, and Greater China, which are primarily mall-based; through its websites; and through franchises, licenses, and wholesale partners. L Brands, Inc. was founded in 1963 and is head-quartered in Columbus, Ohio. Investor Relations: http://investors.lb.com
Operations at a Glance (million USD) 2008 2009 2010 2011 2012 2013 2014 2015 2016 2017 TTM
Operating CF 765 954 1,174 1,284 1,266 1,351 1,248 1,786 1,869 1,890 1,603
Cap Ex 749 479 202 274 426 588 691 715 727 990 865
FCF 16 475 972 1,010 840 763 557 1,071 1,142 900 738
Cap Ex / OCF 98% 50% 17% 21% 34% 44% 55% 40% 39% 52% 54%
CROIC 0.3% 10.0% 19.8% 25.4% 22.9% 22.0% 12.1% 22.6% 20.9% 18.0% 15.2%
Dividend Yield Most Recent Raise 3-yr DGR 5-yr DGR 10-yr DGR
5.77% 20.0% 26.0% 24.6% 14.9%
Source: Edgar Online; OldSchoolValue.com
DividendsL Brands has a 6-year dividend-raising streak which seems to be coming to an end as the latest declarations indi-cate a freeze (that is not uncharacteristic of this company). Spectacular dividend growth rates are history for now just like the special dividends L Brands used to pay regularly.
Key dates and the next raise:Dates of the next dividend are not announced yet. (Likely declaration date: first week of November, likely payable date: first week of December.)The company seems to be freezing its dividend so the timing of the next raise is unpredictable.
Most recent relevant management comment:“We are executing under our share repurchase authorization, we are also paying a very healthy regular dividend as you are aware right now given recent earnings results that we have a very high payout ratio and a very attractive yield for shareholders, but we remain committed to returning excess cash to shareholders using regular dividends, through repurchase programs and from time-to-time with special dividends. We consult with our Board about that as you would expect and we’ll continue to execute against our authorized program, so it’s kind of where we are now.” (Stuart Burgdoerfer, EVP and CFO, Aug. 17, 2017)
12
The FALCON Method Newsletter October 2017
The FALCON Method Newsletter is published as an information service. Nothing presented herein is, or is intended to constitute specific investment advice. Please read the full disclaimer at the end of the newsletter.
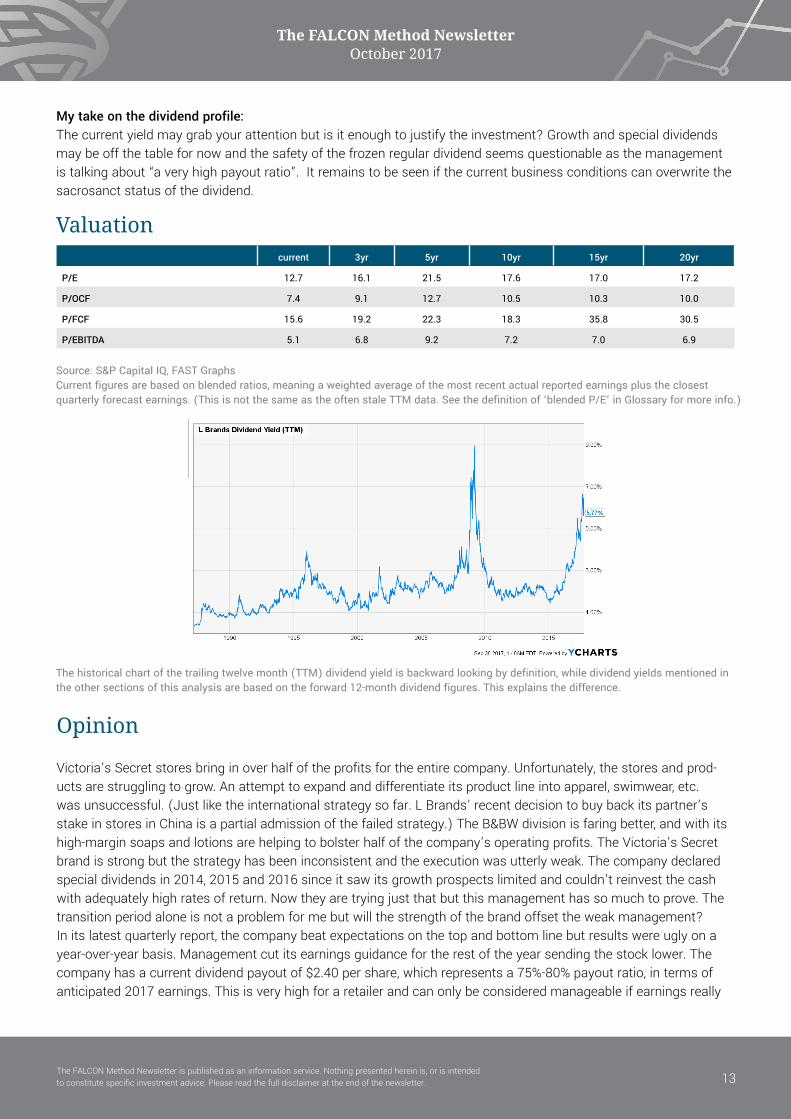
current 3yr 5yr 10yr 15yr 20yr
P/E 12.7 16.1 21.5 17.6 17.0 17.2
P/OCF 7.4 9.1 12.7 10.5 10.3 10.0
P/FCF 15.6 19.2 22.3 18.3 35.8 30.5
P/EBITDA 5.1 6.8 9.2 7.2 7.0 6.9
Source: S&P Capital IQ, FAST GraphsCurrent figures are based on blended ratios, meaning a weighted average of the most recent actual reported earnings plus the closest quarterly forecast earnings. (This is not the same as the often stale TTM data. See the definition of ‘blended P/E’ in Glossary for more info.)
The historical chart of the trailing twelve month (TTM) dividend yield is backward looking by definition, while dividend yields mentioned in the other sections of this analysis are based on the forward 12-month dividend figures. This explains the difference.
Opinion
Victoria’s Secret stores bring in over half of the profits for the entire company. Unfortunately, the stores and prod-ucts are struggling to grow. An attempt to expand and differentiate its product line into apparel, swimwear, etc. was unsuccessful. (Just like the international strategy so far. L Brands’ recent decision to buy back its partner’s stake in stores in China is a partial admission of the failed strategy.) The B&BW division is faring better, and with its high-margin soaps and lotions are helping to bolster half of the company’s operating profits. The Victoria’s Secret brand is strong but the strategy has been inconsistent and the execution was utterly weak. The company declared special dividends in 2014, 2015 and 2016 since it saw its growth prospects limited and couldn’t reinvest the cash with adequately high rates of return. Now they are trying just that but this management has so much to prove. The transition period alone is not a problem for me but will the strength of the brand offset the weak management? In its latest quarterly report, the company beat expectations on the top and bottom line but results were ugly on a year-over-year basis. Management cut its earnings guidance for the rest of the year sending the stock lower. The company has a current dividend payout of $2.40 per share, which represents a 75%-80% payout ratio, in terms of anticipated 2017 earnings. This is very high for a retailer and can only be considered manageable if earnings really
Valuation
My take on the dividend profile:The current yield may grab your attention but is it enough to justify the investment? Growth and special dividends may be off the table for now and the safety of the frozen regular dividend seems questionable as the management is talking about “a very high payout ratio”. It remains to be seen if the current business conditions can overwrite the sacrosanct status of the dividend.
13
The FALCON Method Newsletter October 2017
The FALCON Method Newsletter is published as an information service. Nothing presented herein is, or is intended to constitute specific investment advice. Please read the full disclaimer at the end of the newsletter.
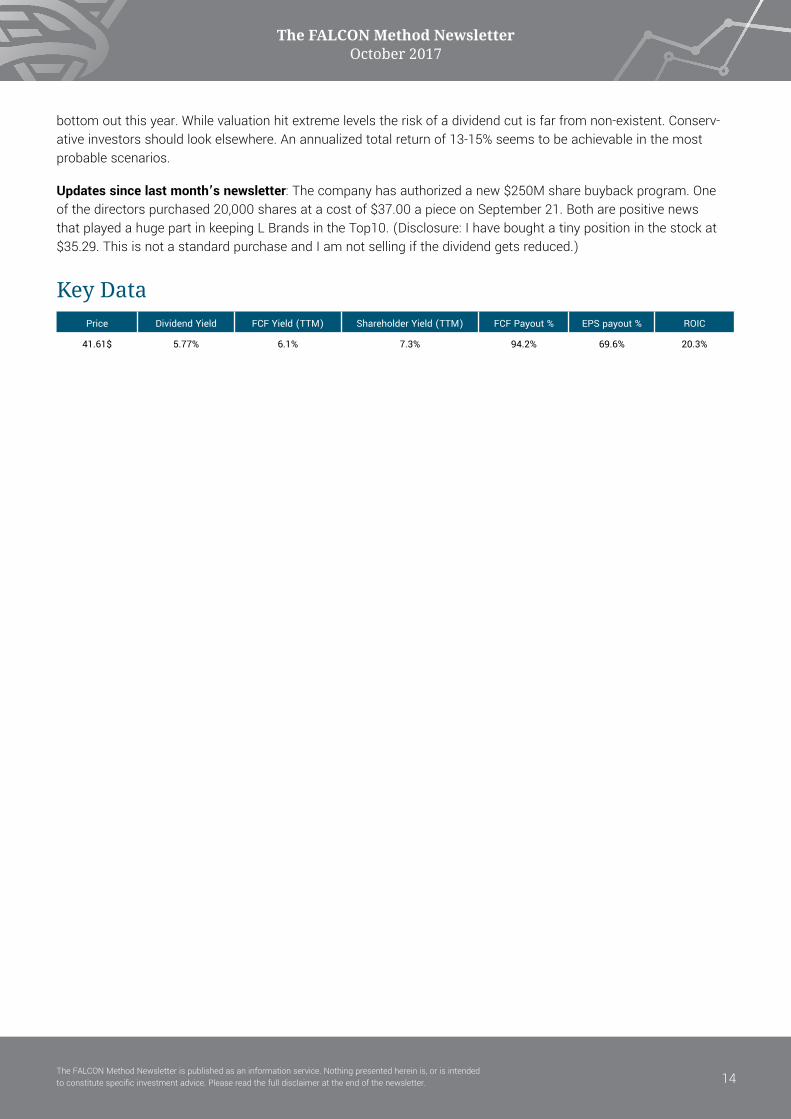
Key DataPrice Dividend Yield FCF Yield (TTM) Shareholder Yield (TTM) FCF Payout % EPS payout % ROIC
41.61$ 5.77% 6.1% 7.3% 94.2% 69.6% 20.3%
bottom out this year. While valuation hit extreme levels the risk of a dividend cut is far from non-existent. Conserv-ative investors should look elsewhere. An annualized total return of 13-15% seems to be achievable in the most probable scenarios.
Updates since last month’s newsletter: The company has authorized a new $250M share buyback program. One of the directors purchased 20,000 shares at a cost of $37.00 a piece on September 21. Both are positive news that played a huge part in keeping L Brands in the Top10. (Disclosure: I have bought a tiny position in the stock at $35.29. This is not a standard purchase and I am not selling if the dividend gets reduced.)
14
The FALCON Method Newsletter October 2017
The FALCON Method Newsletter is published as an information service. Nothing presented herein is, or is intended to constitute specific investment advice. Please read the full disclaimer at the end of the newsletter.
International Business Machines Corporation (IBM)
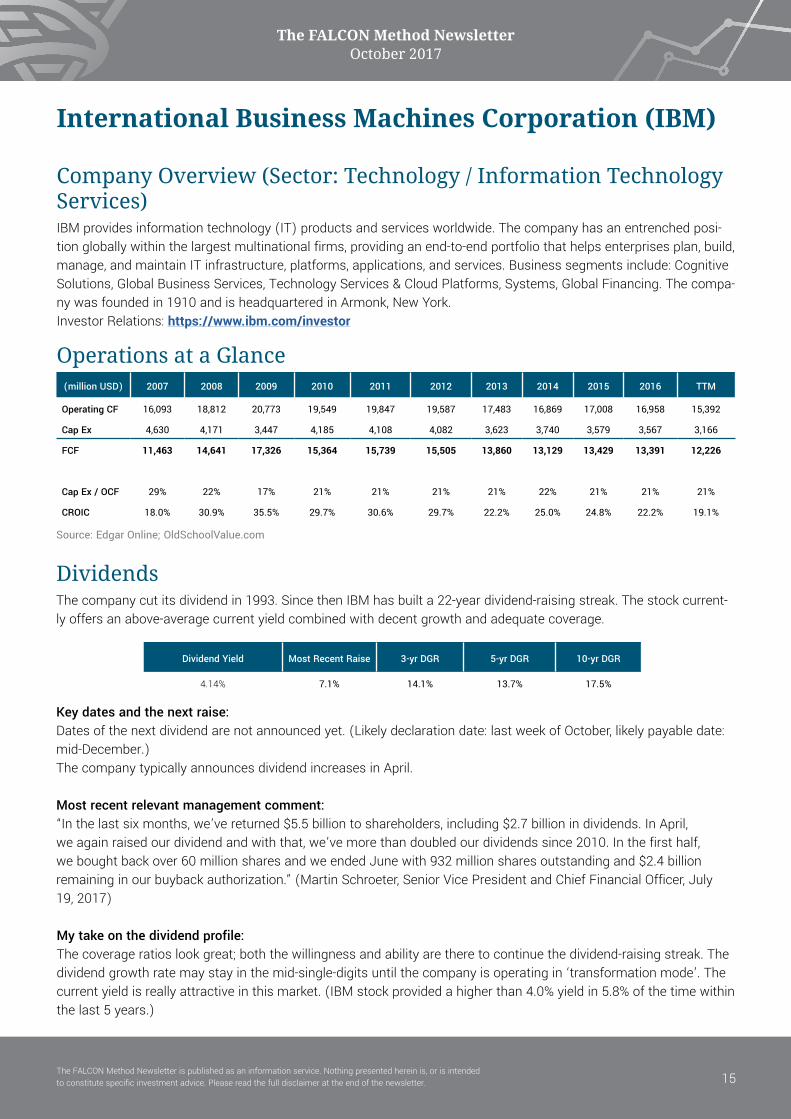
Company Overview (Sector: Technology / Information Technology Services)IBM provides information technology (IT) products and services worldwide. The company has an entrenched posi-tion globally within the largest multinational firms, providing an end-to-end portfolio that helps enterprises plan, build, manage, and maintain IT infrastructure, platforms, applications, and services. Business segments include: Cognitive Solutions, Global Business Services, Technology Services & Cloud Platforms, Systems, Global Financing. The compa-ny was founded in 1910 and is headquartered in Armonk, New York. Investor Relations: https://www.ibm.com/investor
Operations at a Glance (million USD) 2007 2008 2009 2010 2011 2012 2013 2014 2015 2016 TTM
Operating CF 16,093 18,812 20,773 19,549 19,847 19,587 17,483 16,869 17,008 16,958 15,392
Cap Ex 4,630 4,171 3,447 4,185 4,108 4,082 3,623 3,740 3,579 3,567 3,166
FCF 11,463 14,641 17,326 15,364 15,739 15,505 13,860 13,129 13,429 13,391 12,226
Cap Ex / OCF 29% 22% 17% 21% 21% 21% 21% 22% 21% 21% 21%
CROIC 18.0% 30.9% 35.5% 29.7% 30.6% 29.7% 22.2% 25.0% 24.8% 22.2% 19.1%
Dividend Yield Most Recent Raise 3-yr DGR 5-yr DGR 10-yr DGR
4.14% 7.1% 14.1% 13.7% 17.5%
Source: Edgar Online; OldSchoolValue.com
DividendsThe company cut its dividend in 1993. Since then IBM has built a 22-year dividend-raising streak. The stock current-ly offers an above-average current yield combined with decent growth and adequate coverage.
Key dates and the next raise:Dates of the next dividend are not announced yet. (Likely declaration date: last week of October, likely payable date: mid-December.)The company typically announces dividend increases in April.
Most recent relevant management comment:“In the last six months, we’ve returned $5.5 billion to shareholders, including $2.7 billion in dividends. In April, we again raised our dividend and with that, we’ve more than doubled our dividends since 2010. In the first half, we bought back over 60 million shares and we ended June with 932 million shares outstanding and $2.4 billion remaining in our buyback authorization.” (Martin Schroeter, Senior Vice President and Chief Financial Officer, July 19, 2017)
My take on the dividend profile: The coverage ratios look great; both the willingness and ability are there to continue the dividend-raising streak. The dividend growth rate may stay in the mid-single-digits until the company is operating in ‘transformation mode’. The current yield is really attractive in this market. (IBM stock provided a higher than 4.0% yield in 5.8% of the time within the last 5 years.)
15
The FALCON Method Newsletter October 2017
The FALCON Method Newsletter is published as an information service. Nothing presented herein is, or is intended to constitute specific investment advice. Please read the full disclaimer at the end of the newsletter.
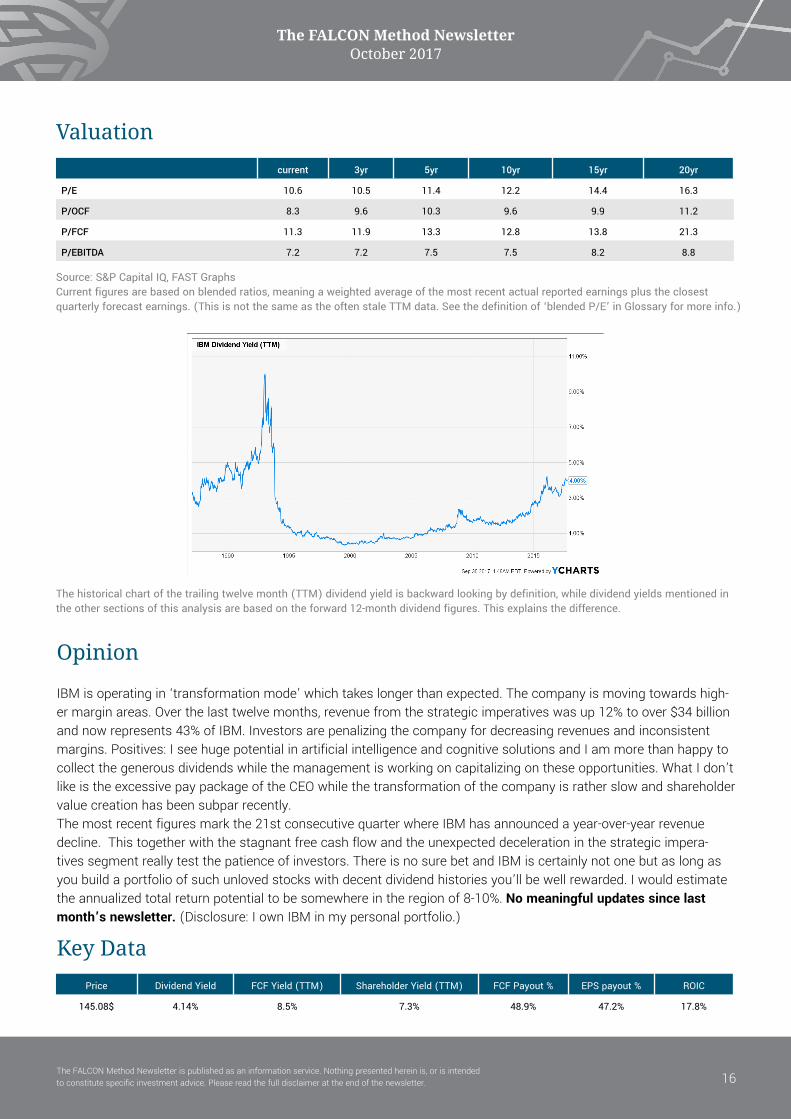
current 3yr 5yr 10yr 15yr 20yr
P/E 10.6 10.5 11.4 12.2 14.4 16.3
P/OCF 8.3 9.6 10.3 9.6 9.9 11.2
P/FCF 11.3 11.9 13.3 12.8 13.8 21.3
P/EBITDA 7.2 7.2 7.5 7.5 8.2 8.8
Source: S&P Capital IQ, FAST GraphsCurrent figures are based on blended ratios, meaning a weighted average of the most recent actual reported earnings plus the closest quarterly forecast earnings. (This is not the same as the often stale TTM data. See the definition of ‘blended P/E’ in Glossary for more info.)
The historical chart of the trailing twelve month (TTM) dividend yield is backward looking by definition, while dividend yields mentioned in the other sections of this analysis are based on the forward 12-month dividend figures. This explains the difference.
Opinion
IBM is operating in ‘transformation mode’ which takes longer than expected. The company is moving towards high-er margin areas. Over the last twelve months, revenue from the strategic imperatives was up 12% to over $34 billion and now represents 43% of IBM. Investors are penalizing the company for decreasing revenues and inconsistent margins. Positives: I see huge potential in artificial intelligence and cognitive solutions and I am more than happy to collect the generous dividends while the management is working on capitalizing on these opportunities. What I don’t like is the excessive pay package of the CEO while the transformation of the company is rather slow and shareholder value creation has been subpar recently. The most recent figures mark the 21st consecutive quarter where IBM has announced a year-over-year revenue decline. This together with the stagnant free cash flow and the unexpected deceleration in the strategic impera-tives segment really test the patience of investors. There is no sure bet and IBM is certainly not one but as long as you build a portfolio of such unloved stocks with decent dividend histories you’ll be well rewarded. I would estimate the annualized total return potential to be somewhere in the region of 8-10%. No meaningful updates since last month’s newsletter. (Disclosure: I own IBM in my personal portfolio.)
Key DataPrice Dividend Yield FCF Yield (TTM) Shareholder Yield (TTM) FCF Payout % EPS payout % ROIC
145.08$ 4.14% 8.5% 7.3% 48.9% 47.2% 17.8%
Valuation
16
The FALCON Method Newsletter October 2017
The FALCON Method Newsletter is published as an information service. Nothing presented herein is, or is intended to constitute specific investment advice. Please read the full disclaimer at the end of the newsletter.
Tanger Factory Outlet Centers (SKT)
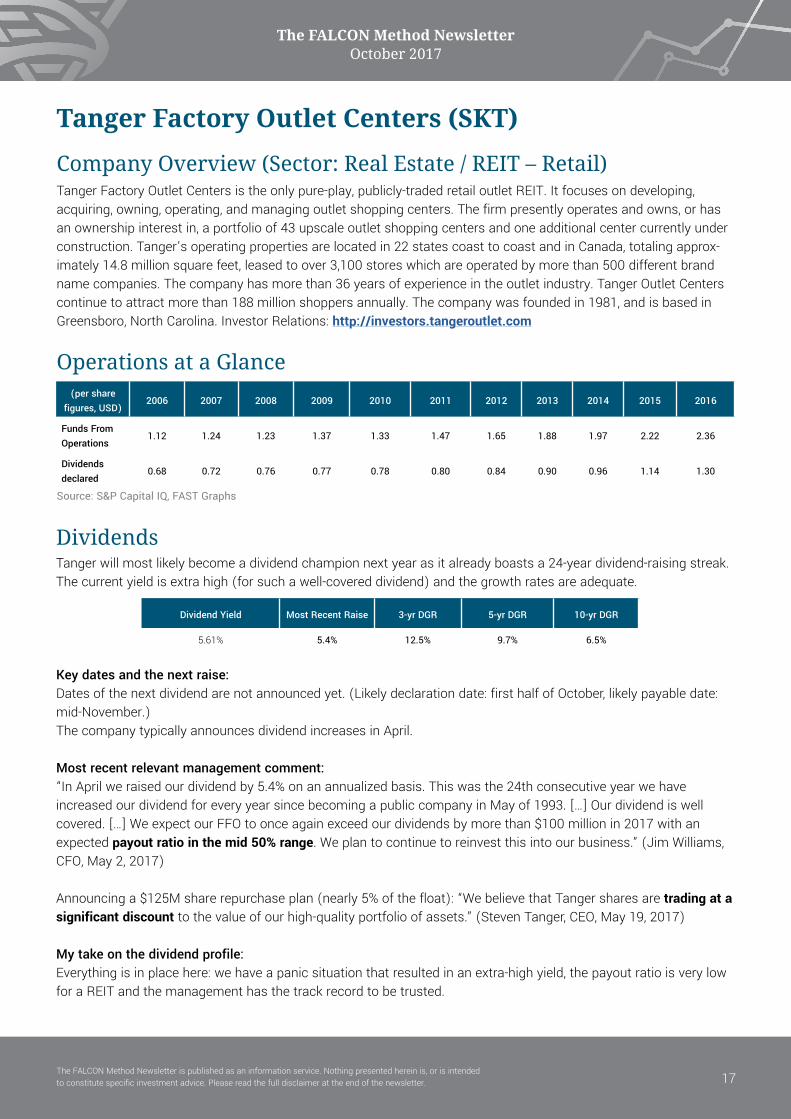
Company Overview (Sector: Real Estate / REIT – Retail)Tanger Factory Outlet Centers is the only pure-play, publicly-traded retail outlet REIT. It focuses on developing, acquiring, owning, operating, and managing outlet shopping centers. The firm presently operates and owns, or has an ownership interest in, a portfolio of 43 upscale outlet shopping centers and one additional center currently under construction. Tanger’s operating properties are located in 22 states coast to coast and in Canada, totaling approx-imately 14.8 million square feet, leased to over 3,100 stores which are operated by more than 500 different brand name companies. The company has more than 36 years of experience in the outlet industry. Tanger Outlet Centers continue to attract more than 188 million shoppers annually. The company was founded in 1981, and is based in Greensboro, North Carolina. Investor Relations: http://investors.tangeroutlet.com
Operations at a Glance (per share
figures, USD)2006 2007 2008 2009 2010 2011 2012 2013 2014 2015 2016
Funds From Operations
1.12 1.24 1.23 1.37 1.33 1.47 1.65 1.88 1.97 2.22 2.36
Dividends declared
0.68 0.72 0.76 0.77 0.78 0.80 0.84 0.90 0.96 1.14 1.30
Dividend Yield Most Recent Raise 3-yr DGR 5-yr DGR 10-yr DGR
5.61% 5.4% 12.5% 9.7% 6.5%
DividendsTanger will most likely become a dividend champion next year as it already boasts a 24-year dividend-raising streak. The current yield is extra high (for such a well-covered dividend) and the growth rates are adequate.
Source: S&P Capital IQ, FAST Graphs
Key dates and the next raise:Dates of the next dividend are not announced yet. (Likely declaration date: first half of October, likely payable date: mid-November.)The company typically announces dividend increases in April.
Most recent relevant management comment:“In April we raised our dividend by 5.4% on an annualized basis. This was the 24th consecutive year we have increased our dividend for every year since becoming a public company in May of 1993. […] Our dividend is well covered. […] We expect our FFO to once again exceed our dividends by more than $100 million in 2017 with an expected payout ratio in the mid 50% range. We plan to continue to reinvest this into our business.” (Jim Williams, CFO, May 2, 2017)
Announcing a $125M share repurchase plan (nearly 5% of the float): “We believe that Tanger shares are trading at a significant discount to the value of our high-quality portfolio of assets.” (Steven Tanger, CEO, May 19, 2017)
My take on the dividend profile: Everything is in place here: we have a panic situation that resulted in an extra-high yield, the payout ratio is very low for a REIT and the management has the track record to be trusted.
17
The FALCON Method Newsletter October 2017
The FALCON Method Newsletter is published as an information service. Nothing presented herein is, or is intended to constitute specific investment advice. Please read the full disclaimer at the end of the newsletter.
Valuation current 3yr 5yr 10yr 15yr 20yr
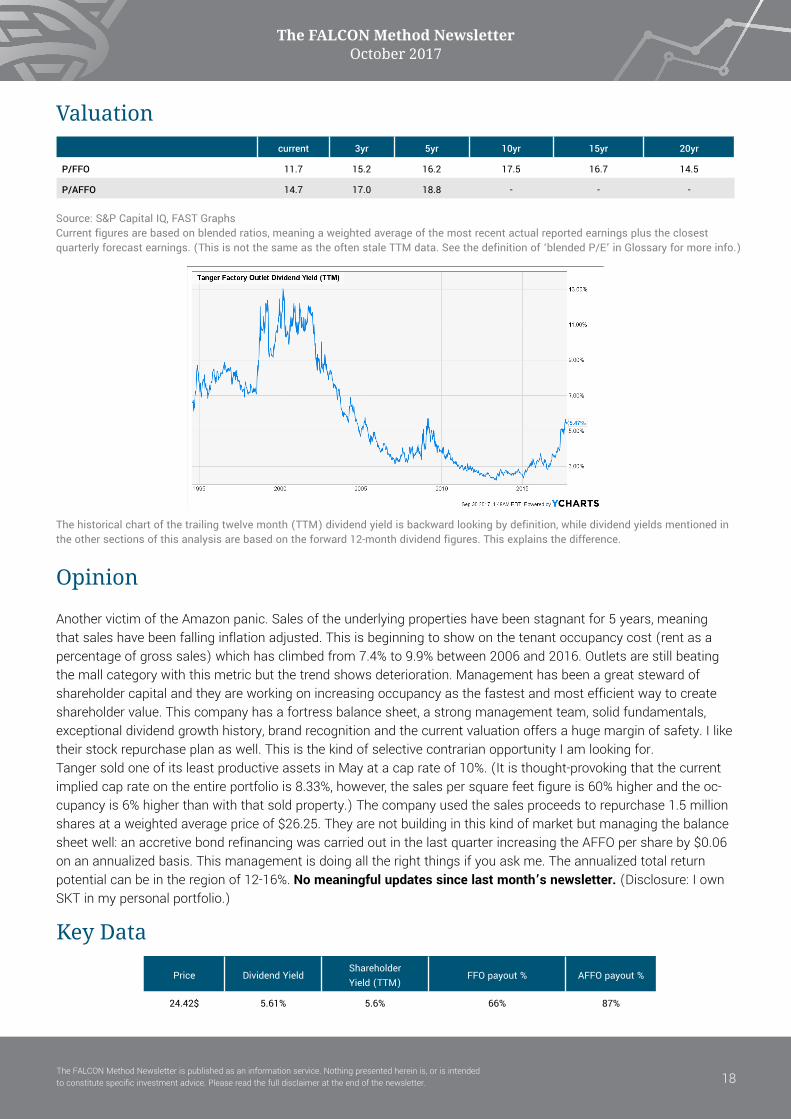
P/FFO 11.7 15.2 16.2 17.5 16.7 14.5
P/AFFO 14.7 17.0 18.8 - - -
Source: S&P Capital IQ, FAST GraphsCurrent figures are based on blended ratios, meaning a weighted average of the most recent actual reported earnings plus the closest quarterly forecast earnings. (This is not the same as the often stale TTM data. See the definition of ‘blended P/E’ in Glossary for more info.)
The historical chart of the trailing twelve month (TTM) dividend yield is backward looking by definition, while dividend yields mentioned in the other sections of this analysis are based on the forward 12-month dividend figures. This explains the difference.
Opinion
Another victim of the Amazon panic. Sales of the underlying properties have been stagnant for 5 years, meaning that sales have been falling inflation adjusted. This is beginning to show on the tenant occupancy cost (rent as a percentage of gross sales) which has climbed from 7.4% to 9.9% between 2006 and 2016. Outlets are still beating the mall category with this metric but the trend shows deterioration. Management has been a great steward of shareholder capital and they are working on increasing occupancy as the fastest and most efficient way to create shareholder value. This company has a fortress balance sheet, a strong management team, solid fundamentals, exceptional dividend growth history, brand recognition and the current valuation offers a huge margin of safety. I like their stock repurchase plan as well. This is the kind of selective contrarian opportunity I am looking for. Tanger sold one of its least productive assets in May at a cap rate of 10%. (It is thought-provoking that the current implied cap rate on the entire portfolio is 8.33%, however, the sales per square feet figure is 60% higher and the oc-cupancy is 6% higher than with that sold property.) The company used the sales proceeds to repurchase 1.5 million shares at a weighted average price of $26.25. They are not building in this kind of market but managing the balance sheet well: an accretive bond refinancing was carried out in the last quarter increasing the AFFO per share by $0.06 on an annualized basis. This management is doing all the right things if you ask me. The annualized total return potential can be in the region of 12-16%. No meaningful updates since last month’s newsletter. (Disclosure: I own SKT in my personal portfolio.)
Key Data
Price Dividend YieldShareholder Yield (TTM)
FFO payout % AFFO payout %
24.42$ 5.61% 5.6% 66% 87%
18

The FALCON Method Newsletter October 2017
The FALCON Method Newsletter is published as an information service. Nothing presented herein is, or is intended to constitute specific investment advice. Please read the full disclaimer at the end of the newsletter.
Whirlpool Corporation (WHR)
Company Overview (Sector: Consumer Cyclical / Home Furnishings & Fixtures)Whirlpool Corporation manufactures and markets home appliances and related products worldwide. The company’s principal products include laundry appliances, refrigerators and freezers, cooking appliances, dishwashers, mixers, and other small domestic appliances. It also produces hermetic compressors for refrigeration systems. The com-pany markets and distributes its products under the Whirlpool, Maytag, KitchenAid, Jenn-Air, Amana, Roper, Admiral, Inglis, Estate, Affresh, Acros, Supermatic, Bauknecht, Laden, Indesit, Privileg, KIC, Hotpoint-Ariston, Hotpoint, Consul, Brastemp, Diqua, and Gladiator brands. Whirlpool Corporation sells its products to retailers, distributors, dealers, builders, and other manufacturers. The company was founded in 1898 and is headquartered in Benton Harbor, Mich-igan. Investor Relations: http://investors.whirlpoolcorp.com
(million USD) 2007 2008 2009 2010 2011 2012 2013 2014 2015 2016 TTM
Operating CF 927 327 1,550 1,078 530 696 1,262 1,479 1,225 1,203 1,416
Cap Ex 536 547 541 593 608 476 578 720 689 660 664
FCF 391 -220 1,009 485 -78 220 684 759 536 543 752
Cap Ex / OCF 58% 167% 35% 55% 115% 68% 46% 49% 56% 55% 47%
CROIC 6.5% -3.9% 15.4% 7.2% -1.2% 3.3% 9.3% 8.2% 6.1% 5.9% 7.4%
Dividend Yield Most Recent Raise 3-yr DGR 5-yr DGR 10-yr DGR
2.39% 10.0% 18.0% 15.1% 8.5%
Operations at a Glance
Source: Edgar Online; OldSchoolValue.com
DividendsWhirlpool has a 7-year uninterrupted dividend-raising streak, before that the company paid unchanged dividends for several years. The dividend was maintained in the great recession as well when the share price tanked, sending the yield to extraordinary levels. The current yield is above market average and comes with double-digit increases.
Key dates and the next raise:Dates of the next dividend are not announced yet. (Likely declaration date: mid-October, likely payable date: mid-De-cember.)The company typically announces dividend increases in April.
Most recent relevant management comment:“We recently announced a 10% quarterly dividend increase. Given our confidence in our underlying business per-formance and our cash generation capability, we remain committed to returning significant levels of cash to our shareholders by executing our balanced approach to capital allocation.” (James Peters, Chief Financial Officer and Executive Vice President, Apr. 26, 2017)
“During the quarter, we repurchased $200 million of common stock, bringing our year-to-date total to $350 million. Given our confidence in our cash flow generation, yesterday we announced a new $2 billion share repurchase
19

The FALCON Method Newsletter October 2017
The FALCON Method Newsletter is published as an information service. Nothing presented herein is, or is intended to constitute specific investment advice. Please read the full disclaimer at the end of the newsletter.
My take on the dividend profile: The current yield is on the low side for my taste so all the other aspects should be extraordinary to get my attention. But not all is great, e.g.: Whirlpool is a proven dividend freezer. (WHR stock provided a higher than 2.5% yield in 6.0% of the time within the last 5 years.)
Valuation current 3yr 5yr 10yr 15yr 20yr
P/E 12.7 12.9 13.9 13.5 12.7 12.2
P/OCF 9.0 11.5 10.3 9.1 8.0 7.4
P/FCF 16.3 23.5 21.3 19.9 18.2 17.8
P/EBITDA 6.1 5.9 6.5 5.0 4.6 4.2
Source: S&P Capital IQ, FAST GraphsCurrent figures are based on blended ratios, meaning a weighted average of the most recent actual reported earnings plus the closest quarterly forecast earnings. (This is not the same as the often stale TTM data. See the definition of ‘blended P/E’ in Glossary for more info.)
The historical chart of the trailing twelve month (TTM) dividend yield is backward looking by definition, while dividend yields mentioned in the other sections of this analysis are based on the forward 12-month dividend figures. This explains the difference.
Opinion
The company’s European operations are a complete mess (that the management is ready to admit) but the other 3 regions are performing well. I don’t like the consistently high capex/OCF ratio. The underlying trends support growth: single households are forecast to grow by a whopping 32% between 2016 and 2030 while smart homes and inter-net-of-things can provide additional opportunities. The company has strong brands, honest and shareholder-friendly management, an easy-to-understand, boring business model and a decent valuation. Whirlpool shares got hammered as Sears announced an agreement to sell its Kenmore line of home appliances di-rectly through Amazon. Whirlpool produces Kenmore so the management sees this news as neutral or even slightly positive in the short term; however, it is too early to judge the effects on future pricing power. The company cut its full-year EPS guidance to reflect the impact of raw material inflation and price mix. The free cash flow guidance was
authorization. This brings our total available authorization to $2.35 billion. We remain committed to returning cash to shareholders, consistent with our balanced approach to capital allocation.” (James Peters, Chief Financial Officer and Executive Vice President, Jul. 27, 2017)
20

The FALCON Method Newsletter October 2017
The FALCON Method Newsletter is published as an information service. Nothing presented herein is, or is intended to constitute specific investment advice. Please read the full disclaimer at the end of the newsletter.
Key DataPrice Dividend Yield FCF Yield (TTM) Shareholder Yield (TTM) FCF Payout % EPS payout % ROIC
184.44$ 2.39% 5.4% 6.1% 44.6% 40.4% 7.5%
unchanged. Whirlpool announced a new $2 billion share repurchase authorization (about 15% of its current market cap). Valuation is still decent considering the lower level of EPS and the recent price increase.
Based on analysts’ estimates on earnings growth, a P/E of 13 and the current dividend yield I foresee an annualized total return in the region of 12-14%. No meaningful updates since last month’s newsletter. (Disclosure: I have no position in the stock.)
21

The FALCON Method Newsletter October 2017
The FALCON Method Newsletter is published as an information service. Nothing presented herein is, or is intended to constitute specific investment advice. Please read the full disclaimer at the end of the newsletter.
Target Corporation (TGT)
Company Overview (Sector: Retail / Discount Stores)Target is one of the largest retailers in North America, with about 1,800 units across the U.S. Its large-format stores offer general merchandise and an assortment of food products. Target sells roughly 33% of general merchandise under private label. The firm has an expanding internet sales presence and issues its own consumer credit card (REDcard), which gives customers a 5% discount on all Target purchases for retaining the card. Target Corporation was founded in 1902 and is headquartered in Minneapolis, Minnesota. Investor Relations: http://investors.target.com
Operations at a Glance
(million USD) 2008 2009 2010 2011 2012 2013 2014 2015 2016 2017 TTM
Operating CF 4,125 4,430 5,881 5,271 5,434 5,325 6,520 4,465 5,958 5,436 6,871
Cap Ex 4,369 3,547 1,729 2,129 4,368 2,346 1,886 1,786 1,438 1,547 2,066
FCF -244 883 4,152 3,142 1,066 2,979 4,634 2,679 4,520 3,889 4,805
Cap Ex / OCF 106% 80% 29% 40% 80% 44% 29% 40% 24% 28% 30%
CROIC -0.8% 2.7% 12.9% 10.1% 3.2% 8.7% 16.1% 10.0% 17.6% 16.4% 20.6%
Dividend Yield Most Recent Raise 3-yr DGR 5-yr DGR 10-yr DGR
4.20% 3.33% 13.7% 16.1% 18.1%
DividendsTarget is a dividend champion with a 50-year uninterrupted dividend-raising streak. The current yield is still at an ex-traordinarily high level while the growth rate shows signs of slowing. The company has reached its targeted payout ratio and is operating in ‘transformation mode’ so we will most likely see low single-digit raises in the foreseeable future.
Source: Edgar Online; OldSchoolValue.com
Key dates and the next raise:Payable December 10; ex-div November 14The company typically announces dividend increases in June.
Most recent relevant management comment:“Unlike many competitors, we have the resources to allow us to invest in the transformation of our business and po-sition Target to compete in this new era in retail. Because our business is so strong, we expect to fund these long-term investments while continuing to support our dividend and annual dividend growth even during the period of transition.” (Brian Cornell, Chairman and Chief Executive Officer, May 17, 2017)
“And over time, to the extent we have excess cash beyond CapEx and dividends, within the limits of our current debt ratings we expect to have the capacity to repurchase our shares. However, given the recent changes in our oper-ating model, we will stay relatively cautious about the pace of share repurchase in the near term.” (Cathy Smith, Chief Financial Officer, May 17, 2017)
22

The FALCON Method Newsletter October 2017
The FALCON Method Newsletter is published as an information service. Nothing presented herein is, or is intended to constitute specific investment advice. Please read the full disclaimer at the end of the newsletter.
My take on the dividend profile: A safe dividend offering more than twice the yield of the market average with half a century of raises. If you feel Tar-get can survive in the retail sector all you have to put up with is the low level of dividend increases in the near term. Investors are paid to wait. (TGT stock provided a higher than 4.0% yield in 12.2% of the time within the last 5 years.)
Valuation current 3yr 5yr 10yr 15yr 20yr
P/E 12.6 12.9 15.2 14.7 15.8 17.9
P/OCF 6.6 6.8 8.3 7.1 8.3 9.4
P/FCF 10.5 9.6 12.4 12.1 23.4 -
P/EBITDA 4.8 5.1 6.0 5.5 6.1 6.9
Source: S&P Capital IQ, FAST GraphsCurrent figures are based on blended ratios, meaning a weighted average of the most recent actual reported earnings plus the closest quarterly forecast earnings. (This is not the same as the often stale TTM data. See the definition of ‘blended P/E’ in Glossary for more info.)
The historical chart of the trailing twelve month (TTM) dividend yield is backward looking by definition, while dividend yields mentioned in the other sections of this analysis are based on the forward 12-month dividend figures. This explains the difference.
OpinionThe story is about Amazon conquering Target’s market. In my opinion, Amazon’s announced acquisition of Whole Foods Market shows the importance of the multichannel model. Target and Amazon are both aiming for this: Target is moving from the brick-and-mortar end of the spectrum, while Amazon is an online behemoth. Target will spend more than $7 billion over the next three years on capital investments to remain competitive. The company’s small-format stores and the digital channel both show promising signs. I most certainly wouldn’t write off Target. Insiders bought stock in March at prices of $54-59. For me, this is a clear selective contrarian buying opportunity. If the P/E returns to a more realistic 15 level, the total-return can easily hit double-digits even with the pessimistic analyst estimates. Target posted better than expected traffic, sales, and financial figures in the second quarter. Management raised its full-year EPS expectation to the range of $4.35 to $4.55 representing an increase of about 11% from the prior guid-ance. Store remodels, new small format stores, exclusive brand launches and the digital sales channel all received great customer feedback. (E.g.: Cat & Jack brand sales crossed $2 billion slightly more than a year after its launch and Target plans to launch 12 additional new brands before the end of next year.) This retailer is doing everything to stay relevant in a tough environment. Their projects are very promising and the execution seems to be flawless. I believe this is a great stock to own. No meaningful updates since last month’s newsletter. (Disclosure: I own TGT in my personal portfolio.)
23

The FALCON Method Newsletter October 2017
The FALCON Method Newsletter is published as an information service. Nothing presented herein is, or is intended to constitute specific investment advice. Please read the full disclaimer at the end of the newsletter.
Key Data
Price Dividend Yield FCF Yield (TTM) Shareholder Yield (TTM) FCF Payout % EPS payout % ROIC
59.01$ 4.20% 14.5% 10.6% 29.0% 48.3% 11.9%
24
The FALCON Method Newsletter October 2017
The FALCON Method Newsletter is published as an information service. Nothing presented herein is, or is intended to constitute specific investment advice. Please read the full disclaimer at the end of the newsletter.
W.W. Grainger (GWW)
Company Overview (Sector: Industrials/ Industrial Distribution)W.W. Grainger distributes more than 1.6 million maintenance, repair, and operations, or MRO, products that are sourced from 5,000 suppliers. The company serves its 3.2 million customers through its online and electronic pur-chasing platforms, vending machines, catalog distribution, and its network of almost 600 global branches. In recent years, Grainger has invested in its e-commerce capabilities, and the firm is the 11th-largest e-commerce site in North America. W.W. Grainger, Inc. was founded in 1927 and is based in Lake Forest, Illinois. Investor Relations: http://invest.grainger.com
Operations at a Glance (million USD) 2007 2008 2009 2010 2011 2012 2013 2014 2015 2016 TTM
Operating CF 469 530 732 596 746 816 986 960 990 1,003 1,032
Cap Ex 197 181 142 127 197 250 272 387 374 284 310
FCF 271 349 590 469 549 566 714 572 616 719 722
Cap Ex / OCF 42% 34% 19% 21% 26% 31% 28% 40% 38% 28% 30%
CROIC 12.3% 13.6% 21.9% 17.4% 17.5% 15.8% 18.8% 15.5% 14.5% 17.8% 17.4%
Dividend Yield Most Recent Raise 3-yr DGR 5-yr DGR 10-yr DGR
2.85% 4.92% 10.4% 13.9% 15.8%
Source: Edgar Online; OldSchoolValue.com
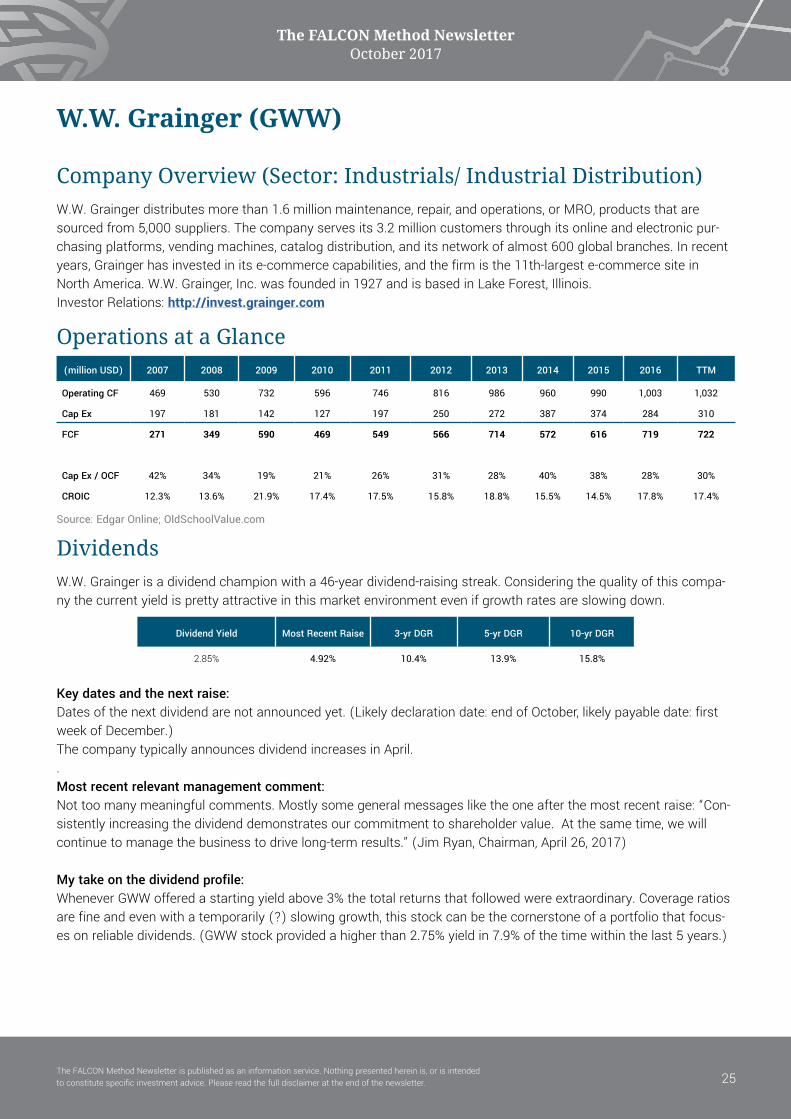
DividendsW.W. Grainger is a dividend champion with a 46-year dividend-raising streak. Considering the quality of this compa-ny the current yield is pretty attractive in this market environment even if growth rates are slowing down.
Key dates and the next raise:Dates of the next dividend are not announced yet. (Likely declaration date: end of October, likely payable date: first week of December.)The company typically announces dividend increases in April..Most recent relevant management comment:Not too many meaningful comments. Mostly some general messages like the one after the most recent raise: “Con-sistently increasing the dividend demonstrates our commitment to shareholder value. At the same time, we will continue to manage the business to drive long-term results.” (Jim Ryan, Chairman, April 26, 2017)
My take on the dividend profile: Whenever GWW offered a starting yield above 3% the total returns that followed were extraordinary. Coverage ratios are fine and even with a temporarily (?) slowing growth, this stock can be the cornerstone of a portfolio that focus-es on reliable dividends. (GWW stock provided a higher than 2.75% yield in 7.9% of the time within the last 5 years.)
25
The FALCON Method Newsletter October 2017
The FALCON Method Newsletter is published as an information service. Nothing presented herein is, or is intended to constitute specific investment advice. Please read the full disclaimer at the end of the newsletter.
current 3yr 5yr 10yr 15yr 20yr
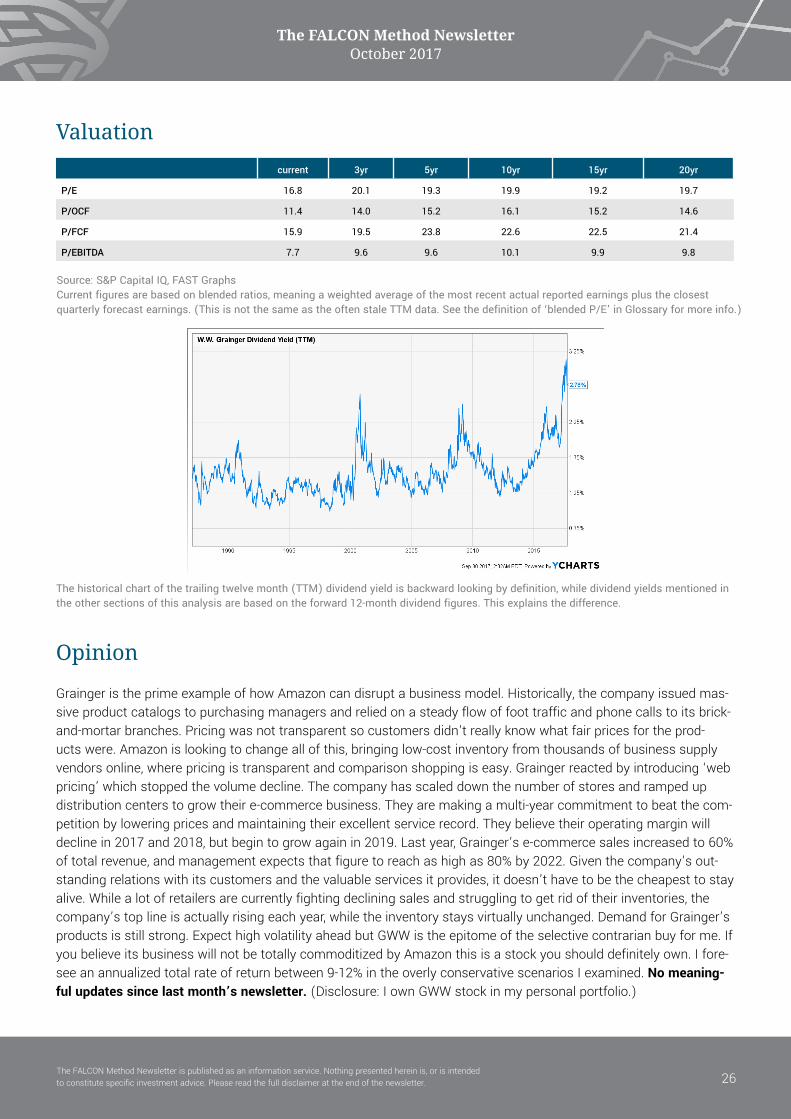
P/E 16.8 20.1 19.3 19.9 19.2 19.7
P/OCF 11.4 14.0 15.2 16.1 15.2 14.6
P/FCF 15.9 19.5 23.8 22.6 22.5 21.4
P/EBITDA 7.7 9.6 9.6 10.1 9.9 9.8
Source: S&P Capital IQ, FAST GraphsCurrent figures are based on blended ratios, meaning a weighted average of the most recent actual reported earnings plus the closest quarterly forecast earnings. (This is not the same as the often stale TTM data. See the definition of ‘blended P/E’ in Glossary for more info.)
The historical chart of the trailing twelve month (TTM) dividend yield is backward looking by definition, while dividend yields mentioned in the other sections of this analysis are based on the forward 12-month dividend figures. This explains the difference.
Opinion
Grainger is the prime example of how Amazon can disrupt a business model. Historically, the company issued mas-sive product catalogs to purchasing managers and relied on a steady flow of foot traffic and phone calls to its brick-and-mortar branches. Pricing was not transparent so customers didn’t really know what fair prices for the prod-ucts were. Amazon is looking to change all of this, bringing low-cost inventory from thousands of business supply vendors online, where pricing is transparent and comparison shopping is easy. Grainger reacted by introducing ‘web pricing’ which stopped the volume decline. The company has scaled down the number of stores and ramped up distribution centers to grow their e-commerce business. They are making a multi-year commitment to beat the com-petition by lowering prices and maintaining their excellent service record. They believe their operating margin will decline in 2017 and 2018, but begin to grow again in 2019. Last year, Grainger’s e-commerce sales increased to 60% of total revenue, and management expects that figure to reach as high as 80% by 2022. Given the company’s out-standing relations with its customers and the valuable services it provides, it doesn’t have to be the cheapest to stay alive. While a lot of retailers are currently fighting declining sales and struggling to get rid of their inventories, the company’s top line is actually rising each year, while the inventory stays virtually unchanged. Demand for Grainger’s products is still strong. Expect high volatility ahead but GWW is the epitome of the selective contrarian buy for me. If you believe its business will not be totally commoditized by Amazon this is a stock you should definitely own. I fore-see an annualized total rate of return between 9-12% in the overly conservative scenarios I examined. No meaning-ful updates since last month’s newsletter. (Disclosure: I own GWW stock in my personal portfolio.)
Valuation
26

The FALCON Method Newsletter October 2017
The FALCON Method Newsletter is published as an information service. Nothing presented herein is, or is intended to constitute specific investment advice. Please read the full disclaimer at the end of the newsletter.
Price Dividend Yield FCF Yield (TTM) Shareholder Yield (TTM) FCF Payout % EPS payout % ROIC
179.75$ 2.85% 6.8% 9.5% 42.0% 56.4% 12.5%
Key Data
27

The FALCON Method Newsletter October 2017
The FALCON Method Newsletter is published as an information service. Nothing presented herein is, or is intended to constitute specific investment advice. Please read the full disclaimer at the end of the newsletter.
Schweitzer-Mauduit International (SWM)
Company Overview (Sector: Basic Materials / Paper & Paper Products)Schweitzer-Mauduit International, Inc. is a diversified producer of premium specialty papers and resin-based prod-ucts. The Engineered Papers segment produces and sells cigarette papers, reconstituted tobacco leaf, and wrapper and binder products to cigarette and cigar manufacturers; and other non-tobacco commercial and industrial paper products. It also offers low ignition propensity cigarette paper; and lightweight papers for printing and writing, floor-ing laminates, and food service packaging. The Advanced Materials & Structures segment manufactures resin-based products, such as films, nets, foams, and other non-wovens for filtration, surface protection, medical, and industrial applications. SWM and its subsidiaries conduct business in over 90 countries. The company was founded in 1995 and is headquartered in Alpharetta, Georgia. Investor Relations: http://phx.corporate-ir.net/phoenix.zhtml?c=98060&p=irol-irhome
(million USD) 2007 2008 2009 2010 2011 2012 2013 2014 2015 2016 TTM
Operating CF 71 33 63 141 82 175 178 166 145 130 122
Cap Ex 48 35 15 74 61 27 29 35 24 28 37
FCF 24 -2 48 67 21 147 149 131 121 102 85
Cap Ex / OCF 67% 106% 24% 52% 75% 16% 16% 21% 17% 21% 31%
CROIC 5.3% -0.4% 8.9% 11.7% 3.3% 22.1% 15.7% 14.1% 11.6% 10.7% 6.7%
Dividend Yield Most Recent Raise 3-yr DGR 5-yr DGR 10-yr DGR
4.05% 5.0% 8.7% 40.1% 18.4%
Source: Edgar Online; OldSchoolValue.com
Operations at a Glance
DividendsAfter a long period of frozen dividend, the last 5 years were packed with spectacular raises. The current yield is more than twice the market average and the coverage is decent.
Key dates and the next raise:Dates of the next dividend are not announced yet. (Likely declaration date: first week of November, likely payable date: end of December.)The company typically announces dividend increases in November.
Most recent relevant management comment:“We also announced an increase to our quarterly dividend rate of 5%. This marks the fifth consecutive year we’ve increased our dividend and is consistent with our balanced capital allocation strategy to return at least one-third of our free cash flow to investors. We believe these steady dividend increases demonstrate the confidence we have in the Company’s financial health and long-term growth prospects.” (Allison Aden, EVP & CFO, Nov. 5, 2016)
My take on the dividend profile:The current yield together with the decent coverage ratios are really attractive in today’s market. Even single-digit raises can make the total-return good enough if the starting yield and valuation components are favorable. I don’t
28
The FALCON Method Newsletter October 2017
The FALCON Method Newsletter is published as an information service. Nothing presented herein is, or is intended to constitute specific investment advice. Please read the full disclaimer at the end of the newsletter.
like freezers but the quote from the CFO indicates that the management is committed to steady dividend increases when the underlying performance makes it possible. (SWM stock provided a higher than 4.0% yield in 31.1% of the time within the last 5 years.)
current 3yr 5yr 10yr 15yr 20yr
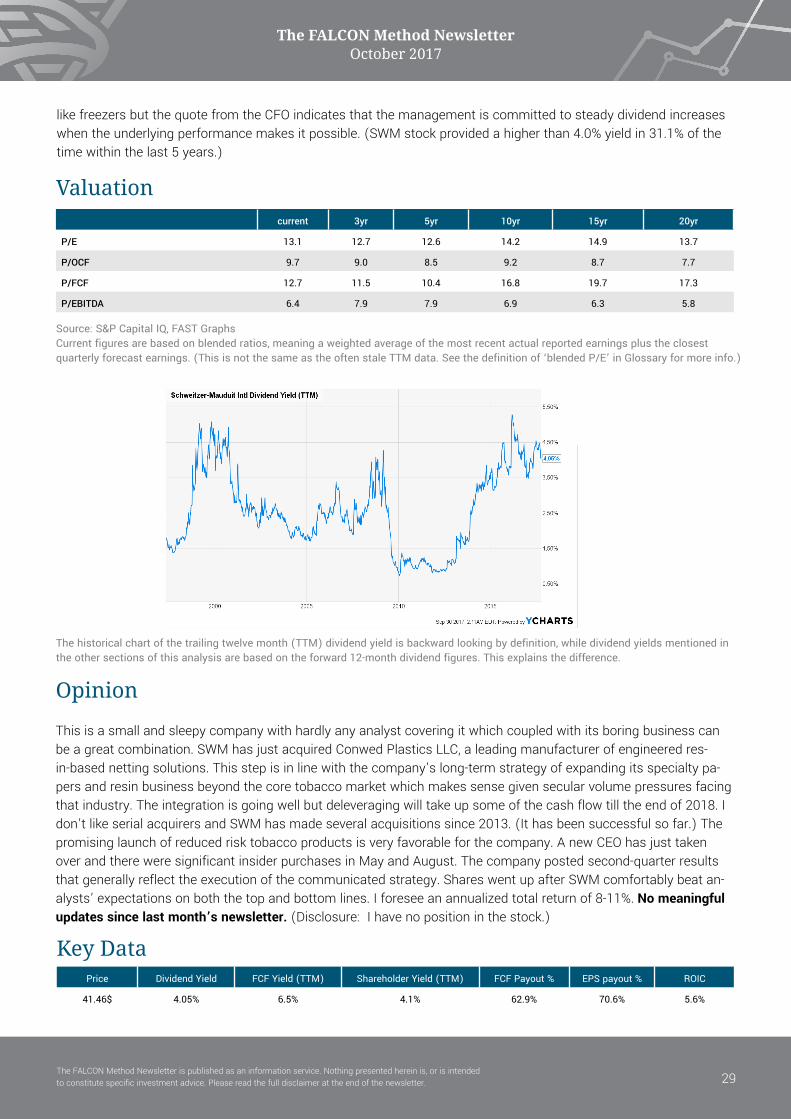
P/E 13.1 12.7 12.6 14.2 14.9 13.7
P/OCF 9.7 9.0 8.5 9.2 8.7 7.7
P/FCF 12.7 11.5 10.4 16.8 19.7 17.3
P/EBITDA 6.4 7.9 7.9 6.9 6.3 5.8
Source: S&P Capital IQ, FAST GraphsCurrent figures are based on blended ratios, meaning a weighted average of the most recent actual reported earnings plus the closest quarterly forecast earnings. (This is not the same as the often stale TTM data. See the definition of ‘blended P/E’ in Glossary for more info.)
The historical chart of the trailing twelve month (TTM) dividend yield is backward looking by definition, while dividend yields mentioned in the other sections of this analysis are based on the forward 12-month dividend figures. This explains the difference.
Opinion
This is a small and sleepy company with hardly any analyst covering it which coupled with its boring business can be a great combination. SWM has just acquired Conwed Plastics LLC, a leading manufacturer of engineered res-in-based netting solutions. This step is in line with the company’s long-term strategy of expanding its specialty pa-pers and resin business beyond the core tobacco market which makes sense given secular volume pressures facing that industry. The integration is going well but deleveraging will take up some of the cash flow till the end of 2018. I don’t like serial acquirers and SWM has made several acquisitions since 2013. (It has been successful so far.) The promising launch of reduced risk tobacco products is very favorable for the company. A new CEO has just taken over and there were significant insider purchases in May and August. The company posted second-quarter results that generally reflect the execution of the communicated strategy. Shares went up after SWM comfortably beat an-alysts’ expectations on both the top and bottom lines. I foresee an annualized total return of 8-11%. No meaningful updates since last month’s newsletter. (Disclosure: I have no position in the stock.)
Valuation
Key DataPrice Dividend Yield FCF Yield (TTM) Shareholder Yield (TTM) FCF Payout % EPS payout % ROIC
41.46$ 4.05% 6.5% 4.1% 62.9% 70.6% 5.6%
29

The FALCON Method Newsletter October 2017
The FALCON Method Newsletter is published as an information service. Nothing presented herein is, or is intended to constitute specific investment advice. Please read the full disclaimer at the end of the newsletter.
Omnicom Group (OMC)
Company Overview (Sector: Consumer Cyclical / Advertising Agencies)Omnicom is an inter-connected global network of marketing communications companies. This is the world’s sec-ond-largest ad holding company, based on annual revenue. The American firm’s services, which include traditional and digital advertising and public relations, are provided worldwide, with over 85% of its revenue coming from more developed regions such as North America and Europe. Omnicom Group Inc. was founded in 1944 and is based in New York, New York. Investor Relations: http://investor.omnicomgroup.com/investor-relations
Operations at a Glance (million USD) 2007 2008 2009 2010 2011 2012 2013 2014 2015 2016 TTM
Operating CF 1,599 1,394 1,732 1,488 1,315 1,451 1,809 1,477 2,172 1,931 1,978
Cap Ex 223 212 131 154 186 226 212 213 203 166 156
FCF 1,376 1,182 1,601 1,334 1,130 1,225 1,597 1,264 1,970 1,766 1,822
Cap Ex / OCF 14% 15% 8% 10% 14% 16% 12% 14% 9% 9% 8%
CROIC 19.2% 17.9% 24.8% 19.7% 16.9% 15.5% 21.0% 17.1% 28.0% 24.8% 25.3%
Dividend Yield Most Recent Raise 3-yr DGR 5-yr DGR 10-yr DGR
2.97% 10.0% 11.9% 17.2% 15.7%
Source: Edgar Online; OldSchoolValue.com
DividendsOmnicom has been paying increased dividends for 7 straight years but freezes are part of the company’s history. The next raise is overdue but as the management comments quoted below suggest it should come soon. The cur-rent yield and growth rates are attractive while the dividend is well covered.
Key dates and the next raise:Payable October 10; ex-div September 21The timing of dividend increases is unpredictable with this company.
Most recent relevant management comment:“Our use of cash remains consistent with past practice, paying out dividends, pursuing accretive acquisitions, and repurchasing shares with the balance of our free cash flow. Our Board will be evaluating a dividend increase during our next meeting. Our cash flow, balance sheet, and liquidity remained very strong.” (John Wren, President and CEO, Jul. 20, 2017)
My take on the dividend profile:If you can tolerate the unpredictable timing of dividend increases there is really nothing wrong here. The holy trinity of yield, growth, and coverage looks good. Omnicom is a free cash flow monster and since the business is not capital intensive most of the cash can be returned via dividends and share buybacks. Exactly how I like it!
30

The FALCON Method Newsletter October 2017
The FALCON Method Newsletter is published as an information service. Nothing presented herein is, or is intended to constitute specific investment advice. Please read the full disclaimer at the end of the newsletter.
current 3yr 5yr 10yr 15yr 20yr
P/E 14.9 18.2 16.8 16.5 18.1 21.1
P/OCF 10.2 10.7 10.0 9.4 10.9 12.4
P/FCF 9.9 12.1 11.5 10.5 12.0 14.6
P/EBITDA 7.5 8.7 8.6 7.8 8.8 10.1
Source: S&P Capital IQ, FAST GraphsCurrent figures are based on blended ratios, meaning a weighted average of the most recent actual reported earnings plus the closest quarterly forecast earnings. (This is not the same as the often stale TTM data. See the definition of ‘blended P/E’ in Glossary for more info.)
The historical chart of the trailing twelve month (TTM) dividend yield is backward looking by definition, while dividend yields mentioned in the other sections of this analysis are based on the forward 12-month dividend figures. This explains the difference.
Opinion
The global advertising market generally grows in-line with global GDP. As advertising and marketing services repre-sent highly discretionary spending for customers, Omnicom’s business should be fairly cyclical, however, if you look at the earnings and cash flow numbers the consistency is remarkable here. Barriers to entry may seem low in the sector but client retention rates are extremely high because of switching costs. The industry has gone through a gradual consolidation as a result of which the “Big 5” firms account for over a fourth of the total global advertising dollars spent. Omnicom shares got hit because its competitor, WPP issued a warning about a potential sharp pull-back in spending from advertisers, particularly in North America.What I absolutely love here: The business is not capital intensive while it generates tons of cash and the CROIC figures are excellent. Looking at the past 10 years, more than 70% of free cash flow has been returned to sharehold-ers via buybacks and dividends. Between 2007 and 2016, Omnicom has bought back nearly 30% of its outstanding shares, of which it has retired the majority. Negatives: excessive executive compensation and the acquisitive nature of the industry that always entails risks.However hard I tried it was nearly impossible to come up with a realistic scenario that would sink the annualized total return potential below 10%. (Disclosure: I own OMC in my personal portfolio.)
Valuation
Key DataPrice Dividend Yield FCF Yield (TTM) Shareholder Yield (TTM) FCF Payout % EPS payout % ROIC
74.07$ 2.97% 10.4% 7.0% 28.5% 44.3% 16.3%
31

The FALCON Method Newsletter October 2017
The FALCON Method Newsletter is published as an information service. Nothing presented herein is, or is intended to constitute specific investment advice. Please read the full disclaimer at the end of the newsletter.
Complete RankingYou can find the Data Table Spreadsheet inside the membership area where the Newsletter resides.
Please don’t forget that this only shows the results of a single step (the multifactor quantitative ranking) of the FAL-CON Method process. This ranking is based solely on the ‘yield plus growth’ characteristics and by no means does it include the filter of historical valuation, the absolute threshold criteria, and the additional qualitative considerations.
Only use this raw data as a starting point for your individual analysis if you wish to perform any.
Since it is in a user-friendly xls format you can easily do your own filtering, sorting, and ranking. (E.g.: You can filter the stocks by sectors and rank them based on their dividend yields.)
32

The FALCON Method Newsletter October 2017
The FALCON Method Newsletter is published as an information service. Nothing presented herein is, or is intended to constitute specific investment advice. Please read the full disclaimer at the end of the newsletter.
The FALCON PortfolioFor the sake of complete transparency here are the stocks that have appeared as top picks in the previous newslet-ters.
Stock Ticker Symbol Purchase Date Purchase Price Market Price Unrealized P/L
CVS Health CVS 06/30/17 $80.46 $81.32 1.1%
Target TGT 06/30/17 $52.29 $59.01 12.9%
Tanger Factory Outlet SKT 06/30/17 $25.98 $24.42 -6.0%
W.W. Grainger GWW 08/04/17 $170.35 $179.75 5.5%
Lowe's Companies LOW 08/04/17 $78.37 $79.94 2.0%
Omnicom Group OMC 09/29/17 $74.07 $74.07 0.0%
The extremely short time frame makes this data insufficient to draw any statistically meaningful conclusions about the performance of the underlying investment approach. Please keep this in mind regardless of how good or bad the table looks.
Selling rules triggered: -
33
The FALCON Method Newsletter October 2017
The FALCON Method Newsletter is published as an information service. Nothing presented herein is, or is intended to constitute specific investment advice. Please read the full disclaimer at the end of the newsletter.
GlossaryAdjusted funds from operations (AFFO): This calculation takes a REIT’s FFO (see later) and subtracts any recurring expenditure that is capitalized and then amortized, as well as any straight-lining of rents.
Blended P/E: A price-to-earnings indicator, where the earnings part is the calculated as the weighted average of the most recent actual reported earnings plus the closest quarterly forecast earnings. This gives the most weight to the past “actual” reported earnings, but also includes an appropriate consideration of the company’s continuing earnings power post their last report.
CEO: Chief Executive Officer
CFO: Chief Financial Officer
CROIC: Cash Return On Invested Capital. This indicator shows how much free cash flow per dollar the business generates from invested capital. This can be the ultimate performance metric as it shows so clearly how effective management is and the strength of the business. (CROIC = FCF/Invested Capital)
Dividend yield: The percentage of the price per share a company pays out to its shareholders as dividends annually, calculated by dividing the forecasted 12-month dividend payout by the current price.
DGR: or Dividend Growth Rate is the compound annual growth rate of the dividend for the periods shown.
EBITDA: Earnings before interest, taxes, depreciation, and amortization is essentially net income with these things added back to it. It is used to analyze and compare profitability without the effects of finance and accounting deci-sions.
EVP: Executive Vice President
Ex-Dividend Date: If you purchase a stock on its ex-dividend date or after, you will not receive the next dividend pay-ment. Instead, the seller gets the dividend. If you purchase before the ex-dividend date, you get the dividend.
FCF payout ratio: This alternative dividend payout ratio aims to be more accurate by excluding accounting earnings and including only actual cash generation. It is calculated as Dividend Per Share as a percent of Free Cash Flow per Share.
FCF yield: Free Cash Flow per Share for the trailing 12-months divided by the current stock price. This is the inverse of the Price to Free Cash Flow (PFCF) value.
Free cash flow (FCF): Free Cash Flow shows how much cash a company generates after paying to maintain and expand its production. It is calculated by subtracting Capital Expenditure (Cap Ex) from Cash Flow.
Funds from operations (FFO): This refers to the figure used by real estate investment trusts (REITs) to define the cash flow from their operations. It is calculated by adding depreciation and amortization to earnings, subtracting any gains on sales. Many leading REITs believe that the FFO calculation is the best presentation of operating results. This is because real estate historically rises and falls with macroeconomic conditions, and any operating results calculated using the cost accounting method are not an accurate measure of performance.
34
The FALCON Method Newsletter October 2017
The FALCON Method Newsletter is published as an information service. Nothing presented herein is, or is intended to constitute specific investment advice. Please read the full disclaimer at the end of the newsletter.
OCF: Operating cash flow. The measure of cash into or out of the company, similar to Net Income but less easily manipulated and without the effects of depreciation and other non-cash charges.
Payout Ratio: Dividend payout ratio is Dividend Per Share as a percent of Diluted Earnings Per Share and can be used to measure the chance of a dividend increase or cut. For example, a company with a small Payout Ratio has room to increase its dividend.
ROIC: ROIC, or Return on Invested Capital, quantifies how well a company generates cash flow relative to the capital it has invested in its business. It is defined as Net Income / (Total Equity + Long-term Debt and Capital Lease Obliga-tion + Short-term Debt and Capital Lease Obligation)
Shareholder yield: Shareholder yield is the total of share buybacks and dividend payments to common shareholders over the past twelve months as a percent of the current market capitalization. A negative value indicates the compa-ny is profiting more from issuing new stock than it is spending on buybacks and dividends.
TTM: trailing twelve months.
35

The FALCON Method Newsletter October 2017
The FALCON Method Newsletter is published as an information service. Nothing presented herein is, or is intended to constitute specific investment advice. Please read the full disclaimer at the end of the newsletter.
How to use the newsletter?If you are saving and investing regularly, it is a wise strategy to buy the highest ranked stock in the Top10 every month in which you have the smallest dollar amount invested, or go for the Top Pick of the month if you do not own it yet. (I prefer the latter.) With this approach, you can build a well-diversified portfolio of top quality stocks pur-chased at attractive prices.
If you have a lump sum to invest I suggest that you should divide the money into 24 equal parts and invest it grad-ually during the next 24 months (1/24 of the money each month), always purchasing the most attractive stocks on the Top10 list of the FALCON Method Newsletter. This way you can free yourself from the frustration of the mission impossible called market timing.
You may also have your own criteria, like “the dividend yield must be above 3%”. In this case, pick the stocks from the Top10 that fulfill your requirements, and do this every month. Although if you notice that none of today’s best opportunities can jump over your bar, it may be time to think whether your expectations are still realistic in the pre-vailing market environment.
My suggestion is to go for 20-30 stock positions and make them approximately equal weighted. This way you will reap the rewards of diversification, while you can have a portfolio of top companies from various sectors and these stocks will put ever increasing dividends in your pocket.
If you start following the recommendations of the FALCON Method Newsletter, after a few years you might have more positions than you feel comfortable with. In this case, I recommend that you sell the stock in your portfolio that ranks the lowest in the complete ranking and use the proceeds to buy one of the Top10 stocks in which you own the least dollar amount.
Whenever you have questions, I am here to help the members of the FALCON Family. I’m not allowed to give individ-ual financial advice but I will do my best to help you. You can contact me directly at [email protected]. As a newsletter subscriber, you are welcome to start the subject line of your emails with the tag [priority], which will guarantee that your questions have priority over the non-member emails.
36
The FALCON Method Newsletter October 2017
The FALCON Method Newsletter is published as an information service. Nothing presented herein is, or is intended to constitute specific investment advice. Please read the full disclaimer at the end of the newsletter.
Closing ThoughtsI’d like to use this section to give you some insights into the thoughts and feelings that came up when compiling this month’s Top10 list. If it’s just half as eye-opening for you as it was for me then I simply couldn’t imagine any-thing more useful as a closing.
It takes several hours to get the results of the FALCON Method, and although it is pretty labor-intensive I am doing the process from beginning to end 2-3 times during the week when the newsletter publishes. I hate last minute sur-prises so I want to see in advance what new names may pop up as potential candidates for our Top10. It’s great to have time for the best possible preparation and I read a lot about the possible newcomers. This is the only way I can form an opinion that I am ready to share.
My first thoughts this time? The exact same 10 stocks again! Absolutely no changes from last month. Members of the FALCON Family might think I am lazy. After all, they are paying for this stuff and I am unable to come up with any new names to invest in. But wait a minute! Am I being paid to invent new names every month or to operate a system that happens to be evidence-based and gives us names of stocks that I myself would buy?
Let’s get out of my head for a short interruption and I will let you back in afterward. I have read a short piece of news about Seth Klarman, one of the greatest value investors of all time, whose book Margin of Safety is rumored to sit on Warren Buffett’s desk. According to Bloomberg “Seth Klarman’s $30 billion Baupost Group plans to return some capital to investors by year end because the hedge fund doesn’t see enough opportunities in the market.” This is the third time they are doing this: “Baupost also returned capital to investors in 2010 and 2013 for similar reasons.”
You are reading it right! The best of the best cannot find enough investment opportunities in this market. The average newsletter subscriber may believe that new names on the list mean that serious work has been done. Well, sometimes the opposite is true! Continuously coming up with new investment ideas just to sell a newsletter or gain publicity is a reckless way to do business. And yes, it is the mainstream.
At the time of this writing (a few days before the deadline) our Top10 is not finalized yet. I have two borderline deci-sions to make about excluding Eastman Chemical (questionable double-dip potential) and L Brands (dividend cov-erage issues). The FALCON Method leaves room for such judgment calls and as I see General Mills and Omnicom Group knocking on the door with excellent operating metrics I am tempted to do some serious System 2 thinking. Both GIS and OMC are included in my personal portfolio. Whatever happens with the Top10 this month you’ve just got two new names to consider.
A fair warning: I only expect major changes on our list when Mr. Market’s bipolar disorder switches into “panic mode” that we haven’t seen for a long time. Until then most of the quality stocks that place better in the quant rank-ing than the ones on our current Top10 are either overvalued in historical comparison or do not meet our absolute threshold criteria. A broad market sell-off or some company-specific panic could surely help shake up our list since I am absolutely not willing to compromise a system that works well just for the sake of the show. Seth Klarman has made a statement that he was a serious investor not a circus clown and I am gladly taking his side on this issue.
Be patient, stick to the plan and enjoy every minute of the journey!
David
37
The FALCON Method Newsletter October 2017
The FALCON Method Newsletter is published as an information service. Nothing presented herein is, or is intended to constitute specific investment advice. Please read the full disclaimer at the end of the newsletter.
DisclaimerThe FALCON Method (including the website, articles, books and newsletter) is published as an information service. It may include opinions as to buying, selling and holding various stocks and other securities.
However, the publishers of the FALCON Method are not brokers or acting as investment advisers and do not provide investment advice or recommendations directed to any particular subscriber or in view of the particular circum-stances of any particular person. Nothing presented by the FALCON Method is, or is intended to constitute specific investment advice. The staff at the FALCON Method will only answer questions of a general nature and are unable to provide specific buy/sell recommendations or specific investment advice on an individual basis.
The FALCON Method does not guarantee that you will outperform the stock market. No guarantee of investment performance is being provided and no inference to the contrary should be made. There is a risk of loss from an investment in securities.
The information provided by the FALCON Method is obtained from sources believed to be reliable but is not guaran-teed as to accuracy or completeness. While the FALCON Method has used reasonable efforts to obtain information from reliable sources, we make no representations or warranties as to the accuracy, reliability or completeness of third-party information presented in the FALCON Method Newsletter or on the website. Investors should recheck critical data before making stock purchases.
At various times, the publishers and employees of the FALCON Method may own, buy or sell the securities dis-cussed for purposes of investment or trading. David Solyomi primarily invests his own portfolio in stocks recom-mended in the FALCON Method Newsletter.
The FALCON Method and its publishers, owners and agents, are not liable for any losses or damages, monetary or otherwise, that result from the content of the FALCON Method.
Nothing presented by the FALCON Method should be construed as a recommendation to follow any investment strategy or allocation. Any forward-looking statements or forecasts are based on assumptions and actual results are expected to vary from any such statements or forecasts. No reliance should be placed on any such statements or forecasts when making any investment decision.
Past performance is not a guarantee of future performance.
38