The Factors Predicting the Developmental Gains of Children ... · GAT1_composite= The GAT fall...
29
The Factors Predicting the Developmental Gains of Children With and Without Disabilities in Inclusive Preschools Bulbin Sucuoglu Hatice Bakkaloglu, Şeyda Demir, Betul Yilmaz, Abdulhamit Karademir, Zafer Erturk, Project No: 114k649 July 15, 2015-July 15, 2018 The Scientific and Technological Research Council of Turkey (TUBİTAK)
Transcript of The Factors Predicting the Developmental Gains of Children ... · GAT1_composite= The GAT fall...

The Factors Predicting the Developmental Gains of Children With and Without Disabilities in Inclusive Preschools
Bulbin SucuogluHatice Bakkaloglu,
Şeyda Demir, Betul Yilmaz,
Abdulhamit Karademir, Zafer Erturk,
Project No: 114k649July 15, 2015-July 15, 2018
The Scientific and Technological Research Council of Turkey (TUBİTAK)

Agenda
Early childhood special education and preschool inclusionWhy preschool inclusion?Outcomes of inclusion practices for children
In Turkey…LegislationsRelated studiesNeed for this studyPurpose of the studyData collectionAnalysisResults and discussion
Jun 9, 2016 ISEI 2016 Stockholm 2

Inclusion is a practice….
– beneficial for children with disabilities
– it creates a conducive environment to promote all aspects of child development
– High-quality preschool inclusion is an important part of early childhood special education (Guralnick,
2016)
Jun 9, 2016 ISEI 2016 Stockholm 3

• Inclusion during the preschool years is necessary. Because….
– Minimizes the possibility of rejection
– Maximizes the possibility of social acceptance
– Increases later life acceptance
– Increases expectations among parents and teachers
Jun 9, 2016 ISEI 2016 Stockholm 4
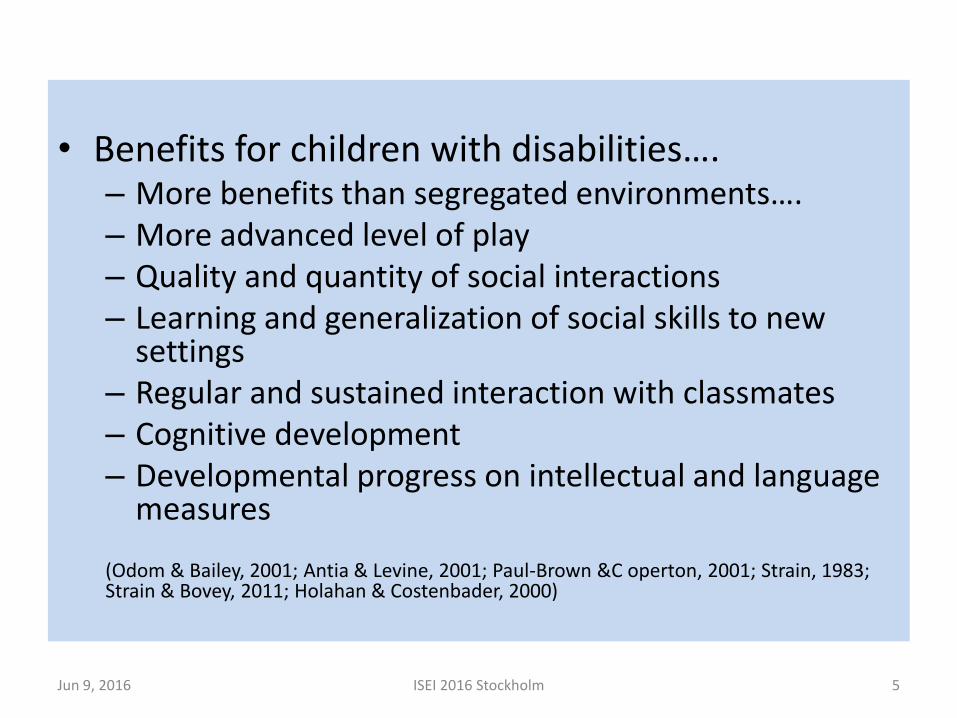
• Benefits for children with disabilities….– More benefits than segregated environments….– More advanced level of play– Quality and quantity of social interactions– Learning and generalization of social skills to new
settings– Regular and sustained interaction with classmates– Cognitive development– Developmental progress on intellectual and language
measures
(Odom & Bailey, 2001; Antia & Levine, 2001; Paul-Brown &C operton, 2001; Strain, 1983; Strain & Bovey, 2011; Holahan & Costenbader, 2000)
Jun 9, 2016 ISEI 2016 Stockholm 5

In Turkey …….• Inclusive preschool practices started in 1997...• In 2006, it became more widespread with the adoption of special
education service regulation…• In 2016, more than 25.000 young children with disabilities were in
preschool classrooms (Ministry of National Education, 2011).
According to the laws and regulations…..
The preschools should take appropriate measures for the children with disabilities who are placed into learning environments with typically developing peers (Ministry of National Education, 2006).
Each classroom should include one or two children with mild disabilities. The teachers have limited knowledge, skills and experience related to
inclusive practices. In each preschool classroom, one teacher is responsible for the
development of all children.
Jun 9, 2016 ISEI 2016 Stockholm 6

Parent and teacher attitudes and beliefs towards inclusive preschools are generally positive…
teachers’ difficulties
parent concerns..
(Gok & Erbas, 2011; Ozaydin & Colak, 2011; Altun & Gulben, 2009; Kaya, 2005; Yavuz, 2005)
Jun 9, 2016 ISEI 2016 Stockholm 7
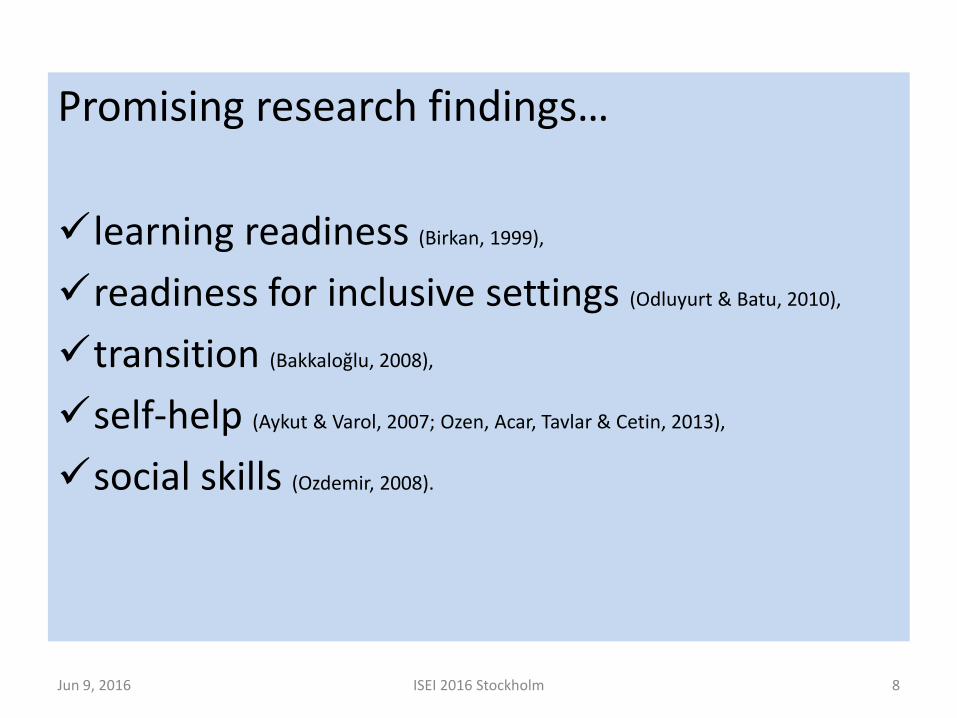
Promising research findings…
learning readiness (Birkan, 1999),
readiness for inclusive settings (Odluyurt & Batu, 2010),
transition (Bakkaloğlu, 2008),
self-help (Aykut & Varol, 2007; Ozen, Acar, Tavlar & Cetin, 2013),
social skills (Ozdemir, 2008).
Jun 9, 2016 ISEI 2016 Stockholm 8

Facts….
There are segregated and inclusive education systems are together in force in Turkey
The policy-makers and the community seem to be in favor of special settings
Inclusive practices are generally being implemented before setting the stages
Inclusion is believed to be an unsuccessful model
Currently, hundreds of young children with disabilities are placed in preschool classrooms
Jun 9, 2016 ISEI 2016 Stockholm 9

Research questions:
• Are there significant differences between the fall and the spring developmental scores of the children with and without disabilities?
• What are the predictors of the development of the participant children in inclusive preschools ?
Jun 9, 2016 ISEI 2016 Stockholm 10

Study groups
Jun 9, 2016 ISEI 2016 Stockholm 11
78 children 39 children with disabilities (CWD)
39 children without disabilities (CWOD)13 inclusive preschools / 53 classrooms
30 preschool teachers78 mothers
The CWD and CWOD were matched according to their age and gender

Jun 9, 2016 ISEI 2016 Stockholm 12
Ch
ildre
nw
ith
Dis
abili
tie
sVariables
Age Range= 39-68
X=51,9 Sd=6,68
f %
Gender Girls 16 41
Boys 23 59
Total 39 100
Diagnosis
Speech and language 9 11,5
Physical and Health 9 11,5
Hearing Impairment 4 5,1
Autism 6 7,7
Intellectual Disability 11 14,1
Total 39 100
Special Education Yes 38 97,4
No 1 2,6
Total 39 100
Special Education
Hours /Week
2 hour 23 66,52
2-9 hours 15 39,47
Table:1 Characteristics of the Children With Disabilities

Table 2: Characteristics of the Mothers and the Teachers
Jun 9, 2016 ISEI 2016 Stockholm 13
Variables CWD** CWOD***
Mothers
Age Range=23-54
X=32,49 sd*=6,60
Range=24-48
X=31,90 sd=5,51
Education
(Years)
Range=5-17
X=9,51 sd=3,5
Range=5-15
X=11,44 sd=3,14
Income
(Euro)
Range= 250-2000 E
X=771, sd= 450,07
Teachers
Age Range=23-46
X=30,62 sd=4,91
Experience
(Years)
Range=1-20
X=6,87 sd=3,87
Education Four Year College Education
*sd: Standard deviation**CWD: Children with disabilities *** CWOD: Children without disabilities
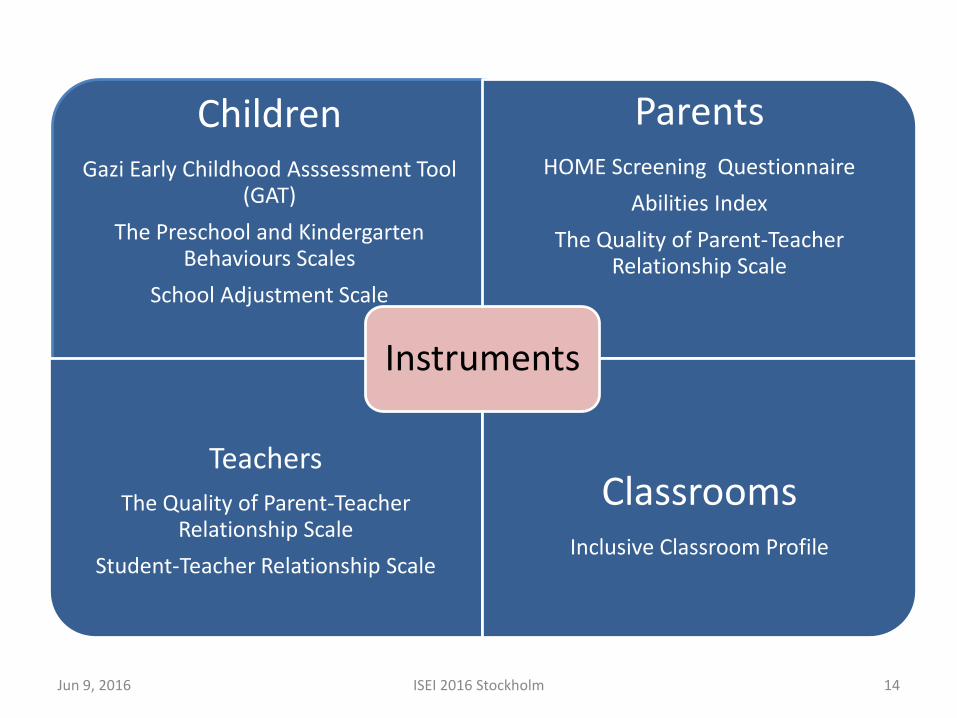
ChildrenGazi Early Childhood Asssessment Tool
(GAT)
The Preschool and Kindergarten Behaviours Scales
School Adjustment Scale
ParentsHOME Screening Questionnaire
Abilities Index
The Quality of Parent-Teacher Relationship Scale
Teachers
The Quality of Parent-Teacher Relationship Scale
Student-Teacher Relationship Scale
ClassroomsInclusive Classroom Profile
Instruments
Jun 9, 2016 ISEI 2016 Stockholm 14
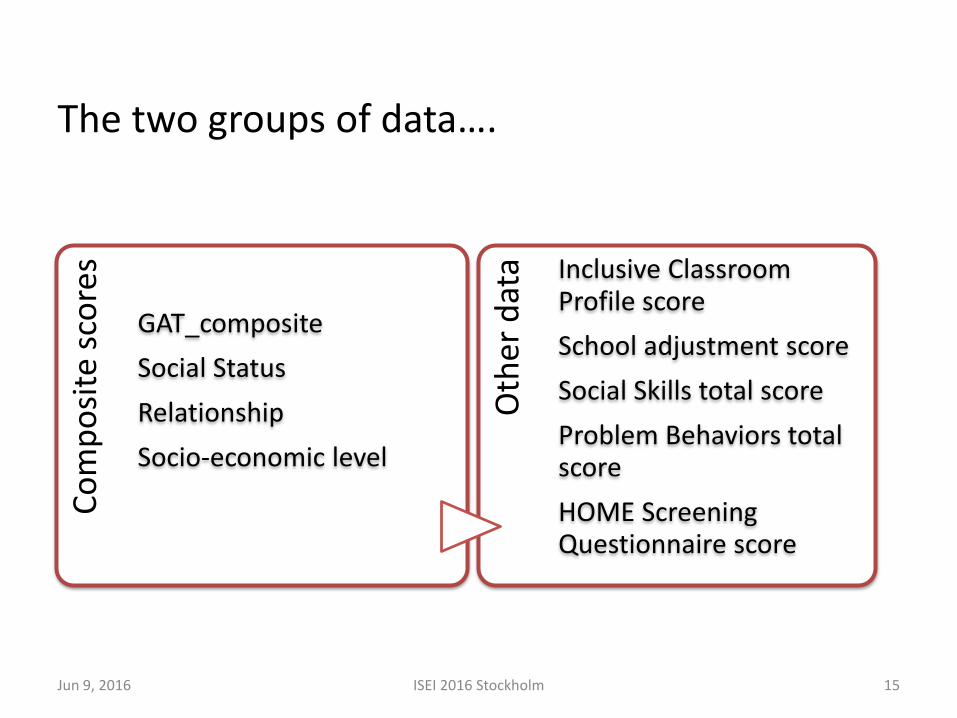
The two groups of data….
Jun 9, 2016 ISEI 2016 Stockholm 15
Co
mp
osi
tesc
ore
s
GAT_composite
Social Status
Relationship
Socio-economic level
Oth
erd
ata Inclusive Classroom
Profile score
School adjustment score
Social Skills total score
Problem Behaviors total score
HOME ScreeningQuestionnaire score

Procedure….
All data was collected two times, in the fall andin the spring of the 2015-2016 school-year.
Jun 9, 2016 ISEI 2016 Stockholm 16

Results……
Jun 9, 2016 ISEI 2016 Stockholm 17

Research question 1
Jun 9, 2016 ISEI 2016 Stockholm 18
ANCOVADependent variable: GAT_ composite spring scoresControlled variable: GAT_composite fall scores
T-TESTS FOR DEPENDENT GROUPSDependent variables:GAT_composite fall X GAT composite spring scores
Psychomotor scoresCognitive scoresLanguage scores
Socio-emotional scores

Table 3: Analysis of covariance for significant mean difference on GAT_composite spring scores among children with and without disabilities
Jun 9, 2016 ISEI 2016 Stockholm 19
GAT1_composite= The GAT fall composite score, GROUPS=CWD and CWODGAT2_composite= The GAT spring composite score, ES= Cohen d
Source
Type III Sum of Squares df Mean Square F Sig.
Partial EtaSquared
ES
GAT_fall_composite25,678 1 25,678 366,400 ,000 ,830
GROUPS
,106 1 ,106 1,507 ,223 ,020 ,43
Error5,256 75 ,070
Corrected Total40,816 77

Table 4:T-test for pre-test and post-test scores of GAT of the CWD and CWOD
Jun 9, 2016 ISEI 2016 Stockholm 20
*p<.000, **p<.05, X= mean, sd=standard deviation, ES= Cohen d valuesdf=77 for all analysis
Dependent Variables
GAT Scores of CWD GAT Scores of CWOD
Fall Spring t ES Fall Spring t ES
X sd X sd X sd X sd
Psychomotor 62,28 6,98 65,39 6,80 5,30* ,45 69,10 3,49 71,00 2,77 4,73* ,65
Cognitive 46,12 7,68 50,05 7,49 6,85* ,51 53,97 4,25 56,94 3,61 6,02* ,75
Language 50,02 7,69 53,76 5,56 6,47* ,56 56,87 2,26 57,76 1,22 2,98** ,49
Social-emotional 50,35 4,39 52,48 3,83 5,75* ,52 54,15 1,18 54,61 1,20 2,12** ,38

Jun 9, 2016 ISEI 2016 Stockholm 21
*The preschools are not prepared for the inclusive
practices
*The teachers have limited knowledge, skills and experience regarding
inclusion and CWD
Significant differences between the fall and the
spring scores forCWDand
CWOD

Research questions 2
Jun 9, 2016 ISEI 2016 Stockholm 22
Dependent variable: GAT_composite score obtained from the springsubscale scores
Independent variables
Social statusRelationships
Socio-economiclevel
(the fallcomposite
scores)
Inclusive Classroom ProfileSchool Adjustment ScoreSocial skills total scores
Problem behaviors total scoresHome Screening Questionnaire
(the fall scores)
Group(Group1:CWD)
(Group2: CWOD)

Table 5: Results of regression analysis (N=78), dependent variable: GAT_composite spring scores
Jun 9, 2016 ISEI 2016 Stockholm 23
R= 0,76 R2=0,55
Variables B Standart
HataB
𝜷 t p
Social status1.composite 0,04 0,07 0,06 0,61 0,54
Social skills.total 0,01 0,00 0,51 3,55 0,00
Problem behaviors.total 0,00 0,00 0,08 0,75 0,45
Relationship.composite -0,00 0,07 -0,00 -0,03 0,97
ICP mean scores -0,05 0,23 -0,02 -0,24 0,80
HOME.total 0,02 0,01 0,17 1,66 0,10
School adjustment.total 0,01 0,01 0,14 0,96 0,34
Group (CWD and CWOD) -0,18 0,15 -0,12 -1,15 0,25
SES1.Composite -0,18 0,07 -0,24 -2,51 0,01

Table 6: Results of regression analysis (N=78), dependent variable: Psychomotor spring scores
Jun 9, 2016 ISEI 2016 Stockholm 24
Variables B Standart
ErrorB
𝜷 t p
Social status1.composite 0,47 0,65 0,07 0,72 0,47
Social skills.total 0,10 0,04 0,38 2,59 0,01
Problem behaviors total 0,01 0,03 0,04 0,34 0,73
Relationship.composite 0,30 0,61 0,05 0,48 0,62
ICP mean scores 0,76 1,97 0,03 0,38 0,70
HOME.total 0,22 0,12 0,18 1,71 0,09
School adjustment.total 0,12 0,13 0,14 0,94 0,35
Group (CWD and CWOD) -1,72 1,34 -0,14 1,2 0,20
SES1.Composite -1,77 0,61 -0,29 2,8 0,00
R=0,72 R2=0,52

Table 7: Results of regression analysis (N=78), dependent variable: Cognitivespring scores
Jun 9, 2016 ISEI 2016 Stockholm 25
Variables B Standart HataB 𝜷 t P
Social status1.composite -0,15 0,69 -0,02 -0,22 0,82
Social skills.total 0,17 0,04 0,56 4,07 0,00
Problem behaviors.total 0,03 0,03 0,09 0,84 0,40
Relationship.composite -0,55 0,65 -0,08 0,83 0,40
ICP mean scores -0,46 2,09 -0,01 0,22 0,82
HOME.total 0,32 0,13 0,23 2,39 0,02
School adjustment.total 0,13 0,14 0,13 0,94 0,34
Group (CWD and CWOD) -2,35 1,42 -0,17 1,65 0,10
SES1.Composite -1,80 0,65 -0,25 2,75 0,00
R= 0,77 R2 =0,59

Table 8: Results of regression analysis (N=78), dependent variable: Language spring scores
Jun 9, 2016 ISEI 2016 Stockholm 26
Variables B Standart HataB 𝜷 t P
Social status1.composite 0,71 0,50 0,15 1,42 0,15
Social skills.total 0,11 0,03 0,54 3,59 0,00
Problem behaviors.total 0,02 0,02 0,12 0,96 0,34
Relationship.composite 0,01 0,47 0,00 0,02 0,98
ICP mean scores -1,06 1,52 -0,06 -0,69 0,48
HOME.total 0,15 0,09 0,17 1,56 0,12
School adjustment.total 0,05 0,10 0,07 0,49 0,62
Group (CWD and CWOD) -0,26 1,03 -0,02 -0,25 0,80
SES1.Composite -0,62 0,47 -0,13 -1,30 0,19
R= 0,71 R2 =0,50

Table 9: Results of regression analysis (N=78), dependent variable: Socio-emotional spring scores
Jun 9, 2016 ISEI 2016 Stockholm 27
Variables B Standart
HataB
𝜷 t P
Social status1.composite 0,71 0,50 0,15 1,42 0,15
Social skills.total 0,11 0,03 0,54 3,59 0,00
Problem behaviors.total 0,02 0,02 0,12 0,96 0,34
Relationship.composite 0,01 0,47 0,00 0,02 0,98
ICP mean scores -1,06 1,52 -0,06 -0,69 0,48
HOME.total 0,15 0,09 0,17 1,56 0,12
School adjustment.total 0,05 0,10 0,07 0,49 0,62
Group (CWD and CWOD) -0,26 1,03 -0,02 -0,25 0,80
SES1.Composite -0,62 0,47 -0,13 -1,30 0,19
R= 0,71 R2 =0,50

Jun 9, 2016 ISEI 2016 Stockholm 28
Social skills of the preschoolers are the most important contributor for the total development and all
developmental domains of all children
SES is the predictor of psychomotor, cognitive development and GAT_spring composite score
Group is not a predictor of the development

Jun 9, 2016 ISEI 2016 Stockholm 29