THE FACTORS AFFECTING PRODUCTIVITY AND PARENTAL … · iv ABSTRACT THE FACTORS AFFECTING...
108
THE FACTORS AFFECTING PRODUCTIVITY AND PARENTAL BEHAVIOR OF AMERICAN OYSTERCATCHERS IN TEXAS by Amanda N. Anderson, B.S. THESIS Presented to the faculty of The University of Houston-Clear Lake in partial fulfillment of the requirements for the degree MASTERS OF SCIENCE THE UNIVERSITY OF HOUSTON CLEAR LAKE December, 2014
Transcript of THE FACTORS AFFECTING PRODUCTIVITY AND PARENTAL … · iv ABSTRACT THE FACTORS AFFECTING...

THE FACTORS AFFECTING PRODUCTIVITY AND PARENTAL
BEHAVIOR OF AMERICAN OYSTERCATCHERS IN TEXAS
by
Amanda N. Anderson, B.S.
THESIS
Presented to the faculty of
The University of Houston-Clear Lake
in partial fulfillment
of the requirements
for the degree
MASTERS OF SCIENCE
THE UNIVERSITY OF HOUSTON CLEAR LAKE
December, 2014


ACKNOWLEDGEMENTS
I would first like to give thanks and love to my parents, Lisa and Eddie for their ongoing
support. You have been my rock in all circumstances and helped me persevere through
life’s obstacles. I would not be the independent, hard-working, or accomplished woman I
am today without you two. I want to recognize my brother, grandparents, and extended
family. I have always cherished our time together during my visits back home. Thanks to
my significant other, Sean Stewart for helping me get through these last few months.
To my advisor, George Guillen, thank you for your guidance, support, and the
opportunity to work on an amazing project. My intention for completing a research thesis
was to intimately study waterbirds, and you helped me do so. I would also like to thank
Jenny Oakley for providing logistical support.
To my mentor and sidekick, Susan Heath, I am immensely grateful for your
support, advice, and patience over the last two years. You taught me so much and helped
me along the path to my avian career. I admire your passion for birds and hope I’m as
bad ass as you are when I’m fifty something!
I would like to thank Felipe Chavez for his ornithological expertise and always
helping when called upon. Also, Lianne Koczur for her help with Program MARK. A
profound thanks to all the student volunteers, Ginnie Sandison, Courtney Klaus, Lauren
Aiken, Corrina Fuentes, Jessica Pebworth, Sandra Salazar and Chrystal Fretwell.

iv
ABSTRACT
THE FACTORS AFFECTING PRODUCTIVITY AND PARENTAL
BEHAVIOR OF AMERICAN OYSTERCATCHERS IN TEXAS
Amanda N. Anderson, M.S. The University of Houston Clear Lake, 2014
Thesis Chair: Dr. George Guillen The American oystercatcher (Haematopus palliatus) is considered a species of high
concern because they exhibit low and variable annual productivity. Their reproductive
success is highly sensitive to anthropogenic disturbances, predation, and weather events.
There has been extensive research on Atlantic coast populations, but until recently, little
was known about oystercatchers breeding in the Western gulf region. The objective of
this study was to summarize productivity and document factors influencing daily survival
and parental behavior. I monitored 80 breeding pairs and 144 nests during 2013 to 2014
along the Texas upper coast. Productivity was 0.51 chicks fledged per pair in 2013 and
0.59 in 2014. Variation in daily survival rates was best explained by seasonality, nest and
brood age, and the abundance of laughing gulls (Leucophaeus atricilla). Nest and brood
failures were caused by overwash, inclement weather, depredation, and starvation. I
conducted focal observations on 60 nests and 38 broods to quantify parental behavior and
determine if laughing gulls influenced their behavior. Incubation did not differ

v
significantly in the presence or absence of gulls. During chick rearing, roosting increased
significantly when nesting gulls were absent. During both reproductive periods, vigilance
increased significantly as the number of gulls increased. I calculated scaled mass indices
for oystercatcher chicks, and determined that chick mass was significantly lower as gulls
increased and when nesting gulls were present. This was the first study in the Western
Gulf to quantify American oystercatcher behavior and document the negative effects of
laughing gulls.

vi
TABLE OF CONTENTS
ACKNOWLEDGEMENTS ............................................................................................... iii
ABSTRACT ....................................................................................................................... iv
LIST OF TABLES ........................................................................................................... viii
LIST OF FIGURES ............................................................................................................ x
INTRODUCTION .............................................................................................................. 1
Shorebirds ........................................................................................................................ 1
Life history and background information ........................................................................ 1
Parental attendance .......................................................................................................... 3
Daily nest and brood survival .......................................................................................... 5
Sources of Mortality ........................................................................................................ 6
Conservation and management strategies ....................................................................... 9
American oystercatchers in Texas ................................................................................. 10
Study objectives and hypothesis ................................................................................... 11
METHODS ....................................................................................................................... 11
Study site ....................................................................................................................... 11
Field Procedures ............................................................................................................ 12
Surveys and monitoring ............................................................................................. 12
Time activity budgets ................................................................................................. 14
Laughing gull surveys ................................................................................................ 15
Capture and banding ................................................................................................. 16

vii
Statistical analysis ......................................................................................................... 17
Daily nest survival ..................................................................................................... 17
Time activity budgets and behavior ........................................................................... 19
Body condition indices............................................................................................... 21
RESULTS ......................................................................................................................... 23
Nest Survival ................................................................................................................. 23
Productivity ................................................................................................................... 25
Time activity budget ...................................................................................................... 26
Cluster analysis and Principle Component analysis ...................................................... 27
Behavior ........................................................................................................................ 29
Body condition .............................................................................................................. 30
DISCUSSION ................................................................................................................... 30
Nest survival .................................................................................................................. 30
Nest failures ................................................................................................................... 33
Brood survival ............................................................................................................... 35
Sources of chick mortality ............................................................................................. 36
Time activity budgets .................................................................................................... 37
Daily survival and laughing gulls .................................................................................. 40
Body condition and laughing gulls ................................................................................ 42
Parental behavior and laughing gulls ............................................................................ 44
Laughing gull predation ................................................................................................ 45
Management strategies for laughing gulls .................................................................... 46
Conclusions ................................................................................................................... 49
LITERATURE CITED ..................................................................................................... 52

viii
LIST OF TABLES
Table 1. Behavior categories for time-activity budgets for American oystercatchers for the incubation and chick rearing periods based on previous studies by Purdy and Miller 1988; Rave 1989; Peters and Otis 2005; Sabine et al. 2008. ..................... 59
Table 2. A predictive model evaluated with Program MARK to determine the effect of site fidelity on constant daily survival for nests’ and broods’ of American oystercatchers. ....................................................................................................... 60
Table 3. Reproductive success of American oystercatchers for Galveston Bay, Drum Bay and Bastrop Bay combined, 2013-2014. ............................................................... 61
Table 4. Number of American oystercatcher nests found in each bay system surveyed within in the study area from 2013-2014. ............................................................. 62
Table 5. The number of American oystercatcher pairs that exhibited first, second, or third re-nesting attempts and the number of nests that hatched per attempt in 2013-2014....................................................................................................................... 63
Table 6. The reasons for clutch loss for American oystercatcher nests combined, 2013-2014....................................................................................................................... 64
Table 7. Summary of model selection results from Program MARK for daily nest survival of American oystercatchers, 2013-2014. Models are ranked by ∆AICc and Wi represents model weight and K is the number of parameters. Model factors included linear (LT) and quadratic (QT) time trend, nest age (age), territory size (TSz), number of gulls (gulls) and nesting gulls (nesting). S(.) represents model only using constant daily survival......................................................................... 65
Table 8. Summary of model selection results from Program MARK for daily brood survival of American oystercatchers, 2013-2014. Models are ranked by ∆AICc and Wi represents model weight and K is the number of parameters. Model factors included linear (LT) and quadratic (QT) time trend, nest age (age), territory size (TSz), number of gulls (gulls) and nesting gulls (nesting). S(.) represents model using only constant daily survival......................................................................... 66
Table 9. Time activity budgets for American oystercatchers in relation to reproductive stage (egg or chick). Raw frequency of behaviors is also provided as proportion of time spent per behavior category for 2013-2014 combined. ................................ 67
Table 10. Attributes of American oystercatcher nests identified by cluster analysis. Nests were distinguished into three groups. The median and interquartile range of each variable are given. ................................................................................................. 68
Table 11. The results from the principle component analysis for the incubation period. The eigenvalue, cumulative proportion of variance explained, and principle component loading score are listed for each variable. Principle component loadings > 0.40 were considered significant. ........................................................ 69
Table 12. Attributes of American oystercatcher broods identified by cluster analysis. Broods were distinguished into two groups. The median and interquartile range of each variable are given. ......................................................................................... 70

ix
Table 13.The results from the principle component analysis for the chick rearing period. The eigenvalue, cumulative proportion variance explained, and principle component loading scores are listed for each variable. Principle component loadings > 0.40 were considered significant. ........................................................ 71
Table 14.The Mann Whitney results for comparing the median proportion of time spent per behavior category between successful and unsuccessful oystercatcher nests and broods. Significant difference (P < 0.05) was detected in roosting by nest fate category. Significant differences were also detected in roosting and vigilance by brood fate category. .............................................................................................. 72
Table 15. The median proportion of time spent per behavior category during the incubation period versus the absence or presence of gulls, number of gulls, absence or presence of nesting gulls, and nest fate. Significant differences were only detected in roosting by nest fate category .................................................... 73
Table 16. The Mann Whitney results for comparing the total proportion of time spent per behavior category between the presence or absence of nesting gulls. No significant differences were detected for the incubation period. Significant differences were detected for chick care, roosting, and vigilant behaviors during the chick rearing period. ....................................................................................... 74
Table 17. The median proportion of time spent in roosting, vigilant, and chick care behaviors during the chick rearing period versus brood fate and the presence or absence of nesting gulls. Significant differences were detected in vigilance and roosting by brood fate category ........................................................................... 75
Table 18. The results of the T-test analysis of scaled mass index versus the density of gulls and presence or absence of other nesting species. Scaled mass index differed significantly for all laughing gull variables. ......................................................... 76

x
LIST OF FIGURES
Figure 1. A year one hatchling and adult American oystercatcher. The hatchling is on the left and the adult on the right. Also pictured are the maroon color leg bands used during the study..................................................................................................... 77
Figure 2. Galveston Bay study area where breeding American oystercatchers were monitored. ............................................................................................................. 78
Figure 3. Bastrop and Drum Bay study areas where breeding American oystercatchers were monitored ..................................................................................................... 79
Figure 4. An American oystercatcher nest with a full clutch of eggs. .............................. 80 Figure 5. Conducting a time activity budget estimate on a breeding pair of American
oystercatchers from an adjacent reef. .................................................................... 81 Figure 6. A setup of a whoosh net and oystercatcher decoys employed to capture
American oystercatcher breeding pairs. ................................................................ 82 Figure 7. A box trap used to capture incubating American oystercatchers. ..................... 83 Figure 8a-c. Morphometric measurements taken on American oystercatcher chicks 2013-
2014. (a). unflattened wing chord length using a metal ruler. (b). culmen length using digital calipers. (c). weight measured using a digital spring scale .............. 84
Figure 9. Physical estimation of subcutaneous fat within the furculum region of American oystercatcher chicks. ............................................................................................. 85
Figure 10. Two American oystercatcher chick carcasses found in West Galveston Bay in 2014....................................................................................................................... 86
Figure 11. Nest survival of American oystercatchers using Program Mark. Daily survival rates and 95% confidence intervals were estimated from the model with the lowest ∆AICc value which incorporated a linear time trend and nest age. Day 1 of the season corresponds to 10 February. ................................................................ 87
Figure 12. Daily survival rates and 95% confidence intervals for nest survival of American oystercatchers predicted from the model incorporating the number of gulls. ...................................................................................................................... 88
Figure 13. Brood survival of American oystercatchers using Program Mark. Daily survival rates and 95% confidence intervals were estimated from the model with the lowest ∆AICc value which incorporated a quadratic time trend and the number of laughing gulls. Day 1 of the season corresponds to 10 March. ........................ 89
Figure 14. Daily survival rates and 95% confidence intervals of brood survival for American oystercatchers predicted from the model incorporating the number of gulls. ...................................................................................................................... 90
Figure 15. The frequency of various causes for agonistic behaviors exhibited by American oystercatchers during the incubation and chick rearing periods for 2013-2014. ............................................................................................................ 91
Figure 16. A dendrogram showing the classification of nests into three groups based on similarities in lay date, behavior, number of gulls, nesting gulls, and territory size. The cluster analysis method employed Euclidean distance metric and Wards linkage. All variables were standardized standardized prior to cluster analysis... 92

xi
Figure 17. A biplot depicting nest scores and rescaled loading factors of the variables incorporated into the PCA analysis for the incubation period. ............................. 93
Figure 18. A dendrogram showing the classification of broods into two groups based on similarities in chick age, behavior, number of gulls, nesting gulls, and territory size. The cluster analysis method employed the Euclidean distance metric and Wards linkage. All variables were standardized prior to cluster analysis. ........... 94
Figure 19. A biplot depicting brood scores and rescaled factor loadings for variables incorporated into the PCA analysis for the chick rearing period. ......................... 95
Figure 20. Boxplot displaying the median proportion of time spent in vigilance versus three categories of gull abundance during the nest rearing period. No significant differences were detected at the lower two gull abundances. Vigilance increased significantly when there was 100-300 gulls (H2 = 6.86, P = 0.032). .................... 96
Figure 21. Boxplot displaying the median proportion of time spent in vigilance versus three categories of gull abundance during the chick rearing period. Vigilance increased significantly between broods from all gull abundance categories (H2 = 11.11, P = 0.004). ................................................................................................. 97

Anderson 1
INTRODUCTION
Shorebirds
Research over the last few decades has indicated that North American shorebird
populations have declined for various reasons (Brown et al. 2001; Bart et al. 2007).
Shorebird reproductive success is influenced by a suite of factors including nest site
selection, food availability, predation risk, habitat disturbance, and inclement weather
(Smith et al. 2007). They also exhibit fluctuating population dynamics due to generally
low and variable reproductive rates, which makes them vulnerable to local extirpation
(Brown et al. 2001). Furthermore, anthropogenic disturbances including habitat
degradation and loss, and disturbance have negatively affected shorebird distribution and
abundance (Brown et al. 2001; McGowan and Simons 2006; Bart et al. 2007). In order to
conserve and manage shorebirds effectively for long term conservation, we need a
comprehensive understanding of the influence of biotic and abiotic factors on individual
species survival.
Life history and background information
American oystercatchers (Haematopus palliatus) have been identified as a species
of high concern by U.S. Shorebird Conservation Plan and U.S. Fish and Wildlife Service
(Brown et al. 2001; Clay et al. 2010). Oystercatchers exhibit low and variable annual
productivity, and population estimates have documented declines across the Atlantic
coast (Brown et al. 2001; Davis et al. 2001; McGowan and Simons 2006). Furthermore,
oystercatchers are highly sensitive to disturbances including human activity, predation,

Anderson 2
weather events, and habitat loss (McGowan and Simons 2006; Sabine et al. 2008). The
National Fish and Wildlife Foundation has designated oystercatchers as a keystone
species and has implemented a ten year business plan that provides resources and funding
to increase oystercatcher populations by 30% (Clay et al. 2010). Oystercatchers are
considered a keystone species because conservation efforts to protect this species will
also benefit other coastal shorebird species that utilize similar habitat (American
Oystercatcher Working Group et al. 2012).
American oystercatchers are large shorebirds (Figure 1) restricted to coastal
habitats along the Atlantic and Gulf coast of the United States and both coasts in South
America. They are the most widely distributed oystercatcher species in the Western
hemisphere with an estimated population of 11,000 in the United States (Brown et al.
2005). In the Northern hemisphere, oystercatchers are short distance migrants and breed
along the Atlantic coast from Maine to Florida and along the Gulf coast from Florida to
Mexico (American Oystercatcher Working Group et al. 2012). Their winter range
extends from New Jersey south towards the Gulf coast; and oystercatchers along the Gulf
of Mexico are thought to be non-migratory (American Oystercatcher Working Group et
al. 2012). An aerial survey across the specie’s winter range estimated 477 individuals
along the Texas coast in 2003 (Brown et al. 2005). Currently, there are no breeding
season population estimates published for oystercatchers in the Gulf of Mexico states
(American Oystercatcher Working Group et al. 2012).
American oystercatchers are long lived (10 to 15 years), monogamous shorebirds
that exhibit delayed sexual maturity (Sanders et al. 2013). They feed exclusively on
bivalves, mollusks, worms and other invertebrates inhabiting intertidal areas (American

Anderson 3
Oystercatcher Working Group et al. 2012). Foraging bouts are highly influenced by the
presence of exposed shellfish beds within intertidal areas (Sanders et al. 2013). American
oystercatchers exhibit mate and nest site fidelity. Pairs along the Texas coast begin
establishing breeding territories during January (American Oystercatcher Working Group
et al. 2012). Oystercatchers are highly territorial and often display aggressive behaviors
towards conspecifics when defending nesting and feeding territories (American
Oystercatcher Working Group et al. 2012; Spiegel et al. 2012; Borneman 2013). They are
ground nesters, and most nests in Texas are found on dredge spoil islands and shell rakes
along salt marsh edges. Along the Atlantic coast, oystercatchers also nest on open beach,
overwash flats, shell islands and dunes. Oystercatchers begin nesting as early as February
on the Gulf coast, whereas nesting begins in April along the Atlantic coast (American
Oystercatcher Working Group et al. 2012). Clutch size is one to three eggs and both
adults incubate for 27 days until hatching. If early in the season, pairs may replace failed
clutches during a single breeding season. Parents exhibit bi-parental care and semi-
precocial chicks depend on adults for food and protection until they fledge at 35 days
(Figure 1). Fledged chicks will continue to rely on adults for food provisioning for
several more months (Hazlitt et al. 2002; Thibault et al. 2010; American Oystercatcher
Working Group et al. 2012).
Parental attendance
American oystercatchers exhibit complementary sex roles and bi-parental care has
been shown to increase nest and brood survival (Collins 2012). It is hypothesized that
energetic demands are reduced when both adults invest in parental duties like incubation
and chick rearing similarly (Collins 2012). Also, bi-parental care reduces the risk of

Anderson 4
predation and permits adults to allocate additional time towards incubation and self-
maintenance (Spiegel et al. 2012). Complimentary pairs are defined as those that
coordinate roles in nest defense and rearing behaviors (Nol 1985; Collins 2012). During
incubation, adults frequently leave their nests to chase conspecifics, other bird species,
and mammals (Spiegel et al. 2012). Nol (1989) noted that when pairs encountered
predators in the presence of newly hatched chicks, one adult would stay to guard the
chicks while the other chased the predator away. She also found that as chicks aged, both
adults would exhibit anti-predator behaviors toward potential predators and territorial
displays towards other oystercatchers.
Reproductive success for avian species is influenced by the allocation of their
time and energy into parental behavior (Hazlitt 2001; Palmer et al. 2001; Spiegel et al.
2012). The proportion of time adults spend incubating depends on their physiological
condition, seasonality, predation risk, temperature, and food availability (Palmer et al.
2001; Spiegel et al. 2012). Activity around the nest also influences nest survival
(McGowan and Simons 2006; Smith et al. 2007). Specifically, higher nest success was
associated with birds taking fewer trips on and off the nest (McGowan and Simons 2006;
Smith et al. 2007). McGowan and Simons (2006) argued that more nest activity cues
predators onto the nest location. During chick rearing, brood success has been shown to
be positively related to the amount of chick provisioning and chick guarding activity.
(Groves 1984; Nol 1989; Thibault et al. 2010).
Additional factors including territory quality, food availability, and size and
distance to foraging areas have also been shown to influence oystercatcher brood success
(Nol 1989; Ens et al. 1992; Thibault et al. 2010). Nol (1989) and Hazlitt (2001)

Anderson 5
suggested that optimal territory used by oystercatchers would allow an adult to be
vigilant over their nesting territory while foraging simultaneously. Oyster reef exposure
also influences provisioning rates. During low tides, McGowan and Simons (2006) found
adults allocated more time towards foraging and locomotive behaviors. Hazlitt and Butler
(2001) suggested that breeding pairs exhibiting site fidelity over multiple years and
establishing breeding territories early in the season, may indicate high quality territory
exists in the area that likely lead to higher reproductive success.
Daily nest and brood survival
Studies have demonstrated that daily nest and brood survival is influenced by the
date of nest initiation, and that daily survival decreases as the breeding season progresses
(Tjørve and Underhill 2008; Murphy 2010; Smith and Wilson 2010; Schulte 2012;
Koczur 2013). A decline in nest survival over time may be explained by seasonal weather
events and changes in temperature, food availability, human disturbance and predator
activity (Ruthrauff and McCaffery 2005; Colwell et al. 2007; Schulte 2012). Semi-
precocial young are particularly vulnerable to predation, starvation, and weather events
within two weeks of hatching (Colwell et al. 2007; American Oystercatcher Working
Group et al. 2012; Schulte 2012). Schulte (2012) and Hazlitt and Butler (2001)
determined that oystercatcher chick mortality was the highest within the first week of
hatching. Nest and brood age also affects daily survival rates. However, different studies
have reported conflicting results where daily survival was found to be positively or
negatively related to age (Colwell et al. 2007; Smith and Wilson 2010; Koczur 2013).

Anderson 6
Sources of Mortality
Shorebird reproductive success and survival are influenced by a combination of
factors including weather, resource availability, predators and anthropogenic disturbances
(Peters and Otis 2005; McGowan and Simons 2006; Sabine et al. 2006). Researchers
predict that waterbirds increase energy expenditure in response to human disturbance;
which may consequently effect an individual’s fitness (Peters and Otis 2005; Borgmann
2010). Human activity has been found to displace birds, cause mortality, reduce nesting
habitat, alter behavior, and influence reproductive success (Burger and Gochfeld 1991;
Brown et al. 2001; Borgmann 2010; Borneman 2013). American oystercatchers breed
along coastal areas that are heavily influenced by human recreational activity, which is
known to negatively affect reproductive success and alter behavior of oystercatchers
along the Atlantic coast. (Davis et al. 2001; Peters and Otis 2005; McGowan and Simons
2006; Sabine et al. 2006; Sabine et al. 2008). Specifically, human disturbance has
resulted in higher nest failure and chick mortality rates, and reduced incubation and brood
attendance of oystercatchers along the Atlantic coast (Davis et al. 2001; McGowan and
Simons 2006; Sabine et al. 2006). Furthermore, disturbance is linked to reduced foraging,
roosting, and nest attendance, as well as; increased vigilance, flushing, and anti-predator
defenses (Burger and Gochfeld 1991; Verhulst et al. 2001; Traut and Hostetler 2003;
Peters and Otis 2005; McGowan and Simons 2006; Borneman 2013).
Several studies found incubation and foraging time decreased with frequent
human activity near nest sites and foraging areas (Verhulst et al. 2001; Sabine et al.
2008). High human activity near nests has resulted in lower nest attendance and higher
probabilities of depredation because nests’ are left unattended more often and flushed

Anderson 7
adults may cue predators onto the nest (McGowan and Simons 2006; Sabine et al. 2006).
During foraging, chick provisioning rates decreased as the human disturber moved closer
to adults (Verhulst et al. 2001). Although human disturbance is associated with lower
reproductive success and altered oystercatcher behavior, there is limited evidence
showing that humans are the direct cause for the species’ decline (McGowan and Simons
2006). Researchers do not yet have a definitive quantitative understanding of the
mechanisms that determine the influence of human presence on reproductive success
(Peters and Otis 2005; McGowan and Simons 2006; Sabine et al. 2006). Besides
anthropogenic disturbances, weather events and interaction with predators and competing
avian species also influences oystercatcher productivity.
Predation has been the primary cause for nest failures where the sources of nest
lost could be determined (Sabine et al. 2006; Schulte 2012; Denmon et al. 2013). Avian
predation by raptors (Falconiformes spp.), fish crows (Corvus ossifragus), boat-tailed
grackles (Quiscalus major) and gulls (Larus spp.) typically results in egg loss (Verboven
et al. 2001; Sabine et al. 2006; Schulte 2012; Denmon et al. 2013). However, quantitative
data is lacking on the relative frequency and importance of avian predation events
(Verboven et al. 2001; Sabine et al. 2006; Schulte 2012; Denmon et al. 2013).
Mammalian predators like raccoons (Procyon lotor), feral cats (Felis catus), foxes
(Vulpes vulpes), and mustelids (Mustelidae spp.) also feed upon eggs and chicks
(McGowan and Simons 2006; Sabine et al. 2008; Schulte 2012). Researchers hypothesize
that the frequency of predation by some mammal species (e.g. raccoons and feral cats)
may be positively correlated with human activity (McGowan and Simons 2006; Sabine et
al. 2008; Schulte 2012).

Anderson 8
Inundation, also referred to as “overwash” of nesting sites during storm and high
tide events is another major cause of nest failure (Sabine et al. 2006; Spiegel et al. 2012;
Denmon et al. 2013). Strong storm events have been documented to eliminate most
active nests during a breeding season (Schulte 2012).
Several studies have documented interspecific interactions between oystercatchers
and gull species that affected reproductive success and food intake. Kleptoparasitism is a
feeding strategy that various gull species exhibit that occurs on oystercatcher winter
foraging sites (Martínez and Bachmann 1997; Tuckwell and Nol 1997; Khatchikian et al.
2002). Tuckwell and Nol (1997) found that kleptoparasitism occurred more often as the
number of gulls increased. Additionally, oystercatchers foraged on smaller mussels and
their intake rate decreased as gulls increased (Tuckwell and Nol 1997). Egg and chick
predation by gulls is known to occur when oystercatchers nest near breeding gull colonies
(Harris and Wanless 1997; Hazlitt 2001). Black oystercatchers (H. bachmani) that
occupied territories adjacent to gull colonies had a smaller mean clutch size versus those
nesting in territories with no gulls (Hazlitt 2001).
As an obligate coastal species, American oystercatcher habitat is threatened by
coastal development and sea level rise. Wintering and breeding oystercatchers may be
limited by habitat loss and degradation as a result of these threats (Clay et al. 2010).
Coastal development has resulted in the direct loss of habitat (American Oystercatcher
Working Group et al. 2012). Sea level rise is expected to have long term negative effects,
and may reduce low lying coastal habitats used by breeding and wintering oystercatchers
(Clay et al. 2010; American Oystercatcher Working Group et al. 2012). Additionally,
storm events may increase with climate change, thus affecting barrier islands and

Anderson 9
increasing overwash events (Clay et al. 2010). There is evidence that oystercatchers are
shifting away from traditional nesting sites; and expanding their breeding range further
north as the habitat changes (American Oystercatcher Working Group et al. 2012). For
example, along the Atlantic coast there has been a decrease in barrier island nesting, and
increase in dredge island and salt marsh nesting (Lauro and Burger 1989; American
Oystercatcher Working Group et al. 2012). The shift between nesting habitat may also be
attributed to greater predator abundance on barrier islands (McGowan and Simons 2005).
Conservation and management strategies
The American Oystercatcher Working Group and the American oystercatcher
Conservation Plan have recommended multiple conservation strategies and actions for
the species (Clay et al. 2010; American Oystercatcher Working Group et al. 2012). These
include 1) identifying and conserving key wintering and breeding sites, along with crucial
habitats and food resources used throughout the specie’s range, 2) identifying potential
habitat that may be utilized by oystercatchers in the future, 3) reducing or eliminating
human disturbance and predators within protected areas before and during the breeding
season to conserve and increase oystercatcher population, 4) monitoring population status
and trends in order to evaluate the effectiveness of management strategies and 5)
conservation and resource management entities must promote public education and gain
public, state and federal support in implementing strategies.
As a long-lived species, oystercatchers exhibit highly variable but generally low
reproductive rates (Davis 1999; Sabine et al. 2006; Schulte 2012). Therefore,
oystercatchers would likely not recover quickly from significant population declines.
Population viability is influenced by delayed maturity, juvenile recruitment, site fidelity

Anderson 10
and regional factors (Davis et al. 2001; American Oystercatcher Working Group et al.
2012; Schulte 2012). It is difficult to determine the population status and whether
survival and recruitment rates will sustain existing populations into the future. Juvenile
recruitment strongly influences long term population dynamics; therefore, there is a
critical need for monitoring and determining survival rates of post fledglings (Davis
1999; American Oystercatcher Working Group et al. 2012). Breeding attempts often fail
during the chick rearing stage, but researchers have found it difficult to determine the
cause and timing of chick mortality (Sabine et al. 2006; Schulte 2012). More research is
needed to understand how various factors like chick age, habitat quality, disturbances,
and parental behavior affect chick survival (Schulte 2012).
American oystercatchers in Texas
The Texas Parks and Wildlife Department considers American oystercatchers to
be a priority species. The Gulf Coast Bird Observatory (GCBO) began investigating the
status of oystercatchers along the Texas coast in 2011 through a grant from the National
Fish and Wildlife Foundation. This project includes color banding, nest monitoring,
observing movement patterns, and identifying threats to the Western Gulf population.
Based on initial observations, Dr. Susan Heath has documented multiple causes for nest
failures including overwash, chick starvation, and predation by mammals and laughing
gulls (Leucophaeus atricilla). The estimated productivity along the upper coast for the
previous 2011-2012 was 0.78 chicks fledged per pair, 0.20 chicks fledged per pair (S.
Heath pers. commun.). Low productivity in 2012 was attributed to multiple high tide
events that overwashed many nests and chicks. Furthermore, limited food availability as a
result of little reef exposure during high tide events, consequently led to chick starvation.

Anderson 11
There are indications that Texas oystercatchers exhibit high site fidelity because ca. 85%
of the birds banded in 2012 were present in the 2013 field season (S. Heath pers.
commun.).
Study objectives and hypothesis
The primary objective of my study included evaluating the influence of selected
variables on 1) American oystercatcher productivity and 2) parental behavior. First, I
aimed to summarize the productivity of American oystercatchers in 2013 and 2014
breeding seasons. Secondly, I hypothesized that the variation in nest and brood success
was influenced by 1) timing of nest initiation, 2) laughing gull density, 3) parental
behavior, and 4) territory size. Lastly, I hypothesized that parental behavior and chick
body condition was negatively influenced by the number of laughing gulls and the
presence of nesting laughing gulls.
METHODS
Study site
This study was conducted along the upper Texas coast in West Galveston Bay,
Bastrop Bay and Drum Bay (Figure 2-3). The region contains numerous dredge spoil
islands, natural estuarine islands, salt marshes, and intertidal oyster reef. There is
significant human development and high recreational activity along Galveston Island and
Follets Island. The Gulf Intracoastal Waterway (GIWW) also runs through the study area.
Numerous barges, tug boats, and recreational vehicles use the GIWW.
The primary nesting substrate for the American oystercatcher in Texas is shell
hash located on various islands. Intertidal oyster reefs, primarily consisting of Eastern

Anderson 12
oysters (Crassostrea virginica) occur throughout the adjacent shallow bays and provide
foraging habitat for oystercatchers. The dominant vegetation along the fringe and interior
portions of these islands consists of smooth cordgrass (Spartina alterniflora), saltwort
(Salicornia spp.), and sea ox-eye daisy (Borrichia frutescens). Other nesting colonial
waterbird species commonly observed within the study sits include laughing gulls, brown
pelicans (Pelecanus occindentalis), tern species (Laridae spp.), and heron species
(Ardeidae spp.). Potential nest predators within the region include laughing gulls,
raccoons, opossum (Didelphis virginiana) feral cats, coyotes (Canis latrans), raptors, and
Western diamondback rattlesnake (Crotalus atrox). Small dredge spoil islands also
experience overwash during high tide and storm events. Many of the islands are easily
accessible to recreational boaters and fishermen.
Field Procedures
Surveys and monitoring. The study period extended from February to August in
2013 and 2014. Surveying and monitoring occurred twice a week in West Galveston Bay
and once a week in Drum Bay and Bastrop Bay. I monitored nests to estimate breeding
pair distribution, survival, and productivity. I conducted nest surveys from February to
June to locate breeding pairs and nests. Monitoring continued through July until all
surviving chicks had fledged. The surveying and monitoring was conducted by boat and
birds were observed with 10 x 42 binoculars. I attempted to locate and observe every
oystercatcher nest within the study area. I initially located incubating adults and those
exhibiting defensive behaviors, and then searched the areas by foot to locate nests (Figure
4). Nest location was determined with a handheld global positioning system (GPS). I also
recorded the adult color bands, egg number, and date found. I numbered eggs with a non-

Anderson 13
toxic sharpie in order to determine whether there were newly laid eggs or eggs
disappeared over the life of the nest. If the nest contained < 3 eggs, I checked the nest in
the following visit to verify final egg number. I restricted time within nesting territories
to less than 10 minutes.
I revisited nests again in subsequent weeks to verify whether the nest was active
or had failed. Nests were considered active if I observed a bird incubating. If neither adult
was incubating or displayed defensive behaviors before the estimated hatch date, I
verified whether the nest had failed and attempted to determine the cause of failure.
Evidence of nest failure included absence of eggs, unviable or cracked eggs, overwash of
nesting area, and nest scrape disturbance.
I also employed motion activated game cameras and continuous video monitoring
at ca. 15% of nests to document avian or mammalian predation. Camera monitored nests
included those located on the mainland or islands accessible to predators, or nests
surrounded by nesting gulls. If the nests failed, Dr. Heath reviewed the pictures and video
to confirm the predation event. I used an incubation period of 27 days to estimate hatch
date (American Oystercatcher Working Group et al. 2012) and those that hatched, were
considered successful nests’. Evidence of a successful nest included direct observation of
chicks or adults carrying food items within the territory. If this evidence was not
observed, I approached the nesting area to search for chicks. If adults exhibited defensive
behaviors such as flying and triple alarm calling, I assumed chicks were present and left
the area to prevent further disturbance. I continued to monitor chicks after hatching and
considered a chick successful if it survived to 35 days or when capable of sustained flight
(American Oystercatcher Working Group et al. 2012). I considered a brood unsuccessful
Anderson 14
if chicks were found dead before 35 days of age, adults did not exhibit defensive
behaviors at the hatching date, or chicks were not seen for ≥ 2 weeks before they were
capable of sustained flight.
Time activity budgets. I conducted behavioral observations of adult pairs during
the incubation and chick rearing periods. Each focal animal observation or Time Activity
Budget (TAB) consisted of a twenty minute sampling period, in which I recorded a
behavior every fifteen seconds. Observation sessions occurred from land if possible or by
boat when necessary using binoculars and a 20 x 60 spotting scope (Figure 5). I
attempted to observe both adults simultaneously, but if an adult went out of sight for five
consecutive minutes, I discontinued the observation period on that adult. I continued to
observe the other adult unless it too went out of sight for greater than five minutes. I
monitored pairs across three diurnal temporal blocks: morning (8:00-10:30), mid-day
(10:30-13:00), and late afternoon (13:00-15:30). I conducted observations at a minimum
of 50 m away, and moved further away if I suspected observer disturbance based on
changes in bird behavior (Rave and Baldassarre 1989; Thibault et al. 2010). I did not
randomly sample pairs because of logistical and time constraints. The opportunity to
observe pairs depended on tide levels, weather, access to islands, and observation points.
Also, the pairs I selected to observe in a single day depended on which time block a pair
needed to be observed in, and whether the nest or brood was still active. In most
instances, I did not complete consecutive observations on a pair within a single day. I
completed TABs on as many nests as possible during the incubation period, and
attempted to observe every pair with chicks due to small sample size and unpredictability
of chick survival.
Anderson 15
I documented twenty-one behaviors for the incubation and chick rearing periods,
and defined and categorized behaviors based on previous studies by Purdy and Miller
1988; Rave 1989; Peters and Otis 2005; Sabine et al. 2008. I categorized behaviors into
the following for both reproductive periods: incubation (i.e., incubating-roosting,
incubating-vigilant, shading eggs), self-maintenance (i.e., preening, bathing, stretching,
bill dipping), rest (i.e., roosting, standing, laying), forage (searching, probing, handling),
locomotion (i.e., flying, walking, running), vigilance (i.e. standing-vigilant, laying-
vigilant), agonistic (i.e., agonistic, fly-agonistic, walk-agonistic, run-agonistic), and chick
care (i.e. brooding, chick feeding) (Table 1). Intra and interspecific interactions
frequently caused oystercatchers to exhibit agonistic and vigilant behaviors. When this
occurred, I coded the causes of these behaviors as laughing gulls, other oystercatchers,
other bird species, humans, or observer.
Laughing gull surveys. I monitored and inventoried laughing gulls (hereafter
gulls) in order to determine whether they affected oystercatcher parental behavior and
reproductive success. I recorded the occurrence of nesting gulls and estimated the number
of loafing and nesting gulls within the areal extent of what I considered an
oystercatcher’s nesting territory. Territory was defined as an area of shell hash and/or
adjacent intertidal area in which there was evidence of reproductive activities and defense
by a single oystercatcher pair (Hazlitt 2001; Steenhof and Newton 2007). I considered
entire islands, such as small dredge spoils that were occupied by a single breeding pair as
a territory.
I was able to conduct direct nest counts in small gull colonies (≤ 30 nests) to
compare with my count of individuals. However, direct nest counts were not feasible in
Anderson 16
large colonies because it disturbed not only gulls, but other nesting species. Areal surveys
were conducted in which I counted all gulls occupying foraging territory, shell hash
within a nesting territory, and those 10 m from the shell hash/vegetation line.
Gulls were counted when an oystercatcher nest was found, when it hatched or
when a nest or brood failed. Gulls were also counted during a TAB. Gulls were counted
by two observers, Dr. Heath and I on all occasions. I used the average of these counts as
my estimate of gull density. In several cases I neglected to count gulls for a nest or TAB.
To avoid removing them from the data set, I used the average of all gull counts I recorded
throughout the season for that nest and TABs. I also identified whether gulls were nesting
when an oystercatcher nest was found and at hatch or failure.
I utilized ArcGIS (ESRI 2010) to spatially depict data collected in the field and
determine the size of oystercatcher nesting territories. I digitized the observed nesting
territory data collected in the field on aerial overlays of the survey area to determine the
area (ha) of nesting territory and assess whether nesting territory size is related to
reproductive success.
Capture and banding. The American Oystercatcher Working Group initiated a
color banding program in 1999 to learn about demographics, movement patterns, and
habitat requirements of the birds. The working group maintains a database for researchers
to enter and search for records of banded oystercatchers. Each state participating in the
banding program is represented by a unique color leg band so researchers can determine
where the oystercatcher was banded. I used U.S. Geological Survey stainless steel leg
bands and PVC maroon color bands with unique alphanumeric codes for each bird
(Figure 1). I attempted to band every chick that survived to 25 days, with a preferred age

Anderson 17
of 30 to 35 days. I captured adults by employing a whoosh net in combination with
oystercatcher decoys and recorded vocalizations (Figure 6). I also employed a box trap to
capture incubating adults (Figure 7). I captured chicks by hand or with a hand net. During
banding, I took morphometric measurements of each chick. I used digital calipers to
measure culmen to the nearest millimeter, a metal wing ruler to measure unflattened wing
chord length to the nearest millimeter, and a digital spring scale to measure weight in
grams (Figure 8a-c). I physically estimated subcutaneous fat within the furculum region
and assigned a fat score ranging from 1 to 5 (Meissner 2009) (Figure 9). A score of
1indicated small traces of fat and very concave, while 5 indicated fat filling the entire
furculum region and convex (Meissner 2009). I re-sighted banded birds during the entire
study period to record survival, habitat use, and breeding pair fidelity.
Statistical analysis
Daily nest survival. Previous studies have used the Mayfield method for
determining apparent nest survival, in which nest survival was the proportion of
successful nests to unsuccessful nests (Dinsmore et al. 2002). This method assumes that
successful and unsuccessful nests are found with equal probability; however, true nest
survival is overestimated when failed nests go undetected, and the timing of hatch or loss
may not be determined exactly (Dinsmore et al. 2002). Many ornithological studies now
use Program MARK to model daily survival rates of nests’ and broods’ as a function of
yearly and seasonal variation, nest age, and other covariates (Dinsmore et al. 2002). I
used Program MARK to determine daily nest and brood survival for oystercatchers
(White and Burnham 1999; Dinsmore et al. 2002). The daily survival rate (DSR) is
calculated from nest observation days and the time of failure is assigned to an interval of

Anderson 18
observation days so the exact failure date is not needed. Daily survival is the likelihood of
a nest surviving one day. The nest survival model requires five pieces of information for
each nest. They include: 1) the day the nest was found, 2) the last day the nest was
checked alive, 3) the last day the nest was checked, 4) the fate of the nest (0 = successful,
1 = failed), and 5) the number of nests that were successful or failed. In the case of brood
survival, the day the nest hatched, the last day a chick was seen alive and checked, and
the fate of the chick were used in the analysis. I standardized the days within the breeding
season, in which Day 1 represented the first day a nest was found and the first day a nest
hatched. I used a 27 day incubation period and considered a nest to be successful if at
least one egg hatched. Brood survival was the probability of at least one chick in a brood
surviving to 35 days.
Program MARK allows temporal variation and individual covariates to be
incorporated into candidate nest survival models. Program MARK builds and evaluates
competing models of DSR using Akaike’s Information Criteria (AIC). I used the
Akaike’s information criterion for small samples (AICc) to determine the best fitting
model for daily nest and brood survival (Burnham and Anderson 2002). I considered
models with ∆AICc values < 2 to be top competing models (Burnham and Anderson
2002). Model covariates whose 95% confidence limits did not include zero were
considered statistically significant results.
First, I ran a simple model of constant daily nest survival. Constant daily survival
(S.) is the default model in which DSR is assumed to be constant across all nests and all
dates. Next, I incorporated temporal variation by modeling the main effects of a linear
(LT) and quadratic (QT) time trend on DSR. The linear time was used because daily

Anderson 19
survival typically decreases across the nesting season (Dinsmore et al. 2002). A quadratic
time trend reflects a bimodal pattern that occurs with re-nesting (Dinsmore et al. 2002).
Lastly, I added covariates to the best temporal model. From the linear model, parameter
estimates are constrained to be linear functions of covariates. I hypothesized there were
several covariates explaining the variation in nest and brood success and they included
the following: territory size, number of gulls, presence or absence of nesting gulls, and
nest and brood age. The number of gulls I counted at lay and hatch were used as the gull
number covariate.
I modeled site fidelity with constant survival to determine if nest and brood
survival differed when one or two adults occupied a territory for two consecutive years.
Site fidelity was modeled separately because many birds are unbanded, and nests’ with an
unbanded adult would have to be excluded from the main analysis incorporating the time
trend and individual covariates. I assigned nests and broods to one of two groups for site
fidelity (Table 2).
Time activity budgets and behavior. I used Mann-Whitney and Kruskal-Wallis in
Minitab® statistical package to examine differences in frequency of behaviors under the
influence of four variables including 1) number of gulls, 2) absence or presence of gulls,
3) absence or presence of nesting gulls and 4) nest fate. Nest fate was categorized as fail
or hatch and brood fate was no fledge or fledge. I created two classification schemes for
gull density that were used to evaluate the influence of this variable on nest and chick
rearing behaviors. First, I created class intervals of gull densities following Sturges
(1926) method and displayed the class intervals in histograms. The histograms were
asymmetrical, so I manipulated the category bins until there was a closely symmetrical

Anderson 20
distribution of categories. The gull categories for incubation were (0-75 - low, 76-300 -
high) and (0-49 - low, 50-99 - medium, 100-300 - high). The gull categories for chick
rearing were (0-60 - low, 61-230 - high) and (0 - low, 1-40 - medium, 41-230 - high).
I examined differences in median values of behaviors for nest fate, presence or
absence of gulls, and the various gull abundance classes using Mann-Whitney or
Kruskal-Wallis. If significant differences were detected, the Dunn’s multiple
comparisons analysis was conducted to determine which group was different. I examined
the incubation and chick rearing periods separately and each bird was considered a
sample. I analyzed the proportion of time spent per behavior category by totaling the
individual behaviors comprising a category for each sample (Table 1). To avoid a
preponderance of zeros, I excluded the incubating adult when analyzing non-incubating
behaviors and the non-incubating adult when analyzing incubation. I used Kruskal-Wallis
and Mann-Whitney to determine if behaviors differed between time of day (morning,
mid-day, afternoon) and chick age (1 to 20 days, 21 to 45 days). I used a histogram to
categorize chick age and manipulated the category bins until there was a symmetrical
distribution of chick ages. I considered P < 0.05 to be significant.
I utilized cluster analysis (CA) to group nests and broods based on similarity in
lay date, chick age, behavior, number of gulls, nesting gulls, and territory size. The CA
method used the Euclidean distance metric and Wards linkage method. All variables were
standardized prior to cluster analysis. After classification, I generated median values of
the variables for each group which was determined by CA.
I also utilized principle component analysis (PCA) to construct linear
combinations of these variables to assess the relative importance of the variables and
Anderson 21
identify those that explained the majority of differences between cluster groupings. I
plotted the distribution and median values of these components, and then examined the
loading and score biplots to determine if any patterns were associated with the groupings.
I considered principle component loadings > 0.40 to be significant based on
recommendations by McGarigal et al. 2000.
Body condition indices. I calculated scaled mass indices for oystercatcher chicks
banded in 2013-2014 to determine if the presence of gulls explained variation in body
condition. Many researchers have stated that body condition is a measure of the energetic
reserves available for use by individuals in their daily processes (Colwell et al. 2007;
Tjørve and Underhill 2008; Virzi 2008; Smith and Wilson 2010). Condition indices are
calculated to reflect the health of an individual. A commonly used index is body mass,
but mass is not independent of structural size. In order to separate mass of nutrient
reserves from structural components, body mass is scaled to a structural measurement to
remove size related variation (Colwell et al. 2007; Virzi 2008; Smith and Wilson 2010).
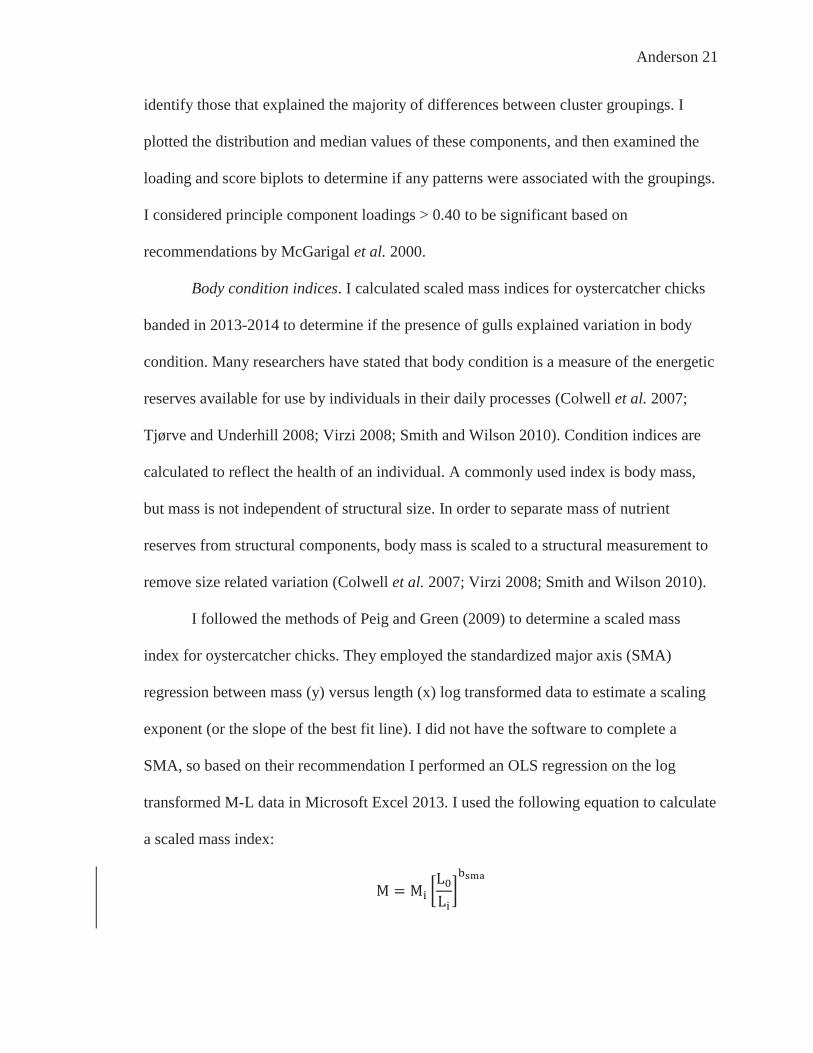
I followed the methods of Peig and Green (2009) to determine a scaled mass
index for oystercatcher chicks. They employed the standardized major axis (SMA)
regression between mass (y) versus length (x) log transformed data to estimate a scaling
exponent (or the slope of the best fit line). I did not have the software to complete a
SMA, so based on their recommendation I performed an OLS regression on the log
transformed M-L data in Microsoft Excel 2013. I used the following equation to calculate
a scaled mass index:

Anderson 22
where Mi and Li are the body mass and linear body measurements of individual i;
bsma is the scaling exponent; L0 is the arithmetic mean value of L for the study population,
and M is the predicted body mass for the individual. The scaling exponent (bsma) was
calculated by dividing the slope from the OLS regression by the Pearson’s r correlation
coefficient. I used the Pearson’s correlation method in Minitab® statistical package to
determine if bill or wing was more correlated with weight. Wing length was more
correlated with weight (r = 0.594 vs. r = 0.509).
I used independent, two-tailed T-tests in Minitab® statistical package to quantify
the effects of gulls on scaled mass indices. The variables I examined included the absence
or presence of nesting gulls and number of gulls. I analyzed several categories of gull
numbers to determine if a threshold was evident. I categorized gull numbers into absent
(0 gulls), present (> 0 gulls), a low number of gulls (0-20; 0-40), and a high number of
gulls (21-140; 41-140). I also used a T-test to determine whether the presence or absence
of other nesting bird species on oystercatcher territory explained variation in mass
indices. I considered test results significant if P < 0.05. Prior to conducting the T-test, I
tested the data set for normality and outliers using the Anderson-Darling and Grubbs
tests’. I tested for equal variances between groups using Levene’s test and assumed equal
variances if P > 0.05. Since oystercatcher chicks were banded at various ages, I used the
Tukey’s test to determine if mass indices differed significantly between two age classes
(23 to 32 days) and (33 to 42 days). I used histograms to categorize chick age and
selected two categories that closely resembled a symmetrical distribution.

Anderson 23
RESULTS
Nest Survival
I monitored 80 breeding pairs and 144 nests during the two year study
period (Table 3). Seventy-eight percent of nests (n = 113) were located in Galveston Bay
and the remaining 22% of nests (n = 31) were located in Drum and Bastrop Bays (Table
4). Fifty-six percent (n = 81) of nests were first nest attempts, and 44% (n = 63) were re-
nest attempts. The majority of pairs only made one re-nest attempt (n = 46) and the
percent of nests that hatched decreased as the number of re-nest attempts increased
(Table 5). Clutch size ranged from 1-3 eggs and the average clutch size was 2.4 (n = 126
clutches of known size). Average clutch size for first nest attempts was 2.6 (n = 76) and
lower for re-nests at 2.06 (n = 50). A nesting attempt was defined as a nest with at least
one egg. In cooperation with Dr. Susan Heath, I banded a total of 54 oystercatchers; 20
adults and 44 chicks (USGS band permit 23712; UHCL IACUC 12.008.R1).
The nesting season, from first nest initiation to last nest hatched or last nest or
brood failure, was 142 days in 2013. I found the first nest on 27 February 2013 and the
last nest on 1 June 2013. The mean nest initiation date was 11 April 2013. The nesting
season was 148 days in 2014. I found the first nest on 10 February 2014 and the last nest
on 23 June 2014. The mean nest initiation date was 8 April 2014.
The mean nest initiation for first nest attempts in 2013 was 25 March and earlier
in 2014 (20 March). The majority of first nest attempts were initiated in March for both

Anderson 24
study years. The mean nest initiation for re-nest attempts in 2013 was 11 May and earlier
for 2014 (7 May). The majority of re-nest attempts occurred in May for both study years.
Eighty nests failed in 2013-2014 combined. I could not identify the cause of
failure for 47.25% of nests (Table 6). Known and unknown predation events accounted
for 30.99% of nest failures. Known depredation events were those verified by motion
activated camera or video monitoring and included feral cat, gull, and coyote. Unknown
predation events were not captured on camera and I assumed a predation event had
occurred based on evidence within the nesting area (i.e. digging in nest scrape, cracked
egg near nest cup, rattlesnake presence). Overwash and weather related causes accounted
for 21.13% of failures. I predicted that approximately 5% of nest failures were related to
human disturbance. For example, I observed oystercatchers not incubating when a wade
fisherman or boat approached the nesting site, consequently leaving the eggs vulnerable
to weather and predation.
I estimated hatching success to be 40% (n = 57). Hatching success was defined as
at least one egg hatched (American Oystercatcher Working Group et al. 2012). As
previously stated, daily nest survival is defined as the likelihood of a nest surviving one
day. Constant daily nest survival was 0.968 (SE 0.003). The probability of nest survival
to hatching during the 27 day incubation period was 0.418 (SE 0.003).
Variation in nest survival was best explained by a linear time trend plus the
additive effect of nest age (Table 7). As the nesting season progressed and nests’ aged,
daily survival rates decreased (Figure 11). The next best model included the additive
effects of the remaining covariates (< 2 ∆AICc) (Table 7). Survival was a function of the
number of gulls, territory size, and the presence of nesting gulls, but support for the

Anderson 25
covariates was weak (95% confidence intervals overlapped zero). Daily survival rate
decreased with increasing territory size (βi = -0.085, CL = -0.419, 0.248). Daily survival
rate decreased as the number of gulls increased (Figure 12). When nesting gulls were
present, daily survival increased (βi = 0.178, CL = -0.384, 0.739)
When survival was held constant, daily survival was higher when one adult rather
than two occupied the same territory for two consecutive years, but support was
statistically insignificant (βi = 0.162, CI = -0.398, 0.721).
Productivity
Productivity was 0.51 chicks fledged per pair in 2013 and 0.59 chicks fledged per
pair in 2014 (Table 3). Forty-four chicks fledged from the 54 broods I monitored across
2013-2014. The percentage of clutches that fledged chicks in 2013-2014 was 43.5%. The
majority of pairs fledged one chick (n = 20), while 9 pairs fledged two chick broods, and
2 pairs fledged three chick broods. The number of pairs fledgling a chick was greater in
the absence of nesting gulls (n = 26) versus in the presence of nesting gulls (n = 6).
Overall, first nest attempts were more frequently (n = 26) successful (fledged ≥1 chick)
compared to re-nest attempts (n = 6). In both seasons, 7 pairs re-nested after brood loss
and one of these pairs fledged a chick. Re-nest attempts were initiated when broods were
lost at 3 to 11 days old.
I could not document many causes of chick mortality. I was able to find 4 chick
carcasses, and Figure 10 depicts two chicks that died during a cold front. There were
three instances of fledgling morality in both seasons. A breeding pair on South Deer lost
a fledgling to disease in both seasons. During monitoring, we discovered that both chicks
were severely emaciated. One chick was brought to a rehabber and died from West Nile

Anderson 26
virus shortly thereafter, and the second chick had disappeared the following week. I
hypothesized that another fledgling died in 2014, evident by the fledgling’s
disappearance from the adult pair approximately a month after their chick fledged.
Constant daily brood survival was 0.985 (SE 0.003). The probability of at least
one chick surviving to fledging or 35 days was 0.591 (SE 0.003).
Variation in brood survival was best explained by a quadratic time effect and the
addition of the number of gulls (Table 8). The model indicated that daily survival rates
decreased as the season progressed and the number of gulls increased (Figure 13-14).
The next best model included the nesting gull covariate (2.32 ∆AICc units above).
Nesting gulls appeared to decrease daily survival, but not significantly (βi = -0.839, CL =
-1.690, 0.011). Adding all covariates to the quadratic time effect did not improve the
model (Table 8). Brood survival appeared to be positively related to brood age, but the
relationship was insignificant (βi = 0.033, CL = -0.010, 0.076).
Brood survival was positively related to territory size, but not significantly (βi =
0.628, CL = -0.591, 1.847). When survival was held constant, daily survival was higher
when both adults occupied the same territory for two consecutive years, but was
statistically insignificant (βi = 0.162, CL = -0.398, 0.721).
Time activity budget
I conducted 249 time activity budgets and 18,540 behavioral observations on 60
nests during the incubation period in 2013-2014. During incubation, pairs engaged
predominantly in incubation behaviors (52%) (Table 9). All other behaviors, such as
foraging, self-maintenance, resting, locomotion, vigilance, and agonistic were much less

Anderson 27
frequent. Resting (16%) occurred more often than self-maintenance (10%) and vigilance
(8%). All other behaviors accounted for 14% of observations.
I conducted 187 time activity budgets and 13,976 observations on 38 broods
during the chick rearing period in 2013-2014. During chick rearing, pairs engaged
predominantly in resting (35%) and vigilance (29%) behaviors (Table 9). Foraging and
chick feeding accounted for 13% of observations. Self-maintenance, locomotion and
agonistic behaviors accounted for the remaining observations (23%). Pairs engaged in
more self-maintenance, foraging, and agonistic behaviors during chick rearing than
incubation.
Agonistic behaviors during the incubation and chick rearing periods were
primarily caused by the presence of gulls and other oystercatchers (Figure 15). Gulls
caused agonistic behaviors more than other oystercatchers during the incubation period,
while the reverse was observed during chick rearing. The presence of other bird species
were the next most common cause of agonistic behaviors.
Cluster analysis and Principle Component analysis
Incubation period. Based on the results of cluster analysis, I identified three
groupings of nests (Table 10) (Figure 16). After examining the PCA plots, I found there
were several characteristics associated with these nest groups (Figure 17). Oystercatchers
in group 3 were early to mid-season nesters and had the greatest occurrence of incubation
(Table 10). Nesting gulls were absent, and they occasionally had loafing gulls on their
territories. Oystercatchers in group 2 were late season nesters and engaged in more
agonistic, vigilant and roosting behaviors (Table 10). They had nesting gulls and high
numbers of gulls on their territories. Oystercatchers in group 1 were early season nesters
Anderson 28
and had the greatest occurrence of vigilance and locomotion (Table 10). No nesting gulls
were present, but the number of loafing gulls ranged from low to high. Hatching success
was higher for cluster 3 (71.4%) than clusters 1 (39.4%) and 2 (29.4%).
I generated and analyzed five principle components (PC) and PC1 through PC3
explained 52.8% of the variation in the original data matrix (Table 11). The variation in
PC1 was primarily explained by incubation, locomotion, and vigilance (Figure 17). Lay
date, roosting, and nesting gulls were the variables with the highest loading coefficients
and explained the greatest amount of variation along the PC2 axis (Figure 17). Finally,
PC3 was best explained by locomotion, vigilance, agonistic, and foraging behaviors
(Table 11).
Chick rearing. Cluster analysis identified two clusters of similar broods (Table
12) (Figure 18). After examining the PCA plots, I determined there were several
characteristics associated with the groups (Figure 19). Oystercatchers in group 1 engaged
in more roosting and foraging behaviors (Table 12). Nesting gulls were absent, and they
occasionally had loafing gulls on their territories. Oystercatchers in group 2 engaged in
more agonistic, vigilant, locomotive, and chick care behaviors (Table 12). They had
nesting gulls and high numbers of gulls on their territories. Chick age was similar
between clusters. Brood success was higher for cluster 1 (95.2%) than cluster 2 (35.3%).
Five principle components were generated with PC1 through PC3 explaining
60.2% of the variation in the original data matrix associated with chick rearing (Table
13). The variation in PC1 was best explained by vigilance, roosting, number of gulls, and
nesting gulls (Figure 19). Chick age, foraging, and locomotion were the components

Anderson 29
driving PC2 (Figure 19). Finally, PC3 was best explained by chick age, chick care, and
agonistic behaviors (Table 13).
Behavior
Roosting and vigilance were the only behaviors that differed significantly
between successful and unsuccessful nests and broods (Table 14). Oystercatchers with
successful nests roosted significantly less than those with failed nests (P = 0.042) (Table
15). Although not significant, incubation and self-maintenance occurred more often when
nests were successful (Table 15). Pairs that fledged a chick roosted significantly more
than pairs that did not (P = 0.031) (Table 17). Oystercatchers that did not fledge a chick
were significantly more vigilant than those that did (P = 0.009) (Table 17).
Behaviors exhibited during the incubation period did not differ significantly in the
absence or presence of nesting gulls (Table 16). Although not significant, oystercatchers
engaged less in incubation and self-maintenance, and more in roosting in response to
gulls (Table 15). Roosting, chick care, and vigilance differed significantly when nesting
gulls were present during the chick rearing period. Roosting increased when no nesting
gulls were present (P = 0.013) (Table 17). Vigilance and chick care increased
significantly in the presence of nesting gulls (Table 16-17).
During incubation, vigilance only differed significantly when there were ≥ 100
gulls. Specifically, vigilance was significantly higher when there were 100-300 gulls
present versus 0-49 and 50-99 gulls (Figure 20). Although not significant, incubation and
self-maintenance decreased, and roosting increased as the number of gulls increased
(Table 15). During chick rearing, vigilance was the only behavior that exhibited

Anderson 30
significant differences between gull numbers. Vigilance increased as the number of gulls
increased (H2 = 11.11, P = 0.004) (Figure 21).
Body condition
I found no significant differences between the age classes (P > 0.05). The scaled
mass indices were normal and no outliers were present (P > 0.05).
I found significant differences in scaled mass indices between the absence and
presence of gulls (P = 0.012). Mass indices were higher when gulls were absent than
when gulls were present (Table 18). As the number of gulls decreased, indices increased
significantly (Table 18). Indices also differed significantly in the presence or absence of
nesting gulls and indices were higher when nesting gulls were absent (Table 18). Mass
indices did not differ significantly in the absence or presence of other nesting species (P
= 0.289).
DISCUSSION
Nest survival
The proportion of nests hatching (40%) in 2013-2014 was similar to what Koczur
(2013) found along the central and upper Texas coast in 2011-2013. Compared to
previous years, hatching success was higher than 2012 (30%), but considerably lower
than 2011 (56%). On the Atlantic coast, hatching success has been variable, but generally
lower. In North Carolina, Davis et al. (2001) and Schulte (2012) documented a 32% and
28% hatching success rate. In Georgia, Sabine et al. (2006) reported a hatching success
rate (45%) similar to my findings.

Anderson 31
My constant DSR (0.968) and probability of hatching (0.418) was similar to
Koczur (2013) findings for oystercatchers along the Texas coast. On the Atlantic coast,
DSR has varied among studies. Sabine et al. (2006) and Borneman (2013) reported
similar DSR of 0.979 and 0.966. Schulte (2012) estimated a lower DSR (0.950) and
probability of hatching (0.28). Similarly, Davis et al. (2001) reported a DSR of 0.928 and
0.133 probability of hatching.
During this study, I found that nest survival was primarily influenced by the nest
initiation date and nest age. I determined that daily survival rates decreased as the season
progressed. Several studies have found that nest survival varied seasonally and begin to
decline by mid-season (Smith and Wilson 2010; Schulte 2012; Koczur 2013). There are
several factors that may explain this relationship. As the season progresses, nests become
vulnerable to heat stress, high tide events, and disturbance by recreationalists. During the
study, strong southerly winds from April through June frequently caused high tide events
that resulted in several occurrences of synchronous nest loss. Furthermore, the arrival of
colonial nesting species like laughing gulls, brown pelicans, and waterbird species in
mid-April may have strongly affected oystercatcher hatching success. For example, birds
that nested near the mean initiation date of March 25th had 49% hatching success, while
the hatching success of those nesting after this date was 32%. Johnson and Walters
(2008) and Tjørve and Underhill (2008) found that birds initiating clutches early in the
season also had higher hatching success. The temporal variation may also explain why re-
nesting attempts were less successful. The mean initiation date for re-nesting was early
May, and hatching success was 30%.

Anderson 32
I found that daily survival decreased as a nest aged, but many studies have found
nest age to be positively related to daily survival (Klett and Johnson 1982; Smith and
Wilson 2010). A positive relationship may indicate that as a nest ages, it becomes
increasingly valuable to adults; and the adults will allocate more time towards incubation
and nest defense (Smith and Wilson 2010). My findings are consistent with those by
Johnson and Walters (2008) and Koczur (2013). Johnson and Walters (2008) suggested
that a negative relationship between DSR and nest age may be related to site experience.
They found that when western sandpipers had more than two years of site experience,
DSR varied less as a nest aged.
Nest survival was higher when only one adult occupied the territory for two
consecutive years. My analysis of site fidelity was not consistent with other studies.
Hazlitt and Butler (2001) found that hatching success was higher when black
oystercatcher pairs occupied territories for two seasons. Johnson and Walters (2008)
determined that nest survival was higher for western sandpipers (Calidris mauri) that had
prior breeding site experience. My results may be skewed because unbanded birds were
excluded from the analysis because I could not determine if the same bird had
consecutively occupied the territory.
Oystercatchers occupying larger territories were typically breeding on larger
islands, and my findings of lower nest survival associated with larger territories are
consistent with Atlantic coast studies. On the Atlantic coast, hatching success was higher
on isolated islands than large barrier islands. For instance, Virzi (2008) reported lower
hatching success on barrier islands (5.8%) than on salt marsh and dredge spoil islands
(37%). Similarly, McGowan et al. (2005) estimated hatching success on dredge spoil

Anderson 33
islands as 45% and 11% on barrier islands. Many Atlantic coast studies have attributed
differences in nest survival to higher predator abundance on large islands.
Mammalian predation has been documented as the leading cause of predator
mortality in many studies on the Atlantic coast (American Oystercatcher Working Group
et al. 2012). McGowan and Simons (2005) found that the absence of mammalian
predators on dredge spoil islands accounted for higher nest survival than on barrier
islands. In Massachusetts, Murphy (2010) reported 67% hatching success when predators
were absent. In my study, breeding sites that are accessible to mammalian predators
generally yielded more variable hatching success. I documented several instances of nest
predation by mammals, and these nests were located on the mainland or on islands
connected to the mainland by intertidal oyster reefs. During separate low tide events, we
observed a raccoon and coyote reaching an island via the reef. Furthermore, large islands
within the study site supported large nesting colonies of laughing gulls, brown pelicans,
tern and wading bird species. The abundance of competing species of nesting birds
appeared to influence the behavior and reproductive success of oystercatchers. There
were numerous instances when I observed oystercatchers flushing and displaying
agonistic behaviors towards other bird species approaching their nesting site. I also
documented kleptoparasitism by nesting forster terns’s and gulls when an oystercatcher
adult returned to feed its chick.
Nest failures
I was not able to directly document most nest failures and had to rely on indirect
evidence. Failures that were reported as unknown generally represent nests where
predation, weather events, and human disturbance were the suspected causes of failure.

Anderson 34
northerly storms bring cold fronts during February and March, and several failures likely
occurred when eggs were exposed to cold temperatures. Many nests were overwashed
during high tide and storm events.
Based on my observations, egg predation by rattlesnakes and coyotes are also
likely causes of some of the observed nest failures. For example, I observed several
occasions of coyote near different islands, and did not find eggs in the following nest
checks. On the larger islands western diamondback rattlesnakes are present. On one
island it is very likely that a breeding pair lost two nests’ to rattlesnake predation based
on visually documenting the rattlesnake near the nest during my nest monitoring and little
evidence of nest scrape disturbance.
Although brown pelicans do not predate nests, their activity along the shell hash
where nests were found may have destroyed nests. Brown pelicans frequently came very
close to stepping on nests. On two occasions, I observed a non-incubating adult
oystercatcher engaging in a standoff with a brown pelican that had approached the nest
site. This response may indicate that oystercatchers perceive brown pelicans as a threat
because of previous interspecific interactions. Denmon et al. (2013) previously
documented twenty-one instances of incubating oystercatchers reacting to brown pelicans
along the Atlantic coast.
Recreationalists may have been indirectly related to several incidences of nest
failure. Incubating oystercatchers would often flush from their nests’ when boaters or
wade fisherman were near the islands. Unattended nests result in eggs being exposed to
potentially lethal ambient temperatures and higher risk of depredation by gulls. On the
Atlantic coast, human activity near breeding sites has shown to alter oystercatcher

Anderson 35
behavior and reduce nest attendance, consequently affecting reproductive success (Davis
et al. 2001; Verhulst et al. 2001; McGowan and Simons 2006; Sabine et al. 2008). I did
not document humans directly causing nest failures, but believe two oystercatcher nests
were destroyed when humans were recreating on islands in Drum Bay. In the subsequent
nest check, not only did I find human garbage, but it was evident that humans were
walking around the island.
Brood survival
The number of chicks fledging in 2013 (0.51) and 2014 (0.59) was higher than
2012 (0.21), but lower than 2011 (0.81) (Koczur 2013). On the Atlantic coast,
productivity is highly variable and has ranged from 0 to 1.48 (Clay et al. 2014).
Oystercatcher productivity in Texas seems relatively high compared to Atlantic coast
states. In North Carolina from 1998-2009, annual productivity was 0.32 (Clay et al.
2014). Sabine et al. 2006 reported 0.46 productivity in Georgia.
My constant DSR (0.985) and probability of fledging (0.591) was similar to
previous findings by Koczur (2013) for oystercatchers along the Texas coast. Also,
studies from the Atlantic coast have yielded similar results. In North Carolina from 1998-
2009, daily brood survival was 0.981 and the probability of fledging was 0.471 (Clay et
al. 2014). Sabine et al. 2006 estimated daily survival to be 0.991 and the probability of
fledging was 0.329 in Georgia.
Daily brood survival was primarily influenced by the hatching date and daily
survival decreased as the season progressed. As discussed earlier, this negative
relationship may be influenced by colonial nesting birds, weather, and predator
abundance. The probability of chick predation increases when gulls begin nesting and

Anderson 36
mammalian presence increases as the season progresses. It is highly likely that cold fronts
early in the season increased food availability and consequently the probability of
fledging. Frequent northerly winds early in the nesting season cause extreme low tide
events within the bays, and results in greater reef exposure over long periods of time. As
mentioned previously, southerly winds beginning in April cause prolonged high tide
events and reduce reef exposure. I recorded several instances of mortality in older chicks
(> 2 weeks) during high tide events. Typically, the probability of fledging increases as
chicks’ age and they become decreasingly vulnerable to threats (Colwell 2007, Schulte
2012). I believe that decreased food availability during high tide events contributed to the
starvation of these chicks.
Brood survival increased as a chick aged and these finding are consistent with
other studies by Colwell et al. 2007, Schulte 2012, and Koczur 2013. Oystercatcher
chicks are semi-precocial and they depend on their parents for food and protection from
weather and predators. For shorebird species with precocial young, high mortality occurs
soon after hatching (Colwell et al. 2007). Schulte (2012) found that chick mortality was
highest during the first week after hatching. Groves (1989) and Hazlitt and Butler (2001)
also found similar results for black oystercatchers. On a study of Eurasian oystercatchers
(H. ostralegus), Ens et al. (1992) determined that chick mortality predominantly occurred
within 10 days of hatching.
Sources of chick mortality
I did not document many causes of direct mortality to chicks and believe that
predation and inclement weather were the primary sources of mortality. I suspected
coyote predation occurred on an island where a game camera had captured a coyote

Anderson 37
visiting the nest the night of hatching. The camera showed two chicks had hatched, but
only one chick was verified in the subsequent nest check. Approximately three weeks
later, the second chick had disappeared too and it’s likely that the coyote continued
visiting the nesting territory. Several instances of chick mortality occurred during cold
fronts with high northerly winds when newly hatched chicks were likely exposed to cold
temperatures and rain. As mentioned previously, high tide events may have caused chick
starvation later in the season.
Time activity budgets
As expected, pairs spent most of their time incubating during nest rearing, which
is consistent with other studies and characteristic of bi-parental care (Byrkjedal 1985;
Kersten 1996; Collins 2012; Spiegel et al. 2012). Incubation bouts are influenced by
foraging opportunities and disturbances (Purdy and Miller 1988; Sabine et al. 2008;
Spiegel et al. 2012). Black oystercatchers incubated continuously when high tides
prevented foraging, and exhibited short incubation bouts at low tide so both adults could
forage (Purdy and Miller 1988; Spiegel et al. 2012). Furthermore, long incubation bouts
are suggested to be an effective anti-predator strategy that minimizes the risk of predation
(Smith et al. 2007; Sabine et al. 2008). I found nest departures were due to mate
switching, human disturbance and defense against predators or conspecifics. Typically,
oystercatchers left nests when boats approached islands, or to chase and attack intruders.
Lastly, data collected during this study and other studies supports the hypothesis that
incubation behavior is directly related to nest success (McGowan and Simons 2006;
Collins 2012). Although, incubation was not significantly related to nest fate, there was a

Anderson 38
positive relationship between the occurrence of successful nests and longer incubation
times.
Following incubation, resting and self-maintenance behaviors occurred more
often than the remaining behavior categories. Collins (2012) and Sabine et al. 2008 found
that American oystercatchers on the Atlantic coast spent similar time in self-maintenance,
but less time resting. On the other hand, Byrkjedal (1985) found golden plovers (Pluvialis
apricaria) spent similar time resting. Preening and bathing are critical for maintaining
good condition of feathers, and I expected oystercatchers to allocate sufficient time
towards self-maintenance. While incubating, oystercatchers were vigilant 38% of the
time and roosted only 7% of time. When adults were relieved from incubating, they
would typically begin roosting or preening. Incubation is less energetically demanding
than chick rearing, but constant allocation towards vigilance may affect energy reserves
and explain why roosting occurred so often. The frequency of self-maintenance and
roosting behaviors could also be influenced by food availability.
As expected, pairs predominantly engaged in vigilant behaviors during chick
rearing which is consistent with other studies on American oystercatchers by Sabine et al.
2008 and Collins (2012). Either one or both adults would exhibit vigilance while standing
or laying near a chick, presumably chick guarding. Byrkjedal (1985) observed that at
least one adult golden plover was always chick guarding. I determined that even when
oystercatchers exhibited significantly more vigilance, they did not always fledge a chick.
This may have been related to poorer parental performance and gull presence, or because
I did not document the true cause of chick mortality.

Anderson 39
Though, only 3% of observations were agonistic behaviors, pairs exhibited them
more often during chick rearing than incubation. Collins (2012) found that oystercatcher
brood success was positively related to agonistic behaviors. Other oystercatchers and
gulls were the major causes of agonistic behavior, but differed depending on the
reproductive period. During incubation, nearly 50% of the agonistic occurrences were
towards gulls. These findings are not surprising considering that gulls are the major
predatory threat to eggs and chicks. During chick rearing, the frequency of agonistic
occurrences was similar for gulls and conspecifics. Territory disputes were very common
when several breeding pairs were occupying an island. I also documented a suite of bird
species that elicited agonistic responses including: great blue heron (Ardea Herodias),
great egret (Ardea alba), willet (Tringa semipalmata), tri-colored heron (Egretta
tricolor), ruddy turnstone (Arenaria interpres), grackle species (Quiscalus spp.),
peregrine falcon (Falco peregrinus) and tern species. On the Atlantic coast, Denmon et
al. (2013) observed oystercatchers responding to great egret, tri-colored heron, willet, and
grackles.
I was surprised that foraging and chick care behaviors only accounted for 13% of
observations because many studies have found that these behaviors occurred more often
(Byrkjedal 1985; Kersten 1996; Collins 2012). My research was not focused on
documenting foraging behavior, which is a likely reason why the time spent foraging was
underestimated for several reasons. First, I did not include tidal phase in my statistical
analysis of behaviors. As mentioned before, tide levels and amount of reef exposure
highly influences oystercatcher foraging behavior. Though I conducted TABs at various
tidal phases, the observations were not scheduled around low tide events when foraging

Anderson 40
opportunities are greater for oystercatchers. Secondly, because of logistical constraints, I
did not conduct observations at sunrise or dusk, which are times of high foraging activity
for birds.
Chick age may also explain some of the variability in adult behaviors. As chicks
age, they become more independent and parents allocate less time toward chick
attendance and possibly more time for themselves (Byrkjedal 1985; Colwell et al. 2007;
Collins 2012).
There are other factors that may have affected bird behavior that I did not evaluate
due to limited resources. First, the sex of adults has been shown to influence the quantity
of oystercatcher parental investment (Purdy and Miller 1988; Palmer et al. 2001).
Depending on the gender, an adult will allocate time towards incubation and nest
disproportionately. For example, large bodied females typically incubate more, while
males initiate nest defense behaviors (Purdy and Miller 1988; Nol 1989). American
oystercatchers exhibit sexual dimorphism, but there is a large range of overlap so I was
not able to verify sex of every adult. Secondly, flushing off the nest affects nest success
(Smith et al. 2007). I did not measure whether flushing was related to nest success
because flushing events were inconsistently documented. Finally, I did not measure
nocturnal behavioral patterns, so I may have underestimated behaviors that oystercatchers
engage in at night such as incubation, roosting, and predator defense.
Daily survival and laughing gulls
Daily nest survival decreased as the number of gulls increased, but not
significantly. Only one gull predation event was verified by camera, but there was
evidence that suggested gulls are a major threat to eggs. Adults were frequently agonistic

Anderson 41
at gulls near their nests’ and I found eggs with holes within the nest site. I believe that
gulls were predating eggs when nests were left unattended. Hazlitt (2001) found that
black oystercatcher pairs nesting near glaucous-winged gull (L. glaucescens) colonies
had significantly smaller clutch sizes than pairs without adjacent gulls and attributed
these results to egg predation by gulls.
Conversely, nest survival slightly increased in the presence of nesting gulls;
however, hatching success was still higher (41%) when nesting gulls were absent than
when they were present (33%). The size of colonies and the proximity to nesting gulls
may explain these findings and suggest a density dependent threshold. Large islands
within the study site supported high density nesting colonies, while small dredge spoils
typically supported ≤ 20 gull nests’. Oystercatcher pairs may be capable of effectively
defending against several gulls versus a large aggregation of gulls. This may also support
why daily survival was higher on smaller territories.
The top model for brood survival during this study included the number of gulls.
Daily survival decreased significantly as the number of gulls increased. The presence of
nesting gulls decreased daily survival, but not significantly. However, substantially more
pairs (n = 26) fledged a chick in the absence of nesting gulls than in the presence of
nesting gulls (n = 6). A study on European oystercatchers found that breeding success
was only higher in areas with very low numbers of gulls (Harris and Wanless 1997).
Magella and Brousseau (2001) also found that chick predation by herring gulls (L.
argentatus) was the major factor explaining low reproductive success of common terns
(Sterna hirundo). Additionally, O’Connell (2003) confirmed that black skimmers

Anderson 42
(Rynchops niger) and terns breeding on islands with nesting gulls experienced higher
rates of gull disturbance than those breeding on islands lacking nesting gulls.
Body condition and laughing gulls
Chick body condition was lower when nesting gulls were present and as the
number of gulls increased. Many studies relate body condition to an individual’s
energetic state and overall fitness (Peig and Green 2009; Schamber et al. 2009).
Furthermore, Tella et al. (2001) suggested that chick fledging weights are positively
correlated with juvenile survival for many species. My results showed changes in
parental behavior were associated with breeding near nesting gull colonies. Although not
statistically significant, foraging decreased in the presence of nesting gulls and as the
number of gulls increased. The stressful conditions of breeding near a large colony may
result in more parental allocation towards chick guarding and less towards chick
attendance, and ultimately compromise chick body condition. A study on colonial
penguins found that higher breeding densities around a nest site negatively affected
offspring condition because adults invested more in nest defense and less in chick
attendance (Tella et al. 2002).
Poor chick body condition may influence the probability of an oystercatcher
surviving their first non-breeding season. Intraspecific competition between adults and
juveniles on wintering sites may force individuals in poor condition to disperse to lower
quality habitat (Barbraud et al. 2003). Based on personal observations, juvenile
oystercatchers tend to roam within the bays and feed together on the reefs. Adult and
juvenile oystercatchers also flock during the winter and I have observed both cohorts
feeding near each other. I witnessed intraspecific interactions on multiple instances. First,

Anderson 43
when juveniles attempted to feed on a breeding pair’s feeding territory and secondly,
when both cohorts were feeding together on unclaimed reefs. During these periods of
interaction, adults elicited agonistic reactions when juveniles encroached on their active
foraging area.
Based on banding re-sights, we are aware that juvenile oystercatchers disperse
along the central and upper coasts. I feel that oystercatchers also disperse to other areas
like Louisiana and Mexico, but little is known about juvenile dispersal patterns along the
Gulf coast. Barbraud et al. (2003) found that dispersal rates increased when juvenile
flamingos were in good condition. If juvenile oystercatchers are displaced from natal
sites and forced to roam along the Gulf coast, body condition may be a key variable that
predicts their probability of survival.
Body condition does not reflect true physiological conditions, and unverified
indices must be used with caution. Many studies recommend making repeated measures
and validating indices with some physiological measure like total body fat or protein
(Peig and Green 2009). A causal relationship between gulls and lower chick body
condition cannot be inferred because I did not measure all variables that may influence
body condition. Many studies have determined that oystercatcher reproductive success is
influenced by foraging (Nol 1989; Ens et al. 1992; Kersten 1996; Thibault et al. 2010). I
did not measure parental foraging rates, food items, and the area or location of feeding
territories. Food availability is also influenced by tide levels and amount of reef exposure.
Lastly, brood size and sibling rivalry may also explain variation in body condition.
Groves (1984) found weight differences between siblings in two chick broods, with the
larger sibling exhibiting more dominance.

Anderson 44
Parental behavior and laughing gulls
I found that many behaviors during incubation were not significantly influenced
by nesting gulls or the number of gulls. However, parental vigilance did increase
significantly when there were ≥ 100 gulls. This supports my hypothesis that a density
dependent threshold of gulls exist, in which parental behavior begins to be significantly
affected when gulls reach a certain density. Also, my findings demonstrate that
oystercatchers nesting near high density of gulls are allocating time differently than
oystercatchers nesting near fewer gulls.
I found that oystercatchers with successful nests roosted significantly less than
those with failed nests, which may be influenced by gulls. Although not significant, they
roosted more in response to gulls. As mentioned previously, it appears that oystercatchers
within a stressful environment may have to roost more to maintain their energy stores. It
may also be a strategy to reduce nest site activity and prevent gulls from cueing onto the
nest site location. Even though I did not find significant differences between incubation
occurrence and gulls; I did find evidence that incubation activity decreased in the
presence of nesting gulls and as gulls increased. In my study, gulls are the main
disturbance factor, and these results provide additional evidence that gulls appear to shift
parental oystercatcher activities away from the nest.
During chick rearing, vigilance increased significantly when nesting gulls were
present and there was a positive relationship between vigilance and the number of gulls
(Figure 21). Also, regardless of the number of gulls, vigilance increased significantly
when gulls were present (≥ 1). My findings suggest that gulls affected vigilance
differently depending on the reproductive period. The findings provide additional

Anderson 45
evidence that adults are allocating their time disproportionally as the number of gulls
increase. Furthermore, pairs that did not fledge a chick were significantly more vigilant
than pairs that did. This suggests that first, increasing vigilance may not be enough to
overcome gulls and secondly, other factors including mortality source, chick age, or
hatching date may explain these results too. However, considering all my findings, I
suggest that high gull densities cause adult oystercatchers to allocate less time towards
behaviors that benefit individual fitness and reproductive success.
Based on my results, laughing gulls influenced parental behavior and daily
survival more during the chick rearing period. As mentioned before, young chicks are
particularly vulnerable to predation. Furthermore, studies have suggested that chick
survival is a critical period that affects breeding productivity (Colwell et al. 2007; Schulte
2012). During the study, the breeding season was typically over when breeding pairs lost
their chicks. Intensifying parental care during the chick rearing period is a reproductive
strategy to increase the likelihood of a breeding pair’s reproductive success.
Laughing gull predation
Avian predation is very difficult to document because there is usually no evidence
and predation occurs very quickly. Gull species are opportunistic feeders and predation
typically occurs when eggs and chicks are exposed (Lauro and Burger 1989). Several
studies on oystercatchers have documented gull species as predators (Vermeer et al.
1992; Hazlitt 2001; Verboven et al. 2001). I hypothesized that oystercatcher eggs were
extremely vulnerable to gull predation when gulls were nesting or loafing on their
breeding territories. In 2013, I employed motion activated game cameras to monitor nests
with a high probability of gull predation. Unfortunately, the delay between the motion
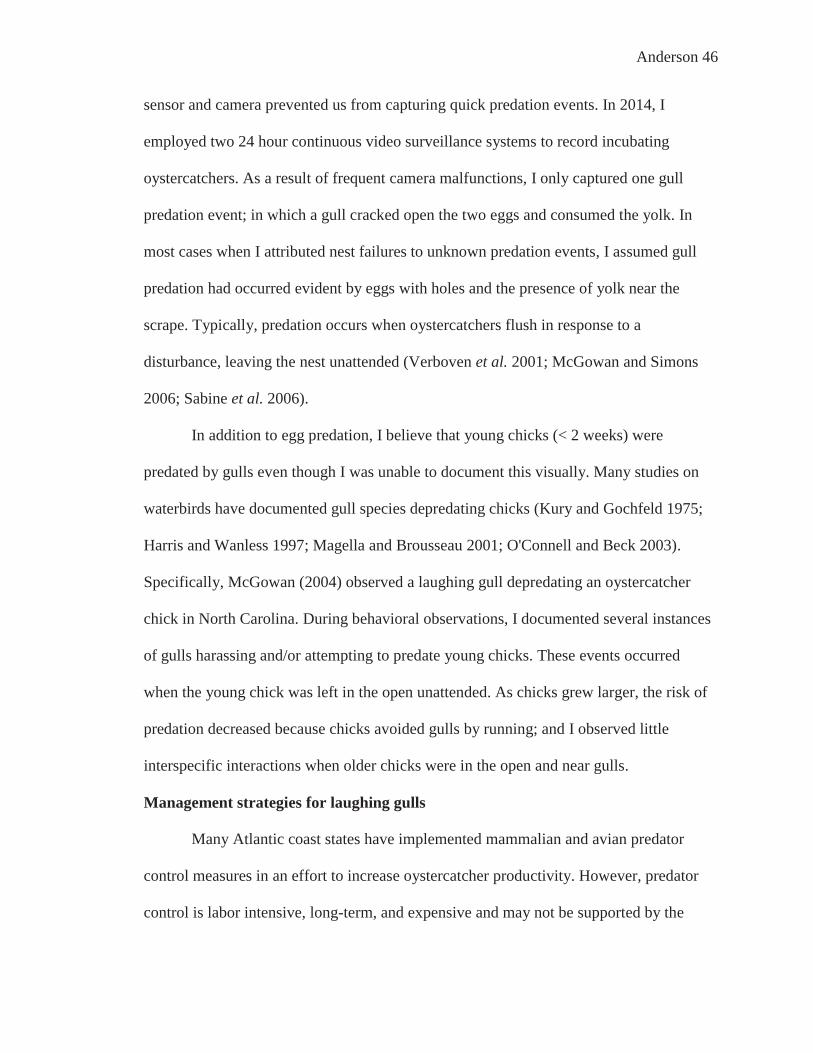
Anderson 46
sensor and camera prevented us from capturing quick predation events. In 2014, I
employed two 24 hour continuous video surveillance systems to record incubating
oystercatchers. As a result of frequent camera malfunctions, I only captured one gull
predation event; in which a gull cracked open the two eggs and consumed the yolk. In
most cases when I attributed nest failures to unknown predation events, I assumed gull
predation had occurred evident by eggs with holes and the presence of yolk near the
scrape. Typically, predation occurs when oystercatchers flush in response to a
disturbance, leaving the nest unattended (Verboven et al. 2001; McGowan and Simons
2006; Sabine et al. 2006).
In addition to egg predation, I believe that young chicks (< 2 weeks) were
predated by gulls even though I was unable to document this visually. Many studies on
waterbirds have documented gull species depredating chicks (Kury and Gochfeld 1975;
Harris and Wanless 1997; Magella and Brousseau 2001; O'Connell and Beck 2003).
Specifically, McGowan (2004) observed a laughing gull depredating an oystercatcher
chick in North Carolina. During behavioral observations, I documented several instances
of gulls harassing and/or attempting to predate young chicks. These events occurred
when the young chick was left in the open unattended. As chicks grew larger, the risk of
predation decreased because chicks avoided gulls by running; and I observed little
interspecific interactions when older chicks were in the open and near gulls.
Management strategies for laughing gulls
Many Atlantic coast states have implemented mammalian and avian predator
control measures in an effort to increase oystercatcher productivity. However, predator
control is labor intensive, long-term, and expensive and may not be supported by the

Anderson 47
general public. Studies have reported varying results on the efficacy of gull control
measures. In an effort to increase a Eurasian oystercatcher population in Scotland, gull
control measures were implemented from 1972 to 1988. First, large scale culling of
adults occurred from 1972 to 1976, followed by egg destruction from 1984 to 1988.
Harris and Wanless (1997) determined that the number of breeding oystercatchers
increased immediately after culling, and suggested that gull free areas attracted
oystercatcher recruits. Even though gull populations remained low, oystercatcher
populations began declining once control measures were relaxed. Furthermore,
reproductive success did not significantly improve as a result of culling because gull
predation was still occurring. Harris and Wanless (1997) suggested that complete
removal instead of a gradual reduction of gulls maybe more effective for improving
breeding success.
In a study on common terns, predatory gulls were shot to increase reproductive
success. Culling lengthened the life span of broods and increased reproductive success,
but it was not a significant improvement (Magella and Brousseau 2001). They suggested
reproductive success may have increased considerably if they completely removed gulls
earlier in the season. Furthermore, the effects of predator control did not carry over into
the subsequent season; and consequently, predation rates were similar to the baseline year
(Magella and Brousseau 2001).
Large scale culling is beneficial for rapid and substantial reduction, but influences
population dynamics (Wanless et al. 1996; Bosch et al. 2000). Gull fecundity and
recruitment is density dependent, and reducing nest density may ultimately attract new
recruits to the colony or influence dispersal between colonies (Wanless et al. 1996; Bosch

Anderson 48
et al. 2000). Gull control is typically implemented on species like greater black-back and
herring gulls. These are large predatory gulls that are highly territorial, in which several
dominate males exhibit this feeding behavior (Yorio and Quintana 1997). Selective
culling within a high density colony would probably be an ineffective measure, and large
scale culling involving egg destruction and/or dispersing poison bait throughout colonies
would be more suitable. Long-term logistical and financial support from multiple
agencies would be needed to implement laughing gull control. It appears that removal of
laughing gulls is not an absolute solution and habitat management could be more feasible.
American oystercatchers and laughing gulls prefer somewhat similar nesting
habitat. I propose making habitat less favorable to gulls in an effort to prevent gulls from
nesting on oystercatcher breeding sites. Studies have determined that gulls prefer salt
marsh islands and higher elevated nest sites surrounded by Spartina alterniflora
(Bongiorno 1970; Burger and Shisler 1978). Within my study site, gulls tended to nest in
two habitat types, 1) within the S. alterniflora behind shell hash berms on salt marsh
islands and 2) elevated, shrubby areas on dredge spoils. The shrubby areas included
vegetation like Carolina wolfberry (Lycium torreyi), marsh elder (Iva annua), saltwort
(Batis maritima), and grass species. The shrubby vegetation provided a substrate for nest
building and concealment, thus I recommend removing this vegetation from dredge spoil
islands. However, monitoring would be needed to determine if vegetation removal
increases erosion. Furthermore, there were several islands that gulls nested on in 2013 but
did not return to in the subsequent season. I believe this was attributed to vegetation
growing too tall and decreasing visibility. Gulls have been found to nest in S. alterniflora
that ranged from 0.20 m to 0.80 m (Bongiorno 1970; Burger and Shisler 1978). I also

Anderson 49
suggest maintaining tall vegetation or low growing vegetation on dredge spoils to provide
nest concealment and chick refuge. Munters (2014) found oystercatchers breeding in
Texas nested on sites with 30% live vegetative cover that included species like Sea
purselane (Sesuvium portulacastrum), saltwort, and sea ox eye daisy.
Salt marsh islands are critical coastal ecosystems along the Texas coast and the
large islands support many oystercatcher breeding pairs. The salt marsh islands within
my study site supported large colonies of nesting gulls. It may be more feasible to
implement gull culling on the salt marsh islands. Another strategy could entail increasing
the size of existing dredge islands to support more oystercatcher breeding pairs.
Implementing habitat manipulation in conjunction with culling at select sites for several
seasons may boost reproductive success short term. Research would be needed to
determine how management would affect gull dispersal along the upper coast and if
management would have long lasting implications on oystercatcher productivity.
Conclusions
The reproductive success of American oystercatchers breeding along the upper
Texas coast is dependent on a combination of many intrinsic and extrinsic factors. My
study determined that daily survival was primarily influenced by seasonality, nest and
brood age, and laughing gulls. I believe that other variables like mate fidelity, vegetation
cover, and size and distance to feeding territories not measured during this study
potentially influence daily survival. I recommend including these variables in future
productivity studies of oystercatchers.
Oystercatcher reproductive success was also influenced by predation and weather.
It is apparent that oystercatchers nesting on the mainland or islands connected to the

Anderson 50
mainland during low tides are vulnerable to mammalian predation. The abundance of
mammalian predators within my study sites did not appear to be as severe a problem as
reported along the Atlantic coast. Instead, it appears that individual mammals that were
able to revisit nest sites were lowering nest survival. I recommend employing live traps
near nesting sites where mammalian predation has been documented. Similar to the
Atlantic coast, nest survival is also dependent on tide levels and island elevation. I
suggest that habitat enhancement that elevates shell mounds on dredge spoil islands
above the high tide line would increase American oystercatcher productivity.
In Texas, population growth and high recreational activity along the coast will
continue to leave oystercatchers vulnerable to human disturbance. I assisted in putting up
conservation signs informing the public to stay a certain distance from breeding birds.
Whether it is humans disobeying the signs, recreating on islands, or affecting parental
behavior, future research should aim to document the prevalence of human disturbance.
Currently, the American Bird Conservancy is partnered with Gulf Coast Bird
Observatory in educating fishermen and recreational boaters about nesting birds within
the bays.
Based on my findings and other studies, it is apparent that chick survival is a
critical period that affects productivity and ultimately population recruitment. As
mentioned previously, data is lacking on the survival and dispersal of juvenile
oystercatchers along the Gulf coast. In order to better understand the population
dynamics of Texas oystercatchers, future monitoring should focus on band re-sightings
along the coasts of Texas, Louisiana, and Mexico.

Anderson 51
This was the first study in Texas to quantify American oystercatcher behavior and
document the negative effects of laughing gulls. Parental behavior influences nest and
brood fate to some extent, but more research on individual characteristics, foraging
behaviors, and nest attendance are needed to determine the strength of these potential
relationships. Extrinsic factors like conspecifics, other bird species, and abiotic variables
are also likely affecting parental behavior. Considering the relationship between foraging
and reproductive success, I recommend conducting a future foraging behavioral study
that measures foraging rates, prey items, tide levels, feeding area, and time of day.
The results of this study supported my hypothesis that laughing gulls are
negatively affecting daily nest and brood survival, parental behavior, and chick body
condition; but laughing gulls affected productivity and behavior differently depending on
the reproductive period. Laughing gull predation of eggs and young chicks is a
predominant threat to oystercatcher reproductive success, but additional documentation
of predation events is needed. I recommend continuing twenty-four hour camera
surveillance on oystercatcher nests near large gull colonies. Finally, agencies should
begin exploring the relationship between laughing gulls and productivity of sensitive
waterbird species. I recommend conducting an experimental study to examine if
American oystercatcher productivity differs on islands where management for laughing
gulls is implemented.

Anderson 52
LITERATURE CITED
Altmann, J. 1974. Observational study of behavior: Sampling methods. Behaviour 49:227-267 American Oystercatcher Working Group, E. N., and R.C. Humphrey, E. Nol, and R. C. Humphrey. 2012. American oystercatcher (Haematopus palliatus), The Birds of North America Online (A. Pooled, Ed.). Retreived from the Birds of North America Online: http://bna.birds.cornell.edu/bna/species/082/ Ithaca: Cornell Lab of Ornithology. Barbraud, C., A. R. Johnson, and G. Bertault. 2003. Phenotypic correlates of post
fledging dispersal in a population of greater flamingos: The importance of body condition. Journal of Animal Ecology 72:246-257.
Bart, J., S. Brown, B. Harrington, and R. I Guy Morrison. 2007. Survey trends of North
American shorebirds: Population declines or shifting distributions? Journal of Avian Biology 38:73-82.
Bongiorno, S.F. 1970. Nest-site selection by adult laughing gulls (Larus atricilla).
Animal Behaviour 18:434-444. Borgmann, K. L. 2010. A review of human disturbance impacts on waterbirds.
California: Audubon California Greenwood Beach Rd., Tiburon. www. audubon. org.[13 September 2011].
Borneman, T. E. 2013. Effects of human activity on American oystercatchers
(Haematopus palliatus) breeding at Cape Lookout National Seashore, North Carolina. Thesis M.S. North Carolina State University, Raleigh, North Carolina.
Bosch M., D. Oro, F.J. Cantos, and M. Zabala. 2000. Short-term effects of culling on the
ecology and population dynamics of yellow-legged gull. Journal of Applied Ecology 37:369-385.
Brown, S. C., C. Hickey, B. Harrington, and R. Gill. 2001. United States shorebird
conservation plan, 2nd ed. Manomet Center for Conservation Sciences, Manoment, MA
Brown, S. C., S. Schulte, B. Harrington, B. Winn, J. Bart, and M. Howe. 2005.
Population size and winter distribution of Eastern American oystercatchers. Journal of Wildlife Management 69:1538-1545.

Anderson 53
Buckley, P. and F. G. Buckley. 1980. What constitutes a waterbird colony? Reflections from the Northeastern U.S. Pages 1-15 in Proceedings of the Colonial Waterbird Group.
Burger, J. and J. Shisler. 1980. Colony and nest site selection in Laughing Gulls in
response to tidal flooding. The Condor 82:251-258. Burger, J. and M. Gochfeld. 1991. Human activity influence and diurnal and nocturnal
foraging of sanderlings (Calidris alba). Condor:259-265. Burnham, K. P. and D. R. Anderson. 2002. Model selection and multimodel inference: A
practical information-theoretic approach. Springer. Byrkjedal, I. 1985. Time-activity budget for breeding Greater Golden-Plovers in
Norwegian Mountains. The Wilson Bulletin 97:486-501. Clay, R. P., A. J. Lesterhuis, S. Schulte, S. Brown, D. Reynolds, and T. R. Simons. 2010.
Conservation plan for the American oystercatcher (Haematopus palliatus) throughout the Western hemisphere. Version 1.1. Manomet Center for Conservation Sciences, Manomet, Massachusetts.
Clay, R. P. A. J. L., S. Schulte, S. Brown, D. Reynolds and T.R. Simons. 2014. A global
assessment of the conservation status of the American oystercatcher Haematopus palliatus. International Wader Studies 20:62-82.
Collins, S. A. 2012. Reproductive ecology of American oystercatchers in the Cape
Romain of South Carolina: Implications for conservation. Thesis M.S. Clemson University, Clemson, South Carolina.
Colwell, M. A., S. J. Hurley, J. N. Hall, and S. J. Dinsmore. 2007. Age-related survival
and behavior of snowy plover chicks. The Condor 109:638-647. Davis, M. B. 1999. Reproductive success, status, and viability of the American
oystercatcher (Haematopus palliatus). Thesis M.S. North Carolina State University., Raleigh, NC.
Davis, M. B., T. R. Simons, M. J. Groom, J. L. Weaver, and J. R. Cordes. 2001. The
breeding status of the American oystercatcher on the East coast of North America and breeding success in North Carolina. Waterbirds:195-202.
Denmon, P., B. D. Watts, and F. M. Smith. 2013. Investigating American oystercatcher
(Haematopus palliatus) nest failure on Fisherman Island National Wildlife refuge, virginia, USA. Waterbirds 36:156-165.
Dinsmore, S. J., G. C. White, and F. L. Knopf. 2002. Advanced techniques for modeling
avian nest survival. Ecology 83:3476-3488.

Anderson 54
Ens, B. J., M. Kersten, A. Brenninkmeijer, and J. B. Hulscher. 1992. Territory quality,
parental effort and reproductive success of oystercatchers (Haematopus ostralegus). Journal of Animal Ecology:703-715.
Groves, S. 1984. Chick growth, sibling rivalry, and chick production in American black
oystercatchers. The Auk:525-531. Harris, M. and S. Wanless. 1997. The effect of removing large numbers of gulls Larus
spp. on an island population of oystercatchers Haematopus ostralegus: Implications for management. Biological Conservation 82:167-171.
Hazlitt, S. L. 2001. Territory quality and reproductive success of black oystercatchers in
British Columbia. Wilson Bulletin 113:404-409. Hazlitt, S. L. and R. W. Butler. 2001. Site fidelity and reproductive success of black
oystercatchers in British Columbia. Waterbirds:203-207. Hazlitt, S. L., R. C. Ydenberg, and D. B. Lank. 2002. Territory structure, parental
provisioning, and chick growth in the American black oystercatcher Haematopus bachmani. Ardea 90:219-227.
Heath, S. 2011-2013 American oystercatcher monitoring results. Unpublished report to
the Gulf Coast Bird Observatory, Lake Jackson, TX. Johnson, M. and J.R. Walters. 2008. Effects of mate and site fidelity on nest survival of
Western sandpipers (Calidris mauri). The Auk 125:76-86. Kersten, M. 1996. Time and energy budgets of oystercatchers Haematopus ostralegus
occupying territories of different quality. Ardea 84A:291-310. Khatchikian, C. E., M. Favero, and A. I. Vassallo. 2002. Kleptoparasitism by brown-
hooded gulls and grey-hooded gulls on American oystercatchers. Waterbirds 25:137-141.
Klett, A. and D. H. Johnson. 1982. Variability in nest survival rates and implications to
nesting studies. The Auk:77-87. Koczur, L. M. 2013. Reproductive success of the American oystercatchers in Texas.
Thesis M.S.Texas A&M University-Kingsville, Kingsville, Texas. Kury, C.R. and M. Gochfeld. 1975. Human interference and gull predation in cormorant
colonies. Biological Conservation 8:23-34. Lauro, B. and J. Burger. 1989. Nest-site selection of American oystercatchers
(Haematopus-palliatus) in salt marshes. Auk 106:185-192.

Anderson 55
Maehr, D. S. and J. A. Rodgers. 1985. Colonial waterbirds: An elusive definition.
Colonial Waterbirds 8:186-187. Magella, G. and P. Brousseau. 2001. Does culling predatory gulls enhance the
productivity of breeding common terns? Journal of Applied Ecology 38:1-8. Martínez, M. M. and S. Bachmann. 1997. Kleptoparasitism of the American
oystercatcher Haematopus palliatus by gulls Larus spp. In the Mar Chiquita lagoon, Buenos Aires, Argentina. Marine Ornithology 25:68-69.
McGarigal, K., S. Cushman, and S.G. Stafford. 2000. Multivariate statistics for wildlife
and ecology research. Springer-Verlag New York, Inc. New York, NY. McGowan, C.P. 2004. Factors affecting nesting success of American oystercatchers
(Haematopus palliatus) in North Carolina. M.S. Thesis, North Carolina State University, Raleigh, NC.
McGowan, C. P. and T. R. Simons. 2006. Effects of human recreation on the incubation
behavior of American oystercatchers. The Wilson Journal of Ornithology 118:485-493.
McGowan, C. P., T. R. Simons, W. Golder, and J. Cordes. 2005. A comparison of
American oystercatcher reproductive success on barrier beach and river island habitats in coastal North Carolina. Waterbirds 28:150-155.
Meissner, W. 2009. A classification scheme for scoring subcutaneous fat depots of
shorebirds. Journal of Field Ornithology 80:289-296. Munters, S. 2014. Nest site selection of American oystercatchers (Haematopus palliatus)
on the upper Texas coast with comments on field sexing techniques. M.S. Thesis, Texas State University, San Marcos, TX.
Murphy, S. P. 2010. Population dynamics of the American oystercatcher (Haematopus
palliatus) near the northern limit of its range. The City University of New York. Nol, E. 1985. Sex roles in the American oystercatcher. Behaviour:232-260. Nol, E. 1989. Food supply and reproductive performance of the American oystercatcher
in Virginia. Condor:429-435. O’Connell, T.J. and R.A. Beck. 2003. Gull predation limits nesting success of terns and
skimmers on the Virginia barrier islands. Journal of Field Ornithology 74:66-73.

Anderson 56
Palmer, A. G., D. L. Nordmeyer, and D. D. Roby. 2001. Factors influencing nest attendance and time-activity budgets of peregrine falcons in interior Alaska. Arctic 54:105-114.
Peig, J. and A. J. Green. 2009. New perspectives for estimating body condition from
mass/length data: The scaled mass index as an alternative method. Oikos 118:1883-1891.
Peters, K. A. and D. L. Otis. 2005. Using the risk-disturbance hypothesis to assess the
relative effects of human disturbance and predation risk on foraging American oystercatchers. The Condor 107:716-725.
Purdy, M.A. and E.H. Miller. 1988. Time budget and parental behavior of breeding
American Black Oystercatchers (Haematopus bachmani) in British Columbia. Canadian Journal of Zoology 66:1742-1751.
Rave, D. P. and G. A. Baldassarre. 1989. Activity budget of green-winged teal wintering
in coastal wetlands of Louisiana. The Journal of Wildlife Management:753-759. Ruthrauff, D. R. and B. J. McCaffery. 2005. Survival of Western sandpiper broods on the
Yukon-Kuskokwim Delta, Alaska. The Condor 107:597-604. Sabine, J. B., J. M. Meyers, C. T. Moore, and S. H. Schweitzer. 2008. Effects of human
activity on behavior of breeding American oystercatchers, Cumberland Island National Seashore, Georgia, USA. Waterbirds 31:70-82.
Sabine, J. B., S. H. Schweitzer, and J. M. Meyers. 2006. Nest fate and productivity of
American oystercatchers, Cumberland Island National Seashore, Georgia. Waterbirds 29:308-314.
Sanders, F., M. Spinks, and T. Magarian. 2013. American oystercatcher winter roosting
and foraging ecology at Cape Romain, South Carolina. Wader Study Group Bulletin 120:128-133.
Schamber, J. L., D. Esler, and P. L. Flint. 2009. Evaluating the validity of using
unverified indices of body condition. Journal of Avian Biology 40:49-56. Schulte, S. 2012. Ecology and population dynamics of American oystercatchers
(Haematopus palliatus). PhD. North Carolina State University, Raleigh, North Carolina.
Smith, P. A., H. G. Gilchrist, and J. N. M. Smith. 2007. Effects of nest habitat, food, and
parental behavior on shorebird nest success. Condor 109:15-31. Smith, P. A. and S. Wilson. 2010. Intraseasonal patterns in shorebird nest survival are
related to nest age and defence behaviour. Oecologia 163:613-624.

Anderson 57
Spiegel, C. S., S. M. Haig, M. I. Goldstein, and M. Huso. 2012. Factors affecting
incubation patterns and sex roles of black oystercatchers in Alaska. Condor 114:123-134.
Steenhof, K. and I. Newton. 2007. Assessing nesting success and productivity. Raptor
research and management techniques:181-192. Sturges, H.A. 1926. The choice of a class interval. Journal of the American Statistical
Association. 21:65-66. Tella, J. L., M. G. Forero, M. Bertellotti, J. A. Donázar, G. Blanco, and O. Ceballos.
2001. Offspring body condition and immunocompetence are negatively affected by high breeding densities in a colonial seabird: A multiscale approach. Proceedings of the Royal Society of London. Series B: Biological Sciences 268:1455-1461.
Thibault, J. M., F. J. Sanders, and P. G. R. Jodice. 2010. Parental attendance and brood
success in American oystercatchers in South Carolina. Waterbirds 33:511-517. Tjørve, K. M. C. and L. Underhill. 2008. Influence of disturbance and predation on
breeding success of the African black oystercatcher, Haematopus moquini, on Robben Island, South Africa. Waterbirds 31:83-96.
Traut, A. H. and M. E. Hostetler. 2003. Urban lakes and waterbirds: Effects of
development on avian behavior. Waterbirds 26:290-302. Tuckwell, J. and E. Nol. 1997. Intra-and inter-specific interactions of foraging American
oystercatchers on an oyster bed. Canadian Journal of Zoology 75:182-187. Verboven, N., B. J. Ens, and S. Dechesne. 2001. Effect of investigator disturbance on
nest attendance and egg predation in Eurasian oystercatchers. Auk 118:503-508. Verhulst, S., K. Oosterbeek, and B. J. Ens. 2001. Experimental evidence for effects of
human disturbance on foraging and parental care in oystercatchers. Biological Conservation 101:375-380.
Vermeer, K., K. Morgan, and G. Smith. 1992. Black oystercatcher habitat selection,
reproductive success, and their relationship with glaucous-winged gulls. Colonial Waterbirds:14-23.
Virzi, T. 2008. Effects of urbanization on the distribution and reproductive performance
of the American oystercatcher (Haematopus palliatus) in coastal New Jersey. Wader Study Group Bulletin 117:19-26.

Anderson 58
Wanless, M.P., J.C. Harris, P. Rothery. 1996. Modelling responses of Herring Gull and Lesser black Backed Gull populations to reduction of reproductive output: Implications for control measures. Journal of Applied Ecology 33:1420-1432. White, G. C. and K. P. Burnham. 1999. Program Mark: Survival estimation from populations of marked animals. Bird Study 46:120-138. Yorio, P. and F. Quintana. 1997. Predation by kelp gulls (Larus dominicanus) at a mixed species colony of royal terns (Sterna maxima) and Cayenne terns (Sterna eurygnatha) in Patagonia. Ibis 139:536-541.
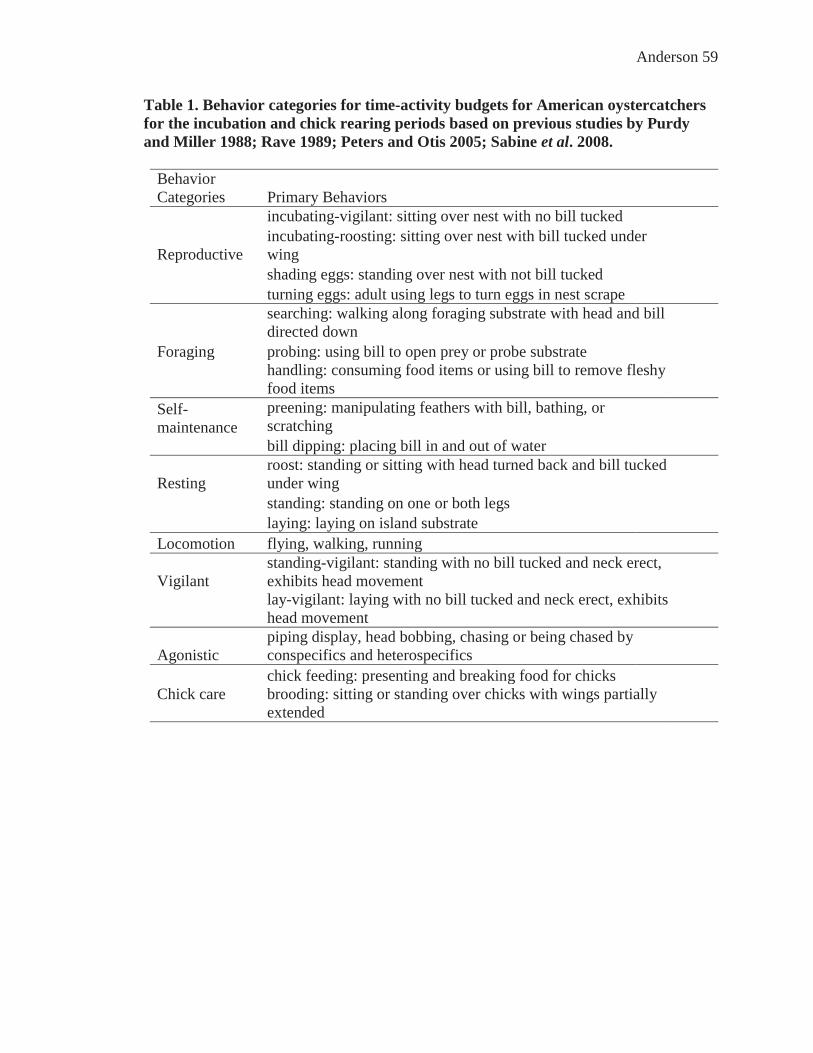
Anderson 59
Table 1. Behavior categories for time-activity budgets for American oystercatchers for the incubation and chick rearing periods based on previous studies by Purdy and Miller 1988; Rave 1989; Peters and Otis 2005; Sabine et al. 2008.
Behavior Categories Primary Behaviors
Reproductive
incubating-vigilant: sitting over nest with no bill tucked incubating-roosting: sitting over nest with bill tucked under wing
shading eggs: standing over nest with not bill tucked turning eggs: adult using legs to turn eggs in nest scrape
Foraging
searching: walking along foraging substrate with head and bill directed down probing: using bill to open prey or probe substrate
handling: consuming food items or using bill to remove fleshy food items
Self- maintenance
preening: manipulating feathers with bill, bathing, or scratching bill dipping: placing bill in and out of water
Resting roost: standing or sitting with head turned back and bill tucked under wing
standing: standing on one or both legs laying: laying on island substrate Locomotion flying, walking, running
Vigilant standing-vigilant: standing with no bill tucked and neck erect, exhibits head movement
lay-vigilant: laying with no bill tucked and neck erect, exhibits head movement
Agonistic piping display, head bobbing, chasing or being chased by conspecifics and heterospecifics
Chick care
chick feeding: presenting and breaking food for chicks brooding: sitting or standing over chicks with wings partially extended

Anderson 60
Table 2. A predictive model evaluated with Program MARK to determine the effect of site fidelity on constant daily survival for nests’ and broods’ of American oystercatchers.
Model Group 1 Group 2
S (.) and site fidelity
1 breeding adult occupied the same nesting territory from 2012-2014
2 breeding adults occupied the same nesting territory from 2012-2014
*S(.) represents constant daily survival

Anderson 61
Table 3. Reproductive success of American oystercatchers for Galveston Bay, Drum Bay and Bastrop Bay combined, 2013-2014.
Year No. of pairs
No. of breeding pairs
No. of clutches
No. of clutches that fledged chicks (%)
No. of chicks fledged
Productivitya
2013 45 41 69 23.53 21 0.51
2014 48 39 75 20 23 0.59
Total 93 80 144 43.53 44
aProductivity = chicks fledged/breeding pairs

Anderson 62
Table 4. Number of American oystercatcher nests found in each bay system surveyed within in the study area from 2013-2014. Site # of Nests %
West Galveston Bay 94 65.28
Galveston Bay East of I-45 19 13.19
Bastrop Bay 9 6.25
Drum Bay 22 15.28
Total 144

Anderson 63
Table 5. The number of American oystercatcher pairs that exhibited first, second, or third re-nesting attempts and the number of nests that hatched per attempt in 2013-2014. Attempt # of pairs and (%) # of nests' hatched and (%) 1 46 (73.0) 14 (73.7) 2 16 (25.4) 5 (26.3) 3 1 (1.6) 0 Total 63 19

Anderson 64
Table 6. The reasons for clutch loss for American oystercatcher nests combined, 2013-2014.
Reasons for clutch loss
2013-2014
n (%)
Predation, unknown source 15 (21.13)
Predation, known source 7 (9.86)
Unknown 30 (42.25)
Human disturbance 4 (5.63)
Overwash/Severe weather 15 (21.13)
Total 71

Anderson 65
Table 7. Summary of model selection results from Program MARK for daily nest survival of American oystercatchers, 2013-2014. Models are ranked by ∆AICc and Wi represents model weight and K is the number of parameters. Model factors included linear (LT) and quadratic (QT) time trend, nest age (age), territory size (TSz), number of gulls (gulls) and nesting gulls (nesting). S(.) represents model only using constant daily survival.
Model AICc ∆AICc Wi K Deviance
LT + age 459.9068 0a 0.62989 3 453.8973 LT + age + TSz + gulls + nesting 461.4848 1.578 0.28616 6 449.4517
LT 465.8507 5.9439 0.03225 2 461.846
LT + nesting 467.4673 7.5605 0.01437 3 461.4579
LT + gulls 467.6204 7.7136 0.01331 3 461.6109
LT + TSz 467.6204 7.7136 0.01331 3 461.6109
QT 468.0935 8.1867 0.01051 2 464.0888
S(.) constant 476.0657 16.1589 0.0002 1 474.0641
a Denotes the best competing model

Anderson 66
Table 8. Summary of model selection results from Program MARK for daily brood survival of American oystercatchers, 2013-2014. Models are ranked by ∆AICc and Wi represents model weight and K is the number of parameters. Model factors included linear (LT) and quadratic (QT) time trend, nest age (age), territory size (TSz), number of gulls (gulls) and nesting gulls (nesting). S(.) represents model using only constant daily survival.
Model AICc ∆AICc Wi K Deviance
QT + gulls 171.7211 0a 0.49586 3 165.7039
QT + nesting 174.0411 2.32 0.15545 3 168.0239
QT + gulls + TSz + nesting + age 174.7293 3.0082 0.11019 6 162.669
QT + age 175.5541 3.8330 0.07295 3 169.5369
QT 175.8318 4.1107 0.06349 2 171.8232
QT + TSz 176.1367 4.4156 0.05452 3 170.1195
LT 176.4824 4.7613 0.04586 2 172.4738
S(.) Constant 183.0931 11.372 0.00168 1 181.0903 a Denotes the best competing model

Anderson 67
Table 9. Time activity budgets for American oystercatchers in relation to reproductive stage (egg or chick). Raw frequency of behaviors is also provided as proportion of time spent per behavior category for 2013-2014 combined. Reproductive Stage
Incubation Chick rearing Behavior Category n % n % Incubation 9598 52 - - Foraging 1434 8 1309 9 Self-maintenance 1854 10 2144 15 Resting 3001 16 4898 35 Locomotion 894 5 711 5 Vigilant 1561 8 3976 29 Agonistic 187 1 360 3 Chick care - 578 4 Total 18540 13976

Anderson 68
Table 10. Attributes of American oystercatcher nests identified by cluster analysis. Nests were distinguished into three groups. The median and interquartile range of each variable are given.
Group 1 2 3 n = 33 n = 17 n = 7
Variable Med IQR Med IQR Med IQR Incubation 33.5 11.25 39 9.25 80 0
Roosting 5 8.25 10 23.5 0 0
Vigilance 5 7.25 2 4.75 0 0
Locomotion 3 4.75 3 2.25 0 0
Agonistic 0 0.25 0 0.75 0 0
Lay date 80 55 126 33.5 102 63
Island size 0.12 0.18 0.09 0.08 0.2 0.23
Gull # 25 83.5 80.5 121.8 0 3
Nesting gulls Absent Present Absent

Anderson 69
Table 11. The results from the principle component analysis for the incubation period. The eigenvalue, cumulative proportion of variance explained, and principle component loading score are listed for each variable. Principle component loadings > 0.40 were considered significant.
Incubation
PC1 PC2 PC3 PC4 PC5
Eigenvalue 2.032 1.794 1.452 1.262 1.015
Cumulative Prop Var 0.203 0.383 0.528 0.654 0.756
Lay date -0.07 0.592 -0.19 -0.371 -0.014
Incubation -0.514 -0.194 0.026 -0.385 -0.061
Locomotion 0.425 -0.131 -0.43 -0.192 0.239
Roosting 0.085 0.499 0.006 0.375 0.078
Vigilance 0.446 -0.127 -0.403 0.113 0.065
Agonistic 0.348 -0.126 0.449 -0.355 -0.105
Foraging 0.307 -0.094 0.449 -0.258 0.429
Island size 0.152 -0.136 -0.291 -0.334 -0.636
Gull # 0.282 0.282 0.065 0.307 -0.571
Nesting gulls 0.163 0.531 0.531 -0.354 -0.047

Anderson 70
Table 12. Attributes of American oystercatcher broods identified by cluster analysis. Broods were distinguished into two groups. The median and interquartile range of each variable are given. Group
1 2
n = 21 n = 17
Variable Med IQR Med IQR
Chick care 0.00 0.50 0.00 4.13
Vigilance 6.75 21.75 26.75 17.63
Roosting 28.25 22.63 16.75 17.25
Forage 1.25 8.00 1.75 4.00
Locomotion 1.00 3.13 4.00 3.88
Agonistic 0.00 0.00 0.50 1.75
Self-maintenance 4.75 5.38 3.50 6.50
Chick age 14.50 15.50 13.00 15.13
Island size 0.10 0.20 0.10 0.12
Gull # 0.00 6.25 86.00 144.00
Nesting gulls Absent Present

Anderson 71
Table 13.The results from the principle component analysis for the chick rearing period. The eigenvalue, cumulative proportion variance explained, and principle component loading scores are listed for each variable. Principle component loadings > 0.40 were considered significant. Chick Rearing
PC1 PC2 PC3 PC4 PC5
Eigenvalue 2.988 1.677 1.354 0.993 0.790
Cumulative Prop Var 0.299 0.467 0.602 0.701 0.780
Chick age -0.158 -0.425 0.537 0.196 -0.080
Vigilant 0.403 -0.006 0.262 -0.008 0.549
Resting -0.406 -0.228 -0.039 -0.181 -0.381
Foraging -0.142 0.402 -0.171 0.708 -0.155
Chick care 0.357 0.142 -0.426 -0.274 -0.273
Locomotion 0.156 0.522 0.305 0.124 0.001
Agonistic 0.093 0.338 0.496 -0.209 -0.542
Gull # 0.476 -0.174 -0.125 -0.066 -0.237
Nesting gulls 0.421 0.266 0.228 0.141 -0.229
Other species 0.252 -0.343 -0.155 0.518 -0.213

Anderson 72
Table 14.The Mann Whitney results for comparing the median proportion of time spent per behavior category between successful and unsuccessful oystercatcher nests and broods. Significant difference (P < 0.05) was detected in roosting by nest fate category. Significant differences were also detected in roosting and vigilance by brood fate category. Behavior Incubation Chick Rearing
U P U P
Incubation 6879.5 0.15
Chick care 3400.5 0.267
Roosting 6476.5 0.042 3016.5 0.031
Vigilance 5059 0.108 4449.5 0.009
Self maintenance 5096.5 0.275 3622 0.884
Foraging 1310.5 0.132 3424 0.399

Anderson 73
Table 15. The median proportion of time spent per behavior category during the incubation period versus the absence or presence of gulls, number of gulls, absence or presence of nesting gulls, and nest fate. Significant differences were only detected in roosting by nest fate category.
Gulls present # of gulls Gulls nesting Nest fate
No Yes Low
(0-75)
High
(76-300) No Yes Hatch Fail
Incubation 93.7 95 95.6 92.5 96.8 90 97.5 91.5
Self-Maintenance 10.6 11.7 12.5 10 11.7 10 13.8 10
Roosting 11.8 19.4 15 17.5 17.7 17.5 12.5 37.5

Anderson 74
Table 16. The Mann Whitney results for comparing the total proportion of time spent per behavior category between the presence or absence of nesting gulls. No significant differences were detected for the incubation period. Significant differences were detected for chick care, roosting, and vigilant behaviors during the chick rearing period. Behavior Incubation Chick Rearing
U P U P
Incubation 9371.5 0.388
Chick care 12576 0.022
Roosting 6863.5 0.854 4872.5 0.013
Vigilance 5662.5 0.435 10601.5 0.000
Self maintenance 6327 0.351 12084.5 0.487
Foraging 1924.5 0.602 12440.5 0.071

Anderson 75
Table 17. The median proportion of time spent in roosting, vigilant, and chick care behaviors during the chick rearing period versus brood fate and the presence or absence of nesting gulls. Significant differences were detected in vigilance and roosting by brood fate category
Brood fate Gulls nesting
Fledge Fail No Yes
Roosting 29.3 16.3 31.3 18.8 Vigilance 13.6 36.3 12.5 32.5 Chick care 4.1 4.5

Anderson 76
Table 18. The results of the T-test analysis of scaled mass index versus the density of gulls and presence or absence of other nesting species. Scaled mass index differed significantly for all laughing gull variables.
T-test Mean scaled mass index SD ta P
Gulls absent or present
Absent 407.6 48.8 2.62 0.012
Present 364.3 60.4 Nesting gulls (Y/N) Yes 357.2 65
-2.2 0.033 No 398 52 Number of gulls 0-20 400.8 50.6
2.82 0.007 21-140 350.3 62.4 Other species nesting (Y/N) Yes 372.1 74.7
-1.07 0.289 No 392.1 49.4

Anderson 77
Figure 1. A year one hatchling and adult American oystercatcher. The hatchling is on the left and the adult on the right. Also pictured are the maroon color leg bands used during the study.

Anderson 78
Figure 2. Galveston Bay study area where breeding American oystercatchers were monitored.
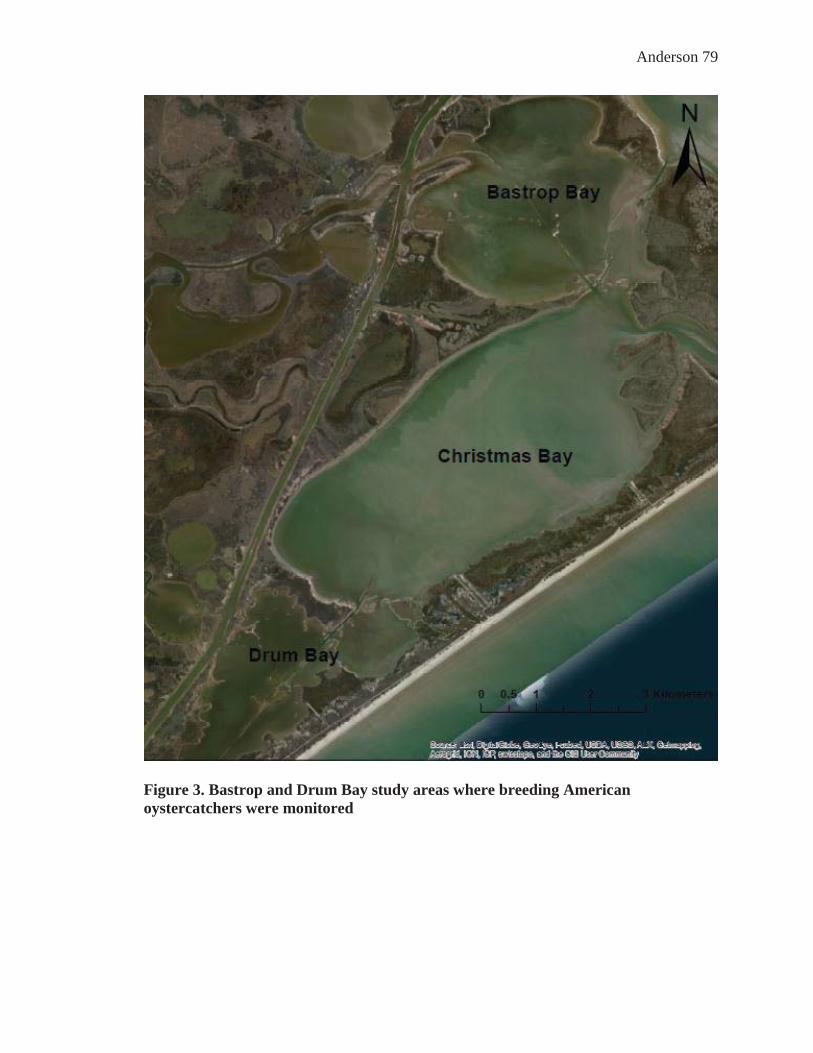
Anderson 79
Figure 3. Bastrop and Drum Bay study areas where breeding American oystercatchers were monitored

Anderson 80
Figure 4. An American oystercatcher nest with a full clutch of eggs.

Anderson 81
Figure 5. Conducting a time activity budget estimate on a breeding pair of American oystercatchers from an adjacent reef.

Anderson 82
Figure 6. A setup of a whoosh net and oystercatcher decoys employed to capture American oystercatcher breeding pairs.

Anderson 83
Figure 7. A box trap used to capture incubating American oystercatchers.

Anderson 84
Figure 8a-c. Morphometric measurements taken on American oystercatcher chicks 2013-2014. (a). unflattened wing chord length using a metal ruler. (b). culmen length using digital calipers. (c). weight measured using a digital spring scale
A
B
C

Anderson 85
Figure 9. Physical estimation of subcutaneous fat within the furculum region of American oystercatcher chicks.

Anderson 86
Figure 10. Two American oystercatcher chick carcasses found in West Galveston Bay in 2014.

Anderson 87
Figure 11. Nest survival of American oystercatchers using Program Mark. Daily survival rates and 95% confidence intervals were estimated from the model with the lowest ∆AICc value which incorporated a linear time trend and nest age. Day 1 of the season corresponds to 10 February.
0.91
0.92
0.93
0.94
0.95
0.96
0.97
0.98
0.99
1
0 1 2 3 4 5 6 7 8 9 101112131415161718192021222324252627
Dai
ly s
urvi
val r
ate
(DSR
)
Day of season

Anderson 88
Figure 12. Daily survival rates and 95% confidence intervals for nest survival of American oystercatchers predicted from the model incorporating the number of gulls.
0.93
0.94
0.95
0.96
0.97
0.98
0.99
1
0 50 100 150 200 250 300 350 400 450 500
Dai
ly s
urvi
val r
ates
Number of gulls

Anderson 89
Figure 13. Brood survival of American oystercatchers using Program Mark. Daily survival rates and 95% confidence intervals were estimated from the model with the lowest ∆AICc value which incorporated a quadratic time trend and the number of laughing gulls. Day 1 of the season corresponds to 10 March.
0.91
0.92
0.93
0.94
0.95
0.96
0.97
0.98
0.99
1
0 10 20 30 40 50 60 70 80 90 100 110 120 130 140
Dai
ly s
urvi
val r
ates
Day of season
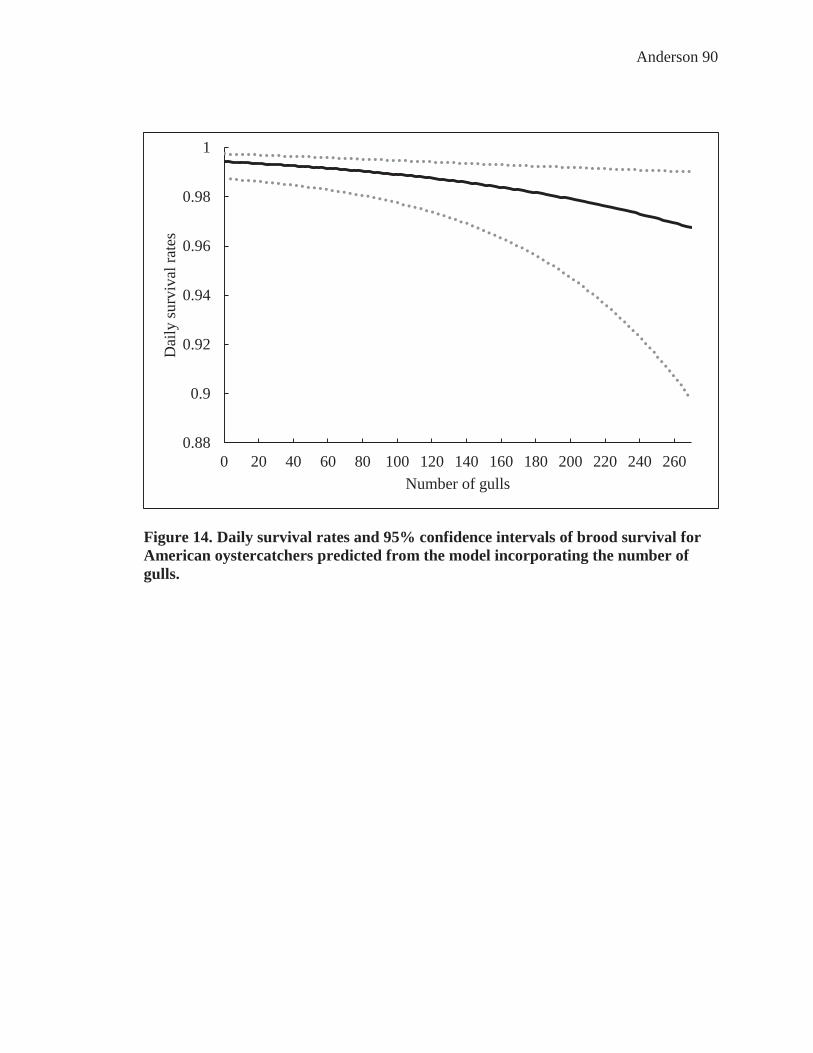
Anderson 90
Figure 14. Daily survival rates and 95% confidence intervals of brood survival for American oystercatchers predicted from the model incorporating the number of gulls.
0.88
0.9
0.92
0.94
0.96
0.98
1
0 20 40 60 80 100 120 140 160 180 200 220 240 260
Dai
ly s
urvi
val r
ates
Number of gulls

Anderson 91
Figure 15. The frequency of various causes for agonistic behaviors exhibited by American oystercatchers during the incubation and chick rearing periods for 2013-2014.
0
20
40
60
80
100
120
140
160
LAG
U
AM
OY
Other
bird spp.
Observer
Hum
an
Unknow
n
Freq
uenc
y
IncubationChick Rearing

Anderson 92
Figure 16. A dendrogram showing the classification of nests into three groups based on similarities in lay date, behavior, number of gulls, nesting gulls, and territory size. The cluster analysis method employed Euclidean distance metric and Wards linkage. All variables were standardized standardized prior to cluster analysis
GALB
164
DRU
MB3
0BA
STB1
4D
RUM
B29
GALB
118
GALB
156
GALB
116
DRU
MB2
8D
RUM
B24
GALB
115
GALB
102
DRU
MB2
3GA
LB14
7GA
LB10
1GA
LB11
2GA
LB10
5G
ALB8
1GA
LB12
5GA
LB12
1DR
UM
18BA
ST10
GALB
138
BAST
08SL
22DR
UM
09GA
LB16
8GA
LB11
7DR
UM
13G
ALB9
1BA
STB0
9GA
LB14
2G
ALB7
7GA
LB13
4GA
LB12
8G
ALB8
8G
ALB8
7G
ALB8
6G
ALB8
5BA
STB1
2BA
STB1
1G
ALB0
8BA
STB1
5D
RUM
B25
GALB
109
GALB
165
GALB
152
GALB
129
GALB
122
DRU
MB1
9G
ALB9
2G
ALB7
6GA
LB12
0G
ALB8
3G
ALB8
0DR
UM
12DR
UM
11G
ALB7
5
-134.24
-56.16
21.92
100.00
Nest
Sim
ilarit
y 1
2
3

Anderson 93
Figure 17. A biplot depicting nest scores and rescaled loading factors of the variables incorporated into the PCA analysis for the incubation period. 1
1 Biplot macro function used in Minitab 17 was provided by Keith Jewell. Tel: +44 (0) 1386 842055. Email: [email protected]

Anderson 94
Figure 18. A dendrogram showing the classification of broods into two groups based on similarities in chick age, behavior, number of gulls, nesting gulls, and territory size. The cluster analysis method employed the Euclidean distance metric and Wards linkage. All variables were standardized prior to cluster analysis.
GALB
163
GALB
117
GALB
121
GALB
90GA
LB10
9GA
LB13
1GA
LB16
6GA
LB11
6GA
LB11
0GA
LB83
GALB
158
GALB
112
GALB
153
GALB
101
GALB
96GA
LB82
GALB
140
GALB
135
BAST
B14
GALB
07GA
LB12
3GA
LB13
6GA
LB12
7GA
LB10
0SL
022
SL01
8D
RUM
B12
GALB
75GA
LB06
GALB
138
DRU
MB1
7GA
LB79
GALB
08GA
LB12
2SL
017
GALB
78D
RUM
B11
BAST
B10
-115.94
-43.96
28.02
100.00
Broods
Sim
ilarit
y 1 2

Anderson 95
Figure 19. A biplot depicting brood scores and rescaled factor loadings for variables incorporated into the PCA analysis for the chick rearing period.

Anderson 96
Figure 20. Boxplot displaying the median proportion of time spent in vigilance versus three categories of gull abundance during the nest rearing period. No significant differences were detected at the lower two gull abundances. Vigilance increased significantly when there was 100-300 gulls (H2 = 6.86, P = 0.032).
100-30050-990-49
0.5
0.4
0.3
0.2
0.1
0.0
Number of gulls
Prop
ortio
n of
tim
e in
vig
ilanc
e

Anderson 97
Figure 21. Boxplot displaying the median proportion of time spent in vigilance versus three categories of gull abundance during the chick rearing period. Vigilance increased significantly between broods from all gull abundance categories (H2 = 11.11, P = 0.004).
41-2301-400
1.0
0.8
0.6
0.4
0.2
0.0
Number of gulls
Prop
ortio
n of
tim
e in
vig
ilanc
e