The Extended Cycle of Solar Activity and the Sun’s 22-Year ...
21
Space Sci Rev (2014) 186:169–189 DOI 10.1007/s11214-014-0093-z The Extended Cycle of Solar Activity and the Sun’s 22-Year Magnetic Cycle E.W. Cliver Received: 13 May 2014 / Accepted: 14 August 2014 / Published online: 18 September 2014 © Springer Science+Business Media Dordrecht 2014 Abstract The Sun has two characteristic migrations of surface features—the equatorward movement of sunspots and the poleward movement of high-latitude prominences. The first of these migrations is a defining aspect of the 11-yr Schwabe cycle and the second is a tracer of the process that culminates in solar polarity reversal, signaling the onset of the 22-yr magnetic cycle on the Sun. Zonal flows (torsional oscillations of the Sun’s differential rotation) have been identified for both of these migrations. Helioseismology observations of these zonal flows provide support for the extended (>11-yr cycle) of solar activity and offer promise of a long-term precursor for predicting the amplitude of the Schwabe cycle. We review the growth of observational evidence for the extended and 22-yr magnetic cycles and discuss: (1) the significance of latitude ∼50 ◦ on the Sun; (2) the “over-extended” cycle; and (3) the outlook for solar cycle 25. Keywords Extended solar cycle · 22-Yr magnetic cycle · Schwabe cycle · Sunspots · Polar crown filaments 1 Introduction “Solar periodicity is a most complex phenomenon. The more it is studied, the less it seems to be understood.” Thus wrote Agnes Mary Clerke, the authoritative chronicler of 19th century astronomy, in 1903. In the intervening 100 plus years, our knowledge of the 11-yr solar cycle has increased dramatically (e.g., Hathaway 2010; Charbonneau 2010), but the understanding remains a challenge. For example, the 79 predictions for the peak smoothed sunspot number for cycle 24 reviewed by Pesnell (2012) range from 42 to 185, with the most probable value being nearer the lower end of that range (the current observed peak is ∼75 at the time of this writing). “Prediction ... ,” as Clerke wrote, “remains at fault.” Here we review the evolution of knowledge on the extended 18–22 year cycle of solar activity (Wilson et al. 1988) and the Sun’s 22-yr magnetic cycle (Hale and Nicholson 1925; Babcock 1961). We E.W. Cliver (B ) National Solar Observatory, Sunspot, NM, USA e-mail: [email protected]
Transcript of The Extended Cycle of Solar Activity and the Sun’s 22-Year ...

Space Sci Rev (2014) 186:169–189DOI 10.1007/s11214-014-0093-z
The Extended Cycle of Solar Activity and the Sun’s22-Year Magnetic Cycle
E.W. Cliver
Received: 13 May 2014 / Accepted: 14 August 2014 / Published online: 18 September 2014© Springer Science+Business Media Dordrecht 2014
Abstract The Sun has two characteristic migrations of surface features—the equatorwardmovement of sunspots and the poleward movement of high-latitude prominences. The firstof these migrations is a defining aspect of the 11-yr Schwabe cycle and the second is atracer of the process that culminates in solar polarity reversal, signaling the onset of the22-yr magnetic cycle on the Sun. Zonal flows (torsional oscillations of the Sun’s differentialrotation) have been identified for both of these migrations. Helioseismology observationsof these zonal flows provide support for the extended (>11-yr cycle) of solar activity andoffer promise of a long-term precursor for predicting the amplitude of the Schwabe cycle.We review the growth of observational evidence for the extended and 22-yr magnetic cyclesand discuss: (1) the significance of latitude ∼50◦ on the Sun; (2) the “over-extended” cycle;and (3) the outlook for solar cycle 25.
Keywords Extended solar cycle · 22-Yr magnetic cycle · Schwabe cycle · Sunspots · Polarcrown filaments
1 Introduction
“Solar periodicity is a most complex phenomenon. The more it is studied, the less it seems tobe understood.” Thus wrote Agnes Mary Clerke, the authoritative chronicler of 19th centuryastronomy, in 1903. In the intervening 100 plus years, our knowledge of the 11-yr solar cyclehas increased dramatically (e.g., Hathaway 2010; Charbonneau 2010), but the understandingremains a challenge. For example, the 79 predictions for the peak smoothed sunspot numberfor cycle 24 reviewed by Pesnell (2012) range from 42 to 185, with the most probable valuebeing nearer the lower end of that range (the current observed peak is ∼75 at the timeof this writing). “Prediction . . . ,” as Clerke wrote, “remains at fault.” Here we review theevolution of knowledge on the extended 18–22 year cycle of solar activity (Wilson et al.1988) and the Sun’s 22-yr magnetic cycle (Hale and Nicholson 1925; Babcock 1961). We
E.W. Cliver (B)National Solar Observatory, Sunspot, NM, USAe-mail: [email protected]

170 E.W. Cliver
focus on the two characteristic migrations of surface features on the Sun: the equatorwardmovement of sunspot formation and the poleward movement of high-latitude prominenceformation.
Sections 2 and 3 cover historical observations of sunspot and prominence migration andthe discovery of the 22-yr magnetic cycle on the Sun, respectively. In Sect. 4, we reviewrecent work on zonal flows of the Sun’s differential rotation in relation to the extended and22-yr cycles. Certain aspects of the extended activity cycle and the 22-yr magnetic cycle arediscussed further in Sect. 5.
2 Cyclic Migrations of Sunspots and Prominences
2.1 Movement of Sunspot Formation Toward the Equator
Carrington (1858) discovered the latitude variation of sunspot formation over the 11-yrSchwabe (1844) cycle. He wrote,
. . .throughout the two years preceding the minimum of frequency in February 1856,the spots were confined to an equatorial belt, and in no instance passed the limits of20° of latitude N. or S.; and that shortly after this epoch, whether connected with it ornot, this equatorial series appears to have become extinct, and in seeming contradic-tion to the precept, Natura non agit per saltum [Nature makes no leaps], two new beltsof disturbance abruptly commenced, the limits of which in both hemispheres, may beroughly set at between 20◦ and 40◦, with exceptions in favor of the old equatorialregion. The tendency at the present time appears to be contraction of the parallels.
In his book Spots on the Sun, Carrington (1863) wrote that the two fresh belts of sunspotsthat formed at high latitudes in the northern and southern hemisphere following the 1856minimum “have in subsequent years shown a tendency to coalesce and ultimately contractas before to extinction. Whether this is what appears at each period of increase and decreaseof frequency of the Spots must be left to observers who may follow me to show. At presentit is only probable that such is the case, and another contribution made to facts on the broadscale which will ultimately elucidate the origin of this phenomenon and instruct us on thequestion, ‘What is a Sun?’ ”
The pattern deduced by Carrington was codified by Spörer (1880) and illustrated byMaunder (1904) in the original butterfly diagram (Fig. 1) for cycles 12 and 13. Figure 2gives portraits of Edward Maunder and his wife Annie Russell Maunder who assisted himin the production of this iconic figure. Many years later, Annie Maunder (1940) described thecircumstances surrounding its creation, “We made this diagram in a week of evenings, onedictating and the other ruling these little lines. We had to do it in a hurry because we wantedto get it before the [Royal Astronomical] Society at the same meeting as the other sunspotobservers, whose views we knew to be heretical. As it turned out, this paper, especiallythe diagram—wiped Father Cortis’ and Prof. Lockyer’s papers clean off the slate, and fullyestablished the manner of procedure of the sunspot 11-year cycle.”
2.2 Movement of Low-Latitude Prominences Toward the Equator and High-LatitudeProminences Toward the Poles
Two other husband and wife teams (Evershed and Evershed 1917; d’Azambuja andd’Azambuja 1948) helped to establish the cyclic migrations of prominences during the

The Extended Cycle of Solar Activity and the Sun’s 22-Year Magnetic Cycle 171
Fig. 1 The Maunder butterfly diagram showing the latitude distribution of sunspots for Schwabe cycles 12and 13 (from Maunder 1904)
Fig. 2 Edward Walter Maunder(1851–1928) and Annie RussellMaunder (1868–1947). Photofrom Kinder (2008), dateunknown (With permission of theBritish AstronomicalAssociation)
solar cycle—the equatorward movement of low-latitude prominence formation in concertwith sunspots and the poleward movement of high-latitude prominence formation. An un-dated photograph circa 1915 of John and Mary Acworth Evershed (fifth and 6th from leftin the second row) with the staff at Kodaikanal Observatory is given in Fig. 3. The Ital-ian school of astronomers that included Respighi, Secchi, and Tacchini were the first tonote that prominences appeared near the poles only at solar maximum (Lockyer 1931;Waldmeier 1973). The Eversheds credit Riccò with discovering the general laws of promi-nence distribution in latitude over the solar cycle and Lockyer and Lockyer (1902) withconfirming them. A stylized diagram of the migrations of high- and low-latitude promi-nences from Riccò (1892) is shown in Fig. 4. Importantly, this figure shows oppositely di-rected migrations of high-latitude and low-latitude prominences starting from mid-latitudesnear solar minimum. The depicted poleward migration of low-latitude prominences toward

172 E.W. Cliver
Fig. 3 John Evershed(1864–1956) and Mary AcworthEvershed (1867–1949), fifth andsixth from right in the secondrow, with the staff of theKodaikanal Observatory circa1915 (With permission of theObservatory Science Centre,Herstmonceux/TerenceEvershed)
Fig. 4 Stylized diagram of themigrations of prominences overthe solar cycle (from Riccò1892). It captures theequatorward and polewardmigrations of prominences thatbegin near solar minimum. Themaximum to minimum phasedepicted here is incorrect (seetext)
Fig. 5 Migration ofprominences in latitude duringcycles 13, 14, and the onset ofcycle 15 (from Evershed andEvershed 1917), based onobservations from Kenley andKodaikanal. The black dots referto “a few sporadic zones whichdo not seem to play a part in thehistory of [the] main zones”.Times of solar minima (m) andmaxima (M) are indicated
mid-latitudes following solar maximum, however, is erroneous. Figure 5, taken from Ever-shed and Evershed (1917) and covering the interval from 1890–1914 shows that, followingthe disappearance in each solar cycle of the polar prominences, a new high-latitude branchforms at about 50◦ latitude in both hemispheres where it resides during the decay of the cy-cle to begin migrating poleward near solar minimum. This poleward migration was referredto by the Eversheds as a “dash to the pole” and in current usage has come to be called “the

The Extended Cycle of Solar Activity and the Sun’s 22-Year Magnetic Cycle 173
Fig. 6 Prominence migrations during cycles 12–15 (adapted from Bocchino 1933). Data for 1880–1911 arefrom Arcetri and for 1911–1930 are from various observatories including Catania, Madrid, and Zürich. Tracksare shown in each hemisphere for the polar crown filaments (top), the quiescent filaments that lay 10–15◦poleward of the sunspots (middle), and active region filaments (bottom; based on sunspot observations). Solarminima (m) are marked by dashed red lines
rush to the poles” (e.g., Ananthakrishnan 1954; Altrock 1997, 2014). A separate low-latitudebranch forms after solar minimum and moves equatorward.
An expanded plot of this behavior for the years 1880–1930 (adapted from Bocchino1933) is given in Fig. 6. Here it can be seen that the time-averaged migratory behaviorof the prominences (or filaments when viewed on the disk) is as systematic as that of thesunspots. For each solar cycle, three distinct branches of prominence activity can be seen orinferred in each hemisphere: (a) a high-latitude branch that moves poleward following solarminimum; (b) a lower-latitude branch which mimics the progression of sunspots toward theequator but is offset from the sunspot curve by ∼10–15◦ toward the poles; and (c) a branchthat overlays the sunspot migration. The three tracks in Fig. 6 correspond, respectively, tothe three classes of prominences defined by Waldmeier (1973): long-lived “polar crown”prominences/filaments that form at latitudes above 45◦ following sunspot maximum, long-lived quiescent prominences that have their maximum frequency of occurrence about 10–15◦
poleward of the sunspot zone, and active region prominences (which originally includedsuch phenomena as sprays and post-eruption loop systems). The cyclic migrations of thehigh- and low-latitude quiescent filament branches in Fig. 6 have been supported/extendedin subsequent studies by d’Azambuja and d’Azambuja (1948), Ananthakrishnan and Nayar(1954), Ananthakrishnan (1954), Li et al. (2008), and Li (2010). There are differences indetails among the various works that can be attributed to different latitude/time averagingintervals and data sets. Recent developments in the automatic recognition of solar filaments(e.g., Bernasconi et al. 2005; Labrosse et al. 2010; Schuh et al. 2014) promise to standardizethe results of such work.
The three tracks in Fig. 6 do not indicate motion of individual prominences but rather,just as is the case for sunspots, the migration of the locations of prominence formation (i.e.,filament channels; Martin 1998; Mackay et al. 2014). Even the longest-lived prominences,those in the polar crown, have maximum individual lifetimes of only about eight months(Smith and Smith 1963)—short in comparison with their migration times to the pole.

174 E.W. Cliver
3 Magnetic Polarity Reversals
3.1 Sunspots and the Hale-Nicholson Polarity Rule
In 1908 George Ellery Hale used the Zeeman (1897) effect to make his epochal discoveryof strong magnetic fields in sunspots (Hale 1908). Hale et al. (1919) reported that before theminimum in 1912 preceding cycle 15, “the magnetic polarity of unipolar spots and of thepreceding members of bipolar spots was positive [north] in the southern and negative [south]in the northern hemispheres of the Sun. Since the minimum these signs have reversed.” Atthe sunspot number minimum in 1923, the sunspot polarities for new solar cycle 16 in eachhemisphere reverted to the polarities of cycle 14. This enabled Hale and Nicholson (1925)to formulate the law of sunspot polarities: “The sun-spots of a new 11½-year cycle, whichappear in high latitudes after a minimum of solar activity, are of opposite magnetic polarityin the northern and southern hemispheres. As the cycle progresses the mean latitude ofthe spots in each hemisphere steadily decreases, but their polarity remains unchanged. Thehigh-latitude spots of the next 11½-year cycle, which begin to develop more than a yearbefore the low-latitude spots of the preceding cycle have ceased to appear, are of oppositemagnetic polarity.” Anticipating the subsequent polarity reversal at the end of cycle 16, Haleand Nicholson noted that while the periodicity in the number of spots was 11½ years, thefull sunspot period, which they called the “magnetic sun-spot period”, was 23 years. Today,this magnetic cycle is generally referred to as the 22-yr, or Hale, cycle based on a nominal11-yr Schwabe cycle.
3.2 Reversal of the Sun’s Polar Field
The father and son team of Harold and Horace Babcock, shown in Fig. 7, used the newly-developed solar magnetograph (Babcock 1953) of the Hale Solar Laboratory to detect ageneral (now called polar) magnetic field of the Sun of ∼1 G based on magnetograms takenfrom the interval August 1952 to October 1954 that spanned the April 1954 solar minimumpreceding cycle 19 (Babcock and Babcock 1955). Hale (1913) had been the first to attemptto look for such a field but, using the instrumentation available at the time, deduced a fieldof ∼50 G. The solar polar field (generally confined to latitudes >55◦) that the Babcocks de-tected was positive in the north and negative in the south (opposite to that of Earth). Babcockand Babcock noted that the polar fields during this period showed no signs of reversal thatmight have been expected to accompany the change in the hemispheric polarity of sunspotsover the 11-yr minimum. From the d’Azambuja’s description of the poleward migration ofthe polar crown filaments, Babcock and Babcock presciently inferred that the general fieldof the Sun would reverse polarity at the maximum of cycle 19—out of phase with the polar-ity reversal for the sunspot curve. Babcock (1959) subsequently observed this reversal of thedipolar field of the Sun, with the field at the north heliographic pole changing in mid-1957and the field in the south reversing in November 1958. The separation in time between thepolar field reversal in the two hemispheres is now recognized to be a common feature of thereversal of the large-scale polar field (Svalgaard and Kamide 2013). As expected (Babcock1961), the polar fields appeared to reverse, at least in the northern hemisphere, near the max-imum of cycle 20 (Howard 1972) but they were weak relative to the magnetograph noise,making it difficult to determine the exact timing. Here was a different, more fundamental,22-yr magnetic cycle, extending from (approximately) sunspot maximum to maximum overtwo ∼11 year intervals, rather than from minimum to minimum.

The Extended Cycle of Solar Activity and the Sun’s 22-Year Magnetic Cycle 175
Fig. 7 Harold Delos Babcock(1882–1968) and HoraceWelcome Babcock (1912–2003)(HDB image courtesy of theArchives, California Institute ofTechnology; HWB imagecourtesy of the Observatories ofthe Carnegie Institution forScience Collection at theHuntington Library, San Marino,California)
3.3 Reversal of the Flanking Magnetic Fields of the Polar Crown Filaments
There is evidence that the classical picture of the migration of the polar crown filaments inFig. 6 is overly-simplistic. Topka et al. (1982) and Makarov and Sivaraman (1989a, 1989b)showed that in a given hemisphere for certain cycles there can be multiple rushes to the polesof bands of filaments rather than a single poleward rush leading to polarity reversal. Topka etal. start the migration of the secondary and tertiary polar crown branches, in such sequences,at latitudes above ∼20◦, similar to the poleward moving ripples in Br reported by Ulrichand Tran (2013). Waldmeier (1973) had earlier noted the existence of a secondary zone ofhigh-latitude northern-hemisphere prominences that reached the pole during cycle 20. Nosuch occurrence had been observed for cycles 12 through 18, but Waldmeier allowed thata secondary rush of this type might have escaped notice in earlier cycles. Makarov andSivaraman (1989a) reported even more complex behavior for cycle 20 in the north—a three-fold polarity reversal (− to +, + to −, and − to +), consistent with Topka et al. (1982).Moreover, they deduced similar three-fold reversals in a single hemisphere for cycles 12,14, 16, and 19. Subsequently, Dermendjiev et al. (1994) reported a secondary polar crownin the southern hemisphere in cycle 22. Presumably, such multiple poleward migrations arerelated to the quasi-periodic ∼1–3 year fluctuations seen in the sunspot record (Krivova andSolanki 2002) and in the stronger surges of magnetic flux to high latitudes seen in butterflydiagrams of photospheric magnetic fields (Fig. 8, taken from Ulrich and Tran 2013).
Instead of the usual method of obtaining a mean or average location for the varioustypes of filaments (in which an arbitrary latitude—usually in the range from 40–60◦ (e.g.,Bretz and Billings 1959; Waldmeier 1973; Li et al. 2008; Kong et al. 2014)—is used toseparate the polar crown filaments from low-latitude filaments), Hansen and Hansen (1975)presented plots of all filaments observed on the Sun during several consecutive Carringtonrotations. The composite plot they constructed by tracing outlines of filaments in the CartesSynoptiques for the July–December 1967 interval is shown in Fig. 9 where it can be seenthat the polar crown filament in each hemisphere at this time lies at a latitude of ∼60◦.Equatorward of the polar crown filaments lies a band of filaments that extend poleward tothe east; these filaments are flanked on their north and south sides by opposite magneticpolarities to those in the polar crown and lie about ∼15◦ from the polar crown filamentswith a relatively well-defined gap in between.
McIntosh (1992) constructed the plot in Fig. 10 by taking the latitudes of the two mostpoleward filaments for each solar rotation, in both hemispheres. This shows clearly, at leastfor cycles 21 and 22, the rush to the poles of the polar crown filament beginning near solar

176 E.W. Cliver
Fig. 8 Latitudinal variation of the radial component of the photospheric magnetic field from mid-1974 tomid-2012 (from Ulrich and Tran 2013) (©AAS. Reproduced with permission)
Fig. 9 Superposed tracings of allfilaments in the CartesSynoptiques for July–December1967 (from Hansen and Hansen1975) (With kind permissionfrom Springer Science andBusiness Media)
Fig. 10 Maximum latitudes of filaments in the true and replacement polar crowns for both hemispheres forcycles 20–22 (from Webb 1997; McIntosh 1992). For cycle 21, the true polar crown begins the rush to thepoles in both hemispheres form ∼55◦ in 1976. The replacement polar crown (true polar crown for cycle 22)begins moving poleward shortly thereafter form ∼40◦ latitude. High-latitude filament behavior was morecomplex in cycle 20 (see text)

The Extended Cycle of Solar Activity and the Sun’s 22-Year Magnetic Cycle 177
Fig. 11 Solar polar field strengthfrom Wilcox Solar Observatoryfor 1976 to mid-2014 for theNorth (solid blue) and South(dashed red; negatived)hemispheres
minimum and the corresponding poleward progression of the replacement polar crown withopposite flanking polarities for the new magnetic cycle. As noted above, the march to thepoles of the polar crown for cycle 20 and its replacement by the polar crown for cycle21 was less stately. The onset of poleward movement of both types of filaments (true andreplacement polar crown) in Fig. 10 occurs near sunspot minimum. The disappearance ofthe polar crown filaments in each hemisphere occurs near the time of the reversal of thepolar fields (e.g., Waldmeier 1960) and sunspot maximum (Fig. 11). Here the reversal ofthe polar fields refers to the passage of the polar field strength through zero. As can beseen in Fig. 11, it takes several years for the field strength of the new field polarity to reachmaximum. Ulrich and Tran (2013) note that the initial broad surges of poleward moving fluxin the northern hemisphere in Fig. 8 are closely associated with the polarity reversals near1980, 1990, and 2000. Reversal is more complicated in the south although in each case, itfollows that in the north within ∼1 year. The replacement (new cycle) polar crown reachesits apex (at latitudes of ∼60–70◦) near polarity reversal and then, as the new polar crown,drifts equatorward to ∼50–55◦ where it resides before beginning its own rush to the polesnear solar minimum (Fig. 10). From a study of quiescent prominences at the end of cycle 20(1973–1976) that employed the Hanle (1924) effect, Leroy (1978) showed that the magneticpolarities flanking the polar crown filaments were opposite to those deduced by Rust (1967)from magnetograph observations during 1964–1965 at the end of cycle 19.
4 Cyclic Zonal Flows
The notion of an extended solar cycle of 12–14 (rather than ∼11) years originated in the19th century but it was the discovery of torsional oscillations of the Sun’s surface rotation inMt. Wilson Doppler data by Howard and LaBonte (1980) and LaBonte and Howard (1982)(see also Snodgrass 1985, 1992; Ulrich 2001; Howe et al. 2011) that brought the concept towide attention. The torsional oscillations reported by Howard and LaBonte (1980) providedevidence for an even longer extended cycle. They moved from pole to equator, starting nearsolar minimum, over a ∼22-year interval. The torsional oscillations consist of alternatingbands of faster and slower velocities, relative to the nominal differential rotation. The lat-itudinal derivative of the torsional oscillations, corresponding to maximal velocity shear,bisects the wings of the sunspot butterfly diagram in each hemisphere. As noted by LaBonteand Howard (1982), the torsional oscillations were the first large-scale velocity fields thatwere closely related to the solar cycle in space and time. The torsional oscillations are cur-rently also referred to as migrating zonal (parallel to the equator) flow bands or simply zonal

178 E.W. Cliver
flows (Howe 2009). Similar, but slightly different, migrating patterns in the differential rota-tion have also been detected by tracking surface magnetic features (e.g., Komm et al. 1993).In this case the strong magnetic field regions coincide with bands of slower-than-averagezonal flow.
Interest in the torsional oscillations or zonal flow bands was reinvigorated about twentyyears after their 1980 discovery when they were detected in helioseismology studies (Schou1999; Howe et al. 2000b; Toomre et al. 2000) based on inversion of rotational splittings ofsolar oscillation frequencies (e.g., Thompson et al. 1996; Schou et al. 1998; Howe 2009)observed by the Michelson Doppler Imager (MDI; Scherrer et al. 1995) on the Solar andHeliospheric Observatory (SOHO; Domingo et al. 1995) and by the Global OscillationNetwork Group (GONG; Harvey et al. 1996). Subsequent studies revealed that the zonalflows persisted deep into the convection zone (Howe et al. 2000a; Antia and Basu 2000;Vorontsov et al. 2002). Moreover, the zonal flows detected by this method exhibited a high-latitude poleward-moving branch (Antia and Basu 2001; Vorontsov et al. 2002) in additionto the equatorward-moving branch discovered by Howard and LaBonte.
Generally, the torsional oscillations are viewed as a secondary or side effect of the mag-netic activity cycle on the Sun’s differential rotation (Gilman 1992), in part because themaximum amplitude of the flow is only ∼5 m s−1 against a solar mean rotation rate atthe equator of ∼2000 m s−1 (and a more comparable mean velocity change across 1◦ oflatitude of ∼15 m s−1 in the sunspot zone). Proposed mechanisms to account for the tor-sional oscillations (see Howe 2009, for a review) include: Lorentz force feedback from themagnetic cycle (Schüssler 1981; Yoshimura 1981), thermal feedback (Spruit 2003), mag-netic quenching of (small-scale) turbulent angular momentum transport (Küker et al. 1999;Pipin 1999), or a combination of these effects (Rempel 2006). Recently, Beaudoin et al.(2013) attributed the zonal flows to modulation of angular-momentum transport by large-scale meridional flow.
4.1 The Extended Cycle of Solar Activity and the Equatorward-Propagating Branch of theZonal Flows
There are several lines of evidence that the solar activity cycle is longer than the nominal 11-yr sunspot cycle. The first indication came from the sunspots themselves. Figure 12, takenfrom Clerke (1903) shows Spörer’s observations of the mean latitude of sunspots duringsolar cycles 10 and 11. Quoting from Clerke, “spot production at minima [occurs in] twowidely separated zones in each hemisphere . . . the start of a new series [of sunspots] in highlatitudes [anticipates] the termination of the old. . . . [Figure 12] illustrates the nature of theprogression. The overlapping of the curves at minimum brings before us the remarkablecircumstance that, as a consequence of successive disturbances breaking out before thoseantecedent to them have expired, the full duration of each [cycle] is, not eleven but twelve tofourteen years.” Harvey (1992) compiled and re-analyzed reports of the first and last mag-netic bipoles, including ephemeral regions (Harvey and Martin 1973; Harvey et al. 1975;Martin and Harvey 1979) and Ca+ plage regions, for solar cycles 14–22 (Table 1), assigningregions to cycles on the basis of latitude, magnetic polarity, and “an understanding of thecharacteristics of the magnetic configuration of active regions as a function of latitude andtime.” The entries for more recent cycles in the table, which are based on higher resolutiondata, indicate a latitude range of ∼30–60◦ for the first bipoles in a cycle and extended cycledurations of ∼14–16 years.
Observations of the 5303 Å coronal green line (e.g., Waldmeier 1960; Leroy and Noens1983; Altrock 1997, 2014) reveal enhanced emission that appears at latitudes ∼70◦ near the

The Extended Cycle of Solar Activity and the Sun’s 22-Year Magnetic Cycle 179
Fig. 12 Overlapping meanlatitude curves of sunspots (boldlines) for cycles 10 and 11 asdetermined by Spörer (adaptedfrom Young 1897; reproduced inClerke 1903)
Table 1 First and last magnetic bipoles observed from cycles 14–22 and comparison of the resulting ex-tended cycle with the corresponding minimum-to-minimum cycle (from Harvey 1992)
CycleN
First region Last region Cycle duration (yrs)
Lat. Year �tN �tN+1 Year Lat. Extended Min-min
14 S21 1900.61 −1.1 +1.9 1915.45 N01 15.8 11.9
15 N20 1911.96 −1.6 +1.5 1925.13 N08 13.2 10.0
16 N34 1921.75 −1.8 +1.9 1935.51 N04 13.8 10.0
17 N48 1932.04 −1.6 +2.0 1946.19 N01 14.2 10.6
18 S30 1942.25 −2.0 +2.2 1956.53 N01 14.3 10.6
19 N42 1953.12 −1.2 +2.2 1967.12 S01 14.0 10.6
20 N46 1962.79 −2.1 +2.0 1978.45 S01 15.7 11.6
21 N61 1973.04 −3.5 +1.7 1988.48 S02 15.4 10.3
22 N32 1983.31 −3.5
11-yr cycle maximum and migrates equatorward to apparently join and move in concert withthe progression of sunspot formation to lower latitudes as can be seen in the composite inFig. 13 for cycles 18–20 (Leroy and Noens 1983). The continuation of this behavior in cycles21 through 23 is shown in Fig. 14 from Altrock et al. (2008). Extended cycle lengths deducedfrom green line measurements are ∼17–18 years. As noted above, the surface torsionaloscillations reported by Howard and LaBonte (1980) moved from pole to equator over a22-year interval.
Wilson et al. (1988) compiled the lines of evidence available at that time to argue foran extended solar cycle of 18–22 years (Fig. 15). Since the overlap between 11-yr sunspotcycles had been known since the 19th century and the coronal green line has been rou-tinely monitored since 1939 (Rybanský et al. 2005), the torsional oscillations along withthe ephemeral regions of Harvey and Martin were the key new pieces of evidence that drewattention to an extended cycle, in this case up to twice as long as the Schwabe cycle.
Even before the Wilson et al. (1988) paper, however, the 22-yr duration of the torsionaloscillations was being questioned. Snodgrass (1985) reanalyzed the Mt. Wilson Dopplerdata and concluded that the torsional oscillation began during ∼1973.5–1974.5, roughlythree years after the polar field reversal (Makarov and Sivaraman 1989a) and closer to lati-tude 45◦ than 90◦ in both hemispheres, although it appeared to end at ∼10◦ near the maxi-mum of the following cycle rather than at the equator near minimum.
The equatorward zonal flow discovered via helioseismology in cycle 23 began at ∼45◦in 2003 (Fig. 16; Howe et al. 2013), about three years after polarity reversal (Fig. 11). Thisdelay from polarity reversal and mid-latitude onset were consistent with that inferred from

180 E.W. Cliver
Fig. 13 Superposed epoch plotof the standard deviation of5303 Å emission at each latituderecorded at Pic du Midi from1944–1974 showing high-latitude(rush to the poles) andlow-latitude (sunspot-related)branches of coronal emission(from Leroy and Noens 1983)(Reproduced with permission©ESO)
Fig. 14 Annual northern- plussouthern-hemisphere averages ofthe number of coronal activitylocal maxima from 1973 through2006 (from Altrock et al. 2008)
Fig. 15 The extended solarcycle for cycles 19–21 showingthe time and latitudinal extensionof the sunspot cycle inferredfrom reversed polarity ephemeralactive regions (circles with dots),coronal green line emission(vertical lines), and the torsionaloscillations (contoured hatching)(adapted from Wilson et al. 1988)(Adapted by permission fromMacmillan Publishers Ltd:Nature)
The Extended Cycle of Solar Activity and the Sun’s 22-Year Magnetic Cycle 181
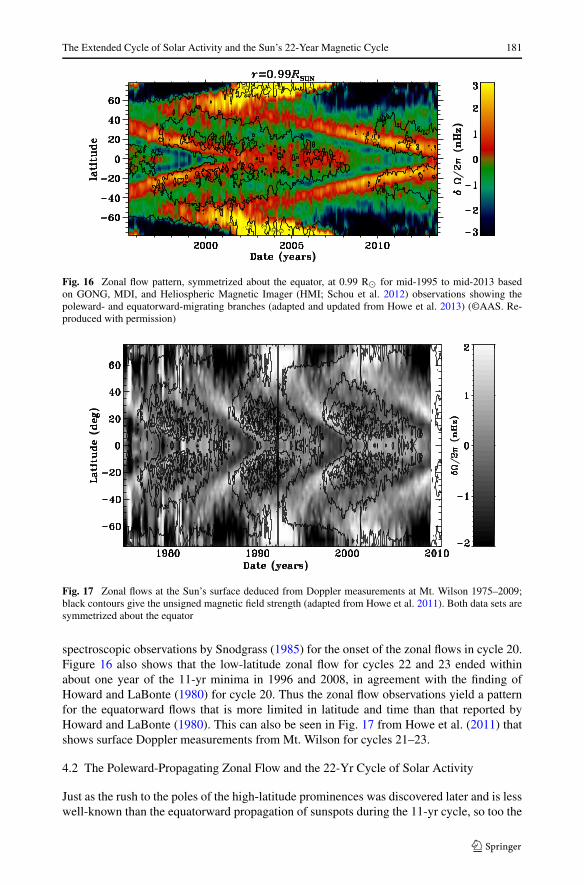
Fig. 16 Zonal flow pattern, symmetrized about the equator, at 0.99 R� for mid-1995 to mid-2013 basedon GONG, MDI, and Heliospheric Magnetic Imager (HMI; Schou et al. 2012) observations showing thepoleward- and equatorward-migrating branches (adapted and updated from Howe et al. 2013) (©AAS. Re-produced with permission)
Fig. 17 Zonal flows at the Sun’s surface deduced from Doppler measurements at Mt. Wilson 1975–2009;black contours give the unsigned magnetic field strength (adapted from Howe et al. 2011). Both data sets aresymmetrized about the equator
spectroscopic observations by Snodgrass (1985) for the onset of the zonal flows in cycle 20.Figure 16 also shows that the low-latitude zonal flow for cycles 22 and 23 ended withinabout one year of the 11-yr minima in 1996 and 2008, in agreement with the finding ofHoward and LaBonte (1980) for cycle 20. Thus the zonal flow observations yield a patternfor the equatorward flows that is more limited in latitude and time than that reported byHoward and LaBonte (1980). This can also be seen in Fig. 17 from Howe et al. (2011) thatshows surface Doppler measurements from Mt. Wilson for cycles 21–23.
4.2 The Poleward-Propagating Zonal Flow and the 22-Yr Cycle of Solar Activity
Just as the rush to the poles of the high-latitude prominences was discovered later and is lesswell-known than the equatorward propagation of sunspots during the 11-yr cycle, so too the

182 E.W. Cliver
Fig. 18 Rotation rate residualsat 0.99 R� from MDI/HMI forcomparable intervals in cycles 23(top) and 24 (bottom). Note therelative weakness of the polarflows in cycle 24 (2009–present)relative to cycle 23 (1996–2008)(adapted and updated from Howeet al. 2013) (©AAS. Reproducedwith permission)
poleward-moving branch of the torsional oscillations (Fig. 16) was discovered later than theequatorward moving branch and as a result has been less well-studied. Howard and LaBonte(1980) did not detect a poleward-propagating branch of the torsional oscillations, althoughLivingston and Duvall (1979) had reported a “spin-up” of the high-latitude rotation rate nearthe solar maximum of solar cycle 20. Subsequently, Snodgrass (1985) reported fast zonalflows at high latitudes at or near the maxima of both cycles 20 and 21. Discovery of thehigh-latitude poleward-moving branch by seismological methods (Antia and Basu 2001)was also delayed slightly relative to that of the low-latitude equatorward moving branch.The high-latitude branch was found to penetrate to the tachocline (Vorontsov et al. 2002;Basu and Antia 2003).
The polar zonal flow is intimately connected (either as a tracer or a driver) to the reversalof the Sun’s polar fields, and thus the 22-yr magnetic cycle, in space and time. The rushto the poles of the polar crown filaments in cycles 20–22 lags the preceding 11-yr minimaby intervals ranging from ∼5–20 solar rotations (Fig. 10). For comparison the onset of thepoleward moving branch of the zonal flows in cycles 23 and 24 lags the preceding min-ima by ∼10 and ∼20 rotations, respectively (Figs. 16 and 18). From approximately 2002through 2004 the polar flow is a prominent feature above 60◦ (Fig. 16). The mean polar fieldreached its maximum field strength in 2004 (Fig. 11). The subsequent decay of the polar

The Extended Cycle of Solar Activity and the Sun’s 22-Year Magnetic Cycle 183
Fig. 19 Schematic diagramdepicting zonal flows and solarsurface migrations of sunspotsand polar crown filaments (PCF)for a nominal 11-yr solar cycle.In this representation, theassociated extended cycle has aduration of ∼15 years. M = timeof solar maximum
field corresponds roughly to the beginning of the disappearance of the zonal flow from theobservable polar regions in 2005.
The apparent absence of the polar zonal flow early in cycle 24 (Howe et al. 2011;Hill et al. 2011) raised the possibility that cycle 25 would not appear and that we couldbe entering a grand minimum. However, further analysis by Howe et al. (2013) showedthat the high-latitude zonal flow is present in cycle 24. Following the flux-transport modelof Rempel (2006, 2012) which links weaker polar fields to a slower high-latitude rotationrate, Howe et al. (2013) subtracted a mean rotation rate based on the rise phase of cycle 24(∼2009–2012.5) (rather than mean rate for all of cycle 23) from the helioseismic data toreveal the onset of the poleward propagating branch of the zonal flow in the residuals forcycle 24 (Fig. 18, bottom), although it is less well defined than was the case for cycle 23(Fig. 18, top). Similarly, Altrock (2014) reported that the rush to the poles in the green linewas unusual in cycle 24; in particular the branch in the south was either weak or absent inthe southern hemisphere as late as early 2011.
5 Discussion
We have reviewed the evolution of thought/knowledge on the extended and 22-yr solar cy-cles in the framework of the two characteristic migrations of surface features on the Sun:(a) the equatorward motion of sunspots; and (b) the poleward motion of high-latitude promi-nences. In this section we comment on certain aspects of the extended and 22-year cy-cle that have the polar crown filament/rush to the poles phenomenon as a common thread.A schematic depicting the spatial/temporal relationship between the equatorward and pole-ward solar surface migrations and their corresponding zonal flows for a nominal 11-yr cycleis given in Fig. 19 as an aid to the discussion.
5.1 Latitude ∼50◦
The latitude ∼50◦ (range from ∼40–60◦) is a key fiducial on the Sun. Newton (1958) wrote,“. . . the prominences in the latitudes beyond the sunspot belt . . . reach their greatest fre-quency between sunspot minimum and maximum when their average latitude of about 50◦north and south is beginning to move rapidly towards the Sun’s polar regions, which theyreach just after sunspot maximum. After a brief but distinct discontinuity they appear again

184 E.W. Cliver
around latitude 50◦, to which they hold with lessened frequency throughout sunspot mini-mum, until with the rising activity of a new cycle, they rise to maximum frequency and ‘rushto the pole’ [Fig. 6].”
The diverging migrations of low- and high-latitude filaments beginning near solar min-imum were qualitatively illustrated by Riccò in 1892, and documented in the first half ofthe 20th century by Evershed and Evershed (1917), Bocchino (1933), and d’Azambujaand d’Azambuja (1948). Nevertheless, the notion of a latitudinal divide in solar activ-ity at ∼50◦, between the upper limit of the extended cycle and the solar minimum res-idence of the polar crown filaments has not taken hold. The transition at ∼50◦ be-tween the equatorward- and poleward migrations of zonal flows (Antia and Basu 2001;Vorontsov et al. 2002) brings renewed attention to this latitude (Fig. 19).
5.2 The Over-extended Cycle
The premise of the extended cycle is that the equatorward migration of sunspots during agiven solar cycle can be extended to higher latitudes and earlier times by considering formsof solar activity that can be detected prior to sunspots. One such type of activity is thetorsional oscillation. The Wilson et al. (1988) proposal of an 18–22 year cycle was based inlarge part on Howard and LaBonte’s (1980) finding that the torsional oscillation extendedfrom ∼90◦ to ∼0◦ over 22 years, beginning at solar minimum. However, helioseismologyanalysis of the zonal flows (Fig. 16) indicate a starting latitude of the equatorward-movingbranch of ∼45◦ and a corresponding reduction in length of the proposed extended cycle.
Wilson et al. also included coronal green line emission as evidence for a high-latitude(>70◦) origin for the extended cycle. The green line emission exhibits both a high-latitudebranch associated with the rush to the poles and an equatorward-moving branch associ-ated with sunspot formation. Figure 13 shows how the two may be conflated. In this fig-ure, at about the same time the high-latitude emission in the northern hemisphere is mov-ing equatorward to ∼60◦, the green line emission associated with the extended cycle ismaking its appearance near 40◦. One is inclined to connect the dots—thereby erroneouslylinking the two fundamentally different migrations of solar activity—at the time/latitudewhere Leroy and Noens (1983) cautiously inserted a question mark. The behavior of thehigh-latitude branch has been recently modeled by Robbrecht et al. (2010) using data fromthe Extreme-ultraviolet Imaging Telescope (Delaboudinière et al. 1995). They associate thehigh-latitude EUV emission with the boundary of the polar coronal hole (Wang et al. 1997;Benevolenskaya et al. 2001). In simple terms, the sequential equatorward, then poleward,motion of the band of high-latitude coronal emission (and the underlying polar crown fila-ment, Fig. 10) following polarity reversal is viewed as a reflection of the waxing and waningof the polar coronal hole as the polar field first strengthens during the decline of the cycleand then begins to weaken near minimum (Fig. 11) in concert with the rush to the poles.In a latitude vs. time plot, the migration track of the polar crown filaments (and associatedhigh-latitude green line emission) makes a U-turn (Fig. 19). Comparison of Figs. 10 and 11shows that the stationary residence of the new polar crown filament at ∼50–60◦ precedingthe 1986 solar minimum corresponds to the broad maximum in polar field strength. Altrock(2014) has presented recent green-line evidence for the extended cycle beginning at 65◦ in∼2003 during cycle 24. However, like Robbrecht et al. (2010), Tappin and Altrock (2013)and Altrock (2014) link the high-latitude emission to streamers overlying polar crown fila-ments which do not migrate below ∼50◦ to become part of the extended cycle.
Recently, Petrie et al. (2014) have re-visited the analysis of Robbrecht et al. (2010) andconcluded that “The question of whether the extended cycle connects more to the main

The Extended Cycle of Solar Activity and the Sun’s 22-Year Magnetic Cycle 185
cycle or the march to the poles phenomena in green line variance remains open. The evi-dence more strongly indicates connection with the main cycle [as seen in their Fig. 7, ourFig. 16], and this would match the patterns of the interior torsional oscillations and photo-spheric ephemeral bipoles.” Physically linking the contiguous high-latitude and low-latitudebranches of the green line emission in Figs. 13 and 14 has the appeal of Occam’s razor. Thepreponderance of evidence, however, supports the picture of Benevolenskaya et al. (2001)and Robbrecht et al. (2010). For example, in the contour diagram in Fig. 14 of 5303 Å peaks,consider the enhancements between ∼67–77◦ centered on ∼1979.5 and ∼1989.5 that ap-pear to be the highest latitude components of an extended cycle. Comparison with the McIn-tosh plot of polar crown filaments in Fig. 10 indicates that in 1979 and 1989 the polar crownfilaments were located between ∼65–75◦, while undergoing their rush to the poles duringcycles 21 and 22, respectively. Inspection of the magnetic butterfly diagram in Fig. 8 revealsstrong poleward surges of trailing polarity flux with leading edges between ∼60–65◦ in bothhemispheres at these times. The relative locations of green line enhancements, polar crownfilaments, and magnetic flux surges in these two cases are consistent with the picture that thegreen line emission overlies the polar crown filaments and results from the encroachment oftrailing polarity magnetic flux on the opposite polarity flux of the polar coronal hole. BothBenevolenskaya et al. (2001) and Robbrecht et al. (2010) stress the role of trailing polarityflux in creating the enhanced high-latitude green line emission but it seems clear that pole-ward “counter-surges” of leading polarity flux (Ulrich and Tran 2013) will also play a role,particularly later in the cycle, for the new polar crown filament which has opposite flankingmagnetic polarities to that of its predecessor (Fig. 19). Such counter-surges may contributeto the concentrations of 5303 Å peaks at ∼55–65◦ centered at ∼1983.5, ∼1993, and ∼2004in Fig. 14. Finally, the interior torsional oscillations to which Petrie et al. (2014) refer ap-pear to originate at ∼45◦ latitude (Fig. 16) rather than the higher latitudes of these greenline features while the new cycle ephemeral regions exhibit broad latitudinal scatter whichstraddles the polar crown magnetic inversion line (see Fig. 5 in Harvey 1994). Nonetheless,we agree with Petrie et al. (2014) that further study of the latitudinal limit of the green linemanifestation of the extended cycle is in order.
To summarize, there is an extended cycle, as was known since the 19th century (Fig. 12)from sunspot data. An 18–22 year (∼70◦–0◦) extended cycle is not supported by the dataalthough a 13–16 year cycle (Table 1), assuming a nominal 11-yr Schwabe cycle, that ex-tends poleward to the ∼50◦ delineator between the equatorward motion of ephemeral re-gions/sunspots and the poleward movement of polar crown filaments is well-established,and is supported by observations of green line emission (Figs. 13 and 14) and zonal flows(Figs. 16 and 17).
5.3 The Poleward-Propagating Branch of Zonal Flow During Cycle 24 and the Amplitudeof Cycle 25
The rush to the poles phenomenon first observed in solar prominences and subsequently inthe coronal green-line emission and the zonal flows is intimately connected with polarityreversal and the ensuing development of the polar fields. The polar field strength at solarminimum is thought to be the most reliable precursor for predicting the peak sunspot numberof the following cycle (e.g., Schatten et al. 1978; Svalgaard et al. 2005). The onset of therush to the poles phenomenon precedes the peak of the cycle whose amplitude it is linkedto by ∼15 years (e.g., 1997 rush to poles onset in cycle 23 (Fig. 14) and ∼2014 cycle24 maximum), making it a potential long-term predictor of solar cycle amplitude. Morerealistically, if mid-term (3–5 years after onset) development of the high-latitude zonal flow

186 E.W. Cliver
has predictive value, the schematic in Fig. 19 indicates a lead time of ∼10 years. Thus(echoing Komm et al. 2014), it will be of great interest to see if the stunted development ofthe poleward-propagating zonal flows (Fig. 18) and green line emission in cycle 24 (Altrock2014), relative to cycle 23, translate into a further reduction in the cycle-to-cycle polar fieldstrength at the next minimum and a prediction that cycle 25 will be weaker than cycle 24.
Acknowledgements I thank André Balogh, Hugh Hudson, Kristóf Petrovay, and Rudolf von Steiger fororganizing a timely and stimulating workshop. I am grateful to: Dick Altrock, Rainer Arlt, Sara Martin,Alexei Pevtsov, and Leif Svalgaard for helpful comments/discussions, Tom Bogdan for providing the text ofA. Maunder’s letter, and Rachel Howe for providing updated/modified versions of Figs. 16, 17, and 18.
References
R.C. Altrock, An ‘extended solar cycle’ as observed in FeXIV. Sol. Phys. 170, 411–423 (1997)R.C. Altrock, Forecasting the maxima of solar cycle 24 with coronal Fe XIV emission. Sol. Phys. 289, 623–
629 (2014)R. Altrock, R. Howe, R. Ulrich, Solar torsional oscillations and their relationship to coronal activity, in Sub-
surface and Atmospheric Influences on Solar Activity, ed. by R. Howe, R.W. Komm, K.S. Balasubrama-niam, G.J.D. Petrie. ASP Conference Series, vol. 383 (2008), pp. 335–342
R. Ananthakrishnan, Prominence activity (1905–1952). Proc. Indian Acad. Sci. 40, 72–90 (1954)R. Ananthakrishnan, P.M. Nayar, Discussions of the results of observations of solar prominences made at
Kodaikanal from 1905–1950. Bulletin No. 137 of Kodaikanal Observatory (1954)H.M. Antia, S. Basu, Temporal variations of the rotation rate in the solar interior. Astrophys. J. 541, 442–448
(2000)H.M. Antia, S. Basu, Temporal variations of the solar rotation rate at high latitudes. Astrophys. J. Lett. 559,
L67–L70 (2001)H.W. Babcock, The solar magnetograph. Astrophys. J. 118, 387–396 (1953)H.D. Babcock, The Sun’s polar magnetic field. Astrophys. J. 130, 364–365 (1959)H.W. Babcock, The topology of the Sun’s magnetic field and the 22-year cycle. Astrophys. J. 133, 572–587
(1961)H.W. Babcock, H.D. Babcock, The Sun’s magnetic field, 1952–1954. Astrophys. J. 121, 349–366 (1955)S. Basu, H.M. Antia, Changes in solar dynamics from 1995 to 2002. Astrophys. J. 585, 553–565 (2003)P. Beaudoin, P. Charbonneau, E. Racine, P.K. Smolarkiewicz, Torsional oscillations in a global solar dynamo.
Sol. Phys. 282, 335–360 (2013)E.E. Benevolenskaya, A.G. Kosovichev, J.R. Lemen, P.H. Scherrer, G.L. Slater, Detection of high-latitude
waves of solar coronal activity in extreme-ultraviolet data from the Solar and Heliospheric ObservatoryEUV Imaging Telescope. Astrophys. J. Lett. 554, L107–L110 (2001)
P.N. Bernasconi, D.M. Rust, D. Hakim, Advanced automated solar filament detection and characterizationcode: description, performance, and results. Sol. Phys. 228, 97–117 (2005)
G. Bocchino, Migrazione delle protuberanze durante il ciclo undecennale dell’attivatà solare. Oss. Mem. Oss.Astrofis. Arcetri 51, 5–47 (1933)
M.C. Bretz, D.E. Billings, Analysis of emission corona 1942–1955 from Climax spectrograms. Astrophys. J.129, 134–145 (1959)
R.C. Carrington, On the distribution of the solar spots in latitudes since the beginning of the year 1854, witha map. Mon. Not. R. Astron. Soc. 19, 1–3 (1858)
R.C. Carrington, Observations of the Spots on the Sun from November 9, 1853 to March 24, 1861 (Williamsand Norgate, London, 1863), p. 17
P. Charbonneau, Dynamo models of the solar cycle. Living Rev. Sol. Phys. 7, 3 (2010)A.M. Clerke, Problems in Astrophysics (Black, London, 1903), pp. 150–152L. d’Azambuja, M. d’Azambuja, A comprehensive study of solar prominences and their evolution from spec-
troheliograms obtained at the observatory and from synoptic maps of the chromosphere published at theobservatory. Ann. Obs. Meudon 6(Fasc. VII), 1–278 (1948)
J.-P. Delaboudinière, G.E. Artzner, J. Brunaud, A.H. Gabriel, J.F. Hochedez, F. Millier, X.Y. Song, B. Au etal., EIT: extreme-ultraviolet imaging telescope for the SOHO mission. Sol. Phys. 162, 291–312 (1995)
V.N. Dermendjiev, K.Y. Stavrev, V. Rušin, M. Rybansky, Secondary polar zone of prominence activity re-vealed from Lomnicky Štìt observations. Astron. Astrophys. 281, 241–244 (1994)
V. Domingo, B. Fleck, A.I. Poland, The SOHO mission: an overview. Sol. Phys. 162, 1–37 (1995)J. Evershed, M.A. Evershed, Results of prominence observations. Mem. Kodaikanal Obs. 1, 55–126 (1917)

The Extended Cycle of Solar Activity and the Sun’s 22-Year Magnetic Cycle 187
P.A. Gilman, What can we learn about solar cycle mechanisms from observed velocity fields? in The SolarCycle, ed. by K.L. Harvey. ASP Conference Series, vol. 27 (ASP, San Francisco, 1992), pp. 241–255
G.E. Hale, On the probable existence of a magnetic field in sun-spots. Astrophys. J. 28, 315–343 (1908)G.E. Hale, Preliminary results of an attempt to detect the general magnetic field of the Sun. Astrophys. J. 38,
27–98 (1913)G.E. Hale, S.B. Nicholson, The law of sun-spot polarity. Astrophys. J. 62, 270–300 (1925)G.E. Hale, F. Ellerman, S.B. Nicholson, A.H. Joy, The magnetic polarity of sun-spots. Astrophys. J. 49,
153–178 (1919)W. Hanle, Über magnetische Beeinflussung der Polarisation der Resonanzfluoreszenz. Z. Phys. 30, 93–105
(1924)R. Hansen, S. Hansen, Global distribution of filaments during solar cycle no. 20. Sol. Phys. 44, 225–230
(1975)K.L. Harvey, The cyclic behavior of solar activity, in The Solar Cycle, ed. by K.L. Harvey. ASP Conference
Series, vol. 27 (ASP, San Francisco, 1992), pp. 335–367K.L. Harvey, The solar magnetic cycle, in Solar Surface Magnetism, ed. by R.J. Rutten, C.J. Schrijver
(Kluwer, Dordrecht, 1994), pp. 347–363K.L. Harvey, S.F. Martin, Ephemeral active regions. Sol. Phys. 32, 389–402 (1973)K.L. Harvey, J.W. Harvey, S.F. Martin, Ephemeral active regions in 1970 and 1973. Sol. Phys. 40, 87–102
(1975)J.W. Harvey, F. Hill, R. Hubbard, J.R. Kennedy, J.W. Leibacher, J.A. Pintar, P.A. Gilman, R.W. Noyes et al.,
The global oscillation network group (GONG) project. Science 272, 1284–1286 (1996)D.H. Hathaway, The solar cycle. Living Rev. Sol. Phys. 7, 1 (2010)F. Hill, R. Howe, R. Komm, J. Christensen-Dalsgaard, T.P. Larson, J. Schou, M.J. Thompson, Large-scale
zonal flows during the solar minimum – where is cycle 25? Bull. Am. Astron. Soc. 43, 16.10 (2011)R. Howard, Polar magnetic fields of the Sun: 1960–1971. Sol. Phys. 25, 5–13 (1972)R. Howard, B.J. LaBonte, The Sun is observed to be a torsional oscillator with a period of 11 years. Astrophys.
J. Lett. 239, L33–L36 (1980)R. Howe, Solar interior rotation and its variation. Living Rev. Sol. Phys. 6, 1 (2009)R. Howe, J. Christensen-Dalsgaard, F. Hill, R.W. Komm, R.M. Larsen, J. Schou, M.J. Thompson, J. Toomre,
Deeply penetrating banded zonal flows in the solar convection zone. Astrophys. J. Lett. 533, L163–L166(2000a)
R. Howe, R. Komm, F. Hill, Variations in solar sub-surface rotation from GONG data 1995–1998. Sol. Phys.192, 427–435 (2000b)
R. Howe, F. Hill, R. Komm, J. Christensen-Dalsgaard, T.P. Larson, J. Schou, M.J. Thompson, R. Ulrich,The torsional oscillation and the new solar cycle, in GONG–SoHO 24: A New Era of Seismology of theSun and Solar-Like Stars. Journal of Physics: Conference Series, vol. 271 (IOP, Bristol, 2011), Issue 1,id. 012074
R. Howe, J. Christensen-Dalsgaard, F. Hill, R. Komm, T.P. Larson, M. Rempel, J. Schou, M.J. Thompson,The high-latitude branch of the solar torsional oscillation in the rising phase of cycle 24. Astrophys. J.Lett. 767, L20 (2013), 4 pp.
A.J. Kinder, Edward Walter Maunder FRAS (1851–1928): his life and times. J. Br. Astron. Assoc. 118, 21–42(2008)
R.W. Komm, R.F. Howard, J.W. Harvey, Torsional oscillation patterns in photospheric magnetic features.Sol. Phys. 143, 19–39 (1993)
R. Komm, R. Howe, I. González Hernández, F. Hill, Solar-cycle variation of subsurface zonal flow. Sol. Phys.289, 3435–3455 (2014)
D.F. Kong, Z.N. Qu, Q.L. Guo, Revisiting the question: does high-latitude solar activity lead low-latitudesolar activity in time phase? Astron. J. 147, 97 (2014), 7 pp.
N.A. Krivova, S.K. Solanki, The 1.3-year and 156-day periodicities in sunspot data: wavelet analysis suggestsa common origin. Astron. Astrophys. 394, 701–706 (2002)
M. Küker, R. Arlt, R. Rüdiger, The Maunder minimum as due to magnetic Λ-quenching. Astron. Astrophys.343, 977–982 (1999)
B.J. LaBonte, R. Howard, Torsional waves on the sun and the activity cycle. Sol. Phys. 75, 161–178 (1982)N. Labrosse, S. Dalla, S. Marshall, Automatic detection of limb prominences in 304 Å EUV images. Sol.
Phys. 262, 449–460 (2010)J.L. Leroy, On the orientation of magnetic fields in quiescent prominences. Astron. Astrophys. 64, 247–252
(1978)J.-L. Leroy, J.-C. Noens, Does the solar activity cycle extend over more than an 11-year period? Astron.
Astrophys. 120, L1–L2 (1983)K.J. Li, Latitude migration of solar filaments. Mon. Not. R. Astron. Soc. 405, 1040–1046 (2010)

188 E.W. Cliver
K.J. Li, Q.X. Li, P.X. Gao, X.J. Shi, Cyclic behavior of solar full-disk activity. J. Geophys. Res. 113, A11108(2008)
W. Livingston, T.L. Duvall Jr., Solar rotation, 1966–1978. Sol. Phys. 61, 219–231 (1979)W.J.S. Lockyer, On the relationship between solar prominences and the forms of the corona. Mon. Not. R.
Astron. Soc. 91, 797–809 (1931)N. Lockyer, W.J.S. Lockyer, Solar prominence and spot circulation, 1872–1901. Proc. R. Soc. Lond. 71,
446–452 (1902)D.H. Mackay, C.R. DeVore, S.K. Antiochos, Global-scale consequences of magnetic-helicity injection and
condensation on the Sun. Astrophys. J. 784, 164 (2014), 15 pp.V.I. Makarov, K.R. Sivaraman, Evolution of latitude zonal structure of the large-scale magnetic field in solar
cycles. Sol. Phys. 119, 35–44 (1989a)V.I. Makarov, K.R. Sivaraman, New results concerning the global solar cycle. Sol. Phys. 123, 367–380
(1989b)S.F. Martin, Conditions for the formation and maintenance of filaments (Invited review). Sol. Phys. 182,
107–137 (1998)S.F. Martin, K.H. Harvey, Ephemeral active regions during solar minimum. Sol. Phys. 64, 93–108 (1979)E.W. Maunder, Note on the distribution of sun-spots in heliographic latitude, 1874–1902. Mon. Not. R.
Astron. Soc. 64, 747–761 (1904)A.R. Maunder, Letter to Stephan Ionides 21 May 1940 (1940)P.S. McIntosh, Solar interior processes suggested by large-scale surface patterns, in The Solar Cycle, ed. by
K.L. Harvey. ASP Conference Series, vol. 27 (ASP, San Francisco, 1992), pp. 14–34H.W. Newton, The Face of the Sun (Penguin, Baltimore, 1958), p. 116W.D. Pesnell, Solar cycle predictions. Sol. Phys. 281, 507–532 (2012)G.J.D. Petrie, K. Petrovay, K. Schatten, Solar polar fields and the 22-year activity cycle: observations and
models. Space Sci. Rev. (2014). doi:10.1007/s11214-014-0064-4V.V. Pipin, The Gleissberg cycle by a nonlinear αΛ dynamo. Astron. Astrophys. 346, 295–302 (1999)M. Rempel, Flux-transport dynamos with Lorentz force feedback on differential rotation and meridional flow:
saturation mechanism and torsional oscillations. Astrophys. J. 647, 662–675 (2006)M. Rempel, High-latitude solar torsional oscillations during phases of changing magnetic cycle amplitude.
Astrophys. J. Lett. 750, L8 (2012), 4 pp.A. Riccò, Risultati delle osservazioni dell protuberanze solari nel periodo undecennale dell’attività solare dal
1880 al 1890. Mem. Soc. degli Spettro. Ital. 20, 135–139 (1892)E. Robbrecht, Y.-M. Wang, N.R. Sheeley Jr., N.B. Rich, On the “extended” solar cycle in coronal emission.
Astrophys. J. 716, 693–700 (2010)D.M. Rust, Magnetic fields in quiescent solar prominences. I. Observations. Astrophys. J. 150, 313–326
(1967)M. Rybanský, V. Rušin, M. Minarovjech, L. Klocok, E.W. Cliver, Reexamination of the coronal index of
solar activity. J. Geophys. Res. 110, A08106 (2005), 9 pp.K.H. Schatten, P.H. Scherrer, L. Svalgaard, J.M. Wilcox, Using dynamo theory to predict the sunspot number
during solar cycle 21. Geophys. Res. Lett. 5, 411–414 (1978)P.H. Scherrer, R.S. Bogart, R.I. Bush, J.T. Hoeksema, A.G. Kosovichev, J. Schou, W. Rosenberg, L. Springer
et al., The solar oscillations investigation – Michelson Doppler Imager. Sol. Phys. 162, 129–188 (1995)J. Schou, Migration of zonal flows detected using Michelson Doppler Imager f -mode frequency splittings.
Astrophys. J. Lett. 523, L181–L184 (1999)J. Schou, H.M. Antia, S. Basu, R.S. Bogart, R.I. Bush, S.M. Chitre, J. Christensen-Dalsgaard, M.P. Di Mauro
et al., Helioseismic studies of differential rotation in the solar envelope by the solar oscillations investi-gation using the Michelson Doppler Imager. Astrophys. J. 505, 390–417 (1998)
J. Schou, P.H. Scherrer, R.I. Bush, R. Wachter, S. Couvidat, M.C. Rabello-Soares, R.S. Bogart, J.T. Hoeksemaet al., Design and ground calibration of the Helioseismic and Magnetic Imager (HMI) instrument on theSolar Dynamics Observatory (SDO). Sol. Phys. 275, 229–259 (2012)
M.A. Schuh, J.M. Banda, P.N. Bernasconi, R.A. Angryk, P.C.H. Martens, A comparative evaluation of auto-mated solar filament detection. Sol. Phys. 289, 2503–2524 (2014)
M. Schüssler, The solar torsional oscillation and dynamo models of the solar cycle. Astron. Astrophys. 94,L17–L18 (1981)
S.H. Schwabe, Sonnen-Beobachtungen in Jahre 1843. Astron. Nachr. 21, 233–236 (1844)H.J. Smith, E.v.P. Smith, Solar Flares (Macmillan, New York, 1963), p. 30H.B. Snodgrass, Solar torsional oscillations—a net pattern with wavenumber 2 as artifact. Astrophys. J. 291,
339–343 (1985)H.B. Snodgrass, Synoptic observations of large scale velocity patterns on the Sun, in The Solar Cycle, ed. by
K.L. Harvey. ASP Conference Series, vol. 27 (ASP, San Francisco, 1992), pp. 205–240

The Extended Cycle of Solar Activity and the Sun’s 22-Year Magnetic Cycle 189
G. Spörer, Beobachtungen der Sonnenflecken vom Januar 1874 bis December 1879. Publ. Astrophys. Obs.Potsdam 2(5), 1–81 (1880)
H.C. Spruit, Origin of the torsional oscillation pattern of solar rotation. Sol. Phys. 213, 1–21 (2003)L. Svalgaard, Y. Kamide, Asymmetric solar polar field reversals. Astrophys. J. 763, 23 (2013), 6 pp.L. Svalgaard, E.W. Cliver, Y. Kamide, Sunspot cycle 24: smallest cycle in 100 years? Geophys. Res. Lett. 32,
L01104 (2005)S.J. Tappin, R.C. Altrock, The extended solar cycle tracked high into the corona. Sol. Phys. 282, 249–261
(2013)M.J. Thompson, J. Toomre, E. Anderson, H.M. Antia, G. Berthomieu, D. Burtonclay, S.M. Chitre, J.
Christensen-Dalsgaard et al., Differential rotation and dynamics of the solar interior. Science 272, 1300–1305 (1996)
J. Toomre, J. Christensen-Dalsgaard, R. Howe, R.M. Larsen, J. Schou, M.J. Thompson, Time variability ofrotation in solar convection zone from SOI-MDI. Sol. Phys. 192, 437–448 (2000)
K. Topka, R. Moore, B.J. Labonte, R. Howard, Evidence for a poleward meridional flow on the Sun. Sol.Phys. 79, 231–245 (1982)
R.K. Ulrich, Very long lived wave patterns detected in the solar surface velocity signal. Astrophys. J. 560,466–475 (2001)
R.K. Ulrich, T. Tran, The global solar magnetic field—identification of traveling, long-lived ripples. Astro-phys. J. 768, 189 (2013), 12 pp.
S.V. Vorontsov, J. Christensen-Dalsgaard, J. Schou, V.N. Strakhov, M.J. Thompson, Helioseismic measure-ment of solar torsional oscillations. Science 296, 101–103 (2002)
M. Waldmeier, Zirkulation und Magnetfeld der solaren Polarzone. Z. Astrophys. 49, 176–185 (1960)M. Waldmeier, A secondary polar zone of solar prominences. Sol. Phys. 28, 389–398 (1973)Y.-M. Wang, N.R. Sheeley Jr., S.H. Hawley, J.R. Kraemer, G.E. Brueckner, R.A. Howard, C.M. Korendyke,
D.J. Michels et al., The green line corona and its relation to the photospheric magnetic field. Astrophys.J. 485, 419–429 (1997)
D.F. Webb, CMEs and prominences and their evolution over the solar cycle, in New Perspectives on SolarProminences, IAU Colloquium 167, ed. by D. Webb, D. Rust, B. Schmieder. ASP Conference Series,vol. 150 (ASP, San Francisco, 1997), pp. 463–474
P.R. Wilson, R.C. Altrock, K.L. Harvey, S.F. Martin, H.B. Snodgrass, The extended solar activity cycle.Nature 333, 748–750 (1988)
H. Yoshimura, Solar cycle Lorentz force waves and the torsional oscillations of the Sun. Astrophys. J. 247,1102–1112 (1981)
C.A. Young, in The Sun, 4th edn. (Appleton, New York, 1897), pp. 157P. Zeeman, On the influence of magnetism on the nature of the light emitted by a substance. Astrophys. J. 5,
332–347 (1897)