The EXPERIENCE SERVICE VALUE
31
1 Q3 2014 - Investors Presentation Paul Isabella - Chief Executive Officer The EXPERIENCE You Want. The SERVICE You Expect. The VALUE You Deserve.
Transcript of The EXPERIENCE SERVICE VALUE

1
Q3 2014 - Investors PresentationPaul Isabella - Chief Executive Officer
The EXPERIENCE You Want. The SERVICE You Expect. The VALUE You Deserve.
2
Forward Looking Statements
This presentation contains “forward-looking statements”. These statements relate to future events or our future financial performance and involve known and unknown risks, uncertainties and other factors that may cause our actual results, levels of activity, performance or achievements expressed or implied by these forward-looking statements. Although we believe that the expectations reflected in the forward-looking statements are reasonable, we cannot guarantee future results, levels of activity, performance or achievements. We caution you not to place undue reliance on forward-looking statements, which reflect our analysis only and speak only as of the date of this presentation, and you should refer to the “Risk Factors” section of our latest Form 10K. We undertake no obligation to update the forward-looking statements to reflect subsequent events or circumstances.

3
Company Overview

4
Beacon’s ExpansionAcross North America
Note: 2014 branch count as of June 30, 2014.

5
• A leader in many key metropolitan markets in the United States and across Canada
• 254 branches across 40 U.S. states and 6 Canadian provinces
• Over 47,000 customers
• Broad product offering of up to 11,000 SKUs
• Strong long-term historical performance
• 10-year sales CAGR = 14.7%
• Operating Income 10-year CAGR = 13.3%
• Historical operating margin between 5-8%
• Successfully completed 25 acquisitions since our IPO in 2004
• Opened 56 new greenfield locations since the IPO
Beacon Overview
$0.7
$1.6 $1.6$2.2
$0.0
$0.5
$1.0
$1.5
$2.0
$2.5
2004 2007 2010 2013
Sale
s ($
in b
illio
ns)
Years
Note: 2014 branch count as of June 30, 2014.
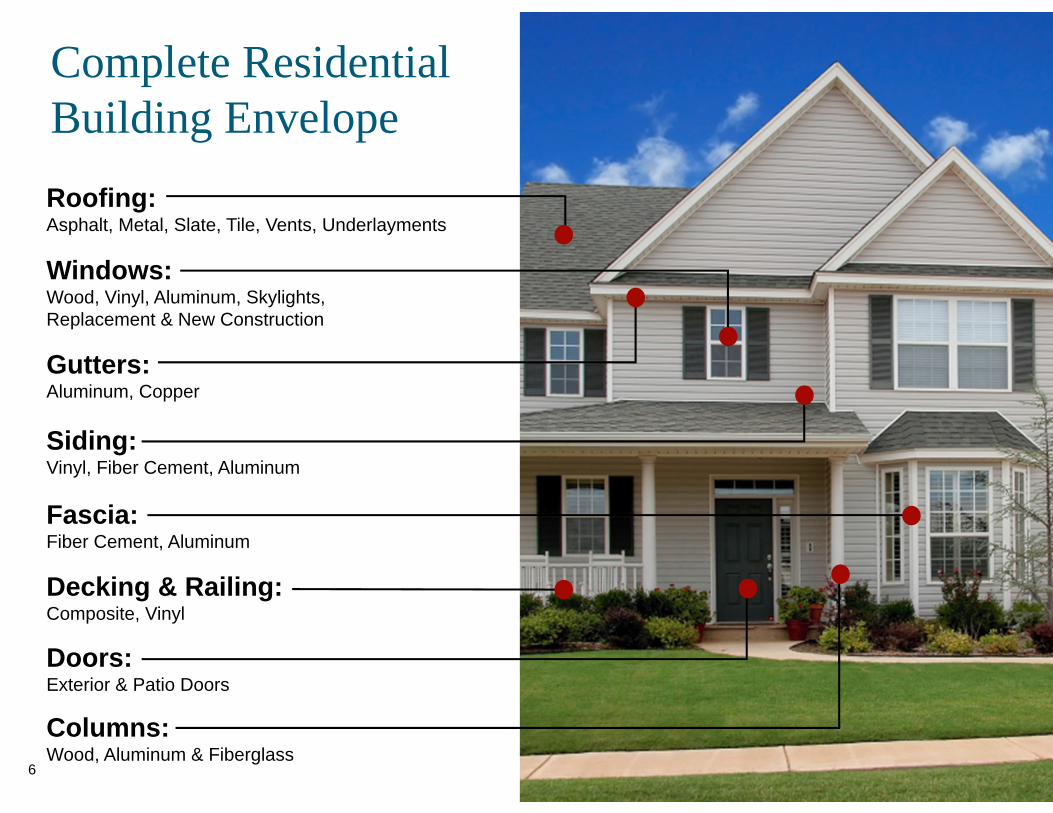
Complete Residential Building EnvelopeRoofing:Asphalt, Metal, Slate, Tile, Vents, Underlayments
Windows:Wood, Vinyl, Aluminum, Skylights, Replacement & New Construction
Gutters:Aluminum, Copper
Siding:Vinyl, Fiber Cement, Aluminum
Fascia:Fiber Cement, Aluminum
Decking & Railing:Composite, Vinyl
Columns:Wood, Aluminum & Fiberglass
Doors:Exterior & Patio Doors
6

Complete Commercial Building EnvelopeRoofing:EPDM, TPO, PVC, Built Up, Single Ply, Metal, Asphalt, Garden, Ventilation, Underlayments
Roof Insulation:Tapered Panels, Fiberboard, Nailboard, Polyiso
Custom Metals:Gutters, Downspouts, Drip Edge
Air & Vapor Barriers:
Below Grade Waterproofing:Sheet & Liquid Membranes, Sealants
Below Grade Drainage Systems:
Ground Barriers:Vapor Barriers, Radon Barriers, Pond Liners
Concrete Sealers & Coatings:Pedestrian & Vehicular Deck Coatings
7
8
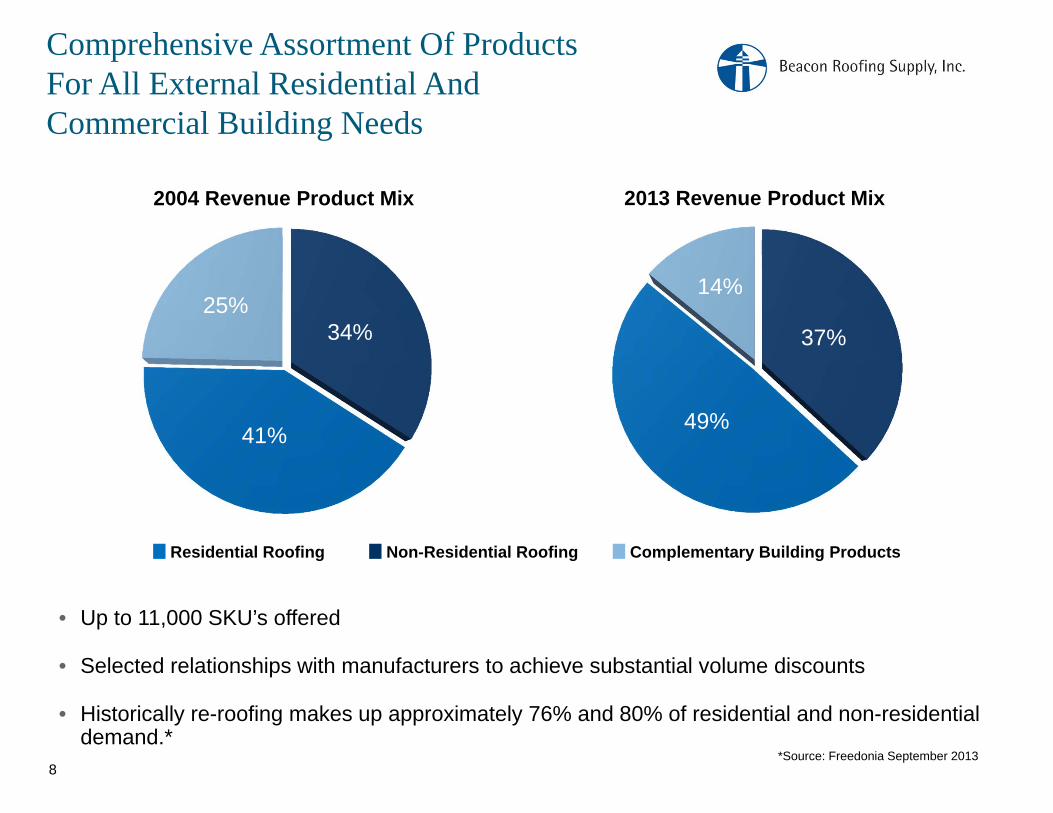
• Up to 11,000 SKU’s offered
• Selected relationships with manufacturers to achieve substantial volume discounts
• Historically re-roofing makes up approximately 76% and 80% of residential and non-residential demand.*
Comprehensive Assortment Of Products For All External Residential And Commercial Building Needs
*Source: Freedonia September 2013
37%
49%
14%
34%
41%
25%
2004 Revenue Product Mix 2013 Revenue Product Mix
Non-Residential RoofingResidential Roofing Complementary Building Products

9
Offering The Top Brands That Contractors Rely On

10
• High value-added distributor performing a critical role in the roofing supply chain
• Market leader in an attractive, growing and fragmented industry
• Highly scalable platform & proven business model with minimal capital expenditures
• Superior financial performance highlighted by attractive growth and margins
• Historical 10-year sales CAGR: 14.7% (2004-2013)
• Historical 10-year organic sales CAGR: 5.0% (2004-2013)
• Strong EBITDA margins: 7.6% in 2013
• Results-oriented management, corporate culture and controls
Why Invest In Beacon?

11
Residential58%
Non-Residential42%
Large And Attractive Market$20.2 billion industry* in the U.S. with a projected
growth rate of 6.2% annually through 2017 to $27.2 billion.
Source: The Freedonia Group – September 2013 *represents sales by manufacturers
U.S. Roofing Materials Market

12
• Traditionally, over 78% of expenditures in the roofing market are for re-roofing projects, with the balance being for new construction.
• In 2012 re-roofing made up approximately 86% and 84% of residential and non-residential demand, respectively.
• The median age of the housing stock as of 2012 is over 37 years old.
• Re-roofing demand provides stability and the potential for growth even during periods of declining building construction expenditures.
• In 2011, the roofing market experienced growth while building construction expenditures contracted.
Aging Housing Market Leads To Re-Roof Demand
1960’s11.6%
1970’s18.6%
1980’s12.6%
1990’s12.1%
2000 or later
14.3%
Year of construction of housing stock
2012 (131.8 million units)
Pre - 196030.9%
Source: The Freedonia Group – September 2013

13
Re-Roofing Concentration Drives Stable Growth
Source: The Freedonia GroupSeptember 2013
• Total roofing demand is stable• Installed base of existing homes and commercial buildings is large and growing• Re-roofing is not a luxury expenditure, and it is not discretionary

14
Re-Roofing Concentration Drives Stable Growth
Source: The Freedonia Group
• Residential new construction activity has been volatile
• Commercial new construction is also volatile and closely follows economic cycles
• Demand for roofing, due to the large installed base of aging structures, remains very stable and consistent despite the construction cycles
(50)%
(40)%
(30)%
(20)%
(10)%
0%
10%
20%
30%
2003
2004
2005
2006
2007
2008
2009
2010
2011
2012
Construction Growth YoY %
New Residential Roofing New Non-Residential Roofing Total Roofing

33%
33%
14%
11%7%
2%
Leaks
Old
Weather Damage
Upgrade Appearance
Deteriorating
Other
15
Drivers of Re-Roofing88% of U.S. re-roofing demand is non-discretionary
and insulated from broader economic conditions.
Source: ELK, F.W. Dodge

$0
$500
$1,000
$1,500
$2,000
$2,500
2002 2003 2004 2005 2006 2007 2008 2009 2010 2011 2012 2013U.S. Property Damage Due To Hail ($M)
16
Drivers of Re-RoofingU.S. property damage due to hail is an element of
annual re-roofing demand.
Source: National Oceanic and Atmospheric Administration, Insurance Information Institute

Source: National Climatic Data Center
Strategically Located To Serve Severe Weather Markets
Billion Dollar Weather Disasters1980 - 2013
1 - 10 11- 20 21 - 30 31 - 40 41+17
Number of EventsSource: National Climatic Data Center

18
Home ImprovementsWhen Faced With A Choice, Many Homeowners Decide
To Improve Their Homes, Rather Than Move
Source: U.S. Census Bureau and U.S. Department of Housing and Urban Development, 2011 American Housing Survey.
$3.5 Billion
$13.4 Billion
$23.1 Billion
$24.1 Billion
$33.2 Billion
$34.0 Billion
$35.7 Billion
$43.7 Billion
Recreation Room
Patio/Terrace/Detached Deck
Bathroom Remodels
Windows / Doors
Flooring/Paneling/Ceiling
HVAC
Kitchen Remodels
Roofing
Total Expenditures
0.5 Million
3.5 Million
5.0 Million
8.9 Million
18.8 Million
9.8 Million
3.7 Million
7.5 Million
Number of Projects

Beacon10%
ABC, Allied, RSG, SRS
40%
All Other50%
• Beacon is the second largest roofing distributor in North America
• Consolidation driven by customer demands and needs
• Although over 1,500 distributors serve the roofing materials market, fewer than 5% are regional
19
Highly Fragmented Market Is Ripe for Consolidation
Less Than 5% Of Roofing Distributors Are Regional
Market Share By Revenue

New Branch Openings
New Branch Openings
Existing Market Growth
Existing Market Growth AcquisitionsAcquisitions Target Average
Annual GrowthTarget Average Annual Growth+ + =
5 - 10% “organic” average growth potential
2-5% 3-5%
• EBITDA impact = Typically break-even in year one.
Strong Platform For Growth And Acquisitions
• Market plans by location
• Sales rep productivity
• Identify new prospects
• New product offerings
• Acquisition opportunities are identified and accountable.• Highly fragmented
market• Over 1,500 players
• Long history of successful integration• Margin and revenue
improvement• Scalable platform
• Actual sales 10-year CAGR: 14.7%
20

Greenfield expansion
Greenfield Map – Last 12 Months
21
Greenfield Financial Impact
• Disciplined approach to new branch openings in contiguous markets
• Low initial investment … $600,000 to $1,000,000
• Rapid breakeven … typically cash flow positive within 1 yr.
• Opened 10 new branches in 2013
• On track to hit target of 25 new branches in 2014
• Expect new branches to drive 2-3% organic growth in 2014
• New markets are consistently being identified & evaluated
• For 2015 and beyond, anticipating approximately 20 new openings per year

RevenueExpansionRevenue
Expansion
Large Operational
Scale
Large Operational
Scale
Best PracticesBest PracticesSophisticated
Uniform IT Platform
Sophisticated Uniform IT Platform
Acquisitions Come WithSignificant Synergy Potential
22

23
Financial Overview

$653
$851
$1,501$1,646
$1,785 $1,734$1,610
$1,817
$2,044
$2,241
$0
$500
$1,000
$1,500
$2,000
$2,500
2004 2005 2006 2007 2008 2009 2010 2011 2012 2013
24
Net Sales ($ in millions)
Significant Sales Growth

25.4%24.3% 24.3%
22.7% 23.5% 23.7%22.4% 23.1%
24.5% 23.7%
15.0%
22.0%
29.0%
2004 2005 2006 2007 2008 2009 2010 2011 2012 2013
25
Fiscal Years
Margin Analysis By Fiscal YearGross Profit Margin
6.5% 7.1% 6.7%
4.2%5.3%
6.3%
4.6%5.7%
7.0%5.8%
0.0%
5.0%
10.0%
2004 2005 2006 2007 2008 2009 2010 2011 2012 2013
Fiscal YearsOperating Income Margin
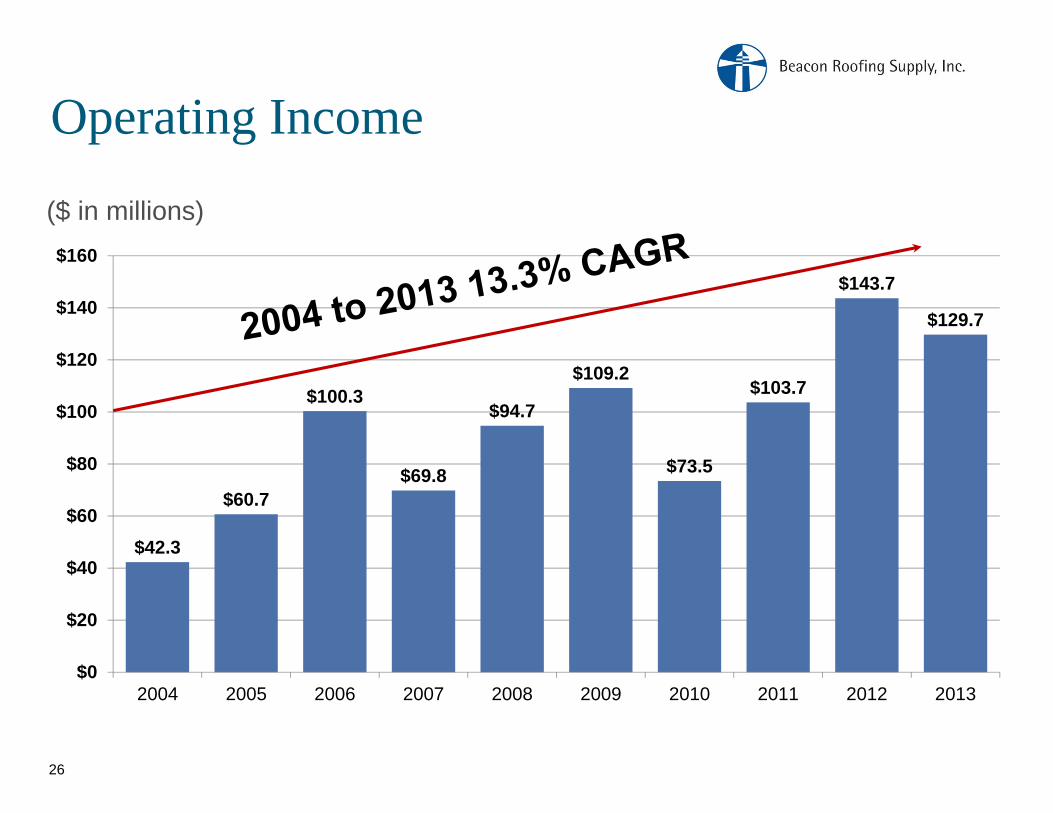
$42.3
$60.7
$100.3
$69.8
$94.7
$109.2
$73.5
$103.7
$143.7
$129.7
$0
$20
$40
$60
$80
$100
$120
$140
$160
2004 2005 2006 2007 2008 2009 2010 2011 2012 2013
26
Operating Income
($ in millions)

Q3 2014YTD
Q3 2013 YTD Change Q3
2014Q3
2013 Change
Net Sales $1,600.4 $1,557.2 2.8% $663.4 $627.2 5.8%
Gross Profit $364.5 $373.7 (2.5)% $150.8 $147.3 2.4%
% margin 22.8% 24.0% (1.2) pts. 22.7% 23.5% (0.8) pts.
Operating Income $55.7 $82.2 (32.2)% $45.8 $48.0 (4.5)%
% margin 3.5% 5.3% (1.8) pts. 6.9% 7.6% (0.7) pts.
Net Income $29.6 $45.2 (34.4)% $26.8 $27.2 (1.3)%
% margin 1.9% 2.9% (1.0) pts. 4.0% 4.3% (0.3) pts.
Adjusted Diluted EPS (1) $0.59 $0.90 (33.8)% $0.54 $0.55 (2.2)%
27
Financial Review
(1) For reconciliations of reported Diluted EPS to Adjusted Diluted EPS, please reference our press release dated August 8, 2014.
($ in millions)
Significant impact of severe winter weather in Q2 2014

28
• Ample Liquidity• $325 million U.S. revolving line of credit and CDN $15 million Canadian revolving line of credit, with
initial term loan totaling $225 million, through March 2017.
• $242.6 million available as of June 30, 2014, plus approximately $26.4 million in cash.
• Conservative Capital Structure• Strong free cash flow
• Net Debt / Total Capital ratio of 27% as of June 30, 2014
• Debt to Adjusted EBITDA ratio of 2.26 to 1 (a) as of June 30, 2014
• Robust Financial Controls• Systems integrated
• Sarbanes-Oxley compliant
• Disciplined financial approach
• Historical bad debt expense less than 0.1% of net sales
• Minimal Capital Expenditures of Less than 1.5% of Sales• $17.4 million in 2012, $26.1 million in 2013 and $26.1 million in Q3 2014 YTD
Financially Positioned To Deliver On Growth
(a) Calculated as defined under our credit facilities

29
Balance Sheet Position
3.2
2.5
1.5 1.6
0.00.51.01.52.02.53.03.5
2010 2011 2012 2013
Leverage Ratio
5.2
10.0
15.8 15.9
0.0
5.0
10.0
15.0
20.0
2010 2011 2012 2013
Interest Coverage Ratio
Annual Return on Equity
7.8%9.2%
10.8%
7.8%
0.0%2.0%4.0%6.0%8.0%
10.0%12.0%
2010 2011 2012 2013
6.2%
8.4%10.1%
8.1%
0.0%2.0%4.0%6.0%8.0%
10.0%12.0%
2010 2011 2012 2013
Annual Return on Invested Capital
Note: Leverage ratio for 2010 and 2011 recalculated to align to current definition (total debt used in place of net debt).

30
• Average sales growth goal of 5% - 10% (excluding acquisitions)
• Gross margin between 23.0% - 25.0%
• Operating margin between 6% - 8%
• Capital expenditures of approximately 1 – 1.5% of sales
Long Term Annual Financial Performance Objectives

31
Beacon Roofing Supply A Company Of Substance
Benchmarking
Culture
Excellent Track Record
Fundamentals
Forecasting & Accountability
Routines