The Exit behavior of Venture Capital firms - Cirano behavior.pdf · The Exit behavior of Venture...
39
1 The Exit behavior of Venture Capital firms Susanne Espenlaub* [email protected] Arif Khurshed* a [email protected] Abdulkadir Mohamed* [email protected] Abstract This study examines the exit behaviour of UK venture capital (VC) firms from their portfolio companies. We model the time to exit parametrically using frailty model and non-parametrically by applying life time distribution function. The results show that UK VCs prefer IPO exits followed by M&A and other exit routes. VCs’ preference of exiting through an IPO route is driven by the fact that an IPO route provides VCs the fastest time to exit their portfolio firms as compared to that of other exit routes such as M&A and liquidations. We find that experienced VCs hold their portfolio companies much longer than young VCs so there is support for Gompers’s (1996) grandstanding hypothesis. VC syndication systematically reduces the time to exit. Portfolio companies based in North America are exited quicker than portfolios companies in Europe and the rest of the world. *Manchester Accounting & Finance Group, Manchester Business School, Booth Street West, Manchester M15 6PB; UK. Fax: ++44 161 275 4023. a Corresponding author Acknowledgements: The authors would like to thank Norman Strong, Ranko Jelic, Armin Schwienbacher for their helpful comments.
-
Upload
hoangkhanh -
Category
Documents
-
view
244 -
download
3
Transcript of The Exit behavior of Venture Capital firms - Cirano behavior.pdf · The Exit behavior of Venture...
1
The Exit behavior of Venture Capital firms
Susanne Espenlaub*
Arif Khurshed*a
Abdulkadir Mohamed*
Abstract
This study examines the exit behaviour of UK venture capital (VC) firms from their portfolio companies. We model the time to exit parametrically using frailty model and non-parametrically by applying life time distribution function. The results show that UK VCs prefer IPO exits followed by M&A and other exit routes. VCs’ preference of exiting through an IPO route is driven by the fact that an IPO route provides VCs the fastest time to exit their portfolio firms as compared to that of other exit routes such as M&A and liquidations. We find that experienced VCs hold their portfolio companies much longer than young VCs so there is support for Gompers’s (1996) grandstanding hypothesis. VC syndication systematically reduces the time to exit. Portfolio companies based in North America are exited quicker than portfolios companies in Europe and the rest of the world.
*Manchester Accounting & Finance Group, Manchester Business School, Booth Street West, Manchester M15 6PB; UK. Fax: ++44 161 275 4023.
a Corresponding author
Acknowledgements: The authors would like to thank Norman Strong, Ranko Jelic, Armin Schwienbacher for their helpful comments.
2
I. INTRODUTION
Over the last two decades, the Private Equity industry has emerged as an
important area of finance and has attracted the attention of academic
researchers and practitioners alike. Although various studies have looked at
venture capital investments, the focus has been on risk and return in different
financing stages (e.g. Cochrane 2005, Woodward and Hall 2003), performance
of venture backed IPO companies (e.g. Jain and Kini 2000; Gompers and
Lerner 1999) and venture capital syndication (Lerner 1994a, Brander, Amit
and Antweiler 2002). Most of these studies are conducted on US markets
while countries like the UK have received little academic attention. In this
study we examine the exits of UK Venture capitalists from their portfolio
companies. Studying the behaviour of UK venture capital exits is important
for two reasons. First, the UK venture capital industry is the second largest in
the world, next to the US in terms of Private Equity investments and accounts
for 57 percent of total European Private Equity investments (BVCA 2006).
Second, past studies of the UK venture capital industry investigate the
performance of venture and non-venture backed companies post IPO,
performance of MBOs, exit strategies for MBO investments and venture
capital syndication (Arberk ,Filatotchev, and Wright 2006; Lockett and Wright
2001; Coakley, Hadass and Wood 2007; Jelic, Saadouni & Wright 2005; Jelic
2008 and Filatotchev 2006). The issue of how UK venture capital firms exit
their investments has received no attention. The exit prospect is a critical issue
in the venture capital industry as investment decisions are partly determined
by the exit possibility (Pearce and Barner 2006). Gompers and Lerner (2001)
state that venture capital exits are the most important aspect of the industry’s
survival and growth. This is due to the fact that venture firms invest in
companies that do not pay dividends to equity holders and hence exits allow
them to realize their returns (Cumming 2008).
The evidence on exit behaviour for US and European venture capital firms is
mixed. For instance, Schwienbacher (2005) compares the exits of US and
European VCs and concludes that European venture firms prefer to exit via
3
the M&A route. In contrast, studies in the US (Cumming and MacIntosh 2003;
Black and Gilson 1998) find that the IPO exit is a preferred route for US VCs
and the attraction is because of an active capital market, which facilitates the
IPO route. Giot and Schwienbacher (2007) investigate the exit options for the
US VCs and find that the IPO exit is a popular exit route relative to other exit
methods. Moreover, venture capital firms exit through M&A only if an IPO
exit is not possible. In the light of these results, the interesting issue is to
question how UK venture capital firms behave when exiting their portfolio
companies provided that UK industry is the largest in Europe and second
next to the US.
In this study, we investigate the exits of UK venture capital firms from their
investee companies. The usual exit routes are M&A, IPOs, Liquidation and
LBO.1 The analyzed data consists of 5,059 investments in portfolio companies
across the globe. The analysis in this study extends the analyses considered in
some of the previous studies of venture capital exits by investigating both
successful (i.e. IPO and M&A) and unsuccessful exits (Liquidation). The
assessment of successful exits alone does not fully capture the exit behaviour.
Isaksson (2007) investigates venture capital exits from 1998 to 2001, but the
study focuses only on IPO and M&A exits. Other studies (Giot and
Schwienbacher 2007) do not consider how exit behaviour changes when a
portfolio company is not in UK or Europe. Over the last decade, venture
capital firms have been investing in US Europe and the rest of the world.
Hence, making inferences on exit behaviours require analyses across many
countries as opposed to a single country. For instance, venture capital firms
may prefer exits through the IPO route, but taking a company public in some
countries might be more time consuming compared to other countries.
Therefore, venture capital firms are likely to exit their portfolio companies
through different routes for different countries. So, analysis that is based on
1 VCs also exit through a sale to another Private Equity firm, sale to Financial institutions, repayment preference shares/loan among other exits. We focus only on IPO, M&A, LBO and Liquidation exits. The time to exit is measured as the difference between a venture capital investment date and the date of exit from an investment. Sometimes VCs only partially exit at the time of the IPO. We treat such cases as an IPO exit.
4
US or Europe cannot generalize venture capital exit behaviour. We provide
analyses of exits for the complete class of main exit routes and examine the
impact of Venture capitalist (VCs) and investee companies’ characteristics on
time to exit. The results show that within three years of investment, the time
to exit through an IPO is much shorter than exit through any other route.
Beyond this three year period, the time to exit through M&A is relatively
short. Further, VCs are likely to exit via Liquidation for investments held over
7 years due to the fact that the prospect of exits via IPO/M&A decreases
beyond the 7 year period. Regardless of the exit methods, experienced VCs
hold their portfolio companies for much longer than inexperienced ones. This
suggests that young VCs are keen to exit their investments quickly, to
maximize the opportunity of future fund raising. For IPO exits, young
venture capital firms appear to exit their investments faster than those of
established venture capital firms consistent with the grandstanding
hypothesis proposed by Gompers (1996). Venture capital syndication
systematically reduces the time to exit, especially for IPO and M&A exits. This
reflects the fact that syndication allows VCs to compare their thinking, add
value to the backed company and enhance networking by minimizing the
time to exit from an investment. We find strong evidence that the time to exit
through IPO is short when the size of investment in a portfolio company is
large. Young portfolio companies are exited faster irrespective of the exit
route. Portfolio companies in North America are exited quicker than their
European counterparts. This could be because of highly developed exit
markets in North America. On average, buyout investments are held much
longer than early, expansion and later stage investments. The industry
analysis shows that the time to exit for Liquidation and LBO are shorter for
the Internet industry than for other industries.
The rest of the paper is organized as follow: Section II provides a brief
overview of the exit role in venture capital industry. Section III reviews the
literature on venture capitalist exits in Europe and the US. Section IV
describes the data sources and the methodology applied in our study.
5
Empirical findings are discussed in Section V, while the conclusion is
presented in Section VI.
II. THE ROLE OF EXITS IN VENTURE CAPITAL INDUSTRY
The success of the venture capital industry depends heavily on the exit
process. The structure of the venture capital industry is unique in that venture
capital firms are involved in start-up financing and are engaged in their
backed companies for only a limited period of time. The exit opportunity is a
key part of the venture capital cycle and allows the quantitative assessments
of venture capital firms’ performance (Schwienbacher 2005). The issue of how
venture capital firms exit their backed companies interests various parties. For
instance, fund providers such as Limited Partners (LP) invest in venture
capital firms and are not directly involved in the decision to invest in a
portfolio company. Venture capital firms manage the fund on their behalf
with a typical life of 10 years and invest in a number of portfolio companies
(Pearce and Barner 2006). They only realize returns from their investments at
the time of exit and their backed companies do not pay any dividends. As a
consequence, venture capital returns are directly linked to the exit from an
investment. Entrepreneurs are also interested in venture capital exits,
especially an exit through the IPO route as it allows them the opportunity to
regain control of their companies.
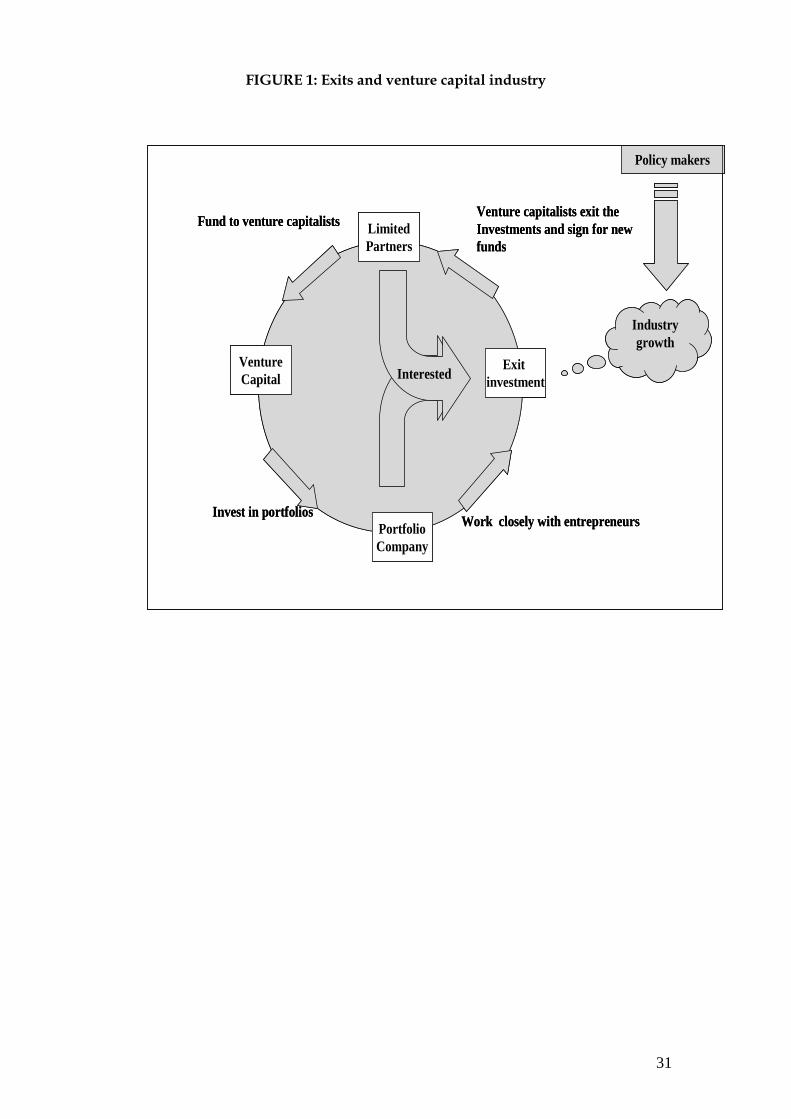
Figure 1 illustrates the role of exit in the venture capital industry and its
importance to industry growth. Venture capital firms raise funds from
Pension funds, Banks, Insurance companies and individuals. They invest the
funds in portfolio companies in exchange for equity shares. They enter into a
contract with entrepreneurial companies, defining the possible exit route for
their investments (Clercq, Fried, Lehtonen, and Sapienza, 2006). In some
cases, VCs include a clause in the contract requiring entrepreneurs to buy out
their shares, if an IPO or M&A has not occurred within a certain time frame
(Pearce and Barner 2006). Nonetheless, the buyback method is less profitable
for VCs as there is no new capital coming into the company. Upon exit from
6
the investments, VCs pay back the fund providers, prior to signing for a new
fund. Therefore, a shorter time to exit allows VCs to raise additional funds
from fund providers and allows entrepreneurs to control the company if the
exit is via IPO. A quick exit from a portfolio company encourages a venture
capital firm to make new investments contributing to industry growth. Policy
makers are concerned with the survival of venture capital industry due to its
role on economic growth. If VC investments are held for longer periods of
time, the VC industry is likely to exhibit slower growth. Therefore, the cycle
of venture capital financings is driven by both the presence of an exit
opportunity and by a short time to exit from a portfolio company.
[FIGURE 1 HERE]
III. LITERATURE REVIEW
There is a theoretical and empirical literature that explores how VCs screen,
select, finance, syndicate, monitor and advise their portfolio companies
(Hellmann 1998; Bergemann and Hege 1998; Cumming and MacIntosh 2003
and Gompers and Lerner 1999; Lockett and Wright 2001). The behaviour of
venture capital exits remains an unexplored area in the study of venture
capital firms, despite its importance for industry survival and economic
growth. Schonfeld (2008) reports that venture capital investments have
decreased significantly during the credit crunch crises, due to low IPO and
M&A exits.
Cumming and MacIntosh (2003) investigate the choice of full and partial exits
of US and Canadian VCs. Using a sample of 246 venture capital exits, of
which 112 are US exits and 134 are Canadian exits. They find that the exit
choices depend on the degree of information asymmetry between seller and
buyer of venture capital investments. They argue that the legal and
institutional environments between the two countries contribute to the
difference between US and Canadian venture capital exits. Schwienbacher
(2005) compares US and European venture capital exits from their portfolio
companies during the months of June through November 2001. He finds
numerous similarities (e.g. monitoring intensity) and important differences
7
(e.g. the use of convertible securities) between US and European venture
capital exits. Schwienbacher (2005) concludes that the difference between the
exits is due to the fact that Europe has fewer liquid markets as compared to
the US.
Cumming, Fleming and Schwienbacher (2006) examine the impact of the legal
environment on venture capital exits through IPO, M&A and other exit
methods. They use a sample of 468 backed companies from 12 countries in the
Asia-Pacific region: Australia, China, Hong Kong, India Indonesia, Malaysia,
New Zealand, Philippines, Singapore, South Korea, Taiwan and Thailand.
Using multinomial-logit, they find that a high legality index increases the
likelihood of IPO exit. They also find that an active stock market and the
quality of the legal environment facilitate exit via IPO.
Nils and Norbert (2007) examine exits of start up and large biotech companies
via IPO and M&A. From 1986 to 2005, they find that start-up biotech
companies were increasingly choosing M&A exits over IPO exits. They also
find that M&A exits offer successful small biotech companies higher returns
than IPO exits in a shorter period of time. Isaksson (2007) investigates exit
strategies in Sweden from 1998 to 2001. He finds that venture capital firms
with an M&A strategy have higher exit activities compared to other exit
strategies including IPOs. Isaksson (2007) concludes that the decision to exit
via IPO or M&A is an entrepreneurial strategy rather than a venture capital
firm strategy. This is due to the fact that exit decision is made by the board of
directors of the portfolio company in which the entrepreneur has the majority
votes.
Giot and Schwienbacher (2007) examine exit options for US VCs using IPO,
M&A and Liquidation routes between 1980 and 2003. They find that the
probability of IPO exit increases and then decreases over time, suggesting that
IPO candidates are selected relatively quickly. Moreover, exits through M&A
are more universal than IPO exits. They conclude that venture capital exits
are sequential in that they only exit via M&A as the time to take a portfolio
company public lengthens. Cumming and Johan (2007) investigate the exits of
Canadian VCs through IPO, M&A, Secondary sale, Buyback and
8
Liquidations. They examine 518 exits, of which there are 32 IPO exits, 197
acquisitions, 66 secondary sale, 116 buybacks and 107 Liquidations. They find
that the investment holding period is lower for companies exited via IPO
compared to those exited through M&A and other exit methods. Further, exits
are influenced by the characteristics of venture capital firms and portfolio
companies.
Elisabete, Cesaltina and Mohamed (2008) examine exit decision in the
European venture capital market through M&A, IPOs and Liquidations. From
2004 to 2005, they find that European VCs dealing with Financial companies
have higher exit rates than those associated with non-Financial companies.
They find that M&A exits are faster than IPO and Liquidation exits, but the
characteristics of venture capital firms and investee companies influence the
time to exit via any route. Cumming (2008) examines the relationship between
venture capital contracts and exits for 11 European countries excluding the
UK. Cumming finds that from 1995 to 2002 VCs with strong contractual rights
are likely to exit through acquisitions, while those with weak contractual
rights are likely to exit through IPO or other exit routes.
Cumming and Johan (2008) investigate the associations between pre-planned
exits and the structure of venture capital contracts. Evaluating 223
entrepreneurial companies from 11 continental European countries, they find
that VCs often pre-plan their exits, either through IPO or M&A. They also
find that pre-planned acquisition exits increase the likelihood of using
convertible securities and decrease the probability of using common equity.
Experienced entrepreneurs are likely to be financed with common equity and
unlikely to be financed with convertible equity. On the other hand,
experienced entrepreneurs are likely to use convertible equity and less likely
to use common equity.
Prior studies of exits report that exit choices are determined by information
asymmetry between the seller and buyer of venture capital investments, a
country’s legal environment, market liquidity and the sector of a portfolio
company (Cumming and MacIntosh 2003; Cumming et al. 2005; Cumming et
al. 2006; Elisabete et al. 2008 and Cumming 2008). Some studies in Europe
9
find that exits through M&A are more likely than through IPO exits, while in
the US exits through IPO are more likely than via M&A route (Nils and
Norbert 2007; Isaksson 2007; Cumming and Johan 2007; Giot and
Schwienbacher 2007). Nonetheless, exit behaviour remains unexplored for
portfolio companies that are not in Europe and the US. Hence, exit behaviour
analysed across the globe reflects the general behaviour of VCs exits more
than analyses that is based on US and Europe alone. To the best of our
knowledge this is the first study that examines exit behaviours of venture
capital firms for portfolio companies that are in the US, Europe and the rest of
the world. The objective is to evaluate how venture capital firms exit their
backed companies in different countries.
IV. DATA AND METHODOLOGY Data
The data used in this study are collected from VentureXpert and cover the
period between 1990 and 2006. We examine venture capital exits from their
investments through IPO, M&A, LBO and Liquidation. The data is filtered to
eliminate investments where the exit date, size of investments and portfolio
company founding dates are missing. We exclude 234 investment rounds for
which information on the founding date of investee firms or size of
investments is missing. This filtration leads to a sample of 5,059 investments
in portfolio companies for 290 venture capital firms.2 We classify factors that
influence the time to exit into venture capital and portfolio company’s related
variables. Venture capital related variables are age, number of VCs
syndicated in financing a backed company, size of investment and stage of
financing. Age is expected to influence the time to exit from a portfolio
company. For example, experienced VCs, might have flexibility to hold their
investments longer than inexperienced ones. Age can be positively or
negatively related to the time to exit. The size of investments is expected to
decrease the time to exit from a portfolio company. Venture capital firms are
2 We include these rounds in the non-parametric estimation and the results are similar to filtered data. Therefore, We focus on the filtered data.
10
unlikely to commit a large investment for a long period of time since their
investments are illiquid relative to stock market securities. Therefore, the
likelihood of large capital commitments is only possible for a short period of
time. Hence, the larger the size of investments, the more likely VCs will exit
their investments quickly. VCs syndicate to diversify the risk of their
investments, and the number of venture capital syndications increases as the
portfolio company develops and requires a greater amount of capital.
Previous studies (Megginson and Weiss 1991; Lerner 1994 and Brander et al.
2002) report that larger syndicates should make exit easier; hence the number
of VCs involved in financing a portfolio company is expected to decrease the
time to exit.
The portfolio company related variables include age, industry and the
portfolio company’s country of incorporation. Young companies have more
growth opportunities than mature ones and hence VCs are likely to benefit
more by taking a young company public than a mature company with low
growth opportunities. As a consequence, the time to exit via M&A is expected
to be shorter than IPO exit when a portfolio company is mature. The time to
exit is expected to vary across industries and expected to be short or long
based on industry characteristics. Developed countries are likely to provide
venture capital firms quicker exits than developing countries (Black and
Gilson 1998). Hence, time to exit is expected to be short for some portfolio
companies based on their location.
In this study, we concentrate solely on the UK venture capital industry and
examine all venture capital investments including buyout financing. Buyout
financings involve investments in established companies operating in mature
industries. This is also known as institutional buyout. This study investigates
the time to exit of venture capital firms from their investments in Europe,
North America and the rest of the world. UK venture capital firms invest
heavily in Europe and North America; so investments outside Europe and
North America are classified as rest of the world investments.
11
Methodology
The analysis of modelling venture capital exit behaviour via different routes
relies on survival/duration analysis. This method allows to measure the time
elapsed between the date at which investments are made and the date on
which venture capital firms exit the investments. Duration analysis in
economics or sociology is referred to as survival analysis and it is a statistical
technique applied to examine the occurrence of some event (Hensler et al
1997; Jain and Kini 2000). The technique is different from other regression
analysis due to its ability to correct censored observations. Censoring refers to
incomplete observation and results in a situation where the event of interest
has not yet occurred. For instance, venture capital firms are unlikely to exit all
investments within a study time period (1990-2006); hence assessing the
likelihood of future exit in a case of censored observations is challenging
using a static model (i.e. probit/logit models). Survival/duration analysis
incorporates both censored and uncensored observations to provide
consistent estimators (Allison 2000). Shumway (2001) finds that survival
models are theoretically and empirically better than static models in terms of
out of sample forecasts.
In the analysis, we apply a lifetime distribution function to estimate non-
parametrically cumulative exit rates. The lifetime distribution function is
defined as the complement of the survival function.
( ) )(1Pr)( tStTtF −=≤=
or
s
j
j 1 j
EF̂(t)
n=
=
∑ (1)
where Ej is the number of investments exited by VCs from 1990 to 2006, and
nj is the total number of investments in portfolio companies. Equation (1) is
12
applied to compute cumulative exit rates for VCs by country of portfolio
company and exit methods. 3
To examine factors that accelerate or decelerate the time to exit from a
portfolio company, we apply a parametric model under the assumption that
the exit of individual VCs is Weibull distributed. The Weibull distribution is
monotonic and is an appropriate distribution for modelling firms’ exits. Since
venture capital firms invest with the intention to exit in the future, so exits are
constantly rising, using a distribution that assumes individual exit increases
at first, then decreases (lognormal) is not suitable. However, the standard
Weibull model assumes homogeneity between individual and population
exit.4 This assumption is violated if individuals are heterogeneous, which is a
common case among venture capital population, as some are more
experienced than others. Typically some venture capital firms have better
skills, expertise and experience than others, allowing them to exit their
investments quicker.
We fit a frailty model to account for heterogeneity, which is similar to
regression models that account for heterogeneity or fixed effect models. The
model provides a useful alternative to a standard survival model when the
standard model fails to account for heterogeneity. In the frailty model there is
a distinction between individual and population time to exit. The population
time to exit can fall while individual time to exit rises due to a heterogeneous
effect. Therefore, the population exits decline over time regardless of the exit
shape an individual venture capital firm is facing (Gutierrez 2002). For
instance, the time to exit is likely to vary between individual VCs, reflecting
their ability to exit an investment. But the population time to exit at a given
point of time reflects both exited and non-exited investments leading to a
non-monotonic distribution. This justifies our choice of gamma distribution
to model the population heterogeneity. The gamma-Weibull mixture
3 The cumulative exit rate is computed using Stata, the data are arranged in years from 1990 to 2006 and the probability of exit is evaluated at each year interval taking into account investments that have not been exited at the end of sample period. 4 Population exit refer to the exit of all venture capital firms irrespective of their experience or expertise.
13
distribution is popular in the econometric literature due to it is convenient
properties (Lancaster 1979).
Finally, we estimate four mutually exclusive exit choices using a gamma
frailty model to account for heterogeneity among venture capital firms. We
assume that the time to exit is a distinct observation, but does not necessarily
mean they are uncorrelated across or within groups.
IPO 0 1 2 3 4
IPO
Ln(t ) SqrtVCage LnSizeInvs Synd SqrtPortfolioage
Stage Industry Country4 6 2
i j ki=1 j=1 k=1
β
= α + α + α + α + α
+ δ + γ + + ε∑ ∑ ∑ (2)
M&A 0 1 2 3 4
M&A
Ln(t ) SqrtVCage LnSizeInvs Synd SqrtPortfolioage
Stage Industry Country4 6 2
i j ki=1 j=1 k=1
β
= α + α + α + α + α
+ δ + γ + + ε∑ ∑ ∑ (3)
Liquidation 0 1 2 3 4
Liquidation
Ln(t ) SqrtVCage LnSizeInvs Synd SqrtPortfolioage
Stage Industry Country4 6 2
i j ki=1 j=1 k=1
β
= α + α + α + α + α
+ δ + γ + + ε∑ ∑ ∑ (4)
LBO 0 1 2 3 4
LBO
Ln(t ) SqrtVCage LnSizeInvs Synd SqrtPortfolioage
Stage Industry Country4 6 2
i j ki=1 j=1 k=1
β
= α + α + α + α + α
+ δ + γ + + ε∑ ∑ ∑ (5)
Ln (tj) is the duration between the investment date and the date of exit, and
SqrtVCage is the square root of venture capital age measured as the difference
between the founding date and the date of investments. LnSizeInvs is the
natural logarithm of the amount invested in a portfolio company. Synd is the
number of VCs syndicated in financing rounds. SqrtPortfolioage is the square
root of age of portfolio companies, measured as the difference between the
founding date and date of first financing round. Variable transformations
(SqrtVCage, LnSizeInvs and SqrtPortfolioage) are based on close resemblance
to a normal distribution. ∑δStage is a dummy variable taking a value of 1 for
a given stage and 0 otherwise. ∑γIndustry is an industry dummy variable
taking a value of 1 or 0 based on the industry of a portfolio company. These
industries include Communication and media, Computer hardware and
14
software, Consumer related, Internet, Medical health and Other product
industries. ∑βCountry is a dummy variable taking a value of 1 or 0 based on
the country in which venture capital funds are committed.5
It is also possible to estimate equations (2)–(5) using traditional ordinary least
squares. The problem with using OLS to analyse survival data is related to
the assumed distribution of the error terms. In a linear regression, for
inference purposes the error term is assumed to be normally distributed, but
normality is an unreasonable assumption for duration analysis. For instance,
VCs invest with a view to exit their investments; hence the time to exit from
an investment is constantly decreasing. Then the distribution of time would
follow an exponential or weibull distribution. The other problem is that the
time to exit is positive and censored to the extent that not all investments are
exited during the sample period. Hence, making inferences on investments
that have not been exited is challenging using a linear regression model.
Typically, survival analysis can be seen as a model that substitutes the OLS
normality assumption with something more appropriate for the problem in
hand (Cleves, Gould, and Gutierrez 2004).
V. Results and analysis
Descriptive statistics
Table 1 describes the sample and shows median, quartiles, maximum,
minimum and means of the control variables for the full sample during 1990
through 2006. The exited investments are partitioned into M&A, IPO,
Liquidation, LBO and other exits. The average age of venture capital firms is
24 years, twice the average age of a portfolio company. The median age is 19
years, three times higher than the median age of a portfolio company. The
maximum age of venture capital firms in the sample is 72 years, compared to
37 years for the portfolio company. The average size of investment in a
5 The error terms from equation (2)-(5) are Weibull-gamma mixture distributed, allowing for heterogeneity among venture capital firms. The time to exit of individual VCs is assumed to follow a Weibull distribution, while the population time to exit is assumed to follow a gamma distribution. The log likelihood ratio for the Weibull-gamma distribution is higher than exponential-gamma distribution, revealing the better fit of Weibull-gamma distribution for the data.
15
portfolio company across the globe is £4.7 million, while the median is £1
million and the maximum size of investment is £32.6 millions (Table 1 Panel
A). The results show that on average venture capital firms do not syndicate in
financing a venture, except for those companies which are exited through the
IPO route. The maximum number of syndications is 7 and only 5 percent of
investments have more than four syndicated investors (i.e. quantile 95). It is
possible to infer from the data that this is due to the time to exit through the
IPO route, which is significantly shorter on average than through other routes
and statistically significant at a level of 1 percent. Further, syndication should
make exit easier as it enhances certification, which may lead to less under-
pricing. This also supports Bienz’s (2005) view that IPO candidates are more
profitable than non-IPO candidates. A short time to exit from an investment
allows VCs to realize the return early and make new investments. The exit
time via Liquidation is approximately identical to the LBO, but statistically
different from the IPO or M&A exits. This suggests that venture capital firms
exit through Liquidation or LBO if M&A or IPO does not occur.
The number of investments exited through M&A for all industries is higher
than the remaining exit methods (Table 1 Panel B). Exits for Internet
companies are high, reflecting the level of uncertainty associated with Internet
companies. Failure to exit Internet companies quickly may force venture
capital firms to liquidate, which was the case during the Internet bubble when
venture capital firms could no longer exit through IPO or M&A (Giot and
Schwienbacher 2007). It can be inferred from Table 1 (Panel B), that Computer
hardware & software and Other products industries are highly targeted
sectors for investments by venture capital firms. Nonetheless, a large fraction
of investments in these sectors are successfully exited through IPO or M&A.
The size of funds committed in the expansion and buyout stages are larger
compared to early and later stage rounds (Table 1 panel C). This is because
backed companies require a large capital commitment in their expansion,
unlike the later stage round where the capital requirement is small (Lerner
1994). Irrespective of financing stages, the fraction of venture capital
investments exited through M&A is higher than IPO and other exit methods.
16
Early stage investments are often liquidated due the level of risk, while most
buyout investments are exited through LBO (Table 1 Panel C). Panel C in
Table 1 shows that exited investments by country of a portfolio company. It is
evident from the Table that exit through M&A is higher than through any
other route for Europe and North America portfolio companies, but not for
the rest of the world portfolios. UK venture capital firms are mature on
average and their time to exit from a portfolio company is shorter for IPO
route relative to other exit methods. It is evident that the Internet sector
provides VCs faster exits than any other sector. The exits for North American
portfolios are quicker than those of Europe and the rest of the world.
[TABLE 1 HERE]
Table 2 shows the breakdown of venture capital investments by industry,
stage of financing, country of a portfolio company and the number of venture
capital firms syndicated in financing from 1990 to 2006. The Table shows that
venture capital firms have been investing in many industries since 1990,
except for the Internet sector, where the investments started only in 1995.
Nonetheless, venture capital investments in the Internet industry have been
rising from 1998 and reached their peak in 2000. During the year 2000 (bubble
period), 32 percent of total venture capital funds were invested in the Internet
industry, while only 68 percent were invested in the remaining sectors (Table
2 Panel A). Nonetheless, post 2002, the Internet sector has become the least
attractive sector for UK VCs and hence the size of investments in the Internet
sector is reduced by approximately 84 percent. It is evident from Table 2
(Panel B) that only small funds were committed to the UK venture capital
industry in the early 1990s. From 1990 to 1997, UK VCs invested
proportionally across financing stages. However, since 1998, the size of
investments in expansion stage has doubled and continued in this trend to the
end of 2006. This exhibits shifts in the investment behaviour from early and
later stages to expansion and buyout stages. The investments ratio between
Europe and North America was 1:2 until 1994. By 1996, the investment
17
patterns changed considerably resulting in a ratio of 4:1 between Europe and
North America respectively. This is due to expansion of the European venture
capital industry during the late 1990s. Panel D in Table 2 shows weak
evidence suggesting that UK VCs merely syndicate in financing a venture.
[TABLE 2 HERE]
Table 3 Panel A, shows the breakdown of venture capital investments in
Europe, North America and the rest of the world. The average investment
committed in portfolios across the globe ranges between £2.4 million and £5.1
million. UK venture capital investments are higher in Europe and the rest of
the world than in North American countries. Perhaps, in North America, a
company that is seeking substantial capital is more likely to raise capital from
US venture capital firms. The sizes of investments are small for the early stage
rounds relative to all other financing rounds (Panel B). Nonetheless, buyout
investments are more than four times the size of investments in any round
including the expansion stage. The fact that investments in the buyout stage
are high is consistent with the literature (Giot and Schwienbacher 2007).
Further, venture capital firms are reluctant to commit substantial capital at the
start of the venture capital process. The level of venture capital funds invested
in industries varies, but Consumer related and other product industries
attract more venture capital funding compared to Other sectors. This reflects
the fact that most buyout investments originate from Consumer related and
other product industries. There is little evidence suggesting that venture firms
syndicate in early, expansion and later stage financing. This is interesting
evidence and suggests that VCs syndicate in the risky rounds and the need of
syndication is trivial for buyout stage, which involves investments in
established companies. From 1990 to 2006, the time to exit through M&A
route is shorter for the rest of the world portfolios than for European and
North American portfolios. For IPO exits, the time to exit for North America
and the rest of the world is shorter than for Europe (Panel A). The evidence
from the data shows that VCs are likely to exit through the IPO route first,
18
and then M&A followed by either Liquidation or LBO exits. Venture capital
firms are slow to exit buyout and early stage investments for all exit routes
(Panel B). Time to exit for later stage financings is shorter than for expansion
stage with marginal differences. The average industry’s time to exit is
approximately identical except for IPO exits, where the exit duration is short
especially for the Internet and Communication & media sectors. This might be
the effect of the bubble period, during which many Internet companies were
taken public prematurely and resulting in shorter time to exit relative to other
sectors.
[TABLE 3 HERE]
To sum up, the results show that UK VCs rarely syndicate in venture capital
financing except for investments that are exited through the IPO route. It is
evident from the data that the time to exit through liquidation is
approximately equal to the time to exit through LBO. This does not
necessarily mean that venture firms are not wary of exiting either through
liquidation or LBO, but rather indicates that the time to exit is similar when
venture capital firms choose to exit through either route. Most Computer
hardware & software and other product industries are successfully exited
either through IPO or M&A. The data show that early stage investments are
liquidated more often than expansion, later and buyout stages. VCs are likely
to exit through the IPO route, then M&A, followed by liquidation or LBO.
There is clear evidence that exits for portfolios in North America are quicker
than in Europe and the rest of the world.
Results
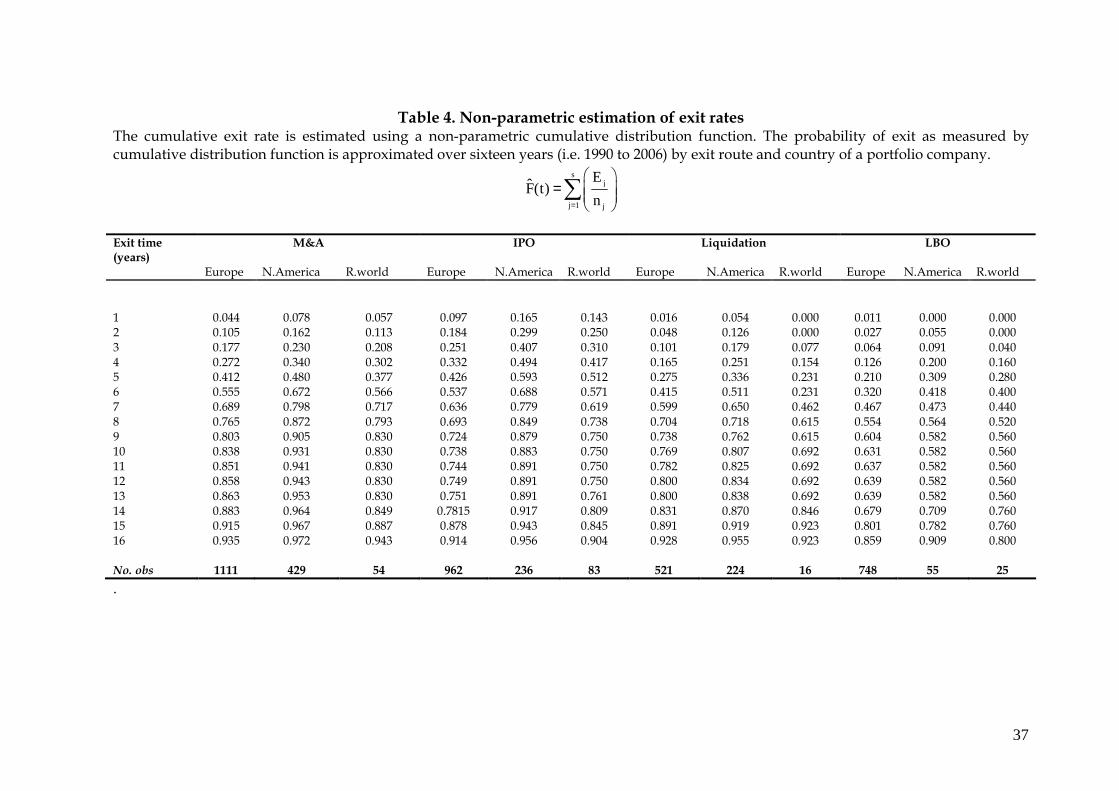
Table 4 shows the cumulative exit estimated non-parametrically using the
cumulative distribution function (E.q 1). Table 4 shows the cumulative exit
estimated non-parametrically using the cumulative distribution function (E.q
1). Table 4, shows that during the first 5 years post investment, the minimum
cumulative exit rate is 21 percent for European portfolio companies via LBO
and the maximum is 59.3 percent for North America portfolios through the
IPO route. Exit through the IPO route is higher for North American portfolio
19
companies than for Europe and the rest of the world portfolios. For instance,
the cumulative exit rate for IPO exit, 5 years post investment is 59.3 percent
for North American portfolios compared to 42.6 percent for Europe and 51.2
percent for the rest of the world portfolios. Hence, the role of the active
market facilitating venture capital exits as noted by Black and Gilson (1998) is
supported by the data. During the same time interval, exit via M&A is also
high but lower than for IPO exit. It seems that when the market is active the
time to exit from a portfolio company is short for either the IPO or M&A
routes. Cumulative exits via M&A are slightly higher than IPO exits 7 years
post investments (Table 4) for North America, Europe and the rest of the
world portfolios. The cumulative exit through Liquidation is high over the
same time interval, suggesting that VCs are likely to adopt the Liquidation
exit if an IPO or M&A did not occur. It is also evident that over 7 year period,
the cumulative exit rate is higher for Liquidation route than LBO route,
irrespective of location of a portfolio company. This is interpreted as the fact
that VCs are likely to choose Liquidation exit over LBO exit for investments
held more than 7 years. This is hardly surprising, provided the fact that VCs
invest in young companies with growth opportunities and borrowing money
for these companies to buy back venture capital stakes might be a challenge.
A buyback often involves considerable borrowing and debt providers might
hesitate to provide debt, especially if VCs are attempting to exit, unless their
views are widely divergent from VCs (Cumming and MacIntosh 2003;
Isaksson 2007). Over 10 years interval, the average cumulative exit rates
across all routes are 86.3 percent for M&A, 78.6 for IPO, 75.3 for Liquidation
and 59.1 percent for LBO route. This suggests that the likelihood of venture
capital investors not exiting their investments beyond 10 years following the
investments is 13.7 percent for M&A route, 21.4 percent for IPO, 24.7 for
Liquidation and 40.9 percent for LBO route. Stated differently, the proportion
of investments that remain un-exited is relatively small beyond the 10 year
period. This exit behaviour is consistent throughout portfolios in Europe,
North America and the rest of the world.
[TABLE 4 HERE]
20
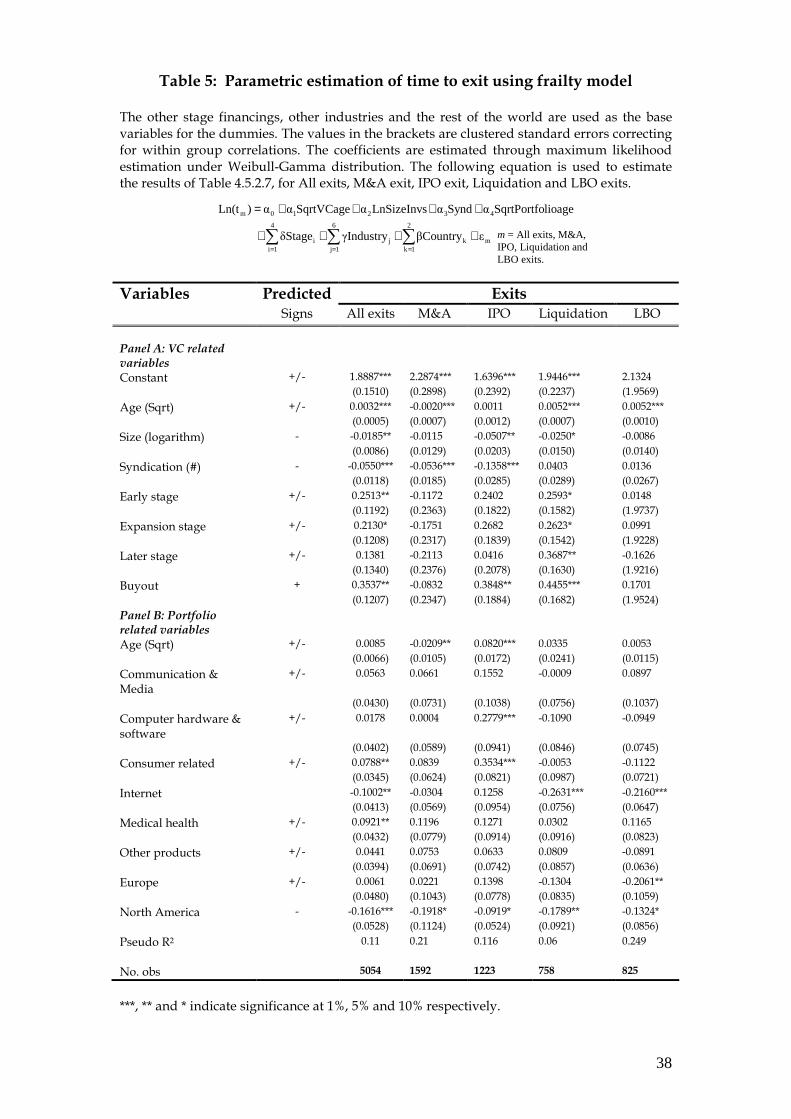
Table 5 shows the parametric results for all exits, M&A, IPO, Liquidation and
LBO. The table has two Panels: Panel A presents the estimation results for
venture capital related variables, while Panel B shows the outputs for the
portfolio company related variables. The results for all exits show that the age
of VCs increases the time to exit, suggesting that longer established VCs hold
their investments longer than young ones. This is consistent with the
literature suggesting that experienced venture capital firms, as measured by
age, have the ability to raise funds quickly from LPs, which allows them to
exit their investments in a timely manner (Pearce and Barnes 2006). The size
of investment in a portfolio company and the number of venture capital
syndications irrespective of the exit method significantly decrease the time to
exit. Buyout investments are slow to exit compared to early, expansion and
later stage rounds. For instance, early, expansion and later stage investments
are exited a year earlier than buyout investments.6 Similarly, later stage
rounds are the fastest investments exited by UK venture capital firms. Time to
exit across all routes (Panel B All exits) is shorter for Internet companies
compared to Medical health companies as exhibited by negative and positive
significant coefficients. The time to exit for the Communication & media,
Computer hardware & software and Other product industries are statistically
identical. However, as far as location of a portfolio company is concerned,
there is statistical evidence that time to exit in North America are shorter than
in Europe and the rest of the world.
Regarding M&A exits, there is strong statistical evidence that the age of
venture capital firms and size of syndication decelerate the time to exit
significantly. This evidence indicates that old VCs are able to exit through
M&A quicker than young ones. Typically, old venture capital firms have
industry expertise and are likely to identify potential buyers for their portfolio
companies. Similarly, investments made in early, expansion and later stage
rounds are exited quicker than buyout investments, but the difference is
6This is computed by dividing the exponentiated coefficient of the early stage round, estimated from the gamma frailty model by the exponentiated coefficient of the buyout stage. A similar approach is used for the expansion and later stage investments (i.e. e0.2513/e0.3537=1, e0.2130/e0.3537=1 and e0.1381/e0.3537=0.81).
21
statistically insignificant. The results also show that the age of a portfolio
company decreases the time to exit, indicating that VCs are likely to exit
mature companies through M&A. There is weak evidence suggesting that the
time to exit via M&A is shorter for North American investments relative to
investments in Europe and the rest of the world.
For IPO exits, syndication and size of investments are statistically significant,
while the age of venture capital firms does not affect the time to exit through
an IPO exit. The magnitude of the size and syndication coefficients is higher
for IPO exits than for M&A exits. This suggests that within IPO exit, size
shorten the time to exit, but within M&A exit, it has no effect. The time to exit
for buyout investments is significantly higher than for early, expansion and
later stage rounds. The age of a portfolio company influences the behaviour to
exit via IPO. The results show that the time to exit is shorter through IPO and
longer through M&A route, when a portfolio company is young. This reveals
that venture capital firms exit via IPO young portfolio companies and
through M&A mature portfolio companies. The evidence is statistically
significant at conventional levels. More often, VCs invest a large proportion of
their funds in technology companies. The likelihood of taking these
companies public decreases past a certain time interval. Computer hardware
& software companies have the highest time to exit, and are followed by
Consumer related companies. IPO exits are high for North American
investments, supporting the findings of a previous study that an active
market facilitates IPO exits (Black and Gilson 1998).
Exits through Liquidation provide evidence that mature VCs are slow to
liquidate their portfolio companies. The results also reveal that time to exit for
buyout investments are longer through Liquidation than early, expansion and
later stage. This is due to the fact that the buyout stage involves large
investments in mature companies, where the default risk is minimal. Internet
companies are liquidated quicker than other companies due to the level of
uncertainty associated with Internet companies. Time to exit via Liquidation
is short for the Internet companies and statistically significant at a level of 1
percent. This provides evidence that Internet companies are liquidated more
22
often than any other companies. Regarding the country of portfolio
companies, it is evident from the Table that the time to exit is shorter for all
routes, when a portfolio company is located in North America. The evidence
is statistically significant between 10 and 5 percent conventional level.
Young venture capital firms tend to pursue the LBO exits more often than
mature venture capital firms. There is no statistical evidence that the size of
investments, syndication, financing stages or age of a portfolio company have
an effect on the time to exit through LBO exits. For LBO exit, there is no
significant difference in the time to exit across all sectors, except for Internet
sector, where the time to exit is significantly short. This is interesting and
points out that venture capital firms are able to exit Internet companies either
through Liquidation or LBO more quickly than any other companies. There is
evidence that time to exit through LBO route is shorter for Europe and North
America portfolio companies, relative to the rest of the world portfolios.
[TABLE 5 HERE]
To summarize, the parametric results reveal that the time to exit through
M&A is short than IPO exit for experienced venture capital firms. Time to exit
for buyout investments are longer than time to exit for early, expansion and
later stage investments. The age of a portfolio company influences the
behaviour of venture capital exits. The evidence from the results shows that
the time to exit via M&A is short for mature backed companies, while the
time to exit through IPO is short for young companies. The analysis of
country of a portfolio company shows that the time to exits is shorter for
North American portfolios than Europe and the rest of the world portfolios.
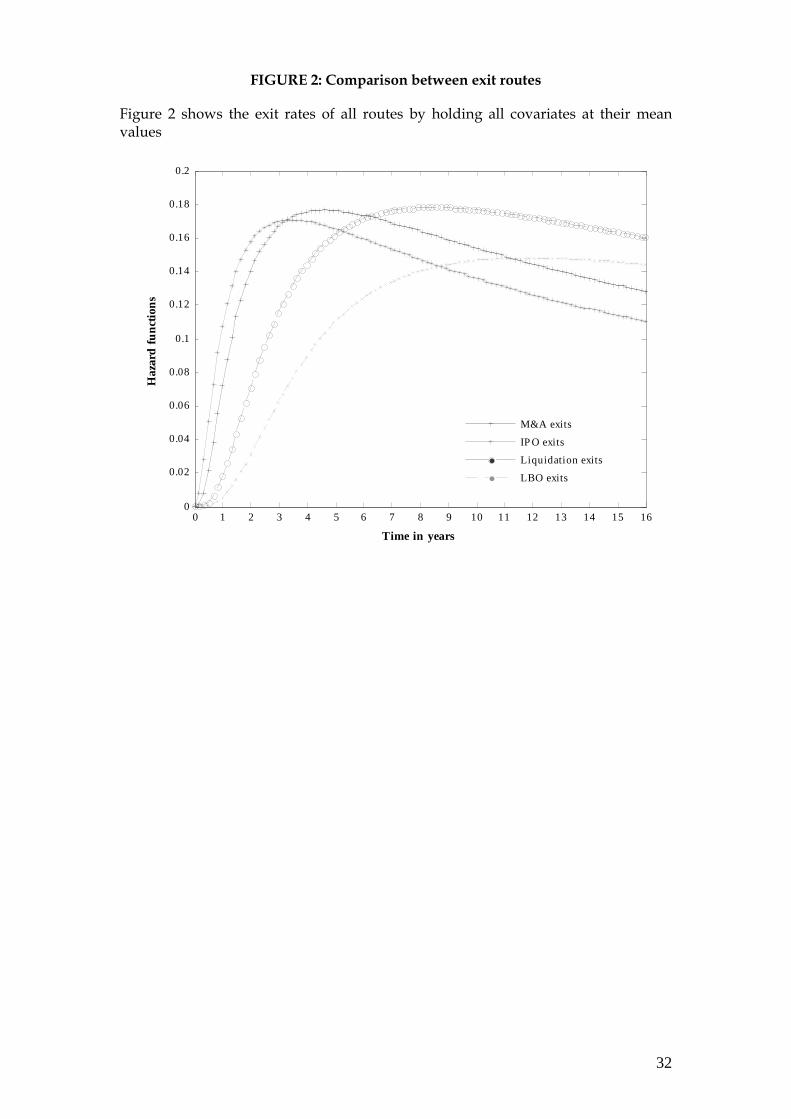
Figure 2 compares the exit routes through M&A, IPO, Liquidation and LBO
exits by holding the explanatory variables at their means. The empirical
results indicate that the time to exit via IPO is shorter than through M&A,
LBO and Liquidation exits over 3 years post investments. It is clear from the
Figure that the first targeted exit route by UK venture capital firms is the IPO
followed by M&A. Nonetheless, in the 3 year period following the
23
investments, the M&A exit is more likely than the IPO exit. Despite both
M&A and IPO exits being available routes for VCs, it seems that venture
capital firms are likely to exit via IPO in the short run (i.e. 3 year period).
Generally, VCs rely on M&A exits for mature companies or companies that
failed to go public quickly. The results support the findings of a previous
study (Cumming and MacIntosh 2003) that the IPO exit is the preferred route
for VCs in the short run. Another attractive feature of the IPO exit route is that
it yields higher returns than other exit routes. Companies that are exited via
the IPO route tend to be high quality (Bienz 2005; Cumming 2008). IPO exits
also allow entrepreneurs to maintain some control over the firm post venture
capital exit. VCs are more likely to exit their investments via Liquidation than
through IPO or M&A exits 7 years following the investment. This reflects the
fact that the probability of successful IPO and M&A exits diminishes as the
investment holding period increases. Subsequently, venture capital firms exit
their investments either through Liquidation or LBO.
[FIGURE 2 HERE]
Sensitivity analysis results
Table 6 shows the sensitivity analysis results, for four continuous variables
based on the Weibull frailty model. The sensitivity analysis shows the impact
on time to exit of changes in a continuous variable from their median values,
holding the remaining variables constant. Panel A shows changes in size of
investments from its median value up to £10 million. Panel B presents
changes in age of venture capital firms up to 10 years from the median value.
Changes in age of portfolio companies to 9 years from their median values are
presented in Panel C. Panel D shows the effect of changes in the number of
syndicated investors up to 9 from the median value. Changes in the
investment size have an impact on time to exit through M&A, IPO and LBO.
For instance, the expected time to exit is likely to decrease by 3 percent from
the median time to exit; if the size of investment increases by £9 million (i.e.
24
median size is £1 million). Similarly, the expected time to exit decreases by 10
percent through IPO and 2 percent through LBO for the same increase in size.
It is evident that venture capital firms are less likely to exit through
liquidation the larger the size of investments. This is shown by a 5 percent
increase in the expected time to exit for an increase in size from £1m to £10m.
Panel B, shows that the expected time to exit is influenced by changes in the
age of venture capital firms and varies across exit routes. For M&A and LBO
exits, the expected time to exit decreases by 5 and 3 percent respectively as
age changes by 10 years from the median. For IPO and liquidation exits, the
expected time to exit increases by 5 and 4 percent as the age of a venture
capital firm changes from 19 to 29 years. This suggests that mature venture
capital firms are more likely to pursue exit through M&A or LBO than
through IPO or liquidation. The results also reveal that young venture capital
investors are more likely than mature venture capital firms to exit quickly
through IPO. Panel C provides evidence that the time to exit through IPO is 8
percent shorter than the median expected time to exit for young companies,
and 3 percent longer than the median time to exit for mature companies. For
M&A exit, the expected time to exit is 1 percent longer than the median
expected time to exit for young companies and 6 percent shorter than the
median time to exit for mature companies. This evidence indicates that
mature portfolio companies are exited more quickly through M&A than
through IPO. Further, the time to exit through liquidation is longer for mature
companies than for young companies, perhaps due to the level of uncertainty
associated with young companies (Panel C). Undoubtedly, syndication of
venture capital firms accelerates exits through M&A and IPO. The impact of
syndication is more pronounced for IPO exit than for M&A exit. For instance,
as the number of syndicated investors increases from 1 to 9 investors, the
expected time to exit decreases by 65 percent for the IPO route, compared to
29 percent for the M&A route (Panel D). This suggests that as the number of
venture capital firms participating in financing a backed company increases,
the time to exit decreases through IPO or M&A exit and increases through
liquidation or LBO exit.
25
[TABLE 6 HERE]
By and large, IPO exits allow VCs a faster exit route than M&A, Liquidation
or LBO. Despite, the importance of syndication in venture capital
investments, the evidence shows that UK VCs do not syndicate on average.
In terms of industry analysis Internet companies are exited more quickly than
non-Internet companies. From 1990 to 1997, investments are balanced across
different financing stages, but from 1998, venture capital firms have been
investing heavily in expansion rounds. The non-parametric results show that
VCs are keen to exit their investments over the 7 year post investment period.
The parametric analysis highlights various issues: (i) experienced VCs are
more likely to exit via M&A than through IPO, (ii) buyout investments are
slower to exit than early, expansion and later stage rounds, (iii) mature VCs
are likely to take public young portfolios and sell mature portfolios to another
company, (iv) North American portfolios are exited faster in all routes than
portfolios in Europe and the rest of the world.
VI. CONCLUSION
The aim of this study is to investigate the exit behaviour of UK VCs across the
globe in a sample of 5,059 investment rounds from 1990 to 2006. The emphasis
is on the time to exit through IPO, M&A, Liquidation and LBO exits. The exits
of venture capital firms are estimated parametrically and non-parametrically.
The parametric estimation involves evaluating the impact of VCs’ and
portfolio companies’ characteristics on the time to exit using a frailty model.
The non-parametric results show that venture capital exits through an IPO
route are faster than M&A, Liquidation and LBO exits. Further, venture
capital firms aim to exit their investments within 7 years after the
investments. Nonetheless, if IPO or M&A exits do not occur, VCs are likely to
take the Liquidation or LBO routes. The parametric analysis reveals that the
time to exit from an investment is influenced by the size of investments, the
number of venture capital firms syndicating in financing rounds, stage of
financings (early, expansion, later or buyout stage), industry and country of a
26
portfolio company. We find that experienced venture capital firms, as
measured by age, hold their investments much longer than inexperienced
ones. VCs are likely to exit their investments quickly through an IPO, if the
size of investments is large. Venture capital syndication is crucial in the exit
process in that it facilitates the IPO and M&A exits. VCs have the tendency to
exit mature backed companies through M&A and young companies via IPO.
Venture capital exits for buyout investments are slower than early, expansion
and later stage investments. The industrial analysis shows that VCs exit
Internet companies faster than non-Internet companies. Venture capital firms
are likely to exit their investments quickly if a backed company is in North
America. The exits of portfolio companies in Europe and the rest of the world
are slower than North America portfolios. Exit through IPO is a highly
targeted route by venture capital firms within 3 to 4 years following the
investments. Post 4 year interval, the likelihood of IPO exits decreases, while
the probability of M&A exits increases. However, after failing to exit an
investment within 7 years, VCs are more likely to take the Liquidation exit
rather than the LBO route, based on shorter time to exit for Liquidation route
than for LBO.
27
REFERENCES Allison, P. (2000). Survival analysis using the SAS system: A practical guide.
SAS Institute Publishing
Arberk, M., Filatotchev, I., and Wright, M. (2006). Venture capitalist,
syndication and governance in the Initial Offerings. Small Business
Economics. 26:337-350.
Bergemann, D. and Hege, U. (1998). Venture capital financing, moral hazard
and learning. Journal of Banking and Finance. 22: 703-35.
Bienz, C. (2005). A pecking order of venture capital exits-what determines the
optimal exit channel for venture capital backed firms? Working Paper.
Center for Financial Studies and Geothe University.
Black, S. and Gilson, J. (1998). Venture capital and the structure of capital
markets: Banks versus Stock Markets. Journal of Financial Economics. 47:
243-277.
Botazzi. L. and Da Rin. M. (2002). Venture capital in Europe and financing
innovative compagnie. Economic Policy. 34: 231-269.
Brander, J., Amit, R., Antweiler, W.,( 2002). Venture-capital syndication:
improved venture selection vs the value added hypothesis. Journal of
Economics and Management Strategy 11, 423–452.
British Venture Capital Association (2007). Report on investment activity,
PricewaterhouseCoopers.
Chahine, S., Filatotchev,.I, and Wright, M. (2007). Venture capitalist, business
angles, and performance of entrepreneurial IPOs in the UK and France.
Journal of Business Finance and Accounting. 34: 505-528.
Cochrane, J. H. (2005). “The risk and return of venture capital”, Journal of
Financial Economics , 75, 3-52.
Clercq, D., Fried, H., Lehtonen, O. and Sapienza, H. (2006). An entrepreneur’s
guide to the venture capital galaxy. Academy of Management Perspectives
Coakley, J., Hadass, L. and Wood, A. (2007). Post-IPO operating performance,
venture capital and the bubble years. Journal of Business Finance and
Accounting. 34: 1423-1446.
28
Cumming, D. J. (2008). Contracts and Exits in Venture Capital Finance. The
Review of Financial Studies. 21: 1947-1982
Cumming, D. and Johan, S. (2007). The profile of venture capital exits in
Canada. International Merger & Acquisitions Activity since 1990. p:196-
219.
Cumming D. and Johan, S. (2008) Pre-planned exit strategies in venture
capital. European Economic Review. 52:1209-1241.
Cumming, D. Fleming, G. and Schwienbacher, A. (2006). Legality and
venture capital exits. Journal of Corporate Finance. 12: 214-245.
Cumming, D. J. and MacIntosh, J. G. (2003). Venture capital exits in Canada
and the United States. University of Toronto Law Journal, 53: 101-200.
Elisabete G., Cesaltina P. and Mohamed, A. (2008). The Exit Decision in the
European Venture Capital Market. Working Paper.
http://www.cefage.uevora.pt/en/content/download/1241/16206/version/
2/file/2008_01.pdf.
Filatotchev. I. (2006). Effects of executive characteristics and venture capital
involvement on board composition and share ownership in IPO firms.
British Journal of Management. 17: 75-92.
Giot, P. and Schwienbacher, A. (2007). IPOs, trade sales and liquidation:
Modelling venture capital exits using exits using survival analysis. Journal
of Banking & Finance. 31:697-702.
Gompers, P. and Lerner, J. (1999) The Venture capital cycle, Cambridge MA:
MIT Press.
Gompers, P. and Lerner, J. (2001). The venture capital revolution. Journal of
Economic Perspective. 2: 145-168.
Gregoriou, G., Kooli, M. and Kraeussl. R. (2007). Venture capital in Europe. 1st
edition, Elsevier Inc.
Gutierrez. R. (2002). Parametric frailty and shared frailty survival models. The
stata journal 2: 22-4
Hellmann, T. (1998). The allocation of control rights in venture capital
contracts. Rand Journal of Economics. 29: 57-76.
29
Hensler, D., Rutherford, R., and Springer, Thomas. (1997). The survival of
initial public offerings in the aftermarket. Journal of Financial Research, 93-110
Isaksson, A. (2007). Exit strategy and the intensity of exit-directed activities
among venture capital-backed entrepreneurs in Sweden. Phd dissertation,
Umeå School of Business
Jain, B., and Kini, O. (2000). Does the presence of venture capitalists improve
the survival profile of IPO firms?. Journal of Business Finance & Accounting,
27: 1139-1176.
Jelic, R. (2008). UK Private Equity market- longevity, exit strategies and
performance management buy-outs. European Financial Management
Annual Meeting. Athens.
Jelic, R., Saadouni, B., and Wright, M. (2005). Performance of private to public
MBOs: the role of venture capital. Journal of Business Finance & Accounting, 4:
643-681.
Lancaster. T. (1979). Econometric methods for the duration of unemployment.
Econometrica, 47: 939-56.
Lerner, J.,(1994). Venture capitalists and the decision to go public. Journal of
Financial Economics 35, 293–316.
Ljungvist, A., Marston, F. and Wilhelm, W. (2005). Scaling the hierarchy: How
and why investment banks compete for syndicate co-management
appointments. Working paper New York University.
Lockett, A. and Wright, M. (2001) The syndication of venture capital
investments. The International Journal of Management Science. 29, 375-390.
Megginson, W., Weiss, K.,(1991). Venture capital certification in initial public
offerings. Journal of Finance 46, 879–893
McGee. and Suzanne. (2005). A new exit in VC land? Private Equity article.
Nils. B. and Norbert. H. (2007) New path to profits in biotech: Taking the
acquisition exit. Journal of Commercial Biotechnology. 13:78-85.
Pearce. R. and Barnes. S. (2006). Raising venture capital. Wiley Finance . UK.
30
Petty, J., Bygrave, W. and Shulman, J. (1994) ‘Harvesting the entrepreneurial
venture: a time for creating value’, Journal of Applied Corporate Finance.
7:48–58.
Relander, K., Syrjänen, A., and Miettinen, S. (1994). Analysis of the trade sale
as a venture capital exit route. In Bygrave, W., Hay., M., and Peeters, J.
(eds) Realizing Investment Value. London, Pittman Publishing, 132-196.
Schwienbacher, A. (2005). An empirical analysis of venture capital exits in
Europe and in the United States. Working Paper.
Schonfeld, E. (2008). The crises in venture capital. Online: (21st April 2009)
http://www.techcrunch.com/2008/07/01/the-crisis-in-venture-capital/
Shumway, T. (2001). Forecasting bankruptcy more accurately: A simple
hazard model, Journal of Business. 74: 101-124.
Woodward, S. and Hall, R. (2003), Benchmarking the returns to venture,
Stanford and NBER Working Paper.
Wüstenhagen, R. and Teppo, T. (2006). Do venture capitalists really invest in
good industries? Risk-return perceptions and path dependence in the
emerging European energy VC market. International Journal Technology
Management. 34
31
FIGURE 1: Exits and venture capital industry
LimitedPartners
VentureCapital
PortfolioCompany
Exit investment
Fund to venture capitalists
Invest in portfoliosWork closely with entrepreneurs
Venture capitalists exit theInvestments and sign for newfunds
Policy makers
Industry growth
Interested
LimitedPartners
VentureCapital
PortfolioCompany
Exit investment
Fund to venture capitalists
Invest in portfoliosWork closely with entrepreneurs
Venture capitalists exit theInvestments and sign for newfunds
Policy makers
Industry growth
Interested
32
FIGURE 2: Comparison between exit routes
Figure 2 shows the exit rates of all routes by holding all covariates at their mean values
0 1 2 3 4 5 6 7 8 9 10 11 12 13 14 15 160
0.02
0.04
0.06
0.08
0.1
0.12
0.14
0.16
0.18
0.2
Time in years
Haz
ard
fu
nct
ion
s
M&A exits
IP O exits
Liquidation exits
LBO exits
33
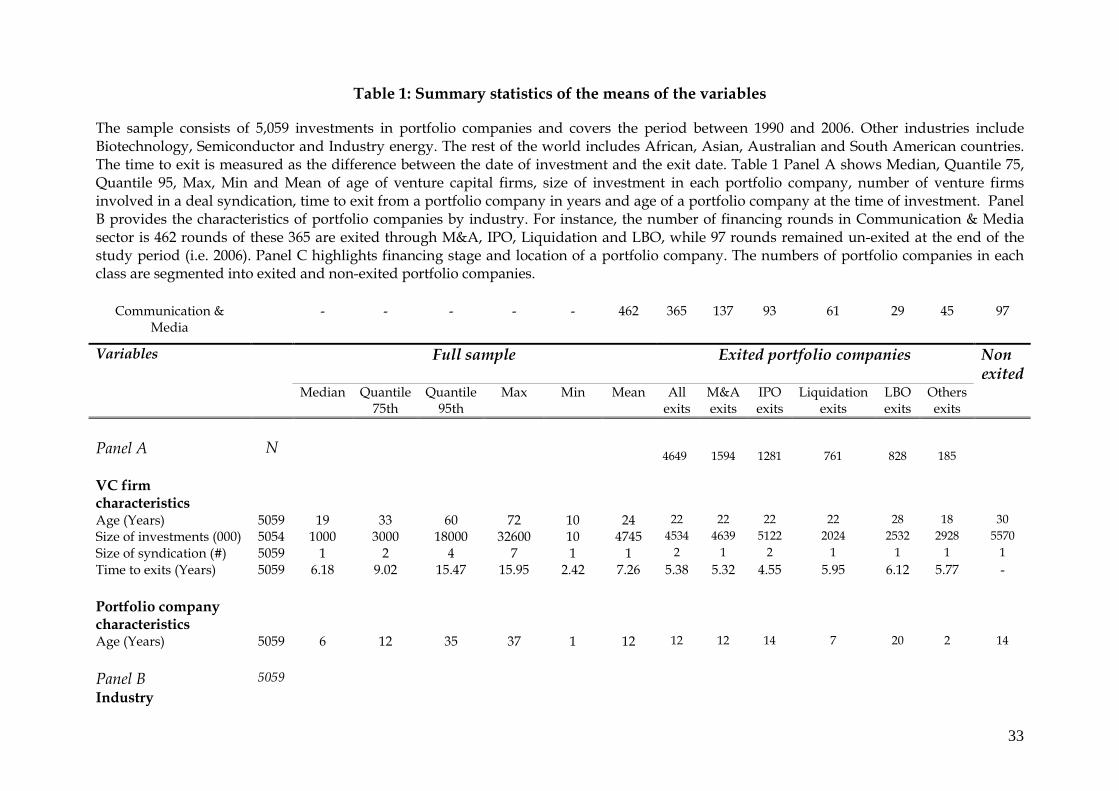
Table 1: Summary statistics of the means of the variables
The sample consists of 5,059 investments in portfolio companies and covers the period between 1990 and 2006. Other industries include Biotechnology, Semiconductor and Industry energy. The rest of the world includes African, Asian, Australian and South American countries. The time to exit is measured as the difference between the date of investment and the exit date. Table 1 Panel A shows Median, Quantile 75, Quantile 95, Max, Min and Mean of age of venture capital firms, size of investment in each portfolio company, number of venture firms involved in a deal syndication, time to exit from a portfolio company in years and age of a portfolio company at the time of investment. Panel B provides the characteristics of portfolio companies by industry. For instance, the number of financing rounds in Communication & Media sector is 462 rounds of these 365 are exited through M&A, IPO, Liquidation and LBO, while 97 rounds remained un-exited at the end of the study period (i.e. 2006). Panel C highlights financing stage and location of a portfolio company. The numbers of portfolio companies in each class are segmented into exited and non-exited portfolio companies.
Variables Full sample Exited portfolio companies Non exited
Median Quantile 75th
Quantile 95th
Max Min Mean All exits
M&A exits
IPO exits
Liquidation exits
LBO exits
Others exits
Panel A
N
4649
1594
1281
761
828
185
VC firm characteristics
Age (Years) 5059 19 33 60 72 10 24 22 22 22 22 28 18 30
Size of investments (000) 5054 1000 3000 18000 32600 10 4745 4534 4639 5122 2024 2532 2928 5570
Size of syndication (#) 5059 1 2 4 7 1 1 2 1 2 1 1 1 1
Time to exits (Years) 5059 6.18 9.02 15.47 15.95 2.42 7.26 5.38 5.32 4.55 5.95 6.12 5.77 -
Portfolio company characteristics
Age (Years) 5059 6 12 35 37 1 12 12 12 14 7 20 2 14
Panel B 5059
Industry
Communication & Media
- - - - - 462 365 137 93 61 29 45 97
34
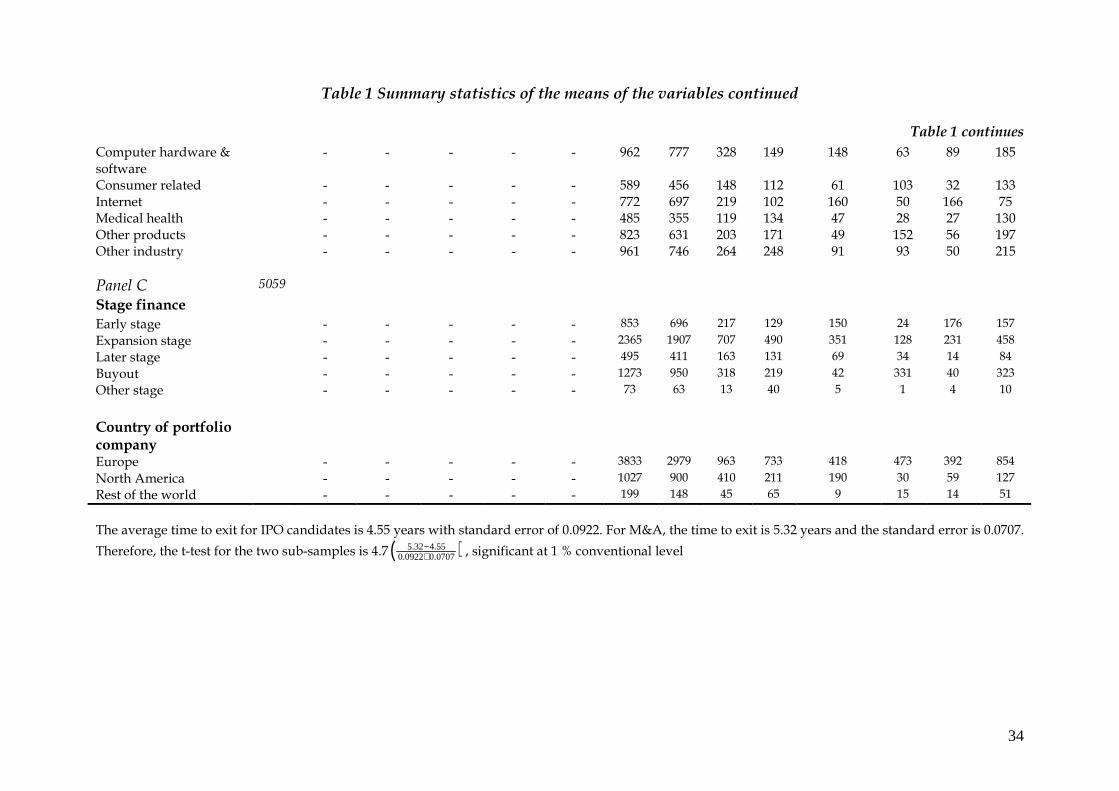
Table 1 Summary statistics of the means of the variables continued
Table 1 continues
The average time to exit for IPO candidates is 4.55 years with standard error of 0.0922. For M&A, the time to exit is 5.32 years and the standard error is 0.0707.
Therefore, the t-test for the two sub-samples is 4.7 ( )5.32 4.550.0922 0.0707
−+ , significant at 1 % conventional level
Computer hardware & software
- - - - - 962 777 328 149 148 63 89 185
Consumer related - - - - - 589 456 148 112 61 103 32 133 Internet - - - - - 772 697 219 102 160 50 166 75 Medical health - - - - - 485 355 119 134 47 28 27 130 Other products - - - - - 823 631 203 171 49 152 56 197 Other industry - - - - - 961 746 264 248 91 93 50 215
Panel C 5059 Stage finance Early stage - - - - - 853 696 217 129 150 24 176 157
Expansion stage - - - - - 2365 1907 707 490 351 128 231 458
Later stage - - - - - 495 411 163 131 69 34 14 84
Buyout - - - - - 1273 950 318 219 42 331 40 323
Other stage - - - - - 73 63 13 40 5 1 4 10
Country of portfolio company
Europe - - - - - 3833 2979 963 733 418 473 392 854
North America - - - - - 1027 900 410 211 190 30 59 127
Rest of the world - - - - - 199 148 45 65 9 15 14 51
35
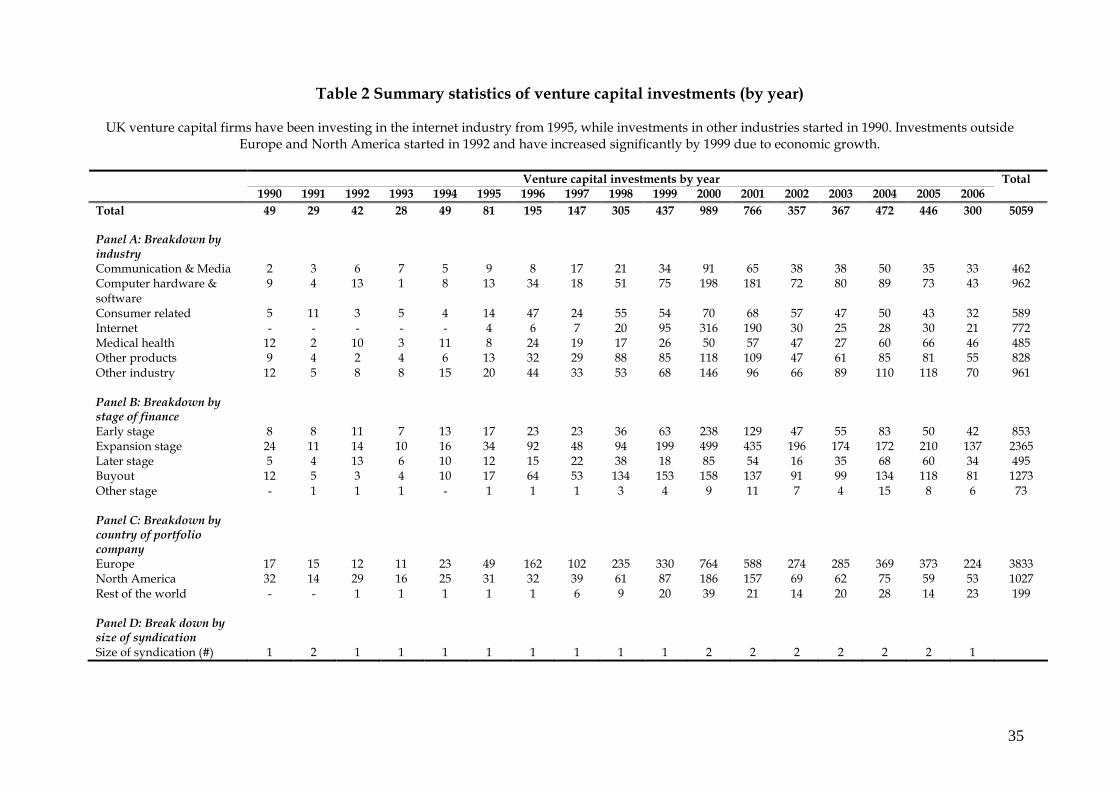
Table 2 Summary statistics of venture capital investments (by year)
UK venture capital firms have been investing in the internet industry from 1995, while investments in other industries started in 1990. Investments outside Europe and North America started in 1992 and have increased significantly by 1999 due to economic growth.
Venture capital investments by year
1990 1991 1992 1993 1994 1995 1996 1997 1998 1999 2000 2001 2002 2003 2004 2005 2006 Total
Total 49 29 42 28 49 81 195 147 305 437 989 766 357 367 472 446 300 5059 Panel A: Breakdown by industry
Communication & Media 2 3 6 7 5 9 8 17 21 34 91 65 38 38 50 35 33 462 Computer hardware & software
9 4 13 1 8 13 34 18 51 75 198 181 72 80 89 73 43 962
Consumer related 5 11 3 5 4 14 47 24 55 54 70 68 57 47 50 43 32 589 Internet - - - - - 4 6 7 20 95 316 190 30 25 28 30 21 772 Medical health 12 2 10 3 11 8 24 19 17 26 50 57 47 27 60 66 46 485 Other products 9 4 2 4 6 13 32 29 88 85 118 109 47 61 85 81 55 828 Other industry 12 5 8 8 15 20 44 33 53 68 146 96 66 89 110 118 70 961 Panel B: Breakdown by stage of finance
Early stage 8 8 11 7 13 17 23 23 36 63 238 129 47 55 83 50 42 853 Expansion stage 24 11 14 10 16 34 92 48 94 199 499 435 196 174 172 210 137 2365 Later stage 5 4 13 6 10 12 15 22 38 18 85 54 16 35 68 60 34 495 Buyout 12 5 3 4 10 17 64 53 134 153 158 137 91 99 134 118 81 1273 Other stage - 1 1 1 - 1 1 1 3 4 9 11 7 4 15 8 6 73 Panel C: Breakdown by country of portfolio company
Europe 17 15 12 11 23 49 162 102 235 330 764 588 274 285 369 373 224 3833 North America 32 14 29 16 25 31 32 39 61 87 186 157 69 62 75 59 53 1027 Rest of the world - - 1 1 1 1 1 6 9 20 39 21 14 20 28 14 23 199 Panel D: Break down by size of syndication
Size of syndication (#) 1 2 1 1 1 1 1 1 1 1 2 2 2 2 2 2 1
36
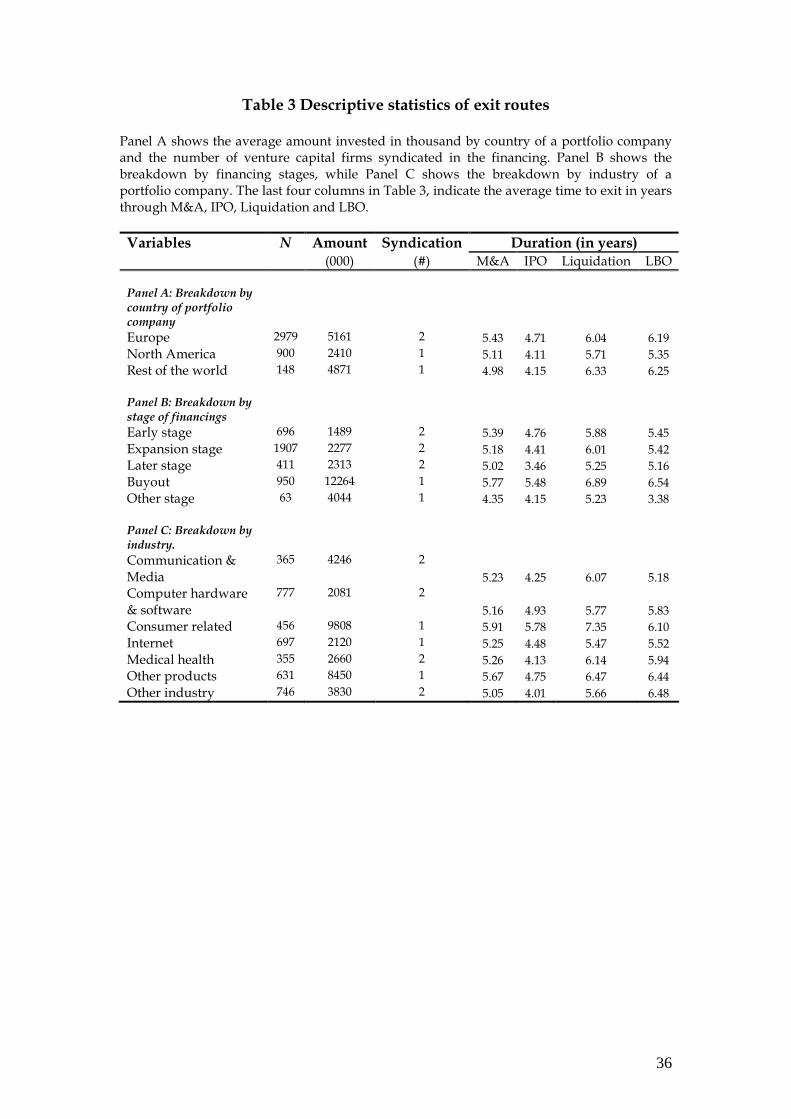
Table 3 Descriptive statistics of exit routes Panel A shows the average amount invested in thousand by country of a portfolio company and the number of venture capital firms syndicated in the financing. Panel B shows the breakdown by financing stages, while Panel C shows the breakdown by industry of a portfolio company. The last four columns in Table 3, indicate the average time to exit in years through M&A, IPO, Liquidation and LBO.
Variables N Amount Syndication Duration (in years) (000) (#) M&A IPO Liquidation LBO
Panel A: Breakdown by country of portfolio company
Europe 2979 5161 2 5.43 4.71 6.04 6.19
North America 900 2410 1 5.11 4.11 5.71 5.35
Rest of the world 148 4871 1 4.98 4.15 6.33 6.25
Panel B: Breakdown by stage of financings
Early stage 696 1489 2 5.39 4.76 5.88 5.45
Expansion stage 1907 2277 2 5.18 4.41 6.01 5.42
Later stage 411 2313 2 5.02 3.46 5.25 5.16
Buyout 950 12264 1 5.77 5.48 6.89 6.54
Other stage 63 4044 1 4.35 4.15 5.23 3.38
Panel C: Breakdown by industry.
Communication & Media
365 4246 2
5.23 4.25 6.07 5.18
Computer hardware & software
777 2081 2
5.16 4.93 5.77 5.83
Consumer related 456 9808 1 5.91 5.78 7.35 6.10
Internet 697 2120 1 5.25 4.48 5.47 5.52
Medical health 355 2660 2 5.26 4.13 6.14 5.94
Other products 631 8450 1 5.67 4.75 6.47 6.44
Other industry 746 3830 2 5.05 4.01 5.66 6.48
37
Table 4. Non-parametric estimation of exit rates The cumulative exit rate is estimated using a non-parametric cumulative distribution function. The probability of exit as measured by cumulative distribution function is approximated over sixteen years (i.e. 1990 to 2006) by exit route and country of a portfolio company.
sj
j 1 j
EF̂(t)
n=
=
∑
Exit time (years)
M&A IPO Liquidation LBO
Europe N.America R.world Europe N.America R.world Europe N.America R.world Europe N.America R.world
1 0.044 0.078 0.057 0.097 0.165 0.143 0.016 0.054 0.000 0.011 0.000 0.000 2 0.105 0.162 0.113 0.184 0.299 0.250 0.048 0.126 0.000 0.027 0.055 0.000 3 0.177 0.230 0.208 0.251 0.407 0.310 0.101 0.179 0.077 0.064 0.091 0.040 4 0.272 0.340 0.302 0.332 0.494 0.417 0.165 0.251 0.154 0.126 0.200 0.160 5 0.412 0.480 0.377 0.426 0.593 0.512 0.275 0.336 0.231 0.210 0.309 0.280 6 0.555 0.672 0.566 0.537 0.688 0.571 0.415 0.511 0.231 0.320 0.418 0.400 7 0.689 0.798 0.717 0.636 0.779 0.619 0.599 0.650 0.462 0.467 0.473 0.440 8 0.765 0.872 0.793 0.693 0.849 0.738 0.704 0.718 0.615 0.554 0.564 0.520 9 0.803 0.905 0.830 0.724 0.879 0.750 0.738 0.762 0.615 0.604 0.582 0.560 10 0.838 0.931 0.830 0.738 0.883 0.750 0.769 0.807 0.692 0.631 0.582 0.560 11 0.851 0.941 0.830 0.744 0.891 0.750 0.782 0.825 0.692 0.637 0.582 0.560 12 0.858 0.943 0.830 0.749 0.891 0.750 0.800 0.834 0.692 0.639 0.582 0.560 13 0.863 0.953 0.830 0.751 0.891 0.761 0.800 0.838 0.692 0.639 0.582 0.560 14 0.883 0.964 0.849 0.7815 0.917 0.809 0.831 0.870 0.846 0.679 0.709 0.760 15 0.915 0.967 0.887 0.878 0.943 0.845 0.891 0.919 0.923 0.801 0.782 0.760 16 0.935 0.972 0.943 0.914 0.956 0.904 0.928 0.955 0.923 0.859 0.909 0.800 No. obs 1111 429 54 962 236 83 521 224 16 748 55 25
.
38
Table 5: Parametric estimation of time to exit using frailty model The other stage financings, other industries and the rest of the world are used as the base variables for the dummies. The values in the brackets are clustered standard errors correcting for within group correlations. The coefficients are estimated through maximum likelihood estimation under Weibull-Gamma distribution. The following equation is used to estimate the results of Table 4.5.2.7, for All exits, M&A exit, IPO exit, Liquidation and LBO exits.
εβCountryγIndustryδStage
lioageSqrtPortfoαSyndαLnSizeInvsαSqrtVCageαα)Ln(t
m
2
1kk
6
1jj
4
1ii
43210m
++++
++++=
∑∑∑===
***, ** and * indicate significance at 1%, 5% and 10% respectively.
Variables Predicted Exits
Signs All exits M&A IPO Liquidation LBO
Panel A: VC related variables
Constant +/- 1.8887*** 2.2874*** 1.6396*** 1.9446*** 2.1324
(0.1510) (0.2898) (0.2392) (0.2237) (1.9569)
Age (Sqrt) +/- 0.0032*** -0.0020*** 0.0011 0.0052*** 0.0052***
(0.0005) (0.0007) (0.0012) (0.0007) (0.0010)
Size (logarithm) - -0.0185** -0.0115 -0.0507** -0.0250* -0.0086
(0.0086) (0.0129) (0.0203) (0.0150) (0.0140)
Syndication (#) - -0.0550*** -0.0536*** -0.1358*** 0.0403 0.0136
(0.0118) (0.0185) (0.0285) (0.0289) (0.0267)
Early stage +/- 0.2513** -0.1172 0.2402 0.2593* 0.0148
(0.1192) (0.2363) (0.1822) (0.1582) (1.9737)
Expansion stage +/- 0.2130* -0.1751 0.2682 0.2623* 0.0991
(0.1208) (0.2317) (0.1839) (0.1542) (1.9228)
Later stage +/- 0.1381 -0.2113 0.0416 0.3687** -0.1626
(0.1340) (0.2376) (0.2078) (0.1630) (1.9216)
Buyout + 0.3537** -0.0832 0.3848** 0.4455*** 0.1701
(0.1207) (0.2347) (0.1884) (0.1682) (1.9524)
Panel B: Portfolio related variables
Age (Sqrt) +/- 0.0085 -0.0209** 0.0820*** 0.0335 0.0053
(0.0066) (0.0105) (0.0172) (0.0241) (0.0115)
Communication & Media
+/- 0.0563 0.0661 0.1552 -0.0009 0.0897
(0.0430) (0.0731) (0.1038) (0.0756) (0.1037)
Computer hardware & software
+/- 0.0178 0.0004 0.2779*** -0.1090 -0.0949
(0.0402) (0.0589) (0.0941) (0.0846) (0.0745)
Consumer related +/- 0.0788** 0.0839 0.3534*** -0.0053 -0.1122
(0.0345) (0.0624) (0.0821) (0.0987) (0.0721)
Internet -0.1002** -0.0304 0.1258 -0.2631*** -0.2160***
(0.0413) (0.0569) (0.0954) (0.0756) (0.0647)
Medical health +/- 0.0921** 0.1196 0.1271 0.0302 0.1165
(0.0432) (0.0779) (0.0914) (0.0916) (0.0823)
Other products +/- 0.0441 0.0753 0.0633 0.0809 -0.0891
(0.0394) (0.0691) (0.0742) (0.0857) (0.0636)
Europe +/- 0.0061 0.0221 0.1398 -0.1304 -0.2061**
(0.0480) (0.1043) (0.0778) (0.0835) (0.1059)
North America - -0.1616*** -0.1918* -0.0919* -0.1789** -0.1324*
(0.0528) (0.1124) (0.0524) (0.0921) (0.0856)
Pseudo R2 0.11 0.21 0.116 0.06 0.249
No. obs 5054 1592 1223 758 825
m = All exits, M&A, IPO, Liquidation and LBO exits.
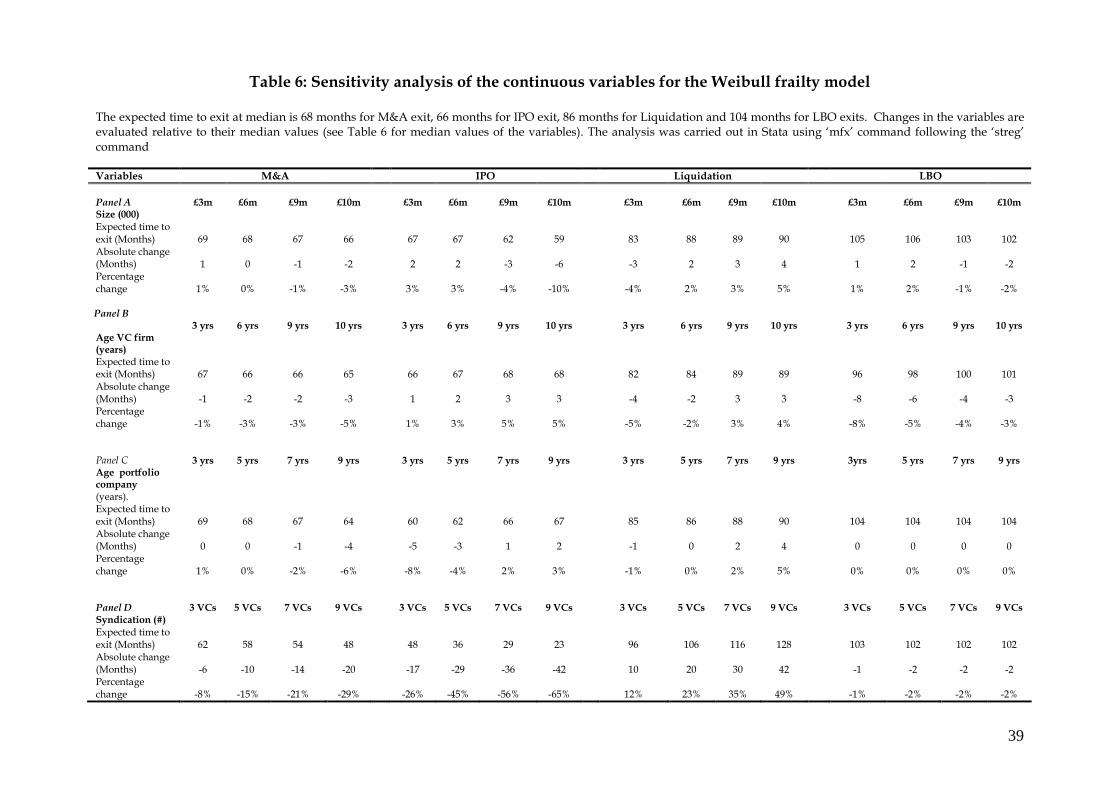
39
Table 6: Sensitivity analysis of the continuous variables for the Weibull frailty model The expected time to exit at median is 68 months for M&A exit, 66 months for IPO exit, 86 months for Liquidation and 104 months for LBO exits. Changes in the variables are evaluated relative to their median values (see Table 6 for median values of the variables). The analysis was carried out in Stata using ‘mfx’ command following the ‘streg’ command
Variables M&A IPO Liquidation LBO
Panel A
£3m
£6m
£9m
£10m
£3m
£6m
£9m
£10m
£3m
£6m
£9m
£10m
£3m
£6m
£9m
£10m
Size (000) Expected time to exit (Months) 69 68 67 66
67 67 62 59
83 88 89 90
105 106 103 102
Absolute change (Months) 1 0 -1 -2
2 2 -3 -6
-3 2 3 4
1 2 -1 -2
Percentage change 1% 0% -1% -3%
3% 3% -4% -10%
-4% 2% 3% 5%
1% 2% -1% -2%
Panel B
3 yrs
6 yrs
9 yrs
10 yrs
3 yrs
6 yrs
9 yrs
10 yrs
3 yrs
6 yrs
9 yrs
10 yrs
3 yrs
6 yrs
9 yrs
10 yrs Age VC firm (years)
Expected time to exit (Months) 67 66 66 65
66 67 68 68
82 84 89 89
96 98 100 101
Absolute change (Months) -1 -2 -2 -3
1 2 3 3
-4 -2 3 3
-8 -6 -4 -3
Percentage change -1% -3% -3% -5%
1% 3% 5% 5%
-5% -2% 3% 4%
-8% -5% -4% -3%
Panel C
3 yrs
5 yrs
7 yrs
9 yrs
3 yrs
5 yrs
7 yrs
9 yrs
3 yrs
5 yrs
7 yrs
9 yrs
3yrs
5 yrs
7 yrs
9 yrs
Age portfolio company (years).
Expected time to exit (Months) 69 68 67 64
60 62 66 67
85 86 88 90
104 104 104 104
Absolute change (Months) 0 0 -1 -4
-5 -3 1 2
-1 0 2 4
0 0 0 0
Percentage change 1% 0% -2% -6%
-8% -4% 2% 3%
-1% 0% 2% 5%
0% 0% 0% 0%
Panel D
3 VCs
5 VCs
7 VCs
9 VCs
3 VCs
5 VCs
7 VCs
9 VCs
3 VCs
5 VCs
7 VCs
9 VCs
3 VCs
5 VCs
7 VCs
9 VCs
Syndication (#) Expected time to exit (Months) 62 58 54 48
48 36 29 23
96 106 116 128
103 102 102 102
Absolute change (Months) -6 -10 -14 -20
-17 -29 -36 -42
10 20 30 42
-1 -2 -2 -2
Percentage change -8% -15% -21% -29%
-26% -45% -56% -65%
12% 23% 35% 49%
-1% -2% -2% -2%