The Evolving Value-Based Healthcare Landscape ... · The Evolving Value-Based Healthcare Landscape:...
17
The Evolving Value-Based Healthcare Landscape: Opportunities for the National Diabetes Prevention Program Bo Nemelka Director, Leavitt Partners September 2016
Transcript of The Evolving Value-Based Healthcare Landscape ... · The Evolving Value-Based Healthcare Landscape:...
The Evolving Value-Based Healthcare Landscape:
Opportunities for the National Diabetes Prevention Program
Bo Nemelka
Director, Leavitt Partners
September 2016

©2016 LEAVITT PARTNERS 2
Objectives
1. Educate about the evolving relationships facing the value-based
healthcare economy.
2. Increase understanding about accountable care concepts and the
implications for provider organizations, particularly National DPP
providers.
3. Provide insight on how payer and purchaser organizations can play
critical roles in the National DPP moving forward, particularly
financial coverage.

©2016 LEAVITT PARTNERS 3
Evolving Relationships
Patients Public Health
Payers / Purchasers Providers
Innovative offerings
Incr
ease
d c
on
sum
eri
sm E
nh
an
ced
colla
bo
ratio
n
Expanded accountability

©2016 LEAVITT PARTNERS 4
Evolving Relationships
Patients Public Health
Payers / Purchasers Providers
Innovative offerings
Incr
ease
d c
on
sum
eri
sm E
nh
an
ced
colla
bo
ratio
n
Expanded accountability

©2016 LEAVITT PARTNERS 5
Intersection between non-traditional providers and a public payer engaged in a value-
based arrangement
• CMS OACT certification based on data that demonstrates a reduction in medical cost for
participating seniors
• Rigorous terms of this arrangement ensure that coverage will not increase net-Medicare
spending
• No payments after 6 months unless weight loss target is achieved
Unique care model and cohort of non-traditional providers to support disease prevention
• Bright light on the promise of the National DPP, which draws the attention of commercial
and state payers
• Coverage for additional non-traditional models that demonstrably support prevention or
management of chronic disease
Medicare Announcement and Proposed Rule
Where does this lead?

©2016 LEAVITT PARTNERS 6
The Accountable Care Movement
Pre-ACO Fee for Service: A “traditional” payment system in which provider
organizations receive separate payments for each individual service provided
to patients
Care Management: A payment to provider organizations for certain non-
face-to-face care coordination services furnished to patients with multiple
chronic conditions
Pay for Performance: A payment approach in which provider organizations
are rewarded or penalized based on adherence to predetermined quality
metrics, such as meaningful use, patient quality, or value-based purchasing
ACOShared Savings: A payment approach whereby a provider organization
shares in the savings (but not in the losses) that accrue to a payer when actual
spending for a defined population is less than a target amount
Shared Savings / Shared Losses: A payment approach whereby a provider
organization shares in the savings and losses that accrue to a payer when
actual spending for a defined population is less or more than a target amount
Partial Capitation: A payment approach in which only certain types or
categories of services are paid on a capitated basis; typical examples of this
include capitation for primary care services, specialty care or other services
such as mental health
Full Capitation: A single payment made to a provider organization to cover
the cost of a predefined set of services delivered to a patient
Provider Risk
Payer
Savin
gs
Low High
Lo
wH
igh
Shared Savings
/ Shared Losses
Fee for Service
Full Capitation
Partial
Capitation
Shared Savings
Pay for
Performance
Care
Management
Pre-ACO ACO

©2016 LEAVITT PARTNERS 7
National Value-Based Payment Penetration
13%17%
22%
30%
41%
53%
65%
74%
80%83% 84%
22%26%
32%
40%
50%
63%
75%
84%
90%93% 94%
0%
10%
20%
30%
40%
50%
60%
70%
80%
90%
100%
2015 2016 2017 2018 2019 2020 2021 2022 2023 2024 2025
Percent of Care Delivered Under Value-Based Payment
Percentage of Physicians Accepting Some Form of Value-Based Payment

©2016 LEAVITT PARTNERS 8
ACO Growth
81 85 102157
207
306 323
421448 460
521
592 600 624635
730 738 761 782836
81 83 95
203254
374 391
536 558591
640
770803
855891
1031 10531080 1097
1157
0
200
400
600
800
1000
1200
1400
# o
f A
CO
s an
d P
aym
en
t A
rran
gem
en
ts
ACO Growth vs. Contract Growth Over Time
# of ACOs # of Payment Arrangements
Source: Leavitt Partners Center for Accountable Care Intelligence
Total ACOs: 836
Total Contracts: 1,157
25 commercial and government
ACO arrangements in MN
Minnesota’s IHP
demonstration
©2016 LEAVITT PARTNERS 9
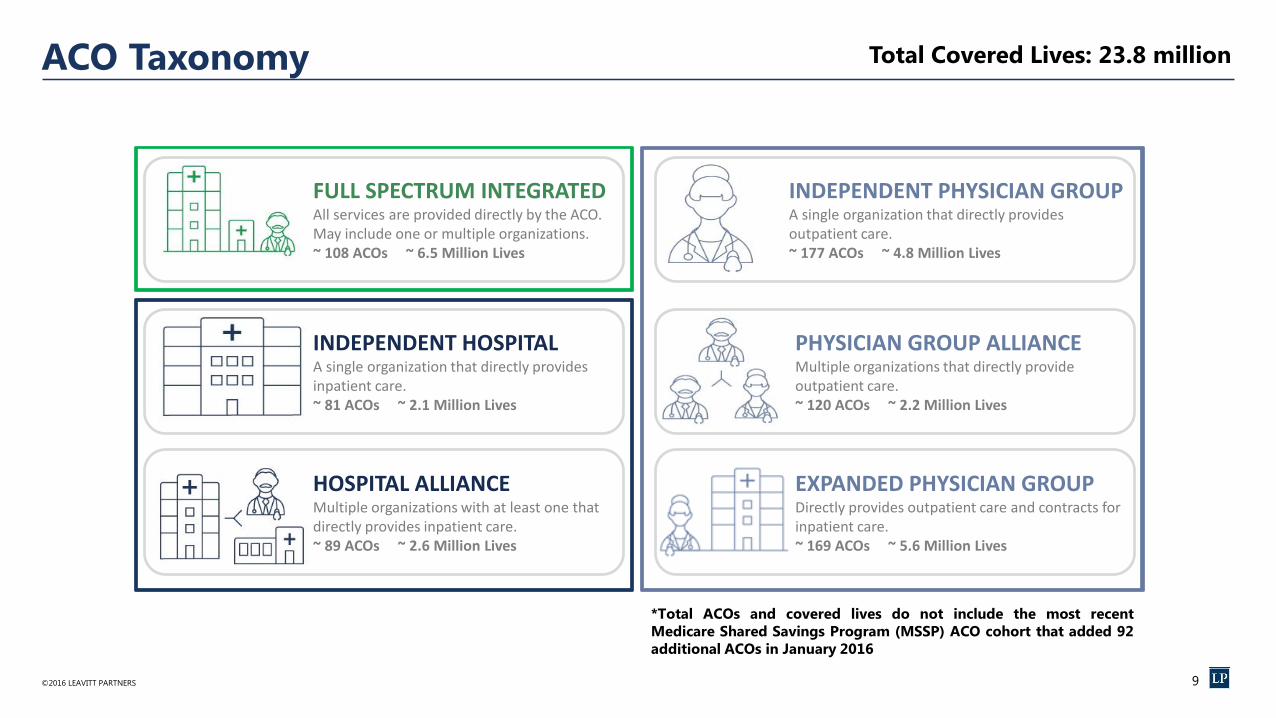
FULL SPECTRUM INTEGRATED All services are provided directly by the ACO. May include one or multiple organizations. ~ 108 ACOs ~ 6.5 Million Lives
INDEPENDENT HOSPITALA single organization that directly provides inpatient care. ~ 81 ACOs ~ 2.1 Million Lives
HOSPITAL ALLIANCEMultiple organizations with at least one that directly provides inpatient care. ~ 89 ACOs ~ 2.6 Million Lives
INDEPENDENT PHYSICIAN GROUPA single organization that directly provides outpatient care. ~ 177 ACOs ~ 4.8 Million Lives
PHYSICIAN GROUP ALLIANCEMultiple organizations that directly provide outpatient care. ~ 120 ACOs ~ 2.2 Million Lives
EXPANDED PHYSICIAN GROUPDirectly provides outpatient care and contracts for inpatient care. ~ 169 ACOs ~ 5.6 Million Lives
ACO Taxonomy Total Covered Lives: 23.8 million
*Total ACOs and covered lives do not include the most recent
Medicare Shared Savings Program (MSSP) ACO cohort that added 92
additional ACOs in January 2016

©2016 LEAVITT PARTNERS 10
Market Signals This Is Happening
• Comprehensive Primary Care Plus
• Medicare Part B drugs payment model
• Medicare Access and CHIP Reauthorization Act (MACRA)
• CMS goal: 50% of Medicare payments into alternative payment
models by end of 2018
• ACOs estimated to cover 75 million lives in five years
• Maturity of government ACO Program
• Mandatory joint replacement (CJR) bundled payment program
• Bipartisan adoption of value-based purchasing
• Heavy hospital investment in tracking the value of the care delivered
• State Innovation Model grant awards must be in some way tied to
quality of care
©2016 LEAVITT PARTNERS 11
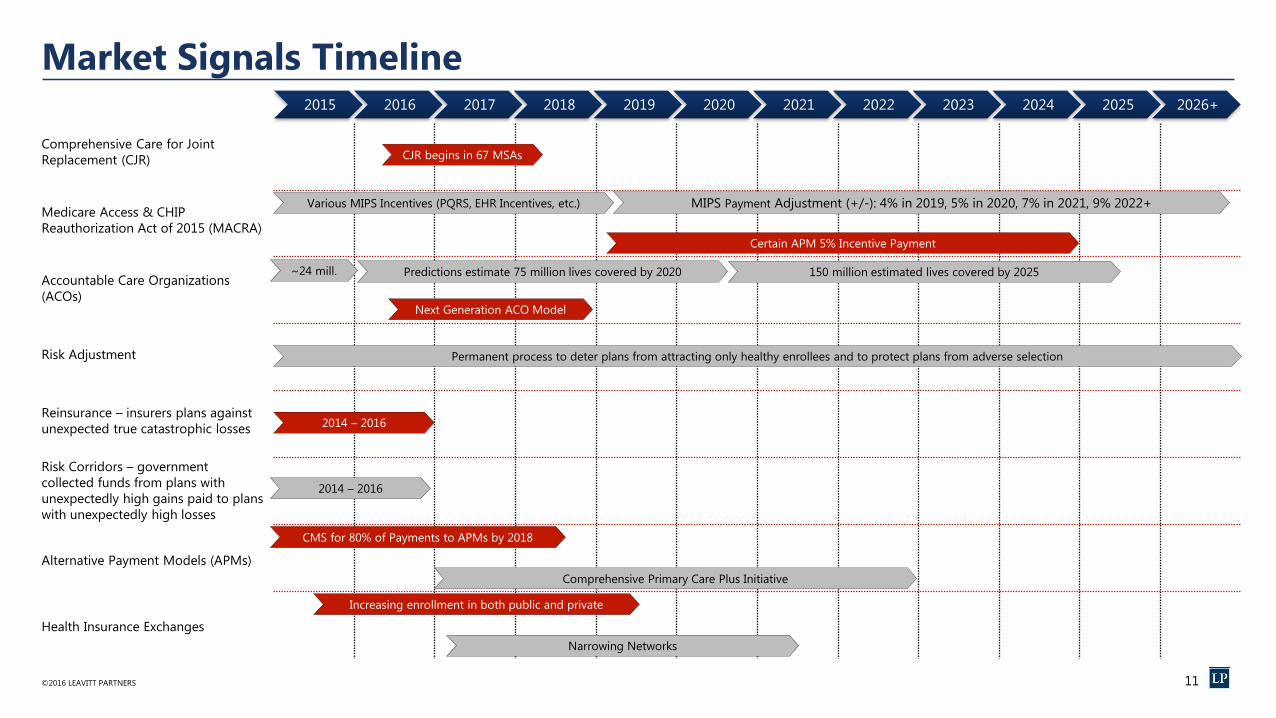
Market Signals Timeline
Comprehensive Care for Joint
Replacement (CJR)
Medicare Access & CHIP
Reauthorization Act of 2015 (MACRA)
Accountable Care Organizations
(ACOs)
Risk Adjustment
Reinsurance – insurers plans against
unexpected true catastrophic losses
Risk Corridors – government
collected funds from plans with
unexpectedly high gains paid to plans
with unexpectedly high losses
Alternative Payment Models (APMs)
Health Insurance Exchanges
2015 2016 2017 2018 2019 2020 2021 2022 2023 2024 2025 2026+
Various MIPS Incentives (PQRS, EHR Incentives, etc.) MIPS Payment Adjustment (+/-): 4% in 2019, 5% in 2020, 7% in 2021, 9% 2022+
Certain APM 5% Incentive Payment
CMS for 80% of Payments to APMs by 2018
Predictions estimate 75 million lives covered by 2020 150 million estimated lives covered by 2025~24 mill.
Permanent process to deter plans from attracting only healthy enrollees and to protect plans from adverse selection
2014 – 2016
2014 – 2016
Comprehensive Primary Care Plus Initiative
Next Generation ACO Model
CJR begins in 67 MSAs
Increasing enrollment in both public and private
Narrowing Networks

©2016 LEAVITT PARTNERS 12
Evolving Relationships
Patients Public Health
Payers / Purchasers Providers
Innovative offerings
Incr
ease
d c
on
sum
eri
sm E
nh
an
ced
colla
bo
ratio
n
Expanded accountability

©2016 LEAVITT PARTNERS 13
Types of Insurance Medicare
FFS: Hospital and Medical coverage administered directly through
the federal government
MC: Medicare Cost plans are a hybrid between Medicare Advantage
and original Medicare; non-network use is covered through traditional
Medicare, but the member also enjoys advantages of private coverage
(MC plans are being phased out at the end of 2018)
MA: Medicare Advantage plans sold by private insurance companies
that provide Medicare benefits
MedicaidFFS: Insurance coverage administered jointly through federal and
state governments to low-income individuals/families
MCO: Managed Care Organizations provide delivery of Medicaid
health benefits via contracts with a state Medicaid agency
CommercialSelf-Insured: Employers accept financial risk and administers its
own health insurance plan (82% of employers with 500+ employees
self-insure*)
Fully-Insured: Employers pay an insurance company who assumes
financial risk for their employees
Individual: Consumers purchase individual/family plans from private
insurance companies and pay full premiums out of pocket
HIX: Consumers purchase individual/family plans from the state- or
federally-based insurance exchange; federal subsidies are available
based on income to reduce monthly premiums
Other: Group coverage obtained through an option not associated
with an employer, HIX, or individual plan; i.e., federal, state, or union
plans, etc.
Public Private
Medicare
FFS MA
Medicaid
FFS MCO
Commercial
Self-
InsuredFully-
InsuredIndividual HIX
Other
(Federal, state,
unions, etc.)
*Source: Department of Health and Human Services, 2015
MC

©2016 LEAVITT PARTNERS 14
Insured Population by Type
0
0.2
0.4
0.6
0.8
1
1.2
1.4
2008 2009 2010 2011 2012 2013 2014 2015 2016 2017 2018 2019 2020
Pro
po
rtio
n o
f th
e T
ota
l P
op
ula
tio
n*
Insured Population Proportion by Type Over Time
Employer Based Other Uninsured Individual Market HIX Medicare Medicaid
Projected
Source: Leavitt Partners Map, 2015
*Proportion totals greater than 1 due to Medicare and Medicaid dual-eligible recipients
†Other includes any plan not employer-based or individual-based; i.e., federal, state, or union plans, etc.
†

©2016 LEAVITT PARTNERS 15
Brokers / Benefits Consultants
In Progress
Source: Leavitt Partners’ analysis for The Council of Insurance Agents & Brokers
An individual or firm that advises an employer or plan sponsor in matters relating to group insurance or employee benefits.
Benefit Consultants advise employers on an array of employee benefits – insurances, investing, legal, health/wellness, etc.
Brokers match employers’ needs (i.e. health insurance) to the right seller (i.e. payer) at the optimal price. Remember, self-
insured employers bear financial risk for employee health, but still contract with a third-party payer for administrative
capabilities. Fully-insured employers shift the financial risk and administration to a payer.

©2016 LEAVITT PARTNERS 16
Takeaways
1. The evolving relationships in the healthcare economy are driving
value and chronic disease prevention is a high priority.
2. Accountable care is being tested in many ways, but is here to stay.
The National DPP is positioned to succeed if clinical incentives move
to value and away from volume.
3. Payer and purchaser organizations play critical roles in the National
DPP moving forward, particularly financial coverage.

Thank You!
Questions?