The Evolving Global Enterprise: Preparing Future ... · comprehensive sets of data, rather than...
15
Journal of Business Cases and Applications Volume 23 The Evolving Global Enterprise, Page 1 The Evolving Global Enterprise: Preparing Future Accountants Using Analytics and Systems Integration Joseph M. Ragan Saint Joseph’s University Giovanni P. Sparacio Saint Joseph’s University Conlan P. McAndrew Saint Joseph’s University Anthony J. Filiciello Saint Joseph’s University ABSTRACT The emergence of big data has created demand in the job market for enhanced visualization skills used to interpret mass amounts of information. The immense scale of modern business imposes several implications on decision makers, considering that modern information can be comprehensive and overwhelming. Hence, today’s data sets must be presented with the use of visualization tools, so that decision makers can more easily analyze and interpret a business’ overall performance. To meet this growing demand, educators are beginning to redirect their coursework to increase the use of analytic software in the classroom environment. This paper will further explore development of capstone courses, in which accounting can be taught through the use of analytics and ERP products. Keywords: Accounting, Big Data, ERP Integration, Data Visualization, Analytics
Transcript of The Evolving Global Enterprise: Preparing Future ... · comprehensive sets of data, rather than...
Journal of Business Cases and Applications Volume 23
The Evolving Global Enterprise, Page 1
The Evolving Global Enterprise: Preparing Future Accountants
Using Analytics and Systems Integration
Joseph M. Ragan
Saint Joseph’s University
Giovanni P. Sparacio
Saint Joseph’s University
Conlan P. McAndrew
Saint Joseph’s University
Anthony J. Filiciello
Saint Joseph’s University
ABSTRACT
The emergence of big data has created demand in the job market for enhanced
visualization skills used to interpret mass amounts of information. The immense scale of modern
business imposes several implications on decision makers, considering that modern information
can be comprehensive and overwhelming. Hence, today’s data sets must be presented with the
use of visualization tools, so that decision makers can more easily analyze and interpret a
business’ overall performance. To meet this growing demand, educators are beginning to redirect
their coursework to increase the use of analytic software in the classroom environment. This
paper will further explore development of capstone courses, in which accounting can be taught
through the use of analytics and ERP products.
Keywords: Accounting, Big Data, ERP Integration, Data Visualization, Analytics
Journal of Business Cases and Applications Volume 23
The Evolving Global Enterprise, Page 2
INTRODUCTION
Over the past twenty years, the accounting profession has been confronted with
convincing arguments that technology changes must occur in the accounting classroom. It
behooves the accounting educator to assist students who will be entry level employees to
embrace new technological skills that run the range from spreadsheet accounting to advanced
predictive analytics. The sense of much of the literature is that this is not being done. To live and
work in the digital age, one must embrace its tools, and such tools should be made an integral
part of the classroom and learning experience.
As the accounting profession changes, it would be unreasonable to allow university
accounting curricula to remain static. The ever-changing field of accounting should be reflected
in a classroom environment, where teaching objectives mirror the demands of the corporate
world. One of the most pressing aspects of this demand is the emergence of big data. This case
study could be integrated within the finance or accounting curriculum at the intermediate level to
show how business analytics can support and enhance the decision-making process. Whereas
existing literature focuses on the need to include data analytics in the accounting and finance
curriculum, this case study provides a real-world method to incorporate such principles in the
classroom.
LITERATURE REVIEW
An overview of literature highlights several problems in the connectedness between
accounting education and the professional positions that students seek. Siegel and Sorenson
(1994, 1999, 2002) and Siegel and Kulesza (1996) allude to the fact that accounting education
has not kept up with the technology innovations and challenges facing the industry. Groysberg
et. al (2011) found the need for a broader set of skills given the changing expectation and
demands for accountants in strategy formulation, analysis, and interpretation of large datasets
affecting many constituent users.
According to a survey performed by Brown and Sikes (2012) of McKinsey Global
Incorporated, one key objective of corporate executives is to leverage the power of big data to
gain a competitive advantage in their respective industries. Effective accounting education
should address these concerns, in order to adequately prepare students for real-world, data-
intensive challenges. Although big data is a commonly mentioned term in today’s business
world, it can be an unclear and nebulous term with great potential for misunderstanding. Large
datasets (big data) result from the compilation of mass amounts of aggregated, unstructured
information that need agents to give it substance through organization and analysis. Moreover,
big data is not necessarily comprised of numbers alone, but also includes strings of text,
keywords, identifiers, and characteristics pertinent to specific transactions. With the right data
visualization tools, big data analytics can lead to the discovery of more significant, integrative
performance results than a simple survey or study.
Big data, when cleansed and formatted appropriately using relational database tools, has
the potential to transform an organization’s strategic decision-making processes. The proper
structuring and formatting of data is the key to effective analysis, as it is necessary to create
dimensions and measures that can be compared (Sherman, 2014). Datasets can include tens of
thousands of rows of data, and a row-by-row evaluation is simply inefficient and ineffective. In
an effort to simplify big data, visual analytics have become the benchmark method for
interpreting large-scale findings for an end-user.
Journal of Business Cases and Applications Volume 23
The Evolving Global Enterprise, Page 3
Powerful analytic applications are being developed and refined in order to make use of
the seemingly endless amount of data collected on a global scale in the modern business
environment. Analytics has proven to be tremendously valuable in a variety of applications
across several industries, and its significance for accountants is becoming readily apparent. For
example, by harnessing the power of analytics, auditors have developed the ability to test
comprehensive sets of data, rather than being merely limited to samples (Murphy & Tysiac,
2015).
According to research conducted by Bauer (2017), “the data analytics process of today's
businesses involves at least two primary challenges: (1) collecting and categorizing voluminous
data and (2) analyzing and prioritizing relevant data”. The first challenge that Bauer addresses
can be solved using ERP systems, which can automatically generate reports in easily
customizable formats. Meanwhile, analytic visualization products, such as SAP Lumira, prove
useful in addressing the second challenge he proposes. SAP Lumira enables the discovery of
underlying trends in organizations’ financial datasets, creating redefined roles for accountants.
Accountants have become key figures in the executive management of corporations, as they
possess strategic insight and analytical skills necessary to envision and fulfill long-term
objectives (Gamage, 2016). No longer are accountants confined to journal entries in the ledger,
but instead, they use their expertise to interpret information in ways that traditional data analysts
cannot.
Accountants in the workplace are adapting their skillsets in order to meet the modern
demand for analytical abilities within the growing and ever-demanding framework of
technology. Thus, it is necessary for accounting education to sense these demands and respond
appropriately. There are clear shortfalls in many accounting curricula in terms of this integration
and there is no time for any further delay in incorporating modern technologies (Pan & Seow,
2016). The most effective way for accounting education to implement these technologies is to
incorporate elements of data analytics and information systems with a focus on real-world
business application into most courses in the curriculum, not only one introductory course (Pan
& Seow, 2016). The following case study provides an efficient way to integrate analytics into the
classroom.
INTEGRATED CAPSTONE PROJECT
The primary goal of this capstone project is to demonstrate how Enterprise-Resource
Planning (ERP) software can be used to effectively supplement teaching real-world analytic
applications in the classroom environment. This case was developed at a US-based liberal arts
institution with a strong tradition of incorporating integrative learning and communication skills
throughout the curriculum. In developing this case, we were able to create advanced practice sets
focusing on accounting concepts and applications using ERP. These ERP applications are used
throughout the accounting curriculum in four of six required courses.
This case-based analysis, as featured within this paper, is a practice set used to teach
third-level (junior) accounting students. The university is partnered with the SAP University
Alliance program. SAP is one of the leading ERP providers, and SAP Lumira is their data
visualization product. By partnering with the alliance, the university is granted access to
proprietary platforms such as SAP ECC 6.0 and SAP Lumira.
SAP technology and software was incorporated within three of the six major accounting
courses at the institution through the use of practitioners and consultants in the classroom to
Journal of Business Cases and Applications Volume 23
The Evolving Global Enterprise, Page 4
enhance students’ comprehension of practical applications. Recently, the faculty have begun to
incorporate applications of data analytics to enhance the reporting features of SAP databases.
Students do not merely absorb the information in these courses, but they participate in the
pedagogy as collaborators in the learning process. A group of students are chosen as STAR
Leaders through a highly selective application process. STAR Leaders are undergraduate
accounting majors who have exhibited a high degree of knowledge in their academic coursework
and have demonstrated proficiency in the use of modern technology tools. These students are
paid technology assistants who are particularly trained in data visualization and data analytics
and contribute to the development and implementation of SAP materials in the classroom. They
are provided with enrichment activities to assist them in understanding the essentiality of
implementation of big data applications. They also assist in developing and testing different
analytic applications, as well as overseeing classroom delivery and further supporting the course
through an analytics help desk. The products and materials that are developed by the STAR
Leaders, such as the materials in this case study, are incorporated into the accounting curriculum
and presented to all students in intermediate accounting classes.
THE CASE OBJECTIVES
1. Consider the link between analytics and big data sources to identify key performance
markers.
2. Formulate an analytics dashboard evaluating financial performance around several key
indicators.
3. Create an interactive dashboard menu for an interactive presentation with end-users.
4. Submit written evaluative analysis along with a detailed report in an e-mail to responsible
parties.
THE CASE SCENARIO
Global Bike Incorporated (GBI) is a fictional, world class bicycle company serving the
professional and prosumer cyclists markets for touring and off-road bike racing. GBI’s riders
demand the highest quality and performance from their bikes and accessories. GBI is involved in
both wholesale and direct selling of its major product categories: bicycles and accessories. They
are a growing company that is attempting to expand internationally. They have identified
STARApollo as a target company that would fit their strategic growth initiatives.
SAP Reporting and Analytics – STARApollo Overview
STARApollo is a fictional, private company that manufactures outdoor apparel. The
company was started in Texas and made a market by offering high quality footwear, sporting
gear and heavy-duty baggage. In recent years, the company has grown through expanding its
product mix to include apparel targeted towards surfers, snowboarders, cyclists, skiers and
others. They are a large international company, operating in over 15 different countries and
offering merchandise in 12 different product lines. STARApollo along with its subsidiaries, has a
large customer list, and generates high annual revenues compared to its competition. GBI is
looking to acquire STARApollo, in order to take advantage of their product lines, retail
locations, international outlets, and supply chain.
Journal of Business Cases and Applications Volume 23
The Evolving Global Enterprise, Page 5
GBI needs you to serve as a consultant to assess the overall performance of STARApollo,
and identify key performance indicators that will help the CEO determine if the company is a
valuable acquisition target.
The student will follow the steps of the STARApollo script to build an interactive
analytical dashboard, as outlined in Appendix A. Appendix B includes the summative reports
and data visualizations created by the student. Appendix C showcases the written analysis and
interpretation of the data, leading to a professional judgment as to whether the acquisition is
feasible.
SUMMARY AND EVALUATIVE COMMENTS
The STARApollo Case and SAP Lumira enable accounting students to easily and
efficiently identify trends that are indicative of financial success in extensive datasets, that might
otherwise be difficult to interpret. In using analytics, university accounting students have become
able to test different accounting dimensions and relationships through the use of interactive,
pictorial dashboards. The dashboard allows students to prepare data visualizations, accompanied
by a written analysis, that serves as a proposal to show the growth dimensions of the targeted
company for takeover. This capstone project inextricably combines a student’s prior knowledge
of accounting with the analytical capacity of SAP Lumira and the professional judgment needed
to develop a substantive executive report. Student learning is enhanced within a course where
they feel they are exposed to real-world experiences that will be useful in their future jobs.
Students’ projects are evaluated based on several key metrics, which include Proficiency
and Skill, Methodology, and Assessment of Learning. The respective attributes for each criterion
are defined in Appendix D.
The first iteration of this project produced very favorable evaluation. Several student
comments reflected how real the project felt, and thus created a stronger motivation to dig deeper
into the financial analysis. Others suggested that the case encouraged them to consider a dual
major in other disciplines, such as Finance and Business Intelligence.
This is only the beginning. Future plans call for integration of this project with capstone
courses of other majors such as finance and within co-operation with other schools. This project
could be adapted and combined with other courses and other cases. Testing in the future will also
occur at the graduate level.
From a technology perspective, S/4HANA, with its embedded analytics, offers great
opportunity to increase student insight into integrated software. There is also some real potential
in extending the classroom with accounting applications in additional specialties such as GRC
(Governance, Risk and Compliance) and BPC (Business Planning and Consolidation).
Journal of Business Cases and Applications Volume 23
The Evolving Global Enterprise, Page 6
REFERENCES
ACCA & IMA (2013). Big Data: Its power and perils. Retrieved from http://www.accaglobal.
com/bigdata
Albrecht, W. Steve and Robert J. Sack. Accounting Education: Charting the Course Through a
Perilous Future. Sarasota, FL: American Accounting Association, 2000.
Bauer, A. M., PhD. (2017). Data analytics: A high-level introduction for accounting
practitioners. The Tax Adviser, 48(5), 366-369.
Brown, B., & Sikes, J. (2012, May). Minding your digital business: McKinsey Global Survey
Results.
Cao, M., Chychyla, R., & Stewart, T. (2015). Big Data Analytics in Financial Statement Audits.
Accounting Horizons, 29(2), 423- 429. doi:10.2308/acch-51068
Gamage, P. (2016). Big data: Are accounting educators ready? Accounting and Management
Information Systems, 15(3), 588-604.
Groysberg, B., Kelly, L. K. & MacDonald, B. (2011). The new path to the C-suite. Harvard
Business Review (March): 60-68.
Murphy, M. L., & Tysiac, K. (2015). Data analytics helps auditors gain deep insight. Journal Of
Accountancy, 219(4), 1.
Pan, G., & Seow, P. (2016). Preparing accounting graduates for digital revolution: A critical
review of information technology competencies and skills development. Journal Of
Education For Business, 91(3), 166-175. doi:10.1080/08832323.2016.1145622
Sherman, C. (2014). What's the big deal about BIG DATA? Online Searcher, 38(2), 10-16.
Siegel, G., & Kulesza, C.S. (1996). The practice analysis of management accounting.
Management Accounting 77 (10): 20-25.
Siegel, G., & Sorenson, J. E. (1994). What Corporate America Wants in Entry-Level
Accountants: A Joint Research Project of the Institute of Management Accountants and
the Financial Executives Institute. Montvale, NJ: IMA.
Siegel, G., & Sorenson, J. E. (1999). Counting More, Counting Less: The 1999 Practice Analysis
of Management Accounting. Montvale, NJ: IMA.
Siegel, G., & Sorenson, J. E. (2002). How to Become a Business Partner. Montvale, NJ: IMA.
Sledgianowski, D., Gomaa, M., & Tan, C. (2017). Toward integration of Big Data, technology
and information systems competencies into the accounting curriculum. Journal Of
Accounting Education, 38(Special Issue on Big Data), 81-93.
doi:10.1016/j.jaccedu.2016.12.008
Tschakert, N., Kokina, J., Kozlowski, S., & Vasarhelyi, M. (2017). How Business Schools Can
Integrate Data Analytics into the Accounting Curriculum. CPA Journal, 87(9), 10-12.
Tang, J., & Karim, K. E. (2017). BIG DATA in Business Analytics: Implications for the Audit
Profession. CPA Journal, 34-39.
Journal of Business Cases and Applications Volume 23
The Evolving Global Enterprise, Page 7
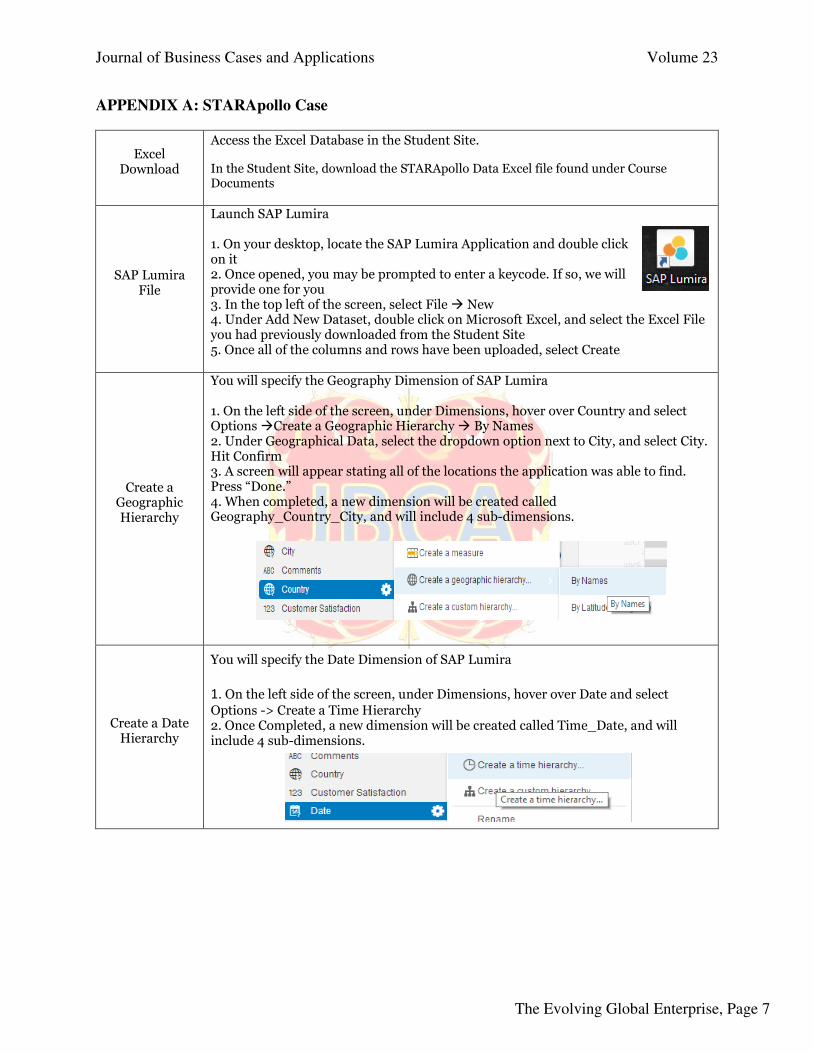
APPENDIX A: STARApollo Case
Excel Download
Access the Excel Database in the Student Site.
In the Student Site, download the STARApollo Data Excel file found under Course Documents
SAP Lumira File
Launch SAP Lumira 1. On your desktop, locate the SAP Lumira Application and double click on it 2. Once opened, you may be prompted to enter a keycode. If so, we will provide one for you 3. In the top left of the screen, select File � New 4. Under Add New Dataset, double click on Microsoft Excel, and select the Excel File you had previously downloaded from the Student Site 5. Once all of the columns and rows have been uploaded, select Create
Create a Geographic Hierarchy
You will specify the Geography Dimension of SAP Lumira 1. On the left side of the screen, under Dimensions, hover over Country and select Options �Create a Geographic Hierarchy � By Names 2. Under Geographical Data, select the dropdown option next to City, and select City. Hit Confirm 3. A screen will appear stating all of the locations the application was able to find. Press “Done.” 4. When completed, a new dimension will be created called Geography_Country_City, and will include 4 sub-dimensions.
Create a Date Hierarchy
You will specify the Date Dimension of SAP Lumira
1. On the left side of the screen, under Dimensions, hover over Date and select
Options -> Create a Time Hierarchy 2. Once Completed, a new dimension will be created called Time_Date, and will include 4 sub-dimensions.
Journal of Business Cases and Applications Volume 23
The Evolving Global Enterprise, Page 8
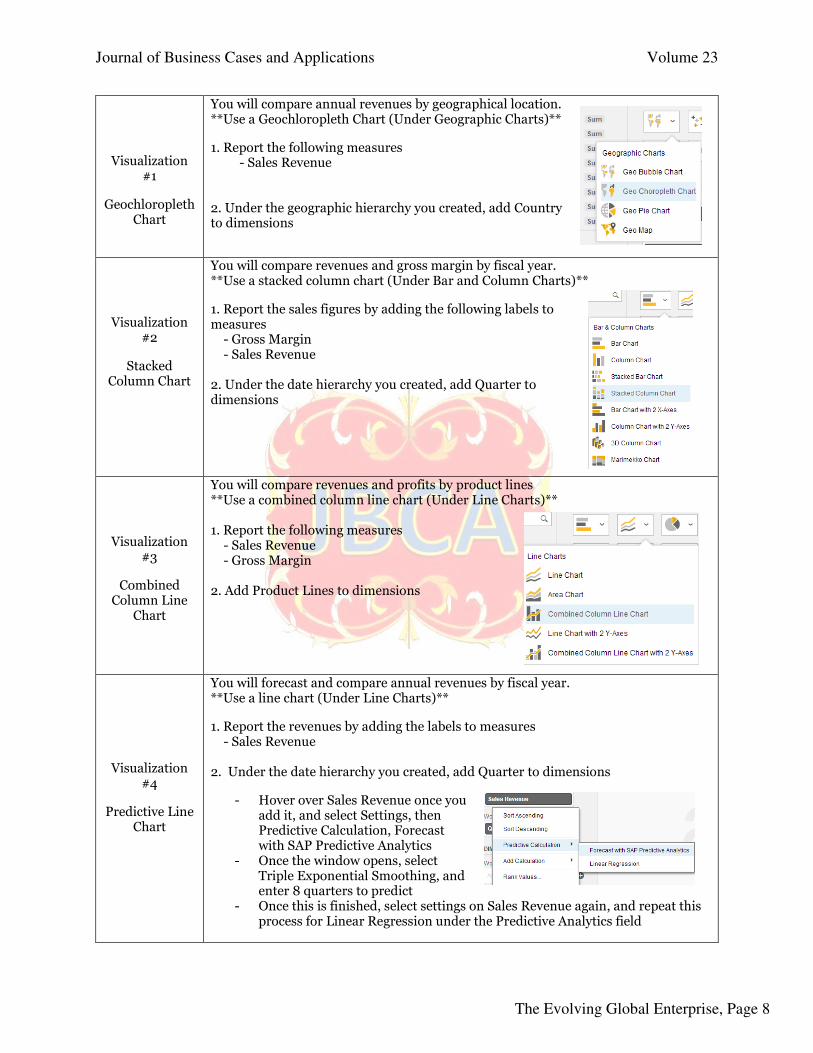
Visualization #1
Geochloropleth Chart
You will compare annual revenues by geographical location. **Use a Geochloropleth Chart (Under Geographic Charts)**
1. Report the following measures - Sales Revenue 2. Under the geographic hierarchy you created, add Country to dimensions
Visualization #2
Stacked Column Chart
You will compare revenues and gross margin by fiscal year. **Use a stacked column chart (Under Bar and Column Charts)**
1. Report the sales figures by adding the following labels to measures - Gross Margin - Sales Revenue 2. Under the date hierarchy you created, add Quarter to dimensions
Visualization #3
Combined Column Line
Chart
You will compare revenues and profits by product lines **Use a combined column line chart (Under Line Charts)** 1. Report the following measures - Sales Revenue - Gross Margin 2. Add Product Lines to dimensions
Visualization #4
Predictive Line Chart
You will forecast and compare annual revenues by fiscal year. **Use a line chart (Under Line Charts)**
1. Report the revenues by adding the labels to measures - Sales Revenue 2. Under the date hierarchy you created, add Quarter to dimensions
- Hover over Sales Revenue once you add it, and select Settings, then Predictive Calculation, Forecast with SAP Predictive Analytics
- Once the window opens, select Triple Exponential Smoothing, and enter 8 quarters to predict
- Once this is finished, select settings on Sales Revenue again, and repeat this process for Linear Regression under the Predictive Analytics field
Journal of Business Cases and Applications Volume 23
The Evolving Global Enterprise, Page 9
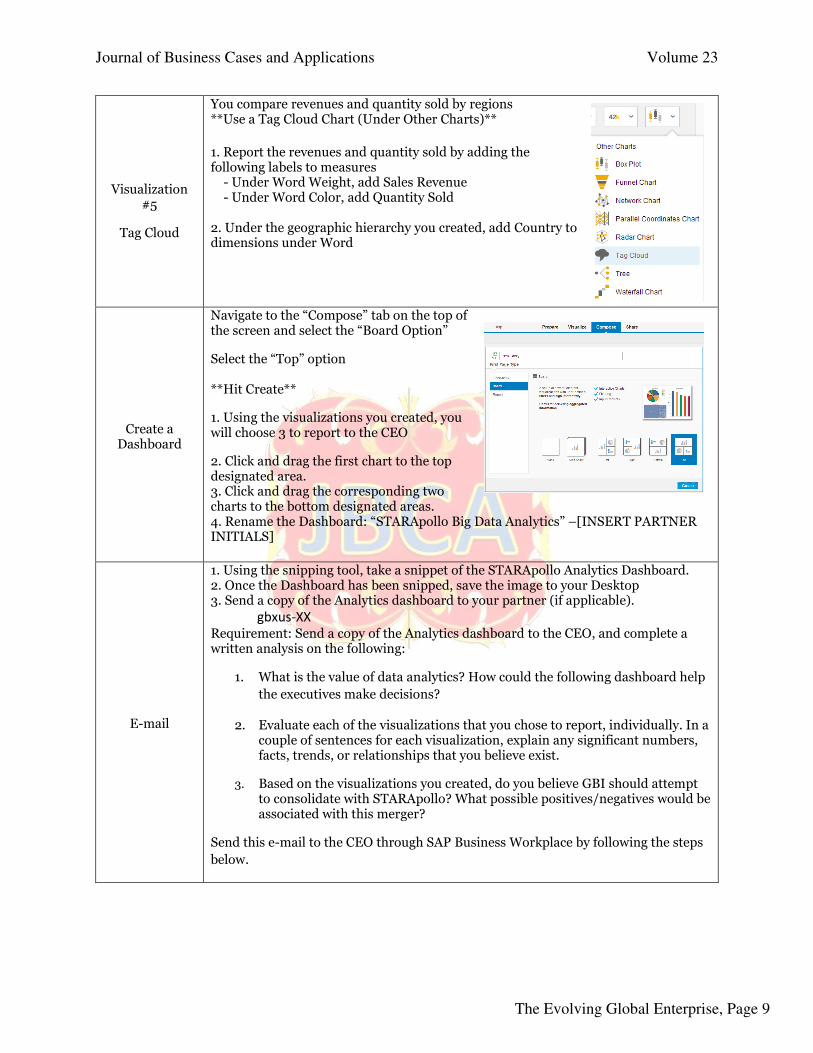
Visualization #5
Tag Cloud
You compare revenues and quantity sold by regions **Use a Tag Cloud Chart (Under Other Charts)**
1. Report the revenues and quantity sold by adding the following labels to measures - Under Word Weight, add Sales Revenue - Under Word Color, add Quantity Sold 2. Under the geographic hierarchy you created, add Country to dimensions under Word
Create a Dashboard
Navigate to the “Compose” tab on the top of the screen and select the “Board Option”
Select the “Top” option **Hit Create**
1. Using the visualizations you created, you will choose 3 to report to the CEO
2. Click and drag the first chart to the top designated area. 3. Click and drag the corresponding two charts to the bottom designated areas. 4. Rename the Dashboard: “STARApollo Big Data Analytics” –[INSERT PARTNER INITIALS]
1. Using the snipping tool, take a snippet of the STARApollo Analytics Dashboard. 2. Once the Dashboard has been snipped, save the image to your Desktop 3. Send a copy of the Analytics dashboard to your partner (if applicable).
gbxus-XX
Requirement: Send a copy of the Analytics dashboard to the CEO, and complete a written analysis on the following:
1. What is the value of data analytics? How could the following dashboard help
the executives make decisions?
2. Evaluate each of the visualizations that you chose to report, individually. In a couple of sentences for each visualization, explain any significant numbers, facts, trends, or relationships that you believe exist.
3. Based on the visualizations you created, do you believe GBI should attempt to consolidate with STARApollo? What possible positives/negatives would be associated with this merger?
Send this e-mail to the CEO through SAP Business Workplace by following the steps
below.
Journal of Business Cases and Applications Volume 23
The Evolving Global Enterprise, Page 10
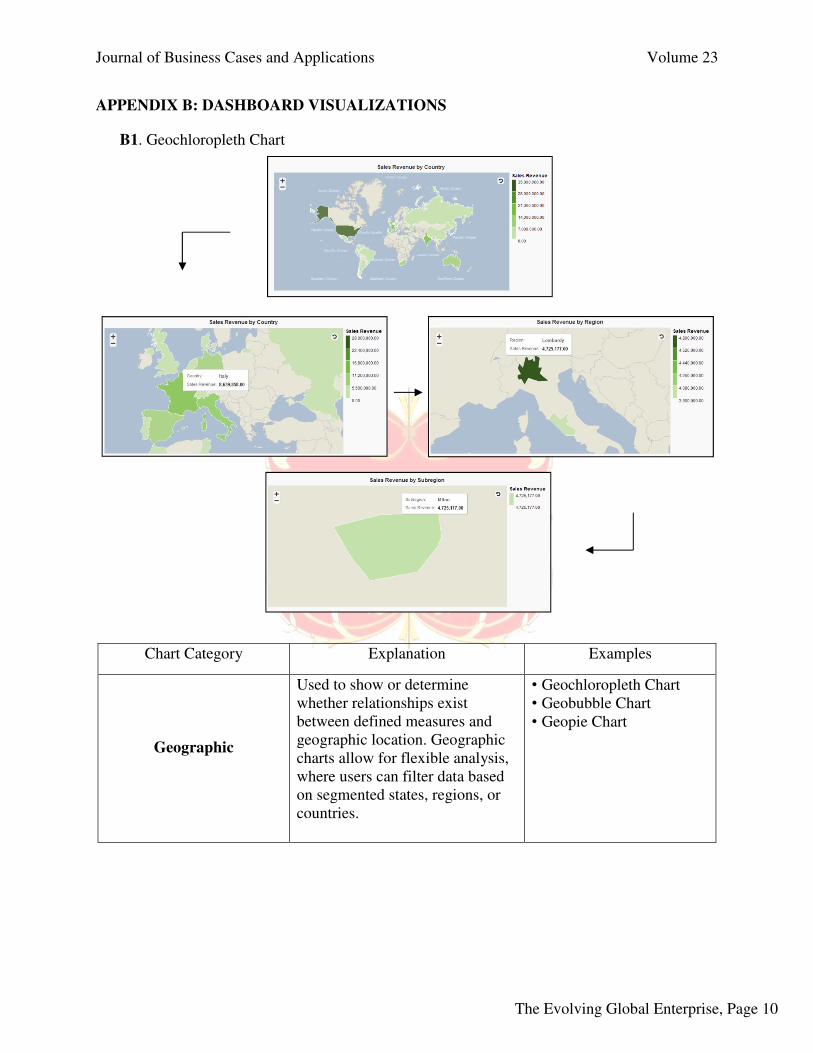
APPENDIX B: DASHBOARD VISUALIZATIONS
B1. Geochloropleth Chart
Chart Category Explanation Examples
Geographic
Used to show or determine
whether relationships exist
between defined measures and
geographic location. Geographic
charts allow for flexible analysis,
where users can filter data based
on segmented states, regions, or
countries.
• Geochloropleth Chart
• Geobubble Chart
• Geopie Chart
Journal of Business Cases and Applications Volume 23
The Evolving Global Enterprise, Page 11
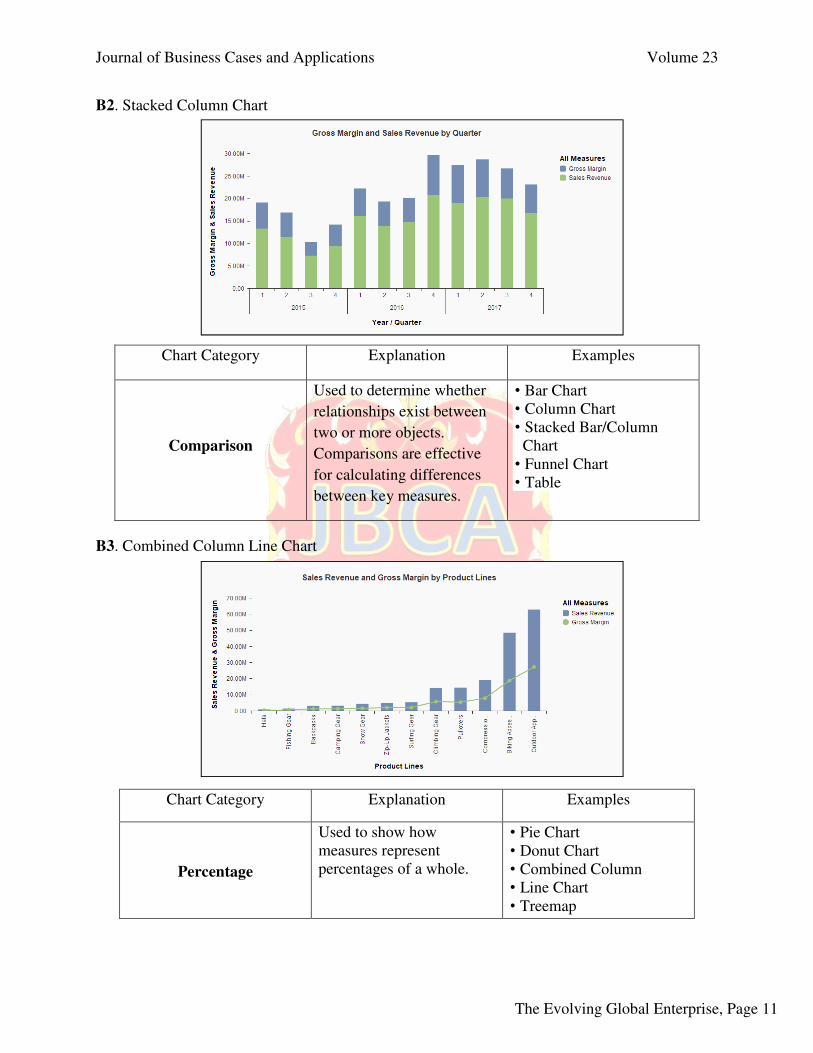
B2. Stacked Column Chart
B3. Combined Column Line Chart
Chart Category Explanation Examples
Comparison
Used to determine whether
relationships exist between
two or more objects.
Comparisons are effective
for calculating differences
between key measures.
• Bar Chart
• Column Chart
• Stacked Bar/Column
Chart
• Funnel Chart
• Table
Chart Category Explanation Examples
Percentage
Used to show how
measures represent
percentages of a whole.
• Pie Chart
• Donut Chart
• Combined Column
• Line Chart
• Treemap

Journal of Business Cases and Applications Volume 23
The Evolving Global Enterprise, Page 12
B4. Predictive Line Chart
B5. Tag Cloud
Chart Category Explanation Examples
Correlation
Used to determine whether
relationships exist among
variables. Correlation charts are
effective in showcasing multi-
dimensional relationships too.
• Scatter Plot
• Bubble Chart
• Box Plot Chart
• Tag Cloud Chart
Chart Category Explanation Examples
Trend
Used to identify whether a
trend exists in a dataset,
especially as it pertains to time-
dependent measures. Trend
charts are useful in making
predictions for the future.
• Line Chart
• Area Chart
• Waterfall Chart
• Heat map

Journal of Business Cases and Applications Volume 23
The Evolving Global Enterprise, Page 13
APPENDIX C: STUDENT-CREATED ANALYTICS DASHBOARD AND ANALYSIS
Mr. CEO,
Attached please find an analytics dashboard that assesses several financial indicators that
STARApollo would be a reasonable acquisition for GBI. Although the dashboard does not
account for all factors in a typical acquisition decision such as valuation models, it does provide
several key insights that further inform our decision. The dashboard in the attachment provides
only a few of various potential reasons why GBI’s acquisition of STARApollo would leverage
the synergetic relationship between the two businesses and create value.

Journal of Business Cases and Applications Volume 23
The Evolving Global Enterprise, Page 14
The first visualization in the dashboard is referred to as a Geochloropleth Chart, and this
interactive visualization shows the Sales Revenue figure per country that STARApollo currently
operates in. While the United States has the highest figure, the map itself shows that there are
established markets in Europe and Asia that are definitely subject to growth. Not only would
acquiring STARApollo give GBI access to the STARApollo retail locations and bicycle markets,
but it would help GBI establish both its presence and a supply chain in Europe.
In conjunction with the Geochloropleth Chat, the Predictive Line Chart reinforces the notion that
a STARApollo acquisition would be valuable. This is due to the fact that the visualization
depicts that Sales Revenue is forecasted to grow over the next two years. The forecast presented
on the dashboard was completed through using SAP Lumira’s triple exponential smoothing
prediction algorithm, which is accompanied by a regression line that shows the general upward
trend over the five-year span. The increased revenue outlook leads me to believe that the
acquisition of STARApollo will enable Global Bike Inc to increase its world-wide market share.
I view this scenario as a horizontal merger since both firms have operations in the biking market,
and because the synergy will increase efficiency.
The last visualization on the dashboard is the Combined Column Line Chart, which shows the
relationship between Gross Margin and Product Line for STARApollo’s operations. The Gross
Margin trend line shows that STARApollo is very profitable, with about a 50% profit margin on
each product line. The most important aspect of this visualization, though, is that STARApollo’s
most profitable product lines are Outdoor Apparel, Biking Accessories, and Compression Gear –
all of which are popular among cyclists because of the well-known brand identity of
STARApollo.
In my professional opinion, I believe that the acquisition of STARApollo is justifiable based on
the information that can be extracted from the visualizations of their financial data. The
acquisition will allow Global Bike Inc to establish its international presence, have control of a
subsidiary that produces good that complement GBI’s high-quality bicycles, and establish a
supply chain in Europe and Asia. I believe that the positives outweigh the negatives in this
merger, as the revenue and profitability of STARApollo alone will increase shareholder value for
GBI. The only negative associated with this merger is the fact that GBI may have to issue notes
payable and create a liability on the balance sheet in order to finance the acquisition.
Please let me know if you have any questions about the analytics dashboard.
Best Regards,
Student
Journal of Business Cases and Applications Volume 23
The Evolving Global Enterprise, Page 15
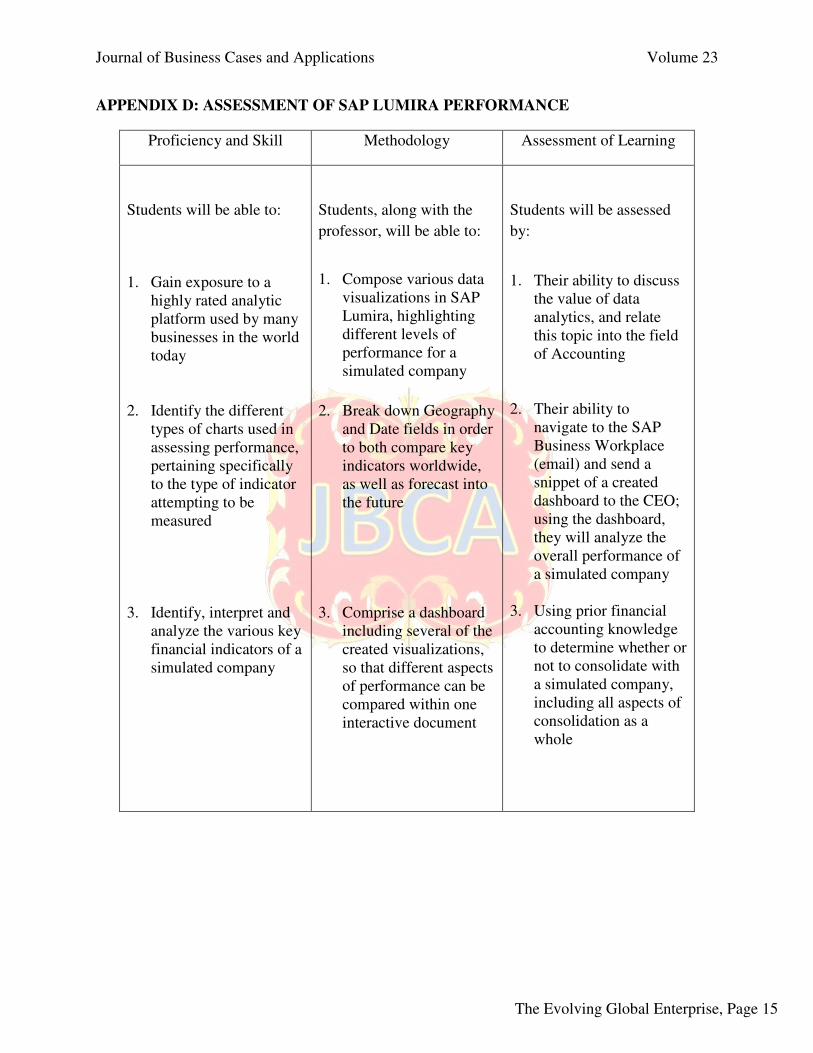
APPENDIX D: ASSESSMENT OF SAP LUMIRA PERFORMANCE
Proficiency and Skill Methodology Assessment of Learning
Students will be able to:
1. Gain exposure to a
highly rated analytic
platform used by many
businesses in the world
today
2. Identify the different
types of charts used in
assessing performance,
pertaining specifically
to the type of indicator
attempting to be
measured
3. Identify, interpret and
analyze the various key
financial indicators of a
simulated company
Students, along with the
professor, will be able to:
1. Compose various data
visualizations in SAP
Lumira, highlighting
different levels of
performance for a
simulated company
2. Break down Geography
and Date fields in order
to both compare key
indicators worldwide,
as well as forecast into
the future
3. Comprise a dashboard
including several of the
created visualizations,
so that different aspects
of performance can be
compared within one
interactive document
Students will be assessed
by:
1. Their ability to discuss
the value of data
analytics, and relate
this topic into the field
of Accounting
2. Their ability to
navigate to the SAP
Business Workplace
(email) and send a
snippet of a created
dashboard to the CEO;
using the dashboard,
they will analyze the
overall performance of
a simulated company
3. Using prior financial
accounting knowledge
to determine whether or
not to consolidate with
a simulated company,
including all aspects of
consolidation as a
whole