The Evolution of Surface Texture in Automotive Coatings
17
The Evolution of Surface Texture in Automotive Coatings Cindy A. Peters, Mark E. Nichols, Kevin R. J. Ellwood Ford Research and Advanced Engineering, USA Introduction The dazzling appearance of modern automotive paints stems from a complex interaction between the optical properties of the pigments and binders in the paint system and the psycho-physical processing of that information by the human eye and brain. Information to be processed includes the colors (hue, brightness, and saturation) as well as gloss, and surface texture. The surface texture that is often present in automotive coatings is commonly referred to as orange peel, as the undulations and bumps are similar to those seen on the skin of an orange. 1 This texture is most easily observed when viewing the reflection of a bright object, such as a clear daytime sky, on the surface of a vehicle. Orange peel is most easily seen on dark colors. Customers equate smooth finishes (low orange peel) with high quality paint. The surface texture in automotive paint systems can potentially arise from a variety of sources. If the substrate or previously applied paint layers display a discernable roughness, the roughness can map or telegraph through the paint layer and be reproduced on the top layer of the paint system. 2 This effect is most pronounced at lower film builds and is masked as the film build is increased. The ability of the coatings to "fill" defects is also critical to minimizing this effect. The evaporation of solvent (flash) and curing of automotive paints results in significant film shrinkage. The volume solids can range from approximately 10% for low solids basecoats to 70% for high solids clearcoats. Thus, defects that are hidden in the wet state may reappear as the film volume decreases during cure and the paint conforms to a previously hidden substrate texture. In paint systems, such as basecoat/clearcoat topcoat systems, multiple layers are co-cured in one oven. The differential cure rates of the coatings can lead to the layers shrinking at different times during the cure process and the generation of residual strains. Wrinkling and pinching can result from these issues. Finally, the spray atomization process used in automotive painting can also lead to surface texture. When droplets arrive at the vehicle surface, they coalesce together to form a continuous wet film. However even directly after spraying the film is not uniformly smooth and surface texture can be observed. This initial texture can be partially ascribed to a distribution in paint particle sizes hitting the vehicle. Additional effects due to spraying are the result of time-of-flight differences, which lead to viscosity and solids distributions on particles arriving at the surface. Electrostatic effects may also play a role in initial surface waviness. 3 In the case of both telegraphing and texture due to spray processing, the roughness of the wet paint system has the opportunity to level out before crosslinking. Leveling has been classically understood to be driven by surface tension effects in paint films. Orchard's original work demonstrated the effect of wavelength, film thickness, surface energy, and viscosity on the leveling of a wet film. 4 This work was later extended by Overdiep and others who elucidated the role of surface tension gradients during the drying of brush-applied coatings. 5,6,7,8 In this case it was shown that surface tension gradients arise due to the differential fraction of solvent that is lost in thin versus thicker sections of the wet film. As the solvent typically has a lower surface energy than the binder, the concentration gradients result in surface energy gradients that gives rise to a flow of material due to the creation of surface shear stresses. Both Orchard and Overdiep's original analyses rely on essentially Newtonian rheology of the coatings. However, for many coatings including automotive coatings, the liquid paints are highly shear thinning and can possess a pronounced low shear rate yield stress. At the typical leveling shear rates (10 -3 - 10 -2 sec - 1 ), this thixotropy can lead to significant deviations from the Newtonian behavior. In addition, the degree of deviation from Newtonian behavior is a strong function of solvent content during the solvent flash period. Because of the commercial importance of the problem, attempts have been made to develop more complex models to predict the leveling performance of coatings. Magnin and coworkers developed a leveling model that expressly took into account the shear thinning performance of the liquid coating. 7 However, it lacked a solvent loss term to account for changing composition and surface energy. Eley and coworkers have developed computer simulations to predict the leveling of architectural coatings in several
Transcript of The Evolution of Surface Texture in Automotive Coatings

The Evolution of Surface Texture in Automotive Coatings
Cindy A. Peters, Mark E. Nichols, Kevin R. J. Ellwood Ford Research and Advanced Engineering, USA
Introduction The dazzling appearance of modern automotive paints stems from a complex interaction between the optical properties of the pigments and binders in the paint system and the psycho-physical processing of that information by the human eye and brain. Information to be processed includes the colors (hue, brightness, and saturation) as well as gloss, and surface texture. The surface texture that is often present in automotive coatings is commonly referred to as orange peel, as the undulations and bumps are similar to those seen on the skin of an orange.1 This texture is most easily observed when viewing the reflection of a bright object, such as a clear daytime sky, on the surface of a vehicle. Orange peel is most easily seen on dark colors. Customers equate smooth finishes (low orange peel) with high quality paint. The surface texture in automotive paint systems can potentially arise from a variety of sources. If the substrate or previously applied paint layers display a discernable roughness, the roughness can map or telegraph through the paint layer and be reproduced on the top layer of the paint system.2 This effect is most pronounced at lower film builds and is masked as the film build is increased. The ability of the coatings to "fill" defects is also critical to minimizing this effect. The evaporation of solvent (flash) and curing of automotive paints results in significant film shrinkage. The volume solids can range from approximately 10% for low solids basecoats to 70% for high solids clearcoats. Thus, defects that are hidden in the wet state may reappear as the film volume decreases during cure and the paint conforms to a previously hidden substrate texture. In paint systems, such as basecoat/clearcoat topcoat systems, multiple layers are co-cured in one oven. The differential cure rates of the coatings can lead to the layers shrinking at different times during the cure process and the generation of residual strains. Wrinkling and pinching can result from these issues. Finally, the spray atomization process used in automotive painting can also lead to surface texture. When droplets arrive at the vehicle surface, they coalesce together to form a continuous wet film. However even directly after spraying the film is not uniformly smooth and surface texture can be observed. This initial texture can be partially ascribed to a distribution in paint particle sizes hitting the vehicle. Additional effects due to spraying are the result of time-of-flight differences, which lead to viscosity and solids distributions on particles arriving at the surface. Electrostatic effects may also play a role in initial surface waviness.3 In the case of both telegraphing and texture due to spray processing, the roughness of the wet paint system has the opportunity to level out before crosslinking. Leveling has been classically understood to be driven by surface tension effects in paint films. Orchard's original work demonstrated the effect of wavelength, film thickness, surface energy, and viscosity on the leveling of a wet film.4 This work was later extended by Overdiep and others who elucidated the role of surface tension gradients during the drying of brush-applied coatings.5,6,7,8 In this case it was shown that surface tension gradients arise due to the differential fraction of solvent that is lost in thin versus thicker sections of the wet film. As the solvent typically has a lower surface energy than the binder, the concentration gradients result in surface energy gradients that gives rise to a flow of material due to the creation of surface shear stresses. Both Orchard and Overdiep's original analyses rely on essentially Newtonian rheology of the coatings. However, for many coatings including automotive coatings, the liquid paints are highly shear thinning and can possess a pronounced low shear rate yield stress. At the typical leveling shear rates (10-3 - 10-2 sec-
1), this thixotropy can lead to significant deviations from the Newtonian behavior. In addition, the degree of deviation from Newtonian behavior is a strong function of solvent content during the solvent flash period. Because of the commercial importance of the problem, attempts have been made to develop more complex models to predict the leveling performance of coatings. Magnin and coworkers developed a leveling model that expressly took into account the shear thinning performance of the liquid coating.7 However, it lacked a solvent loss term to account for changing composition and surface energy. Eley and coworkers have developed computer simulations to predict the leveling of architectural coatings in several

important geometries.9,10 Their work does not explicitly take into account temperature dependent viscosity, but in principle could be amended to do so. A more generalized approach would examine the effects of a shear rate/composition/extent of reaction dependent viscosity and allow for the computation of leveling profiles from arbitrary geometric defects. Advances in instrumentation now allow for a renewed examination of the source of texture in automotive coatings and the mechanisms by which the coatings level. First, the ability to quantify the rheological behavior of coatings during an ambient flash and elevated temperature cure has been advanced by the work of Bhattacharya and coworkers.11 Using a T-bar apparatus the viscosity of a drying automotive refinish coating has been measured and the effects of various rheology control additives evaluated. Their technique allows for the evaporation of the solvent from the free surface instead of the traditional method of measuring viscosity in a closed system with no free surface. Recently, this work has been extended to coatings that cure at elevated temperatures as well.12 Second, a new generation of non-contacting, optical profilometers has been developed that allow the surface roughness of coatings to be quantified during solvent flashing and thermal curing. This allows for a generalization of Overdiep's original work where specific defects were followed optically over time, and over Eley's method of looking at larger scale drips or sags due to geometric discontinuities. Finally, a commercial instrument, the Byk-Wavescan (Byk-Gardner Industries), is now available, which measures and classifies surface roughness into five wavelength bins from 0.1 mm to 30 mm.13 This allows for the correlation between surface texture measured on wet films to be correlated with that measured on cured paint samples. In this paper we report on the leveling behavior of automotive clearcoats, where the constantly evolving composition after application leads to complex time dependent rheological behavior which is difficult to access experimentally. In addition, a general formulation of the leveling problem is solved computationally and the results of that solution are used to define the actual viscosity evolution during the leveling process. The extension of these results to real-world processes is also discussed. Experimental Methods Materials Clearcoat A 1K carbamate functional acrylic-melamine clearcoat containing 62% solids (non-volatile material). It was catalyzed with various amounts of dodecylbenzene sulfonic acid (DDBSA). Clearcoat B is a 1K acrylic-melamine-silane clearcoat with a solids content of 62.5%. To retard cure, 1.5% of triethanolamine (Sigma Aldrich) was added to clearcoat B in some formulations. This addition effectively prevents cure from initiating even at high temperatures. Rheology Measurements Clearcoat rheology was measured using a TA Instruments Advanced Rheometric Expansion System (ARES) Rheometer with custom fixtures. The unique fixtures (Figure 1) consisted of a lower plate with a .2 mm deep trough machined into the bottom to allow approximately 0.2 ml of liquid to be held on the lower fixture.
Liquid Paint Film
Contact Area
Oscillation around axis
Solvent escape holes
Figure 1. Custom fixture used to measure the viscosity of wet coatings. Holes enable entrapped solvent to escape during solvent flash and cure portions of experiments.
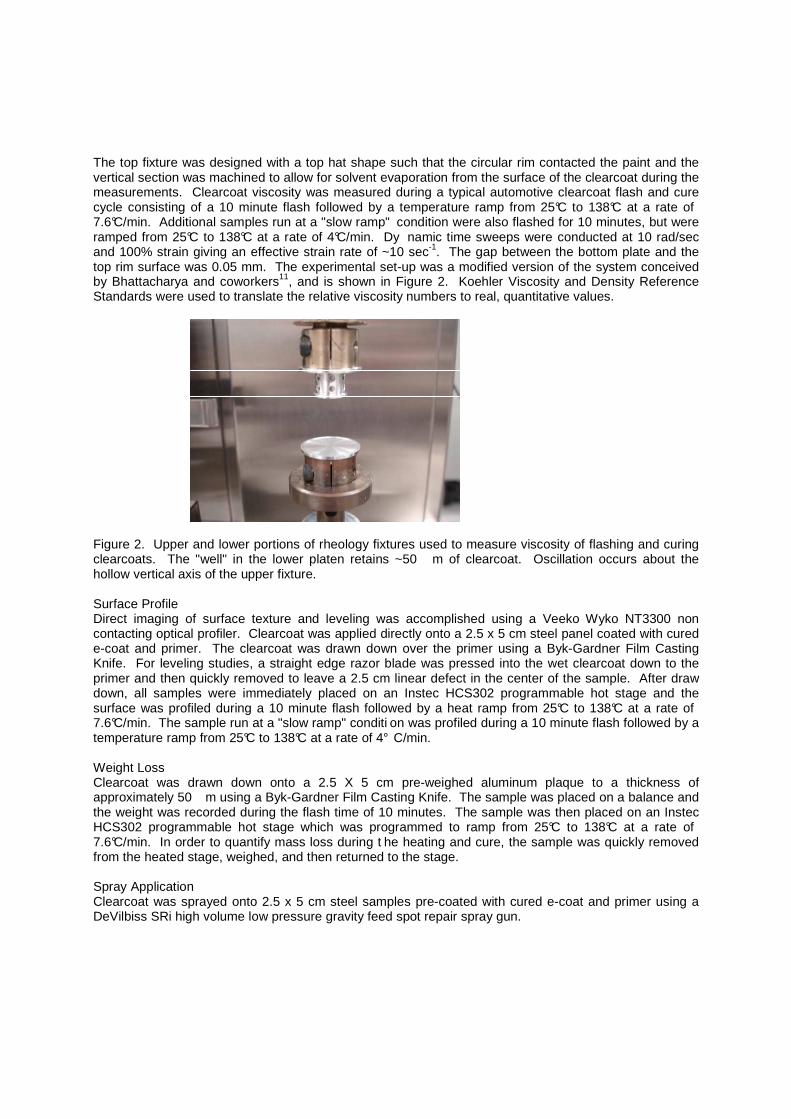
The top fixture was designed with a top hat shape such that the circular rim contacted the paint and the vertical section was machined to allow for solvent evaporation from the surface of the clearcoat during the measurements. Clearcoat viscosity was measured during a typical automotive clearcoat flash and cure cycle consisting of a 10 minute flash followed by a temperature ramp from 25°C to 138°C at a rate of 7.6°C/min. Additional samples run at a "slow ramp" condition were also flashed for 10 minutes, but were ramped from 25°C to 138°C at a rate of 4°C/min. Dy namic time sweeps were conducted at 10 rad/sec and 100% strain giving an effective strain rate of ~10 sec-1. The gap between the bottom plate and the top rim surface was 0.05 mm. The experimental set-up was a modified version of the system conceived by Bhattacharya and coworkers11, and is shown in Figure 2. Koehler Viscosity and Density Reference Standards were used to translate the relative viscosity numbers to real, quantitative values.
Figure 2. Upper and lower portions of rheology fixtures used to measure viscosity of flashing and curing clearcoats. The "well" in the lower platen retains ~50 �m of clearcoat. Oscillation occurs about the hollow vertical axis of the upper fixture. Surface Profile Direct imaging of surface texture and leveling was accomplished using a Veeko Wyko NT3300 non contacting optical profiler. Clearcoat was applied directly onto a 2.5 x 5 cm steel panel coated with cured e-coat and primer. The clearcoat was drawn down over the primer using a Byk-Gardner Film Casting Knife. For leveling studies, a straight edge razor blade was pressed into the wet clearcoat down to the primer and then quickly removed to leave a 2.5 cm linear defect in the center of the sample. After draw down, all samples were immediately placed on an Instec HCS302 programmable hot stage and the surface was profiled during a 10 minute flash followed by a heat ramp from 25°C to 138°C at a rate of 7.6°C/min. The sample run at a "slow ramp" conditi on was profiled during a 10 minute flash followed by a temperature ramp from 25°C to 138°C at a rate of 4° C/min.
Weight Loss Clearcoat was drawn down onto a 2.5 X 5 cm pre-weighed aluminum plaque to a thickness of approximately 50 �m using a Byk-Gardner Film Casting Knife. The sample was placed on a balance and the weight was recorded during the flash time of 10 minutes. The sample was then placed on an Instec HCS302 programmable hot stage which was programmed to ramp from 25°C to 138°C at a rate of 7.6°C/min. In order to quantify mass loss during t he heating and cure, the sample was quickly removed from the heated stage, weighed, and then returned to the stage. Spray Application Clearcoat was sprayed onto 2.5 x 5 cm steel samples pre-coated with cured e-coat and primer using a DeVilbiss SRi high volume low pressure gravity feed spot repair spray gun.

Leveling Model
Governing Equations
The coordinate system and problem definition for the leveling and spreading of a liquid on a substrate is shown in Figure 3.
Figure 3. Schematic of the spine based coordinate mapping implemented in the finite-element based leveling model.
The scales used for the length, velocity, and stress are oh , U, and oo hU /µ , where oh is the mean film
thickness, U is a velocity scale to be defined, and oµ is the zero-shear viscosity of the liquid. The
dimensionless variables that define the flow are,
tUhthhhphUp
hUU)h
oooo
ooo
)/()()/(
)/()((
=′=′=′=′=′=′
µµ ττuurr
(1)
where t is time, r is the position vector xi+yj, u is the velocity vector ui+vj, p is the fluid pressure, and h is the elevation of the free surface above the substrate. The fluid stress tensor, τ , is a symmetrical quantity and has the component form,

,jjjiijiiτ yyyxxyxx ττττ +++= (2)
where yxxy ττ = . All dimensional quantities are shown as primed variables.
Assuming that the flow is incompressible, the dimensionless forms of the equations that govern the flow are, ,0=⋅∇ u (3a) for mass conservation and, ( ) gt StRe eTuuu +⋅∇=∇⋅+ (3b)
for momentum conservation, where τ+−= IT p is the Cauchy stress tensor, ooUhRe µρ /= is the
Reynolds number, UghSt oo µρ /2= is the Stokes number, gge /=g is a unit vector in the direction of
gravitational acceleration, g, and ρ is the density. The free surface is located by demanding that the normal component of the fluid velocity, ,nu ⋅ be equal to the normal component of the interface velocity,
,nr ⋅& or,
( ) 0=⋅− nru & (3c) Here, n is a unit vector, normal to the free surface whose position vector is r.
To solve Equations 3a-3c, a closing equation must be provided that relates the stress, �, to the fluid deformation tensor, D, which is defined as,
( ) ( )[ ].21 TuuD +=
The relationship between ��and D, whatever it happens to be, produces the characteristic behavior of the fluid under study and is referred to as a constitutive equation.
The simplest possible constitutive equation is the Newtonian fluid model, which assumes the linear relation,
,2 Dτ µ= (5) where � is the constant fluid viscosity. An appropriate model to represent the shear-thinning behavior that is common to coatings is the Carreau viscosity function,14
( )[ ] ,1 2
12
−∗
∞
∞ +=−− n
Do
IIλµµµµ
(6)
where n is the power-law exponent and IID is the second invariant of the deformation tensor, D. The
constants oµ and ∞µ are the zero-shear and infinite-shear viscosities and ∗λ is a characteristic
relaxation time. This model computes the viscosity, µ , in Eq. 6 as a function of the local shear rate
represented by IID.

Boundary Conditions
The velocity vector, pressure, and stress tensor were determined by imposing boundary conditions at the fluid interfaces. Along solid surfaces, such as the substrate/fluid interface, it is no slip is typically imposed; thus,
.0,0 == vu (7a) However, to account for the high percentage of mass loss within the film in this analysis, a seepage velocity is applied at the substrate surface, which has the form,
.)(
dt
tdXhv o= (7a)
Here, X(t) is the measured mass fraction of the coating and ho is the initial film thickness. The viscosity of air is small compared to the viscosity of the film; therefore shearing at the interface between the air and liquid is negligible. A force balance at the liquid/air interface results in a balance between the normal traction of stress and the force exerted by the interfacial tension. Taking the reference pressure to be that of the air surrounding the fluid, the dimensionless traction condition at the free-surface can be expressed as,
[ ] ( ) ,1
nnnτI ⋅∇=⋅+− sCap (8)
where Ca is the Capillary Number, n⋅∇s is the mean curvature of the free surface, and s∇ is the
surface divergence operator. In two dimensions the mean curvature has the form
,1 2
x
xxs h
h
+=⋅∇ n (9)
The capillary number is defined as σµ /UCa o= , where � is the surface tension at a phase
boundary such as the liquid/air interface. The physical significance of the capillary number is that it gives a measure of the ratio of the viscous force of a fluid, ooUhµ , to the capillary force, �ho.
The final boundary conditions are those at the ends of the computational domain. The actual film on the substrate is part of a large continuous film. Here, the interest is primarily in the actual flow characteristics in a small portion of the actual flow domain, thus the computational domain is truncated. Therefore, planes along which there is no mass penetration,
,0=⋅nu (10) and zero shear stress, ,0=⋅ nT (11) are placed across the film at locations far from the region of interest.
At this point, the scale for velocity, U, is still unknown and must be defined to proceed. Typically in
such problems, a velocity scale is derived from a linearized form of the governing equations.15 However, the geometrically complex domain under consideration prevents this. An alternative approach is to derive a velocity scale from the dimensionless groups available. Noting that the flow is predominately controlled by surface tension, �, the appropriate choice for the group to determine a velocity scale is the Capillary Number, Ca. This choice results in the velocity scale being defined as follows,

,o
Uµσ= (12)
yielding the following scaling quantities,
ththhhphp
h)h
oooo
ooo
)/()()/(
)/()/((
σµσσµσ
=′=′=′=′=′=′ ττuurr
(13)
The final forms of the significant dimensionless groups are 2/ ooghRe µρ= for the Reynolds number and
σρ /2oghSt = for the Stokes number.
Finite-Element Formulation
The flow domain is tessellated using rectangular Lagrangian elements. The fluid velocities, pressures,
and elevations of the free surface along the spines are represented by biquadratic, ),,( ηξφ i quadratic,
),1,( =ηξφ i and bilinear, ),,( ηξψ i basic functions,
∑∑∑ ===l
ii
m
ii
n
ii hhpp
111
,,, φψφ uu (14)
respectively, with �, and � being local isoparametric coordinates. The major difficulty that arises in computing free surface problems in arbitrary domains is providing a
finite-element mesh that adapts to changes in the unknown free-surface location. The method adopted in this simulation was the technique of free-surface-parameterization developed by Kistler and Scriven.16 In this method, the elevations of the computational nodes are taken to be fractions, fj, of the total elevations,
hi, measured from base points, xi,b, in the direction of the ith spine, ei. Essentially, a logically-rectangular, two-dimensional coordinate system is generated through the following relation,
.iijibij hf exx += (15)
The part geometry appears in the computational domain as a series of Fehler! pairs given in the base vector, xi,b.
The unknowns quantities in Eqs. 14 and 15 are determined by demanding that the residual equations
are orthogonal to the basis functions �i and �i; this is referred to as the Galerkin/finite-element method. The final Galerkin residuals, R, to be solved are represented by,
∫ =⋅∇=−v
kkp dvR ,0uψ (16a)
( )[ ]∫ ∫∫ =⋅−⋅∇+−∇⋅+=−v
s
s
k
v
kgt
kk dsnTdvTdvSteuuuR ,0Re43421
Integral Surface
u φφφ (16b)
and
( ) ( )[ ]∫ =⋅−==−s
kkh dsR .01, nru &ηξφ (16c)
The divergence theorem has been applied in formulating Equation 16b to incorporate natural boundary conditions.
After applying Finite-Element discretization to spatial dimensions, the governing equations reduce to a set of ordinary differential equations representing the motion of the liquid and its free interface,

( )pdt
d,Ug
UM =⋅ (17)
where M is a mass matrix and U is a vector of unknowns containing (u, p, h). A difficulty that arises in fluid mechanics is the absence of time derivatives of pressure, which renders M singular; thus, standard explicit time integration is not possible. In this study, a completely implicit time marching scheme is employed yielding the following nonlinear algebraic equation,
( ) ( )[ ].1211
++=
∆−⋅
+nn
nn
UgUgt
UUM (18)
Equation 18 is then solved by Newton-Raphson iteration using a direct solver. Experimental Results The dynamic viscosity as a function of time for four different clearcoat formulations is shown in Figure 4.
1
10
100
1000
10000
0 5 10 15 20 25 30 35
Time (min)
Vis
cosi
ty (m
Pa-
s) Clearcoat B
Clearcoat B + TEA
Clearcoat A 1% DDBSAClearcoat A 3% DDBSA
Flash Heat
Figure 4. Viscosity of four clearcoats at a shear rate of 10 sec-1 as a function of flash and cure time. Ambient flash occurred through ten minutes, at which point a ramped heating occurred. The data is divided into two regions, with the left hand side corresponding to the ambient flash period and the right hand side corresponding to the heated ramp. This thermal history approximated the thermal history of a clearcoat during the flash and bake cycle in an automotive assembly plant. For all four coatings, the viscosity rose during the flash period due to the loss of solvent. Upon the initiation of heating, the viscosity dropped rapidly due to its strong temperature dependence. When curing initiated, the viscosity rose extremely rapidly for three of the coatings. The width of the viscosity minimum was strongly dependent on the catalyst level in the clearcoat. With a high catalyst level (3% of DDBSA) the viscosity rise in clearcoat A occurred after 6 minutes of heating. With a low catalyst level (1% of DDBSA)

the viscosity rise occurred after 9 minutes of heating. For clearcoat B the viscosity rise occurred after 13 minutes. The viscosity rise was eliminated by the addition of 1.5% triethanolamine to clearcoat B. Thus, the effect of very long times spent at very low viscosities on the leveling behavior could be evaluated. During the flash period, the loss of solvent led to significant film shrinkage. The mass loss of a flat panel coated with the clearcoat B is shown in Figure 5, where the data has been normalized to the initial mass of the clearcoat. Again the data is divided into the ambient flash and ramped heating regions.
0
0.2
0.4
0.6
0.8
1
1.2
0 5 10 15 20 25 30 35 40 45 50
Time (minutes)
Fra
ctio
n o
f S
olv
ent
Rem
ain
ing
Flash Heat Cool
Figure 5. Mass loss of clearcoat B as a function of flash, heating, and cooling time. Approximately 40% of the coating mass volatilized during the flash and cure, in agreement with the known percent solids for this clearcoat. Little additional mass loss was measured during the curing process. Assuming the density of the binder is approximately equal to the density of the solvent blend, the thickness of the clearcoat as a function of time can be calculated, and is shown in Figure 6.

0
10
20
30
40
50
60
0 5 10 15 20 25
Time (minutes)
Th
ickn
ess
( µµ µµm
)
Flash Heat
Figure 6. Thickness of clearcoat B as a function of time during flash and curing. Thickness loss is calculated to be exclusively due to solvent loss. To quantify the degree of leveling that occurred during flashing and curing, a linear defect was placed into a 50 �m thick liquid film of clearcoat B after it was drawn down onto a primed substrate. The clearcoat was then flashed for ten minutes and cured by heating on the hot stage. The surface profile of the clearcoat is shown in Figure 7, initially and at various stages during the flashing and curing cycle.
a, 1 min. flash 25°C) b, 10 min. flash at 25°C
c, 80°C) d, 128°C)
Figure 7. Leveling of linear defect in clearcoat B. a) after one minute ambient flash, b) after 10 minute ambient flash, c) after heating to 80°C, and d) aft er heating to 128°C.

Similar experiments were repeated for a 25 �m thick clearcoat B film, clearcoat B containing triethanolamine to retard cure, and clearcoat B heated at a slower heating rate. Leveling was observed for all the coating/processing conditions, with the majority of the leveling occurring in the initial stages of flashing. Little leveling occurred after heating was initiated. From the surface profiles, the peak to valley height was measured for each coating during the flashing and curing period. The ratio of the peak to valley height, a, to the initial peak to valley height, ao, is shown in Figure 8 for all four formulations/processes. The rate of leveling is greatest immediately after insertion of the defect. Comparing the rate of leveling between formulations/processes in Figure 8 is difficult due to the rate of leveling being a strong function of coating thickness, defect height, and defect wavelength.
0
0.1
0.2
0.3
0.4
0.5
0.6
0.7
0.8
0.9
1
0 5 10 15 20 25 30 35
Time (minutes)
a/ao
50 microns25 microns50 microns slow ramp50 microns + TEA
Flash Heating
Figure 8. Leveling of clearcoat B under different conditions. a/ao is peak to valley height over initial peak to valley height. Flash occurred during the first ten minutes of the experiment. Heating rate was 7.6°C/min for all runs except the slow ramp run whe re the heating rate was 4°C/min. Triethanolamine (TEA) was added to one formulation to retard cure. Note that the wavelength of the defect on each sample was different such that leveling rates between samples cannot be readily compared to each other. To extend the leveling experiments to processes of technological importance, clearcoat A was sprayed onto to a primed substrate by an HVLP spray gun. When the coating was spray applied, the initial surface texture was highly variable. The primed surface of the substrate before clearcoat application is shown in Figure 9a.

a, primed substrate b, 10 min. flash 25°C)
c, 138°C) d, cooled to 25°C)
Figure 9. Surface profiles of clearcoat A applied to a primed steel substrate by an HVLP spray gun. a) primed surface before clearcoat application, b) initial profile after 10 minutes ambient flash, c) after heating to 138°C, d) after curing and cooling to 25 °C. Figures 9b – 9d show the clearcoat surface at various times during the flash and cure process, and show how the surface texture evolved during curing. The size scale of the initial texture existed mainly in the range of 1-2 mm. In particular, lower wavelength (~0.2mm) texture began to appear when curing initiated at 120 – 135°C. The amplitude of the tex ture increased as the coating cooled to room temperature. This texture was superimposed upon the longer wavelength texture that was present due the initial spray application. The initial roughness showed incomplete leveling throughout the curing process, even though the coating went through a substantial viscosity minimum during the heating process. The maximum peak to valley height for the longer wavelength texture was approximately 3.14 �m in the wet state and 1.84 �m in the cured state (Figure 10).

0
100
200
300
400
500
600
700
0 10 20 30 40 50 60
Time (minutes)
Ra
(nm
)
0
0.5
1
1.5
2
2.5
3
3.5
Rt
( µµ µµm
)
RaRt
Flash Heating Isothermal Cure Cool
Figure 10. Surface roughness (Ra and Rt) of clearcoat A applied to primed steel panel during flash, heating, curing, and cooling profile. Modeling Results A significant problem in computing disturbance decay rates using direct nonlinear free surface codes is the temporal viscosity profile �(t). This difficulty exists because the entire leveling process occurs at very low shear rate, on the order of 0.001 s-1, which is difficult to measure even when the fluid system is compositionally constant with time. Orchard's approach allows one to compute the decay rate of a sinusoidal disturbance on a film where the disturbance wavelength (�) is large compared to the initial film depth, (ho).
4,8 Thus, the change in height of a disturbance can be computed over time by using
a
a0
= exp −ΨCγλ4 +
ρgcosα4πλ2
(19)
Where � is the film density, g is the gravitational constant, � is the angle of inclination to the horizontal, � is the defect wavelength, � is the surface energy, and C is a constant equal to 16�4/3. The film flow, �, is a function of the viscosity and film thickness, which is taken to be a linear function of the solvent content and is calculated from
dtt
tht
∫=Ψ0
3
)(
)(
µ (20)
where h is the film thickness and � is the viscosity as a function of the time t. By inverting Eq. 19 we can use experimentally derived amplitude decay data and directly compute the Orchard Flow Function �(t).

At this point, �(t) can be differentiated to obtain the required viscosity estimate and this was accomplished by fitting a polynomial to the computed flow function. The results of such an operation are shown in Figure 11 for clearcoat A under four different formulations/processes. As compared to Figure 4, the viscosity drop is significantly damped as the shear rate approaches zero. In addition, the flattening of the viscosity curve for the clearcoat containing triethanolamine is correctly reproduced.
0.1
1.0
10.0
100.0
1000.0
0.0 5.0 10.0 15.0 20.0 25.0 30.0 35.0
50 µm slow ramp
50 µm + TEA
25 µm
50 µm
Vis
cosi
ty (
Pa
S)
Time (min)
Figure 11. Using the computed viscosity profiles, the defect decay can be computed for each of the defects placed in clearcoat B and compared to the experimentally measured leveling, which is shown in Figure 12 for clearcoat A cured using the slower ramp.
0.5
0.6
0.7
0.8
0.9
1.0
1.1
0.0 5.0 10.0 15.0 20.0 25.0
a/a 0
Time (min)
Simulation
Measured
Figure 12. Leveling of a linear defect in a 50 mm film of clearcoat A cured using a slow heating ramp (4°C/min). The total height of the defect, a, is scaled to the initial height of the defect, ao.

Discussion The complex rheological behavior of the clearcoats prevents a simple analysis of their leveling behavior. We have measured the viscosity explicitly as a function of time for all of the clearcoats at a shear rate of approximately 10 sec-1 (Figure 4). This type of curve was postulated by Bauer for high solids coatings and has been known to be qualitatively true.17 However, leveling occurs at shear rates on the order of 10-
3 sec-1. These shear rates are experimentally inaccessible due to the time required to collect data at low shear rates, and are particularly negated for conditions where the composition is continually changing due to solvent loss and the temperature is changing due to thermal curing. Thus, while the shape of the curves shown in Figure 3 are correct, the absolute magnitude must be substantially different, as leveling would occur almost instantaneously for coatings with the viscosity profiles measured. Because measuring the viscosity at the appropriate shear rate while maintaining the correct composition is experimentally inaccessible, we choose to derive the required viscosity by fitting the leveling profile. This process allows us to calculate the very low shear rate viscosity during various stages of the flash and curing profile and compare those results to the measured viscosity at higher shear rates. The results of such a computation, shown in Figure 11. The absolute values of the viscosity computed during leveling are approximately an order of magnitude greater than those measured at the higher shear rate. The viscosity rise during the flash period scales with the viscosity rise measured experimentally, while the viscosity minimum observed experimentally is much greater than that computed. As expected, the clearcoat with lower solvent content is significantly more non-Newtonian than the clearcoat immediately after application. Thus, little flow occurs during the initial heating of the clearcoat because the low shear rate viscosity drops much less than the viscosity measured at higher shear rates. The rate of leveling shown in Figure 12 is slightly larger than that observed experimentally. The final amount of leveling is within 20% of the measured value. This discrepancy is potentially due to the physics implemented in the leveling model where the film shrinkage is modeled using a seepage velocity (Eq. 7b). Shrinkage actually occurs due to mass transfer at the coating-air interface, where not only mass is lost, but the phase change results in a momentum transfer which is unaccounted for in the current model. Additionally, the calculation of the viscosity implicitly assumes a sinusoidal disturbance of infinitely small amplitude. The defects introduced experimentally and implemented in the finite-element model are solitary disturbances which introduces spreading effects not accounted for in Eq. 19. In addition, there could be non-linear effects due to inertia which are also unaccounted for in Eq. 19. These results allow for two important extensions of this work. First, experimentally measuring the leveling behavior allows one to subsequently compute the actual viscosity of the coating at the appropriate shear rate. Thus, the leveling experiment becomes a means to measure viscosity at very low shear rates. This is particularly important for compositionally transient coatings such as high solids automotive coatings where solvent is released and crosslinking initiates as time progresses. Once the viscosity behavior at the appropriate shear level is computed, the leveling behavior of any arbitrary surface disturbance can then be simulated. For example, in Figure 13 the leveling of a 3.25 �m high sinusoidal defect is shown.

14.0
16.0
18.0
20.0
22.0
24.0
26.0
0.0 0.5 1.0 1.5 2.0 2.5 3.0 3.5 4.0
Coa
ting
Hei
ght (
µm)
X (mm)
0.0 min
8.2 min
15.3 min
23.5 min
Figure 13. The simulated leveling profile of a linear defect (one half shown) as a function of time. Initial height of the defect is 3.25 �m. Viscosity profile used for the simulation is equivalent to that of clearcoat B under the slow ramp conditions. However, the leveling of two dimensional defects, such as the defects formed by spray deposition (Figure 9), could be modeled. This has important implications for improving the appearance of paint systems as the balance between leveling and sag resistance requires that the low shear rate viscosity be sufficiently low to allow some leveling during heating, but not too low to induce sags. As the critical viscosity information was not previously available, optimization of the two competing factors could only be performed via the experience and skill of a formulator. A complicating factor for looking at coatings applied via spray atomization is the growth of secondary texture not associated with leveling. For example, in Figure 9 where a second wavelength of texture evolves during curing. This roughness is approximately one order of magnitude larger than the wavelength of the roughness in the primed substrate (Fig. 9a). This smaller wavelength texture does not appear in coatings applied to smooth substrates such as glass or NaCl discs. Thus, its origin must lie in the initial roughness of the substrate, whose wavelength must be expanded and magnified by the coating. Because it only appears as crosslinking initiates, it is likely partially due to the shrinkage of the film that crosslinking produces. Additional shrinkage occurs as the film cools and is able to support a stress below Tg (~80°C).18 Thermal shrinkage and perhaps thermal expansion mismatch may contribute to the growth of this roughness, which is of a size scale that would map to the Wa range in a Wavescan measurement. We note that the growth of this roughness is completely separate from any leveling related phenomena, as the viscosity of the coating at this point is orders of magnitude too high for significant wet film flow. Thus, the reversal of leveling that can occur in surface tension gradient driven leveling cannot be the source of this phenomena. The contribution this texture makes to the surface roughness data (Fig 10) has not yet been calculated.

Conclusions The viscosity profile of a number of automotive clearcoats has been measured during their solvent flash and thermal cure cycle. All of the clearcoats underwent a rise in viscosity as the solvent evaporated from the coating and a subsequent drop in viscosity during the initial stages of thermal curing. The leveling of linear defects introduced into the wet clearcoat was quantified throughout the flash and cure process. Leveling was seen to primarily occur during the initial stages of the solvent flashing. Because the leveling of the clearcoats takes place at extremely low and experimentally inaccessible rates, the viscosity versus time profiles were calculated from the leveling profiles through the use of a finite-element method. The calculated viscosity profiles were similar in shape to the viscosity profiles directly measured at higher shear rates, but were shifted to much higher absolute values. The deviation from Newtonian behavior increased as the solvent content decreased. Through the use of the calculated viscosity profiles, the leveling of arbitrarily shaped defects can be simulated which allows for an examination of the leveling of more complex surface texture, such as that produced by spray atomization. Future work will extend this research to include mass transfer at the coating-air interface, a more complete 2-D analysis that incorporates possible Marangoni effects, and the creation of more precise defects in the wet film. Acknowledgements The authors would like to thank Mr. Bhaskara Boddakayala for assistance with some of the surface texture measurements, Dr. Michael Koerner (DuPont Performance Coatings) for fruitful discussions, and Dr. Deepanjan Bhattacharya (Eastman Chemical Company) for introduction to the novel rheological measurement technique. References 1 Organic Coatings: Science and Technology, 2nd ed., Z. Wicks, F. Jones, and S. Papas, Wiley-Interscience, New York, 1999. 2 D. Cheever and P. Ngo, J. Coat. Tech., 61, 65, 1989. 3 K. Tachi, C. Okuda, and K. Yamada, J. Coat. Tech., 62, 19, 1990. 4 S. Orchard, Appl. Sci. Res., A11, 451, 1962. 5 W. Overdiep, Prog. Org. Coat., 14, 159, 1986. 6 S. Wilson, Surf. Coat. Int., 4, 162, 1997. 7 O. Cohu and A. Magnin, Prog. Org. Coat., 28, 89, 1996. 8 M. Bosma, R. Brinkhuis, J. Coopmans, and B. Reuvers, Prog. Org. Coat., 55, 97, 2006. 9 R. Eley, J. Coat. Tech., 74, 42, 2002. 10 D. Weidner, L. Schwartz, and R. Eley, J. Coll. and Interf. Sci., 179, 66, 1996. 11 D. Bhattacharya, K. Seo, L. Germinario, M. Clark, K. McCreight, and C. Williams, J. Coat Tech. Res., 4, 139, 2007. 12 M. Nichols, K. Ellwood, and C. Peters, PMSE Prepints, 99, 187, 2008. 13 J. Mori, H. Kubota, T. Shigenaga, T. Yamane, T. Kanda, T. Ohzeki, A. Ikeda, and T. Tsuneoka, Rev. Auto. Engin., 29, 97, 2008. 14 R.B. Bird, R.C. Armstrong, and O. Hassager. Dynamics of Polymeric Liquids: Fluid Mechanics. John Wiley and Sons, New York, 1987. 15 K.R.J. Ellwood. The Mechanics and Stability of Liquid Jets and Films. PhD thesis, The University of Michigan, 1991. 16 S.F. Kistler and L.E. Scriven. Coating flow theory by finite-element and asymptotic analysis of the
Navier-Stokes system. Int. J. Num. Meth. Fluids, 4:207, 1984. 17 D. Bauer and L. Briggs, J. Coat. Tech., 56, 87, 1984. 18 S. Basu, L. Francis, A. McCormick, A. and L. Scriven, PMSE Preprint, 97, 146, 2007.