The Evolution of HIV Biology and natural history of the virus.
29
The Evolution of HIV Biology and natural history of the virus
-
Upload
sharlene-davidson -
Category
Documents
-
view
222 -
download
2
Transcript of The Evolution of HIV Biology and natural history of the virus.

The Evolution of HIV
Biology and natural history of the virus

Fig. 1.1 Global incidence of HIV/AIDS. Number of cases and per cent of adults infected, ages 15-45. Data from UNAIDS (2005).
3/5th’s of HIV+ cases in Africa
1/5th in South and SE Asia

Three global epidemics

Recent epidemic in Russia and Ukraine

The epidemic in Africa
Botswana
Zimbabwe
Lesotho
Swaziland
From UNAIDS (2006)

In sub-Saharan Africa
Life expectancy at birth in Botswana

Fig. 1.5 The life cycle of HIV
Extracellular stage: transmission
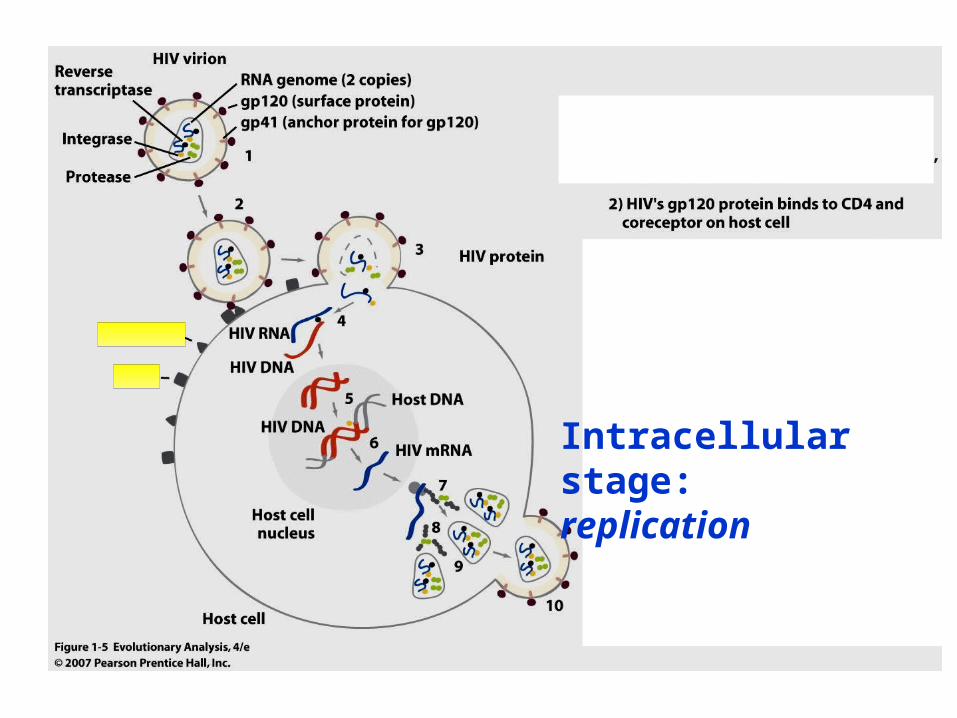
Intracellular stage: replication

• CD4 protein is found on T cells, HIV “uses” CD4 to invade them
• CD4 serves important functions in the immune system

• e.g. CD4 aids in binding of macrophages to helper T (TH) cells
– stabilizes antigen “presentation” to TH cell
– TH cells play a central role in both pathways of immunity


HIV: a retrovirus—DNA is reverse-transcribed from viral RNA by reverse transcriptase
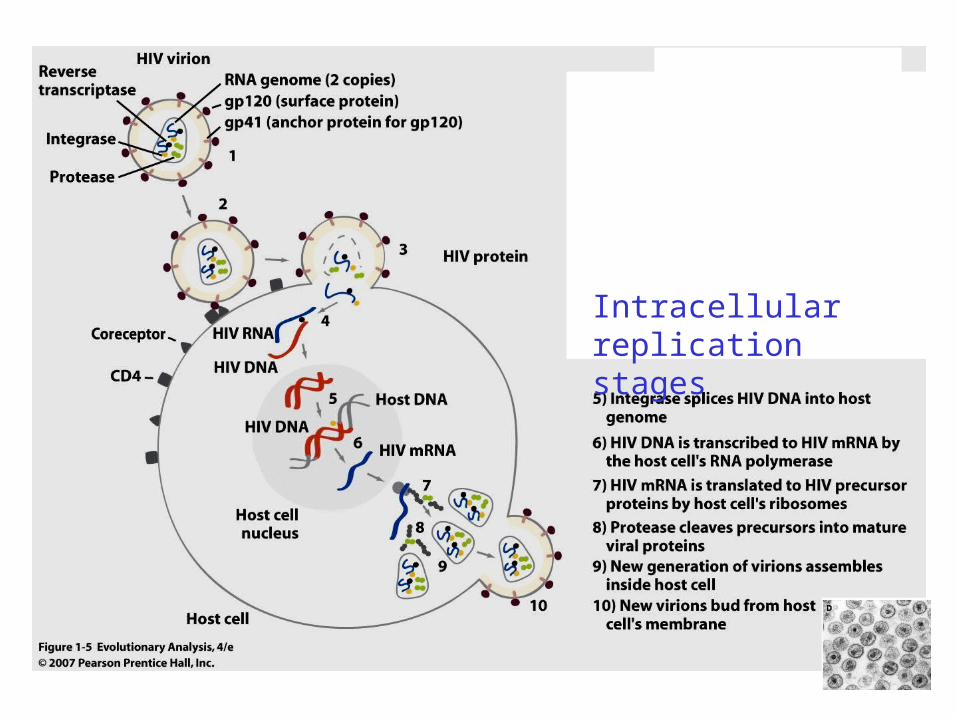
Intracellular replication stages

How does HIV cause AIDS?
• Simple answer: depletion of T cells killed by HIV replicating within them suppresses immunity, leading to opportunistic infections
• Complete answer:
– complex: immune activation hastens collapse by providing host cells
– close phylogenetic relative, SIV, provides useful model for studying this
TEM of HIV budding (arrow) from a T lymphocyte (image: R. Hunt, Univ. S. Carolina)
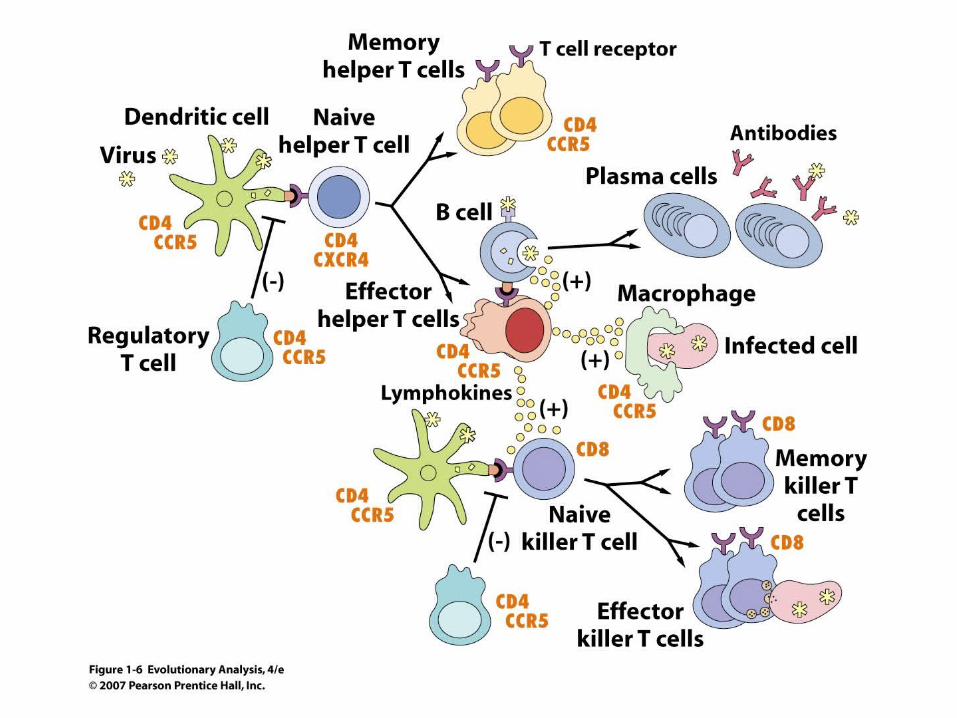

Fig. 1.8a Viral load in an untreated patient
• rapid increase, followed by drop, steady recovery (reflects immune response)
• evolution within patient of declining target cell selectivity

Fig. 1.8b T cell depletion
• decline, recovery, collapse of T cell population
• drastic decline in gut (vulnerable to pathogen attack)
• slow disease onset
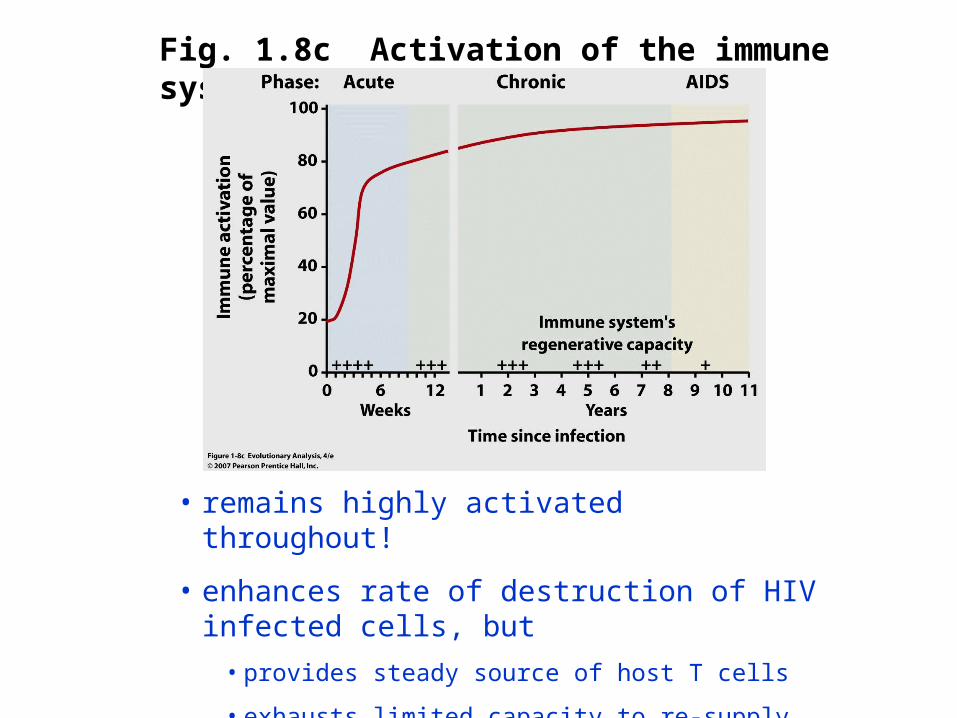
Fig. 1.8c Activation of the immune system
• remains highly activated throughout!
• enhances rate of destruction of HIV infected cells, but
• provides steady source of host T cells
• exhausts limited capacity to re-supply killed T cells

The evolution of HIV
Why do AZT and other antiviral drugs fail over the long term?

Fig. 1.9 How AZT blocks DNA synthesis by HIV reverse transcriptase
RT mistakes azido-thymidine (AZT) for the normal nucleoside (T)

Fig. 1.9 How AZT blocks DNA synthesis by the reverse transcriptase of HIV
the azide group on AZT stops DNA synthesis and RT falls off

AZT treatments
• Initially, low doses dropped viral load, increased CD4 T cell counts
• Increasing doses, over time, lost effectiveness
• No evidence that patient’s enzymatic activation of AZT declined

Evolution of AZT resistance
• A change in the genetic composition of patient’s viral population?
• To test– Sample virus from patient over time as
AZT treatment progresses– Grow virus on cells in culture– Test inhibitory action of increasing
doses of AZT

Fig. 1.11 Evolution of AZT resistance within individual patients
from Larder et al. (1989)

HIV HIV populations populations can take only can take only 6 months to 6 months to evolve high evolve high AZT AZT resistanceresistance

Some random reverse transcriptase mutations will cause “shape changes” in the active site (arrow), allowing them to recognize and not pick up AZT

Space-filling model of reverse transcriptase [from Cohen (1993)]. The large groove is where RNA template and nucleotides bind.
Drug resistance mutations (in red: includes the AZTR mutations) are located within this groove
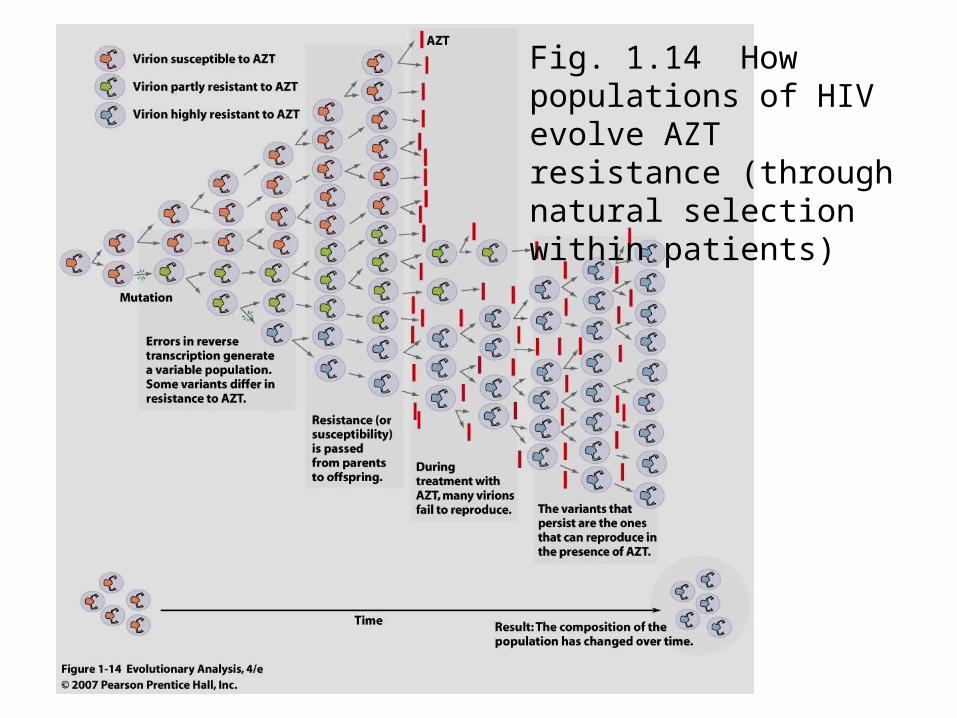
Fig. 1.14 How populations of HIV evolve AZT resistance (through natural selection within patients)
HIV mutation rates
• High replication rate: 10 million to 100 million new virions per day (Ho et al. 1995, Wei et al. 1995)
• High reverse transcriptase mutation rate (~1 mutation/genome/ replication)– polymerase is error prone– HIV lacks DNA repair