The Evolution of Casino Games, 1985-2016 - Center for...
21
University Libraries University of Nevada, Las Vegas 1 Las Vegas Strip Table Mix The Evolution of Casino Games, 1985-2017 An Examination of Shifting Unit and Revenue Trends Contents Executive Summary 1 Methodology, Definitions 2 Unit Share 3 Revenue Share 5 Raw Data 7 Executive Summary Over the past thirty one years, there has been a considerable realignment of aggregate table game mix on the Las Vegas Strip. • Twenty-One (blackjack) has declined in both terms of units and revenue. In 1985, 77% of casino games were blackjack. In 2017, just over 50% were. In 1985, the game accounted for over half of all table game revenues: in 2017, it accounted for 31% of table win. • Craps has declined remarkably as a money-maker for casinos. In 1985, it generated over 28% of all table win. In 2017, it contributed less than 10% to total table win. • Roulette has increased both its revenue share and unit share by about 50% • Baccarat has spectacularly increased its win share in the past several years, out earning blackjack since 2009. Its unit share has grown proportionately with its revenue gain, although it has contracted in recent years. • Other games, including mini-baccarat, three card poker, and pai gow poker, have increased both their revenue share and their unit share. These changes have impacted the ways that casinos operate, and should be taken into consideration by both students of casino management and those interested in monitoring casino financial performance over both the short and long terms. The increased reliance on baccarat, a more volatile game, has led to greater variance in reported field results for both individual properties and the Strip as a whole.
Transcript of The Evolution of Casino Games, 1985-2016 - Center for...
University Libraries University of Nevada, Las Vegas 1
Las Vegas Strip Table Mix
The Evolution of Casino Games, 1985-2017 An Examination of Shifting Unit and Revenue Trends
Contents
Executive Summary 1
Methodology, Definitions 2
Unit Share 3
Revenue Share 5
Raw Data 7
Executive Summary
Over the past thirty one years, there has been a considerable realignment of aggregate table game mix on the Las Vegas Strip.
• Twenty-One (blackjack) has declined in both terms of units and revenue. In 1985, 77% of casino
games were blackjack. In 2017, just over 50% were. In 1985, the game accounted for over half of all table game revenues: in 2017, it accounted for 31% of table win.
• Craps has declined remarkably as a money-maker for casinos. In 1985, it generated over 28% of all table win. In 2017, it contributed less than 10% to total table win.
• Roulette has increased both its revenue share and unit share by about 50% • Baccarat has spectacularly increased its win share in the past several years, out earning
blackjack since 2009. Its unit share has grown proportionately with its revenue gain, although it has contracted in recent years.
• Other games, including mini-baccarat, three card poker, and pai gow poker, have increased both their revenue share and their unit share.
These changes have impacted the ways that casinos operate, and should be taken into consideration by both students of casino management and those interested in monitoring casino financial performance over both the short and long terms. The increased reliance on baccarat, a more volatile game, has led to greater variance in reported field results for both individual properties and the Strip as a whole.
University Libraries University of Nevada, Las Vegas 2
Methodology
This study looks at how well various table games have fared in Nevada over the past twenty-five years. Essentially, it answers the question: how have table game pits in Nevada changed?
To do this, we first tabulated data on the total number of units and revenue for each of the casino games listed by the Nevada Gaming Control Board in its monthly Gaming Revenue Report. We also included “Other Games,” which are those with six or fewer units in the reporting area in question. While bingo, keno, the race book, and the sports book are classified as “games” by the Gaming Control Board, we did not include them in this study, since we wanted to get a clear picture of table games.
For 1992 to 2017, we used the annual totals as given in the December Gaming Revenue report for the year in question. The period 1985-1991 proved to be less straightforward: the reports in that period do not generally include annual totals, so we reconstructed the annual amounts, by using quarterly and sometimes monthly reports to build the appropriate sums (revenues) and averages (units).
Instead of including all games in the unit- and revenue-share analyses, we chose to focus on the “Big Four” casino games: twenty-one (blackjack), craps, baccarat, and roulette. All other table games are classed as “Others.” The data for all game reported by the Gaming Control Board can be found in the “Raw Data” section, which begins on page 8.
With data in hand, we created two tables: one charting the revenue share per game, the other mapping the unit share per game. These show how the percentage of money earned by each game, and the floor space devoted to each game, has changed over the past quarter century.
All interpretation of the data is ours, and though it is based on the data set, involves a degree of subjective analysis.
Definitions
All data is taken from all non-restricted locations, Clark County: Nevada Statewide reporting area, as reported in the Nevada State Gaming Control Board’s Gaming Revenue Report.
Units: Total number of table games for the period in question
Revenue: Reported win for the game during the period in question
% Units: The unit share of the game in question, expressed as a percentage of the total table game inventory for that period
% Revenue: The revenue share of the game in question, expressed as a percentage of the total table game revenue for that period
Unit Share: The percentage of total table game units reported for the game in question
Revenue Share: The percentage of total table game revenue reported for the game in question
University Libraries University of Nevada, Las Vegas 3
Unit Share
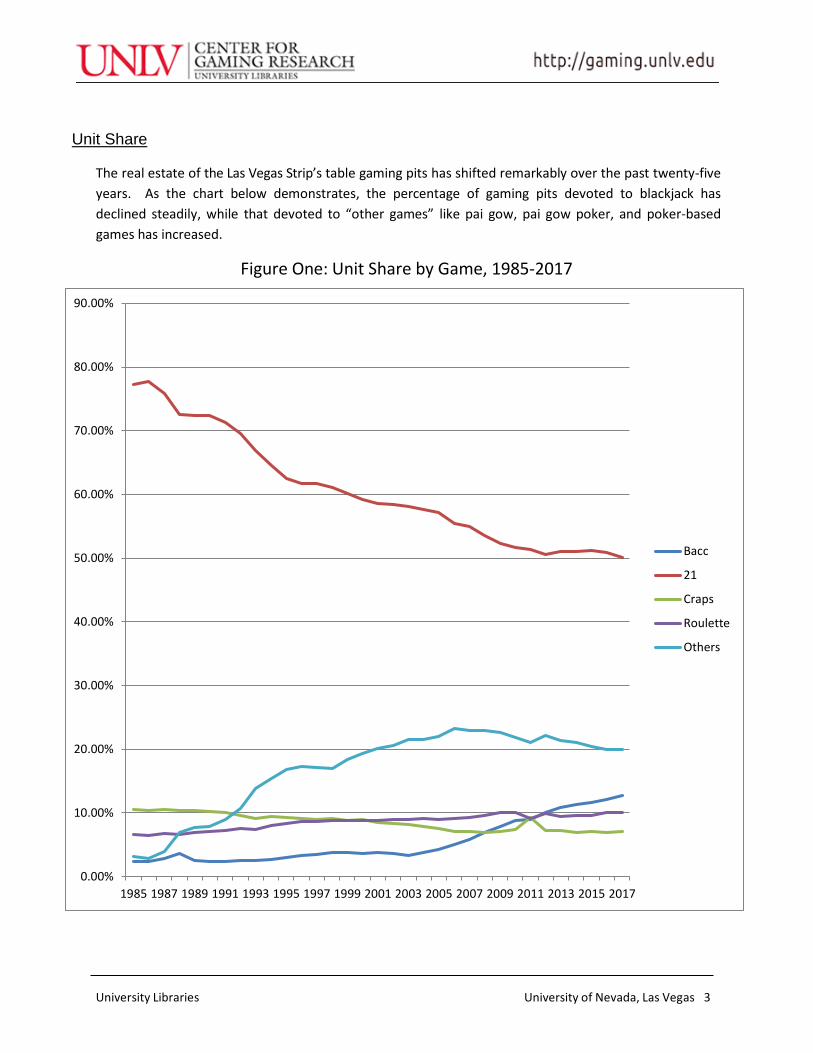
The real estate of the Las Vegas Strip’s table gaming pits has shifted remarkably over the past twenty-five years. As the chart below demonstrates, the percentage of gaming pits devoted to blackjack has declined steadily, while that devoted to “other games” like pai gow, pai gow poker, and poker-based games has increased.
Figure One: Unit Share by Game, 1985-2017
0.00%
10.00%
20.00%
30.00%
40.00%
50.00%
60.00%
70.00%
80.00%
90.00%
1985 1987 1989 1991 1993 1995 1997 1999 2001 2003 2005 2007 2009 2011 2013 2015 2017
Bacc
21
Craps
Roulette
Others
University Libraries University of Nevada, Las Vegas 4
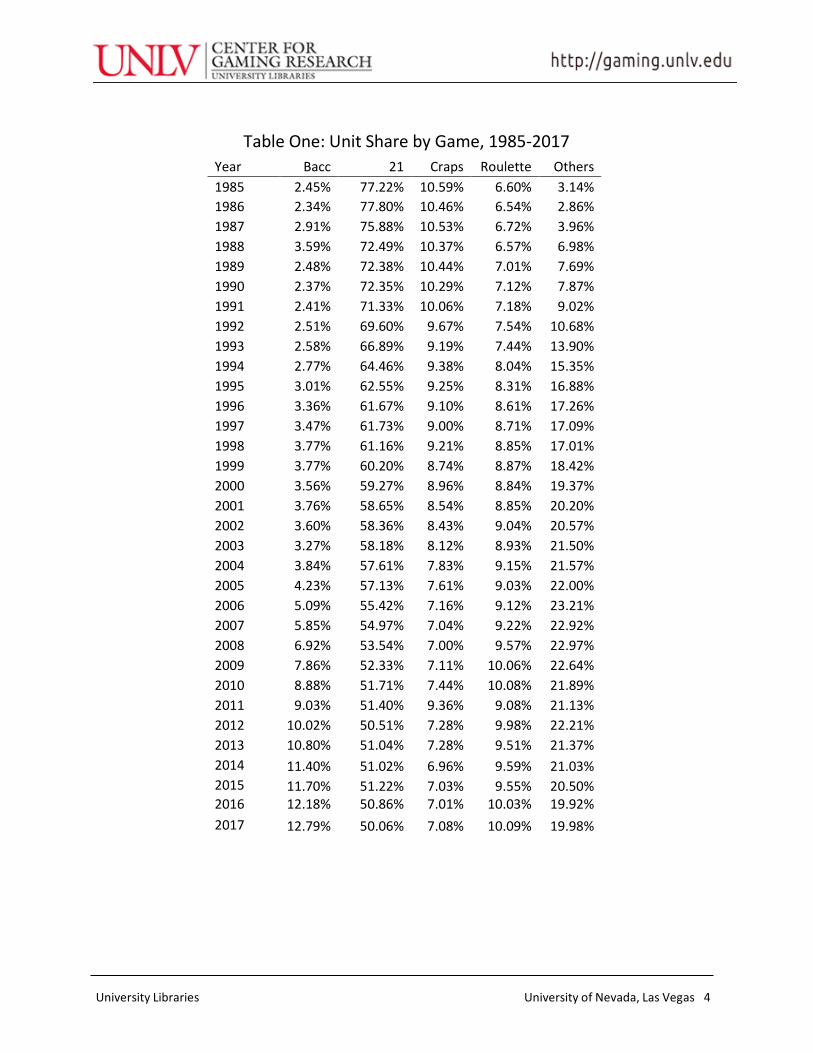
Table One: Unit Share by Game, 1985-2017
Year Bacc 21 Craps Roulette Others 1985 2.45% 77.22% 10.59% 6.60% 3.14% 1986 2.34% 77.80% 10.46% 6.54% 2.86% 1987 2.91% 75.88% 10.53% 6.72% 3.96% 1988 3.59% 72.49% 10.37% 6.57% 6.98% 1989 2.48% 72.38% 10.44% 7.01% 7.69% 1990 2.37% 72.35% 10.29% 7.12% 7.87% 1991 2.41% 71.33% 10.06% 7.18% 9.02% 1992 2.51% 69.60% 9.67% 7.54% 10.68% 1993 2.58% 66.89% 9.19% 7.44% 13.90% 1994 2.77% 64.46% 9.38% 8.04% 15.35% 1995 3.01% 62.55% 9.25% 8.31% 16.88% 1996 3.36% 61.67% 9.10% 8.61% 17.26% 1997 3.47% 61.73% 9.00% 8.71% 17.09% 1998 3.77% 61.16% 9.21% 8.85% 17.01% 1999 3.77% 60.20% 8.74% 8.87% 18.42% 2000 3.56% 59.27% 8.96% 8.84% 19.37% 2001 3.76% 58.65% 8.54% 8.85% 20.20% 2002 3.60% 58.36% 8.43% 9.04% 20.57% 2003 3.27% 58.18% 8.12% 8.93% 21.50% 2004 3.84% 57.61% 7.83% 9.15% 21.57% 2005 4.23% 57.13% 7.61% 9.03% 22.00% 2006 5.09% 55.42% 7.16% 9.12% 23.21% 2007 5.85% 54.97% 7.04% 9.22% 22.92% 2008 6.92% 53.54% 7.00% 9.57% 22.97% 2009 7.86% 52.33% 7.11% 10.06% 22.64% 2010 8.88% 51.71% 7.44% 10.08% 21.89% 2011 9.03% 51.40% 9.36% 9.08% 21.13% 2012 10.02% 50.51% 7.28% 9.98% 22.21% 2013 10.80% 51.04% 7.28% 9.51% 21.37% 2014 11.40% 51.02% 6.96% 9.59% 21.03% 2015 11.70% 51.22% 7.03% 9.55% 20.50% 2016 12.18% 50.86% 7.01% 10.03% 19.92% 2017 12.79% 50.06% 7.08% 10.09% 19.98%
University Libraries University of Nevada, Las Vegas 5
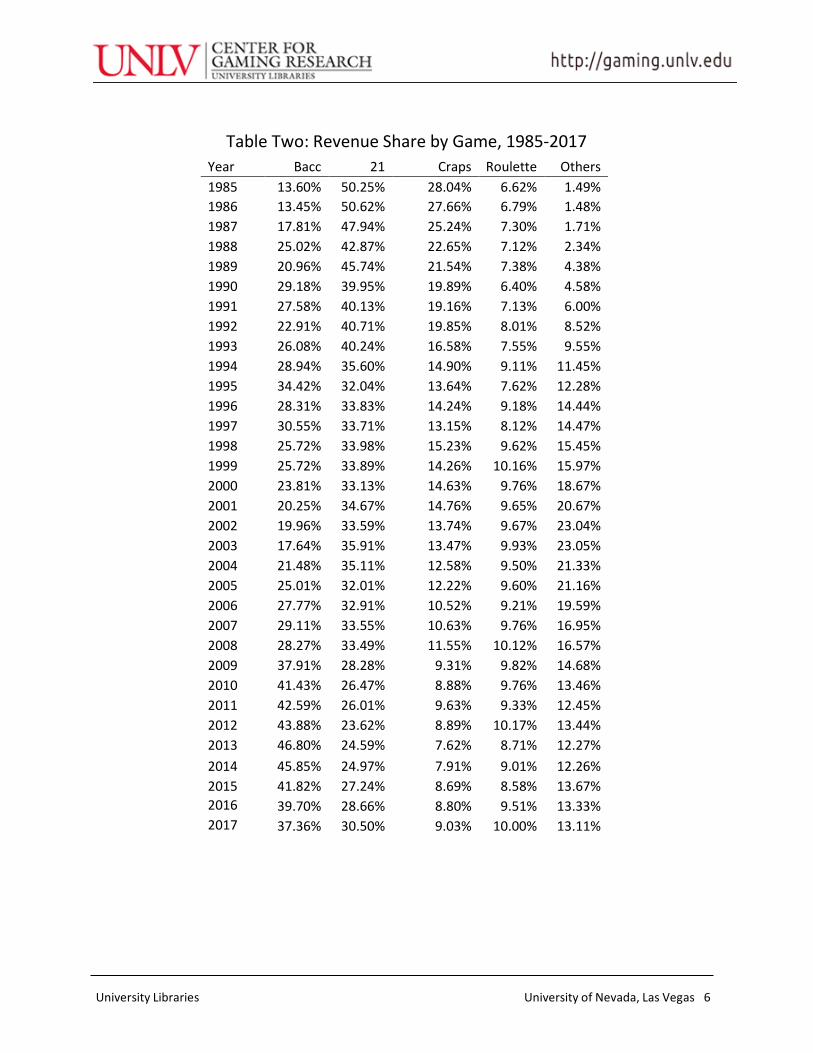
Revenue Share
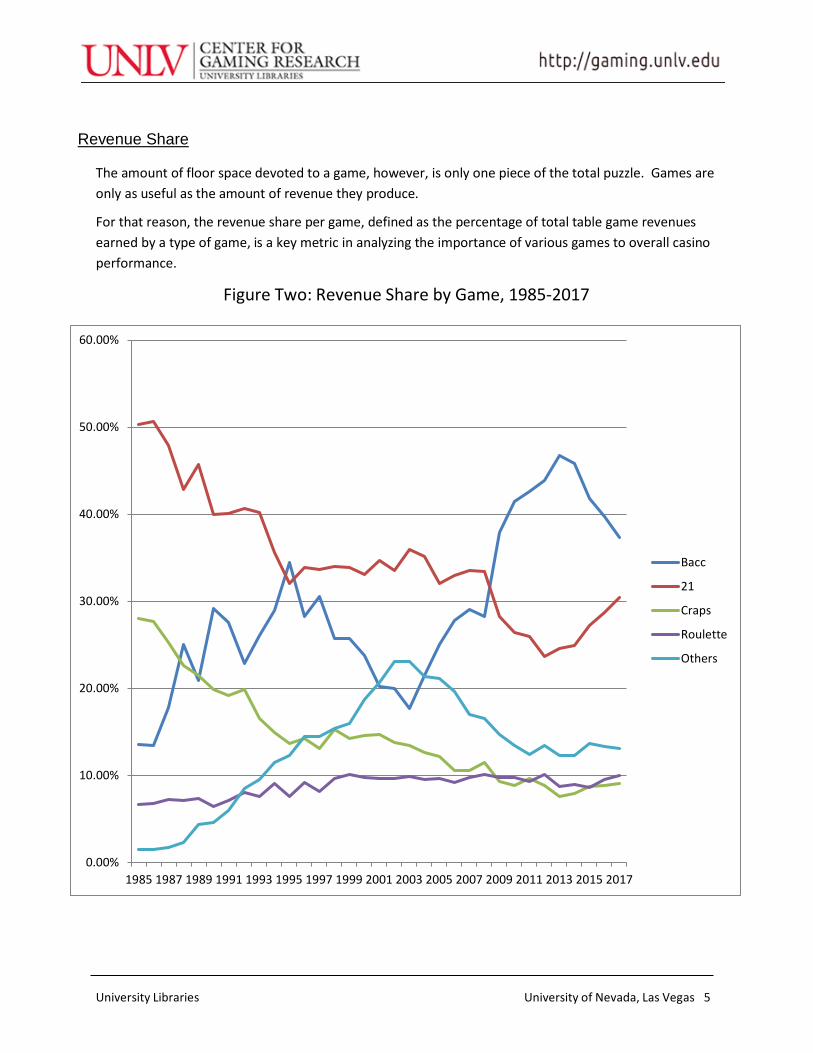
The amount of floor space devoted to a game, however, is only one piece of the total puzzle. Games are only as useful as the amount of revenue they produce.
For that reason, the revenue share per game, defined as the percentage of total table game revenues earned by a type of game, is a key metric in analyzing the importance of various games to overall casino performance.
Figure Two: Revenue Share by Game, 1985-2017
0.00%
10.00%
20.00%
30.00%
40.00%
50.00%
60.00%
1985 1987 1989 1991 1993 1995 1997 1999 2001 2003 2005 2007 2009 2011 2013 2015 2017
Bacc
21
Craps
Roulette
Others
University Libraries University of Nevada, Las Vegas 6
Table Two: Revenue Share by Game, 1985-2017
Year Bacc 21 Craps Roulette Others 1985 13.60% 50.25% 28.04% 6.62% 1.49% 1986 13.45% 50.62% 27.66% 6.79% 1.48% 1987 17.81% 47.94% 25.24% 7.30% 1.71% 1988 25.02% 42.87% 22.65% 7.12% 2.34% 1989 20.96% 45.74% 21.54% 7.38% 4.38% 1990 29.18% 39.95% 19.89% 6.40% 4.58% 1991 27.58% 40.13% 19.16% 7.13% 6.00% 1992 22.91% 40.71% 19.85% 8.01% 8.52% 1993 26.08% 40.24% 16.58% 7.55% 9.55% 1994 28.94% 35.60% 14.90% 9.11% 11.45% 1995 34.42% 32.04% 13.64% 7.62% 12.28% 1996 28.31% 33.83% 14.24% 9.18% 14.44% 1997 30.55% 33.71% 13.15% 8.12% 14.47% 1998 25.72% 33.98% 15.23% 9.62% 15.45% 1999 25.72% 33.89% 14.26% 10.16% 15.97% 2000 23.81% 33.13% 14.63% 9.76% 18.67% 2001 20.25% 34.67% 14.76% 9.65% 20.67% 2002 19.96% 33.59% 13.74% 9.67% 23.04% 2003 17.64% 35.91% 13.47% 9.93% 23.05% 2004 21.48% 35.11% 12.58% 9.50% 21.33% 2005 25.01% 32.01% 12.22% 9.60% 21.16% 2006 27.77% 32.91% 10.52% 9.21% 19.59% 2007 29.11% 33.55% 10.63% 9.76% 16.95% 2008 28.27% 33.49% 11.55% 10.12% 16.57% 2009 37.91% 28.28% 9.31% 9.82% 14.68% 2010 41.43% 26.47% 8.88% 9.76% 13.46% 2011 42.59% 26.01% 9.63% 9.33% 12.45% 2012 43.88% 23.62% 8.89% 10.17% 13.44% 2013 46.80% 24.59% 7.62% 8.71% 12.27% 2014 45.85% 24.97% 7.91% 9.01% 12.26% 2015 41.82% 27.24% 8.69% 8.58% 13.67% 2016 39.70% 28.66% 8.80% 9.51% 13.33% 2017 37.36% 30.50% 9.03% 10.00% 13.11%
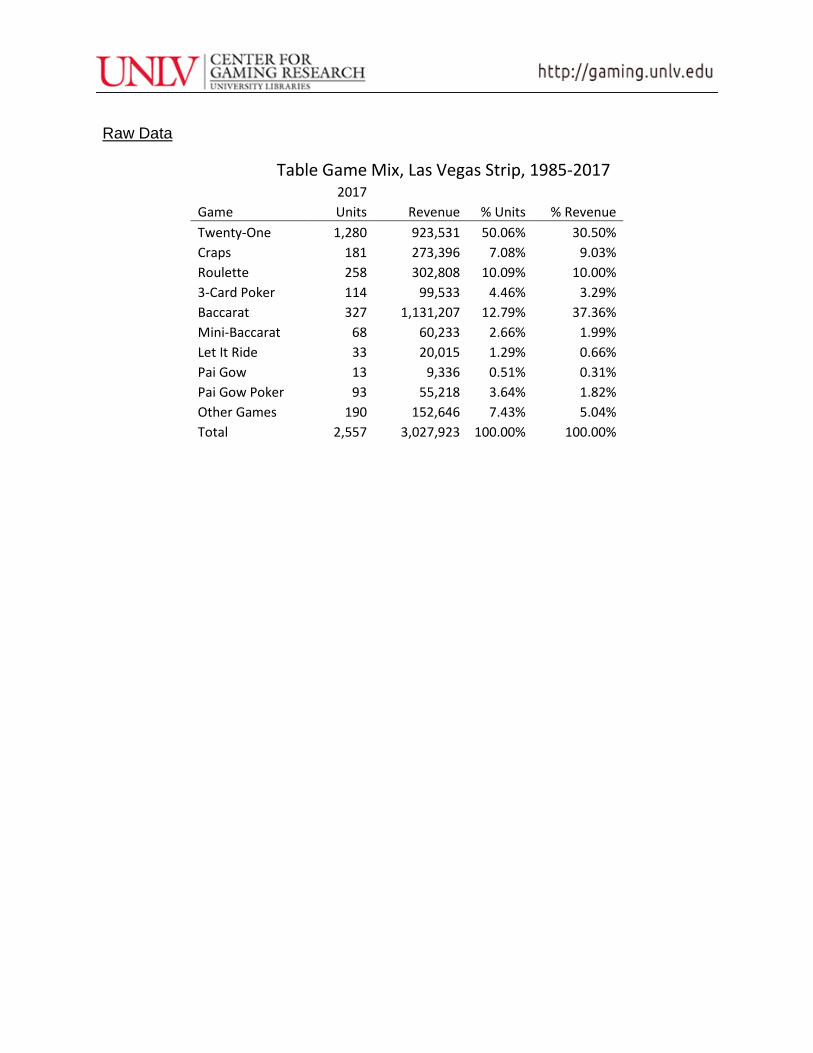
Raw Data
Table Game Mix, Las Vegas Strip, 1985-2017
2017
Game Units Revenue % Units % Revenue Twenty-One 1,280 923,531 50.06% 30.50% Craps 181 273,396 7.08% 9.03% Roulette 258 302,808 10.09% 10.00% 3-Card Poker 114 99,533 4.46% 3.29% Baccarat 327 1,131,207 12.79% 37.36% Mini-Baccarat 68 60,233 2.66% 1.99% Let It Ride 33 20,015 1.29% 0.66% Pai Gow 13 9,336 0.51% 0.31% Pai Gow Poker 93 55,218 3.64% 1.82% Other Games 190 152,646 7.43% 5.04% Total 2,557 3,027,923 100.00% 100.00%
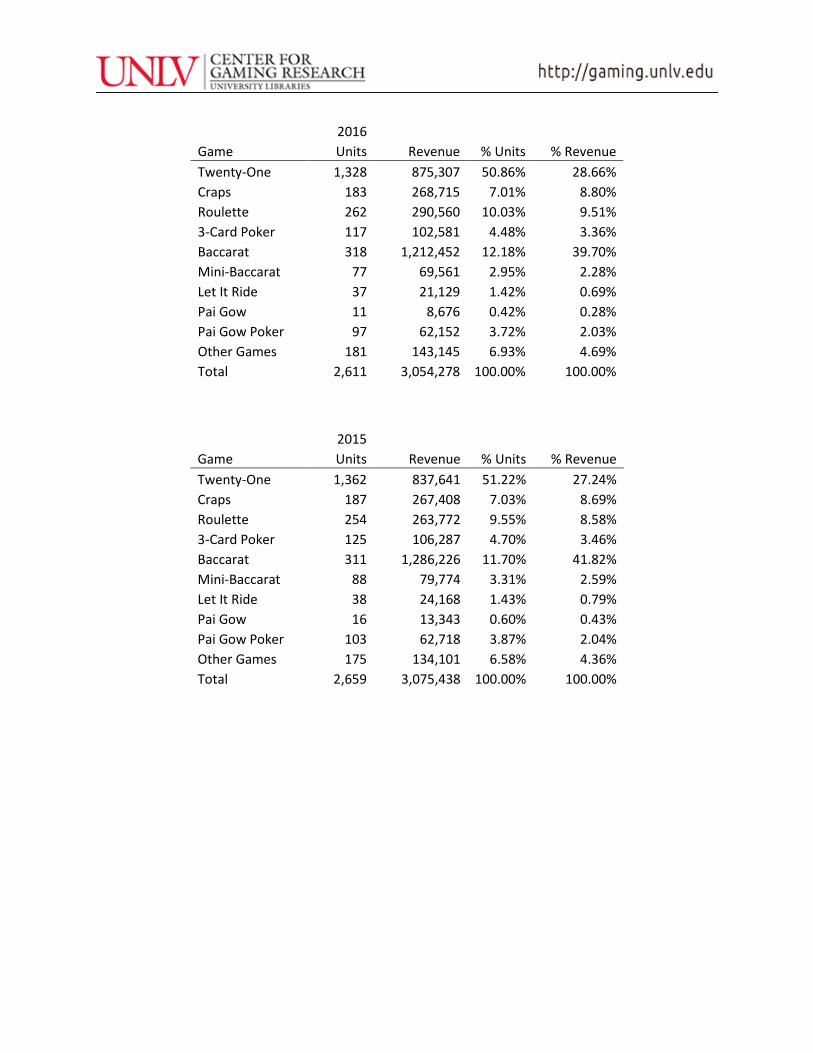
2016
Game Units Revenue % Units % Revenue Twenty-One 1,328 875,307 50.86% 28.66% Craps 183 268,715 7.01% 8.80% Roulette 262 290,560 10.03% 9.51% 3-Card Poker 117 102,581 4.48% 3.36% Baccarat 318 1,212,452 12.18% 39.70% Mini-Baccarat 77 69,561 2.95% 2.28% Let It Ride 37 21,129 1.42% 0.69% Pai Gow 11 8,676 0.42% 0.28% Pai Gow Poker 97 62,152 3.72% 2.03% Other Games 181 143,145 6.93% 4.69% Total 2,611 3,054,278 100.00% 100.00%
2015
Game Units Revenue % Units % Revenue Twenty-One 1,362 837,641 51.22% 27.24% Craps 187 267,408 7.03% 8.69% Roulette 254 263,772 9.55% 8.58% 3-Card Poker 125 106,287 4.70% 3.46% Baccarat 311 1,286,226 11.70% 41.82% Mini-Baccarat 88 79,774 3.31% 2.59% Let It Ride 38 24,168 1.43% 0.79% Pai Gow 16 13,343 0.60% 0.43% Pai Gow Poker 103 62,718 3.87% 2.04% Other Games 175 134,101 6.58% 4.36% Total 2,659 3,075,438 100.00% 100.00%
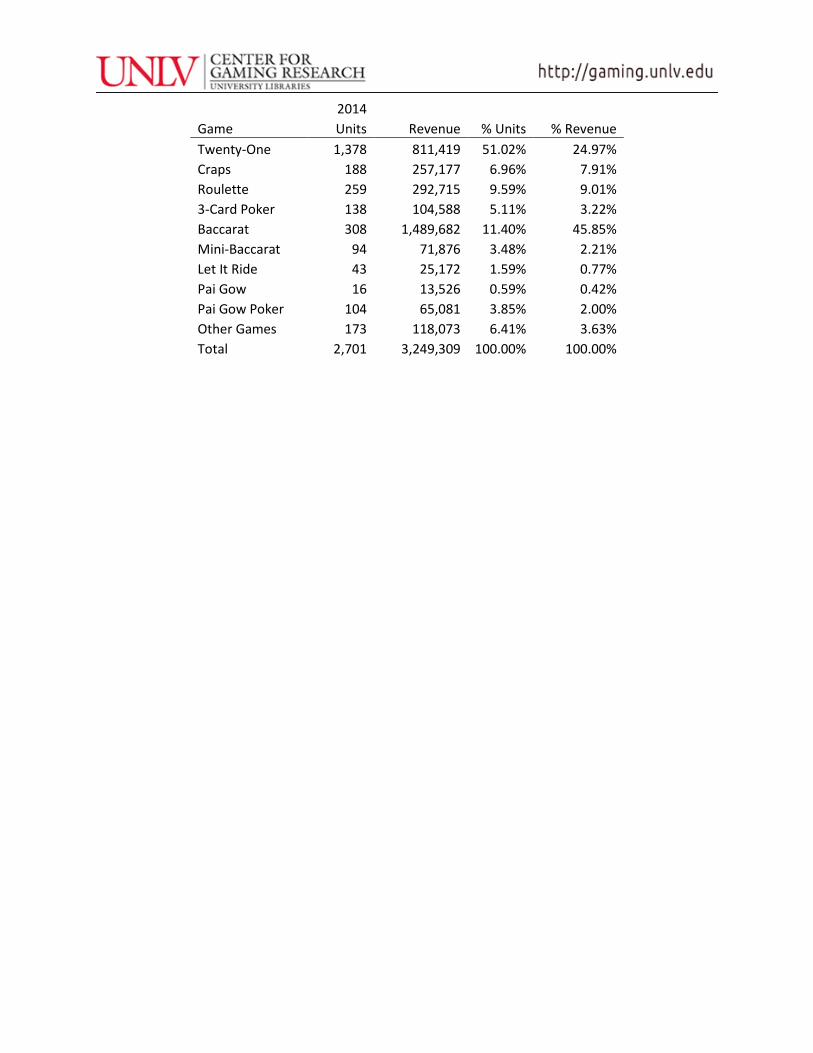
2014
Game Units Revenue % Units % Revenue Twenty-One 1,378 811,419 51.02% 24.97% Craps 188 257,177 6.96% 7.91% Roulette 259 292,715 9.59% 9.01% 3-Card Poker 138 104,588 5.11% 3.22% Baccarat 308 1,489,682 11.40% 45.85% Mini-Baccarat 94 71,876 3.48% 2.21% Let It Ride 43 25,172 1.59% 0.77% Pai Gow 16 13,526 0.59% 0.42% Pai Gow Poker 104 65,081 3.85% 2.00% Other Games 173 118,073 6.41% 3.63% Total 2,701 3,249,309 100.00% 100.00%
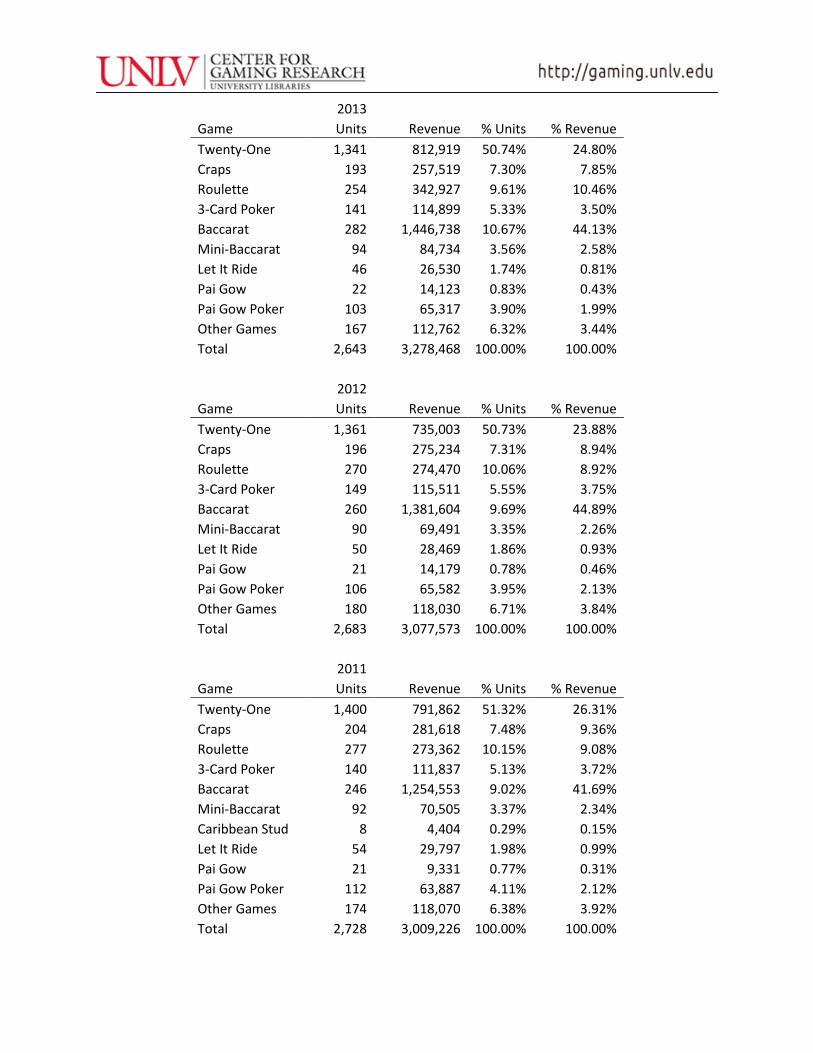
2013
Game Units Revenue % Units % Revenue Twenty-One 1,341 812,919 50.74% 24.80% Craps 193 257,519 7.30% 7.85% Roulette 254 342,927 9.61% 10.46% 3-Card Poker 141 114,899 5.33% 3.50% Baccarat 282 1,446,738 10.67% 44.13% Mini-Baccarat 94 84,734 3.56% 2.58% Let It Ride 46 26,530 1.74% 0.81% Pai Gow 22 14,123 0.83% 0.43% Pai Gow Poker 103 65,317 3.90% 1.99% Other Games 167 112,762 6.32% 3.44% Total 2,643 3,278,468 100.00% 100.00%
2012 Game Units Revenue % Units % Revenue
Twenty-One 1,361 735,003 50.73% 23.88% Craps 196 275,234 7.31% 8.94% Roulette 270 274,470 10.06% 8.92% 3-Card Poker 149 115,511 5.55% 3.75% Baccarat 260 1,381,604 9.69% 44.89% Mini-Baccarat 90 69,491 3.35% 2.26% Let It Ride 50 28,469 1.86% 0.93% Pai Gow 21 14,179 0.78% 0.46% Pai Gow Poker 106 65,582 3.95% 2.13% Other Games 180 118,030 6.71% 3.84% Total 2,683 3,077,573 100.00% 100.00%
2011 Game Units Revenue % Units % Revenue
Twenty-One 1,400 791,862 51.32% 26.31% Craps 204 281,618 7.48% 9.36% Roulette 277 273,362 10.15% 9.08% 3-Card Poker 140 111,837 5.13% 3.72% Baccarat 246 1,254,553 9.02% 41.69% Mini-Baccarat 92 70,505 3.37% 2.34% Caribbean Stud 8 4,404 0.29% 0.15% Let It Ride 54 29,797 1.98% 0.99% Pai Gow 21 9,331 0.77% 0.31% Pai Gow Poker 112 63,887 4.11% 2.12% Other Games 174 118,070 6.38% 3.92% Total 2,728 3,009,226 100.00% 100.00%
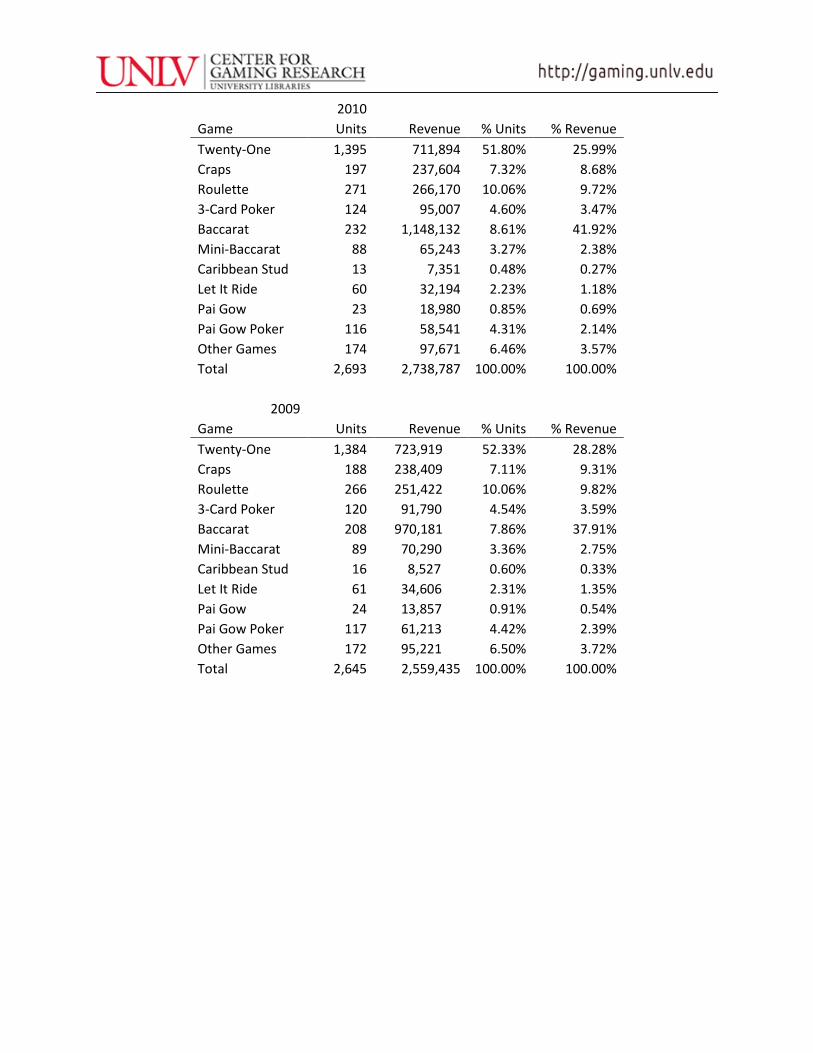
2010
Game Units Revenue % Units % Revenue Twenty-One 1,395 711,894 51.80% 25.99% Craps 197 237,604 7.32% 8.68% Roulette 271 266,170 10.06% 9.72% 3-Card Poker 124 95,007 4.60% 3.47% Baccarat 232 1,148,132 8.61% 41.92% Mini-Baccarat 88 65,243 3.27% 2.38% Caribbean Stud 13 7,351 0.48% 0.27% Let It Ride 60 32,194 2.23% 1.18% Pai Gow 23 18,980 0.85% 0.69% Pai Gow Poker 116 58,541 4.31% 2.14% Other Games 174 97,671 6.46% 3.57% Total 2,693 2,738,787 100.00% 100.00%
2009 Game Units Revenue % Units % Revenue
Twenty-One 1,384 723,919 52.33% 28.28% Craps 188 238,409 7.11% 9.31% Roulette 266 251,422 10.06% 9.82% 3-Card Poker 120 91,790 4.54% 3.59% Baccarat 208 970,181 7.86% 37.91% Mini-Baccarat 89 70,290 3.36% 2.75% Caribbean Stud 16 8,527 0.60% 0.33% Let It Ride 61 34,606 2.31% 1.35% Pai Gow 24 13,857 0.91% 0.54% Pai Gow Poker 117 61,213 4.42% 2.39% Other Games 172 95,221 6.50% 3.72% Total 2,645 2,559,435 100.00% 100.00%
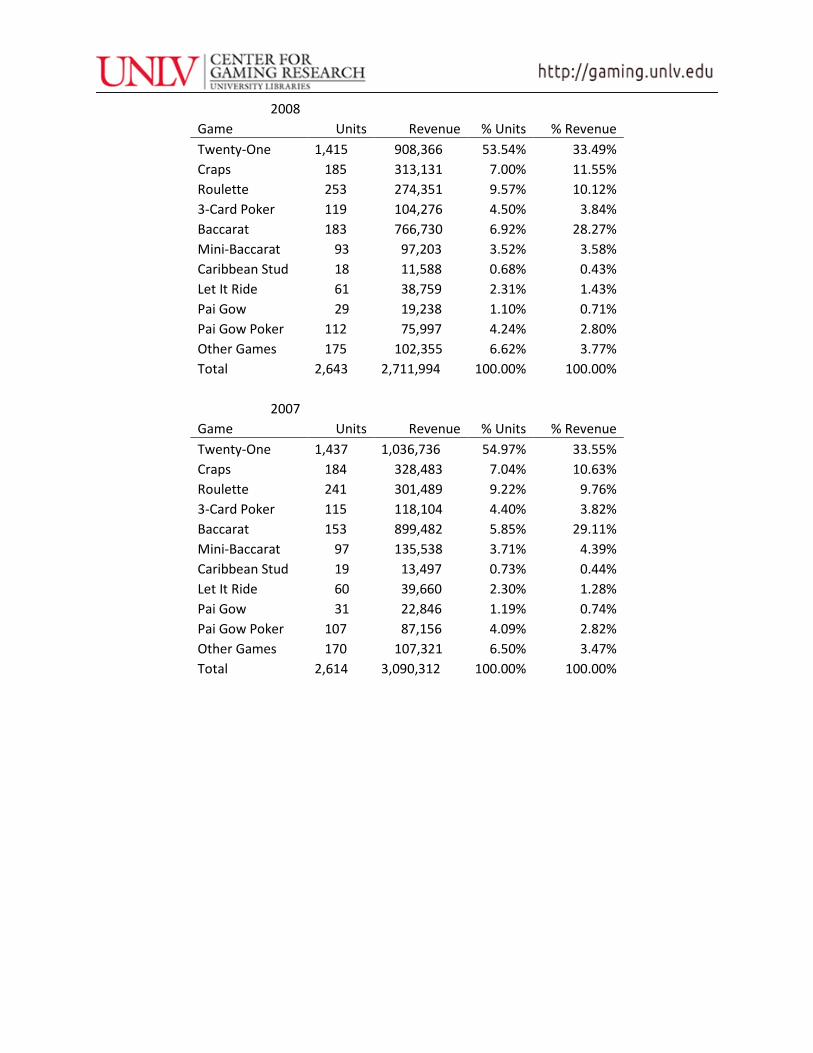
2008 Game Units Revenue % Units % Revenue
Twenty-One 1,415 908,366 53.54% 33.49% Craps 185 313,131 7.00% 11.55% Roulette 253 274,351 9.57% 10.12% 3-Card Poker 119 104,276 4.50% 3.84% Baccarat 183 766,730 6.92% 28.27% Mini-Baccarat 93 97,203 3.52% 3.58% Caribbean Stud 18 11,588 0.68% 0.43% Let It Ride 61 38,759 2.31% 1.43% Pai Gow 29 19,238 1.10% 0.71% Pai Gow Poker 112 75,997 4.24% 2.80% Other Games 175 102,355 6.62% 3.77% Total 2,643 2,711,994 100.00% 100.00%
2007 Game Units Revenue % Units % Revenue
Twenty-One 1,437 1,036,736 54.97% 33.55% Craps 184 328,483 7.04% 10.63% Roulette 241 301,489 9.22% 9.76% 3-Card Poker 115 118,104 4.40% 3.82% Baccarat 153 899,482 5.85% 29.11% Mini-Baccarat 97 135,538 3.71% 4.39% Caribbean Stud 19 13,497 0.73% 0.44% Let It Ride 60 39,660 2.30% 1.28% Pai Gow 31 22,846 1.19% 0.74% Pai Gow Poker 107 87,156 4.09% 2.82% Other Games 170 107,321 6.50% 3.47% Total 2,614 3,090,312 100.00% 100.00%

2006 Game Units Revenue % Units % Revenue
Twenty-One 1,447 986,415 55.42% 32.91% Craps 187 315,214 7.16% 10.52% Roulette 238 276,065 9.12% 9.21% 3-Card Poker 117 122,323 4.48% 4.08% Baccarat 133 832,217 5.09% 27.77% Mini-Baccarat 118 215,837 4.52% 7.20% Caribbean Stud 25 17,982 0.96% 0.60% Let It Ride 64 37,852 2.45% 1.26% Pai Gow 39 28,441 1.49% 0.95% Pai Gow Poker 101 74,113 3.87% 2.47% Other Games 142 90,447 5.44% 3.02% Total 2,611 2,996,906 100.00% 100.00%
2005 Game Units Revenue % Units % Revenue
Twenty-One 1,487 848,693 57.13% 32.01% Craps 198 324,130 7.61% 12.22% Roulette 235 254,583 9.03% 9.60% 3-Card Poker 104 117,854 4.00% 4.44% Baccarat 110 663,019 4.23% 25.00% Mini-Baccarat 110 200,231 4.23% 7.55% Caribbean Stud 40 28,931 1.54% 1.09% Let It Ride 68 40,486 2.61% 1.53% Pai Gow 27 23,282 1.04% 0.88% Pai Gow Poker 121 84,170 4.65% 3.17% Other Games 103 66,169 3.96% 2.50% Total 2,603 2,651,548 100.00% 100.00%

2004 Game Units Revenue % Units % Revenue
Twenty-One 1,442 805,045 57.61% 35.11% Craps 196 288,398 7.83% 12.58% Roulette 229 217,739 9.15% 9.50% 3-Card Poker 92 101,304 3.68% 4.42% Baccarat 96 492,545 3.84% 21.48% Mini-Baccarat 90 170,342 3.60% 7.43% Caribbean Stud 47 33,812 1.88% 1.47% Let It Ride 67 41,911 2.68% 1.83% Pai Gow 25 20,414 1.00% 0.89% Pai Gow Poker 124 76,238 4.95% 3.33% Other Games 95 44,929 3.80% 1.96% Total 2,503 2,292,677 100.00% 100.00%
2003 Game Units Revenue % Units % Revenue
Twenty-One 1,440 731,437 58.18% 35.91% Craps 201 274,491 8.12% 13.47% Roulette 221 202,298 8.93% 9.93% 3-Card Poker 74 78,586 2.99% 3.86% Baccarat 81 359,241 3.27% 17.64% Mini-Baccarat 97 164,588 3.92% 8.08% Caribbean Stud 54 35,226 2.18% 1.73% Let It Ride 70 39,671 2.83% 1.95% Pai Gow 27 19,238 1.09% 0.94% Pai Gow Poker 126 71,472 5.09% 3.51% Other Games 84 60,826 3.39% 2.99% Total 2,475 2,037,074 100.00% 100.00%
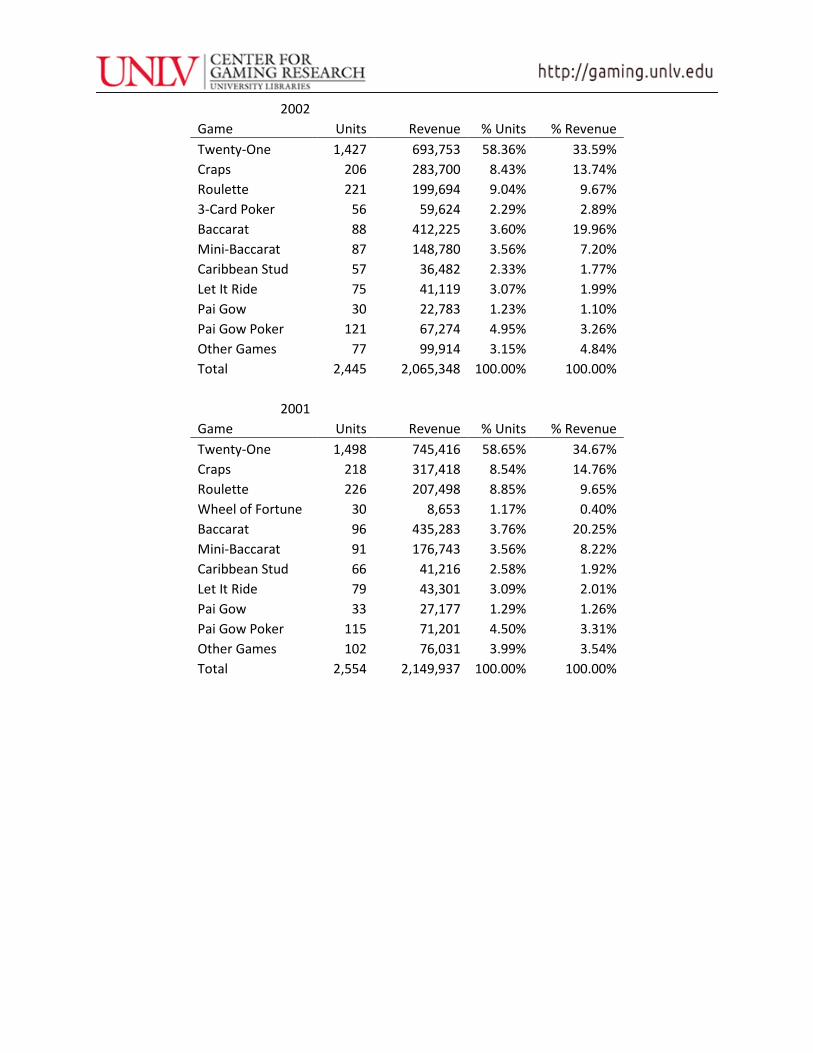
2002 Game Units Revenue % Units % Revenue
Twenty-One 1,427 693,753 58.36% 33.59% Craps 206 283,700 8.43% 13.74% Roulette 221 199,694 9.04% 9.67% 3-Card Poker 56 59,624 2.29% 2.89% Baccarat 88 412,225 3.60% 19.96% Mini-Baccarat 87 148,780 3.56% 7.20% Caribbean Stud 57 36,482 2.33% 1.77% Let It Ride 75 41,119 3.07% 1.99% Pai Gow 30 22,783 1.23% 1.10% Pai Gow Poker 121 67,274 4.95% 3.26% Other Games 77 99,914 3.15% 4.84% Total 2,445 2,065,348 100.00% 100.00%
2001 Game Units Revenue % Units % Revenue
Twenty-One 1,498 745,416 58.65% 34.67% Craps 218 317,418 8.54% 14.76% Roulette 226 207,498 8.85% 9.65% Wheel of Fortune 30 8,653 1.17% 0.40% Baccarat 96 435,283 3.76% 20.25% Mini-Baccarat 91 176,743 3.56% 8.22% Caribbean Stud 66 41,216 2.58% 1.92% Let It Ride 79 43,301 3.09% 2.01% Pai Gow 33 27,177 1.29% 1.26% Pai Gow Poker 115 71,201 4.50% 3.31% Other Games 102 76,031 3.99% 3.54% Total 2,554 2,149,937 100.00% 100.00%

2000 Game Units Revenue % Units % Revenue
Twenty-One 1,515 744,719 59.27% 33.13% Craps 229 328,715 8.96% 14.63% Roulette 226 219,276 8.84% 9.76% Wheel of Fortune 34 10,095 1.33% 0.45% Baccarat 91 535,195 3.56% 23.81% Mini-Baccarat 86 134,876 3.36% 6.00% Caribbean Stud 72 46,882 2.82% 2.09% Let It Ride 81 45,043 3.17% 2.00% Pai Gow 31 29,979 1.21% 1.33% Pai Gow Poker 107 72,735 4.19% 3.24% Other Games 84 80,039 3.29% 3.56% Total 2,556 2,247,554 100.00% 100.00%
1999 Game Units Revenue % Units % Revenue
Twenty-One 1,487 715,468 60.94% 33.89% Craps 216 300,937 8.85% 14.26% Roulette 219 214,452 8.98% 10.16% Wheel of Fortune 30 9,047 1.23% 0.43% Baccarat 93 542,986 3.81% 25.72% Mini-Baccarat 72 125,610 2.95% 5.95% Caribbean Stud 67 45,003 2.75% 2.13% Let It Ride 69 39,736 2.83% 1.88% Pai Gow 30 32,370 1.23% 1.53% Pai Gow Poker 101 62,805 4.14% 2.98% Other Games 56 22,571 2.30% 1.07% Total 2,440 2,110,985 100.00% 100.00%

1998 Game Units Revenue % Units % Revenue
Twenty-One 1,348 584,364 61.16% 33.98% Craps 203 261,949 9.21% 15.23% Roulette 195 165,485 8.85% 9.62% Wheel of Fortune 27 6,853 1.23% 0.40% Baccarat 83 442,246 3.77% 25.72% Mini-Baccarat 64 101,647 2.90% 5.91% Caribbean Stud 66 39,941 2.99% 2.32% Let It Ride 61 29,946 2.77% 1.74% Pai Gow 40 30,985 1.81% 1.80% Pai Gow Poker 87 46,473 3.95% 2.70% Other Games 30 9,815 1.36% 0.57% Total 2,204 1,719,704 100.00% 100.00%
1997 Game Units Revenue % Units % Revenue
Twenty-One 1,297 613,803 61.73% 33.71% Craps 189 239,407 9.00% 13.15% Roulette 183 147,802 8.71% 8.12% Wheel of Fortune 29 7,267 1.38% 0.40% Baccarat 73 556,284 3.47% 30.55% Mini-Baccarat 56 86,977 2.67% 4.78% Caribbean Stud 65 41,559 3.09% 2.28% Let It Ride 67 30,883 3.19% 1.70% Pai Gow 26 40,279 1.24% 2.21% Pai Gow Poker 79 45,853 3.76% 2.52% Other Games 37 10,974 1.76% 0.60% Total 2,101 1,821,088 100.00% 100.00%
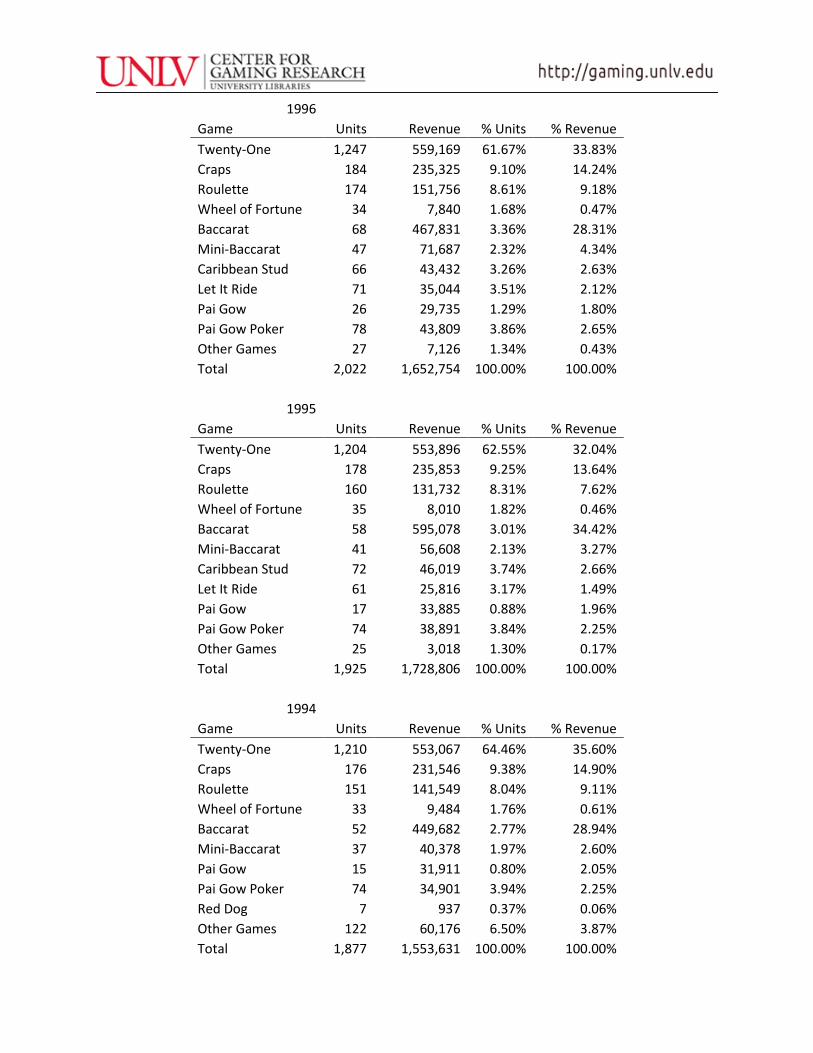
1996 Game Units Revenue % Units % Revenue
Twenty-One 1,247 559,169 61.67% 33.83% Craps 184 235,325 9.10% 14.24% Roulette 174 151,756 8.61% 9.18% Wheel of Fortune 34 7,840 1.68% 0.47% Baccarat 68 467,831 3.36% 28.31% Mini-Baccarat 47 71,687 2.32% 4.34% Caribbean Stud 66 43,432 3.26% 2.63% Let It Ride 71 35,044 3.51% 2.12% Pai Gow 26 29,735 1.29% 1.80% Pai Gow Poker 78 43,809 3.86% 2.65% Other Games 27 7,126 1.34% 0.43% Total 2,022 1,652,754 100.00% 100.00%
1995 Game Units Revenue % Units % Revenue
Twenty-One 1,204 553,896 62.55% 32.04% Craps 178 235,853 9.25% 13.64% Roulette 160 131,732 8.31% 7.62% Wheel of Fortune 35 8,010 1.82% 0.46% Baccarat 58 595,078 3.01% 34.42% Mini-Baccarat 41 56,608 2.13% 3.27% Caribbean Stud 72 46,019 3.74% 2.66% Let It Ride 61 25,816 3.17% 1.49% Pai Gow 17 33,885 0.88% 1.96% Pai Gow Poker 74 38,891 3.84% 2.25% Other Games 25 3,018 1.30% 0.17% Total 1,925 1,728,806 100.00% 100.00%
1994 Game Units Revenue % Units % Revenue
Twenty-One 1,210 553,067 64.46% 35.60% Craps 176 231,546 9.38% 14.90% Roulette 151 141,549 8.04% 9.11% Wheel of Fortune 33 9,484 1.76% 0.61% Baccarat 52 449,682 2.77% 28.94% Mini-Baccarat 37 40,378 1.97% 2.60% Pai Gow 15 31,911 0.80% 2.05% Pai Gow Poker 74 34,901 3.94% 2.25% Red Dog 7 937 0.37% 0.06% Other Games 122 60,176 6.50% 3.87% Total 1,877 1,553,631 100.00% 100.00%

1993 Game Units Revenue % Units % Revenue
Twenty-One 1,295 507,626 66.89% 40.24% Craps 178 209,204 9.19% 16.58% Roulette 144 95,245 7.44% 7.55% Wheel of Fortune 34 7,753 1.76% 0.61% Baccarat 50 329,045 2.58% 26.08% Mini-Baccarat 36 23,980 1.86% 1.90% Pai Gow 21 22,558 1.08% 1.79% Pai Gow Poker 76 28,217 3.93% 2.24% Red Dog 10 1,776 0.52% 0.14% Other Games 92 36,229 4.75% 2.87% Total 1,936 1,261,633 100.00% 100.00%
1992 Game Units Revenue % Units % Revenue
Twenty-One 1,108 453,478 69.60% 40.71% Craps 154 221,172 9.67% 19.85% Roulette 120 89,273 7.54% 8.01% Wheel of Fortune 30 7,222 1.88% 0.65% Baccarat 40 255,271 2.51% 22.91% Mini-Baccarat 30 27,844 1.88% 2.50% Pai Gow 20 18,956 1.26% 1.70% Pai Gow Poker 58 25,200 3.64% 2.26% Red Dog 11 2,408 0.69% 0.22% Other Games 21 13,175 1.32% 1.18% Total 1,592 1,113,999 100.00% 100.00%
1991 Game Units Revenue % Units % Revenue
Twenty-One 1,163 459,881 71.33% 40.13% Craps 164 219,537 10.06% 19.16% Roulette 117 81,738 7.18% 7.13% Wheel of Fortune 29 8,300 1.79% 0.72% Baccarat 39 316,059 2.41% 27.58% Mini-Baccarat 23 15,438 1.40% 1.35% Pai Gow 16 17,509 0.98% 1.53% Pai Gow Poker 63 22,700 3.87% 1.98% Red Dog 8 1,948 0.49% 0.17% Other Games 8 2,942 0.46% 0.26% Total 1,630 1,146,052 99.97% 100.00%
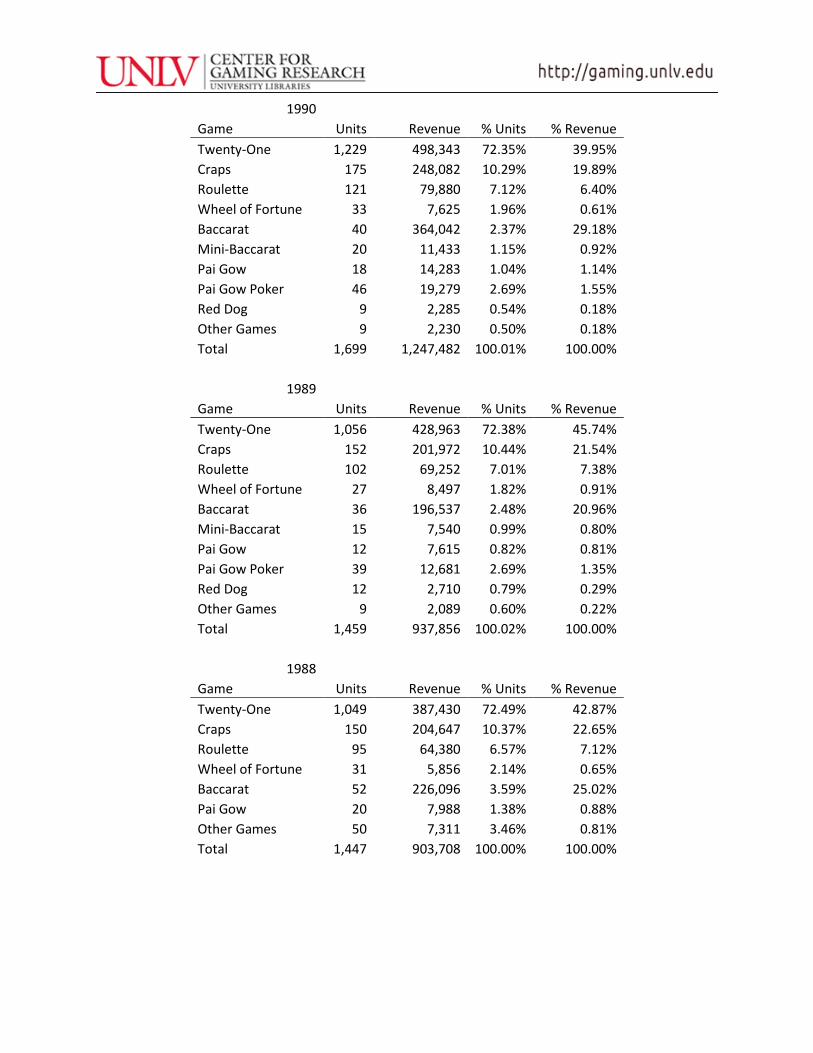
1990 Game Units Revenue % Units % Revenue
Twenty-One 1,229 498,343 72.35% 39.95% Craps 175 248,082 10.29% 19.89% Roulette 121 79,880 7.12% 6.40% Wheel of Fortune 33 7,625 1.96% 0.61% Baccarat 40 364,042 2.37% 29.18% Mini-Baccarat 20 11,433 1.15% 0.92% Pai Gow 18 14,283 1.04% 1.14% Pai Gow Poker 46 19,279 2.69% 1.55% Red Dog 9 2,285 0.54% 0.18% Other Games 9 2,230 0.50% 0.18% Total 1,699 1,247,482 100.01% 100.00%
1989 Game Units Revenue % Units % Revenue
Twenty-One 1,056 428,963 72.38% 45.74% Craps 152 201,972 10.44% 21.54% Roulette 102 69,252 7.01% 7.38% Wheel of Fortune 27 8,497 1.82% 0.91% Baccarat 36 196,537 2.48% 20.96% Mini-Baccarat 15 7,540 0.99% 0.80% Pai Gow 12 7,615 0.82% 0.81% Pai Gow Poker 39 12,681 2.69% 1.35% Red Dog 12 2,710 0.79% 0.29% Other Games 9 2,089 0.60% 0.22% Total 1,459 937,856 100.02% 100.00%
1988 Game Units Revenue % Units % Revenue
Twenty-One 1,049 387,430 72.49% 42.87% Craps 150 204,647 10.37% 22.65% Roulette 95 64,380 6.57% 7.12% Wheel of Fortune 31 5,856 2.14% 0.65% Baccarat 52 226,096 3.59% 25.02% Pai Gow 20 7,988 1.38% 0.88% Other Games 50 7,311 3.46% 0.81% Total 1,447 903,708 100.00% 100.00%
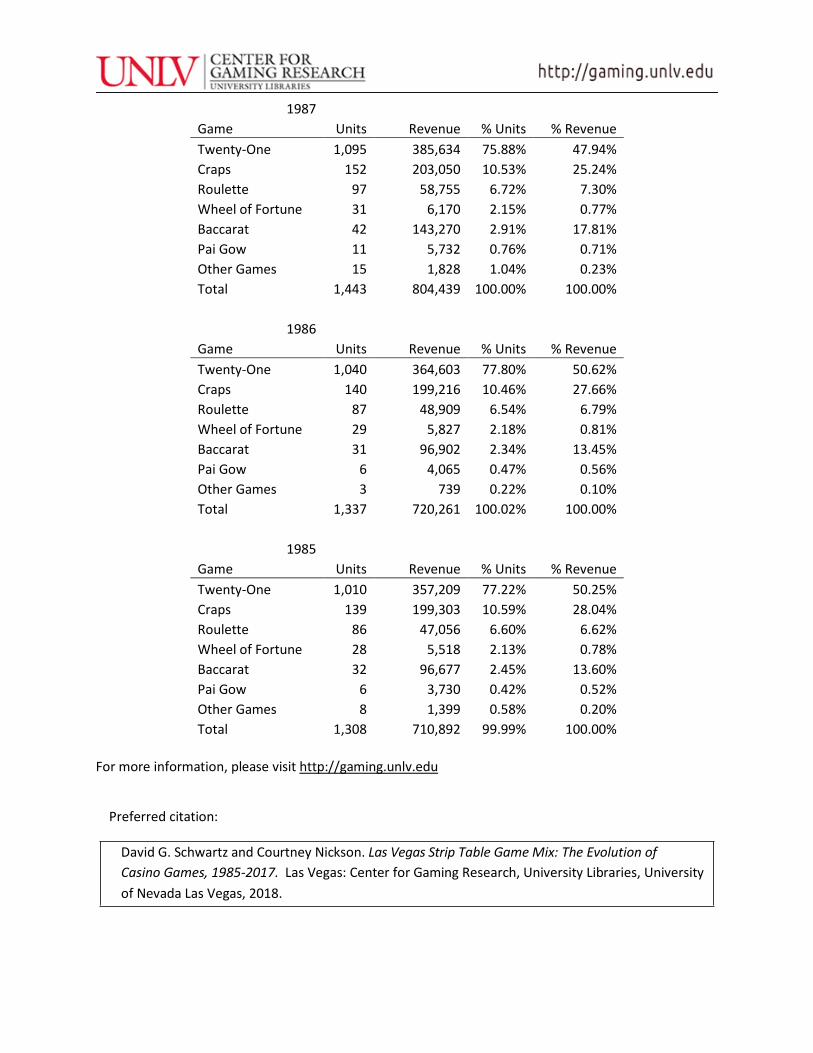
1987 Game Units Revenue % Units % Revenue
Twenty-One 1,095 385,634 75.88% 47.94% Craps 152 203,050 10.53% 25.24% Roulette 97 58,755 6.72% 7.30% Wheel of Fortune 31 6,170 2.15% 0.77% Baccarat 42 143,270 2.91% 17.81% Pai Gow 11 5,732 0.76% 0.71% Other Games 15 1,828 1.04% 0.23% Total 1,443 804,439 100.00% 100.00%
1986 Game Units Revenue % Units % Revenue
Twenty-One 1,040 364,603 77.80% 50.62% Craps 140 199,216 10.46% 27.66% Roulette 87 48,909 6.54% 6.79% Wheel of Fortune 29 5,827 2.18% 0.81% Baccarat 31 96,902 2.34% 13.45% Pai Gow 6 4,065 0.47% 0.56% Other Games 3 739 0.22% 0.10% Total 1,337 720,261 100.02% 100.00%
1985 Game Units Revenue % Units % Revenue
Twenty-One 1,010 357,209 77.22% 50.25% Craps 139 199,303 10.59% 28.04% Roulette 86 47,056 6.60% 6.62% Wheel of Fortune 28 5,518 2.13% 0.78% Baccarat 32 96,677 2.45% 13.60% Pai Gow 6 3,730 0.42% 0.52% Other Games 8 1,399 0.58% 0.20% Total 1,308 710,892 99.99% 100.00%
For more information, please visit http://gaming.unlv.edu
Preferred citation:
David G. Schwartz and Courtney Nickson. Las Vegas Strip Table Game Mix: The Evolution of Casino Games, 1985-2017. Las Vegas: Center for Gaming Research, University Libraries, University of Nevada Las Vegas, 2018.