The Evolution of Airborne Chemical and Radiological Remote...
29
Paul Lewis NGA/IBE/Special Projects 571-557-5468 [email protected] 1 The Evolution of Airborne Chemical and Radiological Remote Sensing For Emergency and Natural Disaster Response EPA & NGA Collaboration SPIE 2011 Remote Sensing Plenary Talk
Transcript of The Evolution of Airborne Chemical and Radiological Remote...
Paul Lewis
NGA/IBE/Special Projects
571-557-5468
1
The Evolution of Airborne
Chemical and Radiological
Remote Sensing
For Emergency and Natural
Disaster Response EPA
&
NGA
Collaboration
SPIE 2011 Remote Sensing Plenary Talk
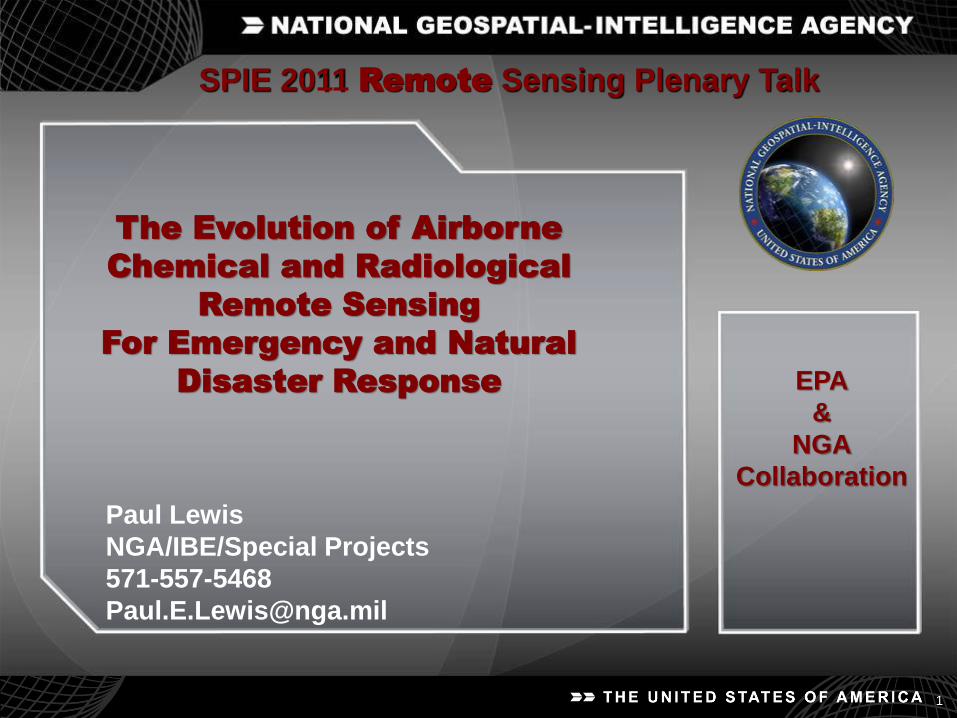
• Why We Need Airborne Emergency Response Capability
Evolution of Core Emergency Response Requirements
Integration & Dissemination of Airborne Data To First Responders
• The Current Aircraft Sensor Suite
• Our Dedicated Airborne Chemical and Gamma Emission Spectroscopy Research & Development Support Program
Capabilities, Technical Approaches
• What an Emergency Response Looks Like & What We Are Trying To Evolve
• Some Interesting Mission Examples illustrating chronologically the evolution of:
Emergency Response
Disaster Response
Remote Sensing Capabilities, Data analysis and Reporting timelines, Information dissemination via our
Situational Awareness Tool (SAT), Products & formats
• Evolution of Infrared Airborne Water Quality Assessment (WQA)
• Current & Planned Technology Upgrades for the ASPECT Program
2
Airborne Spectral Photometric Environmental Collection Technology (ASPECT) Program
Outline
The United States Only Airborne
24/7 Operational CIVIL Emergency Response Chemical, Radiological, & Imaging Mapping Capability
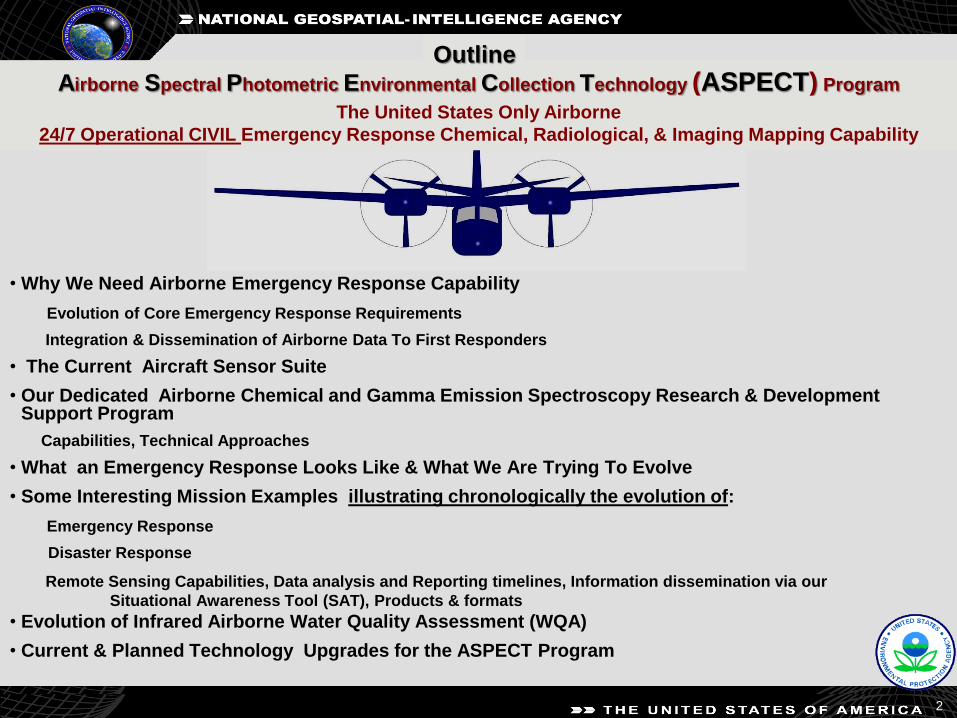
Standoff Detection: Chemical
Gamma Ray Radiological
Imagery: High resolution
Ortho-rectified
Airborne Data Collection: Rapid Response (dispatch)
Wheels Up in Under 1 Hour
Operate below clouds
Automatic Data Processing: Real (or Near Real) Time
Direct Integration of data: Local Incident Commander
Joint Operations Centers
Local
Federal
Data Telemetry: Basic
Advanced
How it All Started Airborne Chemical, Radiological,
& Imagery Analysis Products Are Considered By First Responders
To Be Essential Situational Awareness Information
Terra Chemical Explosion -
1994
Evolution of Core Requirements
3

Integration of Airborne Data and Products Directly
to First Responders and Joint Operation Centers
ASPECT Team
Conducts and Reviews
Analysis
EPA Dispatches Aircraft:
Emergency
Location
Mission Specific Info
Priorities
Real-Time Onboard
Analysis Results
Emergency
Operations
Commercial
Voice
&
Data
Telemetry
4
EPA Releases Data
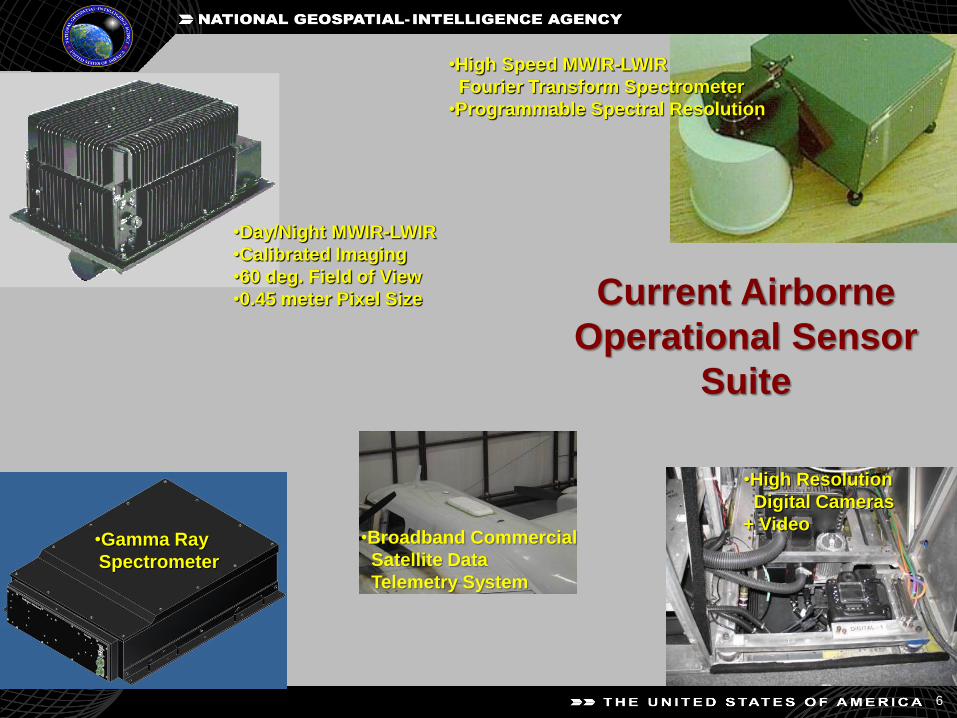
Current Airborne
Operational Sensor
Suite
•Day/Night MWIR-LWIR
•Calibrated Imaging
•60 deg. Field of View
•0.45 meter Pixel Size
•High Speed MWIR-LWIR
Fourier Transform Spectrometer
•Programmable Spectral Resolution
•High Resolution
Digital Cameras
+ Video
•Broadband Commercial
Satellite Data
Telemetry System
•Gamma Ray
Spectrometer
6
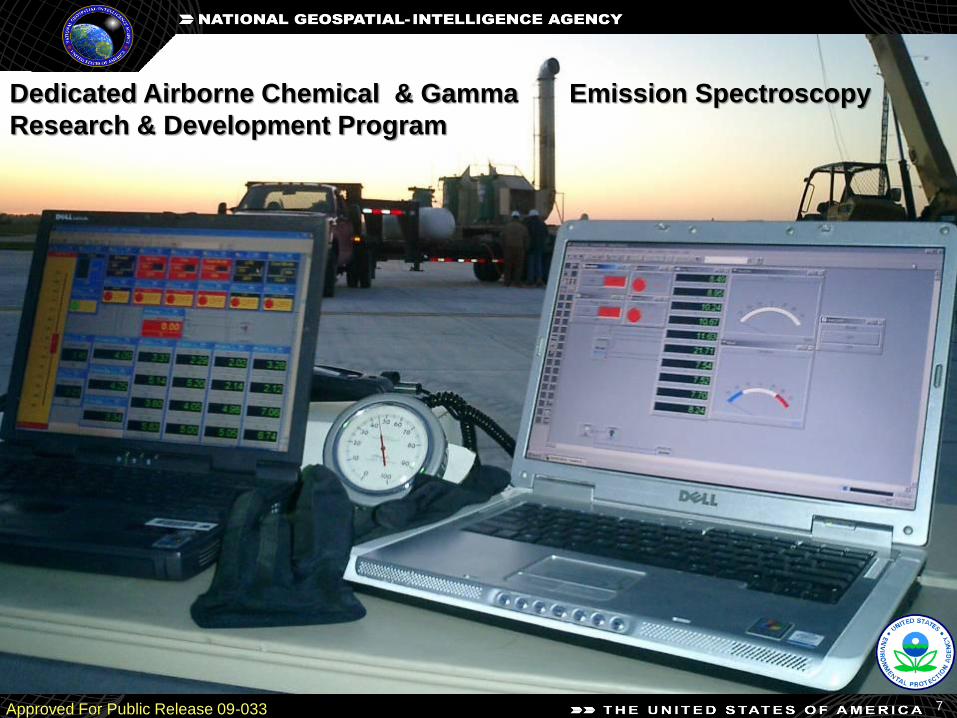
Dedicated Airborne Chemical & Gamma Emission Spectroscopy
Research & Development Program
Approved For Public Release 09-033 7

Page 7
Controlled Plume Emission Experimentation & Measurement
for Evolution Validation and Verification of Automated Airborne
Real-Time Chemical Vapor Analysis Software
Controlled Plume
Emission Source
Calibration
Target
Downwind
Plume
Temperature
Monitoring
Basket
Ground-Based Up-Looking
FT-IR
Weather
Station
Down Looking
FT-IR
9
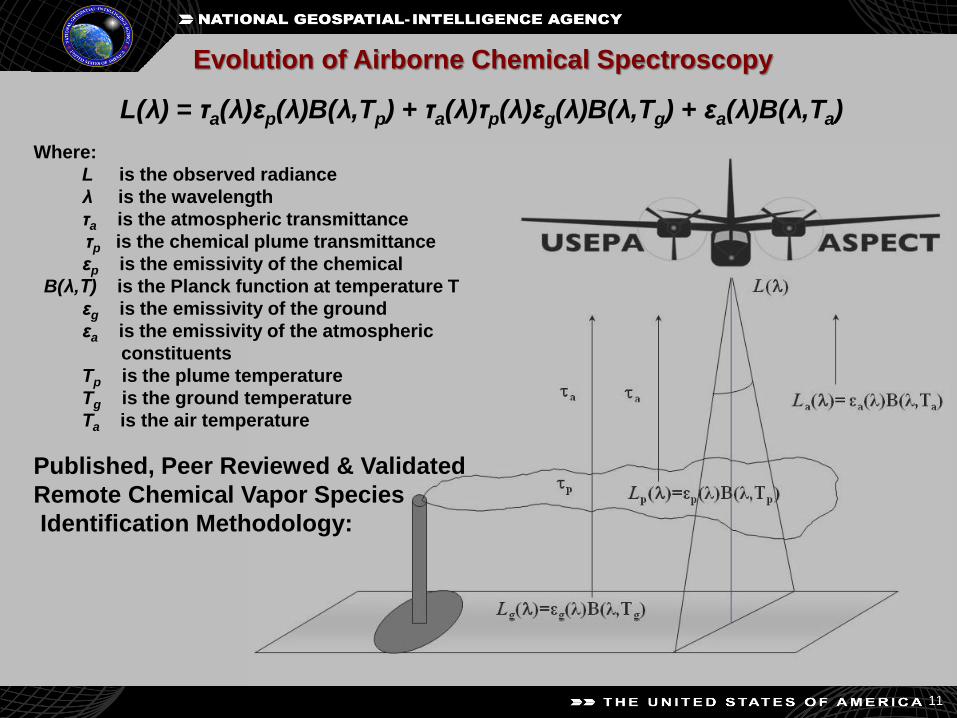
L(λ) = τa(λ)εp(λ)B(λ,Tp) + τa(λ)τp(λ)εg(λ)B(λ,Tg) + εa(λ)B(λ,Ta)
Where:
L is the observed radiance
λ is the wavelength
τa is the atmospheric transmittance
τp is the chemical plume transmittance
εp is the emissivity of the chemical
B(λ,T) is the Planck function at temperature T
εg is the emissivity of the ground
εa is the emissivity of the atmospheric
constituents
Tp is the plume temperature
Tg is the ground temperature
Ta is the air temperature
Published, Peer Reviewed & Validated
Remote Chemical Vapor Species
Identification Methodology:
Evolution of Airborne Chemical Spectroscopy
11
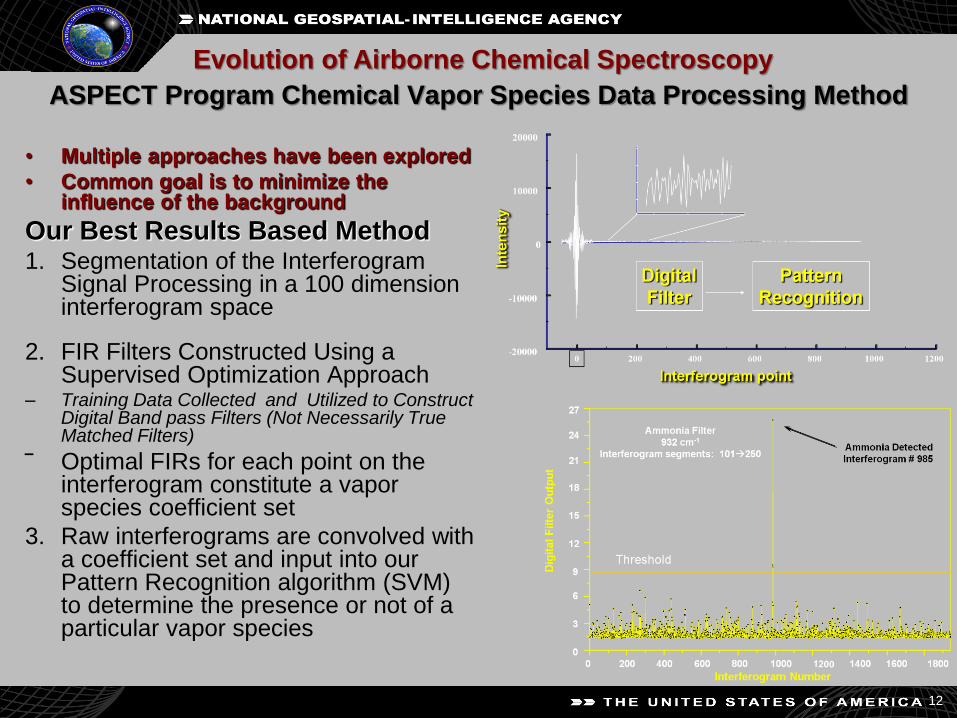
ASPECT Program Chemical Vapor Species Data Processing Method
• Multiple approaches have been explored
• Common goal is to minimize the influence of the background
Our Best Results Based Method 1. Segmentation of the Interferogram
Signal Processing in a 100 dimension interferogram space
2. FIR Filters Constructed Using a Supervised Optimization Approach
– Training Data Collected and Utilized to Construct Digital Band pass Filters (Not Necessarily True Matched Filters)
‾ Optimal FIRs for each point on the interferogram constitute a vapor species coefficient set
3. Raw interferograms are convolved with a coefficient set and input into our Pattern Recognition algorithm (SVM) to determine the presence or not of a particular vapor species
Evolution of Airborne Chemical Spectroscopy
12

Wavenumber = 3,333 2,000 1,250 714
micron
1 J = 6.24x10¹² MeV
0.624 MeV
14
Gamma Ray Spectrum Evolution of Airborne Gamma Ray Spectroscopy
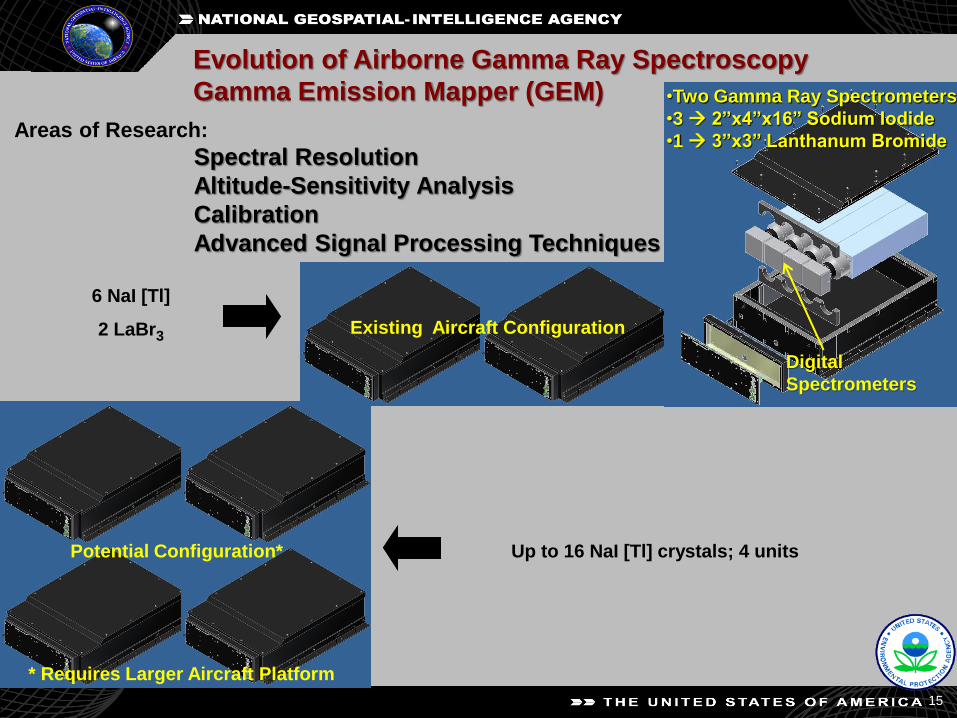
Existing Aircraft Configuration
6 NaI [Tl]
2 LaBr3
Up to 16 NaI [Tl] crystals; 4 units Potential Configuration*
* Requires Larger Aircraft Platform
•Two Gamma Ray Spectrometers
•3 2”x4”x16” Sodium Iodide
•1 3”x3” Lanthanum Bromide
Digital
Spectrometers
Evolution of Airborne Gamma Ray Spectroscopy
Gamma Emission Mapper (GEM)
Spectral Resolution
Altitude-Sensitivity Analysis
Calibration
Advanced Signal Processing Techniques
15
Areas of Research:
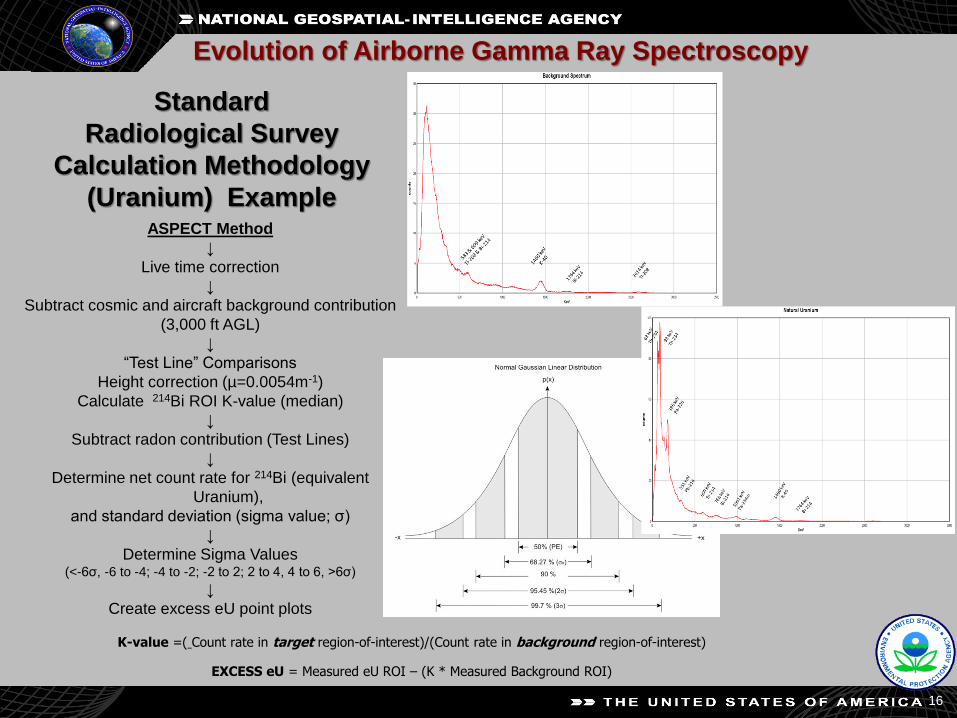
Standard
Radiological Survey
Calculation Methodology
(Uranium) Example ASPECT Method
↓
Live time correction
↓
Subtract cosmic and aircraft background contribution
(3,000 ft AGL)
↓
“Test Line” Comparisons
Height correction (µ=0.0054m-1)
Calculate 214Bi ROI K-value (median)
↓
Subtract radon contribution (Test Lines)
↓
Determine net count rate for 214Bi (equivalent
Uranium),
and standard deviation (sigma value; σ)
↓
Determine Sigma Values (<-6σ, -6 to -4; -4 to -2; -2 to 2; 2 to 4, 4 to 6, >6σ)
↓
Create excess eU point plots
K-value =( Count rate in target region-of-interest)/(Count rate in background region-of-interest)
EXCESS eU = Measured eU ROI – (K * Measured Background ROI) 16
Evolution of Airborne Gamma Ray Spectroscopy
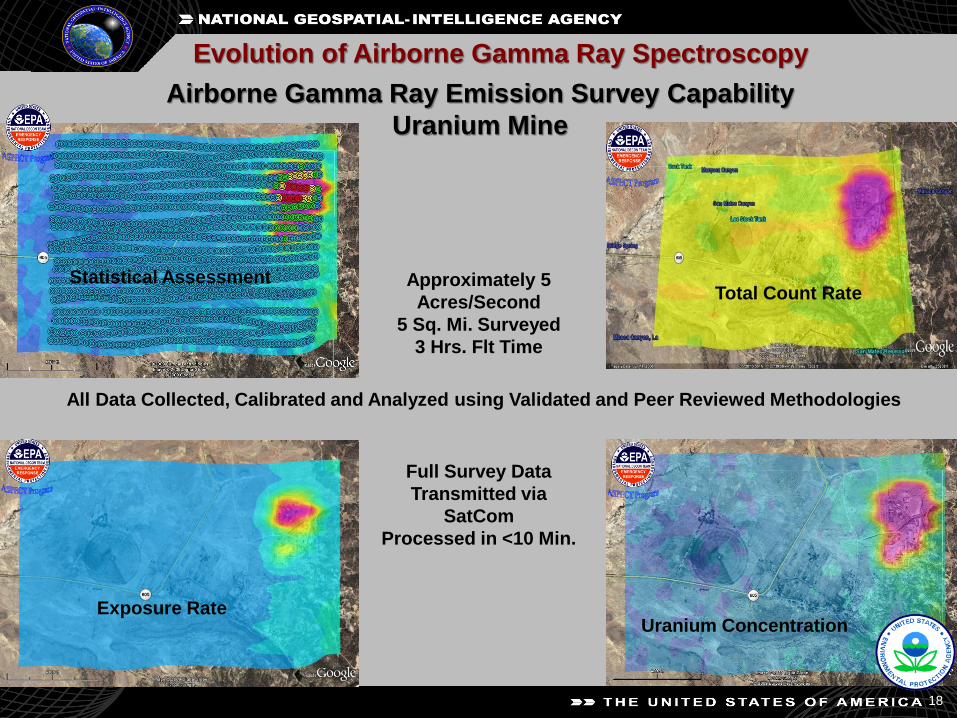
Airborne Gamma Ray Emission Survey Capability
Uranium Mine
Total Count Rate
Exposure Rate Uranium Concentration
Statistical Assessment
Evolution of Airborne Gamma Ray Spectroscopy
Approximately 5
Acres/Second
5 Sq. Mi. Surveyed
3 Hrs. Flt Time
All Data Collected, Calibrated and Analyzed using Validated and Peer Reviewed Methodologies
Full Survey Data
Transmitted via
SatCom
Processed in <10 Min.
18

What Does an Airborne Emergency Response look like?
Wavenumbers
% T
rans
mis
sion
Flight 2 - 17107P47 scans 1105-1111
640 720 800 880 960 1040 1120 1200 1280 1360 144099.76
99.8
99.84
99.88
99.92
99.96
100
100.04
100.08
100.12 ASPECT aircraft spectra
Compound ID 1,3-Butadiene
What are we evolving?
Data Telemetry &
Automated Analysis
Shortening
Reporting Timelines
Capabilities of the sensor suite
Scope of products produced
Airborne
Chemical, Radiological Spectroscopy
Airborne Remote Sensing
Applied to Emergency Response
19
Train Derailment Shepherdsville, KY January 2007
What Situational Awareness Information was needed

ASPECT was the first program to demonstrate the
Utility of a Google Earth® based data dissemination
and access capability Called SAT Tool, developed
specifically for Emergency Responders
Our SAT Tool is now considered as an accepted
standard by the Emergency Response Community
Google Earth application used to disseminate & access data
Available Airborne Sensor Suite Data
Ortho-rectified Color Imagery
Ortho-rectified Infrared Imagery Analysis
Products
Oblique aerial photography
Infrared Surface Oil Analysis Imagery
Infrared Surface Oil Trend Analysis Products
FT-IR Chemical Spectroscopy Data
FT-IR Chemical Analysis Information
Chemical Plume Analysis
Gamma Ray Spectroscopy Data
Gamma Ray Survey Information
Click ASPECT icon
Evolution of Airborne Mission Specific Data Products
Goal: Near-Real-Time data analysis & dissemination
of situational awareness products, information, & data
to first responders and joint operations centers
3-5 Micron Spectrum
20
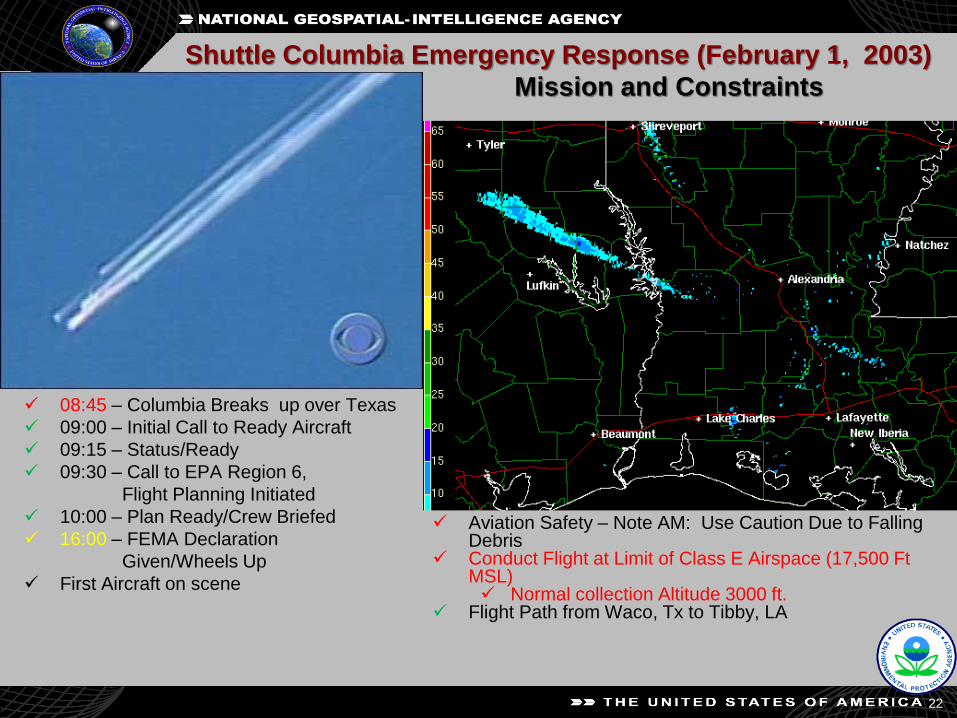
08:45 – Columbia Breaks up over Texas
09:00 – Initial Call to Ready Aircraft
09:15 – Status/Ready
09:30 – Call to EPA Region 6,
Flight Planning Initiated
10:00 – Plan Ready/Crew Briefed
16:00 – FEMA Declaration
Given/Wheels Up
First Aircraft on scene
Shuttle Columbia Emergency Response (February 1, 2003)
Mission and Constraints
Aviation Safety – Note AM: Use Caution Due to Falling Debris
Conduct Flight at Limit of Class E Airspace (17,500 Ft MSL) Normal collection Altitude 3000 ft.
Flight Path from Waco, Tx to Tibby, LA
22

Reference Spectra of
MonoMethyl Hydrazine
Blow-up of Circled Area
N31036’55” W94051’01”
Green Area
SW of
White Area
Indicates Detection
Shuttle Columbia Emergency Response (February 1, 2003)
Mission: Detection and Location of Hydrazine Tank
2003 - 22 missions to date
Land aircraft to process data
7-8 hour analysis & reporting time
Activation call up procedure in place
First aircraft on scene Successful chemical
detection and identification
Basic radiological detection capacity installed
Infrared linescanner image of possible Hydrazine location
Airborne FT-IR Spectrometer
Hydrazine Identification
23

2005 Hurricanes Katrina & Rita Disaster Response
Immediately After Landfall
•The ASPECT Aircraft was the first
reconnaissance aircraft on-scene
supporting FEMA Regions 4 & 6
•Mission Objectives:
Collect, process, & disseminate
Rapid Needs Assessment (RNA) data
to the Incident Command; 9 days,
15 missions, 64 Flt. Hrs.
•Concurrently conducted 5
emergency responses ranging
from fires to chemical releases
•Aspect Imagery & data briefed to
White House
•Incident command structure
not well organized
•Incident command structure
somewhat better organized
•Mission objectives:
More clearly defined,
provide RNA data on key
petrochemical facilities
to the Incident Command
•ASPECT team discovers several
active chemical releases,
data is rapidly forwarded to EPA
Region 6 and chemical facility
personnel all releases corrected
by facility response teams
•The ASPECT Aircraft was the first
reconnaissance aircraft on-scene
supporting FEMA Regions 4 & 6
Katrina August 29th Rita September 23rd
26
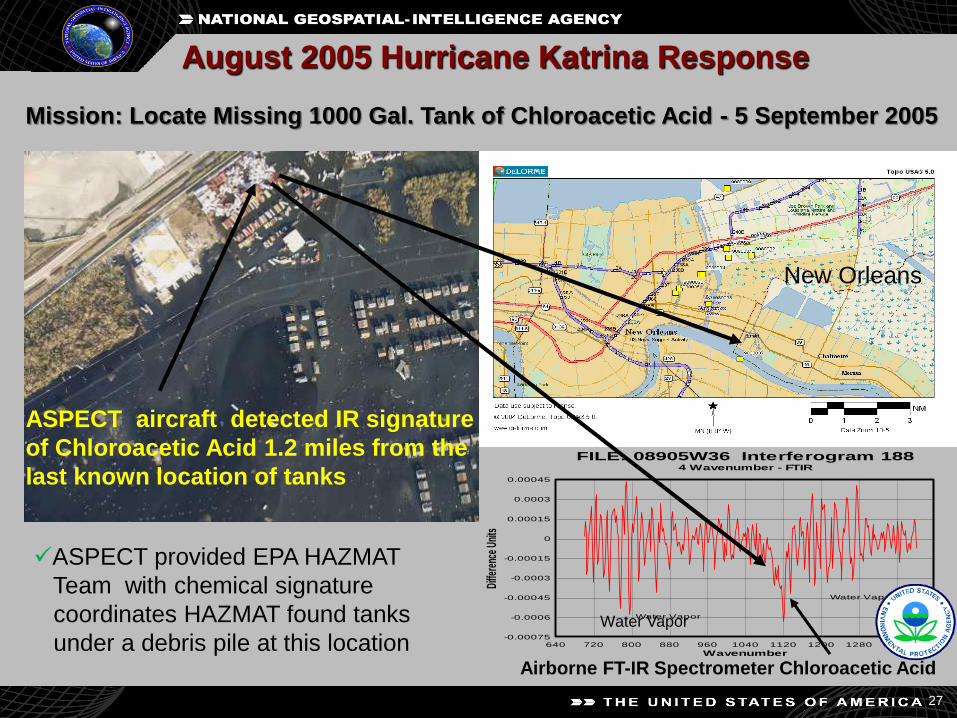
August 2005 Hurricane Katrina Response
Mission: Locate Missing 1000 Gal. Tank of Chloroacetic Acid - 5 September 2005
ASPECT aircraft detected IR signature
of Chloroacetic Acid 1.2 miles from the
last known location of tanks
New Orleans
Wavenumber
Diffe
renc
e Un
its
FILE: 08905W36 Interferogram 1884 Wavenumber - FTIR
640 720 800 880 960 1040 1120 1200 1280 1360 1440-0.00075
-0.0006
-0.00045
-0.0003
-0.00015
0
0.00015
0.0003
0.00045
Water Vapor
Water Vapor
Water Vapor
ASPECT provided EPA HAZMAT
Team with chemical signature
coordinates HAZMAT found tanks
under a debris pile at this location
27
Airborne FT-IR Spectrometer Chloroacetic Acid

Plume Classification and Identification
ICI Acrylics
30.013890 N
-94.02917 W
IR Multispectral
Linescanner Image
Wavenumbers
% T
rans
mitt
ance
FILE: 24905X21 1083FTIR Spectrum
640 720 800 880 960 1040 1120 1200 1280 1360 144097.5
98
98.5
99
99.5
100
100.5
101
AMMONIA
Ammonia
Release
Point
Visible Image N N
28
September 2005 Hurricane Rita
Mission: Petrochemical Infrastructure Damage Survey
Airborne FT-IR Spectrometer
Ammonia
ASPECT aircraft provided release point
coordinates & chemical effluent
information directly to EPA Region 6
Incident Command & the facility response
team
Ammonia release stopped by
facility response team

New Orleans Areas Under Water
August 2005
6 days after Hurricane Katrina
700 900 1100 1300
Wavenumbers
-0.0008
-0.0006
-0.0004
-0.0002
0.0000
0.0002
Diffe
renc
e Un
its
Glycol
Near Beaumont, Texas
September 2005
4 days after Hurricane Rita
Wavenumbers
Dif
fere
nc
e U
nit
s
700 800 900 1000 1100 1200 1300 1400-0.0014
-0.0012
-0.001
-0.0008
-0.0006
-0.0004
-0.0002
0
0.0002
0.0004
Glycol
Wavenumbers
Pe
rce
nt
Tra
ns
mis
sio
n
700 800 900 1000 1100 1200 1300 140096.6
96.8
97
97.2
97.4
97.6
97.8
98
98.2
98.4
98.6
98.8
Glycol
Coffeyville, Kansas Flooding
July 2007
4 days after flooding started
The FTIR spectrum is a close match to either propylene glycol,
2,3-butylene glycol, or ethylene glycol
Propylene glycol and 2,3-butylene glycol have extensive
documentation as fermentation products in the open scientific
literature.
The glycol spectra are only seen above standing water after 4
to 5 days with associated high temperatures.
Future investigations will focus on whether the glycol spectral
signature is an indicator of high biological activity in flood
waters.
These measurements may have utility for health resource
deployment after large floods or hurricane events.
Evolution of Infrared Airborne
Water Quality Assessment (WQA) First in the published literature Kroutil, R., Lewis, P. E., Thomas, M. J.,
Miller, D., Shen, S., Curry, T., "Preliminary
assessment of the utility of airborne infrared
spectroscopic analysis of emissions from a
variety of flooded areas in the United
States" in Imaging Spectrometry XII, edited
by Sylvia S. Shen, Paul E. Lewis,
Proceedings of SPIE Vol. 6661 (SPIE,
Bellingham, WA 2007) 66610K.
2008 - 84 missions to date
1 Hour turn around of data
Change of commercial
satellite data system
Redesign of airborne data
processing software to
one step processing
24 compound auto-search-chem-library
Implementation of
Google Earth based SAT Tool
Redesigned Geo-rectification code
Hurricane IKE, 2 TB of Data
31

US Coast Guard Houma
US Coast Guard Mobile
NOAA
State of Louisiana
State of Mississippi
British Petroleum
EPA Region 4
EPA Region 6
EPA Headquarters
Deepwater Horizon Disaster Response April 28 to August 3, 2010
98 Days of continuous airborne operations under the direction of the National Response Incident Command Required temporary outfitting of second aircraft to support optimization of surface oil skimming
operations (used ASPECT backup instruments) 86 survey flights
3087 data collection runs 294 flight hours
2,544,000 infrared interferograms analyzed Over 4.5TB of data processed 14,972 digital photos 6,593 oblique photos 2,100 infrared images 372,000 unique users of the data Aspect Data Hosted by Google Earth ® Incident Command Users
Air quality monitoring during controlled burning of surface oil
Surface oil characterization and trend analysis
Optimize surface oil skimming operations
Missions:
32

Evolution of Automated data processing, dissemination, and user accessibility
Deepwater Horizon Oil Spill Google Earth Hosted Data
2010 - 105 missions to date
5 MINUTE turn around of data
New high speed satellite data system
50 Compound auto-search-chem-library
True on-board one step chemical/radiological
/photo processing
Full ortho-rectification
Optimization of Google Earth ® dissemination engine
Upgrade of radiological Sensors
33

Deepwater Horizon Oil Spill Disaster Response Mission: Air Quality Monitoring (during controlled oil burns)
The aircraft Fourier transform infrared (FTIR) spectrometer was used to detect vapor species in the air column
between the sea surface and the aircraft flying at 3000 ft during oil burning operations, collecting data both
downwind and over the burning oil source.
Analyses of the FTIR data showed:
Slightly elevated amounts of
Carbon dioxide, water vapor,
Carbon monoxide, Ozone
Trace amounts of 1,3-butadiene
& acetaldehyde.
*No polyaromatic hydrocarbons
(PAHs) detections in the air
column over & downwind
from oil burn sites
Hydrocarbons
CO2 and CO
bands
removed from
spectrum
Aldehyde
3-5 Micron Spectrum – Oil Fires May 19, 2010 2:19 PM CST
*Understanding the importance of not detecting
PAHs in the air column was extremely important
to recovery operations since PAHs are
hazardous to human health.
34
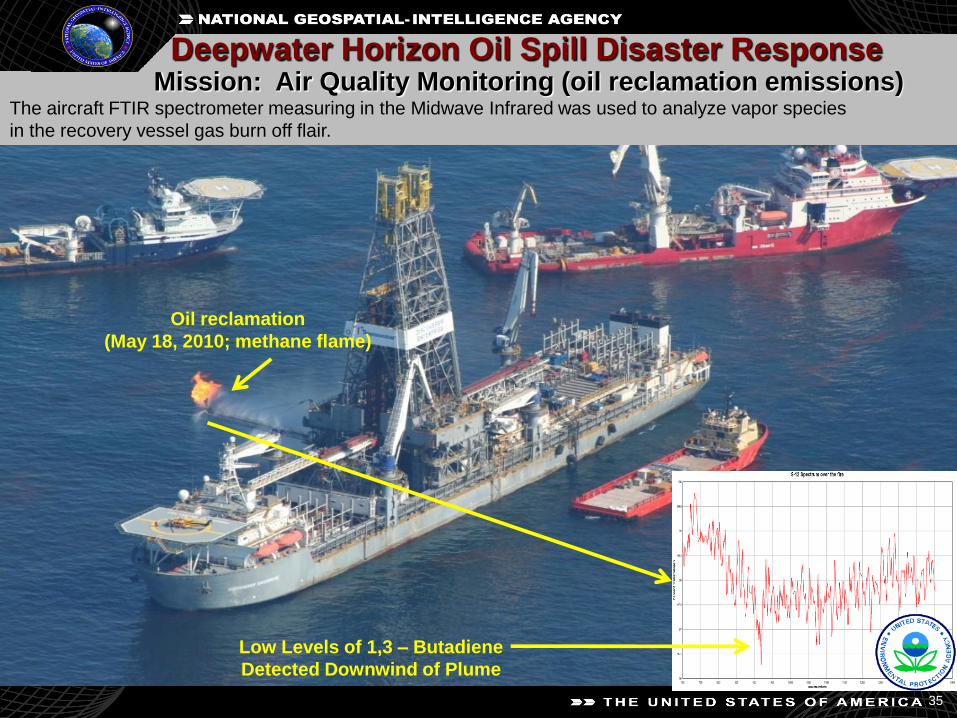
Deepwater Horizon Oil Spill Disaster Response Mission: Air Quality Monitoring (oil reclamation emissions)
The aircraft FTIR spectrometer measuring in the Midwave Infrared was used to analyze vapor species
in the recovery vessel gas burn off flair.
Oil reclamation
(May 18, 2010; methane flame)
Low Levels of 1,3 – Butadiene
Detected Downwind of Plume
35

Note: ASPECT did not detect
Methanol in the Gulf of
Mexico during this incident
at any other location
Deepwater Horizon Oil Spill Disaster Response Mission: Air Quality Monitoring (area around the sunken rig)
The aircraft FTIR spectrometer detected the presence of methanol in close proximity to the location of the well
head and where the ASPECT IR and Visible imagery shows the leaking well head oil reaching the surface
The detected methanol source is believed to be the release of
injected methanol by the British Petroleum (BP) Company at the
well head to prevent the formation of methane hydrates in the line
that funneled oil to a surface recovery ship during the well
capping process
Methanol Detections
for
May 9, 2010
Sunken Rig
Location
Methanol Spectrum
16 cm-1 Resolution
36

RED (surface oil) = 21.5%
GREEN (mixed oil/water) = 48.0%
BLUE (water) = 28.9%
CYAN (other) = 1.6%
ASPECT Designed Automated
Infrared Surface Oil Trend Analysis Tool
Automated Processing of IR Imagery
Rapid data turn around
No interpretation needed
Night Ops
Not severely affected by glare/glint
Enhances heavy & light oil
contamination
Provides percent oil coverage
automatically
Provides a quantitative metric for
conducting surface oil trend analysis
Missions:
Surface oil characterization
Surface oil trend analysis
Optimize surface oil skimming operations
Deepwater Horizon Oil Spill Disaster Response
37
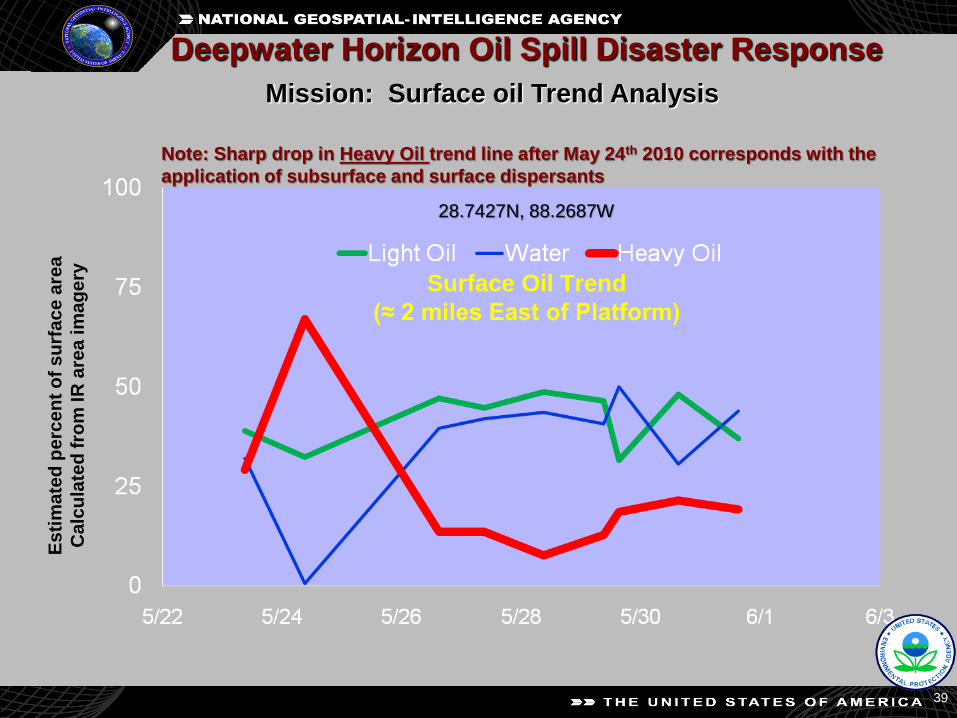
28.7427N, 88.2687W
Es
tim
ate
d p
erc
en
t o
f s
urf
ac
e a
rea
Ca
lcu
late
d f
rom
IR
are
a im
ag
ery
Deepwater Horizon Oil Spill Disaster Response
Mission: Surface oil Trend Analysis
Surface Oil Trend
(≈ 2 miles East of Platform)
Note: Sharp drop in Heavy Oil trend line after May 24th 2010 corresponds with the
application of subsurface and surface dispersants
39
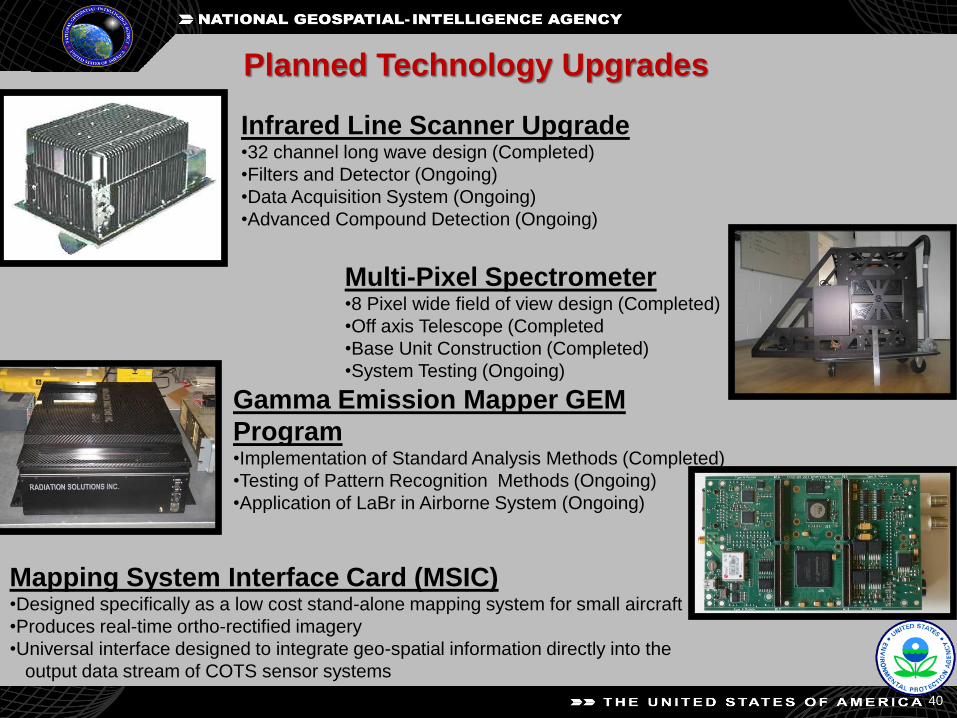
Infrared Line Scanner Upgrade •32 channel long wave design (Completed)
•Filters and Detector (Ongoing)
•Data Acquisition System (Ongoing)
•Advanced Compound Detection (Ongoing)
Multi-Pixel Spectrometer •8 Pixel wide field of view design (Completed)
•Off axis Telescope (Completed
•Base Unit Construction (Completed)
•System Testing (Ongoing)
Gamma Emission Mapper GEM
Program •Implementation of Standard Analysis Methods (Completed)
•Testing of Pattern Recognition Methods (Ongoing)
•Application of LaBr in Airborne System (Ongoing)
Planned Technology Upgrades
Mapping System Interface Card (MSIC) •Designed specifically as a low cost stand-alone mapping system for small aircraft
•Produces real-time ortho-rectified imagery
•Universal interface designed to integrate geo-spatial information directly into the
output data stream of COTS sensor systems
40