The Evolution and Testing of an Aerovalve Pulsejet Engine
166
Theses - Daytona Beach Dissertations and Theses 10-1995 The Evolution and Testing of an Aerovalve Pulsejet Engine The Evolution and Testing of an Aerovalve Pulsejet Engine Gregory V. Meholic Embry-Riddle Aeronautical University - Daytona Beach Follow this and additional works at: https://commons.erau.edu/db-theses Part of the Aerospace Engineering Commons Scholarly Commons Citation Scholarly Commons Citation Meholic, Gregory V., "The Evolution and Testing of an Aerovalve Pulsejet Engine" (1995). Theses - Daytona Beach. 142. https://commons.erau.edu/db-theses/142 This thesis is brought to you for free and open access by Embry-Riddle Aeronautical University – Daytona Beach at ERAU Scholarly Commons. It has been accepted for inclusion in the Theses - Daytona Beach collection by an authorized administrator of ERAU Scholarly Commons. For more information, please contact [email protected].
Transcript of The Evolution and Testing of an Aerovalve Pulsejet Engine

Theses - Daytona Beach Dissertations and Theses
10-1995
The Evolution and Testing of an Aerovalve Pulsejet Engine The Evolution and Testing of an Aerovalve Pulsejet Engine
Gregory V. Meholic Embry-Riddle Aeronautical University - Daytona Beach
Follow this and additional works at: https://commons.erau.edu/db-theses
Part of the Aerospace Engineering Commons
Scholarly Commons Citation Scholarly Commons Citation Meholic, Gregory V., "The Evolution and Testing of an Aerovalve Pulsejet Engine" (1995). Theses - Daytona Beach. 142. https://commons.erau.edu/db-theses/142
This thesis is brought to you for free and open access by Embry-Riddle Aeronautical University – Daytona Beach at ERAU Scholarly Commons. It has been accepted for inclusion in the Theses - Daytona Beach collection by an authorized administrator of ERAU Scholarly Commons. For more information, please contact [email protected].

THE EVOLUTION AND TESTING OF AN AEROVALVE
PULSEJET ENGINE
by
Gregory Vincent Meholic
A Thesis Submitted to the
Aerospace Engineering Department
in Partial Fulfillment of the Requirements for the Degree of
Master of Science in Aerospace Engineering
Embry-Riddle Aeronautical University
Daytona Beach, Florida
October 1995

UMI Number: EP31943
INFORMATION TO USERS
The quality of this reproduction is dependent upon the quality of the copy
submitted. Broken or indistinct print, colored or poor quality illustrations
and photographs, print bleed-through, substandard margins, and improper
alignment can adversely affect reproduction.
In the unlikely event that the author did not send a complete manuscript
and there are missing pages, these will be noted. Also, if unauthorized
copyright material had to be removed, a note will indicate the deletion.
®
UMI UMI Microform EP31943
Copyright 2011 by ProQuest LLC All rights reserved. This microform edition is protected against
unauthorized copying under Title 17, United States Code.
ProQuest LLC 789 East Eisenhower Parkway
P.O. Box 1346 Ann Arbor, Ml 48106-1346

THE EVOLUTION AND TESTING OF AN AEROVALVE PULSEJET ENGINE
by
Gregory Vincent Meholic
This thesis was prepared under the direction of the candidate's thesis committee chairman, Dr. L. L. Narayanaswami, Department of Aerospace Engineering, and has been approved by the members of his thesis committee. It was submitted to the Department of Aerospace Engineering and was accepted in partial fulfillment of the requirements for the degree of Master of Science in Aerospace Engineering.
THESIS COMMITTEE:
Dr L. L. Narayaffaswami Chairman
Dr. Tej R. Gupta Member
^IA/Q.
cJ^^^/l^r- I Ll^^ -U Dr. R. Luther Reisbig Member
Dr. David T. Kim Chair, MSAE Program
/c/i Y/QI' Dr. Allen I. Ormsbee Date Department Chair, Aerospace Engineering
ii

ACKNOWLEDGMENTS
I would like to express my sincerest love and gratitude to my parents
Monica and Ken and my step parents Paul and Gayle for their wonderful support
and assurance through my education and for this project.
My great appreciation and sincerest thanks go to my thesis advisor Dr. L.
L. Narayanaswami for sharing his knowledge, recommendations, and
enthusiastic support of my work. His encouragement strengthened my focus and
helped to keep me within reasonable bounds of my thesis research. I am very
proud to have been a student of his and to have worked closely with him in many
endeavors. Equal gratitude goes to my thesis committee mentors Dr. Tej R.
Gupta and Dr. R. Luther Reisbig to whom I am indebted for their assistance and
guidance through my education and in the production of this project.
Mr. Donald Bouvier deserves my highest appreciation and gratitude for
his assistance in the construction of the pulsejet. He has become a valued
friend and has graciously shared his machining expertise and experience.
Special thanks go to Professor John Novy and Dr. Ernest Jones for their
cooperation in providing technical assistance and research material.
I would also like to give special recognition to Mr. Roy Lumb, the turbine
engine test facility instructor, for his insight and supervision while running the
pulsejet. High regards go to Mr. Andrew Roberts who patiently assisted me on
many occasions during testing. Funding for this project was granted from
iii

Professor David Hazen, chairman of the Aerospace Engineering department, to
which I extend my grandest appreciation.
My deepest love and thanks also go to Ms. Ivana Hrbud whose
unbounded inspiration lead me through impatient times. She has become a very
important part of my life and means more to me and this project than she will
ever know.
In conclusion, the following businesses have been an instrumental part of
the research and deserve many thanks for their help and generosity:
A&W Muffler, Atlas Welding, Baker Brothers Refrigeration, Daytona Bolt
and Nut, Daytona Gas, Discount Auto Parts, Ferran Engineering, Jenks Metals,
Pameco R&R Supply, Radio Shack, Ridgewood Shell, Sid Harvey Industries,
Southside Auto Parts, Wal-Mart, and W. W. Grainger, Inc.
IV

ABSTRACT
Author: Gregory V. Meholic
Title: The Evolution and Testing of an Aerovalve Pulsejet Engine
Institution: Embry-Riddle Aeronautical University
Degree: Master of Science in Aerospace Engineering
Year: 1995
The goal of this project was to develop and test a self-aspirating
aerovalve pulsejet and measure its operating characteristics. An investigation of
pulsejets developed by previous experimenters revealed design trends
associated with the engine geometry. These trends were followed in the
development of an aerovalve pulsejet engine entitled the Astra. The engine
employed variable fuel injection methods, ignition location and exhaust pipe
length to show that certain combinations of geometry relations and fuel injection
methods were more conducive to pulse combustion. Even though the engine
pulsed with forced inlet air, the Astra did not self-aspirate as did the engines on
which its design was based due to insufficient mixing of fuel and air. Data
regarding combustion chamber pressures and temperatures were collected to
verify pulsating behavior. The project also included extensive documentation of
engine design changes and experimentation to serve as a guideline for future
aerovalve pulsejet developers.

TABLE OF CONTENTS
ACKNOWLEDGMENTS Hi
ABSTRACT v
LIST OF TABLES ix
LIST OF FIGURES x
CHAPTER 1 INTRODUCTION 1
1.1 Research Goals 1 1.2 Overview of Pulse Combustion Research 1 1.3 Thesis Summary 3
CHAPTER 2 PULSE COMBUSTION PRINCIPLES AND DEVICES 4
2.1 General Observations About Pulse Combustion 4 2.1.1 The Basics of Pulse Combustion 4 2.1.2 Pulse Combustor Model and Function 5 2.1.3 Thermodynamic Analysis 8 2.1.4 Pressure Magnitudes and Frequency 11
2.2 Pulse Combustors and Pulsejets 13 2.3 Pulsejet Components and Operating Cycle 14
2.3.1 Components 14 2.3.2 Operating Cycle 15
2.4 Types of Pulsejets 18 2.4.1 Mechanically-Valved Pulsejets 19 2.4.2 Aerodynamically-Valved Pulsejets 21
2.5 Comparison of Pulsejets to Other Propulsion Systems 24 2.6 Applications of Pulsejets 26 2.7 Variables Affecting Pulsejet Performance 27
2.7.1 Inlet Lip Shape 27 2.7.2 Inlet Pipe Length 28 2.7.3 Inlet Pipe Cross-Sectional Area 29 2.7.4 Combustion Chamber Geometry 29
2.7.4.1 Inlet Bulkhead 30 2.7.4.2 Combustor 31 2.7.4.3 Exhaust Nozzle 32
2.7.5 Exhaust Pipe Geometry 33 2.7.6 Fuel/Air Mixing Characteristics 34
v i

2.8 Trends in Pulsejet Design 37 2.8.1 Variable Definition 37 2.8.2 Inlet Relationships 39 2.8.3 Exhaust Relationships 40 2.8.4 General Observations 42
CHAPTER 3 DEVELOPMENT OF EXPERIMENTAL PULSEJET 45
3.1 Pulsejet Research Objective History 45 3.2 Engine Development and Configuration 49
3.2.1 Baseline Lockwood Engine 49 3.2.2 Using the Trends in Pulsejet Design 51
3.3 Astra General Design Considerations 52 3.3.1 Material Selection Concerns 52
3.3.1.1 Heat Exposure 52 3.3.1.2 Machining Ability 53 3.3.1.3 Material Cost and Availability 54
3.3.2 Off-the-Shelf Parts and Part Modification 54 3.3.3 Engine Vibration and Hardware 55
3.4 Final Astra Layout and Components 55 3.4.1 Part 1: Inlet Lip 57 3.4.2 Part 2: Inlet Pipe 58 3.4.3 Part 3: Inlet Bulkhead 58 3.4.4 Part 4: Combustor 59 3.4.5 Part 5: Exhaust Nozzle 59 3.4.6 Parts 6 and 7: Inner and Outer Exhaust Pipes 60 3.4.7 Parts 8, 9 and 10: Assembly/Mounting Rings and Gaskets 61 3.4.8 Parts 11 and 12: Fuel Injector and Spark Plug Mounting Plates 62 3.4.9 Parts 13 and 14: Fuel Injector Housing and Fuel Injectors 63
3.4.9.1 Part 14A: Axial Fuel Injection Assembly 64 3.4.10 Part 15: Fuel Injector Mounting Plate Plugs 65
CHAPTER 4 SUPPORT SYSTEMS, SAFETY AND TESTING FACILITY 66
4.1 Support Systems 66 4.1.1 The Fuel System 66
4.1.1.1 Choosing the Right Fuel 67 4.1.1.2 Propane Tank and Throttle Valves 68 4.1.1.3 High-Pressure Hose 69 AAA A Check Valve and Pressure Gauge 70 4.1.1.5 Fuel Injector Housings and Fuel Injectors 70
4.1.2 The Ignition System 71 4.1.2.1 The Power Box 71
v i i

4.1.3 The Air System 72 4.2 Safety Concerns 73 4.3 Testing Facility 75
CHAPTER 5 ENGINE TESTING AND RESULTS 76
5.1 Original Engine Configuration 76 5.2 Test History of the Astra 78 5.3 Data Acquisition Equipment Setup 104
5.3.1 General Layout 104 5.3.2 Fuel and Air Inlet Pressures 105 5.3.3 Pressure Across the Engine 105 5.3.4 Combustion Pressure Variation 106 5.3.5 Temperature Measurements 107
5.4 Data Acquisition Procedure 107 5.5 Testing Results 110
5.5.1 Fuel and Air Inlet Pressure 110 5.5.2 Total Pressure Measurement at Inlet (hTiN) and Exhaust (hTEx).. 112 5.5.3 Combustion Temperatures 113 5.5.4 Combustion Pressure Traces 117
5.5.4.1 Oscilloscope Plot Description 117 5.5.4.2 Pressure Signal Trace 117
5.5.5 Pulse Combustion Verification 121 5.5.6 Engine Frequency 122 5.5.7 Operating Pressures (Max. Peak-to-Peak and Avg. Voltages) 123
CHAPTER 6 CONCLUSIONS AND RECOMMENDATIONS 124
6.1 Conclusions 124 6.1.1 Engine Geometry 124 6.1.2 Combustion Conditions 126
6.2 Recommendations 127
REFERENCES 128
APPENDIX A ASTRA CONSTRUCTION DRAWINGS 130
APPENDIX B PROPERTIES OF LIQUEFIED PETROLEUM GAS 140
APPENDIX C RAW DATA FROM THREE-PHASE TESTING 142
APPENDIX D THERMOCOUPLE & PRESSURE GAUGE CALIBRATION 150
v i i i

LIST OF TABLES
Table 2-1. Pulsejet Inlet Relationships 40 Table 2-2. Pulsejet Exhaust Relationships 41 Table 2-3. General Pulsejet Relationships 43 Table 3-1. Geometric Comparison of Lockwood and Astra Engines 51 Table 5-1. Astra Data at Various Operating Conditions 111
ix

LIST OF FIGURES
Figure 2-1. Pulse Combustor Model 6 Figure 2-2. Pulse Combustor Cycle 7 Figure 2-3. Otto Cycle Diagrams 8 Figure 2-4. Pulse Combustion Cycle Diagrams 9 Figure 2-5. Pulse Combustion Pressure Signature 12 Figure 2-6. Simple Pulsejet 15 Figure 2-7. Pulsejet Cycle 16 Figure 2-8. Argus 109 Mechanically-Valved Pulsejet 19 Figure 2-9. Argus Engine Cycle 20 Figure 2-10. Marconnet Aerovalve Pulsejet 22 Figure 2-11. SNECMA Escopette 23 Figure 2-12. SNECMA Ecrevisse 23 Figure 2-13. Lockwood U-Tube and Thrust Augmentors 24 Figure 2-14. Aerovalve Inlet Shapes 28 Figure 2-15. Combustion Chamber Components 30 Figure 2-16. Pulsejet Geometry Variables 38 Figure 3-1. Ported-Rotor Valve Cycle 46 Figure 3-2. Lockwood Model HH(5.25")-5 Aerovalve Engine 50 Figure 3-3. Astra Experimental Engine 51 Figure 3-4. Astra Component Assembly 56 Figure 3-5. Inlet Lip Cross-Section 58 Figure 3-6. Pressure Ring Assmebly 61 Figure 4-1. Fuel System Schematic 67 Figure 4-2. Ignition System Schematic 71 Figure 5-1. Astra Component Assembly with Ported-Rotor Valve System 77 Figure 5-2. Interchangeable Inlet Pipe Concept 83 Figure 5-3. Inlet Pipe and 45-Degree Inlet Bulkhead 95 Figure 5-4. Crimped-End Fan-Pattern Fuel Injectors 96 Figure 5-5. Opposing Fan-Pattern Fuel Injectors 100 Figure 5-6. Axially-lnjecting Central Fuel Nozzles 101 Figure 5-7. Data Acquisition Equipment Setup 105 Figure 5-8. Combustion Temperature Versus Combustor Length 115 Figure 5-9. Oscilloscope Traces of Combustor Pressure Variation 118
x

CHAPTER 1
INTRODUCTION
1.1 Research Goals
The goal of this project is to develop and test a self-aspirating aerovalve
pulsejet and measure its operating characteristics. An investigation will also be
conducted into pulsejet design trends established by previous experimenters to
demonstrate that experimental conclusions regarding pulsejets may sometimes
differ from those of the governing theory. In addition, the project includes
extensive documentation of design changes made during the experimental stage
of the work to provide an evolutionary history of the engine configuration. The
purpose of this task is to provide a developmental record of an aerovalve
pulsejet to serve as a guideline for future pulsejet developers.
1.2 Overview of Pulse Combustion Research
Pulse combustion is similar to the well-observed and widely-known
phenomenon of combustion-driven oscillation (first noted around 1800), but has
only been researched since the turn of the century. The most significant
difference is that pulse combustion can be used to produce work where
1

2
combustion-driven oscillations cannot (Ref. 1). This observation leads to the
development of pulse combustion devices such as pulsejet engines for
propulsion and pulse combustors for heat generation.
Although many companies and individuals experimented with pulse
combustion in the 1940's and 1950's, some of the work later found to be
significant in pulse combustor development was insufficiently documented. The
companies or individuals associated with the "new" science of pulse combustion
eventually redirected their focuses due to lack of funding, interest and profitable
applications. In addition, the unfavorable reputation of pulsejets established by
the German V-1 "buzz bombs" made pulse combustion an unpopular and little-
understood science. As a result of these issues, only a limited number of
studies have been conducted on pulse combustors and pulsejets, and the
available information is sometimes vague or incomplete.
Most of the literature researched for this project employed pulsejets to
observe various pulse combustion characteristics. These reports described the
design of the device, the experimental goals and procedure, and the results.
The pulsejets used in the experiments were independently developed by various
researchers and none of the documentation described how the engines were
developed or if any problems were encountered during testing.

3
1.3 Thesis Summary
The theory and operation of pulse combustion devices will be discussed
in Chapter 2. Also in this chapter will be a review of aerovalve engine design
trends found in literature. Chapter 3 will describe the experimental engine built
for this project and all of its associated components. Chapter 4 will focus on the
facility where the engine experimentation was conducted and the safety issues
concerned with such tests. This chapter will also describe the support systems
necessary for the engine function (fuel, ignition and air systems). The history of
the engine design will then be given in Chapter 5 along with the experimental
results of the engine's operating characteristics. Chapter 6 will discuss the
conclusions made from the project and evaluate future recommendations for its
continuation.

CHAPTER 2
PULSE COMBUSTION PRINCIPLES AND DEVICES
This chapter will describe the theories governing pulse combustor and
pulsejet operation as well as the differences between the two. The discussion
will then focus on types of pulsejets, their advantages over other types of
propulsion, applications, and the variables that control their function.
2.1 General Observations About Pulse Combustion
2.1.1 The Basics of Pulse Combustion
One of the simplest ways to understand pulse combustion is to observe a
camping lantern or any device utilizing a retractable, flammable wick. When a
burning wick is sufficiently raised above its housing, the flame is steady and
exhibits stability even during modest disturbances. The surrounding air is being
consumed with the fuel such that the flame draws as much air as it requires to
maintain itself. The fuel/air mixture ratio is constant and the flame burns robust.
As the wick is lowered into the housing, the area of the flame exposed to the air
is reduced and the flame burns less intense as the mixture becomes fuel rich.
Eventually, the flame stability will reach a lower limit and will enter a pulsation
4

5
mode, which the author has frequently observed with residential space heaters
and wick-burning lamps. This usually occurs when the flame is just about to
enter the housing. Fully retracting the wick would cause the mixture to become
too rich for combustion and the flame would extinguish. At the pulsation point,
the flame tries to draw the surrounding air to burn with the rich zone around the
wick. When sufficient air arrives, the flame burns more robust while consuming
the fresh supply. The air is expended, the air pressure surrounding the flame
falls, and the flame again draws in a new supply of air. This cycle repeats
several times a second.
A steady flame causes little variation in stagnation pressure. Inside a gas
turbine engine combustor, for example, where the pressures can be 15 times
greater than ambient, the steady flame causes little variation. During the
combustion phase of the pulse cycle, however, the pressure rises sharply due to
the constant-volume nature of the process discussed later in Section 2.1.3. This
rise in stagnation pressure can be observed as a measurable, usable force.
2.1.2 Pulse Combustor Model and Function
Pulse combustion can also be observed in wickless burners, the simplest
being the "jam pot" combustor developed by Reynst and shown in Ref. 1. A
small portion of gasoline is poured into a glass container onto which a lid with a
hole at the center is placed. When a match is held near the hole the fuel vapors
ignite and the flame pulses, following the same principle as the lantern. An

6
extension of the concept is to contain the flame inside a chamber with an air
source, fuel nozzle, ignition source, and exhaust path. The containment of the
flame and the subsequent pressure variation form the basis for a typical pulse
combustor (Figure 2-1).
Fuel source v , Ignition source.
/ miit L | I Exhaust / Combustion
chamber
Figure 2-1. Pulse Combustor Model
Figure 2-2 demonstrates the cycle of a pulse combustor. As the
combustor is functioning, air is drawn from the inlet into the combustion chamber
on the low-pressure valley of the cycle (2-2a). The inertia of the incoming air
slightly compresses the residual gases in the chamber left over from the
previous cycle. At the same time mixing with a new fuel charge also occurs.
The low pressure also pulls hot gases from the exhaust pipe back into the
chamber, helping the compression process even further (2-2b). When the hot
exhaust gases arrive inside the chamber, the mixture ignites and causes an
even greater pressure rise in the combustion chamber (2-2c). This high-
pressure forces the combustion products out through the inlet and exhaust pipes
(2-2d). The combustion pressure drops and the cycle repeats. Pulse

7
mW^A::\^>m^^ Fuel
Residual gases
(a)
;:'::':'/^km. Mixture
Tjmm
(b)
W/MMK
O 0
0 O 0
(d)
Figure 2-2. Pulse Combustor Cycle

8
combustors can function with or without moving parts and are usually self-
aspirating. Further details on pulse combustors are given in Section 2.2.
2.1.3 Thermodynamic Analysis
Reciprocating engines obey either air-standard Otto or Diesel cycles and
gas generators operate under the Brayton cycle. These three cycles take in air,
compress it, mix and combust the air with fuel, and exhaust the products while
producing work. Figure 2-3a represents the pressure-volume (P-v) diagram and
2-3b the temperature-entropy (T-s) diagram for the Otto cycle (gasoline engines)
as shown in Ref. 12. Although variations of these cycles cause the diagrams to
shift in some direction, they all have the same four steps. Step 4-1 represents
air intake, 1-2 compression, 2-3 combustion, and 3-4 expansion.
3
/ . \ constant s
2 A ^ - -constant s
4
* ,
constant v J
2
/
^J^7 \ \
3
/
4 1 constant v
(a) (b)
Figure 2-3. Otto Cycle Diagrams

The operational cycle of a pulse combustor combines the processes of
the Otto and Diesel cycles. As in the Otto cycle, constant entropy occurs in the
expansion and exhaust phases of pulse combustion. The property of the Diesel
cycle associated with pulse combustors is the ignition of the combustion mixture
by a rise in pressure and temperature of the residual gases, and not by an
external source. Figure 2-4a and 2-4b illustrate the P-v and T-s diagrams of a
pulse combustor cycle.
constant s constant v /
•3 (a) (b)
Figure 2-4. Pulse Combustion Cycle Diagrams
The figure above illustrates only a three-step process when there are
indeed four. The intake and compression processes are combined since they
occur at the same time, thus point 2 on the diagrams is actually points 1 and 2
and point 1 on the diagrams is actually point 4 if comparison to a four-step cycle
is made. During the intake/compression process represented by 1-2, the inlet
air column and a portion of the exhaust products both draw into the combustion
chamber and slightly compress the residual gases from the previous cycle (and

also a new fuel charge), as mentioned earlier. This causes a pressure rise and
a slight volumetric decrease of the trapped mixture. The hot gases then ignite
the new.fuel/air combination at the moment proper mixing has made it suitable
for combustion, and the cycle undergoes an isochoric process. Pressure,
temperature, and entropy rise sharply as shown in step 2-3. The last process of
gas expansion and exhaust, step 3-1, occurs as the combustion products
isentropically expand through the inlet and exhaust pipes. Combustor pressure
drops and the cycle begins again with a new charge of fresh air and fuel.
An explanation must be given about assuming that the combustion
process is isochoric. Putnam et al. (1), has observed that the pressure begins to
rise in the combustor as the combustion reaction flame rapidly expands during
the first half of the combustion cycle. Maximum pressure is reached when the
flame has completely filled the chamber. The pressure then begins to fall as the
combustion reaction flame wanes during the second half of the process and the
gases exit through the inlet and exhaust pipes. The isochoric assumption is
based on the observation that very little of the reaction products exit from the
combustor during the pressure-rise portion of the cycle.
A thermodynamic description of the pulse combustion cycle is given by
Winiarski (2). His paper investigated the thermal efficiency of an ideal pulse
cycle (with precompression effects) and compared its efficiency to other air-
standard cycles. Winiarski and others (Severyanin, Doyle and Faulkner, Gill
and Bhaduri, all given in Putnam [1]) also attempted to describe the pulse

11
combustion cycle as being driven by acoustics. This theory assumed that the
pressure variations and mixture ignition resulted from standing pressure waves
inside the combustion chamber. This was thought to be true in the early days of
pulse combustion analysis until functioning pulse combustors were developed
whose geometry prohibited standing waves from forming. As knowledge of the
combustion gas dynamics grew, it had been accepted that although acoustic
processes may assist the pulse cycle for combustors designed to support
standing waves, all pulse combustors operated on an air-standard cycle that
could be thermodynamically modeled.
2.1.4 Pressure Magnitudes and Frequency
Another way to look at pulse combustion is what has been called the "jet
pump" effect. The pulse cycle "pumps" air by using the combustion process to
vary the pressure inside the combustion chamber. Figure 2-5 shows that the
pressure variation during operation. Although acoustic resonance waves
(mostly generated from the exhaust pipe) and combustion unsteadiness slightly
distort the signal during the pressure peaks and valleys, Putnam etal. (1), has
shown that there is a general uniformity in the pressure signals from many types
and designs of pulse combustors with the only significant differences being in
firing rates and pressure magnitudes.

12
Figure 2-5. Pulse Combustion Pressure Signature
At the peak of this particular pressure cycle (immediately following
combustion), the pressure increases to around two atmospheres. After most of
the products have left the chamber, the pressure falls to about one-half an
atmosphere. This yields a mean pressure of one and a quarter atmospheres.
One of the research goals in pulse combustion has been to increase the mean
pressure by raising the peak pressure, thus creating a stronger jet pump effect
for a given fuel/air ratio. Since the intake and compression processes occur
simultaneously, however, compression of the new mixture prior to combustion
through aerodynamic or mechanical means without affecting the other steps in
the cycle has been most challenging.
Empirically determining the operating frequency of the pulse cycle has
often proved unsuccessful. Putnam et al. (1), has shown that several
mathematical models have attempted to approximate the frequency based on
various operating conditions and engine geometries, but their results do not
often compare well with experimental findings. Although some models have
done so successfully for a specific combustor design, the data deviate

13
unacceptably when any conditions are changed. Since the pulse cycle lacks
adiabatic conditions due to the rapid heat transfer between combustion gases in
all cycle phases, fundamental acoustic frequency and harmonic equations based
on combustor and exhaust pipe (or resonance tube) geometry could not be used
because they require the speed of sound. The constant-volume combustion
process and unsteadiness of the pulse cycle, however, dictate that the correct
temperature in determining the speed of sound must be higher than the
adiabatic flame temperature. An historical trend also shown by Putnam et al. (t),
indicates that most pulse combustors and pulsejets operate between frequencies
of 80 Hz and 150 Hz, with geometry and fuel type being the most significant
factors in combustor operating frequency.
2.2 Pulse Combustors and Pulsejets
Although pulse combustors and pulsejets operate on the same cycle,
there are differences in their design and application. Pulse combustors need not
be self-aspirating and can vary greatly in configuration. They are usually
designed to produce heat or for use in combustion research while often not
extracting work from the combustion reaction and the exhaust products. Pulse
combustor performance is somewhat dependent on combustion chamber
geometry and their exhaust pipes can be of any length, as shown by Putnam et
al. (1) (inlet pipe length is discussed in section 2.7.2). Employing pulse
combustion for heat production has been shown to be more efficient than steady

combustion due to greater flame temperatures, increased heat transfer rates,
and reduced nitrogen oxide (NOx) emissions (Putnam et al. [1]). Lennox
Industries of Allen, Texas has developed a pulse combustion home furnace that
uses only about half the fuel as a conventional gas furnace. The Lennox
furnace also extracts 96% of the heat from the combustion process to heat the
home, as stated by Merva (3).
Pulsejets are designed to use the stagnation pressure rise following
combustion as a propulsive force. They are always self-aspirating and generate
static thrust. Self-aspiration and thrust production occur via the jet pump effect
making pulsejet performance dependent on geometry with respect to mixing
dynamics and airflow (explained further in Section 2.7). The intake and exhaust
pipes of pulsejets have specific lengths such that they are "tuned" to the engine
frequency to optimize cycle efficiency, as in two-cycle gasoline engine and
Helmholtz resonator-type exhaust systems.
2.3 Pulsejet Components and Operating Cycle
2.3.1 Components
Most pulsejets without moving parts have three primary components: the
inlet pipe, the combustion chamber or combustor, and the exhaust pipe. Inside
the combustion chamber there are fuel nozzles and an ignition source only used
to start the engine. In keeping with the fact that the inlet and exhaust pipes must

15
have specific lengths based on combustion chamber size, a simple pulsejet is
shown in Figure 2-6 (not to scale).
Fuel S Ignition
< V Inlet \ Exhaust
c <£ / Combustion
chamber
Figure 2-6. Simple Pulsejet
The three primary components have circular cross-sections and are free
of any internal protrusions large enough to disrupt the airflow through the
engine. For reasons that will be explained in the following section, the inlet pipe
has a larger area than the exhaust pipe but is much shorter in length. The fuel
nozzles vary in size, shape, spray pattern, and location inside the chamber and
will be discussed further in Section 2.7.6. The ignition source is generally
located at the center or the aft end of the combustor.
2.3.2 Operating Cycle
The most significant difference between a pulse combustor cycle (Figure
2-2) and that of a pulsejet is the exhaust dynamics prior to the
intake/compression stage of the cycle. This effect is a direct result of engine
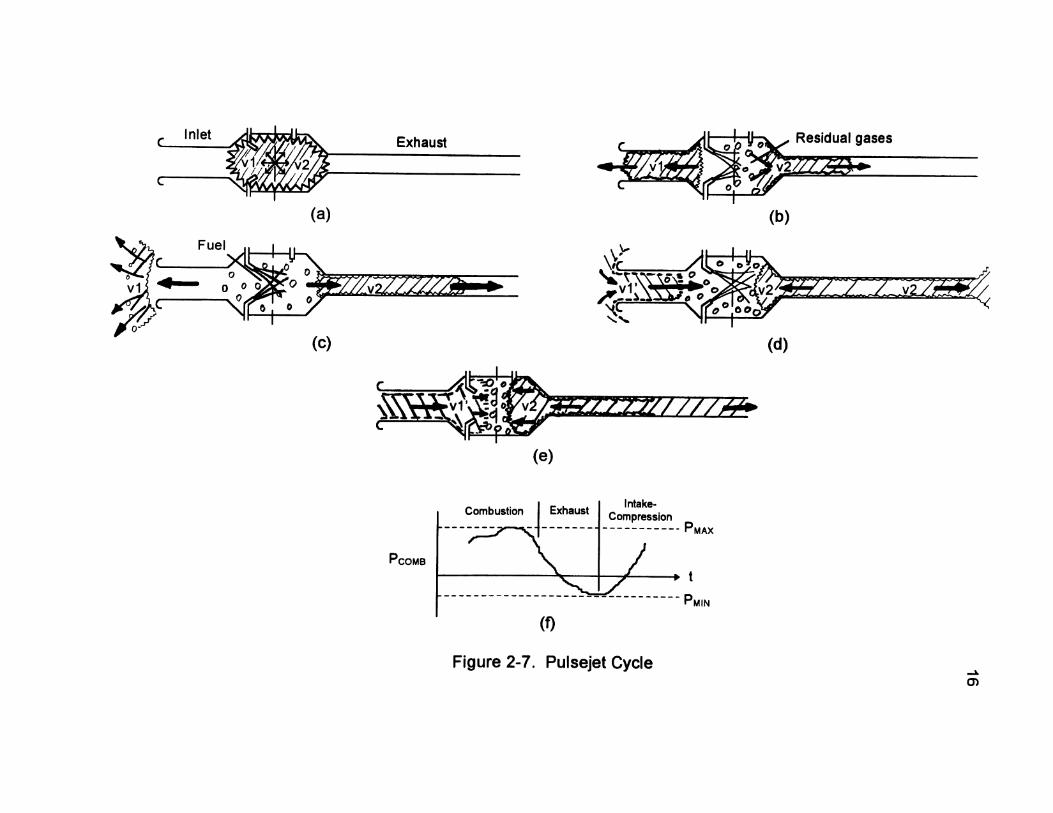
geometry and is how the pulsejet generates its thrust. A simplified pulsejet cycle
is shown in Figure 2-7.
Exhaust
^£nZZZsZfib—+>
(c) (d)
w:tw////#+
Combustion Intake-
Compression MAX
PCOMB
Figure 2-7. Pulsejet Cycle o>

17
Figure 2-7a shows that the cycle begins with the isochoric, complete
combustion reaction of a well-stirred fuel/air mixture. This stage illustrates that
the combustion reactions occur so quickly that they instantaneously fill the
combustor. The pressure in the combustor also reaches its maximum value here
as shown in Figure 2-7f. Since the pressure rise tends to force the uniformly-
distributed exhaust products out of the combustor at both ends, two volumes of
exhaust gas, v1 and v2, will leave each opening. These volumes are not
necessarily equal as shown by Ponizy and Wojcicki (4) and Narayanaswami and
Richards (5), but will be assumed so for simplicity.
Figure 2-7b illustrates part of the exhaust process. Because the inlet
area is larger than the exhaust area, less resistance is encountered by v1 as it
leaves the combustor, while at the same time v2 will take a slightly longer time to
exit the combustor completely under the same pressure. This causes residual
gases to remain inside the combustion chamber as the intake cycle commences.
The pressure now begins to fall within the combustor due to the expansion.
Figure 2-7c is the remainder of the exhaust phase but shows the
significance of inlet and exhaust pipe length. Due to the length of the inlet pipe,
v1 does not need to travel far before it is blown out into the atmosphere. On the
exhaust side, however, most of v2 is contained within the much longer pipe and
only a small portion is released into the atmosphere. Now that the combustion
gases have nearly evacuated the chamber, the pressure inside the combustor

18
reaches its lowest value of about one half an atmosphere. The fresh fuel that is
fed at a constant rate throughout the cycle now creates a rich zone inside the
combustion chamber.
Figure 2-7d illustrates only the intake portion of the intake/compression
phase. The pressure drop in the combustor pulls gases from both the inlet and
exhaust back into the chamber in an attempt to equalize the pressure. Since v1
has completely left the inlet pipe, a quantity of fresh air, v1 \ is pulled in with little
resistance. Similarly, a small portion of v2 is also drawn back into the
combustor. The pressure begins to rise as the gases return to the combustor
volume.
Figure 2-7e completes the cycle by mixing, compressing, and igniting the
new mixture. The momentum and flow dynamics of v1' mix the fresh air with the
fuel and residual gases. At the same time, both v1' and the returning exhaust
gases compress the mixture to slightly below one atmosphere and raise the
mixture to ignition temperature through convection. The pressure sharply rises
and the cycle repeats.
2.4 Types of Pulsejets
Although there are several geometry variations and layouts for pulsejets
summarized by Putnam et al. (1) and Winiarski (2), this section will describe only
those influencing the work in this paper. Included will be the significant qualities
that each type offers and a description of the performance of each.

19
2.4.1 Mechanically-Valved Pulsejets
Valved pulsejets differs from non-valved engines in that they have a
mechanical system that prohibits the backflow of combustion products through
the inlet pipe following combustion. The system acts like a check valve allowing
only flow from the inlet into the combustion chamber and not vice versa. The
valve system is driven by the combustion process itself and not by artificial or
external means. Perhaps the most famous valved pulsejet is the Argus 109
engine used to propel the German V-1 "buzz bomb* of World War II (Figure 2-8).
Inlet shutters
t — Figure 2-8. Argus 109 Mechanically-Valved Pulsejet
This engine is a derivative of the Schmidt tube device explained in
Putnam et al. (1) and Kay (6). In the Argus engine, the intake pipe has been
replaced with a set of reed-type shutters that close when the combustor pressure
rises and open when the pressure falls (Figure 2-8). The cycle of a valved
engine does not differ from that shown in Figure 2-6, but requires additional
explanation to demonstrate valve operation and purpose.
Figure 2-9a illustrates the combustion process and the inlet valves forced
closed under the reaction pressure. Since the exhaust gases can not leave

20
Inlet Exhaust
Fuel Exhaust gases
Incoming air
Residual gases
Figure 2-9. Argus Engine Cycle

21
through the inlet as in a non-valved system, they must exit through the exhaust
pipe (Figure 2-9b). The pressure falls below ambient1 in the combustor, allowing
the valves to open and admit a new charge of air (Figure 2-9c). The
compression, mixing, and ignition processes of the new charge are identical to
those in non-valved systems, and the cycle repeats.
Many variations have been developed on valve systems to control the
inlet flow to the combustor, the most significant concern with all of them being
valve durability. Exposure to extreme temperatures and rapid heat transfer
between cool, incoming air on one side and hot, combustion products on the
other, coupled with the high oscillation frequency, have led to the failure of many
proposed systems. In addition, designing the valve to admit the proper amount
of air in the short time between cycles has also proved to be a difficult task.
Once these problems have been surmounted, however, the result will be a
shorter engine (lack of an inlet pipe) that produces more static thrust than a non-
valved pulsejet of the same dimensions. On the other hand, the noise generated
from the valve oscillations can be excessive (reported in some cases to be 130
dBA by Putnam et al. [1]) and the engines are prone to mechanical failure.
2.4.2 Aerodynamically-Valved Pulsejets
Pulsejets without any moving or mechanical parts are termed "aerovalve''
or aerodynamically-valved engines. These engines and their cycle were

22
exemplified in Section 2.3. Although the primary advantage of these engines
over valved pulsejets is their simplicity, there are many design factors that must
be considered before an aerovalve pulsejet can function. Putnam et al. (1) has
verified that aerovalves are very sensitive to combustor, inlet, and exhaust pipe
geometry. Once a basic engine has been built, the associated areas and
volumes must be tailored to accommodate the cycle frequency and fuel
requirements. They are supposedly quieter than valved engines, but are not as
efficient in thrust production since a portion of the fuel injected during the
combustion process gets blown out of the inlet with the exhaust gases during the
expansion phase. In addition, no net thrust is produced by engines of
axisymmetric configuration since the same mass flows leave in opposite
directions through the inlet and exhaust pipes.
The first aerovalve pulsejet (Figure 2-10) was developed in 1909 by a
French engineer, Marconnet. His pulsejet was designed for propulsion and was
later converted to a valved engine for which he was awarded a patent. This
engine has the axisymmetric arrangement mentioned earlier.
Fuel
Inlet Exhaust
Figure 2-10. Marconnet Aerovalve Pulsejet

23
Perhaps the most significant contributor to aerovalve development was
from a French engine company, SNECMA, who in 1950 produced the Escopette
engine in Figure 2-11.
Exhaust
Figure 2-11. SNECMA Escopette
This design redirects the exhaust products ejected from the inlet through
a rearward-facing duct. Thrust is produced now that all exhaust flows from the
engine in the same direction. The gap between the U-tube and the inlet pipe
permits inlet airflow for the next cycle.
SNECMA simplified the Escopette concept in 1953 to the Ecrevisse
design (Figure 2-12). The Ecrevisse has both the inlet and exhaust pipe facing
rearward and is essentially a Marconnet engine with a bent exhaust pipe.
Inlet
F u e l C K •
Exhaust
Figure 2-12. SNECMA Ecrevisse

24 Around 1955, R. M. Lockwood began to investigate thrust augmentation
of aerovalve engines and became a research consultant for Hiller Aircraft
Company (California) involved with developing efficient pulse combustion
engines for propulsion. Together, they conducted extensive research into
aerovalve pulsejet design and produced most of the foundations of the subject
(Ref. 7). After the research was published around 1962, Lockwood developed a
version of an Ecrevisse engine with thrust augmentors and optimum design
parameters stated in his research. The Lockwood U-tube (Ref. 8) has unique
thrust augmentors (also developed by Lockwood) which utilize the static
pressure drop of the jet efflux to draw surrounding air into the jet stream adding
more mass to the flow and producing more thrust. Figure 2-13 illustrates the
Lockwood engine and augmentor operation.
u e Thrust augmentors
/V-Vr-^ A(
Figure 2-13. Lockwood U-Tube and Thrust Augmentors
2.5 Comparison of Pulsejets to Other Propulsion Systems
Since pulsejets use a jet-pump effect and exhaust stream to produce
thrust, the comparison to reciprocating or rotary-type engines is not significant.

The closest family of steady-combustion engines to pulsejets with respect to
operating cycle and thrust production are ramjets, followed by gas turbine
engines:
Ramjets, like aerovalve engines, have no moving parts but their geometry
is much different. Ramjets use a centerbody (or inlet duct design) to generate
shock waves for compression of the incoming air, inject fuel, burn the mixture
under steady conditions, and exhaust the products. Thrust production is
primarily from stagnation pressure rise across the engine and from the increased
entropy of the exhaust stream due to the heat addition (Rayleigh flow). Unlike
aerovalve engines, ramjets cannot produce static thrust and must attain
sufficient velocity (through external means) to begin functioning. They also
depend on aerodynamic design such that the flow progresses in a steady
manner through the engine with minimal losses. Since pulsejets, in effect,
function through a series of contained explosions, aerodynamic design is not as
significant.
Although the differences between pulsejets and gas turbine engines are
extensive, the most notable differences are complexity and efficiency. Gas
turbine engines have the disadvantage of moving parts and hundreds of
components, leading to increased failure rate and design complexity. They are,
however, more fuel efficient than pulsejets and produce more thrust for a given
size as consequences of the gas turbine operating cycle. On the other hand,
gas turbine engines are costly, heavy, and are extremely sensitive to foreign

26
object ingestion. Aerovalved pulsejets, however, can ingest a variety of
substances (dirt, hay, sand, etc.) with no damage or interruption in cycle, as
proven by Lockwood (7).
2.6 Applications of Pulsejets
With respect to the usefulness of pulsejets and pulse combustion devices,
early researchers saw a variety of applications ranging from flight propulsion to
food product drying. Propulsion, however, saw the largest level of development
and has produced most of the design optimization concepts used in engines
intended for other applications. The most famous (or infamous) application of
pulsejets was powering the German V-1 "buzzbomb" during World War II. Since
then Lockwood and Hiller have explored, and in some cases tested, many
additional aircraft uses ranging from helicopter rotor tip jets to VTOL aircraft.
Currently, pulsejets are being investigated for propulsion of military target
drones, remotely piloted vehicles, and some homebuilt aircraft (Taylor [9]).
Established uses for pulse combustors are residential and commercial
heating (Lennox pulse furnace), fog/insecticide pumping, hydronic water heating,
snow and ice melting, and food product drying (all mentioned in Putnam et al.
[1]).

2.7 Variables Affecting Pulsejet Performance
Because pulsing operation occurs in the narrow region between steady
combustion and flame out states, the dimensions of a pulsejet must allow the
proper thermodynamic conditions to occur so that the engine can start and
maintain its cycle. Thus, the geometry is critical to how a pulsejet will function,
based on thermodynamic cycle and, to some extent, acoustic behavior.
Lockwood (7) conducted extensive experimental research into pulsejet
component designs and has correlated many geometry relations with engine
thrust and thrust specific fuel consumption (TSFC).
This section will discuss the design significance of each component in an
aerovalve pulsejet engine and its effect on performance. When possible, each
section will include a component comparison of all of the functioning pulse
engine designs found during the research of this paper. No information was
found concerning valved pulsejets or valve system design. All of the references
used in this paper deal with engines at static conditions, and give no discussion
on how (or if) engine geometry needs to be changed to maintain performance at
altitude or flight speed.
2.7.1 Inlet Lip Shape
The inlet pipe lip of a pulsejet acts similar to a bell-mouth inlet used in gas
turbine engine static testing. The wide bell-mouth shape used on gas turbines
provides maximum air mass flow with little disturbance into the engine during

28
operation. Although this is also desirable for pulsejets, Lockwood (7) has shown
that the pressure drop over the inlet lip during the intake phase of the cycle acts
as a negative thrust on the unit. His results recommend an inlet lip of lemniscate
shape that enables a compromise between maximizing the inlet mass flow while
keeping the pressure drop to a minimum (Figure 2-14).
Standard Lockwood bell-mouth \ inlet lip
V ^ Q Inlet wall /
Figure 2-14. Aerovalve Inlet Shapes
2.7.2 Inlet Pipe Length
The importance of inlet pipe length was summarized in describing pulsejet
operation in section 2.3.2. Each aerovalve pulse combustor has an inlet length
required for optimum cycle efficiency. If the inlet length falls short, the
combustion products leaving through the inlet pipe will be expelled to the
atmosphere before the pressure reaches a minimum inside the combustion
chamber. This causes premature ingestion of air, a resulting drop in the cycle
peak pressure, and could interfere with the air/fuel mixing process. Conversely,
if the inlet is overly long, the engine may not receive enough air for the next
cycle since exhaust gases would still be in the tube during the onset of the
intake phase. Putnam et al. (1) has demonstrated both of these conditions and
concludes that there is a definite limit to the maximum length of the inlet pipe for

aerovalve pulsejets. Varying the inlet length will gradually decrease engine
performance if lengthened or shortened from optimum. Since valved engines do
not encounter backflow through the inlet pipe, their inlet lengths have no length
restriction.
2.7.3 Inlet Pipe Cross-Sectional Area
Inlet area has a similar effect to inlet length, only this parameter has a
direct effect on mass flow. If too large, too much exhaust product will escape
during backflow before the cycle reaches a minimum pressure, and if too small,
not enough will escape to allow ingestion of fresh air. Putnam et al. (1) states
that research has shown the optimum inlet cross-sectional area is often
substantially smaller than the cross-sectional area of the combustion chamber,
but no research has indicated by how much.
2.7.4 Combustion Chamber Geometry
The three, distinct parts of a pulsejet combustion chamber (Figure 2-15)
must be shaped correctly to accommodate sufficient mixing of air and fuel while
allowing undisrupted passage of inlet and exhaust gases through the chamber.
First, the inlet bulkhead is the section immediately downstream of the inlet pipe
where the incoming air expands into the second part, the combustor. The
combustor portion comprises most of the length of the total combustion chamber

30
and is usually of constant cross-section. The third part is the aft bulkhead or
exhaust nozzle where the reaction products pass into the exhaust pipe.
Inlet Exhaust Bulkhead Nozzle
I . Combustor /
} X
Figure 2-15. Combustion Chamber Components
2.7.4.1 Inlet Bulkhead
The inlet bulkhead is typically designed as an expansion from the inlet
area. The angle of divergence can range from 90 degrees (flat plate) to no less
than 45 degrees (conical). Research of engine designs has shown that either 90
or 45 degree bulkheads are preferred and seem to deliver adequate engine
performance. Aerodynamically, the sudden area expansion from the inlet
creates the slight pressure rise and velocity decrease of the incoming air.
Fuel/air mixing is influenced by the vortices and residual wakes formed as the
inlet air passes from the inlet through the bulkhead. Lockwood (7) has
demonstrated through extensive engine testing that the best inlet bulkhead
design for pulsejets is the 45-degree conical configuration. He also claims that
the 90-degree bulkhead, a flat plate at the combustor face, poses structural

difficulty. This conclusion was not explained and seemed to be unfounded since
many pulsejet and pulse combustor designs using the 90-degree bulkhead
reported no problems with structural integrity (Ponizy and Wojcicki [4], Keel and
Shin [10], and Richards and Gemmen [11]).
2.7.4.2 Combustor
Combustor size determines the proportions of a pulsejet's inlet and
exhaust pipes. Combustor diameter is the most significant in this respect and
has been shown to greatly influence fuel requirements, operating frequency, and
overall engine performance (thrust being the most significant). Combustors
have always been circular and, with the exception of the Marconnet engine, are
of constant cross-sectional area.
Research has been conducted by Lockwood (7) and Putnam et al. (1)
investigating combustor length and diameter effects on thrust. Lockwood states
that as combustor size decreases, the engine thrust-to-volume ratio increases.
He also concludes from experimentation that, since the space and time for the
fuel and air to mix are reduced, the combustion frequency increases.
Eventually, a combustor will be so small (approximately 4-inches in diameter)
that the performance of the engine will be compromised, in part due to fuel
system miniaturization problems. The last of the conclusions does not seem to
be accurate since Putnam et al. and the author have noted many researchers
who developed and tested engines of smaller diameters with satisfactory

performance and no significant component problems. Lockwood also indicates,
but does not explain, that as combustor diameter is decreased the length should
increase to maintain optimum performance. This may be a result of the
Helmholtz acoustic equations' dependency on combustor volume.
In other terms, Putnam et al. (1) finds that the thrust specific fuel
consumption increases and the thrust-per-unit exit area decreases if the
combustor diameter is reduced. Rehman in Putnam et al. compares and
substantiates Lockwood's data to other engines to illustrate a trend of rising
maximum specific thrust over increasing combustor diameter.
2.7 4.3 Exhaust Nozzle
An exhaust nozzle is present on all pulsejet designs and directs the
combustion products into the exhaust pipe during the expansion phase of the
cycle. It is designed similar to the inlet bulkhead but converges from the
combustor area down to the exhaust pipe area. The converging shape of the
nozzle directs the proper amount of exhaust gases into the pipe while still
retaining enough for ignition in the combustion chamber. The angle of
convergence varies with engine designs, but Lockwood (7) found the best angle
for nozzle performance to be between 30 and 45 degrees. Early pulsejets had
shallower angles for their nozzles and the valved Schmidt tube (shown in
Putnam et al. [1]) had no exhaust nozzle at all. Lockwood has illustrated that the
45-degree nozzle drastically reduces the exhaust pipe length required to

maintain the thrust gained by combustor elongation. This allows for a shorter
combustor and exhaust pipe and raises the thrust-to-volume ratio. However, no
explanation is given, thermodynamic or otherwise, as to the nature of these
results. One possibility may be a greater pressure rise and velocity drop of the
returning exhaust gases during the intake phase. The effect would be similar to
that seen by the incoming air through the 45-degree inlet bulkhead.
2.7.5 Exhaust Pipe Geometry
A substantial portion of the research on pulsejets calls the exhaust pipe a
resonance tube because of its role in pulsejet operation. As mentioned earlier,
pulsejets must be "tuned" to their operating frequency much like two-cycle
reciprocating engines or Helmholtz resonators. The length and area taper of the
exhaust pipe control the tuning effect, and play a large part in engine
performance and thrust production. In addition to matching acoustic frequency,
research has shown that the design objective for the exhaust pipe is to contain
sufficient exhaust gases within it such that enough is drawn into the combustion
chamber for ignition during the subsequent intake/compression phase while
preventing the ingestion of fresh air into the pipe. Owing to this requirement, the
inlet pipe and combustion chamber configurations drive the design requirements
of the exhaust pipe. Lockwood (7) has exemplified this by having shown that an
inlet pipe divergence of around 2 degrees drastically reduced the exhaust pipe
length necessary to produce the same thrust as with a straight inlet pipe.

Extensive experimentation concludes that the exhaust pipe length can be used
to find the optimum thrust-to-volume ratio. Lockwood also states that the
exhaust nozzle angle plays a role in exhaust pipe length, as mentioned in the
previous section.
Both Lockwood (7) and Corliss (stated in Putnam et al. [1]) have
experimented with tapered and constant-area exhaust pipes. Lockwood varied
the taper angle and length of several pipes on a baseline SNECMA aerovalve
engine and measured the performance, but never attempted a constant-area
version. His findings indicated that certain fineness ratios (length-to-diameter)
developed either better thrust-to-volume or improved TSFC. Corliss, however,
found his tapered pipe results to be contrary to those of Lockwood, and
experienced better overall performance from constant-area exhaust pipes. One
reason for the differences as explained by Putnam ef al. is that the Corliss
pulsejets did not have as high of a pressure-gain as the SNECMA/Lockwood
engines due to the fuel (gasoline) and combustor geometry. Research for this
paper has shown that most aerovalve units use a tapered exhaust pipe to take
advantage of the pressure rise as the emerging exhaust gases pass from the
smaller area at the exhaust nozzle to the larger area of the exhaust pipe end.
2.7.6 Fuel/Air Mixing Characteristics
The mixing dynamics of the fresh air, new fuel charge, and residual
exhaust products between each pulse is essential for a pulsejet to function. The

mixture must be sufficiently stirred for combustion at the moment the exhaust
gases return to the combustion chamber and ignite it. Since the inlet air column
flow is determined by the inlet and inlet bulkhead, optimum efficiency will be
achieved only if the fuel nozzle location in the combustor, the fuel nozzle spray
pattern, and the mixing time are appropriate.
In addition to fuel nozzle location, Lockwood (7) experimented with nozzle
configurations and spray patterns leading to several novel injector designs. His
tests focused on nozzle location along the combustion chamber and concluded
that the fuel nozzles should be positioned at or near the area in the combustor
most likely to experience the highest mean pressure during the cycle. His
experiments with nozzle design show that the fuel sometimes gets blown back
far enough into the fuel line during the pressure-rise portion that it is not injected
into the chamber in time for the next cycle. The addition of restrictors (similar to
check valves) in the nozzles prevented this. Although no description was given
as to the type of fuel used in the Lockwood engines, it is believed to be gaseous
since the above phenomenon would be less likely to occur in a pressurized
liquid-fueled system due to the higher density and inertia. Tests were also
conducted with the fuel being injected along the engine axis via a fuel line that
traversed the inlet pipe and ended at the predicted point of highest mean
pressure. Engine performance was the same with only the TSFC suffering due
to unburned fuel being blown out of the chamber during the blowback of
combustion gases through the inlet. Keel and Shin (10) experimented with axial

injection to some extent on a Helmholtz combustor model with favorable results.
Because of the blowback, however, Lockwood's research favored fuel injection
perpendicular to the engine axis.
The gas dynamics and flow fields associated with pulse combustion are
far from the steady, adiabatic conditions usually exhibited by other cycles.
Understanding the methods by which the fuel and air mix and combust would
certainly permit pulsejet designers to take advantage of the many phenomena
that are observed in experiment but ambiguous in theory. Several experimental
procedures have successfully mapped the combustion process with respect to
time. Some of the methods include measuring ion currents in the exhaust
stream (Keel and Shin [10]), seeding the inlet flow with NaOH and measuring the
CH and Na radicals in the exhaust (Ponizy and Wojcicki [4]), and incorporating
quartz glass windows on the combustion chamber to photograph the flame
dynamics (also Ref. 4).
Using the experimental data, mathematical models of the pulse
combustion cycle could be modified to better predict the combustion
characteristics. A multitude of variables and high degree of uncertainty
associated with the combustion process make mathematical modeling difficult
even with today's computer technology and analytical techniques. Putnam et al.
(1) and Winiarski (2) conclude that, although less expensive, the time it would
take to solve the complex equations associated with such models would be just
as long (or longer) as the time to build and test a functioning device. In addition,

37
the models attempt to predict the effects of pulse combustion and are not
currently used as a design criteria for pulse combustion devices. Designs that
have been shown to function based on mathematical predictions may not work in
experiment (Putnam et al. [1]), yet others operate very close to the model results
(Narayanaswami and Richards [5]).
2.8 Trends in Pulsejet Design
2.8.1 Variable Definition
The information found in the research collected by the author has
provided dimensions and/or drawings of eight aerovalve pulsejet designs and of
the aerovalve pulse combustor found in Richards and Gemmen (11). The pulse
combustor is arranged similar to an aerovalve pulsejet and is, therefore,
included in this discussion. All of these devices functioned and were used for
experimentation. Comparison of the engines' layout and geometry relations
clearly indicate trends on how aerovalve pulsejets have been designed over the
years. The geometry variables for an aerovalve engine used in comparison are
described in Figure 2-16.

t^FFSfc LEX
AIN Dc AEX
^ \ 7 Ac
rv - t^L n - AEX a l _ A IN 1 - L»N • i _ LEX
1" A E " " A - ~C7~ ~~ A - '"" T" E " 1— M C M C a E MEX L C L C
Figure 2-16. Pulsejet Geometry Variables
The areas A)N and AEX are measured at the entrance and exit to the
combustion chamber and are not necessarily the inlet and exhaust pipe areas.
The length of the combustor, Lc> does not include the length of the inlet
bulkhead or exhaust nozzle, and is measured parallel to the engine axis. By
defining the areas and lengths as such, all aerovalve pulse combustor and
pulsejet designs can be generalized, including those incorporating variable-area
components. All five parameters shown in the figure can be used for pulsejets,
but only those concerning area dimensions can be applied to pulse combustors.
There are three types of relationships evident from the research: those
involving inlet dimensions, those with exhaust dimensions, and general engine
layout. The engines compared in the tables to follow are identified by their
primary experimenter and the combustion chamber diameter.

2.8.2 Inlet Relationships
A trend in aerovalve engine design relates the inlet cross-sectional area
to that of the combustion chamber, as denoted by <xi in Table 2-1. The
successful engines designed by Lockwood and Kentfield illustrate that the inlet
area is roughly one-third of that of the combustor. The engines of Corliss,
Ponizy, and Richards, however, do not follow this trend. This is because the
Ponizy and Richards engines were designed for the measurement of combustion
dynamics and not for thrust development, as were Lockwood's and Kentfield's.
The Corliss engine was designed for thrust production but was known to have
performed poorly (Putnam et al. [1]). No information on how the area relations
were determined have been encountered during research.
Examination of Table 2-1 also shows the inlet pipe length to be very close
to that of the combustor. Although the author has not come upon any research
to explain the similarity, it is evident that even Marconnet was familiar with the
issue in the design of his engine (Figure 2-10). The X\ values are much closer to
one another than those of oti, especially when comparing Lockwood's and
Kentfield's engines.
Their designs illustrate that the inlet pipe length should be the same as
the combustor length, whereas the other experimenters show the inlet length to
be roughly two-thirds of the combustor. As with oti, this difference is also due to
engine purpose (combustion research or thrust production).

40
Table 2-1. Pulsejet Inlet Relationships
Experimenter (Dc)
Lockwood (9.1-in)
Lockwood (5.25-in)
Lockwood (5.25-in)
Lockwood (5.25-in)
Lockwood (5.0-in)
Corliss (4-in)
Kentfield (3-in)
Ponizy (2.5-in)
Richards (2.2-in)
Ac (in2)
65.04
21.65
21.65
21.65
19.64
12.56
7.41
4.83
3.82
Lockwood & Kemtffeid
Lc (m)
20-.0
11.5
11.0
13.0
13.0
8.0
5.32
12.2
5.98
Am (in2)
19.64
8.3
7.67
9.08
7.67
0.99
1.95
0.487
.0196
LIN (in)
20.0
11.5
12.0
13.0
12.3
5.0
5.59
9.45
3.94
<X|
0.3
0.38
0.35
0.42
0.39
0.079
0.26
0.1
0.051
0.35
h
1.0
1.0
1.09
1.0
0.95
0.625
1.05
0.775
0.66
\m
In general, the inlet relations do not seem dependent on combustor
diameter, as given in the first column of Table 2-1. The Corliss engine is larger
than the Kentfield design, yet deviates from the trends supported by the engines
of Lockwood and Kentfield. Similarly, the diameter of the Ponizy engine is only
one-half inch less than Kentfield's and also does not comply with trend
observations
2.8.3 Exhaust Relationships
Table 2-2 shows the exhaust relationships among the available engine
geometries. Nearly all the engines have exhaust areas just under one-quarter

41
the area of the combustor. The exceptions in this case are the engines of
Kentfield and Richards.
Table 2-2. Pulsejet Exhaust Relationships
Experimenter (Dc) Ac (in2) Lc (in) AEX (in2) LEX (in) <xE
Lockwood (9.1-in)
Lockwood (5.25-in)
Lockwood (5.25-in)
Lockwood (5.25-in)
Lockwood (5.0-in)
Corliss (4-in)
Kentfield (3-in)
Ponizy (2.5-in)
Richards (2.2-in)
&fT$tatti&«*6f ' -
65.04
21.65
21.65
21.65
19.64
12.56
7.41
4.83
3.82
-
20.0
11.5
11.0
13.0
13.0
8.0
5.32
12.2
5.98
15.9
4.91
4.91
4.91
4.91
3.14
0.954
0.954
0.444
108.6
61.5
62.5
72.0
68.25
67.0
36
40.64
23.62
0.24
0.23
0.23
0.23
0.25
0.25
0.13
0.2
0.12
5.43
5.35
5.68
5.53
5.25
8.38
6.77
3.33
3.95
0>22 &$7
Table 2-2 illustrates that the Kentfield engine has a high XE when
compared to the Lockwood designs, with the Corliss engine XE being well above
the others. The much lower and similar XE values of Ponizy and Richards are
not a result of their small diameter. Independence of XE from combustor size can
be justified since Kentfield's combustor is only slightly larger than Ponizy's and
yet has over twice the XE ratio. In addition, the Lockwood 9.1-inch diameter
combustor has a XE ratio very close to those of the 5.25 and 5-inch combustors.
The relationships between exhaust geometry and combustor design are a

result of the Helmholtz fundamental acoustic frequency equation, as shown by
Putnam et al. (1) and Keel and Shin (10). The approximate frequency of a
Helmholtz resonator is given by:
f = (C/2TC) • (S/LV)° 5
where C = speed of sound in exhaust pipe S = exhaust pipe neck area L = exhaust pipe length V = combustor volume
Since the literature on the pulsejets evaluated provided only a few of the
above variables, verification of engine design based on the Helmholtz equation
was not possible.
2.8.4 General Observations
Table 2-3 illustrates other ratios that can be compared between the nine
engines. The area ratio, (oti / otE), relates the inlet to exhaust areas. For most
aerovalve pulsejets, the exhaust area is smaller than the inlet area, which also
holds true for the Lockwood and Kentfield engines. This observation does not
apply to the Corliss, Ponizy, or Richards designs. The (oti / aE) ratios smaller
than unity for those engines indicate that the inlet area is less than the exhaust
area.
The reason behind the larger exhaust area may be that the Ponizy and
Richards engines were designed for observation, and not propulsion, as

43
mentioned in Section 2.8.2. The area ratio might also be one cause of poor
performance in the Corliss engine since it was intended for thrust. Nevertheless,
the more promising engines of Lockwood and Kentfield demonstrate that the
inlet area should be slightly less than twice the exhaust area.
Table 2-3. General Pulsejet Relationships
Experimenter (D c ) (oti / <xE) (L/D)c
Lockwood (9.1-in)
Lockwood (5.25-in)
Lockwood (5.25-in)
Lockwood (5.25-in)
Lockwood (5.0-in)
Corliss (4-in)
Kentfield (3-in)
Ponizy (2.5-in)
Richards (2.2-in)
Average of ail exa Ponizy
1.24
1.69
1.56
1.85
1.56
0.32
2.04
0.51
0.44
im
2.2
2.19
2.1
2.48
2.6
2.0
1.77
4.9
2.72
2.28
The combustor length-to-diameter ratio, (L/D)c, also listed in Table 2-3,
shows that the combustor length should be around twice the diameter, with the
obvious exception being the Ponizy engine. The Ponizy combustor was
elongated to accommodate quartz glass windows for flame observation
(mentioned in Section 2.7.6). Even though Lockwood states that the combustor
length should be increased if the diameter is reduced, this is only necessary to

maintain the optimum thrust-to-volume for a given engine geometry (see Section
2.7.4.2). Neither Lockwood nor any other researchers explain why the L/D ratio
for the combustor should be around two.
Through observation of both mechanically-valved and aerovalve pulsejet
designs, the author has noted that the geometries of the two types of engines
are similar from the combustor aft. This supports the requirement of matching
the exhaust (resonance) pipe to the combustor size and pressures ("tuning" the
engine).

CHAPTER 3
DEVELOPMENT OF EXPERIMENTAL PULSEJET
3.1 Pulsejet Research Objective History
The original goal of the research conducted by the author was to develop
and test a novel air inlet valve system for a pulsejet engine. In order to evaluate
the valve concept, a pulsejet based on one of the Lockwood engines (the HH
(5.25")-5 from Ref. 7) that incorporated the valve system was designed and
constructed by the author. The engine included variable fuel injection and
ignition locations within the combustor so that its performance could be
optimized. Performance parameters were to be measured by instrumenting the
combustion chamber to obtain pressure readings, temperatures, and mass flows.
The design objective for the valve system was to minimize or eliminate
any mechanical oscillation inherent to reed and flapper-type valve systems (as
used on the Argus and DynaJet pulsejets) such that fatigue life would be
significantly increased. A valve system was then developed that utilized a
ported rotor connected to a turbine that was driven during the pressure
riseportion of the combustion cycle (Figure 3-1). As the rotor spun, fresh air
would enter the combustor twice during one rotation.
45

46
Ported rotor valve
Combustion chamber
Rotation axis
Fully-open position
Fully-closed position
Figure 3-1. Ported Rotor Valve Cycle
Since the valve has only one moving part,which rotates in one direction,
fatigue life of the system is greatly extended and the system is much quieter. In
addition, each component is easy to manufacture since lower part tolerances are
permissible. One significant drawback of the system, however, is that the valve
position must be precisely timed with the operating frequency of the engine such
that the valve is in the correct position with respect to the combustion cycle
(fully-open at minimum pressure and fully-closed at maximum pressure).
Another downfall is that the maximum combustion pressure must be sufficient to

drive the turbine/rotor valve system without significantly compromising thrust or
cycle efficiency.
The ported rotor inlet valve was tested on the experimental pulsejet
engine mentioned earlier and did not function as expected. The reason was not
the valve system but the engine geometry. Investigation into the component
design according to the research available revealed that the engine was not
conducive to pulse combustion behavior. As a result, the components were
modified to create an aerovalve engine. The reasoning was that if the engine
functioned (pulsed) as an aerovalve, then adaptation of the valve system would
be successful since the faulty component geometries would have been
corrected. The new aerovalve engine had the same combustor geometry as the
valved design (including the variable fuel and ignition locations), but the inlet
and exhaust dimensions were slightly different.
Testing of the aerovalve version of the engine also proved unsuccessful.
The device would ignite and either burn steady or flame out with no tendency to
pulse. After many weeks of part modification and subsequent testing (covered in
Chapter 5), the goal of the project then became the production of a self-
aspirating aerovalve pulsejet and evaluation of performance through variation of
fuel injection and ignition location.
After extensive testing and continual redesign under the new objective,
the engine eventually began to pulse, but only when air was directed into the
inlet from a compressed air source. If the air pressure was reduced or removed,

the engine would burn overly rich and steady. On the other hand, if the air
pressure were increased and the fuel/air ratio was adjusted by adding more fuel,
the engine would pulse strongly. Further experimentation revealed the
throttleable range of the engine between the too-rich and too-lean flame-out
limits of the mixture ratio, with an even narrower range yielding the most robust
pulse operation.
It should be noted that all of the testing until this point employed no
instrumentation other than fuel and air pressure gauges. The pulsing
characteristics of the engine were evaluated based on aural and visual
observations made by both the author and testing assistants. Data to support
the pulsing and steady operation of the engine will be given in Chapter 5.
Since the engine did not show any tendency to self-aspirate, the goal of
the project changed to compare various thrust measurement techniques for
pulsejet engines. This issue had never been discussed in detail by any research
literature and posed many questions to the author as to the validity of the thrust-
measuring methods used to obtain data in the reports. The measurements of
the combustor pressure, the total pressure rise across the engine, and the
dynamic pressure of the exhaust jets were to be compared using a pressure
transducer, a manometer, and a load cell, respectively. Experimenting with
each procedure demonstrated that all but the combustion pressure method had
numerous sources of error that arose from the non-self-aspiration of the engine,

the engine layout, and the resolution of available instrumentation. These issues
will also be discussed later in Chapter 5.
Since a valid comparison between the thrust measuring methods was no
longer possible and the deadline for project completion was drawing nearer, the
project goal changed back to attaining aerovalve self-aspiration and evaluating
performance.
That objective remained until the experimentation was terminated. The
following sections of this chapter will describe the design considerations and
geometry of each component of the final engine configuration.
3.2 Engine Development and Configuration
There are two primary factors that contributed to the general dimensions
of the experimental engine. The first was the baseline engine used by
Lockwood from which the overall geometry of the project engine components
were scaled, and the second was the historical trends found in pulsejet design
as discussed in Section 2.8.
3.2.1 Baseline Lockwood Engine
The Lockwood HH(5.25")-5 engine mentioned in Section 3.1 is shown in
Figure 3-2 as illustrated in Ref. 7.

50
88.0"
1.0"
12.0""
J_
1^ 3.125"
11.0"
5.25"
1.5" 62.5"
n 2.5" 4.8"
Figure 3-2. Lockwood Model HH(5.25")-5 Aerovalve Engine
This particular model was selected as a baseline for the experimental
engine in this project for its general size and optimized performance as stated in
Lockwood (7). Since this engine was larger than desired, however, the engine
dimensions were scaled down from a 5.25-inch diameter combustor to a 4-inch
diameter for several reasons: First, a smaller engine would yield lower material
costs and part manufacturing time; second, the component size of a 4-inch
diameter engine could be more easily handled by the machining equipment used
in manufacturing; third, smaller components reduce assembly and maintenance
time; and fourth, if the diameter were smaller than four inches, sub-system
miniaturization problems as expressed in Lockwood (7) may have been
encountered, as well as machining and assembly difficulties.
Scaling down of the Lockwood model was justified by the scaling up of the
same engine as Lockwood (7) had done on numerous occasions. In addition,
Tables 2-1, 2-2, and 2-3 in the last chapter illustrate that the geometry trends
are similar regardless of engine size. Thus, the general dimensions of this

51
project's experimental engine, named Astra, in its final configuration are shown
in Figure 3-3.
106"
41"to 61"
Figure 3-3. Astra Experimental Engine
3.2.2 Using the Trends in Pulsejet Design
Table 3-1 compares the geometry parameters mentioned in Section 2.8.1
of both the Lockwood HH(5.25")-5 engine and the Astra against their average
values from Tables 2-1, 2-2, and 2-3.
Table 3-1. Geometric Comparison of Lockwood and Astra Engines
<xi <XE (OCI/(XE) X\ XE ( L / D ) C
Lockwood HH(5.25")-5 0.35 023 l756 109 5 68 Z10~
Averages from Tables 0.35 0.22 1.66 1.02 5.67 2.26 Wffi^S////////WW4P,4,. ^m^ 'gyw:..xM„' AM ,1J* 1.0 WWWtMMMMIIIIIMIIIHIM t'lMl'l'll'UHII lllll II MIIIIM>MMMHMMIMII<I«I IIIIIIIIIMIIIIIMMIIIIIMMMMIMIIMIMMIMMIMMIIIIMIIMMIIIII l l l l l l l l l l l l l l l I I I I I I I IHIII I I I I Mill 1111II III MINI l l l l l l l l l l
A 0.0. • 72 2J0t Z7 0A
As the table illustrates, the Astra engine geometry is very close to both
the HH(5.25")-5 and to the averages from Tables 2-1, 2-2, and 2-3. Although the
percent differences of oti and (ai/aE) with respect to the average values are

considerably higher than the rest, they are still acceptable when compared to
even higher differences that would be obtained from other engines listed in the
Chapter 2 tables. The slight differences between the Astra engine and the
Lockwood model are primarily from the Astra utilizing industry standard, off-the-
shelf, and readily available components (i.e. automotive exhaust pipe and brake
line fittings, electrical conduit, etc.) that required little modification to adapt into
the design.
Even though the geometrical similarities between the Lockwood engine
and the Astra are very close, the Astra does not function as the HH(5.25")-5.
This will be discussed further in Chapter 6.
3.3 Astra General Design Considerations
There were many issues that had to be considered in the development of
the Astra pulsejet. Since they were accounted for early in the design phase of
the engine, component assembly and engine manufacture proceeded with few
setbacks. In addition, no components failed during the entire testing phase of
the engine.
3.3.1 Material Selection Concerns
3.3.1.1 Heat Exposure
All of the components of the Astra were designed from materials that
would not fail when exposed to the combustion process and exhaust gases.

Also important was the materials' resistance to creep and expansion from the
heat such that the part would not distort or create excessive thermal stresses on
the assembly hardware. The material of choice was 303 stainless steel. Mild
steel was often used for other components that were not directly exposed to the
combustion reaction. Galvanized materials were avoided whenever possible
since corrosion was not a concern. In addition, the galvanization coating burns
off under excessive heat and produces harmful vapors.
3.3.1.2 Machining Ability
Stainless steel requires roughly three times the machine time and
produces three times the tooling wear than other non-stainless steel alloys. In
other words, a certain thickness of stainless steel is equivalent to machining a
non-stainless variety three times that thickness. The proper thickness for the
engine components had to be selected so that the engine would not fail during
operation, and still be able to be manufactured without damaging the machines
and tooling available. The thickness was chosen to be 22-gauge (0.025") and
all custom-made, stainless steel components of the engine were made from the
same stock.
The mild steel parts of the Astra posed no difficulty in machining or
assembly. The actual designation of the steel was not known and was different
among the many non-stainless components. The thickness of these parts also
varied according to their design specifications.

3.3.1.3 Material Cost and Availability
Since engine weight was not a concern, the materials used in the
construction of the Astra were readily available and relatively inexpensive. The
large sheet of 303 stainless steel from which most of the primary components
were made was shipped from a local sheet metal supplier. All other materials
were attained by the author from local businesses at below-cost prices. Had
material weight been an important issue, materials that were both light and able
to meet the machining and heat requirements could have been obtained,
however at a much higher cost.
3.3.2 Off-the-Shelf Parts and Part Modification
One of the design goals of the engine was to make it inexpensive and
from materials or parts that could be changed with little machining. Thus, many
of the Astra components are slightly-modified parts used in automobiles or other
industrial applications. The reason is so that the engine could be built by
anyone with a low budget, and the necessary tooling and machining skills.
Another reason is that since the funding for the project was from an outside
source, expenditures would be kept at a minimum by using off-the-shelf parts.
The components that required little modification to adapt into the Astra design
were obtained from local businesses at or below consumer cost.

55
Another design goal of the Astra was to make all of the components, both
custom-made and off-the-shelf, able to be modified to incorporate possible future
design requirements. This consideration allowed for part and hardware
uniformity and interchangeability to minimize cost and design complexity. In
other words, one part can fit on many other parts with the same hardware. This
permitted major engine configuration changes either in-the-field or within a very
short time.
3.3.3 Engine Vibration and Hardware
The vibration of the engine during pulse operation was considered for
assembly hardware and fitting selection. In addition to the vibration, the
hardware would also experience extreme thermal stresses due to part expansion
and heat transfer. The fasteners were thus chosen to be steel with those directly
exposed to combustion being stainless steel. The fasteners are common bolts
of various sizes and have either lock nuts or are threaded directly into a
component. Hardware selection was also done such that a minimum number of
tools could be used for engine teardown and assembly. The hardware was
obtained through a local supplier for reasonable cost.
3.4 Final Astra Layout and Components
Figure 3-4 is an assembly drawing of the final Astra layout with the
general dimensions given in Figure 3-3. The engine is axisymmetric and has

PLUG***
ToFuaHOje 13
TO FUEL hose
Figure 3-4. Astra Component Assembly O)

57
three variable parameters: fuel injection location, ignition location, and exhaust
pipe length. Each of the components listed in Figure 3-4 will be briefly described
in order of their part number and any special considerations in the design of the
part will be mentioned. Detailed dimensions and drawings of the components
are provided in Appendix A. Although there were additional components that
were used in the experimentation, only those pertaining to the engine function
will be mentioned. The specifications for the other parts will be given in
Chapter 5.
3.4.1 Parti: Inlet Lip
The inlet lip of the Astra was fashioned in an attempt to conform to the
optimum Lockwood design discussed in Section 2.7.1. Since the compound
curvature of such a part is difficult to manufacture from sheet metal without a
large drop hammer press and a female mold of the lip, an alternate method was
employed.
The inlet lip is a prime example of off-the-shelf components requiring little
modification. A small length of rubber, heat-resistant, automotive fuel line similar
in radius to the lip size stated by Lockwood was cut to the circumference of the
inlet pipe. The tubing was sliced down one side and a standard automotive
hose clamp was inserted into the slot. The flat surface of the hose clamp
widened the tubing and also provided the means to attach the lip to the inlet

58
pipe. The result, shown in Figure 3-5, is a smooth semi-bell-mouth inlet ring
very close to the recommended Lockwood dimensions.
Hose clamp and bands
Auto fuel hose
Inlet wall
Figure 3-5. Inlet Lip Cross-Section
3.4.2 Part 2: Inlet Pipe
The inlet pipe is essentially a length of steel automotive exhaust pipe of
necessary diameter to provide the desired oti stated in Table 3-1. The pipe is
galvanized steel instead of stainless to reduce cost. Although galvanized parts
were to be avoided in the design for heat concerns, the temperature associated
with the inlet components is much less than around the rest of the engine and is
not expected to affect the galvanization coating.
3.4.3 Part 3: Inlet Bulkhead
The Astra's inlet bulkhead expands the inlet area to the combustor area
with a divergence angle of 45-degrees. This is also true for the Lockwood

HH(5.25")-5 engine as shown in Figure 3-2. Lockwood (7) often refers to the 45-
degree angle of the inlet bulkhead as a "breakthrough in combustor design"
since this design increased the overall performance of the research engines.
The bulkhead is made from 303 stainless steel sheet and is cut from a
pattern, rolled into the cone, and welded at the seam. The three tabs on the
inlet side are bent parallel to the engine axis and slip inside the inlet pipe. Steel
bolts and lock nuts are used to fasten the inlet pipe to the bulkhead. The inlet
bulkhead attaches to the combustor using a type of pressure-ring assembly that
will be discussed in Section 3.4.7.
3.4.4 Part 4: Combustor
The combustor is also made of 303 stainless steel and is cut, rolled, and
welded as was the inlet bulkhead. All holes for bolts, spark plugs, fuel injectors,
and mounting screws were made afterwards so that the heat of welding would
not cause distortion.
3.4.5 Part 5: Exhaust Nozzle
The exhaust nozzle is made exactly as the inlet bulkhead and the
combustor. As in the Lockwood engine, the nozzle reduces the combustor area
to the exhaust area through a convergence of 45-degrees. The nozzle attaches
to the combustor using the same pressure-ring assembly as the inlet bulkhead.
Since the exhaust pipe is much longer and weighs more than the inlet pipe,

60
using tabs as in the inlet bulkhead to support the cantilever exhaust pipe may
not have been successful. To ensure a robust structure, a sleeve is welded onto
the exhaust end of the nozzle that fits into the exhaust pipe. Six steel bolts and
lock nuts attach the exhaust pipe to the nozzle sleeve.
3.4.6 Parts 6 and 7: Inner and Outer Exhaust Pipes
Since tuning the length of the exhaust pipe to the frequency of the engine
is necessary for optimized operation, having a single length of pipe and cutting it
down until the correct length was reached was impractical. The solution to the
problem is solved by employing a variable-length exhaust pipe.
Similar to the inlet pipe, the inner and outer exhaust pipes of the Astra are
lengths of steel automotive exhaust pipe. The diameter of the inner pipe (Part 6)
allows the desired aE listed in Table 3-1 and is directly attached to the exhaust
nozzle. The diameter of the outer pipe (Part 7) is larger so that it slides over the
inner pipe. Since the two diameters are substantially different, an adapter also
made from common automotive stock welded onto the forward end of the outer
pipe increases the tolerances between the two pipes and provides a means to
set the position of the outer pipe (using a hose clamp [Part 16]). The inner pipe
is graduated in half-inch increments so that the forward end of the outer pipe can
be aligned to the marks to set a desired length. The total length of the exhaust
pipe can range from 41 to 61 inches.

61
3.4.7 Parts 8, 9 and 10: Assembly/Mounting Rings and Gaskets
Parts 8 and 9 are the pressure rings described in Sections 3.4.3 and
3.4.5. These rings are made of mild steel and attach the inlet bulkhead and
exhaust nozzle to the combustor. Rings shown in Figure 3-4 as Part 8 also act
as engine mounts.
The pressure ring assembly is illustrated in Figure 3-6. The inlet
bulkhead, combustor and exhaust nozzle each has a quarter-inch high lip turned
perpendicular to the engine axis. When the components are assembled, the lips
are flat against each other. The pressure rings on both sides of the lips are
bolted to one another with twelve, steel bolts and lock nuts, holding the parts
together. Since the pressure rings are larger in diameter than the lips, an
aluminum gasket (Part 10) of thickness slightly less than both lips together is
placed between the rings. Aluminum was selected for its superior durability and
heat resistance compared to the fiberous, high-temperature, automotive gasket
material whose performance proved unsuccessful in early engine tests.
Figure 3-6. Pressure Ring Assembly

The advantages of this part assembly method are that the rings and lips
provide a robust structure and an effective seal between the components to
retain the pressures inside the combustion chamber. This method also does not
require techniques such as welding or excessive material working that can
distort the parts. In addition, the only components in the assembly that are most
likely to fatigue or fail (mostly from over-tightening or thermal stresses) are the
bolts holding the rings together. The primary disadvantage of the assembly is
on a part such as the combustor which has lips at both ends to mate with other
components. Once the rings are slipped over the combustor and the lips are
turned up, the rings can not be removed. Overall, the pressure rings and
associated components have performed successfully throughout testing.
3.4.8 Parts 11 and 12: Fuel Injector and Spark Plug Mounting Plates
The Astra has two fuel injection assemblies mounted opposite one
another and one spark plug assembly on the top of the combustion chamber.
The mounting plates for the fuel injectors and spark plugs are made from
segments of Schedule 40 industrial steel pipe of 4-inch inside diameter. The
plates were made from standard pipe so that their curvature would match that of
the 4-inch diameter combustor to provide a good seal. Also, Schedule 40 pipe
has sufficient wall thickness to allow tapping for both the spark plugs and fuel
injector housings.

Both the fuel injector plates (Part 11) and the spark plug plate (Part 12)
have five holes tapped to accommodate the respective component (fuel housing
or spark plug). The holes are spaced every 15 percent of the 9-inch combustor
length. This allows sufficient material between the holes on both the combustor
wall and the plate to reduce distortion under heat while providing a wide range of
test points. The plates are each held to the combustor wall by eight stainless
steel machine screws that thread into small holes on the mounting plates from
inside the combustor.
3.4.9 Parts 13 and 14: Fuel Injector Housing and Fuel Injectors
The injector housing (Part 13) is a small length of 5/16-inch steel
plumbing pipe (standard 6-inch nipple) that fits into the fuel injector mounting
plate at one end and is attached to the fuel hose at the other via a brass
adapter. The housing can readily be moved to any of the five holes on the
mounting plate. The metal pipe acts as a heat sink to carry heat away from the
fuel hose during engine operation. During some tests, the housing itself acted
as the injector by providing a hole in the combustor wall from which the fuel was
ejected. The fuel system and hose will be further discussed in Chapter 4.
Threaded into the combustor end of the housing and protruding into the
combustion chamber is the fuel injector (Part 14). Since many types of fuel
injectors were developed during the research, the injector body was designed to
be readily removed from the housing so that a variety of fuel nozzle

configurations can be tested in one session. This is accomplished by
manufacturing the injectors from 5/16-inch automotive brake line incorporating a
double-flared end and a line nut which threads into the injector housing. This
method of attachment also permitted various orientations of the fuel injection
pattern with respect to the engine axis. The injector tip designs and patterns
tested will be described in Chapter 5.
3.4.9.1 Part 14A: Axial Fuel Injection Assembly
The purpose of this assembly is to inject fuel along the engine axis down
the center of the inlet pipe. The assembly uses only one of the two fuel injector
housings and a long length of automotive brake line attached in the same
manner as the perpendicular-injection nozzles (Part 14). The fuel line is
suspended at the center of the inlet pipe by two, plus-shaped, strut assemblies
welded together from coat hangar wire. Coat hangar wire was selected for its
availability, malleability, and because its diameter is large enough to support the
fuel line and not obstruct inlet airflow. The most forward strut cross is designed
so that the fuel line can slide through its center and remain supported. It also
has gripping tines that hold it in place inside the inlet. The second strut cross is
fixed axially along the fuel line and keeps the tip of the nozzle located on the
engine axis. The strut crosses allow for the fuel injection location (tip of the
injector line) to be moved axially from inside the inlet pipe to well inside the
combustor while being suspended on the engine axis.

65
3.4.10 Part 15: Fuel Injector Mounting Plate Plugs
Even though there are ten holes (five on each side of the combustor) from
which to inject to the fuel into the engine, only two can be used at once since
there are only two injector housings connected to two fuel hoses. The other
eight holes must be plugged while the engine is operating. For this reason,
9/16-inch, standard pipe plugs are used to fill the unused holes in the injector
mounting plates. These plugs have been modified during experimentation to
accommodate thermocouples and early fuel injector designs.

CHAPTER 4
SUPPORT SYSTEMS, SAFETY AND TESTING FACILITY
4.1 Support Systems
Three support systems are utilized during operation of the Astra. They
are the fuel system, the ignition system, and the air system. Since the Astra and
the support systems were not kept in storage at the test facility, each system was
designed to require minimum set up time and, with exception of the air system,
be completely self-sufficient and easily transportable to and from the test cell.
On-site repair, cost, material concerns, and operator safety were also driving
factors in the design of each system. Each component of the systems will be
described as well as any considerations made during system development.
4.1.1 The Fuel System
The pulsejet is fueled by liquefied petroleum gas (LPG or propane) under
pressure in a portable tank. The propane flow rate is controlled by two valves
located downstream of the tank and is routed through high-pressure hose to a
check valve and pressure gauge. Immediately following the check valve, the
66

67
propane is directed to each of the two fuel nozzles in the pulsejet. A schematic
of the fuel system is shown in Figure 4-1.
Throttle valve
POL fitting
/ Gate valve * 6QW hose
Check valve/ press, gauge
Fuel injector housing
Engine T^^N combustor
iu
Inlet pipe
Axial injection assembly
Fuel injector housing
Fuel hose
Fuel injector
Figure 4-1. Fuel System Schematic
4.1.1.1 Choosing the Right Fuel
In general, liquid fuels such as gasoline and kerosene are extremely
volatile when mixed with the proper amount of air required for complete
combustion. They are also more hazardous in transport since spillage and the
resulting ground contamination are more likely. To atomize liquid fuels
sufficiently for combustion, a pressurizing system is often required. This leads to
additional components that could fail during operation. Special fuel nozzles that
deliver proper atomization and spray pattern could eventually become clogged
with carbon and fuel contaminants. In addition to component cost, repair, and

the harmful combustion products, running the Astra on liquid fuel was not
desired.
Gaseous fuels were the next choice. The two fuels that were readily
available, safer to handle, and did not require a pressurizing system were
propane and butane. Although the two gases are very similar in combustion
characteristics, propane was chosen as the fuel due to the higher vapor
pressure, cooler flame temperature (for material consideration), and extensive
availability. A comparison of commercial propane to commercial butane can be
found In Appendix B. Even though propane costs the same per gallon as most
liquid fuels, it weighs less and produces less harmful combustion products
making it a safer choice with respect to transportability and environmental
concerns.
AAA.2 Propane Tank and Throttle Valves
The fuel tank is twice the size of those found on household gas grills.
The tank weighs 40 pounds empty and 69 pounds when full with approximately
9.5 gallons of liquid propane. The tank is equipped with a valve on top that acts
as the throttle valve in the fuel system. A special adapter entitled a POL fitting is
attached directly to this valve so that fuel lines or additional components such as
regulators can be connected to the tank. The POL fitting can be equipped with a
shut-off valve that halts the flow of gas if the pressure from the tank is too high.

Since the fuel pressure required for the Astra is high enough to activate the POL
shut-off valve, a POL fitting without the shut-off option was selected. Tank
vapor pressure varied with ambient temperature and averaged about 150 psi.
The second valve is in line with the POL fitting and is a standard propane
gate valve. This valve can not control the flow as well as the tank valve but it
adds redundancy to the system with respect to fuel shut-off, especially when
transporting the tank. During engine operation, the gate valve is opened fully
and the primary fuel control is from the tank valve. At engine shutdown, both
valves are closed.
4.1.1.3 High-Pressure Hose
The type of hose selected is high-pressure, high-temperature propane
fuel line similar to that used by propane-powered automobiles and industrial fork
trucks. This hose, designated 6QW, is much stiffer than the typical propane fuel
line found on gas grills and was chosen for its resistance to rupture by puncture,
excessive pressure, and exposure to high-temperatures. The chance of these
conditions occurring was minimized during engine testing. The fuel line
throughout the system has a 5/16-inch inside diameter and all connections to in
line components are with flared hose fittings. Quick disconnect type couplings
were not selected for safety concerns and cost.

4.1.1.4 Check Valve and Pressure Gauge
The single fuel line that comes from the gate valve next encounters the
check valve/pressure gauge assembly. The check valve only allows fuel flow
into the pulsejet and has a port on one side to which an aneroid pressure gauge
is attached. The purpose of the check valve is to prevent any backflow into the
fuel system during the pressure rise cycle of the pulsejet.
The gauge measures the pressure just before the fuel line splits to go to
each of the two fuel injectors nozzles inside the combustion chamber. Ideally,
the pressure gauge should be mounted at the fuel nozzle assembly to measure
injection pressure directly. To reduce cost and system complexity, however,
only one gauge was used at the fuel line junction after the check valve that
measures the pressure going into both lines. This is not the true injection
pressure due to pressure losses through the remainder of the fuel line (about
two feet from the splitter to the nozzle housing), but these losses are considered
when computing mass flow rate and fuel/air ratio.
4.1.1.5 Fuel Injector Housings and Fuel Injectors
These components were described earlier in Sections 3.4.9 and 3.4.9.1
and will not be discussed here. The insert in Figure 4-1 illustrates how the fuel
system is adapted to use the axial fuel injection assembly (Figure 3-4, Part 14A).

71
4.1.2 The Ignition System
The ignition system of the Astra generates a high-voltage spark that
ignites the mixture inside the combustion chamber. The system consists of a 12-
volt DC power box connected to an automobile ignition coil. A typical automotive
spark plug cable is run from the coil to a standard, lawnmower spark plug
adjusted to allow a 3/8-inch spark across the electrodes. Since the mixture is
ignited under atmospheric pressure, no specific gap settings are necessary.
Only a discussion of the power box operation will be given. A schematic of the
ignition system is given in Figure 4-2.
Ignition coil
Figure 4-2. Ignition System Schematic
4.1.2.1 The Power Box
This small box designed and built by the author contains two 6-volt
lantern batteries that energize a dual throw, dual contact relay switch. As the

relay oscillates, it pulses the voltage to the ignition coil which generates a spark
of roughly 30,000 volts every time one set of the relay contacts open. This
occurs at such a high frequency that the spark is continuous as seen by an
observer. The engine is used as a common ground for the coil and the power
box.
The power box is controlled by two switches. The first switch, S1, is the
main power switch to activate the box. The second switch, S2, allows for
continuous spark operation or for a single spark to be generated when a remote
set of contacts is opened. The latter was to be used in conjunction with the
valve system employed early in the testing of the Astra. The continuous mode
was used for ignition in subsequent testing. The capacitors in the system aid in
preserving battery life between spark pulses, while the resistors limit the current
through the relay points to reduce fouling. The box is designed for quick
changing of batteries while at the test facility and all components in the circuitry
are readily available at most electronics supply stores.
4.1.3 The Air System
Since the Astra requires air to be forced through the inlet to start the
combustion process, a compressed air source at the test facility pwas used.
This system consisted of the shop air line coming from the compressor and
attached to a regulator/pressure gauge assembly. The regulator permitted

adjustment of the pressure from the air line. The hose from the regulator had no
special nozzle attachment and was open to the outside. The air line and the
regulator assembly were properties of the test facility.
4.2 Safety Concerns
Many safety issues were considered in the design and testing of the
Astra. The most important design issue was such that the combustion chamber
had sufficient structural integrity to contain the combustion process under
sustained operation. This was considered during material selection and
assembly methods (Sections 3.3 and 3.4, respectively). The Astra's design is
supported by encountering no research literature during this project
documenting any type of catastrophic component failure or testing accidents.
Pulsejets do not explode due to their large inlet and exhaust areas for the
combustion forces to exit through. As long as there is a path through which the
combustion pressure can be released to the atmosphere during operation,
explosive engine failure is not possible. In addition, propane handling
procedures and piping methods were investigated to ensure that the fuel would
not corrode the materials used in either the fuel system or the engine.
Testing safety issues focused on the operator and equipment within the
vicinity of the engine. Both the fuel and ignition system were designed to be
operated about twelve feet from the engine. This allowed the operator to be
located behind a doorway or wall leading into the testing room. Once the light-

off characteristics and flame limits of the engine had been observed in early
testing, locating the operator behind a wall became unnecessary. This was
especially true after realizing that the Astra would exhibit better light-off
performance by directing air into the inlet. All fuel hoses, ignition wires, and
surrounding equipment in the test cell were relocated away from the engine to
reduce exposure to exhaust flames and heat. Several fire extinguishers and
water sources were available and accessible at all times, and testing was never
conducted without supervision or assistance.
Additional concern was given to the operator's close proximity to the
propane fuel tank. Since the throttle and gate valves are located on the tank,
the operator stands directly beside it. Both the POL valve and check valve were
installed in the fuel system to prevent any form of flame ingestion by the fuel
injectors that may travel back into the tank. Although this was not likely to
happen, the precautions were nonetheless taken so that the fuel system used on
the Astra is just as safe as that on a propane-fueled, barbecue grill.
Also of concern were stray sparks generated by the ignition system that
would ignite any gas that may have leaked from the fuel system. Each joint of
fuel system was, therefore, tested for leaks and the ignition system was properly
shielded.
The current arrangement is that the operator is stationed in front of and to
the side of the engine next to the fuel tank with the ignition box and air hose
close by. From here, the operator is clear of any flame and heat generated by

the engine and can closely observe the flame characteristics and engine
performance. Immediately after the engine has been run and the fuel is shutoff,
the ignition system is activated and high-pressure air is flushed into the engine
to burn any residual gas left in the device.
4.3 Testing Facility
The Astra was tested at the Embry-Riddle Turbine Engine Test Facility
located on-campus. The facility instructional specialist, Mr. Roy Lumb, was
present for most of the experimentation and provided valuable suggestions for
the setup. The facility contains two engine cells and a control room for each.
Inside each cell, there are various assemblies used in turbine engine static
testing, fire extinguishers, water hoses, a wash sink and a compressed air
source. Testing was conducted here under the direction of the Aerospace
Engineering department in compliance with insurance and flammable material
regulations. The control room contains a large panel for turbine engine
operation and monitoring, and was not used during the Astra testing.

CHAPTER 5
ENGINE TESTING AND RESULTS
The first half of this chapter will summarize the significant events in the
experimentation of the Astra. The events follow the evolution of the engine in
accordance with the project goals in Chapter 3 and conclude with the final
design configuration and last experiment of the engine. This interesting record
is the developmental history that is not discussed in any pulse combustion
literature (as stated in Chapter 1) and could serve as an example guideline for
future pulsejet development. The second half of the chapter will discuss the
data taken from various instrumentation that describes the performance and
operating conditions of the Astra.
5.1 Original Engine Configuration
The original engine concept employed the ported-rotor inlet valve system
described in Chapter 3. Figure 5-1 shows an assembly drawing and component
identification of the engine arrangement. The test facility and support systems
described in Chapter 4 were used including the compressed air line, even
though the engine was designed to start with no artificially-induced airflow. As
76

Part No. 1 3 4 5 6 7 8 9 10 11 12 13 14 15 16 17 18 19 20 21 22 23 24
Description Valve shaft Valve housing plate - left Valve housing top/bottom Valve rotor side plate Valve rotor quadrants Valve housing plate - right 5/16" bearing/mount Turbine housing plate - rear Turbine housing Turbine Turbine housing plate - front Mounting/attachment rings 1 & 3 Combustion chamber front plate Turbine assy, mount/attachment ring 2 Combustion chamber Exhaust nozzle Attachment ring 4 Exhaust pipe Fuel nozzle mounting plate Spark plug mounting plate Spark plugs (x5) Plugs (x8) ^ ^ j Modified plugs (x2) Af
25 26 27
28 29 30 31
Fuel injector (x2) Turbine inlet duct Turbine bleed duct coupling (3/4n conduit compression coupling) Turbine bleed duct Spacer washer Locking shaft collar Valve housing assembly pin (x12)
Figure 5-1. Astra Component Assembly with Ported-Rotor Valve System ^sl -Nl

can be seen from Figure 5-1, the inlet duct and exhaust pipe were smaller in
length compared to the final engine design, since the literature available during
the design phase did not discuss the importance of the lengths. It was also later
found that the areas for both the inlet and exhaust pipes were not correct. The
exhaust pipe was slightly tapered following Lockwood (7). The fuel nozzles were
1/8-inch diameter copper tubes inserted into special plugs that fastened to the
fuel injector mounting plates. The inlet bulkhead was flat to accommodate the
valve system, as was illustrated in Figure 3-1.
The engine was designed with five spark plugs for ignition because
dummy plugs with the same thread as a spark plug were not available. Instead,
five functioning spark plugs were used with the cable from the coil easily moved
between them to vary the ignition location. In other words, only one of the five
plugs was active at a time. The spark plugs were located every 15 percent of
combustor length, as were the fuel nozzles.
5.2 Test History of the Astra
Run 1:
The first test of the Astra occurred on December 3, 1994. The engine
tried to start, producing singular loud bangs and pops, but no pulse tendency or
pulse combustion was induced. The valve system was also not responding to
the combustion reaction in that the combustion pressure was not sufficient to
drive the turbine. Various fuel injection and ignition locations were tested in an

attempt to start the engine but to no avail. The session did show, however, that
forcing air through the fully-open valve into the combustion chamber produced a
more robust light-off. During the tests, the engine produced a sooty, blue-
colored flame from the exhaust pipe characteristic of a rich fuel/air mixture.
Run 2:
The inlet and exhaust areas of the engine were then compared to the
characteristic length parameters developed by Narayanaswami and Richards
(5). These parameters represented the ratio of combustor volume to either the
inlet or exhaust pipe area. Narayanaswami and Richards found two
combinations of the inlet and exhaust characteristic lengths that worked well in
an experimental pulse combustor model evaluated by Richards and Gemmen
(11). The Astra inlet and exhaust areas were modified to the combination that
performed the best (according to Ref. 11) by adding inserts to match the
characteristic lengths. The engine was then tested again.
Although the bangs and pops were louder than before, the engine was
still burning rich and was thought to be getting too much fuel due to the richness
of the exhaust flame. The check valve was modified to reduce the engine fuel
inlet pressure and allow more accurate control of fuel tank pressure. This
modification produced no change in the light-off characteristics.

Runs 3 and 4:
In the next tests, a propane regulator as used on residential barbecue
grills was installed in place of the check valve/pressure gauge unit so that a
more precise fuel delivery could be possible. The fuel nozzles were crimped
closed at the ends and had small holes drilled along their length to enhance the
mixing of air and fuel. Also, the turbine bleed tube from the combustor that led
to the valve system was closed so that the combustion chamber pressure could
be better maintained. Even though these modifications yielded a yellow exhaust
flame characteristic of a more balanced fuel/air ratio and created much louder
light-offs, the engine still had no tendency to pulse. The exhaust flame was also
pulled back into the engine after its ejection from the pipe, indicating that the
chamber pressure was dropping in accordance with a pulse combustion cycle.
During these runs, compressed air was being injected into the inlet pipe
via the shop air line (Chapter 4). After the initial light-off, the flame would burn
steady and strongly proceed through the exhaust pipe. If the air source was
removed, the steady flame would remain inside the combustion chamber, burn
slowly and become exceedingly rich as observed by soot production and deep
blue color. This rich-burning behavior upon the removal of the air supply
remained throughout the experimentation of the engine. In addition, no
instrumentation other than air and fuel pressure gauges were used in these tests
due to their preliminary nature; the goal at this point in the testing phase was to
get the engine to function. All tests with the valve system were conducted with

81
the valve locked in the fully-open position for the reason that if the engine pulsed
as an aerovalve, the geometry aft of the inlet bulkhead would be correct to allow
pulsing when the valve system was introduced.
Run 5:
Additional literature obtained by the author from Lockwood described the
tetter's studies studies on exhaust pipe length. The tapering, fixed-length
exhaust pipe originally used on the Astra was replaced by a constant-area,
variable-length design made of common automotive exhaust stock. The length
was variable from 22 to 37 inches. High-temperature automotive gasket material
was added between the fuel injector/spark plug mounting plates and the
combustor wall to further reduce the escape of combustion pressure during
operation. Since the fuel regulator did not function as expected (engine still ran
too rich), it was removed from the fuel system under the premise that the engine
was getting plenty of fuel and not enough air. The engine was tested with forced
inlet air (by compressed air line) along with various exhaust lengths and fuel
locations, but produced no significant improvement over previous runs.
Run 6:
Early in March of 1995, the inlet and exhaust characteristic lengths were
re-evaluated and were found to be erroneous. The combustor volume had been
calculated incorrectly which lead to improperly-sized inserts for the areas.

Accordingly, new inserts were designed. The fuel nozzles were also moved to
the most forward combustor position (15-percent). Although testing yielded the
same type of singular bangs and pops that preceded steady combustion, the
fuel/air ratio was more balanced dge to the enlarged inlet area that allowed more
forced air into the engine. As before, no pulse tendency was observed,
regardless of exhaust pipe length.
Run 7:
The next modification was to the fuel injectors. Although the proper
location of the injectors would be near the inlet end of the combustor, this was
not achievable since the fuel injector mounting plates did not extend to that
location. Instead, the copper tubing nozzles were bent in such a way that they
injected fuel parallel to the engine axis at the 15-percent combustor length
location. Testing of this configuration yielded better mixing dynamics as visually
observed through the inlet pipe during operation, but no pulsing or improvement
in performance even with forced inlet air.
Run 8:
Since the engine still seemed to be starving for air after the light-off, the
valve system was completely removed from the engine and the flat inlet
bulkhead remained. A new inlet design, shown in Figure 5-2, was employed that
comprised of small lengths of pipe that could be interchanged to fit on the inlet
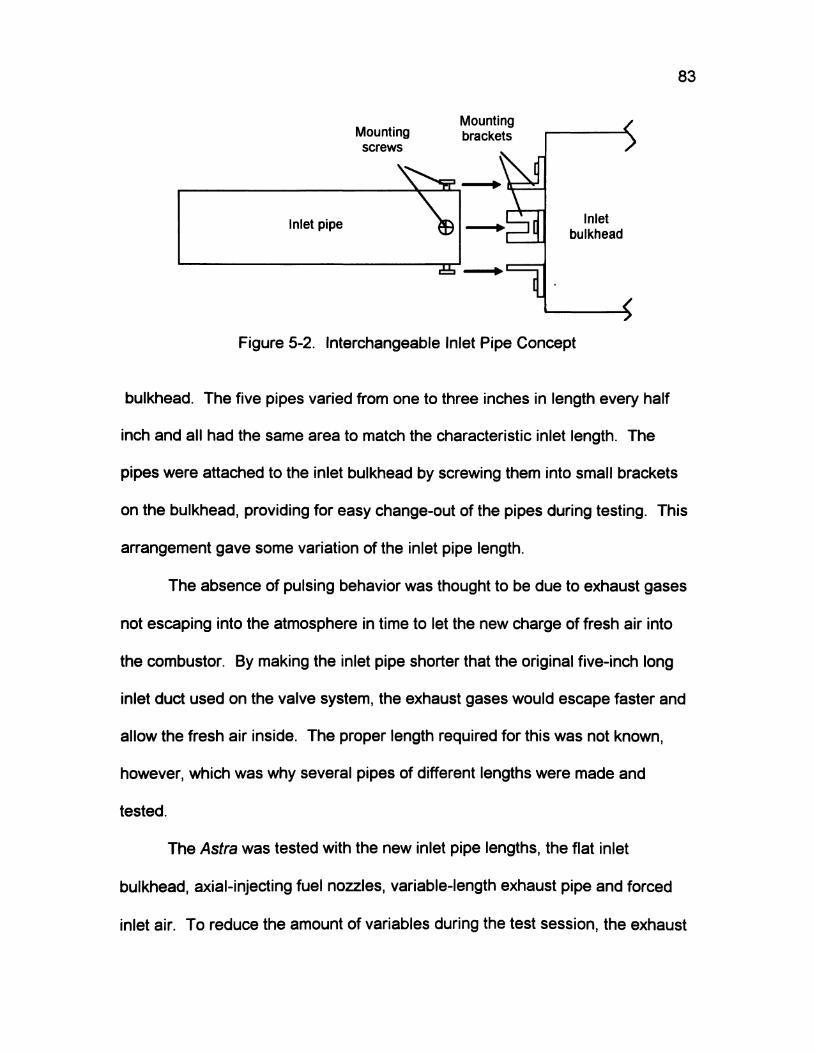
Mounting Mounting brackets screws
Figure 5-2. Interchangeable Inlet Pipe Concept
bulkhead. The five pipes varied from one to three inches in length every half
inch and all had the same area to match the characteristic inlet length. The
pipes were attached to the inlet bulkhead by screwing them into small brackets
on the bulkhead, providing for easy change-out of the pipes during testing. This
arrangement gave some variation of the inlet pipe length.
The absence of pulsing behavior was thought to be due to exhaust gases
not escaping into the atmosphere in time to let the new charge of fresh air into
the combustor. By making the inlet pipe shorter that the original five-inch long
inlet duct used on the valve system, the exhaust gases would escape faster and
allow the fresh air inside. The proper length required for this was not known,
however, which was why several pipes of different lengths were made and
tested.
The Astra was tested with the new inlet pipe lengths, the flat inlet
bulkhead, axial-injecting fuel nozzles, variable-length exhaust pipe and forced
inlet air. To reduce the amount of variables during the test session, the exhaust

length was fixed at 34 inches and the ignition plug used was at 30-percent
combustor length. The goal of the test was to observe the effects of different
inlet pipe lengths on the combustion cycle.
Although no significant effects were noticed other than the size of the
flame that exited the inlet pipe after light-off, delivering excessive fuel pressure
during steady-flame burning produced an interesting result. To start the engine
in past tests, air would first be blown through the inlet pipe at about 10 psi, then
the spark ignition would be activated, then the gate valve would be opened on
the fuel system, and finally the tank (throttle valve) would be opened to allow
about three psi of propane into the combustion chamber. After ignition, the
spark system would be shut off and the engine would burn steady. The
interesting event occurred when an excessive amount of fuel pressure (about 10
psi) was delivered after the engine lit and the spark had been terminated. The
forced inlet air pressure remained constant, but the high fuel pressure forced the
combustion flame out of the exhaust pipe. Once this happened, the air supply
was quickly removed and the flame continued to burn at the exit of the exhaust
pipe by drawing air and fuel through the engine. As the fuel pressure was slowly
reduced, the flame was pulled back inside the exhaust pipe until it had rapidly
traveled down the exhaust pipe and ignited the mixture in the combustion
chamber. This produced a loud "pop* and ejected flame from both inlet and
exhaust pipes after which the engine either extinguished itself or burned very
rich.

85
This behavior was indicative of the first self-aspirating pulse cycle, but
would not sustain itself following the second ignition. Before any conclusions
could be made as to the mechanisms behind this event, more research had to be
done. In the meantime, testing continued to achieve self-aspiration.
Run 9:
Research into inlet pipe design showed that most inlet pipes for aerovalve
pulsejets were just as long as the combustor. An inlet pipe just short of the nine-
inch combustor length was made that attached to the inlet bulkhead in the same
manner as the previous pipes. Again, testing revealed no significant results
even when attempting to start and run the engine with forced air as described in
Run 8.
The characteristic lengths determined by Narayanaswami and Richards
(5) were duplicated in the current Astra design indicating that the engine was
apparently ingesting sufficient air mass through the inlet area. The problem was
thus thought to be fuel nozzles not delivering enough fuel in time for the next
combustion cycle to begin.
Run 10:
The 1/8-inch, copper-tube fuel nozzles used in prior runs were thought to
be too small to deliver the required amount of fuel in the time between
combustion cycles, causing the engine to flame-out or burn steady after the first

86
light-off. The two nozzles were replaced by sections of 5/16-inch pipe (standard
6-inch long plumbing nipple) which in later engine configurations acted as the
fuel nozzle housings. The new nozzles had no special design at the combustor
end and simply provided a large hole through which fuel would flow into the
chamber. For safety concerns, the check valve/pressure gauge assembly was
reinstalled into the fuel system. The engine was tested with the new fuel nozzles
and produced no interesting results even with forced inlet air.
After the test, the process became apparent by which the variables on the
engine could be adjusted to find the correct combination for pulsing. The four
variables were the inlet length (no inlet, five inlets ranging from 1 to 3 inches,
and the 8-3/4-inch length), the fuel injection and ignition location (five locations,
one every 15-percent of combustor length), and the exhaust pipe length (ranging
from 22 to 37 inches). The three-phase series of tests would narrow down the
best operation of the engine based on visual and aural observations of the light-
off stability and strength, and the exhaust flame color and robustness. The
variable settings that produced the strongest light-off and most robust flame
would remain fixed through the next phase. The first phase of tests was to hold
the inlet and exhaust length fixed while the fuel and ignition locations were
varied. The second phase tests would fix the exhaust length as in the first phase
but vary the inlet lengths for the fuel/ignition locations with the strongest light-off
or pulse tendency. The third phase would use the best inlet length and
fuel/ignition location combinations while varying the exhaust length until the

engine began to pulse. During all three phases, the inlet air and fuel pressure
remained constant to establish experimental consistency. Data sheets were
made for systematic testing and experimentation began with the first phase. The
data collected from all three phase? is given in Appendix C.
Runs 11 and 12:
The first phase employed the longest inlet length of 8-3/4 inches and fixed
the exhaust pipe length at 32 inches. Locating the two fuel nozzles and the
spark at different points along the combustor produced a wide variety of light-off
characteristics. Each test was rated on a scale from one to six (six having the
strongest tendency to pulse or most robust light-off) and important comments
were noted. Some yielded weak pops and rich flames while others produced
loud bangs and large exhaust plumes. After a minor repair to the ignition power
box, the first phase testing continued.
Run 13:
The engine began to pulse on April 20, 1995 during one of the final runs
of the first phase tests. The pulsing mode would continue as long as air was
forced into the inlet. Once the pulsing mode had been established, a
throttleable range was found by adjusting the fuel flow to determine the rich and
lean limits of the pulse cycle. Another discovery was that more robust pulses
were produced if the airflow through the inlet became stronger. If the air source

88
was removed, however, the cycle would stop and the flame would burn rich and
steady. The pulsing characteristics were also found to be independent of
ignition location.
Now that the pulsing characteristics of the Astra were apparent, second
phase testing commenced in an attempt to optimize the cycle performance or
achieve self-aspiration.
Run 14:
Six of the best fuel/ignition locations were selected from the first phase to
be re-evaluated with different inlet pipe lengths during the second phase. The
exhaust length remained at 32 inches. During the first test of the second phase,
however, the POL valve on the propane tank (described in Chapter 4) was found
to shut off the fuel pressure if the tank valve was opened too much. In order to
explore pulsing behavior at higher fuel/air ratios, the POL valve was replaced
with a similar non-check valve version that would allow the necessary higher fuel
pressures. Also during this test, a U-tube manometer a hand-held pitot tube
were used to determine the total pressure rise across the device and, therefore,
the thrust. Even though the measurements were successful, the thrust was not
computed since doing so would be meaningless at this point in the
experimentation.

Runs 15 and 16:
This run tested the six best locations from the first phase with different
inlet lengths. In some cases, excessive fuel pressure would lead to a rich,
steady-burning condition inside the combustor with no flame leaving the exhaust
pipe. In other instances, the high fuel pressure would cause the flame to burn
about six inches downstream of the exhaust pipe exit. An important observation
was that the engine produced more heat and robust pulsing conditions if fuel
injection locations were towards the center of the combustor (45 or 60-percent of
the length) rather than other forward or aft locations. The inlet lengths that
yielded the best pulsing characteristics for the first-phase fuel locations were
found to be between 1-1/2 and 2-1/2 inches.
Runs 17, 18, 19 and 20:
Seven of the best conditions from the second phase were tested in the
third phase with the variable exhaust pipe length. Each test was conducted with
the fuel pressure between 3 and 4 psi and the air pressure at around 20 psi held
roughly seven inches from the inlet pipe. Testing of the exhaust pipe length
began at 22 inches and proceeded every inch to 37 inches. As each test was
carefully observed and rated, patterns emerged showing that certain lengths of
the exhaust pipe produced more robust pulsing characteristics than others. The
groups of lengths that had favorable results (robust pulse tendencies) were re-
tested at half-inch intervals to narrow down the optimum length.

Although the groups of favorable exhaust pipe lengths were independent
of the inlet length, they were slightly dependent on fuel location within the
combustor. Varying the exhaust pipe length did not change the pulse
characteristics when the fuel was injected at the center of the combustor, but
had a noticeable effect when the injection was moved rearward. Both central
and aft locations had patterns of favorable pulsing, but the aft locations yielded a
wider range of pulse behavior by varying exhaust length than did the central
locations.
Although the three phases of testing adjusted the four engine variables to
produce the most robust pulsing, self-aspiration did not occur, possibly due to
inadequate fuel/air mixing and engine geometry. At this point in the
experimentation, finding an accurate method to measure the thrust of the engine
became the goal. Lockwood (7) had measured the thrust of his experimental
engines by mounting them vertically (exhaust pipe upwards) on a large floor
scale. The validity of this method was questionable because of how the pulsejet
would function when arranged as such. When mounted vertically with the
exhaust pipe facing upwards, the buoyant force of the hot air from combustion
may influence the pulse cycle as the air travels up the exhaust pipe. This would
lead to different combustion pressures inside the chamber, and thus different
thrust measurements, when compared to a horizontally-mounted engine. The
Astra was never mounted vertically for this reason and so all data regarding
engine performance was taken horizontally.

Three methods were to be investigated and compared to determine the
most accurate for estimating the thrust of a pulsejet. The methods consisted of
measuring the total pressure across the engine during pulse combustion,
obtaining pressure readings from a transducer inside the combustion chamber,
and measuring the force developed on a load cell either by using it to measure
the forward force of a sliding cart on which the engine was mounted or to
register the dynamic pressure of the exhaust gases via a pressure plate device.
Although it was possible to collect data on all three methods at once, each was
done independently to demonstrate that the available instrumentation could
record the necessary measurements.
The ignition location for all following runs in the three-phase testing
remained at 45-percent combustor length, since the ignition location was shown
to have no influence on the pulsing characteristics of the engine.
Run 21:
This run demonstrated that a total pressure change across the engine
was being produced from the pulse combustion process and not from the air
forced into the inlet. The water-filled manometer and pitot tube described earlier
was used to obtain readings. With just the air flowing through the engine, the
pressure just aft of the exhaust pipe displaced about three-tenths of an inch of
water. While the engine was pulsing, however, the displacement increased to
six-tenths of an inch. Readings were not taken at the inlet due to the

interference of the forced air flow. Combustion chamber temperature readings
using a Nanmac Corporation Type K shielded thermocouple were also taken so
that a temperature map could be constructed showing the hot and cool spots
within the chamber.
Run 22:
Now that the manometer and thermocouple proved successful in
measuring the required data, the pressure transducer and load cell had to be
prepared and calibrated. The pressure transducer was a Kistler Instruments
Model 206 high-sensitivity piezotron capable of measuring up to 80 psi at 124.7
mv/psi. The transducer was connected to a Kistler Instruments Model 504D
charge amplifier that boosted the signal output to a Hewlett-Packard 54601A
four-channel, digital oscilloscope. The pressure signal from the transducer was
then plotted directly from the oscilloscope to a Hewlett-Packard ColorPro pen
plotter. The transducer was mounted in a pipe assembly similar to one of the
fuel injector housings such that it was attached to the engine in place of one of
the plugs on the fuel injector mounting plate. A modified, plastic, soda bottle
filled with ice surrounded the transducer housing and kept it cool during engine
operation.
The load cell was an Eaton Corporation Model 3167-25 with a maximum
load of 25 pounds in tension or compression. The load cell received its power
from a Hewlett-Packard 6114A variable power supply. The output signal was
then input into the HP 54601A oscilloscope. The load cell was first used to
measure the forward force on a skateboard on which the Astra was mounted.
Before the actual test, the engine, skateboard, load cell, and data acquisition
equipment were assembled to see jf the load cell would register the slight
forward forces generated by the engine. The skateboard was set up against the
load cell and would detect the slightest tap on the skateboard in the forward
direction. A calibration factor for the load cell was then determined by applying
known weights and measuring the voltage change. The load cell system was
ready for testing.
The Astra was set to pulse with forced inlet air and the pressure
transducer and load cell/skateboard system were tested. Although the pressure
trace on the oscilloscope from the transducer was excellent, the charge amplifier
settings were questionable such that no actual pressure data was calculated.
The settings were corrected later and will be discussed in Section 5.3.4. The
engine was also set to run steady with forced air to demonstrate that the
pressure signatures for pulsing and steady operation were significantly different.
As for the load cell, the oscilloscope revealed no output from the system.
When the engine was shut off, however, the load cell was as sensitive as before.
The observation was made that since the engine is axisymmetric and the
exhaust gases leave both the inlet and exhaust pipes at the same time, there
would be no net thrust produced that would create a forward force on the load
cell. In addition, an unknown 60 Hz signal was being detected by the
oscilloscope that may have distorted the load cell output. Since using the load
cell in this manner proved unsuccessful for thrust measurement, it was then
employed in a dynamic pressure plate assembly.
Run 23:
A stainless steel plate of known area was vertically attached to the load
cell. The plate and load cell were to be placed into the exhaust jet of the engine
(for a short time due to heat concerns on the load cell) and the dynamic pressure
pulses were measured by the oscilloscope.
The dynamic pressure plate system was tested at the same pulsing
conditions as the previous run. Again, no signal was detected by the
oscilloscope. This was thought to be due to the resolution of the load cell. The
forces were much less than the load range for which the cell was designed
making the voltage change per pressure pulse too small to register on the
oscilloscope. Since using that particular load cell to measure thrust did not work
as expected and no other load cells were available, the concept was no longer
used.
Measuring thrust through the use of dynamic pressure plates had worked
for some researchers, however. Rehman, as described in Putnam et al. (1),
used impact plates to quantify thrust on his aerovalve pulsejets.
Since the correct charge amplifier settings for the pressure transducer
were not known at the time, the only somewhat successful method of measuring

thrust was from the manometer and pitot tube, even though the error in such a
system is relatively high. Due to the experimental elimination of other methods
to compare with, the quest for the most accurate thrust measuring technique
ended. The project goal changed back to achieving engine self-aspiration.
The decision was made to change the geometry of the Astra to resemble
a scaled-down version of one of the Lockwood engines, the HH(5.25")-5 shown
in Chapter 3. The inlet pipe and inlet bulkhead were consequently redesigned
such that the inlet pipe was as long as the combustor and had an area according
to the trends in aerovalve design (discussed in Chapter 2). The flat inlet
bulkhead left over from the valve system was replaced by a 45-degree diverging
bulkhead similar to the engine's exhaust nozzle (Figure 5-3) and according to
the research conducted by Lockwood (7).
— *
Inlet pipe « 45-degree inlet bulkhead
6 Figure 5-3. Inlet Pipe and 45-Degree Inlet Bulkhead
Run 24:
The new engine design was tested with an exhaust length of 34-1/2
inches and showed no tendency to self-aspirate when the forced inlet air was
removed. During pulsing operation, however, strong, visually-observable
vibrations were noticed throughout the engine indicating that a force was being

96
produced. Various fuel locations using the same, large, open-hole-type fuel
injectors introduced in Run 10 yielded the same pulse strength and combustion
characteristics.
Run 25:
Now that the inlet geometry had been corrected to represent a working
model (Lockwood's engine), the mixing dynamics of the air and fuel were
thought to hold the answer to the self-aspiration dilemma. Fuel nozzles were
manufactured from automotive brake line that approximated a concept
researched by Lockwood (7) and attached to the ends of the fuel injector
housings that were currently being used as the injectors. These nozzles (Figure
5-4) were crimped at the ends such that a slit was present to disperse the fuel in
a fan pattern.
6 9
\
Fuel " —</i injectors _^ v ,
Figure 5-4. Crimped-End Fan-Pattern Fuel Injectors
The two fuel injectors were attached to the injector housings and placed
at the 15-percent location on the mounting plates. This location was similar to
that used by Lockwood during the investigation of optimum fuel sprayer design

and location. The engine exhibited very little pulse tendency and the overall
operation was much worse than before even with the forced inlet air. The
injectors were removed on-site and the engine was tested again with exhaust
pipe lengths of 37, 34-1/2, 30 and 28 inches. Although there was no significant
difference in performance among the tested exhaust lengths, the pulse operation
was much improved due to the removal of the injectors.
The effect of the forcing air through the inlet pipe to sustain pulse
combustion needed to be investigated in the hope that some clues as to the
engine's air requirement might be revealed. To aid in the investigation, a bell-
mouth inlet as used by Lockwood and other researchers was constructed from
rubber, automotive fuel line and a hose clamp per the specifications described
by Lockwood (7) and in Chapter 2.
Run 26 and 27:
The Astra was run employing the bell-mouth inlet to observe how the
engine functioned with the air supply at various positions in front of the inlet.
The engine was started and pulsed as before, but the air jet from the hose was
moved farther back from the inlet pipe (approximately three to four feet) to
reduce the air velocity into the engine. The engine still pulsed well and the fuel
pressure had to be adjusted to compensate for the slower air velocity. The bell-
mouth made the engine more tolerant of angled air injection and was kept
through the remainder of the experimentation.

Runs 28 and 29:
Since the geometry of the inlet and combustion chamber was identical to
the Lockwood model, the engine should have had no difficulty receiving a
sufficient amount of air for combustion. The absence of self-aspiration,
therefore, had to have been caused by the combustion dynamics not driving the
pressure low enough during the pulse cycle to draw in air. One possible solution
was to enhance the fuel/air mixing by employing a stabilizer plate as researched
by Keel and Shin (10). This plate was suspended in the center of the
combustion chamber close to the inlet bulkhead and was mounted perpendicular
to the engine axis. The plate used in the Astra was made of mild steel and was
suspended in the chamber by two, modified, steel, bicycle spokes. The fuel
injectors were located forward of the plate at the junction of the inlet bulkhead
and the combustor. The purpose of the plate was to cause the incoming air
mass to be deflected towards the sides of the combustor and simultaneously mix
with the fuel. The fuel/air mixture would pass by the plate and be ignited by the
residual gases of the previous cycle that were trapped in the plate's wake. This
method enhanced the mixing dynamics for Keel and Shin, and was thus tried on
the Astra.
New fuel injectors were also constructed that delivered the fuel in a fan-
type pattern parallel to the axis of the engine. The injectors protruded into the
combustor about 1-1/4 inches.

The three-inch diameter stabilizer plate was mounted at 22-percent of the
combustor length. The location of the plate was fixed throughout the
experimentation. The axial-delivery fan-type injectors were employed at the 15-
percent location (upstream of the plate). Even with the forced inlet air, the
engine did not pulse under the same fuel/air ratio and start-up sequence as prior
runs. The engine also did not pulse when the fuel the injectors were moved to
30 percent (downstream of the plate) and the new nozzles were removed.
To further simulate the Keel and Shin experiments, another set of fuel
injectors were designed that delivered the fuel in the same fan pattern but
protruded further into the combustor (about 1-3/4 inches). These nozzles were
also mounted at the 15-percent location and ejected fuel such that it impinged on
the plate. There was no noticeable improvement in performance. This indicated
that the engine was not receiving enough air for combustion due to airway
blockage by the stabilizer plate, even with the forced air supply.
Runs 30 and 31:
The plate diameter was reduced to 2-1/2 inches and the engine was run
with the same longer fuel nozzles as in Run 29. The pulse tendency with the
forced inlet air had returned and occurred at a much higher frequency than
before. Although there was a noticeable throttling range, the pulse cycle was
not as robust as in previous tests without the stabilizer plate and fuel injectors.
Tests were conducted with the fuel injectors oriented parallel and at 45-degrees

to the plate; Again, no pulsing was observed. The fuel injectors were removed
and the engine pulsed at a much lower frequency than prior runs even with the
same air inlet pressure.
Another set of fuel injectors was developed from automotive, steel, brake
line. The injectors were of constant area and protruded into the center of the
combustor. The two opposing injectors were close enough such that the fuel
streams would impinge on one another and fan out radially, as shown in Figure
5-5. Half of the fuel spray would impact the plate and the other would travel a
short distance down the inlet pipe. Testing of these nozzles yielded no pulse
tendency by the engine.
* y
Fuel injectors
>
^rr1^ Stabilizer - plate
• *
Figure 5-5. Opposing Fan-Pattern Fuel Injectors
Run 32:
The plate was further reduced to 2 inches in diameter and another set of
fuel injectors was manufactured. These injectors were also long enough to
reach the center of the combustor but ejected the fuel axially in two streams
along the axis of the engine.

101
The Astra was tested with the new plate size, axially-injecting central fuel
nozzles and forced inlet air. In several tests, the injectors were oriented away
from and towards the plate both upstream and downstream of the plate (15 and
30-percent combustor length, respectively). A slight improvement in the pulsing
characteristics was noticed when the injectors were upstream of the plate and
facing down the inlet pipe away from it (Figure 5-6). The injectors were then
removed and the engine functioned no differently. The other tests with the
different orientations yielded no pulse combustion improvement over Runs 30
and 31.
, /n ' Fuel
injectors ^=£J I stabilizer h' plate
> V±l ,
Figure 5-6. Axially-injecting Central Fuel Nozzles
The stabilizer plate not only impeded the inlet airflow but also the
backflow from the engine after the light-off. This created a rich condition since
the combustion was not receiving a sufficient amount of air. The plate was thus
removed and the engine was tested again with the fuel injectors used in Run 32.

102
Run 33:
Testing without the plate and rearward-facing axial injection at 30-percent
combustor length showed a marked improvement in combustion characteristics
and pulse behavior with the forced inlet air. The flame color indicated a more
balanced fuel/air ratio and the pulsing was nearly as strong and robust as
without the fuel nozzles. Additional tests with the injectors at 15-percent and
facing them forward (towards the inlet pipe) yielded improved results. With the
injectors facing forwards, the single pulse cycle without the ignition or air source
as described in earlier runs was achieved, but would burn steady or extinguish
immediately afterward. In another test, one injector was turned to face
downstream while the other remained facing upstream. This produced no
pulsing whatsoever.
The spark location was varied during this run to investigate various light-
off conditions with the fuel injectors oriented in different positions. The best
ignition location for all cases remained at 45-percent.
Evaluation of additional pulse combustion literature revealed that, in some
engines, the fuel was injected through a long, single tube that traveled the length
of the inlet pipe and ended where the inlet bulkhead began. A single fuel-
injection tube was constructed that was suspended in the inlet pipe on the axis
of the engine. This assembly was discussed in Chapter 3. The injector could be
moved several inches axially to find an optimum injection position. The fuel
system was easily modified to handle the single injector.

103
Runs 34 and 35:
Further research into the Lockwood reports (Ref. 7) and other literature
showed that the exhaust pipe length of the Astra did not conform to the
aerovalve design trends evaluated in Chapter 2. The exhaust pipe of the engine
was originally designed according to Lockwood's conclusion that the best
exhaust geometry for a compromise between low thrust specific fuel
consumption and high thrust-per-volume was a pipe length-to-diameter ratio of
18.5. Contrary to this statement, however, the exhaust geometries of
Lockwood's experimental engines had length-to-diameter ratios much greater
than 18.5 and followed the trends summarized in Chapter 2. After this
discovery, the Astra's exhaust pipe was lengthened to achieve the necessary
length ratio (A,E from Chapter 2). The length of the exhaust pipe was now
variable from 47 to 61 inches.
The Astra was tested with the single fuel injector such that a stream of
fuel was axially ejected into the chamber. The injector was positioned so that its
end was at the same point as the exit of the inlet pipe. The exhaust length was
varied from beginning to end to isolate the best length for pulsing, which was
between 50 and 53 inches. The pulsing characteristics with the forced inlet air
were excellent, just as in earlier runs with the two open-hole-type nozzles, but
there was still no tendency to self-aspirate. The fuel and air pressures that
yielded the most robust pulsing behavior were found (5 psi fuel and 25 psi air)
and a throttleable range between rich and flame-out conditions was determined.
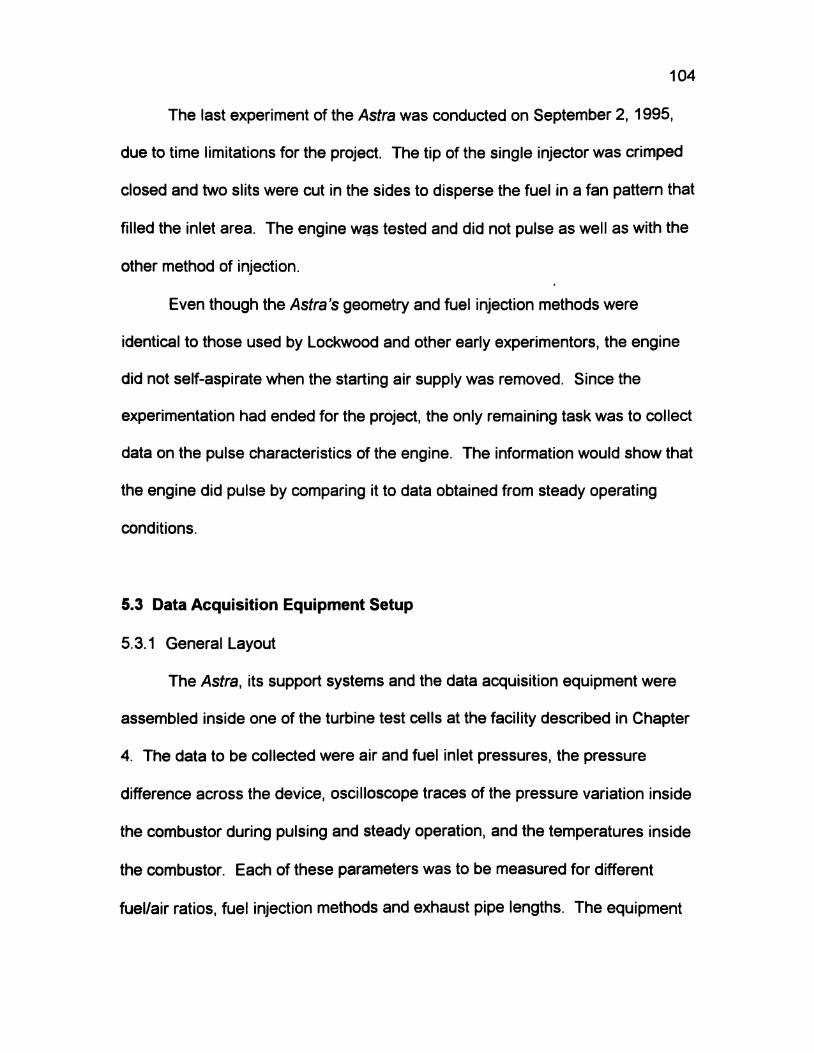
104
The last experiment of the Astra was conducted on September 2, 1995,
due to time limitations for the project. The tip of the single injector was crimped
closed and two slits were cut in the sides to disperse the fuel in a fan pattern that
filled the inlet area. The engine was tested and did not pulse as well as with the
other method of injection.
Even though the Astra's geometry and fuel injection methods were
identical to those used by Lockwood and other early experimentors, the engine
did not self-aspirate when the starting air supply was removed. Since the
experimentation had ended for the project, the only remaining task was to collect
data on the pulse characteristics of the engine. The information would show that
the engine did pulse by comparing it to data obtained from steady operating
conditions.
5.3 Data Acquisition Equipment Setup
5.3.1 General Layout
The Astra, its support systems and the data acquisition equipment were
assembled inside one of the turbine test cells at the facility described in Chapter
4. The data to be collected were air and fuel inlet pressures, the pressure
difference across the device, oscilloscope traces of the pressure variation inside
the combustor during pulsing and steady operation, and the temperatures inside
the combustor. Each of these parameters was to be measured for different
fuel/air ratios, fuel injection methods and exhaust pipe lengths. The equipment
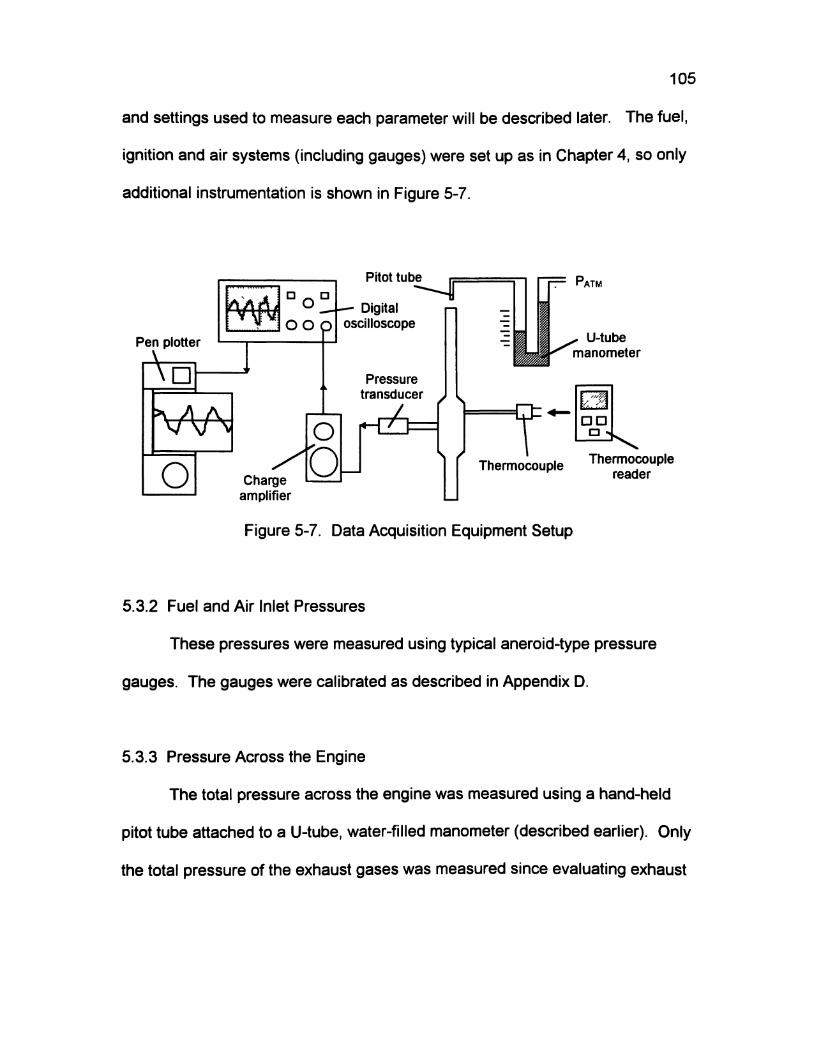
105
and settings used to measure each parameter will be described later. The fuel,
ignition and air systems (including gauges) were set up as in Chapter 4, so only
additional instrumentation is shown in Figure 5-7.
Pen plotter o o o
W. O Charge
amplifier
Pitot tube
— Digital oscilloscope
Pressure transducer
^ r
§
ATM
U-tube manometer
O / 'OJ
FiVii Mf-it
D D
Thermocouple Thermocouple r reader
Figure 5-7. Data Acquisition Equipment Setup
5.3.2 Fuel and Air Inlet Pressures
These pressures were measured using typical aneroid-type pressure
gauges. The gauges were calibrated as described in Appendix D.
5.3.3 Pressure Across the Engine
The total pressure across the engine was measured using a hand-held
pitot tube attached to a U-tube, water-filled manometer (described earlier). Only
the total pressure of the exhaust gases was measured since evaluating exhaust

106
velocity was not required. Readings in inches of water were taken at both the
inlet and exhaust pipes while the engine was operating.
5.3.4 Combustion Pressure Variation
This parameter was measured using the pressure transducer and
equipment mentioned earlier in Run 22 of Section 5.2. The piezotron transducer
was directly connected to the charge amplifier via coaxial cable. The amplifier
was set to the piezotron mode, a short time constant, 1.247 mv/psi sensitivity
and one volt/psi range. This range supposedly converted the 124.7 mv/psi
signal for which the transducer is rated to one volt/psi, making interpretation of
the oscilloscope data easier. The signal was then routed to the Hewlett-Packard
digital oscilloscope which was set to five volts/division at 10 milliseconds
timebase. The input channel was set to AC-coupled mode and employed a
bandwidth limiter to reduce data scattering. The oscilloscope displayed both the
maximum peak-to-peak voltage and average voltage of the signal. Whenever
the screen would display a strong, uniform signal from the transducer, the
screen was frozen and sent to the pen plotter via the oscilloscope's printing
utility. Since the scope was set for five volts/division and the signal from the
charge amplifier was one volt/psi, the pressure values could be interpreted
directly from the signal trace.
The charge amplifier settings were found to be incorrect after all data had
been acquired. Kistler Instruments had explained that since the transducer

107
sensitivity exceeded the range of the charge amplifier, the pressure was actually
100 times less than measured by the scope trace. This correction is accounted
for in the discussion of the data in Section 5.5.
5.3.5 Temperature Measurements
The combustion chamber temperatures were measured using the
thermocouple and digital reading instrument described in Run 21 of Section 5.2.
The calibration of these instruments was conducted as described in Appendix O.
Temperature readings were taken every 15-percent along the combustor
length on the axis of the engine. To establish consistency within the data, the
engine was started and run for between 45 and 90 seconds before the
temperature reading was taken, after which the engine was shut down and the
thermocouple moved to the next location. The engine starting and stabilization
process was repeated until all five readings were recorded.
5.4 Data Acquisition Procedure
The experimental procedure was carefully designed such that all data
with the exception of temperatures could be collected at once. The procedure
was adopted to conserve fuel. To expedite the data collection process, student
volunteers assisted in setting up the equipment and reading instruments during
the runs.

108
The first testing day with all instrumentation was September 29, 1995.
Due to charge amplifier and cable problems, no pressure variation plots were
made of the runs tested. The first run had the engine pulsing with axial fuel
injection and 55-inch exhaust length. The fuel and air inlet pressures,
manometer readings and the temperature at 15-percent combustor length were
recorded. The engine was shut down and the thermocouple moved to 30-
percent. The engine was then started and ran for 45 seconds at the same
fuel/air ratio before the temperature reading was taken. This repeated until the
temperatures at the five combustor lengths were measured.
The second run was conducted at the same fuel/air ratio as the first
(conducive to pulsing) and an exhaust pipe length of 60 inches. The third run
occurred at the same fuel/air ratio and an exhaust length of 50 inches. Since no
correlation was ever found by other experimenters between exhaust pipe length
and combustion temperature, the temperatures for these runs were not recorded.
For the fourth run, the exhaust pipe length was reset to 55 inches and the
fuel/air ratio was increased to produce a steady operating condition. The
steadiness of the condition was only observable by aural comparison with the
previous runs that pulsed, since the pressure transducer could not be used to
obtain a pressure trace. All data were recorded including the five combustor
temperatures.
The fifth and last run was conducted at the same 55-inch exhaust length
and fuel/air ratio as the first three runs, only the single, axial, fuel injector was

109
replaced with two open-hole-type injectors at 15-percent combustor length.
Since the fuel/air ratio and exhaust length were as in the first three runs, all data
but the temperatures were recorded.
Once the problems had been solved with the charge amplifier and
cabling, the Astra was tested again on October 3, 1995. The goal of this series
of runs was to obtain the oscilloscope pressure traces for each of the conditions
tested before and to repeat some runs for experimental comparison. The runs
were structured identical to the first day of data recording. Temperature
measurements were also repeated, except that the engine operated for 90
seconds between thermocouple readings instead of 45 seconds.
Two additional conditions were tested on this day. Now that the pressure
transducer was working, the run which seemed to be operating in a steady
condition on the first day was found to be pulsing (as will be discussed in the
next section); Therefore, to achieve the steady condition, only fuel was injected
into the engine and burned. The absence of the forced inlet air used to induce
pulsing in all previous tests caused the flame to burn rich and steady. The data
for this condition were recorded. The other condition tested was of just the inlet
air and no fuel passing through the engine. The air pressure was the same as
used in the pulsing runs. The pressure data from this condition is the basis on
which the engine behavior is compared, as discussed in the next section.

110
5.5 Testing Results
The data measured during the two days of testing is summarized in Table
5-1. The conditions described at the top of the table indicate the type of
operation (pulsing or steady), the fuel injection method (perpendicular or axial),
and the exhaust pipe length (LEx). Each parameter will be discussed as well as
any observations or significant facts about the data. Even though references to
the combustion pressure traces obtained from the oscilloscope will be made, the
plots will not be described in detail until later.
5.5.1 Fuel and Air Inlet Pressure
These values were recorded directly from the pressure gauges on the fuel
and air systems. The engine pulsed well with the 5 psi fuel and 30 psi air
combination as in the first four conditions of the table. The first run of the fifth
condition (15 psi fuel and 30 psi air) was thought to be the steady operating
state mentioned earlier. The second run of the fifth condition was the fuel-only
state with no forced inlet air. The fuel pressure was held at 10 psi and the flame
burned on its own.
The air-only condition was run at the same air pressure as the first four
conditions to illustrate (by evaluation of the pressure traces) that the pressure
changes caused by the pulse combustion cycle were independent of the forced
inlet air.

Table 5-1. Astra Data at Various Operating Conditions
Run! 9/29/95 Run 2: 10/3/95
Hv. Condition
Parameter's^ Fuel/Air (psi)
hr IN /hT EX (inH20)
Tis (°R)
T30 (°R)
T45 (°R)
Teo (°R)
T75 (°R)
Frequency (Hz)
Max. pressure peak-peak (psi) Avg. pressure
(psi) 1
Pulse, Pro 15% LBC=55"
1 2
5/30 5/30
.357.45 .37.35
- -
-
-
- -
- -
137.9
.2547
.00754 I
I Pulse, Axial Ux*55"
1 2
5/30 5/30
.6/.4 .35/.35
795 894
1035 1034
1351 1341
1565 1714
1760 1975
f§Mmi '•&$%&:' "WffiBflt&BFi
111.1
.3188
.01575
Pulse, Axial LEX=60"
1 2
5/30 5/30
.3/.4 .4/.35
- -
- -
- -
- -
- -
100.0
.2703
.00393
I Pulse, Axial LEX=50"
1 2
5/30 5/30
.25/.5 .25/.4
- -
- -
~ "
- -
- -
MflBi 126.9
.2859
.00058
I Steady, Axial LEX=55"
1 2
15/30 10/1
.45Z.45 0/0
679 1640
826 1307
1114 1134
1297 1050
1539 1030
afl&slH 125.0
.3156
.00407
Air only
0/30
-.1/.2
-
-
-
-
-
iM M&
.0328
.00145

112
5.5.2 Total Pressure Measurement at Inlet (hTiN> and Exhaust (hTEx)
If a pulsejet (valved or aerovalve) functions through self-aspirating pulse
combustion, the exhaust pressure becomes a significant factor in determining
the performance of the device. The exhaust pressure is directly related to the
pressure rise within the combustor due to the pulse cycle. Since atmospheric
pressure is the comparative condition for a self-aspirating engine, the greater
the exhaust pressure above atmospheric, the better the performance. The
Astra, however, never achieved self-aspiration and pulsed only when air was
forced through the inlet. In this case, the exhaust pressure developed from
forcing air through the engine without combustion became the comparative
condition. Exhaust pressures above those of the air-only condition were
indicative of the "pressure gain* due to the pulse combustion process.
The exhaust pressure in all pulsing cases is greater than the pressure
measured from the air-only condition, indicating the inherent pressure gain
resulting from pulse combustion. An examination of the exhaust pressure of the
first run of the fifth condition, thought to be steady combustion by aural
inspection, also indicates a pulsing behavior. Pulse combustion for that run is
further supported by comparison of its pressure trace to others that were pulsing.
An important issue was considered when using the manometer to
measure the exhaust pressure during pulsing operation. Since the exhaust
gases were continuously reversing flow direction through both the inlet and
exhaust pipes (as described in Chapter 2), the manometer readings represented

113
an average pressure between pulses. Since the average readings denoted a
positive pressure, the exhaust pressure leaving the pipes was greater than the
inlet pressure. This indicated that the mean combustor pressure was slightly
greater than atmospheric, as it should be for a pulse combustion cycle.
The manometer heights measured for the air-only condition indicate a
negative pressure at the inlet pipe. This negative value is not relevant in
evaluating pulse combustion characteristics and was caused by the pitot tube
measuring its own wake when the air was flowing around it. With the exception
of the two runs (not including the air-only condition), the total pressure of the
escaping exhaust gases at the exhaust pipe was either equal to or greater than
at the inlet.
5.5.3 Combustion Temperatures
The temperature parameters are listed in Table 5-1 by their combustor
location (i.e., T45 indicates the reading at 45-percent combustor length). The
Fahrenheit readings taken during the tests by the digital thermocouple reader
were converted to Rankine for standardization.
Temperature readings were taken only for the second and fifth operating
conditions. The readings from first runs of both conditions were recorded after
the engine was operational for 45 seconds and the second run readings were
taken after 90 seconds of operation. The stabilization times account for the
temperature differences at some combustor locations between the first and

114
second runs of the second condition. With respect to the fifth condition,
although the engine was set up identically for both runs, the fuel/air ratios were
drastically different and so the two runs have no relation to one another. A
graph of temperature versus combustor length is given for each of the four
temperature runs in Figure 5-8. Figure 5-8(c) was originally thought to
correspond to a steady operating condition and is labeled as such, even though
evaluation of the data proved it was not.
The graphs indicate that for pulsing conditions, the hottest part of the
combustion chamber is towards the rear and is independent of fuel injection
location. This is not so for the steady condition, where the hottest part is
towards the front of the chamber just after the fuel injection point. This trend
indicates that the flow dynamics of the forced air retain the combustion at the
back of the chamber. Although this contradicts the observations of both Ponizy
and Wojcicki (4) and Keel and Shin (10), their pulse combustion devices are
self-aspirating, whereas the Astra is not. In addition to the graphs, Table 5-1
shows broader range of temperatures over the combustor length associated with
pulse combustion than with the steady condition. The temperature increases
about 1000 degrees-R from the front to the rear of the combustor for the pulse
condition compared to about 600 degrees-R for the steady case.
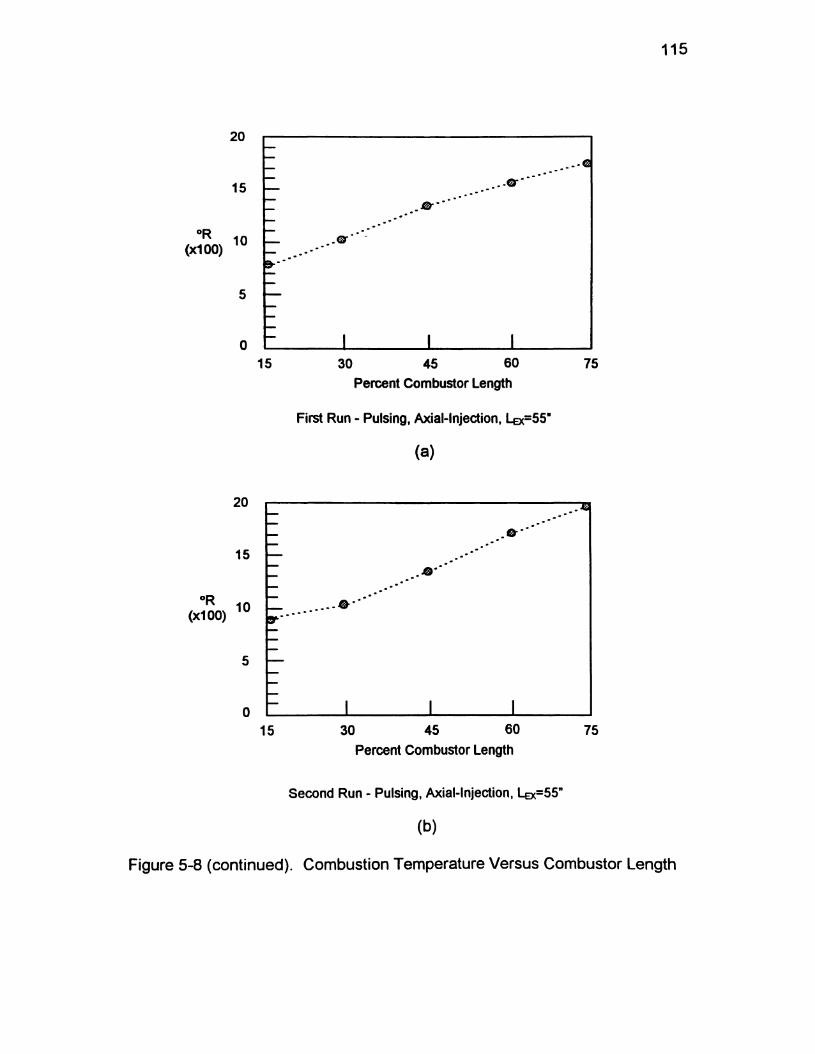
1
20
15
^ 10 — (x100) _
5 —
30 45 60
Percent Combustor Length
First Run - Pulsing, Axial-Injection, Lec=55"
(a)
75
20
15 —
(x100) 10
5 —
15 30 45 60 Percent Combustor Length
75
Second Run - Pulsing, Axial-lnjection, I_EX=55"
(b)
ure 5-8 (continued). Combustion Temperature Versus Combustor Length

116
20
15 —
10 — (X100) _
5 —
30 45 60
Percent Combustor Length
First Run - Steady, Axial-lnjection, LEX=55°
(C)
75
10 — (X100) _
30 45 60
Percent Combustor Length
Second Run - Steady, Axial-lnjection, LEX=55"
(d)
Figure 5-8 (concluded).

117
5.5.4 Combustion Pressure Traces
5.5.4.1 Oscilloscope Plot Description
Table 5-1 indicates the runs for which pressure traces were obtained from
the oscilloscope. The figure number for each plot is given in the shaded row.
As mentioned earlier in Section 5.3.4, the settings for the oscilloscope were five
volts/division and 10 millisecond time base, which remained constant through all
of the runs. The settings are listed at the top of each plot and on the axes of
Figure 5-9(a). The scope also calculated the maximum peak-to-peak voltage
and average voltage of the signal and displayed those values at the bottom of
the screen. These values are also listed in Table 5-1.
The small mark on the right-center of the traces indicates the zero-signal
reference line, which is represented by a horizontal, small-dashed line. The
horizontal, large-dashed line either above or below the reference line indicates
the average voltage. The two vertical dashed lines present in of some traces
are produced by the oscilloscope and are not important for this discussion. All
additional text and symbols on the plots indicate other channel settings, also not
reverent to this discussion. The display grid connecting the tick marks
surrounding the trace was not plotted for clarity.
5.5.4.2 Pressure Signal Trace
There are many similarities in the signals from the oscilloscope that
should be discussed before a comparison of Figures 5-9(a) through 5-9(f) can

118
lms.oov «-O.OOs 10.og/ f 1 STOP
5 V/div. : / . . .
Vp-pC 15=25.47 V VavgCl)=-754.3mV
10msec/div.
(a)
«-0.00s 10.05/ * i STOP
Vp-pCl)=31.88 V VavgCl)=1.575 V
(b)
Figure 5-9 (continued). Oscilloscope Traces of Combustor Pressure Variation

Vp-pCl)=27.03 V VavgCl)=-392.7mV
(C)
lmS.OOV +-0.00S 10,0g/ f 1 STOP
. . . . ± / . . . . I . . . . I . . . . 1 . . . . t . . . . I f , , .
Vp-pCl)=28.59 V VavgCl)=-50.77mV
(d)
Figure 5-9 (continued).

120
O.OOs 10.03/ f1 STOP
Vp-pC1)=31.56 V VavgCl)=-407.4mV
(e)
ittis.oov •-O.OOs 10.03/ f 1 STOP
Vp-pCl)=3.281 V VavgCl)=-145.3mV
(f)
Figure 5-9 (concluded).

121
be conducted. With exception of Figure 5-9(f), all of the pressure traces are
very ragged and irregular in amplitude within certain limits. Examination of the
pressure peaks and valleys reveals two or sometimes three smaller peaks at the
top (or bottom) of each pressure wave that are generated from the dynamics of
the combustion process. The non-uniform amplitude of the waves is produced
by the unsteady flow dynamics between pulses. Nonetheless, the amplitudes in
all of the traces are constrained within certain pressure limits as dictated by the
pulse cycle of the engine.
5.5.5 Pulse Combustion Verification
The pressure trace from the air-only condition is shown in Figure 5-9(f).
As discussed in Section 5.5.3, this condition was the comparative baseline to
determine whether the Astra was pulsing. When comparing the frequency and
amplitude of Figures 5-9(a) through 5-9(e) to those of Figure 5-9(f), the
significant differences in the waveform indicate strong pulsing conditions. In
addition, the maximum peak-to-peak pressures for the Figures 5-9(a) through 5-
9(e) are an order of magnitude higher than for the air-only condition, supporting
the presence of pulse combustion. The maximum peak-to-peak pressures will
be discussed later.

5.5.6 Engine Frequency
The operating frequency of the Astra was calculated from Figures 5-9(a)
through (e). The frequency for each plot is listed in Table 5-1. The average of
the five frequencies is 120.2 Hz, which is typical for a pulsejet of this
configuration (as stated by Lockwood [7]). The operating frequency of the first
condition in Table 5-1 is slightly higher than the rest, possibly due to the fuel
injection method. Since the fuel was injected in two streams perpendicular to the
engine axis at the 15-percent combustor length, the fuel was closer to the
combustion region in the chamber and perhaps did not take as long to mix and
ignite. As for the axial injection present during the other conditions, the fuel had
to travel through the inlet bulkhead before reaching the combustor, resulting in a
longer time between pulses and lower cycle frequency.
The frequency evaluation of first run of the fifth condition (Figure 5-9[e])
indicates that the engine was certainly not operating steady as was thought by
aural inspection.
Variation of exhaust pipe length produced slight differences in the
operating frequency, as theorized by the Helmholtz acoustic equations. With
axial fuel injection, the 50-inch length produced a higher frequency (126.9 Hz)
than did the 60-inch length (100.0 Hz). The frequencies produced by the 55-
inch lengths were 111.1 Hz and 125.0 Hz. Since these frequencies were
between the those of the 50 and 60-inch exhaust lengths, the variation of cycle
operating frequency with exhaust legnth is supported.

123
5.5.7 Operating Pressures (Maximum Peak-to-Peak and Average Voltages)
Due to the charge amplifier settings discussed in Section 5.3.4, the
voltages listed at the bottom of the figures are 100 times greater than their actual
value. The corrected equipment settings were such that one volt represented
one-hundredth (0.01) psi. The actual maximum peak-to-peak and average
voltages (psi values) are listed in Table 5-1.
Averaging the maximum peak-to-peak pressures of the signals from
Figures 5-9(a) through 5-9(e) shows that the Astra develops a combustion
pressure rise of 0.29 psi. The average pressures in the last row of Table 5-1
were obtained by the oscilloscope by utilizing all of the data points and not just
the peak pressures.

CHAPTER 6
CONCLUSIONS AND RECOMMENDATIONS
6.1 Conclusions
The experiments conducted in this project have revealed significant
conclusions about pulsejets and their operation. This project has also verified
some of the observations of previous experimenters. The information is
organized into the categories of engine geometry and combustion conditions.
6.1.1 Engine Geometry
In general, scaling a baseline aerovalve pulsejet design either larger or
smaller is often successful, as demonstrated by Lockwood (7) and other
researchers mentioned in Putnam et al. (1). Lockwood scaled up and scaled
down an original SNECMA aerovalve design and the resulting engines
functioned well. The Astra is a slightly scaled-down version of one of the
Lockwood models yet does not self-aspirate as the baseline engine did. Since
the Astra's geometry ratios (discussed in Chapter 2) are identical to those of a
124

125
Lockwood model, the absence of self-aspiration must be due to inadequate
combustion characteristics.
The optimum characteristic lengths for an aerovalve pulse combustor
defined by Narayanaswami and Richards (5) do not apply to all aerovalve pulse
combustor or pulsejet designs. These parameters were duplicated on the Astra
and produced no tendency to self-aspirate.
Definite trends regarding the geometric proportions of both aerovalve and
mechanically-valved engines have been followed through the years of pulsejet
development. These trends can be observed by comparing the ratios of
component lengths and areas for different engines. The parameters used for
such comparison have been defined in Chapter 2 and are applicable to all pulse
combustor and pulsejet designs.
The exhaust pipe length of an aerovalve pulsejet defines the operating
frequency, as theorized by the Helmholtz acoustic equations. The data from the
Astra experiments support this by demonstrating that the longer the exhaust pipe
length, the lower the pulse frequency. Experimentation with the Astra also
shows that the pulsing conditions induced by a certain exhaust pipe length are
unaffected by changing inlet geometry, but are affected by relocating the fuel
injection point on the combustor. The central fuel injection locations will produce
strong pulsing within a narrow range of exhaust pipe lengths, whereas a more
rearward injection position broadens the range of exhaust lengths that produce
pulsing.

6.1.2 Combustion Conditions
The temperature distribution inside the combustion chamber under self-
aspirating pulse combustion conditions is significantly different than from non-
self-aspirating conditions. Ponizy and Wojcicki (4) and Keel and Shin (10) have
shown that the hottest combustion region is located near the front-central portion
of the combustor for self-aspirating pulsejets. Temperatures inside the Astra's
combustor show the hot regions to be near the exhaust nozzle. This effect is
due to the forced inlet air required to sustain engine pulsing.
Even though an aerovalve pulsejet may be aurally and visually observed
to function steady at high fuel and air inlet pressures, combustion pressure and
temperature data may indicate that the engine is indeed pulsing. For this
reason, instrumentation of a pulse combustion device is the most reliable
method to verify operating condition.
Pulse combustion has a throttleable range, starting at a very lean, low-
frequency condition and going up to the seemingly rich-burning, steady
operation as mentioned above. The Astra experiments show that with the air
pressure remaining constant at 30 psi, the fuel pressures corresponding to these
conditions range from 2.5 to 9 psi, respectively. The most robust pulsing is
established at about 5 psi.

127
6.2 Recommendations
The important recommendation for future experimentation with the Astra
is to achieve self-aspiration. Since the engine geometry follows the design
trends discussed in Chapter 2 and is similar to a functioning aerovalve model
(Lockwood), the reason for no self-aspirating tendency is due to the combustion
conditions. The fuel delivered into the combustor may not mix fast enough to
allow self-aspiration. This can be investigated by testing new fuel nozzle
injection patterns or modifying the engine to accept more than two injectors for a
more uniform fuel delivery pattern. Tests should also be conducted to evaluate
the fuel/air ratio of the engine by employing flow-measuring devices into the fuel
and air systems.
The data collected from a self-aspirating engine will be different in all
respects to that collected from the experiments conducted in this project. Once
self-aspiration is achieved, all of the test runs described in the last half of
Chapter 5 should be re-evaluated. The information and conclusions gathered
from this project will provide a good foundation to compare the new data so that
more in-depth studies of a self-aspirating aerovalve pulsejet can be
accomplished.

REFERENCES
1. Putnam, A. A., Belles, F. E., and Kentfield, A. C, "Pulse Combustion," Progress in Energy and Combustion Science, Vol. 12,1986, pp. 43-79.
2. Winiarski, L, "A Logically Simple Method for Solving the Gas Dynamics of a Pulsating Combustor," First International Symposium on Pulsating Combustion, Sheffield, England, Sept. 20-23, 1971.
3. Merva, J., Lennox Industries, Allen, Texas - Telephone Interview, Jan. 12, 1994.
4. Ponizy, B. and Wojcicki, S., "On Modeling of Pulse Combustors," Twentieth Symposium (Intem'tl) on Combustion, The Combustion Institute, 1984, pp. 2019-2024.
5. Narayanaswami, L. L. and Richards, G. A., "Pressure-Gain Combustion Part I: Model Development," Technical Report, U. S. Department of Energy, Morgantown, West Virginia, 1993.
6. Kay, A. L., "Buzz Bomb," Article of uncertain source or publication date.
7. Lockwood, R. M. and Patterson, W. G., "Pulse Reactor Lift-Propulsion System Development Program," Report No. ARD-301, Hiller Aircraft Corporation, Palo Alto, California, Dec. 18, 1961.
8. Lockwood, R. M., "Pulse-Reactor Lift Propulsion Engines Permit Unlimited Terrain Freedom," AIAA 64-369, First AIAA Annual Meeting, Washington, D. C, Jun. 29-Jul. 2, 1964.
9. Taylor, J. W. R. (Ed.), Thermo-Jet Data, Janes' All the World's Aircraft, p. 764, 1979-80.
10. Keel, S. I. and Shin, H. D., "A Study of the Operating Characteristics of a Helmholtz-Type Pulsating Combustor," Journal of the Institute of Energy, Vol. 64, June 1991, pp. 99-106.
11. Richards, G. A. and Gemmen, R. S., "Pressure-Gain Combustion Part II: Experimental and Model Results," Technical Report, U. S. Department of Energy, Morgantown, West Virginia, 1993.
12. van Wylan, G. J. and Sonntag, R. E., Fundamentals of Classical Thermodvnamcs. 3rd ed., John Wiley and Sons, New York, New York, 1992, p. 315.
128

13. Bland, W. F. and Davidson, R. L. (Ed), Petroleum Processing Handbook. McGraw-Hill, New York, New York, 1967.
14. Nanmac Corporation, Digital Thermometer Instruction Manual. Nanmac Corporation, Framingham Center, Massachusetts, 1994.

APPENDIX A
ASTRA CONSTRUCTION DRAWINGS

131
APPENDIX A
ASTRA CONSTRUCTION DRAWINGS
Special Notes:
• The part numbers on the drawings are as listed in Figure 3-4
• All dimensions are in inches and angles in degrees
• Drawings may not be to scale due to reduction of the actual drawings to
accomodate the required page format
• Only fabricated parts are given in this appendix, components assembled from
off-the-shelf parts are not shown and are described in Section 3.4
• Sheet metal patterns are included as required

(3HQi€S-Sgl7frff3) pOfi.LocAn.otj
I ma J-_; IN LPT PI re I
132
'/fc hJttl. THICK.
%oo
SCAUZ: 1*1
o.O^^so ->

2£&X3'* INier SOL-KHZM
. / }
HSO
K<0
"f 2S0
T
133
vac SCAl£: /*2
g£A/0 /<?£
SCALE:/*!
$Tfi(MLtSS

P/\iZT H'-COMB. CHH&Z
iVN
pop. note UXMtON
£<t(&m.\Atie$
I C£h/T&ZUhl£S
WBLD ?&M
StCKON fi-n

PAgrv- Tem>iftve «?.5o
AKlS
B£*/D
fUHes
<\.oo
WBU> ^ L
135
- . 0 5
o.so
WtU.
X^Cr- 605 STAINL£S5
SCAL£'1=Z

I.CSM7.
*tU&ffi*lc£ _ WLILL fifJ&*SSY.
^RT5" : EXHAU5T N022L£ 136
ScAue • 1*1
B£AJO tod
SCAL£:\Z\
PAETC £ 4 7; VAR \f) gLg -LBWni ZXHAUSr pif€
. . I * — " -1-Jf FOR HOIB srze -±-
Ztf
. /Wo iccAxmi
Y i
Jl.^3
ZCALB' M
137
--.WS'
MtfLQSW\
tm>e ofsmttfuess sreeL/H/rmoTwe
lllcW*U- THICK.
-4
P/I/ST 7

PftfcTS S + q r\TTf\CHrABrJr R\MS (&x)r
pin. hotel ,/->r
138
-|j-*0//>. «ot£J
ftfR t>ltA£r£(OtJ$
I
r
./if
£Cf\L£- l-O

KA£T5 lltl£fO^M(ZZl£/SRrtt
1.106 139
Pft.IU.V-TAP tflOttfirWM M
PL 1/(5- THteW[?x)
far
SCA\£>\-'\

APPENDIX B
PROPERTIES OF LIQUEFIED PETROLEUM GAS (LPG OR PROPANE)

TAKEAJ FjfcofV. PETROLEUM PROCESSING HANDBOOK \f£f Q.)
Average Properties of Commercial Propane and Commercial Butane*
a Properties t M
Vapor pressure, psig: At 70°F
Commercial
-tssrfo™"
At 100°F At 105°F At 130°F
Specific gravity of liquid at 60 /60°F Initial boiling point at 14.7 psia, °F Weight per gal of liquid at 60°F, lb D e w point at 14.7 psia, °F Specific heat of liquid at 60°F, Btu/ ( lb) (°F) Cu ft gas at 60CF. 30 in. Hg, per gal liq at 60'F Specific volume of gas. at 6 0 c r , 30 in. Ilg. cu ft / lb Specific heat of gas at 60°F (Cp), Btu / ( lb) ( c F) Specific gravitv of gas (air = 1) at 60°1\ 30 in. Ilg Ignition temperature in air, CF Max flame temperature in air, CF Per cent cas in air for max flame temperature Max rate of flame propagation in 25-mm tube*
Cm /sec In. /sec
Limits of flammability, *£ gas in air: At lower limit At max rate of flame propagation At upper limit . . .
Required for complete combustion: Cu ft 0 : cu ft gas Cu ft air/cu ft gas Lb Or'lb gas Lb air, lb gas . . . .
Products of complete combustion-Cu ft CO: cu ft gas Cu ft H.O cu ft gas, . . Cu ft X- cu ft gab . . Lb COr lb gaN
Lb H . o lb gab Lb X lti gab . . r i t imatc CO-. ',' b\ volume
Latent heat of \apori7atioii .it boiling point Htu lb lit u gal . . .
Total heating \all ies (after vaporization)* Htu iu ft Htu lb Htu gal . . .
• . . .
.
124 192 206 286
0 .509 - 5 1
4 . 2 4 - 4 6
: 0 . 5 8 8 3 0 .2 8
8 .55 0 .404
I 1.52 920-1020
3595 4 . 2 - 4 . 5
8 4 . 9 33 .4
2 .4 4 . 7 - 5 . 0
9.G
4 . 9 23 .4
3 .60 15 5S
3 0 3 S
IS 5 3 0 1 0
12.0 ' 13 9
isr, 7S5
2522 21.560 91.500
Commercial butane
31 59 65 97
0 . 5 8 2 15
4 . 8 4 * 24
0 . 5 4 9 I 3 1 . 4 6 1 6 .50
0 . 3 8 2 2 .01
900-1000 3615
3 . 3 - 3 . 4
S7 1 3 4 . 3
1 9 3 . 7 - 3 . 9
S .6
6 3 30 0
3 54 15.3
3 . 9 4 . 0
23 7 3 1 1.5
11 S 14 I
167 SOS
3201 21,1 s0
102.1.00
* Courte*\ of Phillip* Petroleum Co.

APPENDIX C
RAW DATA FROM THREE-PHASE TESTING

APPENDIX C
RAW DATA FROM THREE-PHASE TESTING
This data was taken during the testing of the Astra engine and helped to
determine the best combination of the engine's four variable parameters
conducive to pulsing operation. Additional detail is given in Section 5.2. The
rating scale and abbreviations used on the data sheets are given below.
Rating Scale:
Each run was rated on a scale from 1 to 6. A rating of 1 indicated a
muffled light-off and poor combustion stability (too rich or too lean). A rating of 4
or 5 indicated a robust light-off, strong combustion and a tendency to pulse. A
rating of 6 indicated a robust light-off and either pulsing operation or very strong
tendency to pulse after one cycle.
Abbreviations:
P T. = Pulse Tendency B.B. = Big Bang S = Spark Location in percent combustor length L or R = Left and Right (respectively) Fuel Injector Location
in percent combustor length I = Inlet Length in inches E or EXH = Exhaust Length in inches
Stars or Asterisks denote combinations selected to advance to the next testing phase


(sesr FfiuvmoNs)
r/& A ' r
— *y
• "
J7«
© \T
,£
0
o i
cemerts/farTitirr H
r-r-r-r-r-
tf
^
P.T. SZTTZR
sAwe SAMC
.75" .6 .C
& -
<£? - ^ , ;r
ffl J)
3
dtS
IS
\
_0
o I
\s
rk? V ,60
»7T ,nr
scesmrd)
0
I
a
,6o r j o ,?<?
rnr r V
A ©
9
r - ^ -
0
J. 5:
J o I 16-2
(V£W/ f, 0, L~ TOO MCH TttfoTTUJ'* J*j?
' — "
o
r J" J - A urrLg fcma< 5 r r jr 5"
fi-um&&rm*
— a
a
//
^ " ^ 6 f - r -M3pe THfOTTZ/L
r~ /i/arAs &o06
r - **Mf?
1 - W&tfrrT

,6 / r a or
5 ~ - £<X?]> PT.
U3k&TH ~Ptf#&WWtte UK- (J >*L
T&hu*
r-rAwz
30
3-7 7?
23
27.r
MS
5~- s/werfo 1 S'-^oob f.r, wc r - GOOD P.T.
t
xj/ar
A7 / x
77 3*
f- PULSIHC- OK - \
j - , * ) WhMtY TO
r - "
r- "
f~- A urne Bendt
H- IJUTtePrGooD
r- "
r- " 5"- Stwr
-see sneer @
T '&rne&- (-=&") r - eveti Bemrz.
J"- 4 UTTie" L£3T

VgltZXH, m^, LQCACa^/x) 13+
r(3o ,<o tf.^^y
^ . r r-S4M£-Af ^ J 7 J - 5-&?7Wft*wj, PXJf C- NorfoGoofi
gXH
lie
?/
13
3r ?c 77 J /
E
t
3 i . r ^ r r a e t H ^ 35. r 5A/vt£ A5 ST"
JL3 ^Y A T
\ 3*
Jo 31
33 /3Y
\ 3 6 37 J?
[\ - F(AsitJG- MOT THAT CvMlMWr
H--!*
r- ?mf.
f-~^l(rHTLYu£%S
&e Sheer© r-rAMer Ar?r 5 " - SACA0
f- A r &x# AT ALL
<\ - p.r. A/or OoaO 5-k \,\rrvc-Benett
r- " r-rVLtTriege'rr&z f-A-UTte LZK
5"- '* S - SLIGHTLY LeSS

0
QAW tiuILJL VSu eth Pt&r uXr\coNr) <&i
1 2*or LessTWrtil 'Xi.f Berne-WA^I ~£%S SAM fa m.r
77.^ frm* THft/ St-rrKW-fc
H -PULSING-, %^r f&& Moor J-or
5~-flume Befrm^ r-sAM6 S~~A-istfTLe w>(z£ Pa£v?T
r-smjc r~ PULS? OK. -A/or AS rrfro*/£ ^s/kwz
s?e Sheer (T)
F~CAN\6
5-SAW? 5~-*i,iGHT\,y Less $^?me
'i-hlOT \J6W ocob -ALM<XT NO U:
f~A UTVJc BtTTEZ-
r~sAw& r-SAfAe SEC Sheor(£) S~-s/W6 /\c £f" jr-tense.
f^swaJG- p.r
y-SAMe

1 \J6L em /tegF inc. \o*ir) \^!P
7] ^r r-" % jr~ " "'
p* s-"
20 - .r-" -?f r-" _^ J a 5STSHBBTg) 5J 5-SL\G*\TIY L^S wm 3* J1/ r-'' -
3& 5~&MZ,- eurcrcco
3# r~ /^^w/>

APPENDIX D
THERMOCOUPLE AND PRESSURE GAUGE CALIBRATION

APPENDIX D
THERMOCOUPLE AND PRESSURE GAUGE
CALIBRATION
Thermocouple Calibration:
Actual calibration of the Nanmac Type K shielded thermocouple and the
digital reading device was not possible according to the instruction manual (Ref.
14) since the procedure required electronic adjustment of the digital reading box.
Therefore, the thermocouple accuracy was evaluated and compared to the
manufacturer's specifications by measuring the temperature of boiling, distilled
water.
A small pot of distilled water was brought to a furious boil on a residential
electric range. After boiling for two minutes on high heat setting, the
temperature reading was taken by immersing the thermocouple about two inches
into the water while not touching the bottom or sides of the pot. The digital
reading box was activated for about 15 seconds and the temperature displayed
after that time was recorded. The burner setting was then reduced to medium
heat and the water boiled again for two minutes. The temperature readings was
collected in the same manner as above. The heat was then increased to
medium-high and another reading was taken.
The data collected from the three readings are tabulated as follows:

Heat Setting
Temperature (°F)
High Medium Medium-High
214 213 213
*Boiling, distilled water
*Time after heat setting change to reading = 2 min. 15 sec.
The accuracy stated by the manufacturer for this type of thermocouple is:
Accuracy for Temp. Range of -50.0 -+ 1999 °F: 0.3% of reading ±2°F
When the readings in the table were corrected using the manufacturer's
accuracy, they fell slightly above or below the 212 °F boiling point of distilled
water. This indicated that the thermocouple was reading accurately and
required no additional calibration.
Pressure Gauge Calibration:
Both the air and fuel pressure gauges were of the aneroid type and were
calibrated using an oil-piston gauge. This device functions by applying a known
weight to a piston suspended in oil. The pressure of the oil then moves another
piston under the gauge to be calibrated, applying pressure to the gauge. As the
weighted piston moves down, the piston under the gauge moves up, increasing
the pressure. The known pressure developed by the weighted piston can then
be compared to the gauge reading.

The oil-piston gauge used for this procedure applies pressure in units of
bars. Since the gauges indicated units of psi, the conversion between bars and
psi was used. This conversion factor is.
1.0133 bar =14.7 psi (=1 atm)
The readings from the pressure gauges during experimentation were
used only to establish consistency during engine runs and were not used in any
type of calculation. Nonetheless, the gauges were calibrated to test for accuracy
and precision.
The fuel pressure gauge was calibrated first. There were no
manufacturer specifications given on the gauge and no manual to accompany it.
The table below tabulates the data collected during the calibration procedure.
m
Bar 0.2
0.25 0.3 0.4
0.45 0.55 0.65 0.75 0.65 0.55 0.45 0.4 0.3
0.25 0.2
yerage£Merenc
psi 2.9 3.62 4.35 5.8
6.53 7.98 9.43 10.88 9.43 7.98 6.53 5.8
4.35 3.62 2.9
e . : - . . . . .
Gauge psi 3.125 3.75 4.68 6.25 7.0 8.25 10.0 11.2 10.0 8.25 7.0
6.25 4.68 3.75 3.125
Difference 0.225 0.13 0.33 0.45 0.47 0.27 0.57 0.32 0.57 0.27 0.47 0.45 0.33 0.13
0.225 0,347
The data indicates that the fuel pressure gauge is very precise (little
hysteresis) and relatively accurate, indicating an average of 0.35 psi greater

than actual. Since the fuel pressure gauge only registers up to 15 psi, the
applied pressures did not exceed 12 psi.
The air pressure gauge from the shop air line was the calibrated in the
same manner. It also had no manual or manufacturer specifications. Since the
air pressures used during experimentation were much greater than the fuel
pressures, the calibration pressures were increased. The data for the air
pressure gauge is tabulated below:
Bar jasi [ Gauge psi Difference
The data shows that although the air pressure gauge is precise (little
hysteresis), there is significant error associated with the readings. The gauge
indicates about 9 psi greater that actual pressure. This would be unacceptable if
the gauge readings were used in any type of calculation, but for this project they
were only used to establish consistent operating conditions of the pulsejet.