The Evolution and Composition of the Agricultural … evolution and composition of the agricultural...
42
Copyright KEPΕ, Athens 2011 535 The Evolution and Composition of the Agricultural Labour Force in Greece: 1998-2008* Pródromos-Ioánnis K. Prodromídis Centre of Planning and Economic Research, Athens University of Economics and Bussiness Abstract According to LFS figures, employment in agricultural activities in Greece declined by 29–30 per cent during 1998–2008, despite the economy-wide rise (fall) in the number of employed (unemployed) people. We study the changes in the size and makeup of the population that engaged primarily in agriculture by isolating the seasonal, medium and longer-term effects exhibited by the various gender, age, qualification, occupational and regional groups—identi- fying those that are significant at the 1 per cent level. The detection of (i) a seasonal attachment to agriculture by certain segments of the population, and (ii) longer-term increases in the figures of certain subgroups yield a num- ber of glimpses into the evolving composition of the sector’s workforce. These are potentially useful for policy purposes. 1 Introduction The article sets out to investigate and describe the composition and evo- lution of the Greek labour force that engages primarily in agricultural activi- ties by empirically studying changes in its size and makeup during the last decade (1998–2008). Agricultural activities involve the cultivation of crops, farming of animals and hunting. In this instance, the changing composition of * The article has benefited from constructive comments offered by an anonymous referee and participants in the Commemorative Conference for the fiftieth anniversary of the Cen- tre’s foundation. Τhe usual disclaimer applies.
Transcript of The Evolution and Composition of the Agricultural … evolution and composition of the agricultural...
Copyright KEPΕ, Athens 2011
535
The Evolution and Composition of the Agricultural LabourForce in Greece: 1998-2008*
Pródromos-Ioánnis K. ProdromídisCentre of Planning and Economic Research,
Athens University of Economics and Bussiness
Abstract
According to LFS figures, employment in agricultural activities in Greecedeclined by 29–30 per cent during 1998–2008, despite the economy-wide rise(fall) in the number of employed (unemployed) people. We study the changesin the size and makeup of the population that engaged primarily in agricultureby isolating the seasonal, medium and longer-term effects exhibited by thevarious gender, age, qualification, occupational and regional groups—identi-fying those that are significant at the 1 per cent level. The detection of (i) aseasonal attachment to agriculture by certain segments of the population,and (ii) longer-term increases in the figures of certain subgroups yield a num-ber of glimpses into the evolving composition of the sector’s workforce. Theseare potentially useful for policy purposes.
1 Introduction
The article sets out to investigate and describe the composition and evo-lution of the Greek labour force that engages primarily in agricultural activi-ties by empirically studying changes in its size and makeup during the lastdecade (1998–2008). Agricultural activities involve the cultivation of crops,farming of animals and hunting. In this instance, the changing composition of
* The article has benefited from constructive comments offered by an anonymous refereeand participants in the Commemorative Conference for the fiftieth anniversary of the Cen-tre’s foundation. Τhe usual disclaimer applies.
1 Using disaggregated data from the 2001 Census, Prodromídis (2008) finds that the inhabi-tants of 638 municipalities (three fourths of the country’s surface) concentrate on agriculturaland forestry activities in the sense that local involvement in such activities exceeds the na-tional average by 25% or more. Additionally, the level of correlation between (a) the locali-ties in question and (b) the localities in which involvement in another industry exceeds thenational average by 25% is negative. This suggests that there is probably very little diversifi-cation over a large part of the countryside, and that agriculture and forestry constitute theproduction backbone of rural Greece. The participation ratio between the two latter activi-ties is estimated at 80:1.2 The numbers are quarterly. Hence, they are provided here in range-format to allow forcomparisons between same quarters and reduce confusion on account of seasonality. Morespecifically, the left-hand numbers in each of the two ranges (i.e., 199–214 and 700–713thousand) concern the estimated workforce numbers in the first quarters of 1998 and 2008,respectively; and the right-hand numbers pertain to their forth quarter counterparts, re-spectively. Likewise, the left-hand number of the 29–30% range captures the change be-tween the first quarters of 1998 and 2008, and the right-hand number describes the changeobserved in terms of (i.e., between) the final quarters during the period in question.
the labour force engaging in such activities attracts our interest on account ofthe sector’s fundamental importance for the residents of a large part of theGreek countryside,1 the substantial job-losses that seem to have taken placein the period under examination, and the little or no research that the issuehas attracted.
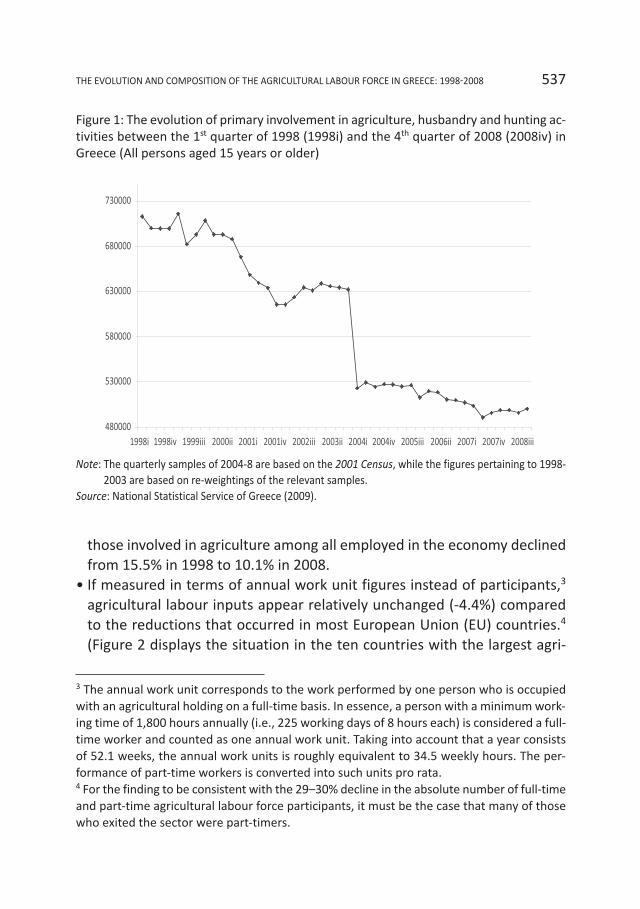
Indeed, according to the quarterly Labour Force Survey estimates, partic-ipation in agricultural activities seems to have fallen in 2008 by 199–214 thou-sand people (29–30%) compared to the number of 700–713 thousandestimated ten years earlier (Figure 1).2 Though the contraction may be at-tributed to some extent to a change in the sampling method in 2004 (achange not specifically applied to the agricultural sector), it is clearly thelargest observed in terms of absolute numbers across the country’s economicsectors in the course of the decade—equivalent to about 5.0–5.4% of thetotal workforce of Greece in 1998, involving the sum of employed and un-employed people aged 15 years and older. To keep things in perspective, itshould be noted that in the course of 1998–2008: • Overall employment in Greece increased by about 542 thousand people,
up 13.5% from the average figure of 4.018 million in 1998. At the same time,unemployment decreased by about 130 thousand (down 25.6% from theopening figure of 508 thousand). As a result of these shifts, the share of
536 PRÓDROMOS�IOÁNNIS K. PRODROMÍDIS
3 The annual work unit corresponds to the work performed by one person who is occupiedwith an agricultural holding on a full-time basis. In essence, a person with a minimum work-ing time of 1,800 hours annually (i.e., 225 working days of 8 hours each) is considered a full-time worker and counted as one annual work unit. Taking into account that a year consistsof 52.1 weeks, the annual work units is roughly equivalent to 34.5 weekly hours. The per-formance of part-time workers is converted into such units pro rata.4 For the finding to be consistent with the 29–30% decline in the absolute number of full-timeand part-time agricultural labour force participants, it must be the case that many of thosewho exited the sector were part-timers.
those involved in agriculture among all employed in the economy declinedfrom 15.5% in 1998 to 10.1% in 2008.
• If measured in terms of annual work unit figures instead of participants,3
agricultural labour inputs appear relatively unchanged (-4.4%) comparedto the reductions that occurred in most European Union (EU) countries.4
(Figure 2 displays the situation in the ten countries with the largest agri-
THE EVOLUTION AND COMPOSITION OF THE AGRICULTURAL LABOUR FORCE IN GREECE: 1998�2008 537
Figure 1: The evolution of primary involvement in agriculture, husbandry and hunting ac-tivities between the 1st quarter of 1998 (1998i) and the 4th quarter of 2008 (2008iv) inGreece (All persons aged 15 years or older)
Note: The quarterly samples of 2004-8 are based on the 2001 Census, while the figures pertaining to 1998-2003 are based on re-weightings of the relevant samples.
Source: National Statistical Service of Greece (2009).
5 This may be attributed to differences in (a) the decline of certain agricultural sub-sectors,(b) the introduction of new technologies in the sector, (b) the growth of other sectors andthe shortage of (native or foreign) workers in these sectors, (d) all of the above (Baraldi at al.,2007).6 A simultaneous rise in total financial support for Greek agriculture, notwithstanding(Karanikolas et al., 2008).7 Indeed, the country’s landscape is dominated by mountain-chains (about 42.2% of the coun-try’s surface), small valleys traversed by rivers or inlayed with lakes, narrow coastal strips, amultitude of islands (35.1% of the country’s surface), and an inordinately jagged coastline(corresponding to 13.6% of the EU-27 total), all packed in a rather small area (about 3.1% ofthe EU’s landmass). These natural features greatly fragment the country into a host of tiny dis-tricts. The road, rail and sea transport system linking the coastal strips, plateaux and islands,in its present state of development, partially ameliorates the situation, though may cause in-cidental farm fragmentation (this is usually of limited significance). In Greece, land distribu-tion schemes and a number of local practices (e.g., inheritance and dowry customs, piecemealsales and acquisitions of land due to lack of money, etc.) exacerbate the fragmentation and
538 PRÓDROMOS�IOÁNNIS K. PRODROMÍDIS
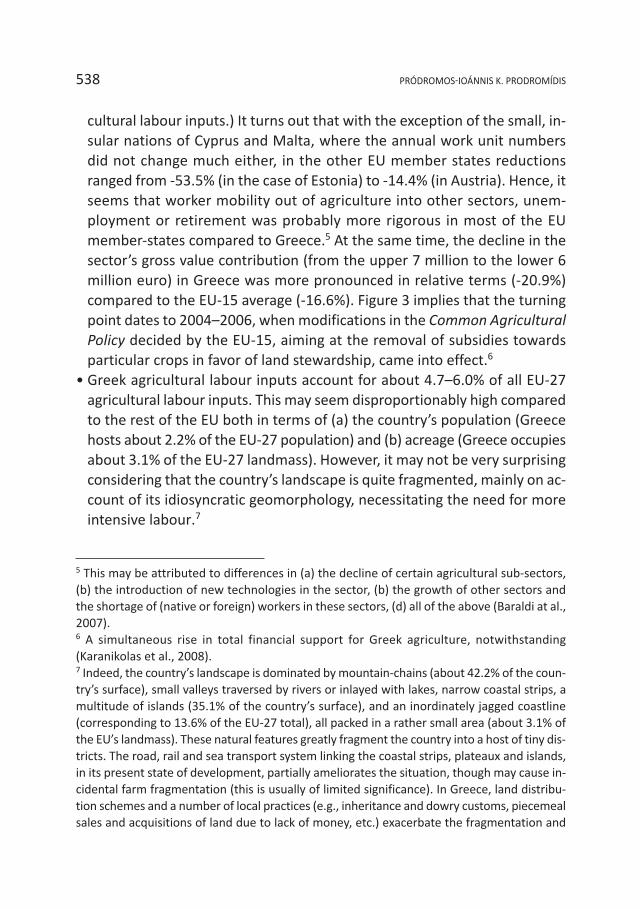
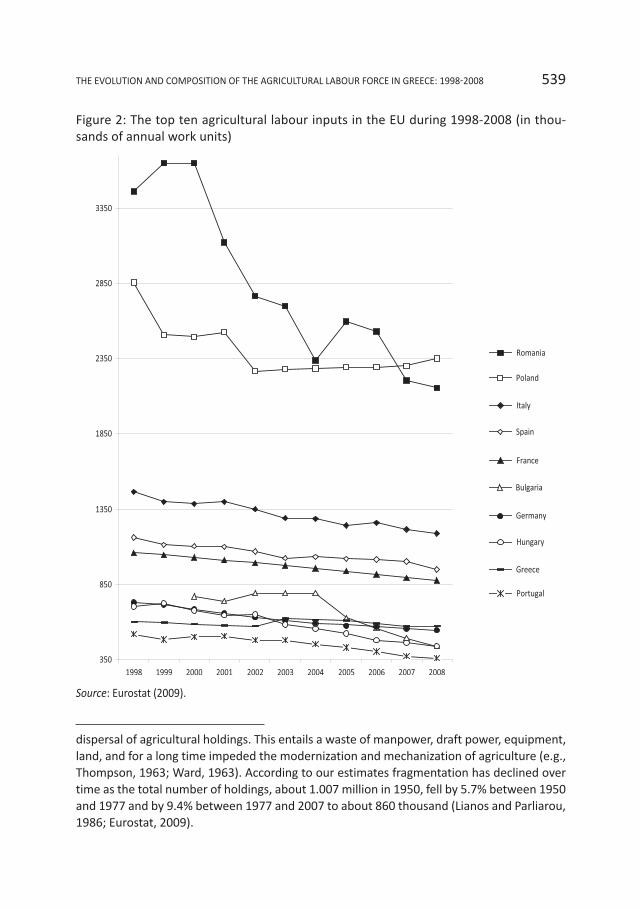
cultural labour inputs.) It turns out that with the exception of the small, in-sular nations of Cyprus and Malta, where the annual work unit numbersdid not change much either, in the other EU member states reductionsranged from -53.5% (in the case of Estonia) to -14.4% (in Austria). Hence, itseems that worker mobility out of agriculture into other sectors, unem-ployment or retirement was probably more rigorous in most of the EUmember-states compared to Greece.5 At the same time, the decline in thesector’s gross value contribution (from the upper 7 million to the lower 6million euro) in Greece was more pronounced in relative terms (-20.9%)compared to the EU-15 average (-16.6%). Figure 3 implies that the turningpoint dates to 2004–2006, when modifications in the Common AgriculturalPolicy decided by the EU-15, aiming at the removal of subsidies towardsparticular crops in favor of land stewardship, came into effect.6
• Greek agricultural labour inputs account for about 4.7–6.0% of all EU-27agricultural labour inputs. This may seem disproportionably high comparedto the rest of the EU both in terms of (a) the country’s population (Greecehosts about 2.2% of the EU-27 population) and (b) acreage (Greece occupiesabout 3.1% of the EU-27 landmass). However, it may not be very surprisingconsidering that the country’s landscape is quite fragmented, mainly on ac-count of its idiosyncratic geomorphology, necessitating the need for moreintensive labour.7
THE EVOLUTION AND COMPOSITION OF THE AGRICULTURAL LABOUR FORCE IN GREECE: 1998�2008 539
Figure 2: The top ten agricultural labour inputs in the EU during 1998-2008 (in thou-sands of annual work units)
Source: Eurostat (2009).
dispersal of agricultural holdings. This entails a waste of manpower, draft power, equipment,land, and for a long time impeded the modernization and mechanization of agriculture (e.g.,Thompson, 1963; Ward, 1963). According to our estimates fragmentation has declined overtime as the total number of holdings, about 1.007 million in 1950, fell by 5.7% between 1950and 1977 and by 9.4% between 1977 and 2007 to about 860 thousand (Lianos and Parliarou,1986; Eurostat, 2009).
8 The study of migrant groups, whether foreign nationals or natives relocating within the coun-try, though desired (the information was solicited in the survey), is not feasible at this stage.
540 PRÓDROMOS�IOÁNNIS K. PRODROMÍDIS
At the beginning of the period under examination, it was predicted thatthe country’s agricultural labour force would shrink due to: (a) increased lib-eralization at the international level, which, in turn, would result in lowerprices and, hence, the acquisition of less income for a given quantity of agri-cultural products; (b) reduced EU emphasis (i.e., provision of incentives) onthe quantity of agricultural production; (c) desertification; (d) little or no plan-ning; and (e) demographic ageing. The latter was expected to affect a reduc-tion in the number of self-employed farmers and unpaid family members,and an increase in the number of people entering into contractual relation-ships as employers and employees (Karanikolas and Martinos, 1999; Tsim-poukas and Tsoukalas, 1999). However, there is scant evidence pertaining todevelopments in the size and the internal composition of the agriculturallabour force, e.g., the personal interviews of a small number of women whobecame professional farmers (Gidarakou et al., 2008).
To gain insights into what transpired in Greece, we turn our attention to theevolution of people’s primary involvement in agricultural or other economicactivities, and study the seasonal and longer-term phases or patterns exhibitedby the various gender, age, qualification, occupational or regional groups thatconstitute the agricultural labour force.8 To visually aid the reader, the medium
Figure 3: Gross Value Added in the Agricultural Industry at basic prices in the EU-15 andGreece (in million ECU or euro)
Source: Eurostat (2009).
THE EVOLUTION AND COMPOSITION OF THE AGRICULTURAL LABOUR FORCE IN GREECE: 1998�2008 541
and longer-term patterns are provided alongside the text, in Figures 4–12 andwherever space is not sufficient in Figures A.1-3 in the Appendix. The presen-tation and discussion of the empirical results are provided in Section 2, and theconclusions in Section 3. The econometric results, on the basis of which theaforesaid figures are drawn, are supplied in the Appendix.
2 Empirical Findings
We commence our analysis by looking at a number of correlations in orderto get a sense of how the evolution of people’s involvement in agriculture fitswith participation in other economic activities. First, we note that the declinein people’s participation in agricultural activities bears a close resemblance tothe patterns observed in people’s participation in the manufacturing of (a)wearing apparel, dressing and dyeing of fur (r=95.9%), (b) textiles and textileproducts (r=77.46%), (c) leather and leather products (r=71.7%), (d) tobaccoproducts (r=65.9%); as well as in (e) forestry, logging and related activities(r=72.6%). This suggests reliance on the same factors and, in some cases, thepresence of sectoral connections and complementarities (Porter, 2003). Ad-ditionally, the declining participation in agricultural activities exhibits a posi-tive correlation with the declining number of unemployed observed in Greeceduring the same period (r=71.2%), which may suggest that those exiting theagricultural workforce did not swell the ranks of the unemployed. At the sametime, the declining participation in agricultural activities exhibits (i) modest orlow levels of positive correlation with the declining participation in elevenother industrial sectors, and (ii) negative correlations with the evolution ofnon-participation, as well as the evolution of participation in some 42 sec-tors— especially, (a) public administration, defense and compulsory socialsecurity, (b) construction, (c) repair of personal/household goods and retailtrade (except motor vehicles), (d) (domestic) personnel employment withinhouseholds, among others (r<–90.0%). This may suggest that those exitingthe agricultural sector tended to either enter such sectors or retire.
Shifting our attention to the econometric analysis, we ground ourselveson conventional labour economic theory. Understandably, to the extent thatpeople’s time-use choices originate from their preferences over consumptionand leisure, subject to time and domestic technology constraints (Blundel andMacurdy, 2008), the sizes of the working-age population that opt to (a) par-
542 PRÓDROMOS�IOÁNNIS K. PRODROMÍDIS
ticipate in agricultural activities or other sectors of the economy, (b) look forjobs or (c) abstain from the workforce, are bound to be determined, to a con-siderable extent, by their characteristics (gender, age, qualifications etc.).Owing to the aggregate nature of the data at our disposal, these characteris-tics cannot be employed as explanatory variables in a multivariate participa-tion or labour supply expression, as is usually done with disaggregated orindividual data. Hence, we engage in econometric regressions with the afore-mentioned characteristics (more accurately, the population sizes of the agri-cultural labour force with such characteristics) serving as dependent variablesof which the seasonal and longer-term features are isolated and the statisti-cally significant effects (i.e., those exhibiting a very low probability of error, inour case less than 1%) are identified. These are discussed in subsections 2.i–2.iv.
i. Participation and Time Involvement
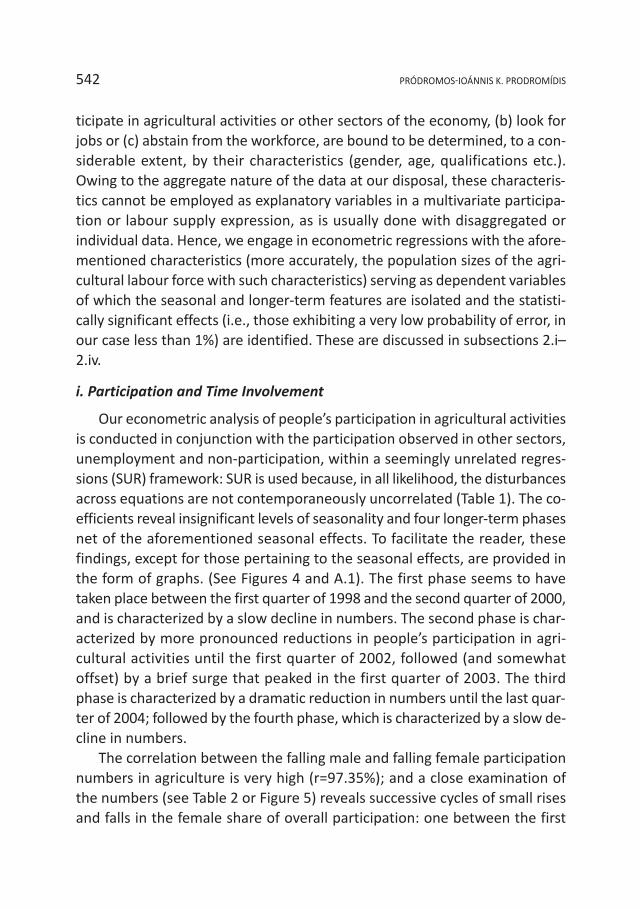
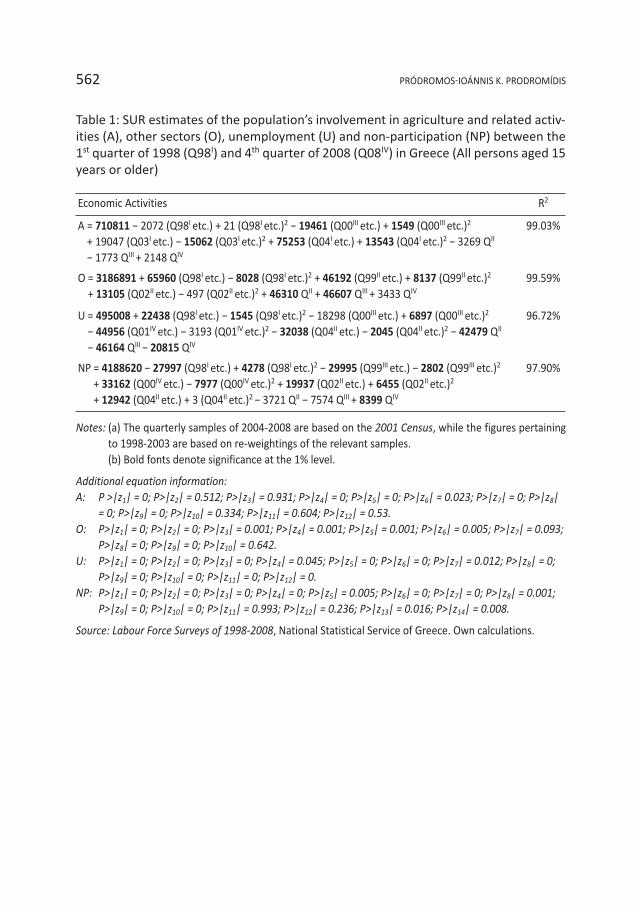
Our econometric analysis of people’s participation in agricultural activitiesis conducted in conjunction with the participation observed in other sectors,unemployment and non-participation, within a seemingly unrelated regres-sions (SUR) framework: SUR is used because, in all likelihood, the disturbancesacross equations are not contemporaneously uncorrelated (Table 1). The co-efficients reveal insignificant levels of seasonality and four longer-term phasesnet of the aforementioned seasonal effects. To facilitate the reader, thesefindings, except for those pertaining to the seasonal effects, are provided inthe form of graphs. (See Figures 4 and A.1). The first phase seems to havetaken place between the first quarter of 1998 and the second quarter of 2000,and is characterized by a slow decline in numbers. The second phase is char-acterized by more pronounced reductions in people’s participation in agri-cultural activities until the first quarter of 2002, followed (and somewhatoffset) by a brief surge that peaked in the first quarter of 2003. The thirdphase is characterized by a dramatic reduction in numbers until the last quar-ter of 2004; followed by the fourth phase, which is characterized by a slow de-cline in numbers.
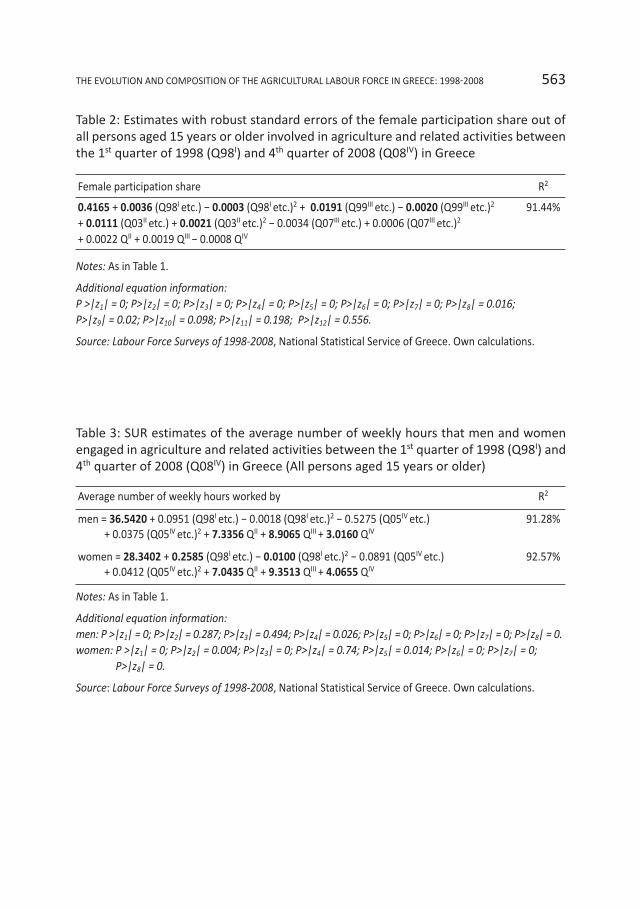
The correlation between the falling male and falling female participationnumbers in agriculture is very high (r=97.35%); and a close examination ofthe numbers (see Table 2 or Figure 5) reveals successive cycles of small risesand falls in the female share of overall participation: one between the first
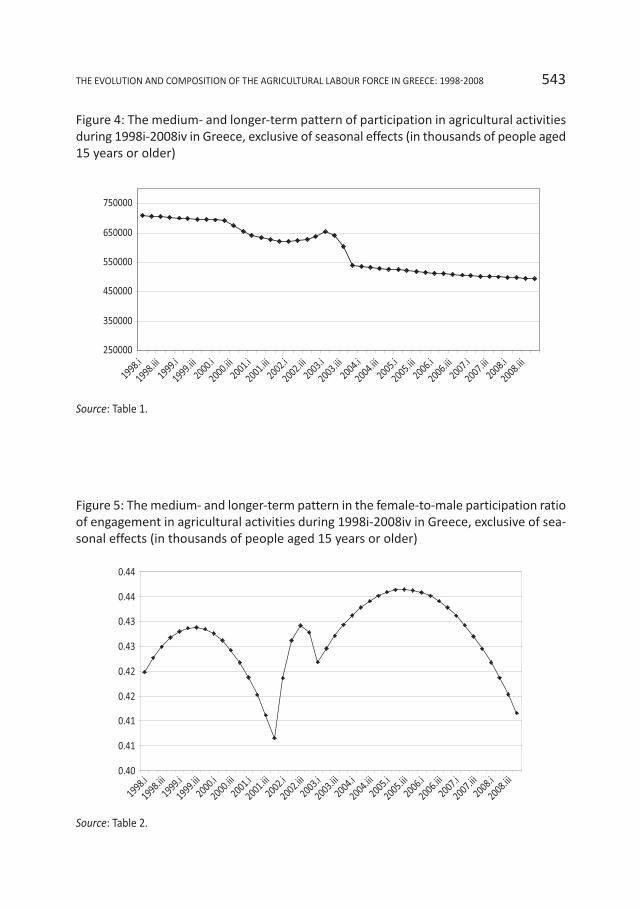
Figure 4: The medium- and longer-term pattern of participation in agricultural activitiesduring 1998i-2008iv in Greece, exclusive of seasonal effects (in thousands of people aged15 years or older)
Source: Table 1.
Figure 5: The medium- and longer-term pattern in the female-to-male participation ratioof engagement in agricultural activities during 1998i-2008iv in Greece, exclusive of sea-sonal effects (in thousands of people aged 15 years or older)
Source: Table 2.
THE EVOLUTION AND COMPOSITION OF THE AGRICULTURAL LABOUR FORCE IN GREECE: 1998�2008 543
544 PRÓDROMOS�IOÁNNIS K. PRODROMÍDIS
quarter of 1998 and the fourth quarter of 2001 (from 42 to 43 to 41%), an-other between the fourth quarter of 2001 and the first quarter of 2003 (from41 to 43 to 42%), a third between the first quarter of 2003 and the final quar-ter of 2008 (from 42 to 44 to 42%). Again, seasonal effects are not significantat the 1% level (i.e., when the probability of error is no more than 1%).
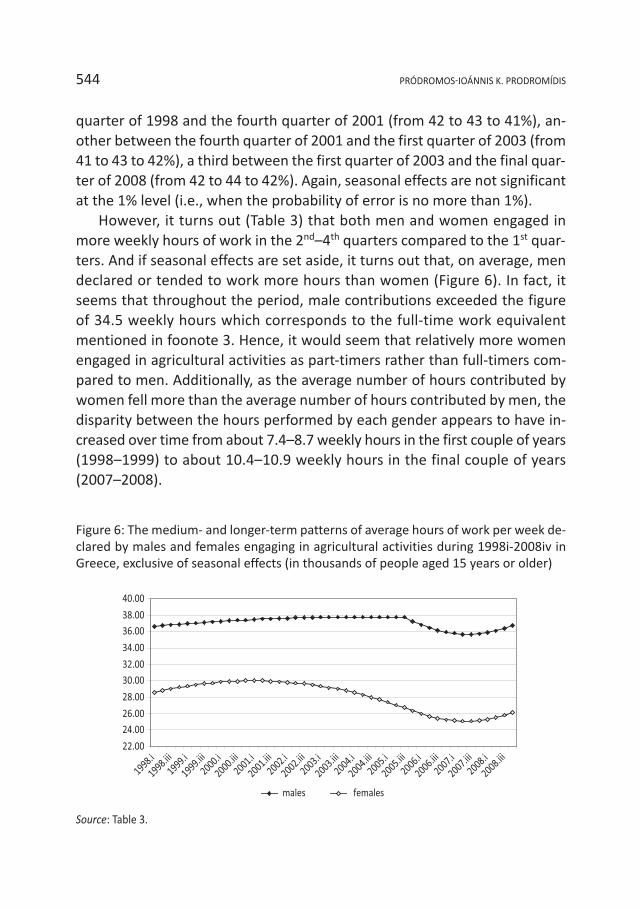
However, it turns out (Table 3) that both men and women engaged inmore weekly hours of work in the 2nd–4th quarters compared to the 1st quar-ters. And if seasonal effects are set aside, it turns out that, on average, mendeclared or tended to work more hours than women (Figure 6). In fact, itseems that throughout the period, male contributions exceeded the figureof 34.5 weekly hours which corresponds to the full-time work equivalentmentioned in foonote 3. Hence, it would seem that relatively more womenengaged in agricultural activities as part-timers rather than full-timers com-pared to men. Additionally, as the average number of hours contributed bywomen fell more than the average number of hours contributed by men, thedisparity between the hours performed by each gender appears to have in-creased over time from about 7.4–8.7 weekly hours in the first couple of years(1998–1999) to about 10.4–10.9 weekly hours in the final couple of years(2007–2008).
Figure 6: The medium- and longer-term patterns of average hours of work per week de-clared by males and females engaging in agricultural activities during 1998i-2008iv inGreece, exclusive of seasonal effects (in thousands of people aged 15 years or older)
Source: Table 3.
THE EVOLUTION AND COMPOSITION OF THE AGRICULTURAL LABOUR FORCE IN GREECE: 1998�2008 545
ii. Changes in Occupational Composition
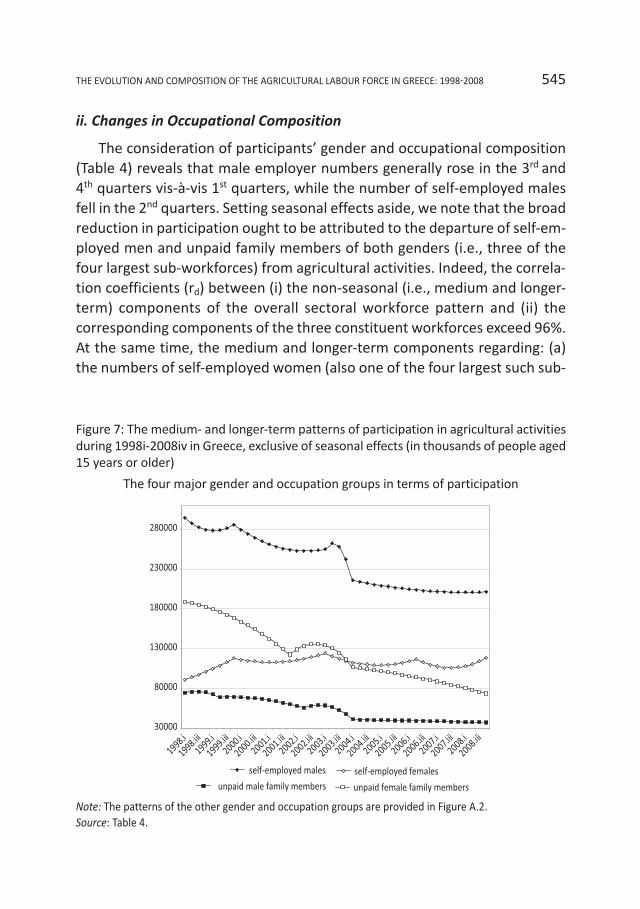
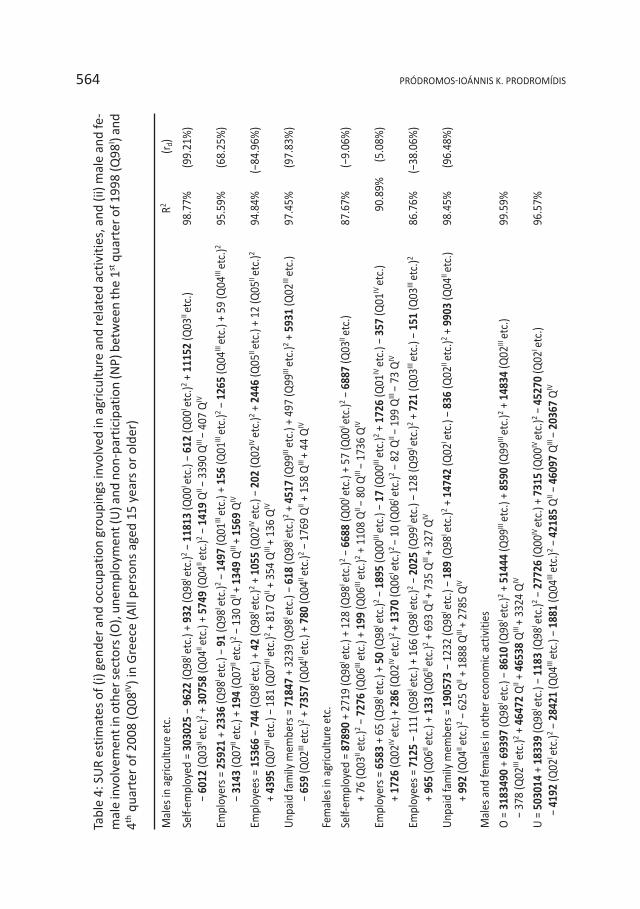
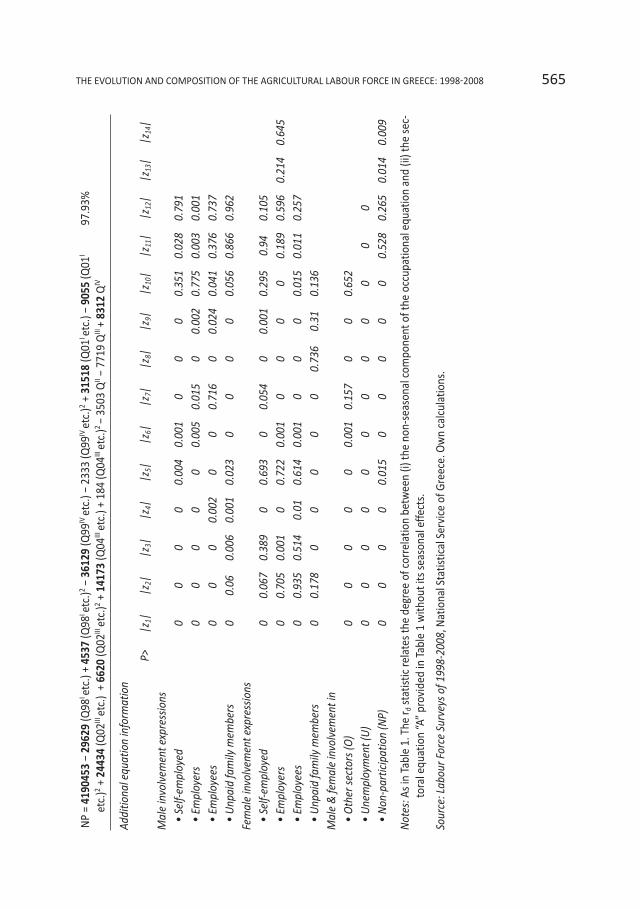
The consideration of participants’ gender and occupational composition(Table 4) reveals that male employer numbers generally rose in the 3rd and4th quarters vis-à-vis 1st quarters, while the number of self-employed malesfell in the 2nd quarters. Setting seasonal effects aside, we note that the broadreduction in participation ought to be attributed to the departure of self-em-ployed men and unpaid family members of both genders (i.e., three of thefour largest sub-workforces) from agricultural activities. Indeed, the correla-tion coefficients (rd) between (i) the non-seasonal (i.e., medium and longer-term) components of the overall sectoral workforce pattern and (ii) thecorresponding components of the three constituent workforces exceed 96%.At the same time, the medium and longer-term components regarding: (a)the numbers of self-employed women (also one of the four largest such sub-
Figure 7: The medium- and longer-term patterns of participation in agricultural activitiesduring 1998i-2008iv in Greece, exclusive of seasonal effects (in thousands of people aged15 years or older)
The four major gender and occupation groups in terms of participation
Note: The patterns of the other gender and occupation groups are provided in Figure A.2.Source: Table 4.

Figure 8: The medium- and longer-term patterns of participation in agricultural activitiesduring 1998i-2008iv in Greece by type of profession, exclusive of seasonal effects (inthousands of people aged 15 years or older)
The two major profession groups in terms of participation
Note: The patterns of the other professions are provided in Figure A.3.Source: Table 5.
9 The medium and longer-term pattern of skilled primary sector workers is highly correlatedwith the corresponding pattern exhibited by the self-employed and unpaid males (r=98.9and 98.7%, respectively), which suggests that the former group may overlap to a consider-able extent with the other two groups.
546 PRÓDROMOS�IOÁNNIS K. PRODROMÍDIS
workforces) and the numbers of female employees are rather indistinct (therespective rds range between 5 and -10%.); (b) the numbers of male employ-ers appear to have fluctuated (rd≈70%); and (c) the numbers of male and fe-male employees seem to have increased (the respective rds range between-38 and -85%.) See also Figures 7 and A.2.
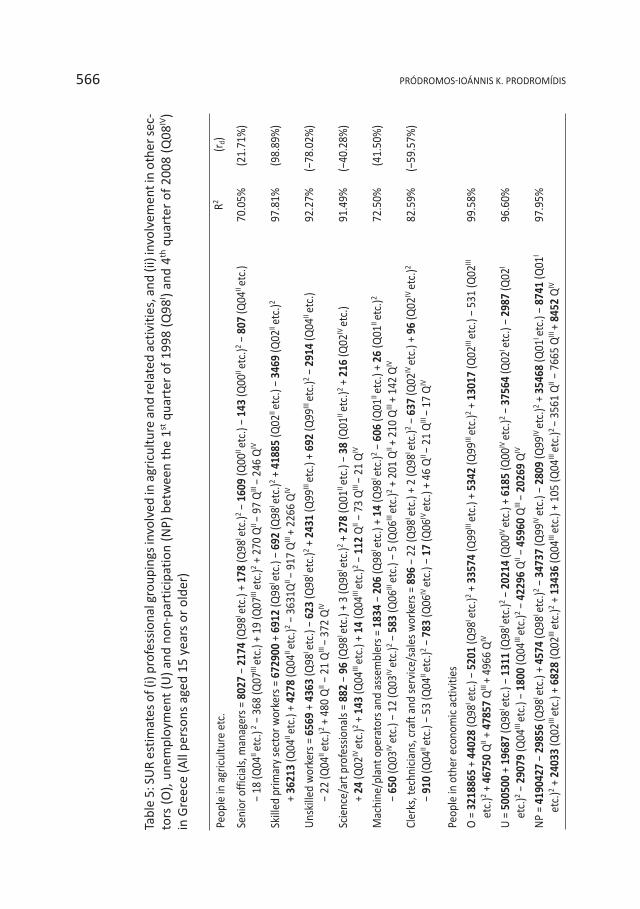
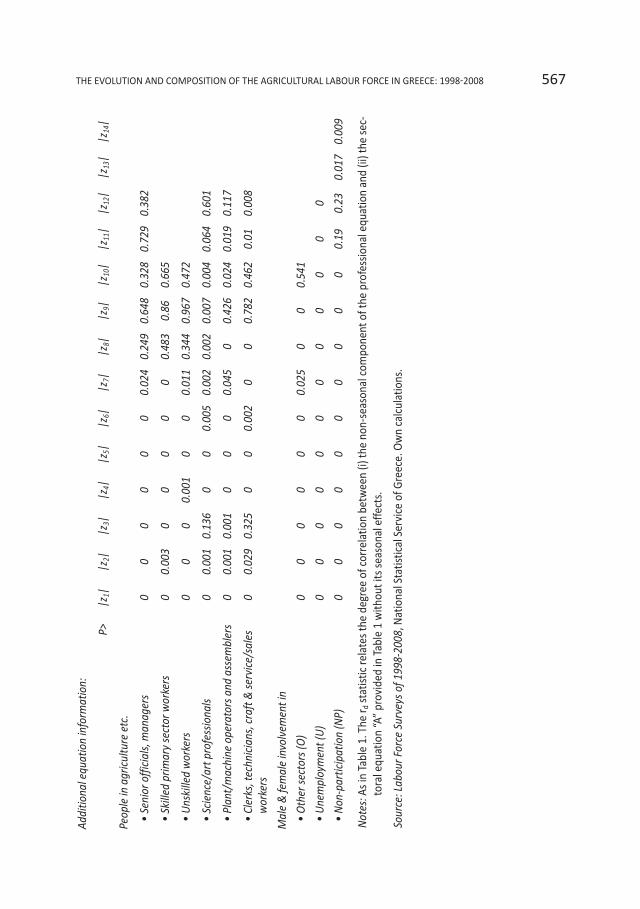
In addition, if we study the figures from another perspective (Table 5), weobserve that the overall medium and longer-term reduction in participationis driven by the drop in the number of skilled primary sector workers(rd=99%).9 In the background, the small numbers of unskilled workers, man-agers, machine operators, science/art professionals or other professions in-volved in agricultural activities (clerks, technicians, craft and service/salesworkers) also declined initially and then either rebounded somewhat (man-
agers (rd≈22%)) or completely (machine operators (rd≈42%)) or exceeded ini-tial levels (science/art professionals, unskilled workers, others; the relevant rdsrange between -40 and -78%.) See also Figures 8 and A.3. There are no sta-tistically significant seasonal effects at the 1% level, other than a fall in thenumber of science/art professionals in the 2nd quarters compared to the num-ber involved in the 1st quarters.
iii. Developments Across Regions
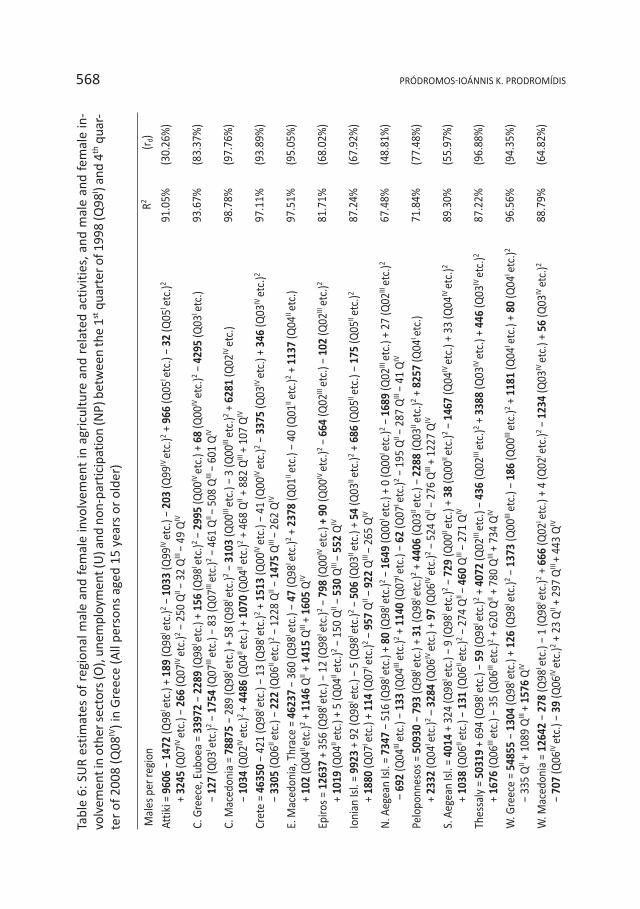
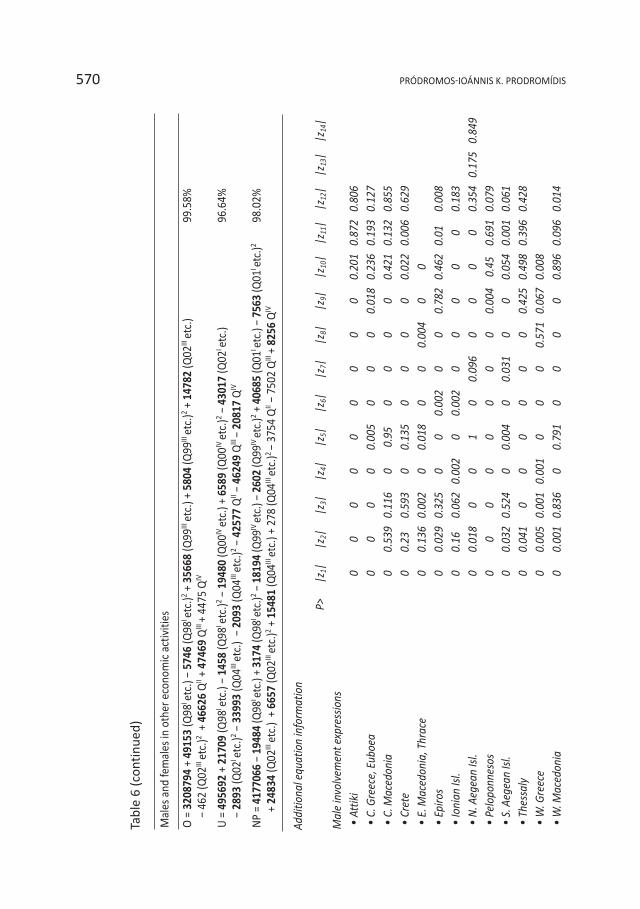
A detailed analysis at the regional level (Table 6) reveals that a number ofseasonal effects turn out to be statistically significant. In East Macedonia andThrace, male and female figures are generally higher in the 2nd, 3rd and 4th
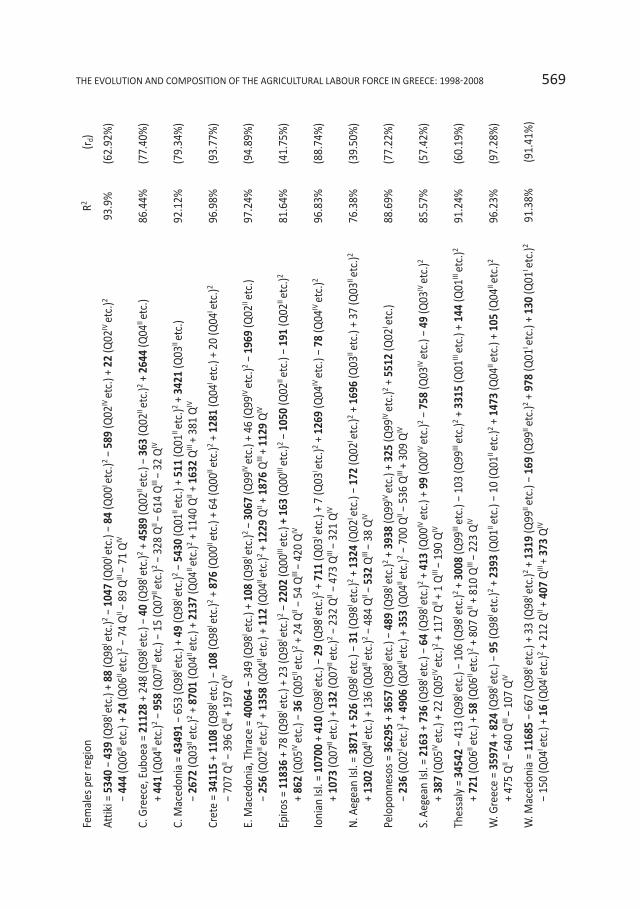
quarters vis-à-vis the 1st quarter; in West Macedonia, female figures arehigher in the 2nd and 3rd quarters; in Central Macedonia, female figures arehigher in the 3rd quarters; and in Western Greece, male figures are higher inthe 4th quarters. At the same time, in Crete and the South Aegean islands,male figures are lower in the 3rd quarters; in the North Aegean islands, fe-male figures are lower in the 3rd quarters; in the Ionian islands and Epiros,male figures are lower in the 2nd–3rd and 3rd–4th quarters, respectively.
Seasonal effects aside, the contraction of the sectoral workforce turns outto be associated with reductions in the male workforces of Central Macedo-nia,10 Western Greece, Thessaly,11 Crete, East Macedonia and Thrace that en-gaged in agricultural activities, as well as with reductions in the femaleworkforces of East Macedonia and Thrace, Crete, Western Greece12 that en-gaged in similar activities (i.e., five out of the six largest regional male work-forces, and three out of the six largest regional female workforces in the
10 The medium and longer-term pattern of the male agricultural workforce in Central Mace-donia is highly correlated with the corresponding pattern exhibited by the self-employedmales (r=98.1%) and skilled primary sector workers (r=98,3%), which suggests that it mayoverlap to a considerable extent with the other two groups.11 The medium and longer-term pattern of the male agricultural workforce in Thessaly ishighly correlated with the corresponding pattern exhibited by the skilled primary sectorworkers (r=98.8%), which suggests that the two groups may overlap to a considerable extent.12 The medium and longer-term pattern of the female agricultural workforce in WesternGreece is highly correlated with the corresponding pattern exhibited by the unpaid femalefamily members (r=98.1%) and skilled primary sector workers (r=98.6%), which suggests thatit may overlap to a considerable extent with the other two groups.
THE EVOLUTION AND COMPOSITION OF THE AGRICULTURAL LABOUR FORCE IN GREECE: 1998�2008 547
13 Modern-day Attiki comprises ancient Attica and Megaris, the Saronic isles, a slice of theneighbouring Peloponnese and a number of isles off the east Peloponnesian coast. Modern-day Peloponnesos comprises the eastern and southern parts of the Peloponnese, and mod-ern-day Central Greece comprises the parts of the mainland which are located south ofThessaly and Epiros minus the territories of Attica, Megaris, Aetolia and Akarnania.
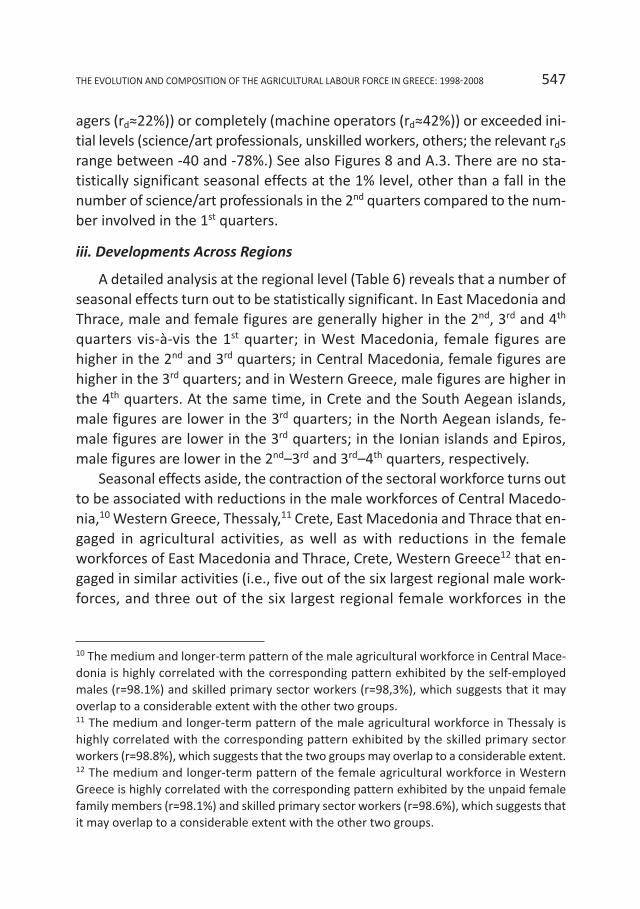
sector, respectively). Indeed, the correlation coefficients of the (non-seasonal)sectoral workforce pattern (see Table 1, expression A) and the aforemen-tioned (non-seasonal) regional forces (i.e., the rds) exceed 93%. On the otherhand, male numbers in Attiki,13 female numbers in Epiros, and male and fe-male numbers in the North Aegean turn out to have fluctuated around the ini-tial level, and in the case of the former, even increased. (The respective rdsrange between 30 and 49%.) See Figures 9 and 10.
Figure 9: The medium- and longer-term patterns of female participation in agriculturalactivities during 1998i-2008iv in Greece by region, exclusive of seasonal effects (in thou-sands of people aged 15 years or older)
548 PRÓDROMOS�IOÁNNIS K. PRODROMÍDIS
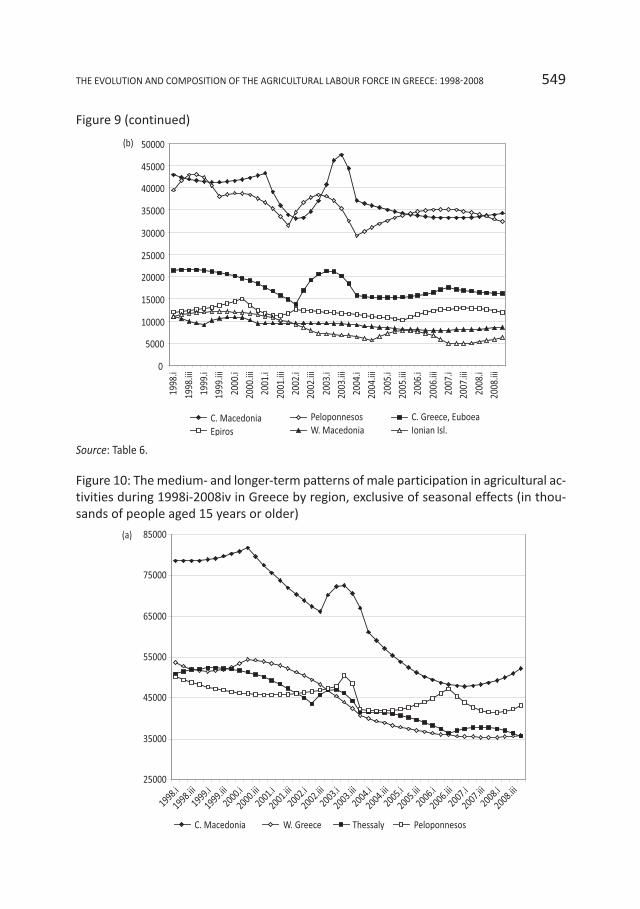
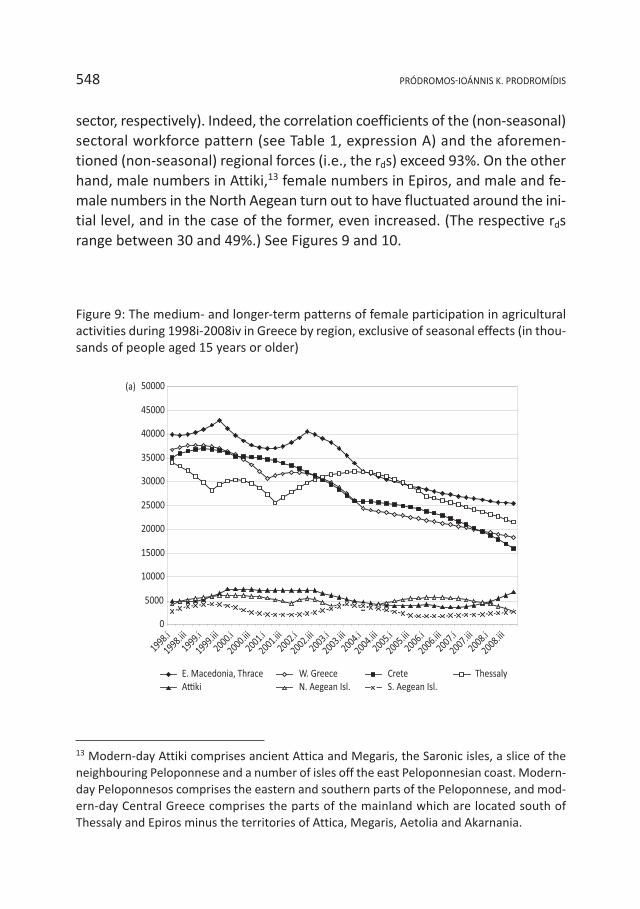
Figure 9 (continued)
Source: Table 6.
THE EVOLUTION AND COMPOSITION OF THE AGRICULTURAL LABOUR FORCE IN GREECE: 1998�2008 549
Figure 10: The medium- and longer-term patterns of male participation in agricultural ac-tivities during 1998i-2008iv in Greece by region, exclusive of seasonal effects (in thou-sands of people aged 15 years or older)
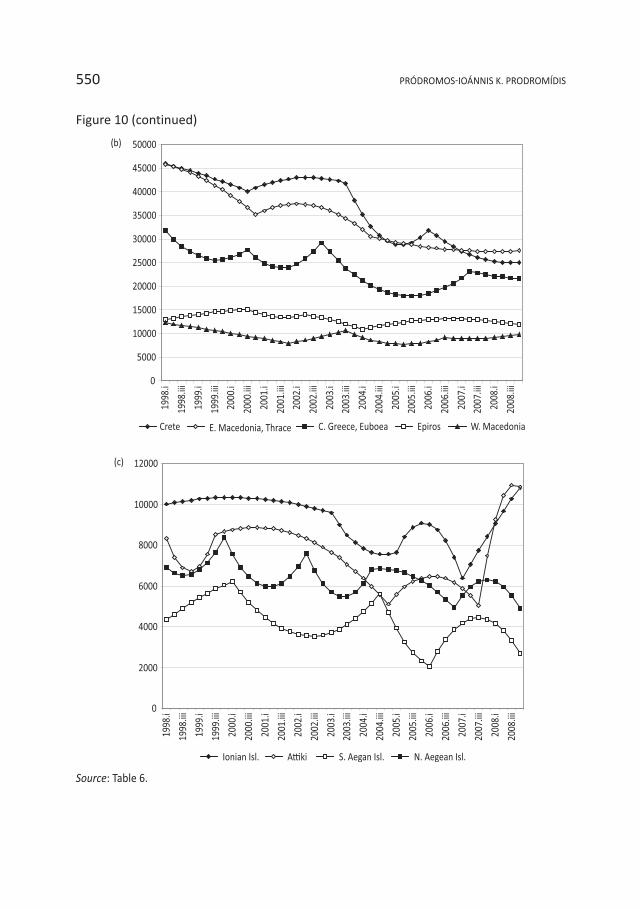
Figure 10 (continued)
Source: Table 6.
550 PRÓDROMOS�IOÁNNIS K. PRODROMÍDIS

14 The medium and longer-term patterns of the male and female agricultural workforcesaged 45-64 years old are highly correlated with the corresponding pattern exhibited by skilledprimary sector workers (r=98.2 and 98.4%, respectively) which suggests that they may over-lap with it to considerable extent. Additionally, the pattern of the male agricultural work-force aged 45-64 is highly correlated with the corresponding patterns exhibited by theself-employed and unpaid males (r=98.4 and 98.8%, respectively), which suggests that it mayoverlap to a considerable extent with the other two groups.15 The medium and longer-term patterns of the male and female agricultural workforces withprimary level educational qualifications are highly correlated with the corresponding patternexhibited by the skilled primary sector workers (r=98.5% in each occasion), which suggeststhat they may overlap to a considerable extent. Additionally, the pattern of the male agri-cultural workforce with primary level educational qualifications is highly correlated with thecorresponding pattern exhibited by the self-employed males (r=98.6%), which suggests thatthe two groups may overlap to a considerable extent.16 The medium and longer-term pattern of the female agricultural workforce without school-ing is highly correlated with the corresponding pattern exhibited by skilled primary sectorworkers (r=98.5%) and the female agricultural workforce aged 45-65 years old (r=98.4%),which suggests that it may overlap to a considerable extent with the other two groups.17 The medium and longer-term pattern of females with some primary level schooling ishighly correlated with the corresponding pattern exhibited by the unpaid female family mem-bers (r=98.3%), which suggests that the two groups may overlap to a considerable extent.
THE EVOLUTION AND COMPOSITION OF THE AGRICULTURAL LABOUR FORCE IN GREECE: 1998�2008 551
iv. Different Responses by Gender, Age and Qualification Groups
A similar analysis in terms of gender and age groupings (Table 7) traces thesector’s declining participation pattern to the medium and longer-term con-traction of (a) the two largest male and female workforces, namely thoseaged 45–64 years old;14 and (b) males aged 20–24 years old involved in agri-cultural activities (rds≥96%). The corresponding numbers of the other genderand age groups diverge somewhat but generally decline. (The respective rdsrange between 80 and 95%.) See also Figures 11 (a) and (b). Of the seasonaleffects, only those regarding the participation influx of males aged 15–19years old in the 3rd–4th quarters and of females aged 15–19 in the 3rd quartersturn out to be statistically significant at the 1% level.
For the most part, the medium and longer-term sectoral pattern can beexplained by the exit from agricultural activities of (a) men and (b) womenwith primary level educational qualifications,15 and (c) women without formalschooling (rd>97%).16 Categories (a) and (b) used to comprise (and apparentlystill comprise) the largest sub-workforces in the sector. The numbers of menand women with some primary schooling,17 along with the number of men
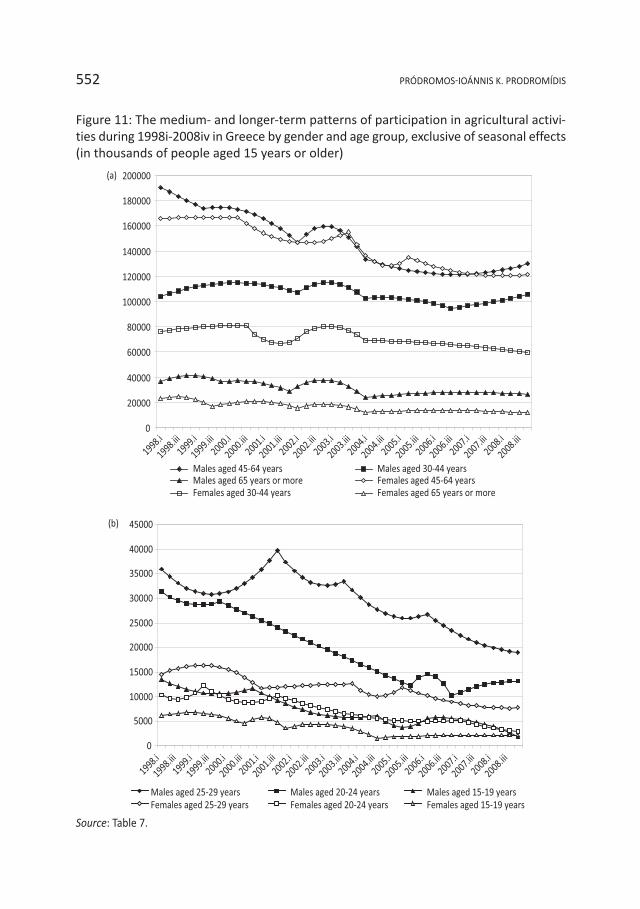
Figure 11: The medium- and longer-term patterns of participation in agricultural activi-ties during 1998i-2008iv in Greece by gender and age group, exclusive of seasonal effects(in thousands of people aged 15 years or older)
Source: Table 7.
552 PRÓDROMOS�IOÁNNIS K. PRODROMÍDIS
THE EVOLUTION AND COMPOSITION OF THE AGRICULTURAL LABOUR FORCE IN GREECE: 1998�2008 553
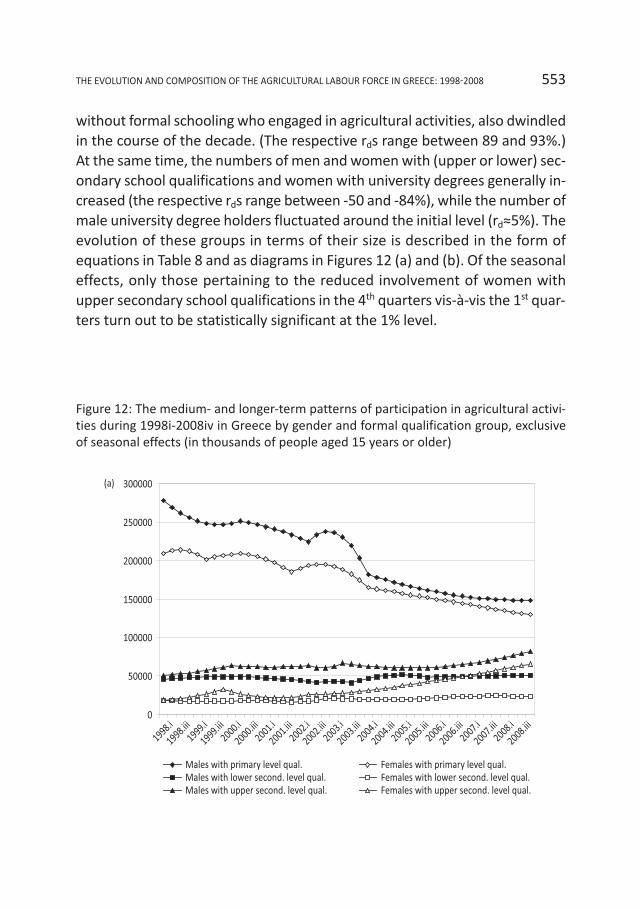
without formal schooling who engaged in agricultural activities, also dwindledin the course of the decade. (The respective rds range between 89 and 93%.)At the same time, the numbers of men and women with (upper or lower) sec-ondary school qualifications and women with university degrees generally in-creased (the respective rds range between -50 and -84%), while the number ofmale university degree holders fluctuated around the initial level (rd≈5%). Theevolution of these groups in terms of their size is described in the form ofequations in Table 8 and as diagrams in Figures 12 (a) and (b). Of the seasonaleffects, only those pertaining to the reduced involvement of women withupper secondary school qualifications in the 4th quarters vis-à-vis the 1st quar-ters turn out to be statistically significant at the 1% level.
Figure 12: The medium- and longer-term patterns of participation in agricultural activi-ties during 1998i-2008iv in Greece by gender and formal qualification group, exclusiveof seasonal effects (in thousands of people aged 15 years or older)
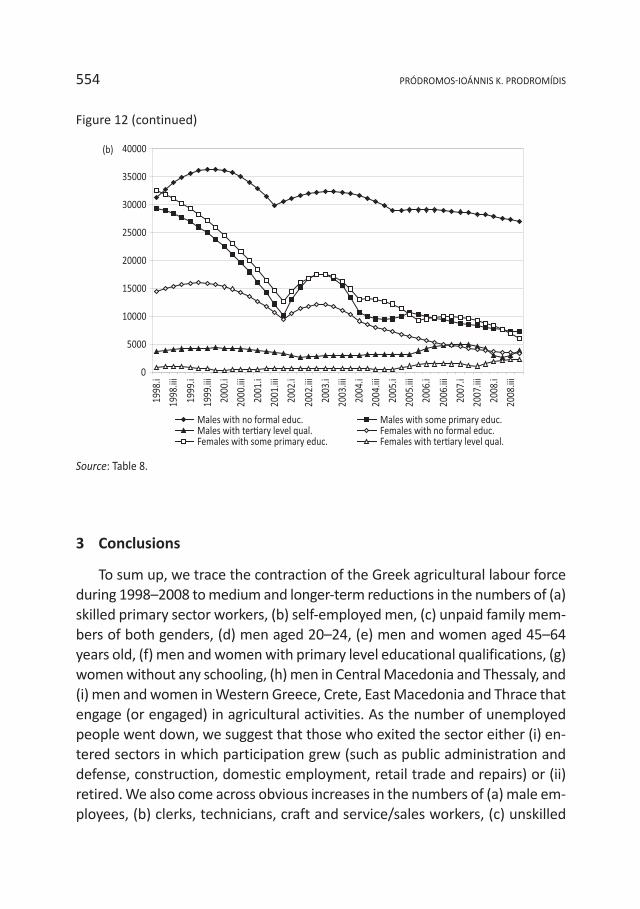
Figure 12 (continued)
Source: Table 8.
554 PRÓDROMOS�IOÁNNIS K. PRODROMÍDIS
3 Conclusions
To sum up, we trace the contraction of the Greek agricultural labour forceduring 1998–2008 to medium and longer-term reductions in the numbers of (a)skilled primary sector workers, (b) self-employed men, (c) unpaid family mem-bers of both genders, (d) men aged 20–24, (e) men and women aged 45–64years old, (f) men and women with primary level educational qualifications, (g)women without any schooling, (h) men in Central Macedonia and Thessaly, and(i) men and women in Western Greece, Crete, East Macedonia and Thrace thatengage (or engaged) in agricultural activities. As the number of unemployedpeople went down, we suggest that those who exited the sector either (i) en-tered sectors in which participation grew (such as public administration anddefense, construction, domestic employment, retail trade and repairs) or (ii)retired. We also come across obvious increases in the numbers of (a) male em-ployees, (b) clerks, technicians, craft and service/sales workers, (c) unskilled
THE EVOLUTION AND COMPOSITION OF THE AGRICULTURAL LABOUR FORCE IN GREECE: 1998�2008 555
workers, (d) men and women with secondary school qualifications, (e) womenwith university degrees, and (f) men in the urban district of Attiki who engagein agricultural activities. All things considered, one discovers a diversity of re-sponses (by different segments of the population) to the changing economic en-vironment, providing a potentially useful glimpse into the evolving compositionof the sector’s workforce. As the latter may signify the need for new arrange-ments or the presence of new possibilities, its early detection may be usefulfor policy purposes; for instance, adopting better tailored economic develop-ment approaches that might appeal to inhabitants who do not meet the tradi-tional farmer’s profile (especially as EU interest shifts from production tostewardship of the land). Indeed, steps could be taken to enhance young peo-ple’s regard or appreciation for employment in agriculture and/or their expec-tations of long-term rewards. These could be facilitated via (a) the provision ofpositive imagery, broad, practical and versatile skills, as well as apprenticeships;(b) the availability of specialist advice regarding the suitability of particular cropsand herds, diversification, returns, entrepreneurship etc.; (c) the promotion ofsynergies with sectors in higher stages of the value-chain (such as manufactur-ing, tourism, sales, tertiary level education and research etc.); (d) improvementsin the management of the flow of goods, information and other resources be-tween points of production and (domestic or foreign) consumption; and so on.
In addition, one observes seasonal swings in (i) the average hours of workperformed by both men and women involved in the sector, as well as in (ii) thesize of some of the groups engaging in such activities—namely, male em-ployers, self-employed males, science/art professionals, female holders ofupper secondary school qualifications, men in Crete, the South Aegean is-lands, the Ionian islands, Western Greece, and Epiros, women in the NorthAegean islands, and Central and Western Macedonia, men and women in EastMacedonia–Thrace, teenaged men and women. The pattern implies periodicattachment to agriculture by segments of the population (or lack of betteroptions). It also begs the question as to whether the (seasonal) duration of in-creased employment opportunities might be prolonged and/or extended toother groups; and what the cost and benefits might be, especially if Greekregions are presumed to possess or wish to build a comparative advantage inagriculture or in other sectors. Obviously, in the trying times of the currenteconomic crisis, a sector’s capacity to provide more jobs during certain sea-sons ought not to be overlooked. Additionally, ceteris paribus, an enlarged
556 PRÓDROMOS�IOÁNNIS K. PRODROMÍDIS
agricultural production that affects lower prices may alleviate some of thehousehold income losses caused by the recent austerity measures.
On the whole, it is hoped that this empirical exploration in the internalcomposition and evolution of the Greek agricultural labour force supplies in-sights into the issue, as well as stimuli for further study, of (a) particular sub-groups of farmers (such as male employees, science/arts professional, menand women with upper secondary qualifications or others who are attractedto the agriculture), and (b) the segments of the population employed in othersectors.
APPENDIX


Figure A1: The medium- and longer-term pattern of participation in agricultural activi-ties, other sectors, unemployment and non-participation during 1998i-2008iv in Greece,exclusive of seasonal effects (in thousands of people aged 15 years or older)
Source: Table 1.
THE EVOLUTION AND COMPOSITION OF THE AGRICULTURAL LABOUR FORCE IN GREECE: 1998�2008 559
560 PRÓDROMOS�IOÁNNIS K. PRODROMÍDIS
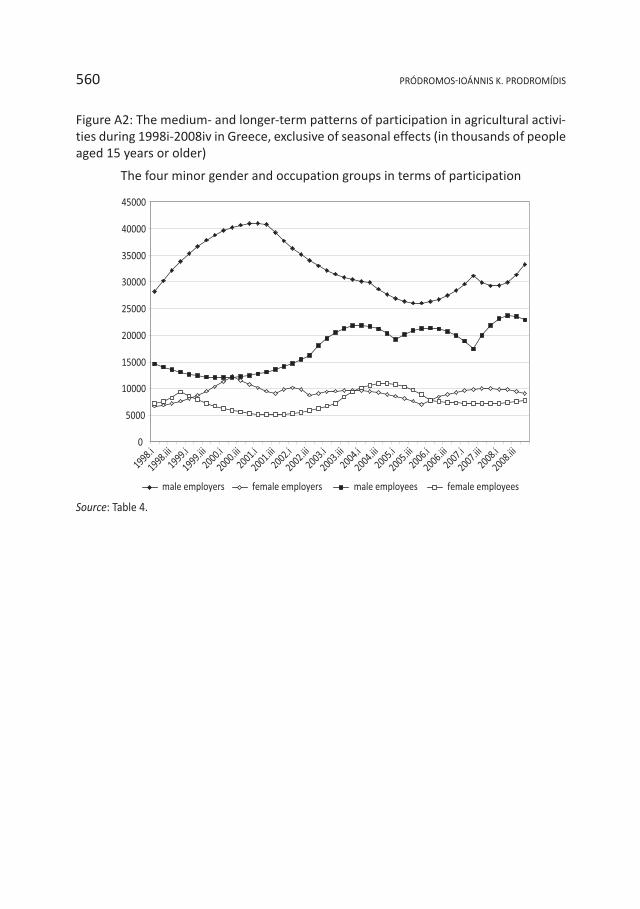
Figure A2: The medium- and longer-term patterns of participation in agricultural activi-ties during 1998i-2008iv in Greece, exclusive of seasonal effects (in thousands of peopleaged 15 years or older)
The four minor gender and occupation groups in terms of participation
Source: Table 4.
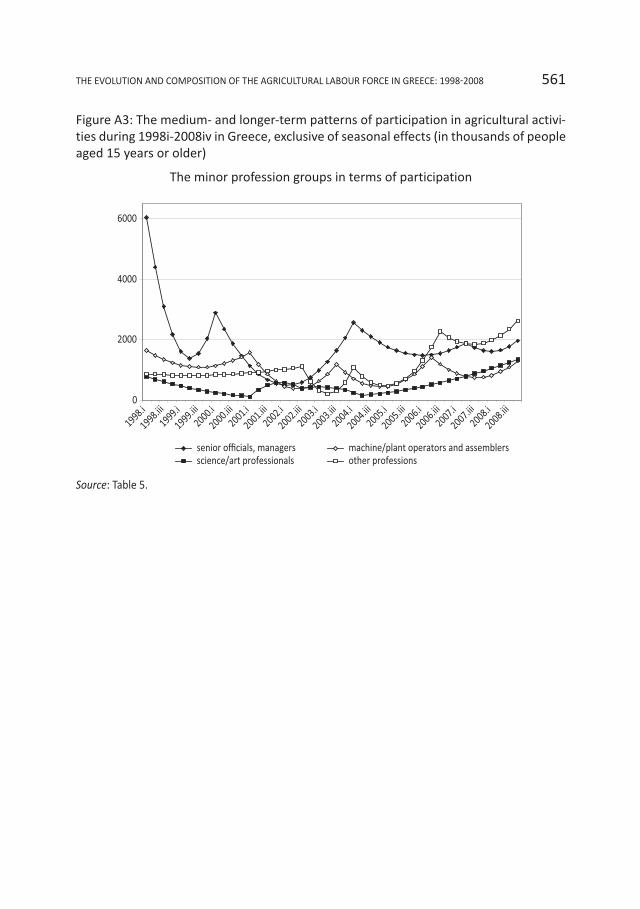
Figure A3: The medium- and longer-term patterns of participation in agricultural activi-ties during 1998i-2008iv in Greece, exclusive of seasonal effects (in thousands of peopleaged 15 years or older)
The minor profession groups in terms of participation
Source: Table 5.
THE EVOLUTION AND COMPOSITION OF THE AGRICULTURAL LABOUR FORCE IN GREECE: 1998�2008 561
Economic Activities R2
A = 710811 − 2072 (Q98I etc.) + 21 (Q98I etc.)2 − 19461 (Q00III etc.) + 1549 (Q00III etc.)2
+ 19047 (Q03I etc.) − 15062 (Q03I etc.)2 + 75253 (Q04I etc.) + 13543 (Q04I etc.)2 − 3269 QII
− 1773 QIII + 2148 QIV
99.03%
O = 3186891 + 65960 (Q98I etc.) − 8028 (Q98I etc.)2 + 46192 (Q99II etc.) + 8137 (Q99II etc.)2
+ 13105 (Q02II etc.) − 497 (Q02II etc.)2 + 46310 QII + 46607 QIII + 3433 QIV99.59%
U = 495008 + 22438 (Q98I etc.) − 1545 (Q98I etc.)2 − 18298 (Q00III etc.) + 6897 (Q00III etc.)2
− 44956 (Q01IV etc.) − 3193 (Q01IV etc.)2 − 32038 (Q04II etc.) − 2045 (Q04II etc.)2 − 42479 QII
− 46164 QIII − 20815 QIV
96.72%
NP = 4188620 − 27997 (Q98I etc.) + 4278 (Q98I etc.)2 − 29995 (Q99III etc.) − 2802 (Q99III etc.)2
+ 33162 (Q00IV etc.) − 7977 (Q00IV etc.)2 + 19937 (Q02II etc.) + 6455 (Q02II etc.)2
+ 12942 (Q04II etc.) + 3 (Q04II etc.)2 − 3721 QII − 7574 QIII + 8399 QIV
97.90%
Table 1: SUR estimates of the population’s involvement in agriculture and related activ-ities (A), other sectors (O), unemployment (U) and non-participation (NP) between the1st quarter of 1998 (Q98I) and 4th quarter of 2008 (Q08IV) in Greece (All persons aged 15years or older)
Notes: (a) The quarterly samples of 2004-2008 are based on the 2001 Census, while the figures pertainingto 1998-2003 are based on re-weightings of the relevant samples.(b) Bold fonts denote significance at the 1% level.
Additional equation information:A: P >|z1| = 0; P>|z2| = 0.512; P>|z3| = 0.931; P>|z4| = 0; P>|z5| = 0; P>|z6| = 0.023; P>|z7| = 0; P>|z8|
= 0; P>|z9| = 0; P>|z10| = 0.334; P>|z11| = 0.604; P>|z12| = 0.53.O: P>|z1| = 0; P>|z2| = 0; P>|z3| = 0.001; P>|z4| = 0.001; P>|z5| = 0.001; P>|z6| = 0.005; P>|z7| = 0.093;
P>|z8| = 0; P>|z9| = 0; P>|z10| = 0.642.U: P>|z1| = 0; P>|z2| = 0; P>|z3| = 0; P>|z4| = 0.045; P>|z5| = 0; P>|z6| = 0; P>|z7| = 0.012; P>|z8| = 0;
P>|z9| = 0; P>|z10| = 0; P>|z11| = 0; P>|z12| = 0.NP: P>|z1| = 0; P>|z2| = 0; P>|z3| = 0; P>|z4| = 0; P>|z5| = 0.005; P>|z6| = 0; P>|z7| = 0; P>|z8| = 0.001;
P>|z9| = 0; P>|z10| = 0; P>|z11| = 0.993; P>|z12| = 0.236; P>|z13| = 0.016; P>|z14| = 0.008.
Source: Labour Force Surveys of 1998-2008, National Statistical Service of Greece. Own calculations.
562 PRÓDROMOS�IOÁNNIS K. PRODROMÍDIS
Female participation share R2
0.4165 + 0.0036 (Q98I etc.) − 0.0003 (Q98I etc.)2 + 0.0191 (Q99III etc.) − 0.0020 (Q99III etc.)2
+ 0.0111 (Q03II etc.) + 0.0021 (Q03II etc.)2 − 0.0034 (Q07III etc.) + 0.0006 (Q07III etc.)2
+ 0.0022 QII + 0.0019 QIII − 0.0008 QIV
91.44%
Table 2: Estimates with robust standard errors of the female participation share out ofall persons aged 15 years or older involved in agriculture and related activities betweenthe 1st quarter of 1998 (Q98I) and 4th quarter of 2008 (Q08IV) in Greece
Notes: As in Table 1.
Additional equation information:P >|z1| = 0; P>|z2| = 0; P>|z3| = 0; P>|z4| = 0; P>|z5| = 0; P>|z6| = 0; P>|z7| = 0; P>|z8| = 0.016; P>|z9| = 0.02; P>|z10| = 0.098; P>|z11| = 0.198; P>|z12| = 0.556.
Source: Labour Force Surveys of 1998-2008, National Statistical Service of Greece. Own calculations.
Average number of weekly hours worked by R2
men = 36.5420 + 0.0951 (Q98I etc.) − 0.0018 (Q98I etc.)2 − 0.5275 (Q05IV etc.) + 0.0375 (Q05IV etc.)2 + 7.3356 QII + 8.9065 QIII + 3.0160 QIV
91.28%
women = 28.3402 + 0.2585 (Q98I etc.) − 0.0100 (Q98I etc.)2 − 0.0891 (Q05IV etc.) + 0.0412 (Q05IV etc.)2 + 7.0435 QII + 9.3513 QIII + 4.0655 QIV
92.57%
Table 3: SUR estimates of the average number of weekly hours that men and womenengaged in agriculture and related activities between the 1st quarter of 1998 (Q98I) and4th quarter of 2008 (Q08IV) in Greece (All persons aged 15 years or older)
Notes: As in Table 1.
Additional equation information:men: P >|z1| = 0; P>|z2| = 0.287; P>|z3| = 0.494; P>|z4| = 0.026; P>|z5| = 0; P>|z6| = 0; P>|z7| = 0; P>|z8| = 0.women: P >|z1| = 0; P>|z2| = 0.004; P>|z3| = 0; P>|z4| = 0.74; P>|z5| = 0.014; P>|z6| = 0; P>|z7| = 0;
P>|z8| = 0.
Source: Labour Force Surveys of 1998-2008, National Statistical Service of Greece. Own calculations.
THE EVOLUTION AND COMPOSITION OF THE AGRICULTURAL LABOUR FORCE IN GREECE: 1998�2008 563
Mal
es in
agr
icul
ture
etc
.R2
(rd)
Self-
empl
oyed
= 3
0302
5−
9622
(Q98
I etc.
) + 9
32(Q
98I et
c.)2
− 11
813
(Q00
I etc.
) − 6
12(Q
00I et
c.)2
+ 11
152
(Q03
II et
c.)
− 60
12(Q
03II
etc.
)2+
3075
8(Q
04II
etc.
) + 5
749
(Q04
II et
c.)2
− 14
19Q
II −
3390
QIII
− 40
7 Q
IV98
.77%
(99.
21%
)
Empl
oyer
s = 2
5921
+ 23
36(Q
98I et
c.) −
91
(Q98
I etc.
)2−
1497
(Q01
III et
c.) +
156
(Q01
III et
c.)2
− 12
65(Q
04III
etc.
) + 5
9 (Q
04III
etc.
)2
− 31
43(Q
07II
etc.
) + 1
94(Q
07II
etc.
)2−
130
QII
+ 13
49Q
III +
1569
QIV
95.5
9%(6
8.25
%)
Empl
oyee
s = 1
5366
− 74
4(Q
98I et
c.) +
42
(Q98
I etc.
)2+
1055
(Q02
IV et
c.) −
202
(Q02
IV et
c.)2
+ 24
46(Q
05II
etc.
) + 1
2 (Q
05II
etc.
)2
+ 43
95(Q
07III
etc.
) − 1
81 (Q
07III
etc.
)2+
817
QII
+ 35
4 Q
III +
136
QIV
94.8
4%(−
84.9
6%)
Unp
aid
fam
ily m
embe
rs =
718
47+
3239
(Q98
I etc.
) − 6
18(Q
98I et
c.)2
+ 45
17(Q
99III
etc.
) + 4
97 (Q
99III
etc.
)2+
5931
(Q02
III et
c.)
− 65
9(Q
02III
etc.
)2+
7357
(Q04
II et
c.) +
780
(Q04
II et
c.)2
− 17
69 Q
II+
158
QIII
+ 44
QIV
97.4
5%
(97.
83%
)
Fem
ales
in a
gric
ultu
re e
tc.
Self-
empl
oyed
= 8
7890
+ 27
19 (Q
98I et
c.) +
128
(Q98
I etc.
)2−
6688
(Q00
I etc.
) + 5
7 (Q
00I et
c.)2
− 68
87(Q
03II
etc.
) +
76 (Q
03II
etc.
)2−
7276
(Q06
III et
c.) +
199
(Q06
III et
c.)2
+ 11
08 Q
II −
80 Q
III −
1736
QIV
87.6
7%(−
9.06
%)
Empl
oyer
s = 6
583
+ 65
(Q98
I etc.
) + 5
0(Q
98I et
c.)2
− 18
95(Q
00III
etc.
) − 1
7(Q
00III
etc.
)2+
1726
(Q01
IV et
c.) −
357
(Q01
IV et
c.)
+ 17
26(Q
02IV
etc.
)+ 2
86(Q
02IV
etc.
)2 +
1370
(Q06
I etc.
)2 −
10 (Q
06I et
c.)2
− 82
QII
− 19
9 Q
III −
73 Q
IV90
.89%
(5
.08%
)
Empl
oyee
s = 7
125
− 11
1 (Q
98I et
c.) +
166
(Q98
I etc.
)2−
2025
(Q99
I etc.
) − 1
28 (Q
99I et
c.)2
+ 72
1(Q
03III
etc.
) − 1
51(Q
03III
etc.
)2
+ 96
5(Q
06II
etc.
) + 1
33(Q
06II
etc.
)2+
693
QII
+ 73
5 Q
III +
327
QIV
86.7
6%
(−38
.06%
)
Unp
aid
fam
ily m
embe
rs =
190
573
− 12
32 (Q
98I et
c.) −
189
(Q98
I etc.
)2+
1474
2(Q
02I et
c.) −
836
(Q02
II et
c.)2
+ 99
03 (Q
04II
etc.
) +
992
(Q04
II et
c.)2
− 62
5 Q
II+
1888
QIII
+ 27
85 Q
IV98
.45%
(9
6.48
%)
Mal
es a
nd fe
mal
es in
oth
er e
cono
mic
act
iviti
es
O =
318
3490
+ 69
397
(Q98
I etc.
) − 8
610
(Q98
I etc.
)2+
5144
4(Q
99III
etc.
) + 8
590
(Q99
III et
c.)2
+ 14
834
(Q02
III et
c.)
− 37
8 (Q
02III
etc.
)2+
4647
2Q
II+
4653
8Q
III +
3324
QIV
99.5
9%
U =
503
014
+ 18
339
(Q98
I etc.
) − 1
183
(Q98
I etc.
)2−
2772
6(Q
00IV
etc.
) + 7
315
(Q00
IV et
c.)2
− 45
270
(Q02
I etc.
)−
4192
(Q02
I etc.
)2−
2842
1 (Q
04III
etc.
) − 1
881
(Q04
III et
c.)2
− 42
185
QII
− 46
097
QIII
− 20
367
QIV
96.5
7%
Tabl
e 4:
SU
R es
timat
es o
f (i)
gend
er a
nd o
ccup
atio
n gr
oupi
ngs
invo
lved
in a
gric
ultu
re a
nd re
late
d ac
tiviti
es, a
nd (i
i) m
ale
and
fe-
mal
e in
volv
emen
t in
othe
r sec
tors
(O),
unem
ploy
men
t (U
) and
non
-par
ticip
atio
n (N
P) b
etw
een
the
1stqu
arte
r of 1
998
(Q98
I ) and
4thqu
arte
r of
200
8 (Q
08IV
) in
Gre
ece
(All
pers
ons
aged
15
year
s or
old
er)
564 PRÓDROMOS�IOÁNNIS K. PRODROMÍDIS
NP
= 41
9045
3−
2962
9(Q
98I et
c.) +
453
7(Q
98I et
c.)2
− 36
129
(Q99
IV et
c.) −
233
3 (Q
99IV
etc.
)2+
3151
8(Q
01I et
c.) −
905
5(Q
01I
etc.
)2+
2443
4(Q
02III
etc.
) +
6620
(Q02
III et
c.)2
+ 14
173
(Q04
III et
c.) +
184
(Q04
III et
c.)2
− 35
03 Q
II−
7719
QIII
+ 83
12Q
IV97
.93%
Addi
tiona
l equ
atio
n in
form
atio
n
P>|z
1||z
2||z
3||z
4||z
5||z
6||z
7||z
8||z
9||z
10|
|z11
||z
12|
|z13
||z
14|
Mal
e in
volv
emen
t exp
ress
ions
•
Self-
empl
oyed
00
00
0.00
40.
001
00
00.
351
0.02
80.
791
• Em
ploy
ers
00
00
00.
005
0.01
50
0.00
20.
775
0.00
30.
001
• Em
ploy
ees
00
00.
002
00
0.71
60
0.02
40.
041
0.37
60.
737
• U
npai
d fa
mily
mem
bers
00.
060.
006
0.00
10.
023
00
00
0.05
60.
866
0.96
2Fe
mal
e in
volv
emen
t exp
ress
ions
• Se
lf-em
ploy
ed0
0.06
70.
389
00.
693
00.
054
00.
001
0.29
50.
940.
105
• Em
ploy
ers
00.
705
0.00
10
0.72
20.
001
00
00
0.18
90.
596
0.21
40.
645
• Em
ploy
ees
00.
935
0.51
40.
010.
614
0.00
10
00
0.01
50.
011
0.25
7•
Unp
aid
fam
ily m
embe
rs0
0.17
80
00
00
0.73
60.
310.
136
Mal
e &
fem
ale
invo
lvem
ent i
n•
Oth
er se
ctor
s (O
) 0
00
00
0.00
10.
157
00
0.65
2•
Une
mpl
oym
ent (
U)
00
00
00
00
00
00
• N
on-p
artic
ipat
ion
(NP)
00
00
0.01
50
00
00
0.52
80.
265
0.01
40.
009
Not
es: A
s in
Tabl
e 1.
The
r dst
atist
ic re
late
s the
deg
ree
of c
orre
latio
n be
twee
n (i)
the
non-
seas
onal
com
pone
nt o
f the
occ
upat
iona
l equ
atio
n an
d (ii
) the
sec-
tora
l equ
atio
n “A
” pr
ovid
ed in
Tabl
e 1
with
out i
ts se
ason
al e
ffect
s.
Sour
ce:L
abou
r For
ce S
urve
ys o
f 199
8-20
08, N
atio
nal S
tatis
tical
Ser
vice
of G
reec
e. O
wn
calc
ulat
ions
.
THE EVOLUTION AND COMPOSITION OF THE AGRICULTURAL LABOUR FORCE IN GREECE: 1998�2008 565
Peop
le in
agr
icul
ture
etc
.R2
(rd)
Seni
or o
ffici
als,
man
ager
s = 8
027
− 21
74(Q
98I et
c.) +
178
(Q98
I etc.
)2−
1609
(Q00
II et
c.) −
143
(Q00
II et
c.)2
− 80
7(Q
04II
etc.
) −
18 (Q
04II
etc.
)2−
368
(Q07
III et
c.) +
19
(Q07
III et
c.)2
+ 27
0 Q
II −
97 Q
III −
246
QIV
70.0
5%
(21.
71%
)
Skill
ed p
rimar
y se
ctor
wor
kers
= 6
7290
0+
6912
(Q98
I etc.
) − 6
92(Q
98I et
c.)2
+ 41
885
(Q02
II et
c.) −
346
9(Q
02II
etc.
)2
+ 36
213
(Q04
II et
c.) +
427
8(Q
04II
etc.
)2−
3631
QII
− 91
7 Q
III +
2266
QIV
97.8
1%
(98.
89%
)
Uns
kille
d w
orke
rs =
656
9+
4363
(Q98
I etc.
) − 6
23(Q
98I et
c.)2
+ 24
31(Q
99III
etc.
) + 6
92(Q
99III
etc.
)2−
2914
(Q04
II et
c.)
− 22
(Q04
II et
c.)2
+ 48
0 Q
II−
21 Q
III −
372
QIV
92.2
7%
(−78
.02%
)
Scie
nce/
art p
rofe
ssio
nals
= 88
2−
96(Q
98I et
c.) +
3 (Q
98I et
c.)2
+ 27
8(Q
01II
etc.
) − 3
8(Q
01II
etc.
)2+
216
(Q02
IV et
c.)
+ 24
(Q02
IV et
c.)2
+ 14
3(Q
04III
etc.
) + 1
4(Q
04III
etc.
)2−
112
QII
− 73
QIII
− 21
QIV
91.4
9%
(−40
.28%
)
Mac
hine
/pla
nt o
pera
tors
and
ass
embl
ers =
183
4−
206
(Q98
I etc.
) + 1
4(Q
98I et
c.)2
− 60
6(Q
01II
etc.
) + 2
6 (Q
01II
etc.
)2
− 65
0(Q
03IV
etc.
) − 1
2 (Q
03IV
etc.
)2−
583
(Q06
III et
c.) −
5 (Q
06III
etc.
)2+
201
QII
+ 21
0 Q
III +
142
QIV
72.5
0%
(41.
50%
)
Cler
ks, t
echn
icia
ns, c
raft
and
serv
ice/
sale
s wor
kers
= 8
96−
22 (Q
98I et
c.) +
2 (Q
98I et
c.)2
− 63
7(Q
02IV
etc.
) + 9
6(Q
02IV
etc.
)2
− 91
0(Q
04II
etc.
) − 5
3 (Q
04II
etc.
)2−
783
(Q06
IV et
c.) −
17
(Q06
IV et
c.) +
46
QII
− 21
QIII
− 17
QIV
82.5
9%
(−59
.57%
)
Peop
le in
oth
er e
cono
mic
act
iviti
es
O =
321
8865
+ 44
028
(Q98
I etc.
) − 5
201
(Q98
I etc.
)2+
3357
4(Q
99III
etc.
) + 5
342
(Q99
III et
c.)2
+ 13
017
(Q02
III et
c.) −
531
(Q02
III
etc.
)2+
4675
0Q
II+
4785
7Q
III +
4966
QIV
99.5
8%
U =
500
500
+ 19
687
(Q98
I etc.
) − 1
311
(Q98
I etc.
)2−
2021
4(Q
00IV
etc.
) + 6
185
(Q00
IV et
c.)2
− 37
564
(Q02
I etc.
) − 2
987
(Q02
I
etc.
)2−
2907
9 (Q
04III
etc.
) − 1
800
(Q04
III et
c.)2
− 42
296
QII
− 45
960
QIII
− 20
269
QIV
96.6
0%
NP
= 41
9042
7−
2985
6(Q
98I et
c.) +
457
4(Q
98I et
c.)2
− 34
737
(Q99
IV et
c.) −
280
9(Q
99IV
etc.
)2+
3546
8(Q
01I et
c.) −
874
1(Q
01I
etc.
)2+
2403
3(Q
02III
etc.
) + 6
828
(Q02
III et
c.)2
+ 13
436
(Q04
III et
c.) +
105
(Q04
III et
c.)2
− 35
61 Q
II−
7665
QIII
+ 84
52Q
IV97
.95%
Tabl
e 5:
SU
R es
timat
es o
f (i)
prof
essi
onal
gro
upin
gs in
volv
ed in
agr
icul
ture
and
rela
ted
activ
ities
, and
(ii)
invo
lvem
ent i
n ot
her s
ec-
tors
(O),
unem
ploy
men
t (U
) and
non
-par
ticip
atio
n (N
P) b
etw
een
the
1stqu
arte
r of
199
8 (Q
98I ) a
nd 4
thqu
arte
r of
200
8 (Q
08IV
)in
Gre
ece
(All
pers
ons
aged
15
year
s or
old
er)
566 PRÓDROMOS�IOÁNNIS K. PRODROMÍDIS
Addi
tiona
l equ
atio
n in
form
atio
n:
P>|z
1||z
2||z
3||z
4||z
5||z
6||z
7||z
8||z
9||z
10|
|z11
||z
12|
|z13
||z
14|
Peop
le in
agr
icul
ture
etc
.
• Se
nior
offi
cial
s, m
anag
ers
00
00
00
0.02
40.
249
0.64
80.
328
0.72
90.
382
• Sk
illed
prim
ary
sect
or w
orke
rs0
0.00
30
00
00
0.48
30.
860.
665
• U
nski
lled
wor
kers
00
00.
001
00
0.01
10.
344
0.96
70.
472
• Sc
ienc
e/ar
t pro
fess
iona
ls0
0.00
10.
136
00
0.00
50.
002
0.00
20.
007
0.00
40.
064
0.60
1
• Pl
ant/
mac
hine
ope
rato
rs a
nd a
ssem
bler
s0
0.00
10.
001
00
00.
045
00.
426
0.02
40.
019
0.11
7
• Cl
erks
, tec
hnic
ians
, cra
ft &
serv
ice/
sale
sw
orke
rs0
0.02
90.
325
00
0.00
20
00.
782
0.46
20.
010.
008
Mal
e &
fem
ale
invo
lvem
ent i
n
• O
ther
sect
ors (
O)
00
00
00
0.02
50
00.
541
• U
nem
ploy
men
t (U
) 0
00
00
00
00
00
0
• N
on-p
artic
ipat
ion
(NP)
00
00
00
00
00
0.19
0.23
0.01
70.
009
Not
es:A
s in
Tabl
e 1.
The
r dst
atist
ic re
late
s the
deg
ree
of c
orre
latio
n be
twee
n (i)
the
non-
seas
onal
com
pone
nt o
f the
pro
fess
iona
l equ
atio
n an
d (ii
) the
sec-
tora
l equ
atio
n “A
” pr
ovid
ed in
Tabl
e 1
with
out i
ts se
ason
al e
ffect
s.
Sour
ce: L
abou
r For
ce S
urve
ys o
f 199
8-20
08, N
atio
nal S
tatis
tical
Ser
vice
of G
reec
e. O
wn
calc
ulat
ions
.
THE EVOLUTION AND COMPOSITION OF THE AGRICULTURAL LABOUR FORCE IN GREECE: 1998�2008 567
Mal
es p
er re
gion
R2(r
d)
Attik
i = 9
606
− 14
72(Q
98I et
c.) +
189
(Q98
I etc.
)2−
1033
(Q99
IV et
c.) −
203
(Q99
IV et
c.)2
+ 96
6(Q
05I et
c.) −
32
(Q05
I etc.
)2
+ 32
45(Q
07IV
etc.
) − 2
66(Q
07IV
etc.
)2−
250
QII
− 32
QIII
− 49
QIV
91.0
5%
(30.
26%
)
C. G
reec
e, E
uboe
a =
3397
2−
2289
(Q98
I etc.
) + 1
56(Q
98I et
c.)2
− 29
95(Q
00IV
etc.
) + 6
8(Q
00IV
etc.
)2−
4295
(Q03
I etc.
) −
127
(Q03
I etc.
)2−
1754
(Q07
III et
c.) −
83
(Q07
III et
c.)2
− 46
1 Q
II −
508
QIII
− 60
1 Q
IV93
.67%
(8
3.37
%)
C. M
aced
onia
= 7
8875
− 28
9 (Q
98I et
c.) +
58
(Q98
I etc.
)2−
3103
(Q00
III et
c.) −
3 (Q
00III
etc.
)2+
6281
(Q02
IV et
c.)
− 10
34(Q
02IV
etc.
)2+
4486
(Q04
II et
c.) +
107
0(Q
04II
etc.
)2+
468
QII
+ 88
2 Q
III +
107
QIV
98.7
8%
(97.
76%
)
Cret
e =
4635
0−
421
(Q98
I etc.
) − 1
3 (Q
98I et
c.)2
+ 15
13(Q
00IV
etc.
) − 4
1 (Q
00IV
etc.
)2−
3375
(Q03
IV et
c.) +
346
(Q03
IV et
c.)2
− 33
05(Q
06II
etc.
) − 2
22(Q
06II
etc.
)2−
1228
QII
− 14
75Q
III −
262
QIV
97.1
1%(9
3.89
%)
E. M
aced
onia
, Thr
ace
= 46
237
− 36
0 (Q
98I et
c.) −
47
(Q98
I etc.
)2+
2378
(Q01
II et
c.) −
40
(Q01
II et
c.)2
+ 11
37(Q
04II
etc.
) +
102
(Q04
II et
c.)2
+ 11
46 Q
II+
1415
QIII
+ 16
05Q
IV97
.51%
(9
5.05
%)
Epiro
s = 1
2637
+ 35
6 (Q
98I et
c.) −
12
(Q98
I etc.
)2−
798
(Q00
IV et
c.) +
90
(Q00
IV et
c.)2
− 66
4(Q
02III
etc.
) − 1
02(Q
02III
etc.
)2
+ 10
19(Q
04II
etc.
) + 5
(Q04
II et
c.)2
− 15
0 Q
II−
530
QIII
− 55
2Q
IV81
.71%
(68.
02%
)
Ioni
an Is
l. =
9923
+ 92
(Q98
I etc.
) − 5
(Q98
I etc.
)2−
506
(Q03
II et
c.) +
54
(Q03
II et
c.)2
+ 68
6(Q
05II
etc.
) − 1
75(Q
05II
etc.
)2
+ 18
80(Q
07I et
c.) +
114
(Q07
I etc.
)2−
957
QII
− 92
2Q
III −
265
QIV
87.2
4%(6
7.92
%)
N. A
egea
n Is
l. =
7347
− 51
6 (Q
98I et
c.) +
80
(Q98
I etc.
)2−
1649
(Q00
I etc.
) + 0
(Q00
I etc.
)2−
1689
(Q02
III et
c.) +
27
(Q02
III et
c.)2
– 69
2(Q
04III
etc.
) − 1
33(Q
04III
etc.
)2+
1140
(Q07
I etc.
) − 6
2(Q
07I et
c.)2
− 19
5 Q
II −
287
QIII
− 41
QIV
67.4
8%(4
8.81
%)
Pelo
ponn
esos
= 5
0930
− 79
3(Q
98I et
c.) +
31
(Q98
I etc.
)2+
4406
(Q03
II et
c.) −
228
8(Q
03II
etc.
)2+
8257
(Q04
I etc.
) +
2332
(Q04
I etc.
)2–
3284
(Q06
IV et
c.) +
97
(Q06
IV et
c.)2
− 52
4 Q
II −
276
QIII
+ 12
27 Q
IV71
.84%
(77.
48%
)
S. A
egea
n Is
l. =
4014
+ 32
4 (Q
98I et
c.) −
9 (Q
98I et
c.)2
−72
9(Q
00II
etc.
) + 3
8(Q
00II
etc.
)2−
1467
(Q04
IV et
c.) +
33
(Q04
IV et
c.)2
+ 10
38(Q
06II
etc.
) − 1
31(Q
06II
etc.
)2−
274
QII
− 46
0Q
III −
271
QIV
89.3
0%(5
5.97
%)
Thes
saly
= 5
0319
+ 69
4 (Q
98I et
c.) −
59
(Q98
I etc.
)2+
4072
(Q02
III et
c.) −
436
(Q02
III et
c.)2
+ 33
88(Q
03IV
etc.
) + 4
46(Q
03IV
etc.
)2
+ 16
76(Q
06III
etc.
) − 3
5 (Q
06III
etc.
)2+
620
QII
+ 78
0 Q
III +
734
QIV
87.2
2%(9
6.88
%)
W. G
reec
e =
5485
5−
1304
(Q98
I etc.
) + 1
26(Q
98I et
c.)2
− 13
73(Q
00III
etc.
) − 1
86(Q
00III
etc.
)2+
1181
(Q04
I etc.
) + 8
0(Q
04I et
c.)2
− 33
5 Q
II+
1089
QIII
+ 15
76Q
IV96
.56%
(94.
35%
)
W. M
aced
onia
= 1
2642
− 27
8(Q
98I et
c.) −
1 (Q
98I et
c.)2
+ 66
6(Q
02I et
c.) +
4 (Q
02I et
c.)2
− 12
34(Q
03IV
etc.
) + 5
6(Q
03IV
etc.
)2
− 70
7(Q
06IV
etc.
) − 3
9(Q
06IV
etc.
)2+
23 Q
II+
297
QIII
+ 44
3 Q
IV88
.79%
(64.
82%
)
Tabl
e 6:
SU
R es
timat
es o
f reg
iona
l mal
e an
d fe
mal
e in
volv
emen
t in
agr
icul
ture
and
rel
ated
act
iviti
es, a
nd m
ale
and
fem
ale
in-
volv
emen
t in
othe
r sec
tors
(O),
unem
ploy
men
t (U
) and
non
-par
ticip
atio
n (N
P) b
etw
een
the
1stqu
arte
r of 1
998
(Q98
I ) and
4th
quar
-te
r of
200
8 (Q
08IV
) in
Gre
ece
(All
pers
ons
aged
15
year
s or
old
er)
568 PRÓDROMOS�IOÁNNIS K. PRODROMÍDIS
Fem
ales
per
regi
on
R2(r
d)
Attik
i = 5
340
− 43
9(Q
98I et
c.) +
88
(Q98
I etc.
)2−
1047
(Q00
I etc.
) − 8
4(Q
00I et
c.)2
− 58
9(Q
02IV
etc.
) + 2
2(Q
02IV
etc.
)2
− 44
4(Q
06II
etc.
) + 2
4(Q
06II
etc.
)2−
74 Q
II −
89 Q
III −
71 Q
IV93
.9%
(62.
92%
)
C. G
reec
e, E
uboe
a =
2112
8+
248
(Q98
I etc.
) − 4
0 (Q
98I et
c.)2
+ 45
89(Q
02II
etc.
) − 3
63(Q
02II
etc.
)2+
2644
(Q04
II et
c.)
+ 44
1(Q
04II
etc.
)2−
958
(Q07
II et
c.) −
15
(Q07
II et
c.)2
− 32
8 Q
II −
614
QIII
− 32
QIV
86.4
4%(7
7.40
%)
C. M
aced
onia
= 4
3491
− 65
3 (Q
98I et
c.) +
49
(Q98
I etc.
)2−
5430
(Q01
II et
c.) +
511
(Q01
II et
c.)2
+ 34
21(Q
03II
etc.
) −
2672
(Q03
II et
c.)2
+ 87
01(Q
04II
etc.
) + 2
137
(Q04
II et
c.)2
+ 11
40 Q
II+
1632
QIII
+ 38
1 Q
IV92
.12%
(79.
34%
)
Cret
e =
3411
5+
1108
(Q98
I etc.
) − 1
08(Q
98I et
c.)2
+ 87
6(Q
00II
etc.
) + 6
4 (Q
00II
etc.
)2+
1281
(Q04
I etc.
) + 2
0 (Q
04I et
c.)2
− 70
7 Q
II−
396
QIII
+ 19
7 Q
IV96
.98%
(93.
77%
)
E. M
aced
onia
, Thr
ace
= 40
064
− 34
9 (Q
98I et
c.) +
108
(Q98
I etc.
)2−
3067
(Q99
IV et
c.) +
46
(Q99
IV et
c.)2
− 19
69(Q
02II
etc.
) −
256
(Q02
II et
c.)2
+ 13
58(Q
04II
etc.
) + 1
12(Q
04II
etc.
)2+
1229
QII
+ 18
76Q
III +
1129
QIV
97.2
4%(9
4.89
%)
Epiro
s = 1
1836
+ 78
(Q98
I etc.
) + 2
3 (Q
98I et
c.)2
− 22
02(Q
00III
etc.
) + 1
63(Q
00III
etc.
)2−
1050
(Q02
II et
c.) −
191
(Q02
II et
c.)2
+ 86
2(Q
05IV
etc.
) − 3
6(Q
05II
etc.
)2+
24 Q
II−
54 Q
III −
420
QIV
81.6
4%(4
1.75
%)
Ioni
an Is
l. =
1070
0+
410
(Q98
I etc.
) − 2
9(Q
98I et
c.)2
+ 71
1(Q
03I et
c.) +
7 (Q
03I et
c.)2
+ 12
69(Q
04IV
etc.
) − 7
8(Q
04IV
etc.
)2
+ 10
73(Q
07II
etc.
) + 1
32(Q
07II
etc.
)2−
232
QII
− 47
3 Q
III −
321
QIV
96.8
3%(8
8.74
%)
N. A
egea
n Is
l. =
3871
+ 52
6(Q
98I et
c.) −
31(Q
98I et
c.)2
+ 13
24(Q
02I et
c.) −
172
(Q02
I etc.
)2+
1696
(Q03
II et
c.) +
37
(Q03
II et
c.)2
+ 13
02(Q
04II
etc.
) + 1
36 (Q
04II
etc.
)2−
484
QII
− 53
2Q
III −
38 Q
IV76
.38%
(3
9.50
%)
Pelo
ponn
esos
= 3
6295
+ 36
57(Q
98I et
c.) −
489
(Q98
I etc.
)2+
3938
(Q99
IV et
c.) +
325
(Q99
IV et
c.)2
+ 55
12(Q
02I et
c.)
− 23
6(Q
02I et
c.)2
+ 49
06(Q
04II
etc.
) + 3
53(Q
04II
etc.
)2−
700
QII
− 53
6 Q
III +
309
QIV
88.6
9%(7
7.22
%)
S. A
egea
n Is
l. =
2163
+ 73
6(Q
98I et
c.) −
64
(Q98
I etc.
)2+
413
(Q00
IV et
c.) +
99
(Q00
IV et
c.)2
− 75
8(Q
03IV
etc.
) − 4
9(Q
03IV
etc.
)2
+ 38
7(Q
05IV
etc.
) + 2
2 (Q
05IV
etc.
)2+
117
QII
+ 1
QIII
− 19
0 Q
IV85
.57%
(57.
42%
)
Thes
saly
= 3
4542
− 41
3 (Q
98I et
c.) −
106
(Q98
I etc.
)2+
3008
(Q99
III et
c.) −
103
(Q99
III et
c.)2
+ 33
15(Q
01III
etc.
) + 1
44(Q
01III
etc.
)2
+ 72
1(Q
06II
etc.
) + 5
8(Q
06II
etc.
)2+
807
QII
+ 81
0 Q
III −
223
QIV
91.2
4%(6
0.19
%)
W. G
reec
e =
3597
4+
824
(Q98
I etc.
) − 9
5(Q
98I et
c.)2
+ 23
93(Q
01II
etc.
) − 1
0 (Q
01II
etc.
)2+
1473
(Q04
II et
c.) +
105
(Q04
II et
c.)2
+ 47
5 Q
II−
640
QIII
− 10
7 Q
IV96
.23%
(97.
28%
)
W. M
aced
onia
= 1
1685
− 66
7 (Q
98I et
c.) +
33
(Q98
I etc.
)2+
1319
(Q99
II et
c.) −
169
(Q99
II et
c.)2
+ 97
8(Q
01I et
c.) +
130
(Q01
I etc.
)2
− 15
0 (Q
04I et
c.) +
16
(Q04
I etc.
)2+
212
QII
+ 40
7Q
III +
373
QIV
91.3
8%(9
1.41
%)
THE EVOLUTION AND COMPOSITION OF THE AGRICULTURAL LABOUR FORCE IN GREECE: 1998�2008 569
P>|z
1||z
2||z
3||z
4||z
5||z
6||z
7||z
8||z
9||z
10|
|z11
||z
12|
|z13
||z
14|
Mal
e in
volv
emen
t exp
ress
ions
• At
tiki
00
00
00
00
00.
201
0.87
20.
806
• C.
Gre
ece,
Eub
oea
00
00
0.00
50
00
0.01
80.
236
0.19
30.
127
• C.
Mac
edon
ia0
0.53
90.
116
00.
950
00
00.
421
0.13
20.
855
• Cr
ete
00.
230.
593
00.
135
00
00
0.02
20.
006
0.62
9•
E. M
aced
onia
, Thr
ace
00.
136
0.00
20
0.01
80
00.
004
00
• Ep
iros
00.
029
0.32
50
00.
002
00
0.78
20.
462
0.01
0.00
8•
Ioni
an Is
l.0
0.16
0.06
20.
002
00.
002
00
00
00.
183
• N
. Aeg
ean
Isl.
00.
018
00
10
0.09
60
00
00.
354
0.17
50.
849
• Pe
lopo
nnes
os0
00
00
00
00.
004
0.45
0.69
10.
079
Addi
tiona
l equ
atio
n in
form
atio
n
Mal
es a
nd fe
mal
es in
oth
er e
cono
mic
act
iviti
es
O =
320
8794
+ 49
153
(Q98
I etc.
) − 5
746
(Q98
I etc.
)2+
3566
8(Q
99III
etc.
) + 5
804
(Q99
III et
c.)2
+ 14
782
(Q02
III et
c.)
− 46
2 (Q
02III
etc.
)2+
4662
6Q
II+
4746
9Q
III +
4475
QIV
99.5
8%
U =
495
692
+ 21
709
(Q98
I etc.
) − 1
458
(Q98
I etc.
)2−
1948
0(Q
00IV
etc.
) + 6
589
(Q00
IV et
c.)2
− 43
017
(Q02
I etc.
) −
2893
(Q02
I etc.
)2−
3399
3 (Q
04III
etc.
) −
2093
(Q04
III et
c.)2
− 42
577
QII
− 46
249
QIII
− 20
817
QIV
96.6
4%
NP
= 41
7706
6−
1948
4(Q
98I et
c.) +
317
4(Q
98I et
c.)2
− 18
194
(Q99
IV et
c.) −
260
2(Q
99IV
etc.
)2+
4068
5(Q
01I et
c.) −
756
3(Q
01I et
c.)2
+ 24
834
(Q02
III et
c.)
+ 66
57(Q
02III
etc.
)2+
1548
1(Q
04III
etc.
) + 2
78 (Q
04III
etc.
)2 −
3754
QII
− 75
02 Q
III +
8256
QIV
98.0
2%
Tabl
e 6
(con
tinue
d)
• S.
Aeg
ean
Isl.
00.
032
0.52
40
0.00
40
0.03
10
00.
054
0.00
10.
061
• Th
essa
ly0
0.04
10
00
00
00.
425
0.49
80.
396
0.42
8•
W. G
reec
e0
0.00
50.
001
0.00
10
00
0.57
10.
067
0.00
8•
W. M
aced
onia
00.
001
0.83
60
0.79
10
00
00.
896
0.09
60.
014
570 PRÓDROMOS�IOÁNNIS K. PRODROMÍDIS
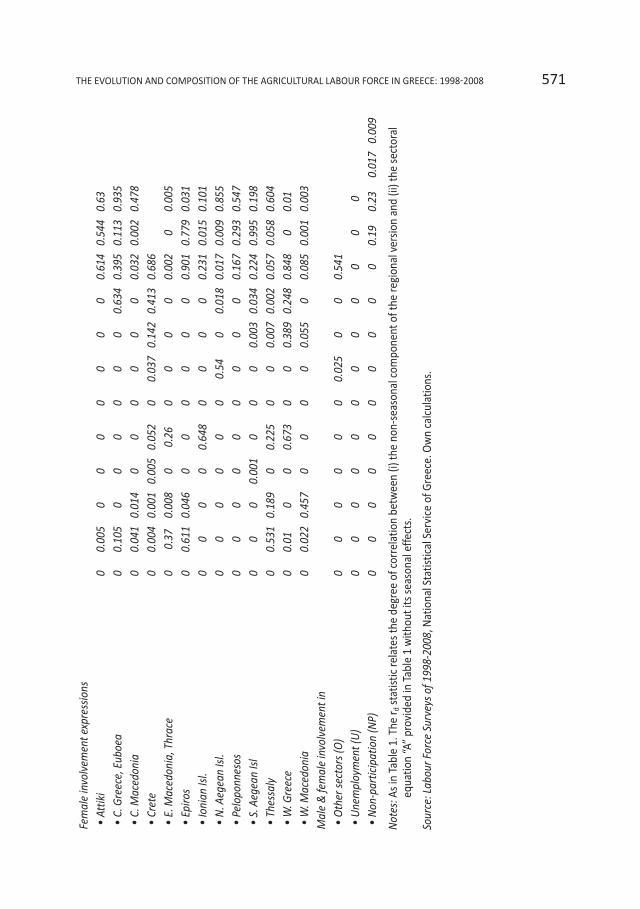
Fem
ale
invo
lvem
ent e
xpre
ssio
ns
• At
tiki
00.
005
00
00
00
00.
614
0.54
40.
63•
C. G
reec
e, E
uboe
a0
0.10
50
00
00
00.
634
0.39
50.
113
0.93
5•
C. M
aced
onia
00.
041
0.01
40
00
00
00.
032
0.00
20.
478
• Cr
ete
00.
004
0.00
10.
005
0.05
20
0.03
70.
142
0.41
30.
686
• E.
Mac
edon
ia, T
hrac
e0
0.37
0.00
80
0.26
00
00
0.00
20
0.00
5•
Epiro
s0
0.61
10.
046
00
00
00
0.90
10.
779
0.03
1•
Ioni
an Is
l.0
00
00.
648
00
00
0.23
10.
015
0.10
1•
N. A
egea
n Is
l.0
00
00
00.
540
0.01
80.
017
0.00
90.
855
• Pe
lopo
nnes
os0
00
00
00
00
0.16
70.
293
0.54
7•
S. A
egea
n Is
l0
00
0.00
10
00
0.00
30.
034
0.22
40.
995
0.19
8•
Thes
saly
00.
531
0.18
90
0.22
50
00.
007
0.00
20.
057
0.05
80.
604
• W
. Gre
ece
00.
010
00.
673
00
0.38
90.
248
0.84
80
0.01
• W
. Mac
edon
ia0
0.02
20.
457
00
00
0.05
50
0.08
50.
001
0.00
3M
ale
& fe
mal
e in
volv
emen
t in
• O
ther
sect
ors (
O)
00
00
00
0.02
50
00.
541
• U
nem
ploy
men
t (U
)0
00
00
00
00
00
0•
Non
-par
ticip
atio
n (N
P)0
00
00
00
00
00.
190.
230.
017
0.00
9
THE EVOLUTION AND COMPOSITION OF THE AGRICULTURAL LABOUR FORCE IN GREECE: 1998�2008 571
Not
es: A
s in
Tabl
e 1.
The
r dst
atist
ic re
late
s the
deg
ree
of c
orre
latio
n be
twee
n (i)
the
non-
seas
onal
com
pone
nt o
f the
regi
onal
ver
sion
and
(ii) t
he se
ctor
aleq
uatio
n “A
” pr
ovid
ed in
Tabl
e 1
with
out i
ts se
ason
al e
ffect
s.
Sour
ce: L
abou
r For
ce S
urve
ys o
f 199
8-20
08, N
atio
nal S
tatis
tical
Ser
vice
of G
reec
e. O
wn
calc
ulat
ions
.
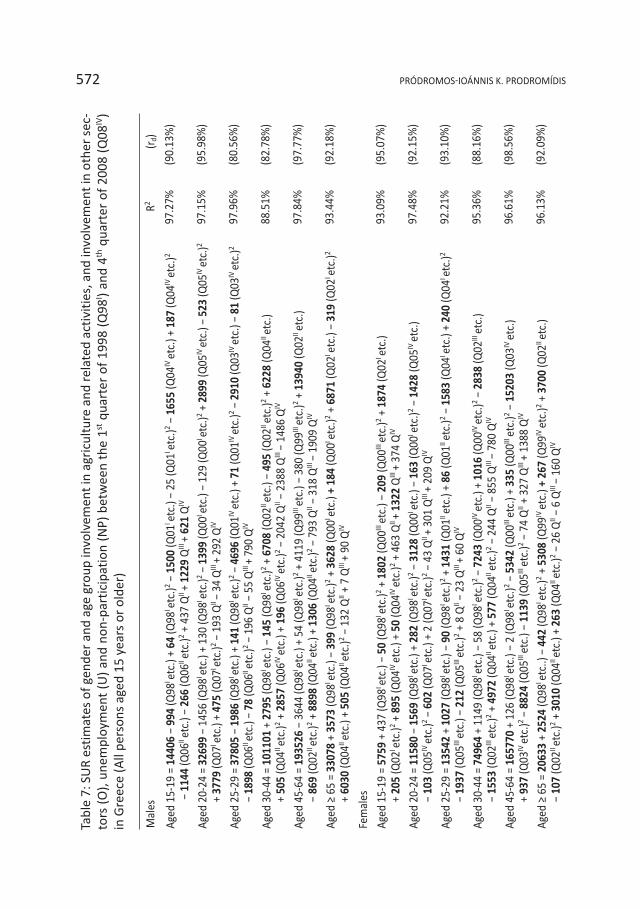
Mal
esR2
(rd)
Aged
15-
19 =
144
06−
994
(Q98
I etc.
) + 6
4(Q
98I et
c.)2
− 15
00(Q
01I et
c.) −
25
(Q01
Ι etc.
)2−
1655
(Q04
ΙV et
c.) +
187
(Q04
ΙV et
c.)2
− 11
44(Q
06ΙΙ
etc.
) − 2
66 (Q
06ΙΙ
etc.
)2+
437
QΙΙ
+ 12
29Q
ΙΙΙ +
621
QΙV
97.2
7%(9
0.13
%)
Aged
20-
24=
3269
9−
1456
(Q98
I etc.
) + 1
30 (Q
98Ι et
c.)2
− 13
99(Q
00Ι et
c.) −
129
(Q00
Ι etc.
)2+
2899
(Q05
ΙV et
c.) −
523
(Q05
IV et
c.)2
+ 37
79(Q
07I et
c.) +
475
(Q07
I etc.
)2−
193
QII
− 34
QIII
+ 29
2 Q
IV97
.15%
(95.
98%
)
Aged
25-
29=
3780
5−
1986
(Q98
Ι etc.
) + 1
41(Q
98Ι et
c.)2
− 46
96(Q
01ΙV
etc.
) + 7
1 (Q
01ΙV
etc.
)2−
2910
(Q03
ΙV et
c.) −
81
(Q03
IV et
c.)2
− 18
98(Q
06II
etc.
) − 7
8(Q
06II
etc.
)2−
196
QII
− 55
QIII
+ 79
0 Q
IV97
.96%
(8
0.56
%)
Αged
30-
44 =
101
101
+ 27
95(Q
98Ι et
c.) −
145
(Q98
Ι etc.
)2+
6708
(Q02
ΙΙ et
c.) −
495
(Q02
ΙΙ et
c.)2
+ 62
28 (Q
04ΙΙ
etc.
) +
505
(Q04
ΙΙ et
c.)2
+ 28
57(Q
06ΙV
etc.
) + 1
96(Q
06IV
etc.
)2−
2042
QII
− 23
88 Q
III −
1486
QIV
88.5
1%(8
2.78
%)
Aged
45-
64 =
193
526
− 36
44 (Q
98Ι et
c.) +
54
(Q98
Ι etc.
)2+
4119
(Q99
ΙΙΙ et
c.) −
380
(Q99
ΙΙΙ et
c.)2
+ 13
940
(Q02
ΙΙ et
c.)
− 86
9(Q
02ΙΙ
etc.
)2+
8898
(Q04
ΙΙ et
c.) +
130
6(Q
04ΙΙ
etc.
)2−
793
QII
− 31
8 Q
III −
1909
QIV
97.8
4%(9
7.77
%)
Αged
≥ 6
5 =
3307
8+
3573
(Q98
Ι etc.
) − 3
99(Q
98I et
c.)2
+ 36
28(Q
00I et
c.) +
184
(Q00
I etc.
)2+
6871
(Q02
I etc.
) − 3
19(Q
02Ι et
c.)2
+ 60
30(Q
04ΙΙ
etc.
) + 5
05(Q
04II
etc.
)2−
132
QII
+ 7
QIII
+ 90
QIV
93.4
4%
(92.
18%
)
Fem
ales
Aged
15-
19 =
575
9+
437
(Q98
I etc.
) − 5
0(Q
98Ι et
c.)2
+ 18
02(Q
00ΙΙΙ
etc.
) − 2
09(Q
00ΙΙΙ
etc.
)2+
1874
(Q02
Ι etc.
) +
205
(Q02
Ι etc.
)2+
895
(Q04
ΙV et
c.) +
50
(Q04
ΙV et
c.)2
+ 46
3 Q
II +
1322
QIII
+ 37
4 Q
IV93
.09%
(95.
07%
)
Aged
20-
24 =
115
80−
1569
(Q98
I etc.
) + 2
82(Q
98Ι et
c.)2
− 31
28(Q
00Ι et
c.) −
163
(Q00
Ι etc.
)2−
1428
(Q05
ΙV et
c.)
− 10
3(Q
05IV
etc.
)2−
602
(Q07
I etc.
) + 2
(Q07
I etc.
)2−
43 Q
II +
301
QIII
+ 20
9 Q
IV97
.48%
(92.
15%
)
Aged
25-
29 =
135
42+
1027
(Q98
I etc.
) − 9
0(Q
98Ι et
c.)2
+ 14
31(Q
01ΙΙ
etc.
) + 8
6 (Q
01ΙΙ
etc.
)2−
1583
(Q04
Ι etc.
) + 2
40(Q
04I et
c.)2
− 19
37 (Q
05IΙΙ
etc.
) − 2
12 (Q
05IΙΙ
etc.
)2+
8 Q
II−
23 Q
III +
60 Q
IV92
.21%
(93.
10%
)
Aged
30-
44 =
749
64+
1149
(Q98
I etc.
) − 5
8 (Q
98Ι et
c.)2
− 72
43(Q
00ΙV
etc.
) + 1
016
(Q00
ΙV et
c.)2
− 28
38 (Q
02ΙΙΙ
etc.
) −
1553
(Q02
ΙΙΙ et
c.)2
+ 49
72(Q
04ΙΙ
etc.
) + 5
77(Q
04ΙΙ
etc.
)2−
244
QΙΙ
− 85
5 Q
ΙΙΙ −
780
QΙV
95.3
6%
(88.
16%
)
Aged
45-
64 =
165
770
+ 12
6 (Q
98I et
c.) −
2 (Q
98Ι et
c.)2
− 53
42(Q
00ΙΙΙ
etc.
) + 3
35(Q
00ΙΙΙ
etc.
)2−
1520
3(Q
03ΙV
etc.
) +
937
(Q03
ΙV et
c.)2
− 88
24(Q
05ΙIΙ
etc.
) − 1
139
(Q05
ΙΙI et
c.)2
− 74
QII
+ 32
7 Q
III +
1388
QIV
96.6
1%(9
8.56
%)
Aged
≥ 6
5 =
2063
3+
2524
(Q98
I etc.
.) −
442
(Q98
I etc.
)2+
5308
(Q99
IV et
c.) +
267
(Q99
IV et
c.)2
+ 37
00 (Q
02II
etc.
) −
107
(Q02
IΙ et
c.)2
+ 30
10(Q
04IΙ
etc.
) + 2
63(Q
04II
etc.
)2−
26 Q
II−
6 Q
III −
160
QIV
96.1
3%(9
2.09
%)
Tabl
e 7:
SU
R es
timat
es o
f gen
der a
nd a
ge g
roup
invo
lvem
ent i
n ag
ricu
lture
and
rela
ted
activ
ities
, and
invo
lvem
ent i
n ot
her s
ec-
tors
(O),
unem
ploy
men
t (U
) and
non
-par
ticip
atio
n (N
P) b
etw
een
the
1stqu
arte
r of
199
8 (Q
98I ) a
nd 4
thqu
arte
r of
200
8 (Q
08IV
)in
Gre
ece
(All
pers
ons
aged
15
year
s or
old
er)
572 PRÓDROMOS�IOÁNNIS K. PRODROMÍDIS
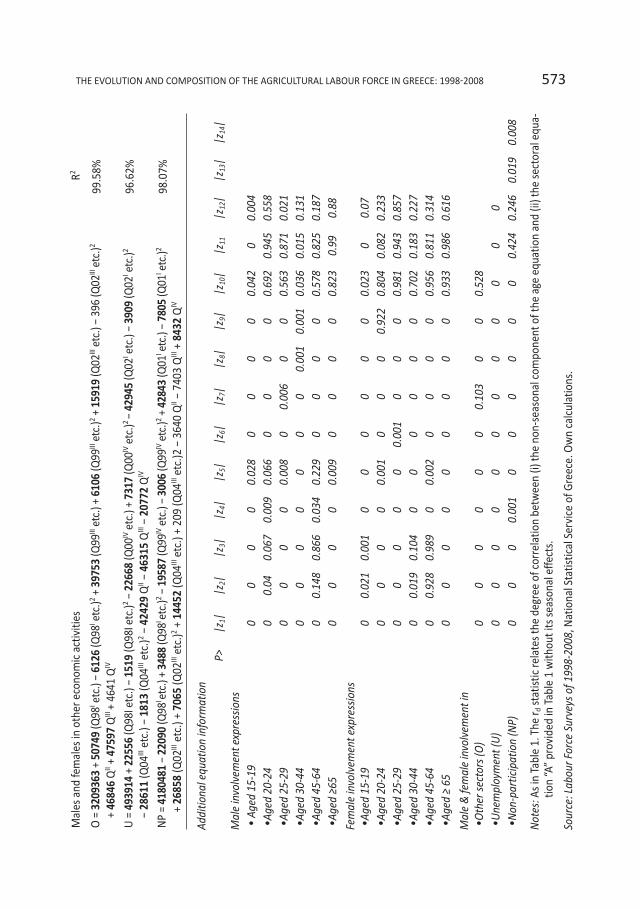
Not
es: A
s in
Tabl
e 1.
The
r dst
atist
ic re
late
s the
deg
ree
of co
rrel
atio
n be
twee
n (i)
the
non-
seas
onal
com
pone
nt o
f the
age
equ
atio
n an
d (ii
) the
sect
oral
equ
a-tio
n “A
” pr
ovid
ed in
Tabl
e 1
with
out i
ts se
ason
al e
ffect
s.
Sour
ce: L
abou
r For
ce S
urve
ys o
f 199
8-20
08, N
atio
nal S
tatis
tical
Ser
vice
of G
reec
e. O
wn
calc
ulat
ions
.
Mal
es a
nd fe
mal
es in
oth
er e
cono
mic
act
iviti
es
R2
Ο =
320
9363
+ 50
749
(Q98
Ι etc.
) − 6
126
(Q98
Ι etc.
)2+
3975
3(Q
99ΙΙΙ
etc.
) + 6
106
(Q99
ΙΙΙet
c.)2
+ 15
919
(Q02
ΙΙΙet
c.) −
396
(Q02
ΙΙΙet
c.)2
+ 46
846
QΙΙ
+ 47
597
QΙΙΙ
+ 46
41 Q
ΙV99
.58%
U =
493
914
+ 22
556
(Q98
Ι etc
.) −
1519
(Q98
I etc
.)2−
2266
8(Q
00IV
etc.
) + 7
317
(Q00
IVet
c.)2
− 42
945
(Q02
I etc.
) −39
09(Q
02Ι et
c.)2
− 28
611
(Q04
ΙΙΙet
c.) −
181
3(Q
04III
etc.
)2−
4242
9Q
II−
4631
5Q
III−
2077
2Q
IV96
.62%
NP
= 41
8048
1−
2209
0(Q
98I et
c.) +
348
8(Q
98I et
c.)2
− 19
587
(Q99
IVet
c.) −
300
6(Q
99IV
etc.
)2+
4284
3(Q
01I et
c.) −
780
5(Q
01I et
c.)2
+ 26
858
(Q02
IIIet
c.) +
706
5(Q
02III
etc.
)2+
1445
2 (Q
04III
etc.
) + 2
09 (Q
04III
etc.
)2 −
364
0 Q
II−
7403
QIII
+ 84
32Q
IV98
.07%
Addi
tiona
l equ
atio
n in
form
atio
nP>
|z1|
|z2|
|z3|
|z4|
|z5|
|z6|
|z7|
|z8|
|z9|
|z10
||z
11|z
12|
|z13
||z
14|
Mal
e in
volv
emen
t exp
ress
ions
• Ag
ed 1
5-19
00
00
0.02
80
00
00.
042
00.
004
•Age
d 20
-24
00.
040.
067
0.00
90.
066
00
00
0.69
20.
945
0.55
8•A
ged
25-2
90
00
00.
008
00.
006
00
0.56
30.
871
0.02
1•Α
ged
30-4
40
00
00
00
0.00
10.
001
0.03
60.
015
0.13
1•A
ged
45-6
40
0.14
80.
866
0.03
40.
229
00
00
0.57
80.
825
0.18
7•Α
ged
≥65
00
00
0.00
90
00
00.
823
0.99
0.88
Fem
ale
invo
lvem
ent e
xpre
ssio
ns•A
ged
15-1
90
0.02
10.
001
00
00
00
0.02
30
0.07
•Age
d 20
-24
00
00
0.00
10
00
0.92
20.
804
0.08
20.
233
•Age
d 25
-29
00
00
00.
001
00
00.
981
0.94
30.
857
•Αge
d 30
-44
00.
019
0.10
40
00
00
00.
702
0.18
30.
227
•Age
d 45
-64
00.
928
0.98
90
0.00
20
00
00.
956
0.81
10.
314
•Αge
d ≥
650
00
00
00
00
0.93
30.
986
0.61
6
Mal
e &
fem
ale
invo
lvem
ent i
n •O
ther
sect
ors (
O)
00
00
00
0.10
30
00.
528
•Une
mpl
oym
ent (
U)
00
00
00
00
00
00
•Non
-par
ticip
atio
n (N
P)0
00
0.00
10
00
00
00.
424
0.24
60.
019
0.00
8
THE EVOLUTION AND COMPOSITION OF THE AGRICULTURAL LABOUR FORCE IN GREECE: 1998�2008 573
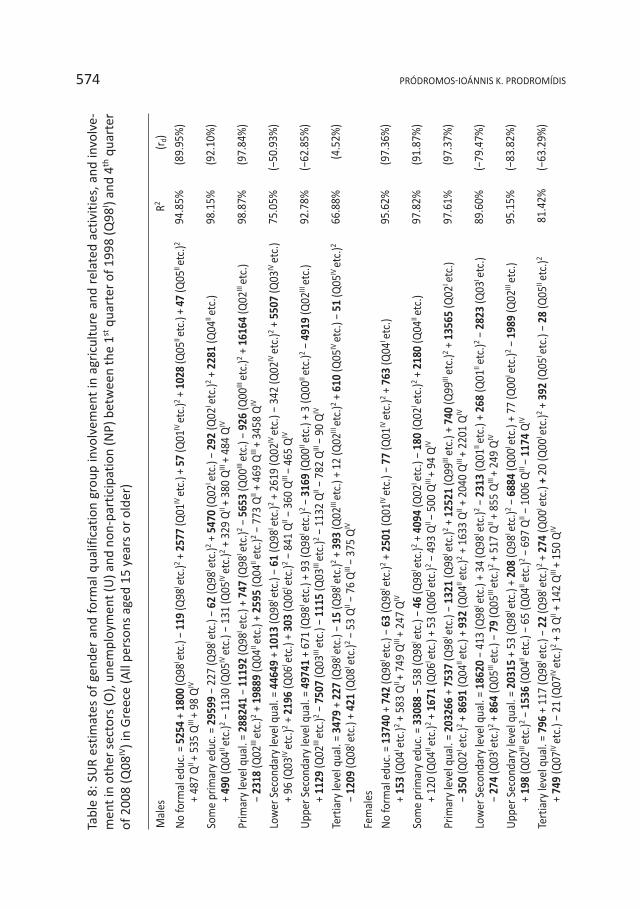
Mal
esR2
(rd)
No
form
al e
duc.
= 5
254
+ 18
00(Q
98I et
c.) −
119
(Q98
I etc.
)2+
2577
(Q01
IV et
c.) +
57
(Q01
ΙV et
c.)2
+ 10
28(Q
05ΙI et
c.) +
47
(Q05
ΙI et
c.)2
+ 48
7 Q
ΙΙ +
535
QΙΙΙ
+ 98
QΙV
94.8
5%(8
9.95
%)
Som
e pr
imar
y ed
uc. =
295
99−
227
(Q98
I etc.
) − 6
2(Q
98Ι et
c.)2
+ 54
70(Q
02Ι et
c.) −
292
(Q02
Ι etc.
)2+
2281
(Q04
ΙI et
c.)
+ 49
0(Q
04II
etc.
)2−
1130
(Q05
IV et
c.) −
131
(Q05
IV et
c.)2
+ 32
9 Q
II +
380
QIII
+ 48
4 Q
IV98
.15%
(92.
10%
)
Prim
ary
leve
l qua
l. =
2882
41−
1119
2 (Q
98Ι et
c.) +
747
(Q98
Ι etc.
)2−
5653
(Q00
ΙII et
c.) −
926
(Q00
ΙII et
c.)2
+ 16
164
(Q02
ΙII et
c.)
− 23
18(Q
02III
etc.
)2+
1988
9(Q
04II
etc.
) + 2
595
(Q04
II et
c.)2
− 77
3 Q
II+
469
QIII
+ 34
58 Q
IV98
.87%
(97.
84%
)
Low
er S
econ
dary
leve
l qua
l. =
4464
9+
1013
(Q98
Ι etc.
) − 6
1(Q
98Ι et
c.)2
+ 26
19 (Q
02ΙV
etc.
) − 3
42 (Q
02ΙV
etc.
)2+
5507
(Q03
ΙV et
c.)
+ 96
(Q03
ΙV et
c.)2
+ 21
96(Q
06Ι et
c.) +
303
(Q06
I etc.
)2−
841
QII
− 36
0 Q
III −
465
QIV
75.0
5%(−
50.9
3%)
Upp
er S
econ
dary
leve
l qua
l. =
4974
1+
671
(Q98
Ι etc.
) + 9
3 (Q
98Ι et
c.)2
− 31
69(Q
00ΙΙ
etc.
) + 3
(Q00
ΙΙ et
c.)2
− 49
19(Q
02ΙΙI
etc.
) +
1129
(Q02
ΙIΙ et
c.)2
− 75
07(Q
03ΙIΙ
etc.
) − 1
115
(Q03
ΙIΙ et
c.)2
− 11
32 Q
II−
782
QIII
− 90
QIV
92.7
8%(−
62.8
5%)
Tert
iary
leve
l qua
l. =
3479
+ 22
7(Q
98Ι et
c.) −
15
(Q98
I etc.
)2+
393
(Q02
III et
c.) +
12 (Q
02III
etc.
)2+
610
(Q05
IV et
c.) −
51
(Q05
ΙV et
c.)2
− 12
09(Q
08Ι et
c.) +
421
(Q08
Ι etc.
)2−
53 Q
II−
76 Q
III −
375
QIV
66.8
8%(4
.52%
)
Fem
ales
No
form
al e
duc.
= 1
3740
+ 74
2(Q
98I et
c.) −
63
(Q98
Ι etc.
)2+
2501
(Q01
ΙV et
c.) −
77
(Q01
ΙV et
c.)2
+ 76
3(Q
04Ι et
c.)
+ 15
3(Q
04Ι et
c.)2
+ 58
3 Q
II +
749
QIII
+ 24
7 Q
IV95
.62%
(97.
36%
)
Som
e pr
imar
y ed
uc. =
330
88−
538
(Q98
I etc.
) − 4
6(Q
98Ι et
c.)2
+ 40
94(Q
02Ι et
c.) −
180
(Q02
Ι etc.
)2+
2180
(Q04
ΙI et
c.)
+ 12
0 (Q
04II
etc.
)2+
1671
(Q06
I etc.
) + 5
3 (Q
06I et
c.)2
− 49
3 Q
II −
500
QIII
+ 94
QIV
97.8
2%(9
1.87
%)
Prim
ary
leve
l qua
l. =
2032
66+
7537
(Q98
I etc.
) − 1
321
(Q98
Ι etc.
)2+
1252
1(Q
99ΙΙΙ
etc.
) + 7
40 (Q
99ΙΙΙ
etc.
)2+
1356
5(Q
02Ι et
c.)
− 35
0(Q
02I et
c.)2
+ 86
91 (Q
04IΙ
etc.
) + 9
32 (Q
04IΙ
etc.
)2+
1633
QII
+ 20
40 Q
III +
2201
QIV
97.6
1%(9
7.37
%)
Low
er S
econ
dary
leve
l qua
l. =
1862
0−
413
(Q98
I etc.
) + 3
4 (Q
98Ι et
c.)2
− 23
13(Q
01ΙΙ
etc.
) + 2
68(Q
01ΙΙ
etc.
)2−
2823
(Q03
Ι etc.
) −
274
(Q03
Ι etc.
)2+
864
(Q05
ΙΙΙ et
c.) −
79
(Q05
ΙΙΙ et
c.)2
+ 51
7 Q
ΙΙ+
855
QΙΙΙ
+ 24
9 Q
ΙV89
.60%
(−79
.47%
)
Upp
er S
econ
dary
leve
l qua
l. =
2031
5+
53 (Q
98I et
c.) +
208
(Q98
Ι etc.
)2−
6884
(Q00
Ι etc.
) + 7
7 (Q
00Ι et
c.)2
− 19
89(Q
02ΙΙΙ
etc.
) +
198
(Q02
ΙΙΙ et
c.)2
− 15
36(Q
04ΙΙ
etc.
) − 6
5 (Q
04ΙI
etc.
)2−
697
QII
− 10
06 Q
III −
1174
QIV
95.1
5%(−
83.8
2%)
Tert
iary
leve
l qua
l. =
796
+ 11
7 (Q
98I et
c.) −
22
(Q98
I etc.
)2+
274
(Q00
I etc.
) + 2
0 (Q
00I et
c.)2
+ 39
2 (Q
05I et
c.) −
28
(Q05
IΙ et
c.)2
+ 74
9(Q
07IV
etc.
) − 2
1 (Q
07IV
etc.
)2+
3 Q
II+
142
QIII
+ 15
0 Q
IV81
.42%
(−63
.29%
)
Tabl
e 8:
SU
R es
timat
es o
f gen
der
and
form
al q
ualif
icat
ion
grou
p in
volv
emen
t in
agr
icul
ture
and
rel
ated
act
iviti
es, a
nd in
volv
e-m
ent i
n ot
her s
ecto
rs (O
), un
empl
oym
ent (
U) a
nd n
on-p
artic
ipat
ion
(NP)
bet
wee
n th
e 1st
quar
ter o
f 199
8 (Q
98I ) a
nd 4
thqu
arte
rof
200
8 (Q
08IV
) in
Gre
ece
(All
pers
ons
aged
15
year
s or
old
er)
574 PRÓDROMOS�IOÁNNIS K. PRODROMÍDIS
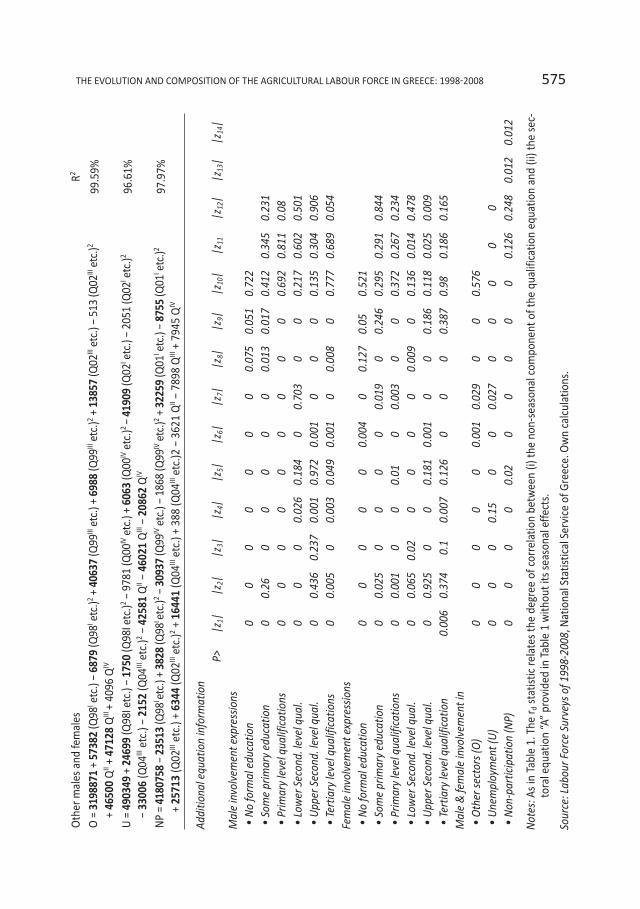
Not
es: A
s in
Tabl
e 1.
The
r dst
atist
ic re
late
s the
deg
ree
of c
orre
latio
n be
twee
n (i)
the
non-
seas
onal
com
pone
nt o
f the
qua
lific
atio
n eq
uatio
n an
d (ii
) the
sec-
tora
l equ
atio
n “A
” pr
ovid
ed in
Tabl
e 1
with
out i
ts se
ason
al e
ffect
s.
Sour
ce: L
abou
r For
ce S
urve
ys o
f 199
8-20
08, N
atio
nal S
tatis
tical
Ser
vice
of G
reec
e. O
wn
calc
ulat
ions
.
Oth
er m
ales
and
fem
ales
R2
Ο =
319
8871
+ 57
382
(Q98
Ι etc.
) − 6
879
(Q98
Ι etc.
)2+
4063
7(Q
99ΙΙΙ
etc.
) + 6
988
(Q99
ΙΙΙet
c.)2
+ 13
857
(Q02
ΙΙΙet
c.) −
513
(Q02
ΙΙΙet
c.)2
+ 46
500
QΙΙ
+ 47
128
QΙΙΙ
+ 40
96 Q
ΙV99
.59%
U =
490
349
+ 24
699
(Q98
Ι etc
.) −
1750
(Q98
I etc
.)2−
9781
(Q00
IVet
c.) +
606
3(Q
00IV
etc.
)2 −
4190
9 (Q
02I et
c.) −
2051
(Q02
Ι etc.
)2
− 33
006
(Q04
ΙΙΙet
c.) −
215
2(Q
04III
etc.
)2−
4258
1Q
II−
4602
1Q
III−
2086
2Q
IV96
.61%
NP
= 41
8075
8−
2351
3(Q
98I et
c.) +
382
8(Q
98I et
c.)2
− 30
937
(Q99
IVet
c.) −
186
8 (Q
99IV
etc.
)2+
3225
9(Q
01I et
c.) −
875
5(Q
01I et
c.)2
+ 25
713
(Q02
IIIet
c.) +
634
4(Q
02III
etc.
)2+
1644
1 (Q
04III
etc.
) + 3
88 (Q
04III
etc.
)2 −
362
1 Q
II−
7898
QIII
+ 79
45 Q
IV97
.97%
Addi
tiona
l equ
atio
n in
form
atio
n P>
|z1|
|z2|
|z3|
|z4|
|z5|
|z6|
|z7|
|z8|
|z9|
|z10
||z
11|z
12|
|z13
||z
14|
Mal
e in
volv
emen
t exp
ress
ions
• N
o fo
rmal
edu
catio
n0
00
00
00
0.07
50.
051
0.72
2•
Som
e pr
imar
y ed
ucat
ion
00.
260
00
00
0.01
30.
017
0.41
20.
345
0.23
1•
Prim
ary
leve
l qua
lific
atio
ns0
00
00
00
00
0.69
20.
811
0.08
• Lo
wer
Sec
ond.
leve
l qua
l.0
00
0.02
60.
184
00.
703
00
0.21
70.
602
0.50
1•
Upp
er S
econ
d. le
vel q
ual.
00.
436
0.23
70.
001
0.97
20.
001
00
00.
135
0.30
40.
906
• Te
rtia
ry le
vel q
ualif
icat
ions
00.
005
00.
003
0.04
90.
001
00.
008
00.
777
0.68
90.
054
Fem
ale
invo
lvem
ent e
xpre
ssio
ns•
No
form
al e
duca
tion
00
00
00.
004
00.
127
0.05
0.52
1•
Som
e pr
imar
y ed
ucat
ion
00.
025
00
00
0.01
90
0.24
60.
295
0.29
10.
844
• Pr
imar
y le
vel q
ualif
icat
ions
00.
001
00
0.01
00.
003
00
0.37
20.
267
0.23
4•
Low
er S
econ
d. le
vel q
ual.
00.
065
0.02
00
00
0.00
90
0.13
60.
014
0.47
8•
Upp
er S
econ
d. le
vel q
ual.
00.
925
00
0.18
10.
001
00
0.18
60.
118
0.02
50.
009
• Te
rtia
ry le
vel q
ualif
icat
ion
0.00
60.
374
0.1
0.00
70.
126
00
00.
387
0.98
0.18
60.
165
Mal
e &
fem
ale
invo
lvem
ent i
n•
Oth
er se
ctor
s (O
)0
00
00
0.00
10.
029
00
0.57
6•
Une
mpl
oym
ent (
U)
00
00.
150
00.
027
00
00
0•
Non
-par
ticip
atio
n (N
P)0
00
00.
020
00
00
0.12
60.
248
0.01
20.
012
THE EVOLUTION AND COMPOSITION OF THE AGRICULTURAL LABOUR FORCE IN GREECE: 1998�2008 575
References
Baraldi, F., A. Castellini and C. Pirazzoli (2007). “The labour factor in agricul-ture: an analysis between three EU partners.” New Medit. MediterraneanJournal of Economic, Agriculture and Environment (6): 44-51.
Blundel, T. and T. Macurdy (2008). “Labour supply.” The New Palgrave Dic-tionary of Economics. 2nd edition. Edited by S.N. Durlauf and L.E. Blume.New York: Macmillan, vol.4, pp: 808-822.
Eurostat (2009). Agriculture. Accessed in Nov.2009 via http://eeurostat.ec.europa.eu/portal/page/portal/agriculture/data/database.
Gidarakou, I., E. Dimopoulou, R. Lagogianni and S. Sotiropoulou (2008).“Young Women and Agriculture: The Case of Active Young Women Farm-ers in West Macedonia, Greece.” In Regional Analysis and Policy. TheGreek Experience. Edited by H. Coccosis and Y. Psycharis. Heidelberg:Springer (Physica-Verlag), pp: 355-374.
Karanikolas, P. and N. Martinos (1999). “Spatial differentiation of Greek agri-culture towards 2010.” In Greek agriculture towards 2010. Edited by N.Maravegias. Athens: Papazissis, pp: 245-306 [in Greek].
Karanikolas, P., D. Bourdaras, D. Kremmydas and N. Martinos (2008). “Supportand Protection of Greek agriculture: Inter-temporal developments and sec-toral diversification.” South-Eastern Europe Journal of Economics (6): 197-212.
Lianos, T. and D. Parliarou (1986). “Farm size structure in Greek agriculture.”European Review of Agricultural Economics (13): 233-248.
National Statistical Service of Greece (2009). Labour force (quarterly): Ac-cessed in Nov.2009 via http://www.statistics.gr/portal/page/portal/ESYE/PAGE-themes?p_param=A0101.
Porter, M.E. (2003). “The Economic Performance of Regions.” Regional Stud-ies, 37: 549-78.
Prodromídis, P.I. (2008). The Spatial Distribution of Male and Female Em-ployment and Unemployment in Greece. Athens: KEPE Studies.
Thompson, K. (1963). Farm Fragmentation in Greece. Athens: Center of Eco-nomic Research Monograph Series.
Tsimpoukas, K. and S. Tsoukalas (1999). “Structure and typology of agricul-tural operations.” In Greek agriculture towards 2010, edited by N. Mar-avegias. Athens: Papazissis, pp: 157-221 [in Greek].
Ward, B. (1963). Greek Regional Development. Athens: Center of EconomicResearch Monograph Series.
576 PRÓDROMOS�IOÁNNIS K. PRODROMÍDIS