The Evaluation of JSA 2009-2012 - Department of Education ...€¦ · Web viewThe most...
511
The Evaluation of Job Services Australia 2009 – 2012
Transcript of The Evaluation of JSA 2009-2012 - Department of Education ...€¦ · Web viewThe most...

The Evaluation of Job Services Australia 2009 – 2012
Evaluation team
Shelley EvansAnne AisbettRobin CollinsKaren CostanzoSuet-Lam MuiJennifer PhanLydia RossJo VirgonaYingru Wu
ISBN
978-1-76051-852-3 [PDF]978-1-76051-853-0 [DOCX]
With the exception of the Commonwealth Coat of Arms, the Department’s logo, any material protected by a trade mark and where otherwise noted all material presented in this document is provided under a Creative Commons Attribution 3.0 Australia (http://creativecommons.org/licenses/by/3.0/au/) licence.
The details of the relevant licence conditions are available on the Creative Commons website (accessible using the links provided) as is the full legal code for the CC BY 3.0 AU licence (http://creativecommons.org/licenses/by/3.0/au/legalcode).
The document must be attributed as The Evaluation of Job Services Australia 2009 – 2012.

Table of ContentsTable of Contents........................................................................................................................................... i
List of Figures.............................................................................................................................................. vii
List of Tables................................................................................................................................................ ix
List of acronyms........................................................................................................................................... xi
Executive Summary....................................................................................................................................... 1
Background........................................................................................................................................................1Employment services....................................................................................................................................1The case for change......................................................................................................................................1Job Services Australia....................................................................................................................................1
Challenges for Job Services Australia.................................................................................................................2Measuring Job Services Australia performance.............................................................................................2
What worked well.............................................................................................................................................3Employment outcomes for Stream 4 job seekers..........................................................................................3Education and training outcomes for all job seekers.....................................................................................3Streaming......................................................................................................................................................3Tailored assistance........................................................................................................................................3Work Experience...........................................................................................................................................4Churn.............................................................................................................................................................4
Where results were mixed.................................................................................................................................4Employment outcomes for long-term unemployed job seekers...................................................................4Employment outcomes for Indigenous job seekers......................................................................................5Employment outcomes for other groups of disadvantaged job seekers.......................................................5Training provision and access........................................................................................................................5Assessment mechanisms...............................................................................................................................6Specialist providers.......................................................................................................................................6Employment Pathway Plans..........................................................................................................................6Reverse marketing........................................................................................................................................7Wage subsidies..............................................................................................................................................7
Where more work is required...........................................................................................................................7Employment outcomes for more competitive job seekers............................................................................7

Removing early activation requirements......................................................................................................8Compliance framework changes...................................................................................................................8Red tape........................................................................................................................................................8Parking of job seekers...................................................................................................................................9
Conclusion.........................................................................................................................................................9
1 Introduction........................................................................................................................................ 10
1.1 Government funded employment services in Australia......................................................................101.1.1 Job Network Services and the Active Participation Model.............................................................101.1.2 The case for Job Services Australia.................................................................................................111.1.3 Policy changes during or in conjunction with the JSA 2009 – 2012 contract..................................121.1.4 Policy external to Employment Services.........................................................................................14
1.2 The Job Services Australia 2009 – 2012 Evaluation............................................................................141.2.1 Key evaluation areas......................................................................................................................151.2.2 Methodology..................................................................................................................................151.2.3 Data sources...................................................................................................................................16
2 Overview of Job Services Australia...................................................................................................... 19
2.1 The macroeconomic environment......................................................................................................19
2.2 Job Services Australia (2009 – 2012) – the service model..................................................................212.2.1 Eligibility.........................................................................................................................................222.2.2 Stream allocation...........................................................................................................................23
2.3 Caseload overview..............................................................................................................................24
2.4 Conclusion..........................................................................................................................................25
3 Participation in Job Services Australia..................................................................................................26
3.1 Introduction........................................................................................................................................26
3.2 The Job Services Australia caseload and unemployment....................................................................26
3.3 Commencement.................................................................................................................................27
3.4 Stream allocation................................................................................................................................293.4.1 Streams 1 to 3................................................................................................................................293.4.2 Job Services Australia caseload by stream.....................................................................................30
3.5 Engagement and compliance..............................................................................................................31
3.5.1 Contact between providers and job seekers..................................................................................323.5.2 Attendance at interviews...............................................................................................................363.5.3 Compliance.....................................................................................................................................373.5.4 Revised compliance arrangements (implemented on 1 July 2011)................................................403.5.5 Return to service (Churn)...............................................................................................................41
3.6 Conclusion..........................................................................................................................................42
4 Service planning and delivery.............................................................................................................. 44
4.1 Introduction........................................................................................................................................44
4.2 Employment Pathway Plans...............................................................................................................46
4.3 Employment Pathway Fund assistance...............................................................................................494.3.1 Employment Pathway Fund expenditure.......................................................................................504.3.2 Job Seeker Account versus Employment Pathway Fund expenditure............................................51
4.4 Work Experience................................................................................................................................534.4.1 Work Experience placements in Job Services Australia..................................................................534.4.2 Work Experience in Job Network and Job Services Australia.........................................................564.4.3 Effectiveness of Job Services Australia Work Experience Phase activities......................................57
4.5 Time to exit service or income support..............................................................................................594.5.1 Predicted exits from employment services for the long-term unemployed...................................62
4.6 Conclusion..........................................................................................................................................63
5 Job seeker outcomes........................................................................................................................... 64
5.1 Introduction........................................................................................................................................64
5.2 Measuring effectiveness.....................................................................................................................645.2.1 Comparing outcomes.....................................................................................................................645.2.2 Measuring employment outcomes................................................................................................65
5.3 Total job placements, 13- and 26-week outcomes from JSA..............................................................675.3.1 Placements.....................................................................................................................................675.3.2 13- and 26-week outcomes............................................................................................................67
5.4 Context...............................................................................................................................................685.4.1 Policy context.................................................................................................................................685.4.2 Macroeconomic context................................................................................................................685.4.3 Other contextual factors................................................................................................................68

5.5 Outcomes...........................................................................................................................................695.5.1 Employment outcomes for Stream 1 to 3 type job seekers...........................................................695.5.2 Employment outcomes for Stream 4 type job seekers...................................................................71
5.6 Relative expenditure...........................................................................................................................725.6.1 Published cost per employment outcome figures..........................................................................725.6.2 Expenditure per outcome in this evaluation..................................................................................725.6.3 Average expenditure for new entrants in their first 12 months of service.....................................735.6.4 Expenditure per employment outcome for new entrants..............................................................74
5.7 Stream service effectiveness..............................................................................................................74
5.8 Conclusion..........................................................................................................................................77
6 Building labour force capacity............................................................................................................. 79
6.1 Introduction........................................................................................................................................79
6.2 Skills development in Job Services Australia.......................................................................................79
6.3 Training in Job Services Australia........................................................................................................826.3.1 Expenditure on training..................................................................................................................826.3.2 Types of training.............................................................................................................................826.3.3 Course completion rates................................................................................................................836.3.4 Effectiveness of training in achieving employment........................................................................836.3.5 Employment Pathway Fund expenditure on training.....................................................................86
6.4 Education outcomes in Job Services Australia....................................................................................876.4.1 New entrant job seekers................................................................................................................876.4.2 Long-term unemployed job seekers...............................................................................................88
6.5 Conclusion..........................................................................................................................................88
7 Disadvantaged Groups........................................................................................................................ 90
7.1 Introduction........................................................................................................................................90
7.2 Job seekers facing labour market challenges......................................................................................90
7.3 Multiple labour market challenges.....................................................................................................917.3.1 Labour market disadvantage in the Job Services Australia caseload..............................................92
7.4 Servicing disadvantaged job seekers..................................................................................................937.4.1 Stream 4.........................................................................................................................................947.4.2 Access to services for the most disadvantaged..............................................................................95

7.4.3 Service planning and delivery.........................................................................................................967.4.4 Work experience............................................................................................................................99
7.5 Outcomes for selected job seeker groups..........................................................................................997.5.1 New entrants..................................................................................................................................997.5.2 Long-term unemployed................................................................................................................100
7.6 Client groups likely to experience labour market disadvantage.......................................................1027.6.1 Single parents...............................................................................................................................1027.6.2 Job seekers with disability............................................................................................................1037.6.3 Mature age job seekers................................................................................................................1077.6.4 Youth............................................................................................................................................1087.6.5 Job seekers who are culturally and linguistically diverse and / or with mixed or low English proficiency.................................................................................................................................................1117.6.6 Long-term and very long-term unemployed job seekers.............................................................112
7.7 Conclusion........................................................................................................................................116
8 Indigenous job seekers...................................................................................................................... 118
8.1 Introduction......................................................................................................................................118
8.2 Employment services for Indigenous job seekers.............................................................................1188.2.1 Community Development Employment Projects.........................................................................1198.2.2 Indigenous Employment Programme...........................................................................................1198.2.3 Other programmes.......................................................................................................................120
8.3 Indigenous job seekers in Job Services Australia..............................................................................1208.3.1 Overview......................................................................................................................................1208.3.2 Disadvantage and streaming........................................................................................................120
8.4 Servicing Indigenous job seekers......................................................................................................1248.4.1 Engaging Indigenous job seekers..................................................................................................1248.4.2 Assisting Indigenous job seekers..................................................................................................124
8.5 Outcomes.........................................................................................................................................1278.5.1 Overview......................................................................................................................................1278.5.2 Comparing Job Services Australia with Job Network Services......................................................128
8.6 Supporting Indigenous employment................................................................................................1298.6.1 Indigenous employment strategies..............................................................................................1298.6.2 Working with Community Development Employment Projects, the Indigenous Employment Programme and other providers...............................................................................................................130

8.6.3 Employer attitudes.......................................................................................................................131
8.7 Closing the Gap.................................................................................................................................1318.7.1 Measuring progress......................................................................................................................1328.7.2 Job Services Australia and Closing the Gap..................................................................................1328.7.3 Results..........................................................................................................................................133
8.8 New developments and future directions........................................................................................134
8.9 Conclusion........................................................................................................................................134
9 Employer servicing............................................................................................................................ 136
9.1 Introduction......................................................................................................................................136
9.2 Employers’ use of employment agencies.........................................................................................1369.2.1 Employers’ awareness and use of Job Services Australia.............................................................136
9.3 Attributes that employers value.......................................................................................................1379.3.1 What employers want in job seekers...........................................................................................1379.3.2 Satisfaction with Job Services Australia services..........................................................................1379.3.3 Employer attitudes to disadvantaged job seeker groups..............................................................139
9.4 Strategies for servicing employers....................................................................................................1409.4.1 Candidate screening and short-listing..........................................................................................1429.4.2 Understanding employer needs...................................................................................................1429.4.3 Employer Brokers.........................................................................................................................1459.4.4 Wage subsidies.............................................................................................................................1459.4.5 Reverse marketing.......................................................................................................................1489.4.6 Post-placement support...............................................................................................................149
9.5 Conclusion........................................................................................................................................152
10 Job Services Australia providers......................................................................................................... 154
10.1 Introduction......................................................................................................................................154
10.2 Overview..........................................................................................................................................154
10.3 Provider performance......................................................................................................................155Specialist providers...................................................................................................................................155
10.4 Performance framework..................................................................................................................15710.4.1 Measurement of performance.................................................................................................15710.4.2 Charter of Contract Management............................................................................................158

10.4.3 Provider brokered outcomes...................................................................................................158
10.5 Provider satisfaction.........................................................................................................................15810.5.1 Satisfaction with the Department of Education, Employment and Workplace Relations........15810.5.2 Satisfaction with the Department of Human Services..............................................................159
10.6 Administrative burden......................................................................................................................16110.6.1 Comparison of administrative load between Job Network and Job Services Australia............16210.6.2 Approach to administrative work.............................................................................................16310.6.3 Unnecessary departmental administrative requirements........................................................16310.6.4 Red tape reduction..................................................................................................................164
10.7 Impact of the economic downturn...................................................................................................165
10.8 Conclusion........................................................................................................................................165
References................................................................................................................................................ 167
Appendix 1 Methodology.................................................................................................................... 173
1 Introduction..........................................................................................................................................173
2 Comparing JNS and JSA.........................................................................................................................1732.1 New entrant comparisons............................................................................................................1732.2 Long-term unemployed comparisons...........................................................................................1742.3 Outcome measures used..............................................................................................................1752.4 Cost effectiveness comparisons...................................................................................................1772.5 Cost per employment outcome....................................................................................................178
3 Other analyses undertaken...................................................................................................................1783.1 Quantifying the effectiveness of training in JSA...........................................................................1783.2 Quantifying other training aspects...............................................................................................1793.3 Analysing social exclusion and disadvantage................................................................................1793.4 Comparing specialist and generalist providers.............................................................................1793.5 Estimating the relative effectiveness of Work Experience............................................................1803.6 Estimating the impact of Intensive Support job search training...................................................1813.7 Quantifying the effectiveness of streaming..................................................................................181
4 Conclusion............................................................................................................................................182
Appendix 2 Statistical tables................................................................................................................ 183
List of Tables..................................................................................................................................................183

List of Figures
11

Figure 1.1: Generalised job seeker interaction with employment services..........................................................Figure 1.2: Depiction of the Programmes that define Job Network Services (JNS) as used for this
evaluation......................................................................................................................................Figure 2.1: ABS job vacancies, February 2001 to February 2013, (per unemployed person)...............................Figure 2.2: Job placements by employment services and number of Internet job advertisements,
November 2009 to March 2014 (number).....................................................................................Figure 2.3: Job Services Australia service model as defined for the 2009 – 2012 period.....................................Figure 3.1: JSA monthly commencements and exits and monthly unemployment rate, July 2009 to June
2012 (number and per cent)..........................................................................................................Figure 3.2: Time from registration for employment services to commencement in services for JNS and
JSA and entry process (RapidConnect (RC) and Other) for new entrant populations (days and per cent).................................................................................................................................
Figure 3.3: Job Services Australia job seekers by stream, July 2009 to June 2012, active caseload (number)........................................................................................................................................
Figure 3.4: Proportion of job seekers that attended an interview by fortnight, Assessed Stream 1 JSA and JNS job seekers for new entrant populations (per cent)................................................................
Figure 3.5: Proportion of job seekers that attended an interview by fortnight, Assessed Stream 2, JSA and JNS job seekers for new entrant populations (per cent).........................................................
Figure 3.6: Proportion of job seekers that attended an interview by fortnight, Assessed Stream 3 JSA and JNS job seekers for new entrant populations (per cent)................................................................
Figure 3.7: Proportion of job seekers that attended an interview by fortnight, Assessed Stream 4 JSA and JNS job seekers for new entrant populations (per cent)................................................................
Figure 3.8: Attendance at appointments with providers 2008–2012 by quarter, Caseload and new entrant populations (per cent)......................................................................................................
Figure 3.9: Generation of Contact Requests, Participation Reports and Comprehensive Compliance Assessments under the 2009–2011 Job Services Australia compliance framework......................
Figure 4.1: How a job seeker might progress through JSA and the types of assistance available (as needed).........................................................................................................................................
Figure 4.2: Average time spent by providers with JSA job seekers on initial contact tasks caseload population (per cent).....................................................................................................................
Figure 4.3: Proportion of JSA job seekers by stream in the Work Experience Phase, (WEPh) July 2009 to June 2012, caseload population (per cent)....................................................................................
Figure 4.4: Cumulative exits from income support JSA and JNS for new entrant populations (per cent)............Figure 4.5: Probability of exit from income support – JSA and JNS for new entrant populations........................Figure 4.6: Probability of exit from income support JNS by Assessed Streams 1 to 4 for new entrant
populations....................................................................................................................................Figure 5.1: Employment outcomes for Assessed Streams 1 to 3, JNS and JSA for new entrant populations
(per cent).......................................................................................................................................Figure 5.2: Off income support rates at different JSCI scores - predicted and actual for Streams 1 to 3
(per cent).......................................................................................................................................Figure 5.3: Average expenditure per job seeker in the first 12 months of JSA service by JSCI score ($)..............Figure 5.4: Average expenditure ($) per job seeker in the first 12 months of JNS service by JSCI score..............Figure 6.1: Job seeker satisfaction with training and education option information provided by JSA
provider, June 2012 (per cent)......................................................................................................Figure 6.2: Education outcomes in Assessed Streams 1 to 3, JNS and JSA for new entrant populations (per
cent)...............................................................................................................................................Figure 6.3: Education outcomes in Assessed Streams 1 to 4, JNS and JSA for long-term unemployed (LTU)
job seekers (per cent).....................................................................................................................Figure 7.1: JNS and JSA active caseload and Australian population aged 15–64, selected characteristics
(per cent).......................................................................................................................................Figure 7.2: JSA active caseload, disadvantaged groups by stream, September 2010 (per cent)..........................Figure 7.3: Time to placement in Stream 4 type services, JNS and JSA new entrant populations (weeks)..........Figure 7.4: Employment outcomes in Assessed Streams 1 to 3, selected groups for new entrant job
seekers (per cent)........................................................................................................................Figure 7.5: Education and training outcomes in Assessed Streams 1 to 3, selected groups for new
entrant job seekers (per cent).....................................................................................................
12

Figure 7.6: Employment outcomes for long-term unemployed (LTU) job seekers, selected groups (per cent)............................................................................................................................................
Figure 7.7: Education and training outcomes for long-term unemployed (LTU) job seekers, selected groups (per cent).........................................................................................................................
Figure 7.8: Employment Services active caseload by length of unemployment, July 2006 to June 2012 (number)......................................................................................................................................
Figure 7.9: Full-time and part-time employment outcome and education outcome rates by length of unemployment, JNS and JSA (per cent).......................................................................................
Figure 8.1: Distribution of Job Seeker Classification Instrument (JSCI) scores for Indigenous and non-Indigenous job seekers, July 2009 to February 2011 (per cent)...................................................
Figure 8.2: Select client groups in JSA active caseload, Indigenous and non-Indigenous job seekers, at 30 September 2010 (per cent)..........................................................................................................
Figure 8.3: Estimated proportions of JSA job seekers who experienced each domain of disadvantage (per cent)............................................................................................................................................
Figure 8.4: Outcome rates for overall job seeker population and Indigenous...................................................Figure 9.1: Services received by employers who used JSA 2012 (per cent).......................................................Figure 9.2: Strategies reportedly used JSA providers to identify skills needs of employers 2012 (per cent)......Figure 9.3: Methods used by JSA providers to facilitate job placements 2012 (per cent)..................................Figure 9.4: Strategies JSA providers reported using to sustain employment (per cent).....................................Figure 10.1: Average Star Ratings for all generalist and specialist providers over JSA operation period...........
13

List of TablesTable 2.1: Actual and predicted entry to various streams of service JSA 2009 – 2012 – new entrant
population (percentages)..............................................................................................................Table 3.1 JNS and JSA job seekers connected under RapidConnect (RC) new entrant populations by
stream (per cent)...........................................................................................................................Table 3.2: Adjusted time taken from registration to connect 90 per cent of registrants to employment
services – JNS and JSA by stream and entry process for new entrant populations (days).............Table 3.3: Average time between attended interviews after commencement with providers during first
12 months after registration by stream for new entrant populations (weeks)..............................Table 3.4: Changes in length of disengagement following July 2011 compliance, caseload (work days).............Table 3.5: Number of periods of assistance per job seeker JNS and JSA new entrant populations
(per cent).......................................................................................................................................Table 4.1: EPF expenditure by category, 1 July 2009 to 30 June 2012 (percentage of total expenditure)...........Table 4.2: Proportion of Job Seeker Account July 2006 to June 2009 and Employment Pathway Fund July
2009 to June 2012, expenditure by category (per cent)................................................................Table 4.3: Expenditure in the first 12 months, provider vs non-provider, new entrant population (per
cent and dollar).............................................................................................................................Table 4.4: Work experience activities between 1 July 2009 and 30 June 2012 (number and per cent)...............Table 4.5: Work experience activities undertaken, 1 July 2009 to 30 June 2012 (per cent).................................Table 4.6: Median time to exit from services by Assessed Stream for new entrant populations (weeks)...........Table 4.7: Long-term unemployed (LTU) JSA and JNS who exited employment services by Assessed
Stream for study populations (per cent)........................................................................................Table 5.1: Total job placements by JSA providers over the period July 2009 – June 2012 by stream,
(number and per cent)...................................................................................................................Table 5.2: Total number of paid employment outcomes by JSA providers over the period July 2009 –
June 2012 by stream, (number and per cent)................................................................................Table 5.3: Job placement and 13-week outcome rates for Assessed Stream 4 job seekers, JNS and JSA
new entrant populations, (per cent)..............................................................................................Table 5.4: Published cost ($) per employment outcome for JNS and JSA 2009-2012 ($).....................................Table 5.5: Average expenditure per job seeker in first 12 months of service, new entrant populations ($)........Table 5.6: Average expenditure by stream per employment outcome for new entrant populations ($).............Table 6.1: Education and training related expenditure in the first 12 months of JNS and JSA, new
entrants (per cent and $)...............................................................................................................Table 7.1: Proportion of Job Services Australia caseload that experiences disadvantage in each of five
domains (per cent)........................................................................................................................Table 7.2: Job seekers with disability with employment restrictions in the JSA active commenced
caseload, by first medical condition, 30 June 2012 (per cent and total numbers).......................Table 7.3: Off-income support rates one year after exit from employment services for job seekers with
disability with employment restrictions, JNS and JSA study population (per cent).....................Table 7.4: JSA job seekers from a culturally and linguistically diverse (CALD) background or with mixed or
low English proficiency (per cent of job seeker category)...........................................................Table 8.1: Work Experience Phase (WEPh) activity types participated in during the WEPh (per cent of job
seeker population).......................................................................................................................Table 8.2: Odds ratios of coming off Newstart Allowance (NSA) and Youth Allowance (Other) (YA(O)) for
different activity types compared with the employment-related activities type.........................Table 9.1: Proportion of employers aware of JNS and JSA and their usage of such services (per cent).............Table 9.2: Proportion of employers reporting current or previous employment of disadvantaged job
seeker groups (per cent)..............................................................................................................Table 9.3: Effectiveness of JSA wage subsidy job placements, Caseload population (per cent).........................Table 10.2: Proportion of sites providing generalist versus specialist services by JSA provider for profit or
not for profit status Jan 2014(per cent).......................................................................................
14

List of acronymsABS Australian Bureau of Statistics
ACCI Australian Chamber of Commerce and Industry
ACOSS Australian Council of Social Service
AEC Australian Employment Covenant
AES Aboriginal Employment Strategy
AJS Australian JobSearch
APESAA Advisory Panel on Employment Services Administration and Accountability
APM Active Participation Model
ASIB Australian Social Inclusion Board
BAFW Building Australia’s Future Workforce
CAEPR Centre for Aboriginal Economic Policy Research
CALD Culturally and Linguistically Diverse
CCA Comprehensive Compliance Assessment
CDEP Community Development Employment Projects
CES Commonwealth Employment Service
COAG Council of Australian Governments
CPI Consumer Price Index
CR Contact Request
CRI Commonwealth Rehabilitation Service Australia
CRS Commonwealth Rehabilitation Service, Australia
DAISES Dynamics of Australian Income Support and Employment Services
DEEWR Department of Education, Employment and Workplace Relations
DEN Disability Employment Network
DES Disability Employment Services
DES ESS DES Employment Support Service
DHS Department of Human Services
DMS DES Disability Management Service
DSP Disability Support Pension
EAS Employment Assistance Survey
EPF Employment Pathway Fund
15

EPP Employment Pathway Plan
ESA Employment Service Area
ESAt Employment Services Assessment
ESC1 First Employment Services Contract
ESC3 Third Employment Services Contract
ESD4 Employment Services Deed 4
ESS Employment Services System
FaHCSIA Department of Families, Housing, Community Services and Indigenous Affairs
FTB Family Tax Benefit
GFC Global Financial Crisis
GSS General Social Survey
HAS Health Services Australia Group
HLS Harvest Labour Scheme
IEP Indigenous Employment Programme
IES Indigenous Employment Strategy
ILO International Labour Organisation
IOP Indigenous Opportunity Policy
IRC Indigenous Ranger Cadetship
IS Intensive Support
ISca Intensive Support customised assistance
ISca1 Intensive Support customised assistance (period 1)
ISca2 Intensive Support customised assistance (period 2)
ISjst Intensive Support job search training
IT Information Technology
IWS Indigenous Wage Subsidy
IYCP Indigenous Youth Careers Pathways programme
JCA Job Capacity Assessment
JN Job Network
JNS Job Network Services, including Job Network, JPLOs and other complementary programmes such as PSP and JPET
JPET Job Placement, Education and Training Programme
JPLO Job Placement Licensed Organisations
16
JSA Job Services Australia
JSCI Job Seeker Classification Instrument
JSKA Job Seeker Account
JSS Job Search Support
KPI Key Performance Indicator
LCTW Local Connections To Work
LEC Local Employment Coordinators
LHS Left hand side
LMAO Labour Market Assistance Outcomes
LTU Long-term Unemployed
NATSIHS National Aboriginal and Torres Strait Islander Health Survey
NATSISS National Aboriginal and Torres Strait Islander Social Survey
NEIS New Enterprise Incentive Scheme
NESA National Employment Services Association
NHLIS National Harvest Labour Information Service
NPA National Partnership Agreement
NSA Newstart Allowance
OECD Organisation for Economic Cooperation and Development
PEA Priority Employment Area
POPPPL Priority Occupations Priority Places Programme List
PP Parenting Payment
PPM Post Programme Monitoring Survey
PPP Productivity Places Programme
PPT Percentage Point
PR Participation Report
PSP Personal Support Programme
RC RapidConnect
RED Research and Evaluation Database
RFQ Request for Quotation
RFT Request for Tender
RHS Right hand side
RJCP Remote Jobs and Communities Programme
17

RTO Registered Training Organisation
SLA Service Level Agreement
S1 Stream 1
S2 Stream 2
S3 Stream 3
S4 Stream 4
SSR Stream Services Review
TAFE Technical and Further Education
VRS Vocational Rehabilitation Services
WEAR Work Experience Activity Requirement
WEPh Work Experience Phase
WfD Work for the Dole
YA(O) Youth Allowance (Other)
YA(S) Youth Allowance (Student)
18

Executive Summary
Background
Employment servicesJob Services Australia (JSA) was the continuation of a system under which non-government organisations and businesses provide Australian Government employment services under a contract arrangement. Job Network which began in 1998 was the first of these contracting arrangements (Employment Services Deed 1). The Active Participation Model (APM) of Job Network (which began in 2003) provided a continuum of assistance and offered job search support and intensive support for eligible job seekers.1 Mutual Obligation requirements were triggered after six months of unemployment for most activity tested job seekers. Job Search training (which was a full-time participation requirement) occurred for less disadvantaged job seekers after 12 weeks unemployment.
The case for changeA review of the APM initiated in 2008 found that, as a result of a persistently strong economy over a period of 17 years Australia faced two major challenges with regard to the employment services sector. Firstly, because most trained workers were already in employment there was significant shortfall in the supply of workers with requisite vocational qualifications.2 Secondly, as the more job ready entered employment and remained employed, the proportion of job seekers who were disadvantaged increased. For example, the percentage of job seekers in receipt of income support for five years or more increased from 18 per cent in September 2004 to 29 per cent in March 2009.3 The existing model was not adequately servicing this group or addressing the skills shortages for existing job seekers and employers. Assistance for job seekers who were most disadvantaged was capped under the APM.
Job Services AustraliaJSA replaced Job Network and six related employment services contracts from 1 July 2009 with a budget of $3.9 billion over three years.4
The programme was intended to overcome the problems of Job Network by providing individualised service by assigning job seekers to streams determined by their relative level of labour market disadvantage. JSA was designed with the goals of: increasing the focus on the most disadvantaged job seekers; achieving greater social inclusion; boosting employment participation and the productive capacity of the workforce and addressing skills shortage areas.5 The compliance system supporting
1 More information on the Active Participation Model is available in DEEWR, 2007. Active Participation Model Evaluation July 2003 – June 2006, Canberra.
2 ACTU, AiG, GTA, AEU, April 16, 2008. Facing up to Australia’s skills challenge: industry sets key priorities to address the skills crisis, Dusseldorp Skills Forum.
3 DEEWR, 2008. The future of employment services in Australia, A Discussion Paper, DEEWR, Canberra.4 These complementary programmes which existed in the APM included the Job Placement, Employment and Training
and Personal Support Programmes, Job Placement Licensed Organisations, Community Work Coordinators, Green Corps and Harvest Labour Services. In this report these programmes combined are referred to as Job Network Services (JNS).
5 The most disadvantaged job seekers include those unemployed more than five years, homeless job seekers, people with mental health conditions, Indigenous, job seekers in jobless families and 15- to 24-year-olds who are not working and not in education. These job seekers were considered at risk of social exclusion.
1

the new programme was designed to be more responsive to the needs of an increasingly disadvantaged job seeker population.
JSA began with a total of 141 provider organisations over 2000 sites. Of these, 77 per cent were not for profit and 23 per cent were for profit. Alongside general employment service providers, specialist providers delivered services for particular disadvantaged groups including the homeless, youth, people with disabilities, Indigenous job seekers, people from Culturally and Linguistically Diverse (CALD) background and ex-offenders. Services for highly disadvantaged job seekers were not capped under JSA.
Over the life of the contract, July 2009 – June 2012 the active JSA caseload decreased from 751,881 to 739,455, peaking at 828,475 in February 2010. Over the same period there were more than 2,357,100 referrals of job seekers to JSA providers. There were 1,263,099 job placements.
Challenges for Job Services Australia Several unforeseen challenges faced the new programme. They included the onset of the Global Financial Crisis (GFC) from late 2008, whose complications were twofold: firstly, more people entered employment services and, secondly, there were fewer jobs vacancies into which job seekers could be placed.6
There were challenges associated with structural changes across many industries.7 For example, skills shortages were no longer a major concern of many employers as had been the case prior to the implementation of JSA.
The Welfare to Work reforms in 2006 and associated tightening of eligibility and participation requirements for Parenting Payment (PP) and the Disability Support Pension (DSP) had continuing cumulative effects on the caseload composition. The JSA caseload had higher percentages of groups who were subject to participation requirements and were less likely to leave income support. Many job seekers in JSA experienced multiple disadvantage, which is associated with significantly lower outcome rates and presents additional challenges for service provision. Of the JSA caseload around 18 per cent were identified by an Employment Services Assessment (ESAt) as having disability (with employment restrictions). These job seekers are more likely to become long-term unemployed (LTU) than other job seekers. Many LTU job seekers exited from JSA to either Disability Employment Services (DES) or the DSP.8
Measuring Job Services Australia performanceEffectiveness comparisons in this evaluation are made between JSA and the programmes it replaced. These programmes included Job Network and six complementary programmes, in combination referred to in this report as Job Network Services (JNS).9 Net impact analysis was not possible because:
• no control group could be identified as JSA was a universal access programme
• no information was available on non-participants (even if they had been comparable).
6 See Section 10.7 for a discussion of the impact of the GFC on JSA.7 See Section 2.1 for discussion on the macroeconomic context for JSA.8 See Chapter 7 for a detailed discussion on disadvantage in JSA9 These complementary programmes which existed in the APM included the Job Placement, Education and Training and
Personal Support Programmes, Job Placement Licensed Organisations, Community Work Coordinators, Green Corps and Harvest Labour Services.
2

Many specific studies were undertaken to measure various aspects of JSA effectiveness and Appendix 1 details the methodology used for these studies. Previously published reports for this evaluation were also used.10
What worked well
Employment outcomes for Stream 4 job seekers New entrant Stream 4-type job seekers in JSA were more likely to achieve job placements (37.6 compared with 17.0 per cent) and 13-week employment outcomes (21.5 compared with 6.9 per cent) compared with similar job seekers in JNS. A greater proportion of Stream 4-type job seekers in JSA were off income support at the end of an 18-month study period compared with JNS, and these results are confirmed by regression modelling that accounts for differences in macroeconomic conditions and caseload composition. While cost per job seeker was higher under JSA in the first 12 months of service, higher outcome rates meant that the cost per employment outcome for these job seekers was lower under JSA (Table 5.6).
Education and training outcomes for all job seekersJSA was substantially more effective than JNS in helping job seekers obtain skills and training. Both LTU and new entrant job seeker populations had higher education and training outcomes under JSA compared with JNS.11 Training was found to significantly improve the chances of job seekers getting a job, particularly for youth and mature aged. Regression analysis showed that job seekers in Streams 2, 3 and 4 had more than double the odds of getting a job placement if they had received Employment Pathway fund (EPF)-funded vocational or non-vocational training compared with those who had not.12 While JNS shows higher early exit rates for new entrants, JSA exit rates from income support after 37 weeks were higher (Figure 4.5). This is probably the return on investment of increased training outcomes in JSA. Education has a recognised attachment effect, meaning that job seekers lessen or cease job search while they study. This may contribute to the lower early exit rates from both service and income support in JSA.
StreamingStreaming based on Job Seeker Classification Instrument (JSCI) scores was found to be an effective and efficient way of distributing resources to drive outcomes for more disadvantaged job seekers.13
There is a strong and largely linear relationship between JSCI scores and outcome rates (off income support after 12 months). Regression discontinuity analysis showed:
• a 14 percentage point difference in off-income support rates between job seekers at the top of Stream 1 compared with those at the bottom of Stream 2
• an 8 percentage point difference in off-income support rates at the boundary between Streams 2 and 3.
Tailored assistanceEvidence suggests that JSA was operating as intended by providing individually tailored assistance to job seekers. JSA participants undertook activities which reflected their circumstances and the EPF was
10 See Section 1.2 for a complete list of publications.11 See Section 6.4 for discussion of education outcomes in JSA.12 See Section 6.3.4 for discussion of the effectiveness of training in JSA.13 See Section 5.7 for discussion of the effectiveness of streaming.
3

used to purchase services appropriate to job seeker needs.14 15 For example, higher percentages of expenditure in Stream 4 were for professional services (which include mental health and counselling services). Work Experience activities selected for disadvantaged job seekers showed the high priority given to addressing non-vocational barriers.16
Work ExperienceAnalysis showed a strong ‘threat effect’ for work experience activities for Streams 1 to 3 type job seekers. The ‘threat effect’ refers to job seekers who leave JSA service to avoid participating in an activity. There is little evidence of a this effect for Stream 4 job seekers which reflects the lower capacity for these job seekers to easily leave income support regardless of the ‘threat’ of the Work Experience activity.
ChurnReturn to service, or ‘churn’ in the employment services context, refers to job seekers cycling in and out of service (or unemployment). Evidence suggests that the rate of return to service was slightly lower in JSA than in JNS. While 17 per cent of new entrants had more than one period of assistance in the JSA population, this was around 26 per cent in the JNS population (Table 3.5). Departmental17 analysis of Stream 2 type job seekers also found that JNS job seekers who had left income support 18 months after registration were more likely to return to income support within six months than those under JSA.
Departmental, as well as external research, from Australia and overseas has found that placement in short-term jobs can actually provide an advantage when job seekers attempt to secure and sustain future job placements.18
Where results were mixed
Employment outcomes for long-term unemployed job seekersPost Programme Monitoring (PPM) survey data show lower employment outcomes for LTU job seekers under JSA compared with JNS. These results do not account for differences in macroeconomic conditions or job seeker characteristics. Regression analysis which does this showed comparable employment outcomes for LTU job seekers overall in JNS and JSA.19
Highly disadvantaged (Stream 4-type) LTU job seekers under JSA exited services at a higher rate than similar job seekers under JNS measured over 18 months and regressed.
LTU job seekers who exited JSA had more sustainable outcomes than similar job seekers exiting JNS, with higher off-income support rates (39.6 per cent compared with 31.4 per cent) and lower average
14 See Section 4.4.1 for discussion of the work experience activities undertaken in JSA.15 See Section 4.3.1 for discussion of EPF expenditure in JSA.16 See Section 7.4.4 for discussion of work experience for disadvantaged job seekers.17 Unless otherwise specified, references in this report to ‘departmental analysis’ or ‘the department’ are (depending
on the timeframe) references to the Department of Education, Employment and Workplace Relations (from December 2007 to October 2013), the Department of Employment (from October 2013 to December 2017), the Department of Jobs and Small Business (from December 2017 to May 2019) or the Department of Employment, Skills, Small and Family Business (from May 2019).
18 See Section 3.5.5 for discussion of returns to employment services.19 See Section 7.6.6 for discussion on very long-term unemployed (VLTU) job seekers.
4

reliance on income support (47.3 per cent compared with 55.1 per cent) 12 months after exit. This result holds for job seekers across all Assessed Streams and all age groups.20
Employment outcomes for Indigenous job seekersIndigenous job seekers in JSA the 2009 – 2012 contract were more likely to be disadvantaged than non-Indigenous job seekers, reflected in higher JSCI scores. In 2011, 27 per cent of Stream 1 and 44 per cent of Stream 2 Indigenous job seekers experienced multiple disadvantage.21
According to PPM survey data, the gap in employment outcomes between Indigenous and non-Indigenous new entrant job seekers in Streams 1 to 3 widened under JSA. It should be noted that this comparison is complicated by the winding back of Community Development Employment Projects (CDEP), the worsening economic circumstances that prevailed under JSA and changes in job seeker cohorts.
For LTU Indigenous job seekers, however, the story is different. Higher proportions of Indigenous job seekers were off both Newstart Allowance (NSA) / Youth Allowance (Other) (YA(O)) (68.7 per cent compared with 61.7 per cent) and all income support types (32.9 per cent compared with 29.7 per cent) after exiting JSA than JNS.22
Employment outcomes for other groups of disadvantaged job seekersOutcomes for most target groups followed similar patterns to overall outcomes.23 New entrant Stream 1 to 3 job seekers into JSA showed lower rates of employment outcomes as measured by the PPM survey than equivalent job seekers in JNS. Where regression was used to compare outcomes the difference is less marked. This can be at least partly explained by the more difficult economic environment and the higher prevalence of more disadvantaged job seekers in JSA.24 People with disability seem to be the exception in that they tended to have better employment outcomes under JSA than equivalent job seekers in JNS.25 The introduction of uncapped DES in 2010 may have skewed the results because many more difficult to place job seekers may have registered in DES.
A similar pattern of higher employment outcome rates under JNS was found for LTU job seekers in target groups. There was less difference between the models for LTU job seekers than for new entrants, and on regressed measures the differences largely disappear for these job seekers.
Training provision and accessThe Productivity Placement Programme (PPP) was well supported by providers but there were issues in accessing places.26 JSA providers reported problems accessing appropriate training opportunities for job seekers. This was particularly the case in regional areas, where transport and course availability were constant challenges.27
20 See Appendix 1 Section 2.2 for a description of how outcomes for LTU job seekers were compared.21 See Section 8.3.2 for discussion of disadvantage and streaming.22 See Section 8.5.2 for discussion of outcomes comparisons for Indigenous job seekers.23 Specified target groups for JSA included: single parents, people with disability, mature aged, youth, people from CALD
backgrounds and mixed or low English proficiency and LTU and VLTU job seekers.24 See Section 2.1 for discussion of macroeconomic differences and Figure 7.1 for the prevalence of different types of
disadvantage.25 See Section 7.6.2 for discussion of outcomes for people with disability.26 See Section 1.1.4 for more detail on the Productivity Places Programme (PPP).27 See Section 6.3 for discussion of training in JSA.
5

The shortage of training places had implications for providers’ ability to meet employer skills needs. While most providers reported discussing job options and skills development needs with job seekers, job seekers reported not getting enough information about training and education options.
There is anecdotal evidence of ‘deadweight’ and ‘training for training’s sake’ in the provision of training in JSA. ‘Deadweight’ is where a job seeker is given assistance for training that they would have undertaken themselves, that does not contribute to the likelihood of employment, or does not lead to learning new skills. ‘Training for training’s sake’ is where a job seeker repeats the same training programme or attends irrelevant courses.
Assessment mechanismsSeveral lines of evidence suggest that the assessment mechanisms for streaming could be improved. Job seekers had more JSCI assessments per job seeker in JSA, which could indicate that the initial assessment needed revision, since JNS was based on a continuum of service, there was less incentive to have job seekers reassessed under JNS. Another indication is the prevalence of disadvantage found in lower streams and the fact that job seekers with multiple disadvantage occur in all streams.28 29
A ‘multiple disadvantage’ indicator, when added to regression models of labour market success is usually found to be significant. This is the case even when all relevant JSCI factors are included in the model. This indicates that there is a residual ‘contributing factor’ not adequately captured in JSCI measures, at the time of the analysis.
The Organisation for Economic Cooperation and Development (OECD) also suggests that research should investigate why the Star Rating regression over-predicts expected outcomes for certain disadvantaged groups.30 This over-prediction could well be linked to the overall identification of disadvantage and the fact that more work may be required to properly identify disadvantage and quantify its impact.31
Specialist providersWhile specialist providers performed relatively poorly early in the contract period, there remains some evidence of a need for these services. Analysis of Star Ratings data shows that early in the JSA contract specialist providers were performing 0.6 Stars below generalist providers. As a result of midterm business re-allocations and strong performance improvement from remaining specialist providers, by the end of the contract specialist and generalist Star Ratings were comparable.
Specialist providers were better than generalist providers at achieving outcomes for their particular target cohorts. They also scored consistently better on measures of job seeker satisfaction.
Employment Pathway PlansResults indicate that Employment Pathway Plans (EPP), when used effectively work well for both job seekers and providers, helping to identify job seeker needs and assisting in planning ways to address barriers. There were issues however, in that almost one-third of job seekers interviewed were not aware of having or signing an EPP.
28 For instance, over half of all job seekers identified as homeless were in Stream 4, but another quarter were in either Stream 1 or 2.
29 See Section 7.4 for discussion of servicing disadvantaged job seekers in JSA.30 OECD, 2012. Activating Jobseekers: How Australia Does It, OECD Publishing.31 See Section 7.4 for discussion of servicing disadvantaged job seekers in JSA.
6

Reverse marketingReverse marketing, when appropriately targeted contributed to improved appropriateness and effectiveness of EPF funded services. Reverse marketing was an essential aspect of employer servicing. There is a risk that if not well targeted, reverse marketing can result in inappropriate job referrals and employer contact fatigue.
Wage subsidiesThe majority of wage subsidies were provided to job seekers in the first six months of service, indicating that they were not being used for LTU job seekers. There is some evidence, stemming from employer attitudes, to suggest that they may have been slightly less effective for this group anyway. Wage subsidies led to sustained outcomes as they resulted in better off income support outcome rates after 12 months and reduced reliance on income support. The odds were 14 per cent higher of being off income support after 12 months if wage subsidies were provided.32 Results from the 2011 Employer Incentives Survey33 indicate substantial levels of deadweight (31 per cent) for these wage subsidies, indicating a need for strict targeting.
Where more work is required
Employment outcomes for more competitive job seekersOverall employment outcomes, for less disadvantaged job seekers were stronger under JNS than under JSA.
PPM data show outcome rates for Stream 1, 2 and 3 type job seekers were up to 11 percentage points better under JNS for new entrant job seekers (Figure 5.1). These results are not regressed and would therefore be affected by the stronger economic climate, fewer job seekers with part-time participation requirements and, on average, less disadvantaged job seekers in JNS. Regressed measures (such as exit rates and income support reliance) support the finding that employment outcome rates for these job seekers were lower under JSA. There is evidence, however, that exits for Stream 1 to 3 new entrant job seekers under JSA appear to be more sustained.
Outcomes for LTU Stream 1 to 3 job seekers were comparable under both models.34
Some of the reasons for the lower outcome rates for less disadvantaged job seekers were a result of policy changes including the removal of early activation requirements (as a cost saving measure) and compliance changes.
Another factor which may have influenced higher outcome rates under JNS, especially for less disadvantaged job seekers was that under the APM in JNS, job brokerage licences were issued to both Job Network members and other (private) employment agencies (referred to as Job Placement Licensed Organisations (JPLO)). The operation of JPLO had both a direct effect, that is, by having outcomes recorded for the previous model, and an indirect effect in that they registered vacancies the equivalent of which would not be available to JSA providers. JPLO job placements tended to be for more job ready job seekers and were less sustainable than Job Network placements.35
32 See Section 9.4.4 for discussion of wage subsidies.33 See Section 1.2.3 for a description of this data source.34 See Section 7.6.6 for a discussion of LTU and VLTU job seekers.35 DEEWR, 2007. Active participation model evaluation: July 2003 – June 2006 DEEWR, Canberra.
7

Removing early activation requirementsThe activity requirements for job seekers changed for Streams 1, 2 and less disadvantaged Stream 3 job seekers with the removal of the Intensive Support job search training (ISjst) phase of JNS.
Analysis of exits from service and income support from JNS and JSA found a sharp spike in exit rates in JNS at around 12 weeks in service. Job Search Training was a three-week full-time programme of training in job search techniques that took place after three months in service in JNS for less disadvantaged job seekers. It was compulsory for job seekers on activity tested payments. The ISjst phase was mainly aimed at Stream 1 and 2 type job seekers— not classed as highly disadvantaged. That these were the job seekers for which the spike in exits is most pronounced, indicates that the spike is probably a result of the referral effect of Job Search Training (Figure 4.5). Further analysis estimated the net impact of Job Search Training on the chances of leaving income support at 18 months was eight percentage points in exit rates for JNS job seekers (compared with propensity score matched JSA job seekers).36
If the impact of the three-month intervention is removed from the exit rates shown for JNS, very similar early exit rates are seen under both models, while JSA seems to prompt higher exits later in a period of service. While previous evaluations have noted high levels of deadweight and limited efficacy in increasing job search skills for similar interventions, this evaluation finds that interventions that prompt early exits can have long-term benefits and in this light the associated referral effect is cost-effective.37, 38
Compliance framework changesThe compliance system supporting JSA was designed to be more responsive to the needs of an increasingly disadvantaged job seeker population. JSA allowed more discretion for providers and Centrelink (now the Department of Human Services, DHS) to not take compliance action. This was to prevent vulnerable job seekers from being subject to inappropriate compliance action. An Independent Review of the Job Seeker Compliance Framework by Disney et al. (2010) describes how these changes affected engagement.39 Departmental analysis shows that the median time between a missed appointment and the next attended appointment over the first 18 months of service was two to three working days longer under the JSA compliance framework than under JNS (13–19 days for JSA compared with 11–16 days for JNS).
Revised compliance arrangements (implemented on 1 July 2011) as a result of the Disney review resulted in job seekers reengaging faster after these changes. Attendance rates at interviews also increased slightly following these changes.40
Red tapeProviders who operated under both models reported higher administrative burden in JSA than Job Network. Some of this would be expected as JSA was a combination of Job Network and six associated contracts (JNS). Providers, however, reported that much of the red tape was related to data entry and was considered duplication between either Centrelink and the department, or between paper and electronic records.
36 See Appendix 1, Section 3.6 for a description of this analysis.37 DEEWR, 2007. Active Participation Model evaluation: July 2003 – June 2006, DEEWR, Canberra.38 Productivity Commission 2002, Independent Review of the Job Network: Inquiry Report.39 Disney et al, 2010. Impacts of the new Job Seeker Compliance Framework: the report of the independent review.40 See Section 3.5.4 for discussion on the revised compliance arrangements.
8
The OECD notes that while Australia does have a relatively strong central management of its employment services this is necessary as only central management can consistently implement Star Ratings and monitor the quality of service. The report also noted though that there are trade-offs involved, with a risk that changes that reduce the information available to the department reduce its ability to monitor and improve the quality of service. Another risk is that such changes could facilitate ‘gaming’ of payments.41
Initially the JSA model differentiated between provider brokered outcomes and provider assisted outcomes as a means of incentivising higher levels of employer servicing. In 2012 an independent inquiry of provider brokered outcomes found weaknesses in the administrative standards of some providers and changes were made to the payment structure for 13- and 26-week employment outcomes. This would not have been possible without strong administrative requirements.
As part of achieving a balance between accountability for public money and provider concerns regarding red tape, changes were made to the JSA contract for 2012 – 15 in an attempt to reduce red tape.42
Parking of job seekersSome parking of more disadvantaged job seekers in higher streams appeared to be occurring. This is shown by declining expenditure with increasing JSCI scores in Streams 2 and 3. This pattern was also found in JNS analysis for job seekers with JSCI score equivalents of 27 or higher indicating that there may be some job seekers with JSCI scores above this level who providers feel are unlikely to achieve outcomes.
The fact that approximately 23 per cent of Stream 4 job seekers and 32 per cent of Stream 3 job seekers did not receive any EPF assistance between July 2009 and December 2011 is also an indication that there are job seekers providers feel will not benefit from EPF spending.
ConclusionThe answer to the question of how well JSA 2009 – 2012 achieved the programme objectives is complex. JSA largely achieved the objective of providing training in order to prepare job seekers for the workforce. It achieved the objective of directing resources effectively to help more disadvantaged job seekers into work, but failed to effectively activate job seekers who were less disadvantaged.
The 2012 – 2015 JSA model addresses some of the areas of concern raised in this report by specifically including measures to reduce red tape and by incentivising more strongly the active servicing of Stream 1 and Indigenous job seekers.
41 OECD, 2012. Activating Jobseekers: How Australia Does It, OECD Publishing.42 See Section 10.6.4 for a discussion of these changes.
9

1 IntroductionJob Services Australia (JSA) was the Australian Government employment services system that supported job seekers into employment and helped employers to find employees. The first JSA contract ran from 1 July 2009 to 30 June 2012 and replaced the Job Network employment service and its many related complementary services (Job Network Services, JNS).
JSA marked a shift in the goals and design of Australian Government employment services from the ‘work first’ focus that defined JNS to a greater emphasis on building human capital through skills and training and addressing the needs of highly disadvantaged job seekers. JSA also aimed to improve the links between labour market assistance and apprenticeships, vocational education and training and state and territory government employment and training programmes. The second JSA contract (from 1 July 2012 to 30 June 2015) was an extension of the first contract, with some variations. This evaluation covers the first JSA contract, 2009 to 2012.
1.1 Government funded employment services in AustraliaThe establishment of Job Network in 1998 marked a change in how employment services had been managed in Australia. The Commonwealth Employment Service (CES), a government agency, and its predecessors had administered employment services since 1946. The introduction of Job Network in May 1998 as the model for delivering employment services represented a move to a more flexible system of providing labour market assistance. For the first time in Australia, publicly funded employment services were supplied by non-government organisations and businesses under a contract arrangement (Employment Services Contract 1 (ESC1)) which replaced the CES.
Job Service Australia (as was its predecessor Job Network) was administered by the Department of Employment (the department).43 The programme worked to assist job seekers referred through Centrelink (now the Department of Human Services (DHS)) gateway. Limited assistance was also available for unemployed Australians who were not currently employed or studying full-time and who volunteered into the programme. Participation in the programme was compulsory for activity tested job seekers in order to receive income support and other related benefits. In varying guises, compliance has always been part of the Job Network and Job Services Australia framework through contact and activity requirements.
The way job seekers interact with employment services remained constant through both the Job Network and Job Services Australia contracts but the emphasis on how assistance was provided, and where and how it was focused, changed (Figure 1.1).
Figure 1.1: Generalised job seeker interaction with employment services
1.1.1 Job Network Services and the Active Participation ModelThe Active Participation Model (the APM) was introduced in the Job Network contract from July 2003.44 The APM provided a continuum of assistance and offered job search and intensive support for
43 Now the Department of Employment, Skills, Small and Family Business.44 More information on the Active Participation Model is available in DEEWR, 2007. Active Participation Model
Evaluation July 2003 – June 2006.
10
eligible job seekers. Mutual Obligation requirements were triggered after six months of unemployment for most activity tested job seekers. There was also a requirement for job seekers who were not highly disadvantaged to undertake Job Search Training after three months unemployment. The contract was subsequently extended through to 30 June 2009.
The model of service delivery during this time comprised Job Network itself as well as a number of complementary programmes including the Job Placement, Education and Training Programme (JPET) and the Personal Support Programme (PSP). The service delivery model also included the operation of Job Placement Licensed Organisations (JPLOs), Community Work Coordinators, Green Corps and Harvest Labour Services. Throughout this report this is referred to as the Job Network Services (JNS) service delivery model and is taken to include Job Network and all complementary services. (Figure 1.2).45
Figure 1.2: Depiction of the Programmes that define Job Network Services (JNS) as used for this evaluation
1.1.2 The case for Job Services AustraliaA review of employment services in 2008 highlighted weaknesses in the existing Services (JNS) in two key areas. Firstly, the review cited widespread skill shortages, a product of 17 years of continuous economic growth.46 This was a result of a persistent strong economy which saw the unemployment rate fall from 7.7 per cent when Job Network was introduced in 1998 to 4.2 per cent at the time of the discussion paper.
Australia faces a significant shortfall in the supply of workers with required vocational qualifications. Currently 87 per cent of available jobs require post-school qualifications, but 50 per cent of the workforce lacks these qualifications. The best estimate is that if the supply of people with VET qualifications remains at the same level as in 2005, a shortfall of 240,000 can be expected over the 10 years to 2016.47
In this environment, the JNS model was seen not to be adequately addressing the skills gap for existing job seekers and employers.
Secondly, the proportion of job seekers in receipt of income support for five years or more had increased from 18 per cent in September 2004 to 29 per cent in March 2009.48 The existing model appeared not to be adequately servicing this job seeker group.
45 Not all components are included in all comparisons.46 DEEWR, 2008. The future of employment services in Australia A Discussion Paper, Canberra.47 ACTU, AiG, GTA, AEU, April 16, 2008. Facing up to Australia’s skills challenge: industry sets key priorities to address the
skills crisis, , Dusseldorp Skills Forum.48 DEEWR, 2008. The future of employment services in Australia, A Discussion Paper, Canberra.
11
The new employment services model, announced in the 2008 Budget, was intended to respond to the concern that employment services at that time were
…no longer suited to a labour market characterised by lower unemployment, widespread skill shortages and a growing proportion of job seekers who were highly disadvantaged and long-term unemployed.49
A key feature of the JSA model was the provision of tailored individual services in line with job seekers’ assessed levels of disadvantage and the provision of skills and training appropriate to labour market demand.
There were essentially no waiting periods to access a JSA provider for participants who were eligible.50 There were some waiting periods for income support for newly unemployed people who had access to other income, for example, redundancy payouts, and in some circumstances this may have triggered a waiting period for access to full employment services.
JSA commenced on 1 July 2009 and involved expenditure of $4.3651 billion over three years. JSA replaced the JNS continuum of assistance (the APM) with four service streams (with a work experience phase in each stream).
The aim of JSA was to use labour market assistance to ensure that individuals had access to socially inclusive labour market programmes that furthered economic development.52 JSA’s objectives were to help individuals to:
• obtain the skills they need
• secure sustainable employment.
JSA was also designed to:
• increase the focus on the most disadvantaged job seekers53
• achieve greater social inclusion
• boost employment participation
• boost the productive capacity of the workforce
• address skills shortage areas
• better meet the needs of employers.
1.1.3 Policy changes during or in conjunction with the JSA 2009 – 2012 contractOther policy developments affected the way the first JSA contract operated.
Job Capacity Assessments and Employment Services Assessments Under the first JSA contract entry into Stream 4 or other services such as Disability Employment Services (DES) was dependent on the result of a Job Capacity Assessment (JCA). A 2009 Department of
49 DEEWR, 2008. The future of employment services in Australia, A Discussion Paper, Canberra, p1.50 See Section 2.2.1 for further information on eligibility criteria is.51 DEEWR, 2011, 2012, 2013. Annual Reports, 2009-10, 2010-11 and 2011-12.52 Portfolio Budget Statements 2008–09, Budget Related Paper No 1.5, Education, Employment and Workplace Relations
Portfolio, Australian Government, Canberra.53 Including: job seekers unemployed more than five years; homeless job seekers; job seekers with mental health
conditions; Indigenous job seekers; job seekers in jobless families and 15 to 24-year-olds not working and not in education. These job seekers were considered at risk of social exclusion.
12
Finance Strategic Review of the Job Capacity Assessment Program found that the JCA programme was not cost-effective in performing its two major roles: determining income support eligibility and streaming for employment services.54 Based on recommendations from the review, significant changes to job seeker assessment services were introduced in July 2011.55
Reflecting the two distinct purposes noted above, the JCA programme was reformed to separate assessments for employment services and income support:
• Employment Service Assessments (ESAt) established employment services eligibility using medical and non-medical assessments
• JCAs assessed people who lodged a claim for the Disability Support Pension (DSP).
Since this change, all ESAts were completed by assessment services within DHS. The new assessment and referral process only applied to job seekers identified by the Job Seeker Classification Instrument (JSCI) as having multiple or complex barriers with a need for a more comprehensive assessment. People with an injury or ill health seeking temporary incapacity exemptions from the activity test no longer required a JCA; their claim was determined directly by Centrelink Customer Service Advisors.
In addition, on 1 July 2011 the department removed the ability of JSA providers to refer job seekers participating in stream services (Streams 1 to 3) for change of circumstances ESAts reassessments. This change made permanent a suspension for JCA referrals which was introduced in February 2011.
Revised compliance arrangements (implemented on 1 July 2011)On 1 July 2011 revised compliance arrangements were introduced in an attempt to improve job seeker attendance rates at provider appointments and activities. Under the revised arrangements a job seeker’s payment could be immediately suspended if:
• they failed to attend an appointment with their provider or DHS without giving a valid reason beforehand
• they had not been attending an activity and their provider believed they had become disengaged (job seekers with a current Vulnerability Indicator did not have their payment suspended for the first missed appointment or following disengagement from an activity).
A failure could still be applied to a job seeker for missing an appointment or activity, even if they had a reasonable excuse, if it was reasonable to expect them to advise their provider in advance and they failed to do so. Providers could choose to submit Participation Reports (PR) for job seekers who had a reasonable excuse for missing an appointment or activity but failed to let them know beforehand.
JSA Demonstration PilotsThe JSA Demonstration Pilots was a discretionary grants programme which commenced in July 2011 and ceased on 30 June 2013. The projects aimed to improve employment and education outcomes for highly disadvantaged job seekers, including those with multiple barriers to employment. They enabled the department to work with leading providers to capture best practice in service delivery and explore new approaches and partnerships.
54 Department of Finance, 2009. Strategic Review of the Job Capacity Assessment Program.55 The Job Capacity Account was abolished from 1 January 2011. Delivery of the assistance previously recommended by
an assessor and funded through this account was now at the discretion of employment service providers and funded through the EPF. This change was designed to remove any duplication in funding and services between the two funding mechanisms. It meant that assessors were no longer directly involved in funding assistance to job seekers.
13

Early School Leavers Formerly known as Learn or Earn, the Early School Leavers policy was introduced on 1 July 2009. Under this policy people aged less than 21 receiving Youth Allowance (Other) (YA(O)) who had yet to complete Year 12 or a Certificate II qualification were required to participate in either full-time study or training or in part-time study or training in combination with other activities.
1.1.4 Policy external to Employment Services
Productivity Places ProgrammeThe Productivity Places Programme (PPP) was a National Partnership Agreement which commenced on 1 January 2009 and concluded on 30 June 2012. The PPP was part of the Commonwealth Government’s Skilling Australia for the Future initiative, which aimed to reduce skills shortages and increase the productivity of industry and enterprises.56 The PPP was heavily utilised by providers to assist job seekers into training but was subject to availability. Following an Interim Review of the Partnership in November 2010, management of the Priority Occupation Productivity Places Programme List (POPPPL) became a state responsibility.
1.2 The Job Services Australia 2009 – 2012 EvaluationThe department is required to progressively monitor and evaluate government employment services. This evaluation examines the way in which Job Services Australia (JSA) performed over its first contract period. The evaluation examines how well JSA assisted individuals, particularly those most disadvantaged in the labour market, to obtain skills and secure sustainable employment.
The strategy for this evaluation, entitled Evaluation Strategy for Job Services Australia 2009 – 2012 (Evaluation Strategy), was released in 2011 and is available on the department’s website.57 A series of evaluation papers have been publicly released and are also available on the department‘s website. They include:
• The Impact of the Global Economic Downturn on Job Services Australia58
• Servicing Indigenous Job Seekers in Job Services Australia59
• Employment Pathway Fund, Chapter 1, Introduction60
• Employment Pathway Fund, Chapter 2, Wage subsidies61
• Employment Pathway Fund, Chapter 3, Reverse Marketing62
• Good Practice in Job Services Australia.63
This report consolidates findings from these papers and subsequent internal evaluation investigations.
56 Council of Australian Governments (COAG) website,2013, viewed 15 November.57 DEEWR, 2011. Evaluation Strategy for Job Services Australia 2009 – 2012, Canberra.58 DEEWR,2011. The Impact of the Global Economic Downturn on Job Services Australia, July 2009 – January 2010,
Canberra.59 DEEWR, 2012. Servicing Indigenous Job Seekers in Job Services Australia, Canberra.60 DEEWR, 2012. Employment Pathway Fund, Chapter. 1, Introduction, Canberra.61 DEEWR, 2012. Employment Pathway Fund, Chapter 2, Wage subsidies, Canberra.62 DEEWR, 2012. Employment Pathway Fund, Chapter 3, Reverse Marketing, Canberra.63 DEEWR, 2012. Good practice in Job Services Australia, Canberra.
14

1.2.1 Key evaluation areasThe Evaluation Strategy identified the core areas of interest for this evaluation. Changing circumstances have meant that some issues have received more attention while others became less relevant in terms of evaluation and future policy development. Core areas of interest identified in the Strategy were:
• participation in Job Services Australia
• job seeker assistance
• building labour force capacity
• addressing disadvantage
• impact on administrative burden
• Indigenous servicing
• social inclusion under Job Services Australia
• effectiveness of Job Services Australia
• impact of the economic downturn on employment services.
1.2.2 MethodologyThis evaluation assesses the effectiveness and efficiency of JSA by comparing the outcomes of job seekers under the JSA service delivery model with outcomes for similar job seekers under the model it replaced, JNS (Figure 1.2).
Outcomes for a cohort of new entrants to JSA were compared to those of a cohort of new entrants to JNS. The JNS cohorts were allocated to ‘Assessed Streams’ based on their level of labour market disadvantage using the criteria now used to stream job seekers in JSA. This enabled comparison of groups with similar levels of disadvantage in the labour market. For more information on how the Assessed Streams were calculated, see Appendix 1 Section 2.
CAUTIONARY NOTE
The use of new entrant populations and outcome measures which were specifically designed for this comparative study means that outcome rates quoted in comparisons should be used only in the context of these comparisons. They should not be compared to outcome rates published elsewhere, which will be based on different methodologies and populations.
The generic phases of job seeker interaction with employment services (Figure 1.1) which apply to JSA or JNS provides a framework for comparing the effectiveness and efficiency of the two employment services models.
Net impact studiesAlthough a net impact study is sometimes used for this type of evaluation, it was found not to be feasible for this JSA evaluation. Net impact studies are possible for smaller types or phases of programmes, but only where non-participants can be used as ‘control groups’.64 65 This is the case 64 A net impact study involves comparing a group of participants in a programme (treatment group) with a group which
is similar, but did not participate in the programme (control group) in order to quantify the overall benefit of the programme.
65 A ‘control group’ is a group of participants in a similar circumstance not impacted by the programme being evaluated.
15

where programmes are separate and distinct (such as the Personal Support Programme). For programmes which are universal and consist of such a broad suite of individualised interventions as JSA, a net impact study is not possible.
As noted by the Organisation for Economic Cooperation and Development:
In the case of “net impact” evaluations of Active Labour Market Programmes (ALMPs), the accuracy of the impact estimates is less certain because, with the comparison group approach used, selection on unobservables may affect participation, which biases the impact estimate.66
In summary, a net impact study of the overall JSA programme was not applicable because:
• a ‘control group’ or non-participating population could not be identified because government funded employment services are universal access programmes
• the administrative data used in much of this study applies only to participants in employment services and so equivalent data would not be available for non-participants, even if an untreated ‘control group’ could be identified
• the individual and tailored nature of the programme would exacerbate the likely bias in any estimates which could have been produced.
Despite these challenges, both JNS and JSA were designed to help similar types of clients. It is therefore feasible to compare outcomes between models for different client groups – regardless of the ‘phase’ or type of assistance provided. This does restrict comparisons to those which are measured and reported similarly under both models.
1.2.3 Data sourcesA variety of quantitative and qualitative data sources were used in this evaluation, including a combination of collections designed specifically for this evaluation as well as existing data sources. They include:
Administrative dataThe department has a number of administrative systems to support its programmes. These systems cover employment services, specialist employment services for Indigenous job seekers, apprenticeships and traineeships, access to apprenticeships, structural adjustment and language, literacy and numeracy assistance.
Employer Incentives SurveyThe Employer Incentives Survey was a one-off department-run survey conducted in 2011 designed to gather evidence about the effectiveness of wage subsidies. The survey targeted employers who had used a wage subsidy and sought information about the subsidies usefulness and effectiveness.
Post Programme Monitoring SurveySince 1987 the department has conducted the ongoing Post Programme Monitoring Survey (PPM) to measure the labour market and education status of job seekers who participated in employment services. In most cases, outcomes are measured around three months post-assistance. The survey also collects information on the self-assessed benefits of labour market assistance and satisfaction with the services received.
66 OECD, 2012. Activating Jobseekers: How Australia Does It, OECD Publishing.
16

Research and Evaluation DatabaseThe Research and Evaluation Database (RED) is a series of data files that contained unit record level data for customers on income support payments (excluding Department of Veterans’ Affairs pensions) who were on an income support payment with duration of at least 1 day since 1 July 1998. The information contained in RED is primarily collected from Centrelink’s Income Security Integrated System data, with some additional information from the Department of Employment’s Employment Services System (ESS).
Survey of Employment Service Providers:The Survey of Employment Service Providers is run annually since 1999, this survey collects information on the management of employment services contracts, employment services provider awareness and use of government initiatives and their satisfaction with the quality of services that the department and DHS provide
Survey of EmployersThis survey captures a range of information from employers, including recruitment practices, awareness of government programmes, experiences with employment services and experiences with employing individuals from disadvantaged groups.67
Stepping Stones survey (also known as DAISES)The Stepping Stones survey was a longitudinal survey of job seekers that collected information on participation in employment services and income support and its outcomes. The survey was also known as the Dynamics of Australian Income Support and Employment Services (DAISES). The survey was established primarily to support the evaluations of JSA and Disability Employment Services. The survey sample consisted of four cohorts interviewed at six-monthly intervals for a maximum of six waves. Throughout this report, this survey will be referred to as Stepping Stones.
Survey of Employers’ Recruitment ExperiencesThe Survey of Employers’ Recruitment Experiences is a department-run telephone survey using a random sample of employers in regions across Australia. A rolling survey programme obtains information on employer recruitment activities and expectations.
Employment Assistance SurveyThis survey provided information about the type, quality and intensity of employment services provided by Job Network providers to job seekers who were parents, people with a disability, mature aged and very long-term unemployed, as well as mainstream job seekers. There were six waves conducted over an 18-month period between 2008 and 2009.
2010 Departmental qualitative research roundIn 2010 the department conducted research in selected geographic areas to assess the perceived effectiveness of the JSA in those regions. A total of 271 interviews and focus groups were conducted in nine Priority Employment Areas (PEAs) and in five other regions.68 69 Face-to-face structured interviews and focus groups were held with stakeholders, including:
67 Questions in this survey have changed between iterations. Most recent data relating to JSA 2009 has been used where available.
68 PEAs where 2010 departmental fieldwork was conducted included: Cairns; Canterbury-Bankstown and South Western Sydney; Central Coast-Hunter; Illawarra; Ipswich-Logan; North West/Northern Tasmania; Northern & Western Adelaide; Port Augusta-Whyalla-Port Pirie; and South Eastern Melbourne.
17

• JSA providers – site managers and case managers
• local government
• Local Employment Coordinators (LECs)
• employers and chambers of commerce
• job seekers.
2013 Departmental qualitative researchThis fieldwork was conducted in 2013 as part of the evaluation of the Building Australia’s Future Workforce (BAFW) package. Interviews and focus groups were conducted in various locations in New South Wales (Queanbeyan, Mt Druitt and Chatswood), South Australia (Port Adelaide and Noarlunga), Queensland (Mitchelton and Ipswich) and Tasmania (Launceston and Devonport).
Stakeholders interviewed included:
• JSA providers – site managers and case managers
• Registered Training Organisations (RTO)
• Centrelink Customer Service Centre staff.
69 Other regions where 2010 departmental fieldwork was conducted included Geelong, Gold Coast, Mildura/Swan Hill, North Eastern Perth and South Coast NSW.
18

2 Overview of Job Services Australia
2.1 The macroeconomic environmentEmployment services programmes are subject to the economic environment in which they operate. Macroeconomic conditions affect the inflow of population into services and the outcomes the programmes are likely to achieve.
Job Network Services (JNS)70 operated in a comparatively stable economic environment, up to the onset of the Global Financial Crisis (GFC). By comparison, Job Services Australia (JSA) began in the aftermath of the GFC. The economic environment in which the JSA model was conceived also did not resemble the environment in which it was implemented (that is, the turbulent post-GFC economy).
Prior to September 2008, economic and labour market conditions in Australia were exceptionally strong with Gross Domestic Product (GDP) and employment growth averaging 3.4 per cent and 2.3 per cent per annum over the decade, and the unemployment rate troughing at 4.0 per cent in February 2008.
With the onset of the GFC in September 2008, world growth weakened dramatically and economic and labour market conditions in Australia softened. GDP in the year to September 2009 grew by a modest 0.9 per cent, while the unemployment rate increased to a peak of 5.9 per cent in June 2009. The JSA programme was introduced at the peak of this spike in unemployment.
Between September 2009 and March 2012, the Australian economy recovered at a steady pace as opposed to the growth experienced prior to the GFC. GDP grew at an annual average rate of 3.0 per cent over the period September 2009 to March 2012. Labour market conditions were initially strong in the post-GFC recovery. The unemployment rate decreased from a peak of 5.9 per cent in June 2009 to 4.9 per cent in December 2010. Over the period December 2010 to March 2012, labour market conditions were relatively subdued, with the unemployment rate increasing to 5.2 per cent in March 2012. Over the same period the level of employment increased a modest 0.9 per cent.
In 2011, in response to the GFC, stimulus measures were introduced by the then federal government including the Building Australia’s Future Workforce (BAFW) Package. Some BAFW initiatives were delivered through JSA providers. During this time, providers were operating in a very different environment than had been envisaged when the programme was first designed.
With higher unemployment, lower employment growth and declining job vacancies, skills shortages were not as significant a concern for employers as it had been in previous years.71
Aside from the impact of the GFC on implementation of the JSA contract, it is worth noting that it might also have been expected to have a detrimental effect on outcomes in JNS during the latter part of the reference period. Firstly, an increasing unemployment rate meant that more people were losing jobs (adding to the number of job seekers coming into service) and a weaker economy meant fewer vacancies, therefore, fewer job outcomes (Figure 2.1).
70 The term Job Network Services (JNS) is used when referring to Job Network and the relevant complementary services which JSA replaced.
71 Australian Chamber of Commerce and Industry 2004-2013, Survey of Investor Confidence.
19

Figure 2.1: ABS job vacancies, February 2001 to February 2013, (per unemployed person)
0
0.1
0.2
0.3
0.4
0.5
Job
vaca
ncie
s pe
r une
mpl
oyed
per
son
JNS Inflow JSA Inflow
JNS Reference Period JSA Reference Period
Note: Job vacancy data between August 2008 and August 2009 (inclusive) have been estimated by Connolly, G., and Tang, S. 2011, as ABS data was not available.72
Source: ABS 6291.0.55.001 Labour Force, Australia (adjusted for redefinitions) and ABS 6354.0 Job Vacancies, Australia.
Despite decreasing overall unemployment rates over the period of the first JSA contract (2009 – 2012), unemployment rates for long-term unemployed (LTU) job seekers changed little and very long-term unemployment (VLTU) rose.73 74 From July 2009 to July 2011 the number of LTU job seekers grew 18.9 per cent (ABS, 2012). A similar trend was shown in the average duration of unemployment per labour force member. Evidence suggests it can take some time after a recovery begins for significant and sustainable inroads to be made into the level of long-term unemployment (Mayer and Levine, 2010).75 In light of the findings of the Discussion Paper, The Future of Employment in Australia, which guided the development of JSA, it was felt that in order to better prepare unemployed people to take advantage of employment opportunities there remained a need to address emerging skills shortages. The focus of JSA was to position for recovery in these circumstances, by focusing on the provision of training to fill expected future vacancies.
The effect of macroeconomic conditions on the performance of employment services is further demonstrated by the strong alignment between the number of JSA job placements and the number of advertised jobs from September 2009 to February 2014 (Figure 2.2). As illustrated, trends in job placements in employment services closely mirror advertised job vacancies. Given this, the impact of the macroeconomic environment on the performance of employment services cannot be overlooked. Where possible in this report, macroeconomic conditions are taken into account through regression analyses.
72 Connolly, G, and Tang, S 2011. DEEWR. Filling in the Gaps in the ABS Job Vacancies Series, Paper presented at ABS Labour Statistics Advisory Group Meeting, ABS House, Belconnen, ACT, 23 March 2011.
73 LTU job seekers are job seekers unemployed for over 12 months.74 VLTU job seekers are job seekers unemployed for over 24 months.75 Mayer, G, & Levine, L, 2010. Long-Term Unemployment and Recession. Congressional Research Service.
20

Figure 2.2: Job placements by employment services and number of Internet job advertisements, November 2009 to March 2014 (number)
0
50,000
100,000
150,000
200,000
250,000
300,000
0
5,000
10,000
15,000
20,000
25,000
30,000
35,000
40,000
45,000
50,000
Num
ber o
f job
adv
ertis
emen
ts
Num
ber o
f job
pla
cem
ents
JSA job placements (LHS) Internet job advertisements (RHS)
Source: Department of Employment, Vacancy Report and Job Services Australia administrative data, March 2014, three-month averages of original data.
2.2 Job Services Australia (2009 – 2012) – the service model Figure 2.3 describes the JSA model for the 2009 – 2012 period.76 The main elements were four service streams: one for work-ready job seekers (Stream 1) and three for more disadvantaged job seekers (Streams 2 to 4). Assessment of a job seeker’s level of labour market disadvantage was made using the Job Seeker Classification Instrument (JSCI) and where required, a Job Capacity Assessment (JCA) or Employment Services Assessment (ESAt).77 If the job seeker’s level of disadvantage was assessed as having increased, they may have become eligible for a higher level of service and could be moved to a higher stream.
76 Although the contract remained mostly unchanged, some design elements were changed or amended during the contract period, or for the 2012-2015 contract.
77 See Section 1.1.3 for policy changes to the ESAt and JCA in the 2009 to 2012 contract
21
Figure 2.3: Job Services Australia service model as defined for the 2009 – 2012 period
CENTRELINK REGISTRATION
JOB SEEKER CLASSIFICATION INSTRUMENT/ JOB CAPACITY ASSESSMENT
PROVIDEREMPLOYMENT PATHWAY PLAN
EXTRA PRODUCTIVITY PLACES PROGRAMME PLACES FOR JOB SEEKERSWORK READY DISADVANTAGED JOB SEEKERS
53% of new job seekers
• $11 in Employment Pathway Fund
• $385 - $440 in job placement fees
• Up to $781 in service fees
15% of new job seekers
• Up to $1,650 in Employment Pathway Fund
• $385 - $6,600 in outcome and job placement fees
• Up to $2,736 in service fees
10% of new job seekers
• $1,100 in Employment Pathway Fund
• $385 - $6,600 in outcome and job placement fees
• Up to $1,120 in service fees
22% of new job seekers
• $550 in Employment Pathway Fund
• $385 - $2,800 in outcome and job placement fees
• Up to $885 in service fees
WORK EXPERIENCE including Work for the Dole and Green Corps
STREAM 1 STREAM 2 STREAM 3 STREAM 4
• $500 in the Employment Pathway Fund• Up to $722 in service fees (includes $330 one-off work experience
service fees plus up to $392 in service fees for the year)*
* For job seekers who continued in Work Experience for more than 12-months the fee paid continued at $133 and $67 for each alternate three months i.e. for 13 o 15 moths $133, 16 to 18-months $67, 19 to 21-months $133 etc.Note: Not all aspects of the model were continued as per the original design for the full three years of the contract. For changes during the contract see Section 1.1.3.Source: Department of Education, Employment and Workplace Relations 2008, Request for Tender for Employment Services 2009-12.
2.2.1 EligibilityThe levels of service provided in each stream related to the levels of labour market disadvantage of the job seeker. Service and outcome fees differed according to the level of services each stream offered.
A job seeker could be fully or partially eligible for stream services. Fully eligible job seekers included:
• recipients of Newstart Allowance (NSA) and Youth Allowance (Other) (YA(O))
• recipients of other forms of qualifying income support
• 15 to 20-year-olds not in receipt of income support and not employed more than 15 hours a week or in full-time education
• Community Development Employment Project (CDEP) participants.
Partially eligible job seekers included those not working or studying full-time and not receiving activity tested income support. These job seekers could register with Centrelink (now the Department of Human Services (DHS)) or a JSA provider as Stream 1 (Limited). They were entitled to help with their résumé, access to Australia‘s national vacancy database (Australian JobSearch) and advice on the local labour market. They were not assessed using the JSCI. A more comprehensive description of eligibility is contained in Appendix B of the 2008 Request for Tender for Employment Services.78
78 DEEWR, 2008. Request for Tender for Employment Services 2009–2012, Canberra.
22
To link employment services more closely to training that addressed skill shortages, job seekers fully eligible for JSA stream services were also eligible for extra places in the Productivity Places Programme.79
2.2.2 Stream allocationA fully eligible job seeker’s level of disadvantage was assessed using the JSCI and (if required) an ESAt. Responses to the JSCI interview were weighted and combined to create a score that was used to allocate a job seeker to one of Streams 1 to 3.
The entry of a job seeker into Stream 4 or another service such as Disability Employment Services (DES) was dependent on the result of an ESAt.80 This assessment identified vocational and non-vocational barriers to finding and maintaining employment. A job seeker could be reassessed if their circumstances changed. For further information on the services for disadvantaged job seekers see Chapter 7. JSCI information could be updated when new or revised information was received – for example, from an ESAt. The remuneration basis in the JSA model arguably gave more financial incentive for providers to reassess a job seeker as more disadvantaged than it did under JNS. This is because, if additional barriers to employment were identified, the job seeker could be up-streamed or referred for an ESAt which could result in higher payments for both outcomes and servicing.
Stream Services ReviewJob seekers who had received 12 months of stream services underwent a Stream Service Review (SSR) prior to moving into the Work Experience Phase (WEPh). The SSR was used to determine whether a job seeker was still in the appropriate stream. If they were in the appropriate stream they began their WEPh. Where the SSR found that service in a higher stream was needed, the job seeker was referred to the higher stream. In the case of Stream 4 job seekers (who could not be referred for higher levels of service) providers could recommend an extra six months of stream service before the job seeker entered their WEPh.
Work Experience PhaseWithin the WEPh, job seekers aged between 18 and 49 were required to participate in a work experience activity over a 26-week period for every 12 months in the phase.
A job seeker who had received 18 months of service in Stream 4 automatically moved to the WEPh. Job seekers could participate in work experience activities in programmes such as Work for the Dole (WfD), Green Corps or Drought Force or take up part-time study, paid employment or voluntary work.
Employment Pathway FundProviders used the Employment Pathway Fund (EPF) to help job seekers obtain or prepare for employment. Providers received a notional EPF credit for each job seeker which increased commensurate with the level of disadvantage of the job seeker. Providers were not restricted to using EPF credits for any particular job seeker, rather credits could be used flexibly to assist any job seeker or group of job seekers. Unused credits could be retained to help future job seekers but could not be retained as profit.
79 See Section 1.1.4 and Section 6.2.For information on the PPP.80 See Section 1.1.3 for policy changes to the ESAt and JCA in the 2009 to 2012 contract.
23

Job seeker compliance frameworkParticipation in JSA was supported by a revised compliance framework. In particular, there were safeguards to ensure that a job seeker who did not participate through no fault of their own was not penalised. Centrelink continued to have responsibility for making compliance-related decisions under social security legislation and reconnecting job seekers to the employment service. Centrelink was also responsible for undertaking Comprehensive Compliance Assessments (CCAs). These assessments were made with job seekers who persistently failed to meet their participation requirements or who had the potential to do so. The role of providers was primarily to notify Centrelink when a job seeker failed to meet their requirements.
Other programme elements Other elements of the JSA 2009 – 2012 model included continuation of the New Enterprise Incentive Scheme (NEIS), Harvest Labour Services (HLS) and the National Harvest Labour Information Service (NHLIS):
• The NEIS was for job seekers interested in starting and running a small business. The scheme provided small business training, business advice and mentoring as well as ongoing income support for up to 52 weeks. A NEIS panel chose participants based on the viability of business proposals and draft business plans.
• HLS provided workers for primary producers in areas where the demand for workers could not be met locally. Any job seeker legally entitled to work in Australia was eligible for this service.
• The NHLIS developed and disseminated information about harvest-related work opportunities throughout Australia.
An Innovation Fund was established to support projects designed to remove barriers to employment for the most disadvantaged job seekers. Funds were available to members appointed by the department to an Innovation Fund Panel.
Employer Brokers were also funded to help providers develop links with local employers facing skills and labour shortages. Employer Brokers were appointed to a panel and invited to submit proposals for funding activities.81
2.3 Caseload overviewThe actual and predicted percentages of job seekers commencing in various streams are shown in Table 2.1.
81 Employer Brokers and the Innovation Fund are not components of the JSA 2012 – 2015 model.
24

Table 2.1: Actual and predicted entry to various streams of service JSA 2009 – 2012 – new entrant population (percentages)
Stream 1 Stream 2 Stream 3 Stream 4
Predicted 53.0 22.0 10.0 15.0
Actual 2009 – 2012 52.2 28.5 10.9 8.5
Difference -0.8 6.5 0.9 -6.5
Note: These refer to inflows to service and will differ from percentage distributions for caseload.Source: Department of Employment administrative data and Department of Education, Employment and Workplace Relations, Request for tender for employment services 2009-12.
From July 2009 to June 2012, the active JSA caseload decreased from 751,881 to 739,455 (Figure 3.3). The caseload peaked at 828,475 in February 2010 and steadily decreased (apart from the seasonal December-January rises) to trough in November 2011 to 706, 889.
From the beginning of JSA on 1 July 2009 to the end of June 2012, there were over 2,357,100 referrals of job seekers to JSA providers. During the same period there were 1,263,099 job placements of which 1,042,292 could have resulted in paid 13-week employment outcomes. Of these, 480,048 resulted in 13-week employment outcomes and 312,558 resulted in 26-week employment outcomes. To put these outcomes in context, though, many job seekers in JSA were not likely to achieve outcomes which were payable to providers. These included job seekers who had flexible participation requirements such as parents and job seekers over 55 years old.
2.4 ConclusionThe economic environment in which the JSA model was conceived did not resemble the environment in which it was implemented. Prior to September 2008, economic and labour market conditions in Australia were exceptionally strong, but with the onset of the GFC world growth weakened dramatically and economic and labour market conditions in Australia softened. Therefore the JSA contract operated in far more turbulent conditions than had its predecessor, JNS.
The JSA programme introduced substantial changes to the objectives, priorities and operation of government-funded employment services. Compared with JNS, JSA was designed to place a greater emphasis on addressing skill shortages, social inclusion and assisting the more disadvantaged job seekers. JSA consolidated seven previously separate service contracts into one (Figure 1.2). The service delivery model changed from the time-based service continuum of the Active Participation Model (in JNS) to four streams of service each with two distinct service phases. Allocation of job seekers into Streams 1 to 3 was made using the JSCI and in the case of Stream 4 a JCA or ESAt.
Over the life of the contract, the JSA caseload dropped by 12,426, from 751,881 in July 2009 to 739,455 in June 2012. From the beginning of Job Services Australia on 1 July 2009 to the end of June 2012, there were over 2,357,100 referrals of job seekers to JSA providers.
25

3 Participation in Job Services Australia
3.1 IntroductionConnection with employment services is a first step to participation in the labour market. Both Job Network Services (JNS) and Job Services Australia (JSA) emphasised the importance of rapidly connecting job seekers to employment services.82 Centrelink, (now the Department of Human Services (DHS)), was the gateway to government-funded employment services for most job seekers under both service models. Under the JSA model, following initial connection, effective engagement with employment services relied on appropriate stream placement, sufficient face-to-face contact, good systematic monitoring and timely re-engagement actions. This chapter examines these aspects of JSA and compares the timeliness and rate of participation in JSA with JNS.
3.2 The Job Services Australia caseload and unemploymentAccording to departmental data, in August 2011 there were 724,825 job seekers on the JSA caseload. Australian Bureau of Statistics (ABS) Census data put the number of unemployed in August 2011 at 620,300.83
The discrepancy between the two numbers can be explained by substantial differences between the criteria for eligibility to receive JSA services and the ABS definition of being unemployed. An important distinction relates to working hours. It was possible to be employed less than full-time and still be active in JSA, whereas the ABS classifies people as employed if they worked for at least one hour in the reference week.
Another point of difference was around looking for work. Some job seekers in JSA had modified activity requirements which would be met by voluntary work or other activities such as study. These people were not necessarily actively seeking work and therefore not classed as unemployed according to the ABS definition. Such groups included job seekers in JSA aged over 55 and parents of young dependent children.
Conversely, many people who were unemployed by the ABS definition may not have been engaged with JSA at all. They included people whose personal (or partner’s) income precluded them from income support, or who did not meet assets test requirements. Many of these groups will find their own employment or use other private recruitment companies.
Commencements and exits in JSA largely reflect the pattern of movement of unemployment rates. (Figure 3.1). There were peaks in commencements around January/February each year which were preceded by drops in exits, coinciding with the influx of school leavers in the new-year. Monthly exits sat mainly above monthly commencements, leading to the overall drop in the caseload over the life of the JSA contract (Figure 2.4).
82 The term Job Network Services (JNS) is used when referring to Job Network and the relevant complementary services which JSA replaced.
83 DEEWR Administrative data and Australian Bureau of Statistics 2012, Labour Force, Australia, Cat No 6202.0, ABS, Canberra
26

Figure 3.1: JSA monthly commencements and exits and monthly unemployment rate, July 2009 to June 2012 (number and per cent)
0.0
1.0
2.0
3.0
4.0
5.0
6.0
7.0
8.0
9.0
10.0
0
10,000
20,000
30,000
40,000
50,000
60,000
70,000
80,000
90,000
Jul2009
Oct2009
Jan2010
Apr2010
Jul2010
Oct2010
Jan2011
Apr2011
Jul2011
Oct2011
Jan2012
Apr2012
Unem
ploy
men
t rat
e (p
er ce
nt)
Job
seek
ers (
num
ber)
Monthly exits Monthly commencements Unemployment rate
Note: Refer Appendix 2, Table A2.1.Source: Department of Employment administrative data and Australian Bureau of Statistics, Labour Force Australia, Cat. 6202, Nov. 2012.
3.3 CommencementThe way in which job seekers connected with employment services did not change substantially between JNS and JSA. In both, the process aimed to connect job seekers to employment services as soon as possible. This was the goal of RapidConnect (RC) in both JNS and JSA. RC applied to job seekers who were:
job ready fully eligible eligible to claim Newstart Allowance (NSA) or Youth Allowance (Other) (YA(O)) not subject to a RC exemption not subject to activity test exemptions.84
Eligible job seekers were to be given appointments with an employment service provider within two working days (best practice) or a maximum of 14 calendar days after their initial contact with Centrelink. The proportions of new entrant job seekers eligible for RC by Assessed Stream are shown in Table 3.1.
84 Activity test exemptions would have applied, for example, to job seekers in remote areas or, under JSA, to job seekers under 21 years of age already undertaking an approved activity such as an apprenticeship.
27
Table 3.1 JNS and JSA job seekers connected under RapidConnect (RC) new entrant populations by stream (per cent)
Assessed Stream JNS new entrant population JSA new entrant population
Stream 1 60.9 67.9
Stream 2 40.2 30.9
Stream 3 13.4 10.8
Stream 4 3.8 3.8
Total 50.5 57.0Note: Descriptions of comparable new entrant populations are in Appendix 1, Section 2.Source: Department of Employment administrative data.
RC job seekers commenced with employment services earlier than other job seekers under both JNS and JSA (Figure 3.2). Over 97 per cent connected within 14 days. For non-RC job seekers, 60 per cent of job seekers under JNS and 44 per cent under JSA connected within 14 days.
Figure 3.2: Time from registration for employment services to commencement in services for JNS and JSA and entry process (RapidConnect (RC) and Other) for new entrant populations (days and per cent)
0
10
20
30
40
50
60
70
80
90
100
1 8 15 22 29 36 43 50 57 64 71 78 85 92
Per c
ent
Days to commencement
JNS RapidConnect
JNS Other
JSA RapidConnect
JSA Other
Notes: 1. Descriptions of comparable new entrant populations are in Appendix 1, Section 2.2. Refer Appendix 2, Table A2.2.
Source: Department of Employment administrative data.
After adjusting durations for exemptions and suspensions from service, over 90 per cent of JNS and JSA job seekers entering under RC commenced with employment services within eight calendar days of registration. Overall, then, JSA and JNS were similar in their timeliness of connecting RC job seekers. JSA was however, less timely in the commencement of other job seekers.
While this was the case overall, in line with the focus on job seeker disadvantage, JSA was faster at connecting job seekers with the highest levels of labour market disadvantage (Assessed Stream 4 job seekers) (Table 3.2).
28

Table 3.2: Adjusted time taken from registration to connect 90 per cent of registrants to employment services – JNS and JSA by stream and entry process for new entrant populations (days)
Assessed Stream JNS RapidConnect
JNS Other
JSA RapidConnect
JSA Other
Stream 1 7 55 8 65
Stream 2 7 50 9 72
Stream 3 14 57 10 86
Stream 4* n.a. 134 n.a. 107
Total 7 58 8 73Notes:1. Small numbers of job seekers in these groups were eligible for RC.2. n.a. Not applicable.3. Time to commencement is adjusted by subtracting days in which a job seeker was on either a suspension or an
exemption (except for exemptions under JNS to participate in PSP or JPET), excluding volunteer periods. 4 Descriptions of comparable new entrant populations are in Appendix 1 Section 2.Source: Department of Employment administrative data.
3.4 Stream allocation
3.4.1 Streams 1 to 3On average, JSA new entrant job seekers had more Job Seeker Classification Instrument (JSCI) assessments per period of assistance than new entrant job seekers in JNS. Stream 1 and 2 job seekers in JSA were about twice as likely as comparable JNS job seekers to be reassessed during their period of assistance as being more highly disadvantaged.85 New entrant job seekers in both employment service models initially assessed as Stream 3 (or equivalent JNS) were less likely to be reassessed as requiring assistance in a higher stream, reflecting the fact that they were already receiving a high level of service and to upstream them would require an Employment Services Assessment (ESAt).
That so many new entrant job seekers were reassessed as requiring higher levels of assistance implies one or more of the following:
• job seekers’ circumstances changed
• the JSCI assessment was not applied thoroughly in the first instance
• it took time for job seekers to disclose barriers to employment to their provider. In this circumstance, subsequent reapplication of the JSCI might identify more barriers than were disclosed in the initial JSCI assessment.
Quality audits of the JSCI in 2010 found that the initial JSCI was streaming job seekers correctly in most cases (over 90 per cent). Qualitative evidence collected in 2010 confirmed that job seekers are often reticent to disclose barriers until they develop a rapport with their service provider. Together these indicate that there may be room for improvement in the way the initial JSCI is conducted to support early disclosure of barriers. There is also a financial incentive for providers to have job seekers reassessed in order to upstream. This makes the provider eligible for higher outcome payments.
85 Twenty-two per cent of job seekers in Assessed Stream 1 and 26 per cent of those in Assessed Stream 2 were reassessed during their period of assistance as requiring assistance in a higher stream, compared with 9 per cent and 14 per cent respectively of job seekers of comparable levels of labour market disadvantage in JNS.
29

3.4.2 Job Services Australia caseload by streamFrom July 2009 JNS job seekers were progressively transitioned to JSA services. The transitional arrangements allocated job seekers to JSA streams, based on their level of disadvantage. This was measured by the JSCI, a Job Capacity Assessment (JCA) if appropriate, length of unemployment and whether or not they had been referred to or were participating in the Personal Support Programme (PSP) or Job Placement, Education and Training Programme (JPET). Transitional arrangements were such that almost all job seekers were in the new employment services by the end of December 2009.
The expected distribution of new entrant job seekers by stream was very different from the actual distribution of clients who joined JSA in the transition period from July 2009 to January 2010 (Table 2.1).86 This was mainly due to two opposing factors. Firstly, the economic downturn caused by the Global Financial Crisis (GFC) increased unemployment among the relatively less disadvantaged (more employable) labour market participants. This acted to shift the overall distribution of JSA clients towards Stream 1. Secondly, in April 2009 some job seekers were given immediate access to intensive assistance in response to the economic downturn.87 This reduced the relative size of Stream 1 and increased the size of Stream 2, relative to Stream 1.88 The result of changes in the JSA caseload composition following the GFC, particularly with regard to gender and duration of unemployment, was that job seekers experienced different barriers to employment than were expected at the time of the tender process.
The downturn coincided with a marked change in the gender composition of the job seeker population. Between 2004 and late 2007, there was growth in absolute and relative numbers of women using employment services, especially women aged over 30. This was mainly attributable to changes in Parenting Payment (PP) rules. In the final months of 2008 men of prime working age (25–45 years) became the major clients entering employment services.
Prior to the GFC, a higher number of job seekers in employment services had relatively little recent work experience, especially full-time work. Most new clients required comprehensive reintegration into the labour market in order to take advantage of the employment growth in that period. During the downturn, both actual job losses and a scarcity of vacancies meant that a larger proportion of job seekers entering employment services had recent work experience, yet despite this became and remained unemployed.89
The total number of job seekers in JSA over the contract period exhibited seasonal peaks in January/February of each year (associated with school leavers) and falls throughout the rest of the calendar year (Figure 3.3). In 2012, the usual February increase occurred, but the expected fall throughout the year had not occurred by June. One explanation for this 2012 phenomenon is that overall unemployment, as estimated by the ABS, rose and remained elevated until June 2012 making it difficult to lower overall job seeker numbers.
86 DEEWR, 2011. The Impact of the Global Economic Downturn on Job Services Australia, July 2009 – January 2010. Canberra.
87 Two groups of new entrants to unemployment assistance were eligible for immediate access to intensive assistance: direct entry to Stream 2 or higher. These were workers made redundant on or after 24 February and young people under the age of 21 years who were granted (YA(O)) after 1 July 2009 and who did not have a Year 12 or equivalent level of educational attainment.
88 DEEWR, 2011. The Impact of the Global Economic Downturn on Job Services Australia, July 2009 – January 2010. Canberra.
89 DEEWR, 2011. The Impact of the Global Economic Downturn on Job Services Australia, July 2009 – January 2010. Canberra.
30

Figure 3.3: Job Services Australia job seekers by stream, July 2009 to June 2012, active caseload (number)
0
100,000
200,000
300,000
400,000
500,000
600,000
700,000
800,000
900,000
Jul-09 Oct-09 Jan-10 Apr-10 Jul-10 Oct-10 Jan-11 Apr-11 Jul-11 Oct-11 Jan-12 Apr-12
JSA
case
load
Eligibility yet to be determined Stream 1 (Limited) Stream 1 Stream 2 Stream 3 Stream 4
Notes: 1. ‘Stream 1 (Limited)’ participants comprised not fully eligible participants (such as those not working or studying full-
time and not receiving activity tested income support, and who wished to volunteer into JSA to get help finding get a job).
2. Refer Appendix 2, Table A2.3.Source: Department of Employment administrative data.
There were changes in stream profile over the period of operation, particularly for Streams 1, 2 and 4. At July 2009 Stream 2 represented just 16.2 per cent of the caseload. This increased rapidly until January 2010 when it reached 27.8 per cent. This was a result of the automatic access to Stream 2 provided to redundant workers as a response to the GFC. Under the ESL policy some youth were also given early access to Stream 2 services. The opposite effect occurred for Stream 1 which dropped from 40.2 per cent in July 2009 to 29.6 per cent in January 2010. While some rebalancing did occur, the contract ended with many more job seekers in higher streams. This was not only a result of the redundant workers policy, but also a natural build-up in JSA of job seekers who in general left service at lower rates (such as job seekers in higher streams). For example, the proportion of the caseload assigned to Stream 4 increased steadily through the first two years of the JSA period following the staged transition of highly disadvantaged job seekers from JNS. Job seekers facing challenges in the labour market are discussed further in Chapter 7.
3.5 Engagement and compliance To enable JSA providers to assist clients into employment, job seekers needed to remain actively engaged. Job seeker engagement and compliance rules and guidelines seek to:
• reduce the length of time that job seekers wait before receiving assistance
• maintain an appropriate level of contact between a job seeker and their provider
• minimise the period of disconnection when a job seeker fails to attend appointments.
31

Both JNS and JSA used job seeker interviews as a form of activation and compliance monitoring.
Evidence from Australian and overseas studies indicate that purposeful interviews are effective at maintaining engagement.90 91
3.5.1 Contact between providers and job seekersThe focus of the following analysis is on face-to-face contact after the initial contact.92 Note that the data analysis is not suitable for assessing providers’ compliance with minimal contact requirements.93
The rate and distribution of interviews was affected by the incentives for providers to achieve outcomes and the minimum contact requirements. Contractual minimum contact requirements in JNS and JSA 2009 – 2012 varied depending on the job seeker’s programme of assistance, assessed level of disadvantage, phase, or length of time in assistance and personal characteristics. Providers had some discretion to account for individual needs and local labour market conditions.
This analysis focuses on appointment attendance. The number of appointments made by providers but not attended by job seekers is not analysed (though it is known that approximately 40 per cent of scheduled appointments were not attended).94 Assessed Stream was used to compare new entrant job seekers with similar levels of labour market disadvantage in the two programmes. Details on the methodology for comparing job seekers between JNS and JSA can be found in Appendix 1 Section 2.
Overall, job seekers in JSA met with their providers more frequently than job seekers in JNS. This finding holds across all benefit types (Table 3.3).
Table 3.3: Average time between attended interviews after commencement with providers during first 12 months after registration by stream for new entrant populations (weeks)
Assessed Stream JNS JSA Difference
Stream 1 8.1 5.9 2.2
Stream 2 6.3 3.6 2.7
Stream 3 4.3 3.7 0.6
Stream 4 4.8 3.3 1.6
Overall 7.3 5.4 1.9Notes:1. Because this analysis focuses on ongoing contact, only job seekers who had been engaged for at least two weeks and
had at least one interview following their initial one are included.2. Time periods are adjusted for time-outs (exemptions and suspensions) from service.3. The interview rates were calculated to allow comparisons in ongoing contact rates between JNS and JSA and not to
assess provider compliance with contractual requirements.4. Job seekers who had temporary changes in activity requirements during their registrations included.5. Based on new entrant populations defined in Appendix 1 Section 2.
Source: Department of Employment administrative data.
90 Davidson, P, 2013. Is Job Services Australia made to measure for disadvantaged jobseekers? Paper presented at Employment Services for the Future Conference, Centre for Public Policy, University of Melbourne. Accessed November.
91 DEEWR, 2007. Active participation model evaluation: July 2003 – June 2006, Canberra.92 According to Employment Services Deed 4 (ESD4), interviews were to be conducted by face-to-face interview rather
than other methods of contact.93 The contact rates reported here cannot be validly used to assess provider compliance with contractual requirements.
The main differences include: the JNS rates include: job seekers who were in complementary programmes and who may have had fewer contact requirements; changes over time in job seekers’ streams were not taken into account; and providers were encouraged to customise contact rates to meet a job seekers needs.
94 Attendance rates are from Table A3 in the annexure to the Independent Review of the Job Seeker Compliance Framework.
32

Attendance patterns varied by stream, consistent with the phases of assistance, and the objective of JSA to increase the focus on the most disadvantaged job seekers.
Stream 1 and 2In Stream 1 the initial rate of contact with providers started low and increased in weeks 12 to 14 because contact requirements were lower in the first three months of assistance for JSA Stream 1, and JNS Stream 1 type job seekers.95 An increase in contact for JNS in the fourth month corresponded with the movement of less disadvantaged job seekers into their first phase of Intensive Support job search training (ISjst) during which there was a fortnightly minimum contact requirement.
JNS Stream 1 and 2 type job seekers were generally in the Job Search Support Service phase for the first three months. Streams 1 and 2 type job seekers in JNS had a higher rate of interviews in the fourth month of service than in JSA. JNS providers were required to meet with Stream 1 and 2 type job seekers three times in the first three months, until the commencement of ISjst. In JSA Stream 1 job seekers had a requirement of monthly contact from the fourth month onwards and a skills assessment requirement before the end of the 17th week of service.
Compared with JNS, JSA had a much higher interview rate (more than double) for Stream 2 type job seekers in their first three months of service, reflecting the different minimum contact requirements for the models. In JSA the minimum contact requirement for Streams 2 to 4 was constant over time at one contact each month. By contrast the JNS minimum contact requirements were lower in the first three months and intensified around week 13 when the ISjst requirement started.
95 Unlike the previous analysis of intervals between interviews, this analysis of rates of interviews attended per fortnight is not adjusted for suspensions from service, and therefore will tend to overestimate contact rates for JSA relative to JNS.
33
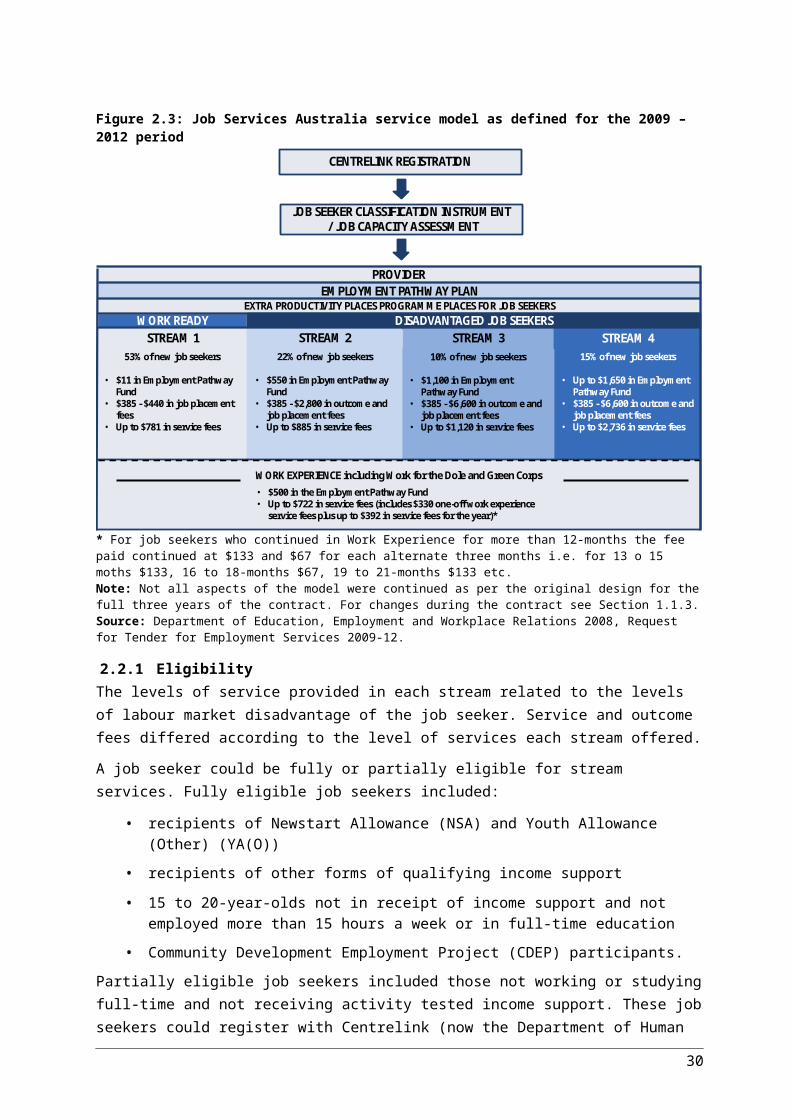
Figure 3.4: Proportion of job seekers that attended an interview by fortnight, Assessed Stream 1 JSA and JNS job seekers for new entrant populations (per cent)
0%10%20%30%40%50%60%70%80%90%
2 6 10 14 18 22 26 30 34 38 42 46 50 54 58Prop
ortio
n of
job
seek
ers t
hat
atten
ded
an in
terv
iew
in th
e fo
rtni
ght
(per
cen
t)
Fortnights since first attended interview
JNS Stream 1 JSA Stream 1
Notes:1. To allow comparison between JNS and JSA, the number of interviews per fortnight has been adjusted by the number of
job seekers who were in service during that fortnight. The actual number of interviews held in any period will depend on the number of job seekers still in service.
2. Based on interviews attended.3. Descriptions of comparable new entrant populations are in Appendix 1 Section 2.4. Refer Appendix 2, Table A2.4.Source: Department of Employment administrative data.
Figure 3.5: Proportion of job seekers that attended an interview by fortnight, Assessed Stream 2, JSA and JNS job seekers for new entrant populations (per cent)
0%10%20%30%40%50%60%70%80%90%
2 6 10 14 18 22 26 30 34 38 42 46 50 54 58Prop
ortio
n of
job
seek
ers
that
att
ende
d an
inte
rvie
w in
the
fort
nigh
t (p
er c
ent)
Fortnights since first attended interview
JNS Stream 2 JSA Stream 2
Notes:1. To allow comparison between JNS and JSA, the number of interviews per fortnight has been adjusted by the number of
job seekers who were in service during that fortnight.2. Based on interviews attended.3. New entrant populations are described in Appendix 1 Section 2.4. Refer Appendix 2, Table A2.4.Source: Department of Employment administrative data.
34

Stream 3Stream 3 job seekers had a relatively constant contact rate after the first two months of service for both JNS and JSA. While JNS had a higher rate of contact than JSA in the first few weeks, beyond that there is little difference from JSA in the timing of interviews for Assessed Stream 3 job seekers. Interview rates spiked in week three to four in both models. JNS recorded a second peak in the fourth month.
Figure 3.6: Proportion of job seekers that attended an interview by fortnight, Assessed Stream 3 JSA and JNS job seekers for new entrant populations (per cent)
0%10%20%30%40%50%60%70%80%90%
2 6 10 14 18 22 26 30 34 38 42 46 50 54 58Prop
ortio
n of
job
seek
ers
that
att
ende
d an
inte
rvie
w in
the
fort
nigh
t (p
er c
ent)
Fortnights since first attended interview
JNS Stream 3 JSA Stream 3
Notes: 1. To allow comparison between JNS and JSA, the number of interviews per fortnight has been adjusted by the number of
job seekers who were in service during that fortnight.2. Based on interviews attended.3. New entrant populations are defined in Appendix 1 Section 2.4. Refer Appendix 2, Table A2.4.Source: Department of Employment administrative data.
Stream 4Stream 4 JSA job seekers had a higher contact rate in the first month following their initial interview than equivalent job seekers under JNS. After the first three months, the interview rate was relatively constant and similar for JNS and JSA job seekers.
The increase in the intensity of interviews early in service for Stream 4 type job seekers is consistent with previous findings that more time and effort is required to increase engagement and support of highly disadvantaged job seekers.96 This reflects the objectives of the new contract suggesting that, in this aspect, JSA was operating the way it was designed.
96 DEEWR, 2013. Better practice Guide 3: Job Seeker Contact. Canberra.
35
Figure 3.7: Proportion of job seekers that attended an interview by fortnight, Assessed Stream 4 JSA and JNS job seekers for new entrant populations (per cent)
0%10%20%30%40%50%60%70%80%90%
2 6 10 14 18 22 26 30 34 38 42 46 50 54 58
Prop
ortio
n of
job
seek
ers
that
att
ende
d an
inte
rvie
w in
the
fort
nigh
t (pe
r cen
t)
Fortnights since first attended interview
JNS S4 JSA S4
Notes: 1. To allow comparison between JNS and JSA, the number of interviews per fortnight has been adjusted by the number of
job seekers who were in service during that fortnight.2. Based on interviews attended.3. New entrant populations are defined in Appendix 1 Section 2.4. Refer Appendix 2, Table A2.4.Source: Department of Employment administrative data.
Under certain circumstances, JSA providers could claim Employment Pathway Fund (EPF) payments for additional contacts within a 13-week service period.97 The evaluation found no evidence of providers charging for additional but perhaps unnecessary interviews through this mechanism.
3.5.2 Attendance at interviewsAttendance rates appear to have slowly increased since 2006, however the improvement was small and inconsistent. The APM evaluation report gave a monthly average attendance rate of 54 per cent over the period.98 Published data on interviews between 2008 and 2012 show that average attendance rates varied between 55 and 59 per cent.99 Excluding initial interviews and considering the new entrant population, the attendance rate was slightly higher (Figure 3.8). The trend for the first 18 months of service for new entrants was very similar to that for the caseload-based rates which included more long-term unemployed (LTU) job seekers.100
97 Providers could claim payment through the EPF for an additional contact after they made six contacts in a 13-week period for job seekers in Streams 1–4 (except for the first 13-week period for Stream 1). Providers could claim from the EPF for the cost of additional contacts under the WEPh once they met with a job seeker more than twice in a 13-week period: DEEWR, 2009, Request for Tender for Job Services Australia 2009 – 2012.
98 DEEWR, 2007. Active participation model evaluation: July 2003 – June 2006, Canberra.99 Caseload Interview Attendance data is from DEEWR, 2012, Updated Disney Annexure. 100 See Appendix 1 Section 2 for more information about new entrant populations.
36
Figure 3.8: Attendance at appointments with providers 2008–2012 by quarter, Caseload and new entrant populations (per cent)
40
45
50
55
60
65
Per c
ent o
f app
oint
men
ts a
tten
ded
Caseload based New entrants
Notes: 1. The caseload data includes initial interview appointments, whereas the new entrant population excludes initial
appointments.2. There was a gap in the inflow data in 2009 during the transition period between JNS and JSA.3. Descriptions of comparable new entrant populations are in Appendix 1 Section 2.4. Refer Appendix 2, Table A2.5.Source: Caseload data is derived from Table A3 in the annexure to the Independent Review of the Job Seeker Compliance
Framework (Disney, 2010) and new entrant population is based on departmental administrative data.
Under the initial JSA rules, a Participation Report (PR) could be produced if appointments and compulsory activities were not attended and the provider considered there was no valid reason for non-attendance. The submission of a PR by the provider was discretionary under most circumstances. In all cases though, the provider was required to record failure to attend interviews. Failure to attend a compulsory activity was not necessarily recorded unless the provider submitted a PR. Other options included rescheduling the activity. PRs also existed under JNS.
Rates of attendance at follow-up interviews varied systematically by stream. These rates were also affected by changes to the compliance rules. In light of rising numbers of PRs, an independent review of the compliance regime was undertaken. Following this review, in July 2011 the rules on non-attendance were tightened and the consequences of non-compliance made more immediate.
In the 12 months after the changes, attendance rates were 2 percentage points higher than those recorded in the 12 months prior to the changes.
3.5.3 ComplianceDifferences in the nature of the compliance systems between JNS and JSA make them difficult to compare. In addition, rules changed during the JSA contract period and Centrelink and employment providers continued to adapt their processes through at least the first year of the programme.101
An Independent Review of the Job Seeker Compliance Framework by Disney et al. (2010) contains a substantial amount of information on how the JSA compliance framework functioned during the first
101 Disney et al 2010. Impacts of the new Job Seeker Compliance Framework: the report of the independent review.
37
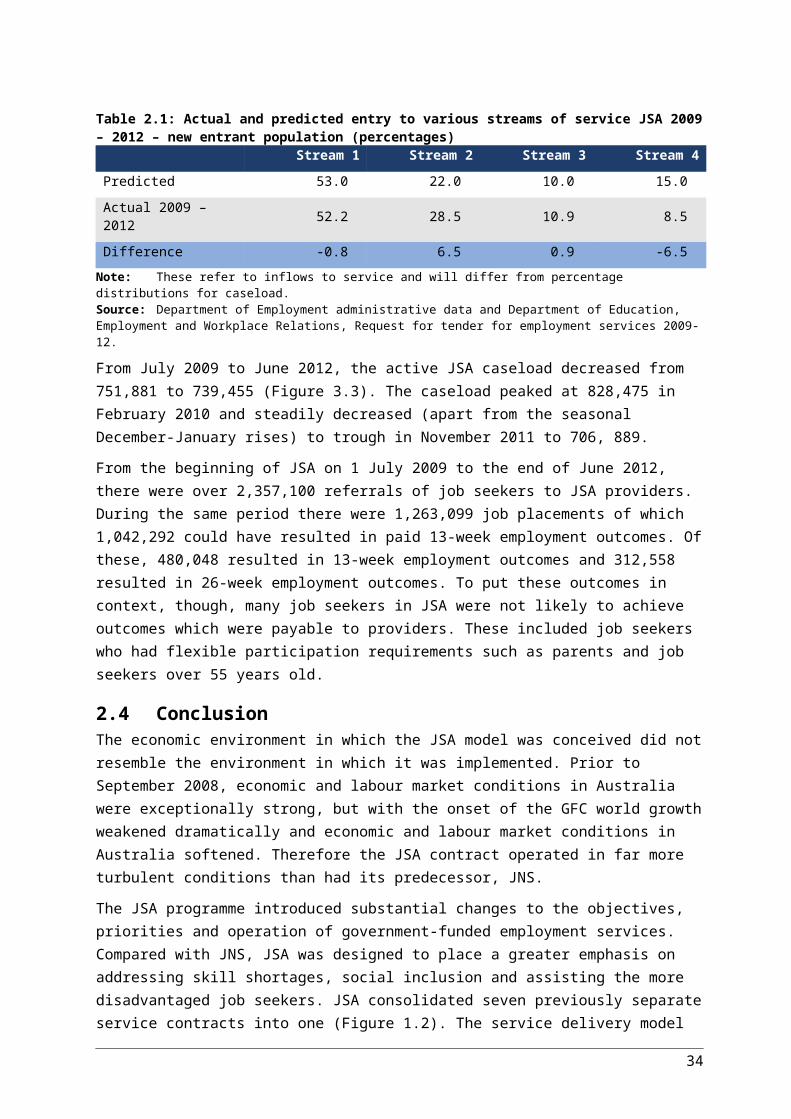
year of operation. The following analysis draws on information from this review and further departmental analysis.
Changes in the Compliance Framework between Job Network and Job Services AustraliaThe JSA compliance system was designed to be more responsive to the needs of an increasingly disadvantaged job seeker population. JSA used early intervention and re-engagement strategies to encourage compliance.
To prevent vulnerable job seekers from being subject to inappropriate compliance action, the first JSA contract allowed providers and Centrelink more discretion. The mandatory eight-week non-payment penalties for a third or subsequent failure to attend an appointment or an activity that had applied under JNS were considered inappropriate for highly disadvantaged job seekers and were removed under JSA. Comprehensive Compliance Assessments (CCAs) were introduced and requirements were more tailored.
Key components of JSA 2009 – 2012 compliance model were PRs, Contact Requests (CR), CCAs, and compliance activities (Figure 3.9). Eight-week non-payment periods for non-compliance could be imposed but payments could be reinstated if compliance commenced.
Participation Reports: PRs were made by providers to Centrelink. They informed Centrelink of job seeker non-compliance. The Independent Review of the Job Seeker Compliance Framework provides extensive analysis of the role of PRs in monitoring job seeker participation and the way they were used in the first year of JSA.102
Contact Requests: A CR was an alternative to compliance action. A provider could choose to submit a CR to Centrelink requesting assistance in establishing contact with a job seeker who failed to meet their participation requirements.
Comprehensive Compliance Assessments: A CCA was automatically triggered when a job seeker incurred three applied failures in a six-month period. The three failures must have been of the same type – for example, for failing to attend appointments (Connection or Reconnection failures) three times, or for three ‘No Show, No Pay’ failures. The assessment examined the reasons for the job seeker’s failure to meet their requirements, identified barriers to compliance and if appropriate, the job seeker was referred to more appropriate service options. A Serious Failure (an eight-week non-payment penalty) was applied in instances where it was determined that the pattern of non-compliance constituted persistent and wilful non-compliance. Providers and Centrelink could also request a CCA if they did not know why a job seeker was continually failing to comply with their participation requirements.
Eight-week non-payment periods: Eight-week non-payment periods were applied to job seekers where a CCA had shown a job seeker to have been persistently and wilfully non-compliant.
Compliance activities: Any job seeker who incurred an eight-week non-payment period penalty for a serious failure could have their payment reinstated if they agreed to undertake a Compliance Activity. If the job seeker did not commence the activity as agreed, their eight-week penalty was reimposed. If
102 Disney et al, 2010. Impacts of the new Job Seeker Compliance Framework: the report of the independent review.
38

Figure 3.9: Generation of Contact Requests, Participation Reports and Comprehensive Compliance Assessments under the 2009–2011 Job Services Australia compliance framework
If a job seeker had failed to attend an appointment without valid reason three times, a CCA was triggered.If a job seeker refused a suitable job, or voluntarily left a suitable job, the Provider had to submit a PR.
Successful contact Unsuccessful contact
No serious compliance action
Valid reason Invalid reason
Provider used discretion to decide whether to create CR/PR
No PR created
Centrelink decided whether to uphold PR/CR
PR created CR/PR created
Provider attempted to contact job seeker
Job seeker did not comply with participation requirements
Provider used discretion to decide whether to create PR
Note: CCA: Comprehensive Compliance Assessment. PR: Participation Report. CR: Contact Request.Source: Department of Employment JSA Employment Services Deed 2009–2012.
39

a job seeker commenced but did not continue an agreed activity, they could incur a ‘No Show, No Pay’ penalty.
If a job seeker incurred an eight-week non-payment penalty they could have their payment reinstated if they did not have the capacity to undertake a Compliance Activity and they were in severe financial hardship.
Effectiveness of the initial changes in compliance from Job Network to Job Services AustraliaIn the JSA model the primary intent of the job seeker compliance framework was to incentivise job seekers to comply with the requirements of their provider or Centrelink. For non-compliant job seekers, the system was designed to rapidly encourage future compliance.
Time to re-engagement could therefore be used to measure the effectiveness of a compliance system. The following analysis compared the length of time it took for job seekers who missed an appointment to attend their next appointment under JNS and JSA as an indicator of the relative effectiveness of the compliance frameworks.
Median time between a missed appointment and the next attended appointment over the first 18 months of service was two to three working days shorter under JNS (11 to 16 days compared with 13 to 19 days for JSA). The reasons for this are likely twofold. Firstly, the JSA population is more disadvantaged, and therefore more difficult to re-engage. Secondly the nature of the compliance framework under JSA meant the penalties under JSA were less severe than under JNS.
3.5.4 Revised compliance arrangements (implemented on 1 July 2011)Revised compliance arrangements (implemented on 1 July 2011) are described in Section 1.1.3. The following analysis uses the number of work days between a missed appointment – or the first in a series of missed appointments – and the first subsequently attended appointment, to measure the impact of these changes. The analysis was restricted to job seekers on income support with participation requirements. Data from caseload records for the 12 months before the changes was compared with data for the 12 months after the changes.
Overall, job seekers re-engaged faster after the 1 July 2011 changes though the extent of these changes varied according to stream (Table 3.4). There was a reduction in the number of work days before a reconnection interview for all streams, with Stream 4 reducing by 6.5 days on average (from 33 days to 26 days).
Table 3.4: Changes in length of disengagement following July 2011 compliance, caseload (work days)Stream Difference in average Difference in median
Stream 1 5.1 4
Stream 2 5.0 4
Stream 3 5.9 5
Stream 4 6.5 5Notes: 1. Positive values indicate that duration shortened after change.2. Connection includes re-engagement associated with an appointment triggered by a Contact Request.Source: Department of Employment administrative systems.
40
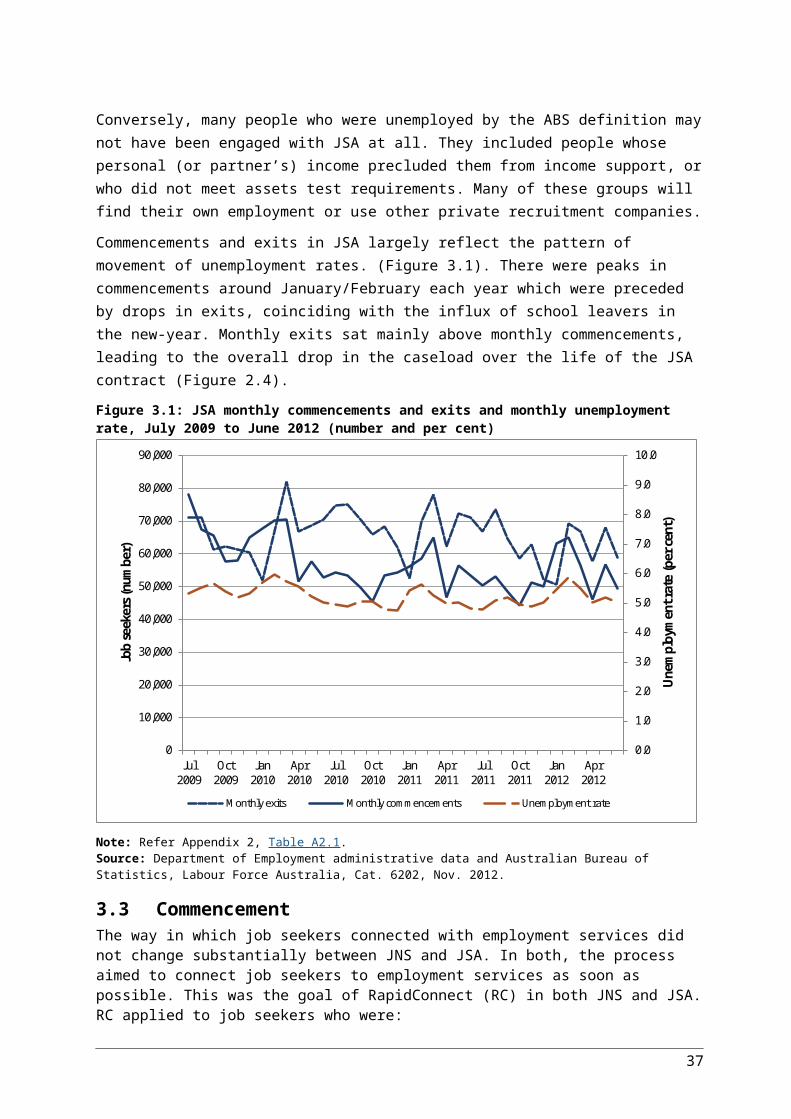
This improvement in time to reconnection is likely a combination of several factors including:
• changes in the compliance arrangements
• publicity around the changed arrangements
• differences in the characteristics of job seekers who incurred PRs before and after the changes.
With the broadening of the circumstances prompting a PR in 2011, job seekers who were more likely to be compliant would have received a PR (whereas prior to the 2011 changes they would not). These largely more compliant job seekers would have been more likely to attend reconnection interviews.
3.5.5 Return to service (Churn)Return to service, or ‘Churn’ in the employment services context, refers to job seekers cycling in and out of service (or unemployment). Churn can be influenced by a number of factors, including the employment service delivery model, macroeconomic conditions and the prevalence of different types of job seeker. Higher levels of churn by some disadvantaged demographic groups, such as the low paid and people with low skills, is documented.103 This means that differences in the makeup of job seeker populations will affect the overall level of churn.
While return to service is commonly seen as a negative outcome, this is not always the case. Many job seekers re-enter employment services multiple times as, for instance, they experience repeated periods of unemployment or enter or leave employment services for other reasons. The reasons job seekers ‘churn’ through services should be considered before assuming it to be a negative outcome. It may indicate a move from being completely disengaged from the workforce (not in the labour force) interspersed with periods of engagement with services. In these cases entry into services is positive, as it indicates greater engagement. In other cases, a return to unemployment may follow a period of employment in which case the return to service is negative.
Around 26 per cent of the JNS and 17 per cent of the equivalent JSA new entrant populations had more than one period of assistance within the period of comparison (Table 3.5).104
Table 3.5: Number of periods of assistance per job seeker JNS and JSA new entrant populations (per cent)Number of periods of assistance JNS JSA
1 73.7 83.1
2 20.3 15.5
3 4.9 1.4
4 or more 1.2 0.0Average number of periods of assistance 1.3 1.2
Note: Descriptions of comparable new entrant populations are in Appendix 1 Section 2.Source: Department of Employment administrative data.
103 Watson, I 2008. Low Paid Jobs and Unemployment: Churning in the Australian Labour Market, 2001 to 2006, Australian Journal of Labour Economics, Vol 1, No 1, pp 71–96.
104 See Appendix 1 Section 2 for details on new entrant populations.
41

The higher proportion of JNS job seekers re-registering in the study period was likely due to a combination of factors including:
• changes in administrative procedures and data recording
• the operation of Job Placement Licensed Organisations (JPLOs) under the JNS model. JPLO placements were more likely to be for short-term and temporary positions.
It was not possible to quantify the extent to which these factors affected rates of return to service in JNS.
Departmental analysis of Stream 2 type job seekers also found that JNS job seekers who had left income support 18 months after registration were more likely to return to income support within six months than those under JSA. This, along with the evidence from the new entrant comparisons presented in Table 3.5, provides some evidence to support the finding of lower churn in JSA than JNS. As noted, there are many other factors that affect churn besides the employment service delivery model.
An analysis of Stream 3 and 4 job seekers who achieved job placements under JSA found that placement in short-term jobs gives job seekers an advantage when they attempt to secure and sustain future job placements (Table A2.6). External research from Australia and overseas has made similar findings.105 106 Departmental research found that the likelihood of getting a longer-term job placement increased when the number of short-term placements increased, but the incremental benefit plateaued when job seekers had four or more unsustained job placements. After four unsustained job placements there is a likely scarring effect, as job seekers lose hope for more sustained employment.
3.6 ConclusionConnection with an employment services provider is the first step to participation in the labour market. Overall, JSA and JNS were similar in the time they took to commence job seekers eligible for RapidConnect, (essentially job seekers with participation requirements). JSA had a higher proportion of job seekers connected under RC. For other job seekers, commencements in JSA were slower on average than JNS. Stream 4 job seekers were the exception as they connected faster in JSA.
The proportion of caseload assigned to Stream 4 stabilised at around 20 per cent after increasing steadily through the first two years of the JSA period following the staged transition of highly disadvantaged job seekers from JNS.
Job seeker engagement as measured by attendance at provider interviews was higher under JSA Streams 2, 3 and 4 type job seekers. New entrants to JSA met with their providers more during their first 12 months of service than similar job seekers in JNS.
The timing of provider contact varied substantially between models. Interview requirements in JSA and JNS for Stream 1 type job seekers after the fourth month of service were very similar. For Stream 1 type job seekers there was a peak in appointments in JSA and JNS, at around 12 to 14
105 Buddelmeyer, H and Wooden M, May, 2008. Transitions from Casual Employment in Australia, Melbourne Institute Working Paper 7/08.
106 Zijl, M, van der Berg, G and Heyma, A, August, 2004. Stepping Stones for the Unemployed: The Effect of Temporary Jobs on the Duration until Regular Work. University of Amsterdam, IZA Discussion Paper No. 1241.
42

weeks in service. For Stream 1 job seekers under JSA there were minimal service fees and no EPF credits in the first 13 weeks of service. Service fees increased in the second 13-week period of service, with a skills assessment required to be completed before the end of the fourth month of service. Additionally, job placements achieved in the first 13 weeks of service were not eligible for job placement fees or outcome payments and therefore there was little incentive for early servicing. Stream 1 type job seekers in JNS moved into ISjst around the three-month mark so patterns of interaction were similar for the models though the reasons were quite different.
Stream 2 job seekers in JSA tended to see their providers more often and earlier than equivalent job seekers in JNS. Stream 4 job seekers in JSA tended to have more face-to-face contact in the first three months than their counterparts in JNS. The timing of interactions were consistent with the nature of incentives for achieving outcomes combined with minimum contact requirements.
Interview attendance increased by a few per cent after changes in the compliance rules in 2011. In particular, the time to re-engagement after a missed appointment improved for all streams, especially for Stream 4 job seekers.
Fewer job seekers had multiple periods of service in JSA compared to JNS. However, this may be due to administrative and data recording changes in combination with the cessation of JPLOs. There was evidence that JNS also had a higher return to income support rates. The combination of these findings suggests that there was less churn occurring in JSA than had occurred in JNS.
Multiple periods of assistance may be associated with having a few short-term job placements, which is not necessarily a negative outcome. People with no history of work or no recent work experience can take time to develop work habits, confidence and present well to employers. In addition, it may take several jobs to arrive at a good job match. For some job seekers, particularly the LTU, this takes time and resilience. Stream 3 and Stream 4 job seekers who had several short-term job placements had a higher likelihood of achieving ongoing employment in the longer-term. (The likelihood of long-term success appears to decrease with each additional job placement over four placements). This evidence, that re-engagement in employment services can increase a person’s long-term prospects means ‘churn’ is not always a negative indicator.
43

4 Service planning and delivery
4.1 IntroductionA key feature of the Job Services Australia (JSA) model was providing services in accordance with a job seeker’s assessed level of disadvantage through service streams. Fully eligible job seekers were allocated to one of four main streams, (Streams 1 to 4).107 Stream allocation was determined by the job seeker’s level of labour market disadvantage, or barriers to employment. Stream 1 job seekers were the most job ready and were therefore likely to require the least assistance to find employment. Streaming determined the amount of Employment Pathway Fund (EPF) money which was notionally credited for a job seeker and the fee structure for outcome payments the provider received. Figure 2.3 shows the various notional EPF credits, service fees and outcome payments prevailing in the JSA 2009 – 2012 contract.
Outcome payments were higher for job seekers in higher streams, in recognition of the increased difficulty of getting more disadvantaged job seekers into work. For example, a higher 13-week outcome fee was payable for getting a Stream 3 job seeker into work than for a Stream 1 job seeker, even if they had both been unemployed for a year. This recognised that more effort was likely required to achieve this outcome than for the more ‘job ready’ Stream 1 job seeker.
As well as services for fully eligible participants, Stream 1 Limited service was available for job seekers who were partially eligible for stream services, such as those not working or studying full-time and not receiving activity tested income support, and who wished to volunteer into JSA.
The expected level of service for each stream is set out the service guarantees. They were deliberately not prescriptive to allow for individual tailoring of assistance.
Because the JSA service model was flexible, there was no ‘typical’ way a job seeker might progress through service. Ideally, a job seeker entered service and had their barriers to employment addressed – these barriers will have been identified through information obtained in the Job Seeker Classification Instrument (JSCI) and/or Employment Services Assessment (ESAt). The job seeker could receive education and training for identified skills gaps and job search assistance to attain a job placement. The placement may be achieved as a result of reverse marketing or through a wage subsidised placement. Depending on their length of time in service, the job seeker may also have entered the Work Experience Phase (WEPh), have completed volunteer work, a training activity, a job placement or Work for the Dole (WfD) (Figure 4.1). Depending on their level of engagement, the emergence of new barriers or number of placements, the job seeker may have had more than one period in service, and may have moved into a higher stream, even during one service period.
107 Fully eligible job seekers included: recipients of Newstart allowance (NSA) and Youth Allowance (Other) (YA(O)); recipients of other forms of qualifying income support; 15 to 20-year-olds not in receipt of income support and not employed more than 15 hours a week or in full-time education; and CDEP participants.
44

Figure 4.1: How a job seeker might progress through JSA and the types of assistance available (as needed)
In the JSA model Employment Pathway Plans (EPP) and the EPF were two critical elements of stream service delivery that encouraged tailored service for individual job seekers. While the EPP was a key planning tool which set out an individualised pathway to employment, the EPF offered a flexible pool of funds that providers could draw on to purchase vocational and non-vocational goods and services to assist job seekers into employment.
Most job seekers underwent a Stream Service Review (SSR) following 12 months in a stream of service. As a consequence of the SSR, job seekers most likely progress to the WEPh (unless they are referred to a different stream or are Stream 4 job seekers whose SSR found that they would benefit from an extra six months in stream services). The WEPh was designed to allow job seekers to gain work experience to enhance their chance of finding employment.
The critical differences between the JSA and the JNS108 model were that the JNS model provided a continuum of assistance interspersed with periods of Mutual Obligation which commenced after six months in service. In JNS highly disadvantaged job seekers were moved into Intensive Assistance phases earlier in their period of unemployment than those who were not highly disadvantaged. Regardless, the major determinant of the type of service under JNS was the length of time job seekers had been unemployed. This compares with JSA where the main determinant of service was the level of disadvantage of the job seeker. The Active Participation Model (APM) in JNS had a ‘work first’ focus as set out in its objectives which were to:
• increase the effectiveness of employment services in securing employment and other positive outcomes for job seekers
• ensure that job seekers who remain unemployed are engaged in ongoing employment-focused activity and job search.109
These different approaches between JNS and JSA were reflected in the different uses of the funding available to assist job seekers. The Job Seeker Account (JSKA) was the funding pool available for providers under JNS. It could be used for goods and services to assist job seekers into employment.110 The equivalent in JSA, the EPF, together with the EPP focused on providing
108 In this report Job Network Services (JNS) are taken to include Job Network and complementary programmes which were replaced by JSA.
109 DEEWR, 2007. Active Participation Model Evaluation 2003-2006, Canberra.110 DEEWR, 2007. Active Participation Model Evaluation 2003-2006, Canberra.
45

individually tailored pathways to employment which could encompass non-vocational as well as vocational activities, training and other forms of expenditure.
This chapter analyses different aspects of the JSA service delivery model in order to gauge its effectiveness. The use of the EPP and EPF are explored as tools for tailored service delivery. Activities undertaken by job seekers during the WEPh and their effects on employment outcomes are analysed, and ‘time to exit’ is examined as an indication of the effectiveness of the employment service model.
4.2 Employment Pathway PlansAn EPP set out an individualised pathway to employment for each fully eligible job seeker. In the first JSA contract Stream 1 Job seekers were required to have an EPP created by Centrelink during their first 13 weeks of service. Employment service providers were required to create an EPP for job seekers in Streams 2, 3 and 4 at their first appointment.
Departmental records show that 93 per cent of job seekers had an EPP created on the same day as their initial appointment and 95 per cent of all job seekers had an EPP in place within 14 days of commencement.111
EPPs were designed to be tailored to the needs of the individual job seeker and regularly updated during the job seeker’s period of service. Mandatory elements of an EPP for job seekers with activity test or participation requirements included: the frequency of contact between provider and job seeker; the timing and details of activities to be undertaken by provider and job seeker; and details of the job seeker’s obligations. This may have included voluntary activities. For non-activity tested job seekers, EPPs contained only voluntary activities.
The department assessed a percentage of EPPs on an ongoing basis to ensure they met quality assurance standards. EPPs were assessed as to whether they contained:
• details of each job seeker’s individual circumstances and obligations
• details of defined activities or assistance relating to the job seeker’s goals
• dates and milestones.
The Good Practice in Job Services Australia study found that high-performing provider sites were more likely to have EPPs that met these standards than middle and low-performing sites (76 per cent of EPPs compared with 72 and 62 per cent respectively), demonstrating a link between EPP quality and the performance of providers.112 113
Just under half of all service providers reported spending an average of 16 to 30 minutes on initial contact and registration for Stream 1 job seekers and around 36 per cent reported spending over
111 DEEWR, 2012. Employment Pathway Fund, Ch 1: Introduction, Canberra.112 DEEWR, 2012. Good practice in Job Services Australia, DEEWR, Canberra.113 High-performing sites were identified using Star Rating and participant experience measures which were combined
into a 25 level rating, with the Star Ratings component weighted at 10 times the participant experience measure. The combined performance rating was then divided into low, medium and high performing sites. See Section 10.3 for further discussion of Star Ratings.
46

30 minutes (Figure 4.2). Most sites (about 90 per cent) spent on average more than 30 minutes on initial contact and registration for job seekers in Streams 2 to 4, including EPP preparation.114
Figure 4.2: Average time spent by providers with JSA job seekers on initial contact tasks caseload population (per cent)
0%
10%
20%
30%
40%
50%
60%
70%
80%
90%
100%
Stream 1 Initial contact and
registration
Stream 1Initial skillsassessment
Stream 1First EPP update
Stream 2 -3Initial contact and
registration
Stream 4 Initial contact and
registration
Prop
ortio
n of
pro
vide
rs
Up to 15 minutes 16 to 30 minutes 31 to 60 minutes More than 1 hour
Note: Refer Appendix 2, Table A2.7.Source: Department of Employment Survey of Employment Service Providers 2010.
The average time spent on initial contact was not linked to site performance, however the content and style varied with performance level. High-performing sites tended to make better use of the EPPs as central documents for service planning and delivery.115 They also regarded the first appointment as a crucial time to build rapport with job seekers, particularly in Streams 2 to 4.116
Strategies used by high-performing providers to engage a job seeker with their EPP included:
• using the EPP as a framework for discussions
• focusing on a personal goal to be achieved within a specified time frame
• encouraging job seekers to take ownership of their EPP so that they were more likely to want to revisit it and use it to track their own progress
114 DEEWR, 2012. Good practice in Job Services Australia, DEEWR, Canberra.115 High-performing sites were identified using Star Rating and participant experience measures which were combined
into a 25 level rating, with the Star Ratings component weighted at 10 times the participant experience measure. The combined performance rating was then divided into low, medium and high performing sites. See Section 10.3 for further discussion of Star Ratings.
116 DEEWR, 2012. Good practice in Job Services Australia, DEEWR, Canberra.
47

• treating the EPP as a living document by frequently reviewing and updating it as circumstances changed, such as a goal being achieved or a barrier being addressed.117
Data from the Stepping Stones survey showed that job seekers who remembered their EPP were most familiar with their obligations (97 per cent), but only 87 per cent said that the EPP helped them to understand what assistance they would receive from their provider.118 The majority of these job seekers (65 per cent) disagreed with the statement that they ‘had little or no say about what was in my plan’.119
Around 86 per cent of job seekers agreed with the statement ‘My provider has been delivering some of the things they agreed to in my plan’, but not all job seekers recalled having an EPP.120 They were therefore unlikely to understand their obligations or what they could expect to receive from their provider.
Job seekers who recalled they had an EPP agreed it was an effective tool for identifying their needs and planning services. According to the department’s Post Programme Monitoring survey (PPM), 63 per cent of respondents agreed or strongly agreed that their EPP suited their needs.121 There were significant differences across streams, with disadvantaged job seekers being more positive about this:
Stream 1 job seekers 58 per cent Stream 2 job seekers 63 per cent Stream 3 and 4 job seekers 68 per cent
Results indicate that EPPs, when used effectively, worked well for both job seekers and providers, helping to identify job seeker needs and assisting in planning ways to address barriers. Some providers made better use of EPPs than others. Almost one-third of job seekers surveyed were unaware of having an EPP, or of having signed one. This is a cause for concern, as job seekers who were not aware of their EPP may not have been fully aware of their obligations or what they could expect from their providers. It is also the case that providers were not maximising the benefits to be gained from using these plans.
Depending on the job seekers needs and individual circumstances, some of the things a provider could have been expected to do to help a job seeker included:
• assistance with preparing a résumé
• advice on the best ways to look for work
• advice on how to receive training to obtain skills for work opportunities through the government funded Productivity Places Programme (PPP)
• reasonable access to JobSearch and computer facilities and advice on how to use them to look for work
• access to an interpreter
117 DEEWR, 2012. Good practice in Job Services Australia, Canberra.118 DEEWR, Stepping Stones Cohort 1, Wave 2, 2009.119 DEEWR, 2012. Good practice in Job Services Australia, Canberra.120 DEEWR, 2012. Employment Pathway Fund, Chapter 1: Introduction, Canberra.121 Results from the Post Programme Monitoring Survey, conducted in 2011.
48

• placement in work experience or related activities
• provision of counselling or other professional support
• referral to, or help accessing, other support services they may need.
4.3 Employment Pathway Fund assistanceProviders could use the EPF to assist fully eligible job seekers to overcome their vocational and non-vocational barriers to employment.122 The EPF continued under JSA 2012–2015. Providers received a notional EPF credit for each job seeker, with higher amounts credited for job seekers in higher streams. Providers were able to use these funds flexibly to assist any job seeker or group of job seekers in any stream.
Between 2009 and 2012 there were 17 categories covering a diverse range of assistance including:
• clothing and presentation
• interpreter services
• New Enterprise Incentive Scheme (NEIS) and self-employment
• pre-employment checks and work-related documentation
• professional services
• provider services
• relocation assistance
• remote services
• short-term child care assistance
• Stream 4 only assistance
• tools, mobile phones and equipment
• training courses
• training books and equipment
• transport and licensing assistance
• work experience activities
• wage subsidies.
The fund operated by reimbursing JSA providers who purchased goods and services for job seekers. EPF purchases were to match the needs of job seekers as identified in their EPP and adhere to the principles of the EPF.123
122 Job seekers Fully eligible for stream services include recipients of NSA and YA(O), including parents and people with disability who have part-time participation requirements or another form of qualifying income support; 15- to 20-year-olds not in receipt of income support and not employed more than 15 hours a week or in full-time education; and CDEP participants.
123 As described in the EPF Guidelines and the DEEWR Employment Services Deed 2009–2012.
49

4.3.1 Employment Pathway Fund expenditure From 1 July 2009 to 30 June 2012 $1.13 billion was spent from EPF funds across 5.8 million transactions with an average value of $181.124 This section summarises findings from a published study of EPF usage and assistance conducted as part of the JSA evaluation.125
Average EPF expenditure per job seeker was slightly lower for providers with larger caseloads. This probably relates to economies of scale for these businesses (for example, the high number of purchase of training courses).
Expenditure in the training course category accounted for over 33 per cent of EPF expenditure (Table 4.1). Wage subsidies and provider services (which included, but was not limited to, reverse marketing) were the second and third highest expenditure categories over the three-year period.
Training accounted for the highest proportion of EPF expenditure for low, middle and high-performing provider sites. High performing sites on average spent slightly less on training activities than other sites despite having more job seekers enrolled in training activities. One possible explanation is that high-performing sites were able to source lower-cost training options.126
Table 4.1: EPF expenditure by category, 1 July 2009 to 30 June 2012 (percentage of total expenditure)Expenditure Category Expenditure (per cent)
Training Courses 33.1
Wage Subsidies 20.9
Provider Services 11.2
Unallocated bulk transactions 8.8
Other expenditure 7.8
Professional Services 7.5
Clothing and Presentation 5.7
Transport and licensing assistance 4.9
Total 100.0Note: Numbers may not add up due to rounding.Source: Department of Employment administrative data.
High-performing sites spent higher proportions on reverse marketing and work-related items such as wage subsidies but lower proportions on outreach than other sites.127
EPF expenditure patterns differed between specialist and generalist providers.128 Specialist providers spent less on training, slightly less on wage subsidies and more on non-vocational barrier related EPF items such as interpreter services, reverse marketing, mental health counselling, driving lessons and other assistance (Table A2.8).129
124 For those transactions that could be allocated against individual job seekers. That is, excluding approximately 86,000 transactions which were unallocated bulk transactions and work experience activities for multiple job seekers.
125 DEEWR, 2012. Employment Pathway Fund, Ch. 1, Introduction, Canberra.DEEWR, 2012. Employment Pathway Fund, Ch. 2, Wage subsidies, Canberra.DEEWR, 2012. Employment Pathway Fund, Ch. 3, Reverse Marketing, Canberra.
126 DEEWR, 2012. Good Practice in Job Services Australia, Canberra.127 DEEWR, 2012. Good Practice in Job Services Australia, Canberra.128 See Section 7.4 for further information on specialist providers.129 See Appendix 1 Section 3.4 for details on how Specialist and Generalist providers were compared.
50

According to the EPF study, 48 per cent of eligible job seekers received assistance through the EPF and patterns of EPF expenditure differed across the streams, reflecting the differing levels of job seeker disadvantage. Stream 4 job seekers received proportionally more EPF in the professional services category – mental health counselling, vocational rehabilitation and drug and alcohol counselling and rehabilitation – than the other streams. This reflects the non-vocational barriers that Stream 4 job seekers experience. Stream 1 job seekers, on the other hand, received proportionally more EPF expenditure for training courses than other streams.130
The study also noted that:
• job seekers typically received their first EPF expenditure transaction within six months of commencing in a stream and over 50 per cent of job seekers received their first EPF transaction in the first 10 weeks
• most Stream 1 job seekers did not receive EPF expenditure until their second 13-week period after commencement – this likely reflects the fact that there was no financial incentive before this for providers to use EPF credits
• Stream 2 job seekers tended to receive their first EPF transaction earlier in their unemployment duration than job seekers in other streams
• EPF use was generally targeted towards disadvantaged job seekers, however after 26 weeks in service, almost 20 per cent of job seekers in Streams 3 and 4 who would go on to receive EPF assistance had not yet received any.131
Job seekers in Streams 3 and 4 may not have received EPF funding in the first 26 weeks for valid reasons, including: providers rationing funding to ensure they did not run short, lack of evidence that a job seeker was progressing or a lack of suitable services. However, no data was available for this evaluation to confirm these possible reasons.
4.3.2 Job Seeker Account versus Employment Pathway Fund expenditureA comparison of EPF and Job Seeker Account (JSKA) expenditure shows that providers switched from more immediate interventions such as the provision of clothing and equipment to longer-term strategies such as training (Table 4.2). This change was probably driven to some extent by difficulties placing job seekers into work during the more challenging labour market conditions following the Global Financial Crisis (GFC). Another contributing factor may have been the change in caseload composition under the two models.132 Under JSA, more highly disadvantaged clients with non-vocational barriers were serviced through mainstream services and there was no EPF equivalent available for Job Placement, Employment and Training (JPET) programme or Personal Support Programme (PSP).
130 DEEWR, 2012. Employment Pathway Fund, Ch 1: Introduction, Canberra.131 DEEWR, 2012. Employment Pathway Fund, Ch 1: Introduction, Canberra.132 DEEWR, 2011. The Impact of the Global Economic Downturn on Job Services Australia, July 2009 – January 2010,
Canberra.
51
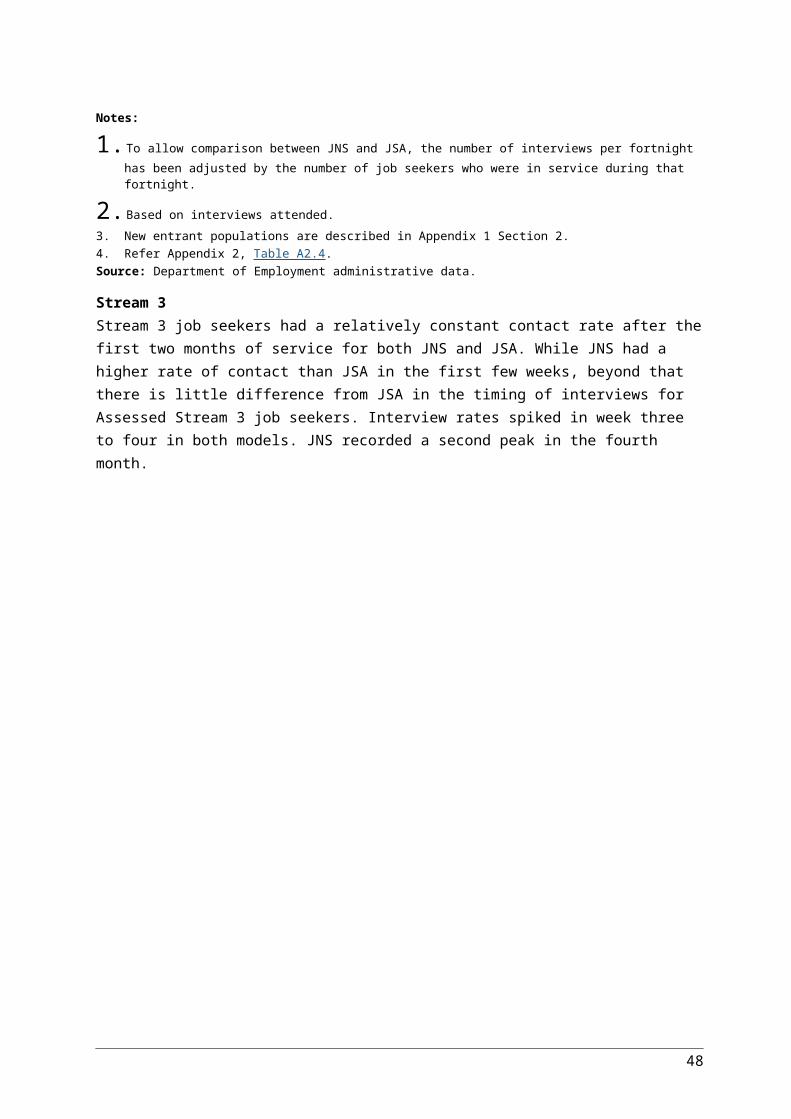
Table 4.2: Proportion of Job Seeker Account July 2006 to June 2009 and Employment Pathway Fund July 2009 to June 2012, expenditure by category (per cent)
Category of expenditure Job Seeker AccountJuly 2006 to June 2009(per cent)
Employment Pathway FundJuly 2009 to June 2012(per cent)
Training 23.8 33.1
Wage subsidies 30.0 20.9
Provider services including Reverse marketing
12.0 11.2
Clothing and presentation 10.3 5.7
Other 23.9 29.1
Total 100.0 100.0
Source: Department of Employment administrative data.
Internal analysis of expenditure between the two models for new entrant job seekers in the first 12 months by provider expenditures (service, placement and outcome fees etc.) and non-provider expenditures (EPF and JSKA expenditure) indicates that the average non-provider expenditure was nearly twice as large under JSA as under JNS. The proportion of job seekers who benefited from the non-provider expenditure was also greater under JSA (Table 4.3). Overall, JSA average expenditure per job seeker consisted of a higher proportion of EPF expenditure and lower proportion of provider expenditures relative to JNS.
Table 4.3: Expenditure in the first 12 months, provider vs non-provider, new entrant population (per cent and dollar)
Expenditure JNS JSA
Proportion of job seekers benefited from non-provider expenditure (per cent) 16 25
Non-provider expenditure per benefited job seeker ($) 512 616
Non-provider expenditure per job seeker of the study population ($) 80 153
Non-provider expenditure - contribution to average expenditure per job seeker (per cent) 10 17
Provider expenditure /Average expenditure per job seeker (per cent) 90 83Notes:1. CPI adjusted cost for JNS.2. Descriptions of comparable new entrant populations are in Appendix 1 Section 2.
Source: Department of Employment administrative data.
As there are significant differences between the two service models, these findings should be treated with caution. For example, at least some of the PSP and JPET equivalent services were paid under non-provider expenditure as they were separate programmes. The EPF under JSA was also specifically designed to support more broad service provision than was the JSKA under JNS. (For analysis of JSKA and EPF expenditure on education and training see Chapter 6).
There was also a shift in the policy goals and design of JSA, from the ‘work first’ focus that defined JNS, to a focus on the building of human capital through skills and training and social inclusion goals of employment services.133
133 See Chapter 5 for a discussion on changes in education outcome rates between the JNS and JSA models.
52

Building human capital through training was a major focus of JSA 2009 – 2012. For this reason, Chapter 6, Building Labour Force Capacity is dedicated to training (including the effectiveness of EPF-funded training). Other important categories of EPF expenditure for job seeker services related to employer servicing (wage subsidies and reverse marketing), are dealt with in Chapter 9, Employer Servicing.
4.4 Work Experience
4.4.1 Work Experience placements in Job Services Australia JSA gave providers a wide range of options for placing job seekers in work experience activities in order to broaden their skills and increase their chances of finding employment. During the period of this evaluation there were over 1.3 million (1,349,055) work experience placements. Table 4.4 shows the breakdown of these placements by broad activity type. While participation in work experience activities was compulsory during the Work Experience Phase (WEPh), job seekers could undertake activities at any time and most placements, (985,040 or 73 per cent) occurred when job seekers were not in the WEPh.
Table 4.4: Work experience activities between 1 July 2009 and 30 June 2012 (number and per cent)Activity Number Per centVocational Training 517,413 38
Non-vocational Training 332,147 25
Part-time/Casual Paid Employment 199,268 15
Other Activities 1 175,487 13
Work for the Dole 94,768 7
Voluntary Work 25,063 2
Unpaid Work Experience 4,909 <1
Total 1,349,055 100Notes:1. Other Activities include minor activities of Drought Force, Green Corps, Defence Force Reserves, National Green Jobs
Corps, NEIS Training, and other Approved Programmes.2. These placements included those undertaken both within and outside of the Work Experience Phase (WEPh).
Source: Department of Employment administrative data.
Types of activities undertaken by job seekers JSA providers presented, brokered or purchased work experience activities for fully eligible job seekers. All work experience activities were required to focus on at least one of the following outcomes:
• skills in demand in the local labour market, leading to sustainable employment
• addressing non-vocational barriers
• genuine work-like experiences and/or training.
They were also required to provide at least one of the following: experience in an existing workplace; opportunity to be part of a team and/or be mentored; employment, natural environment or cultural heritage benefit; community benefit and benefit to the participant, (such as addressing non-vocational barriers).
53
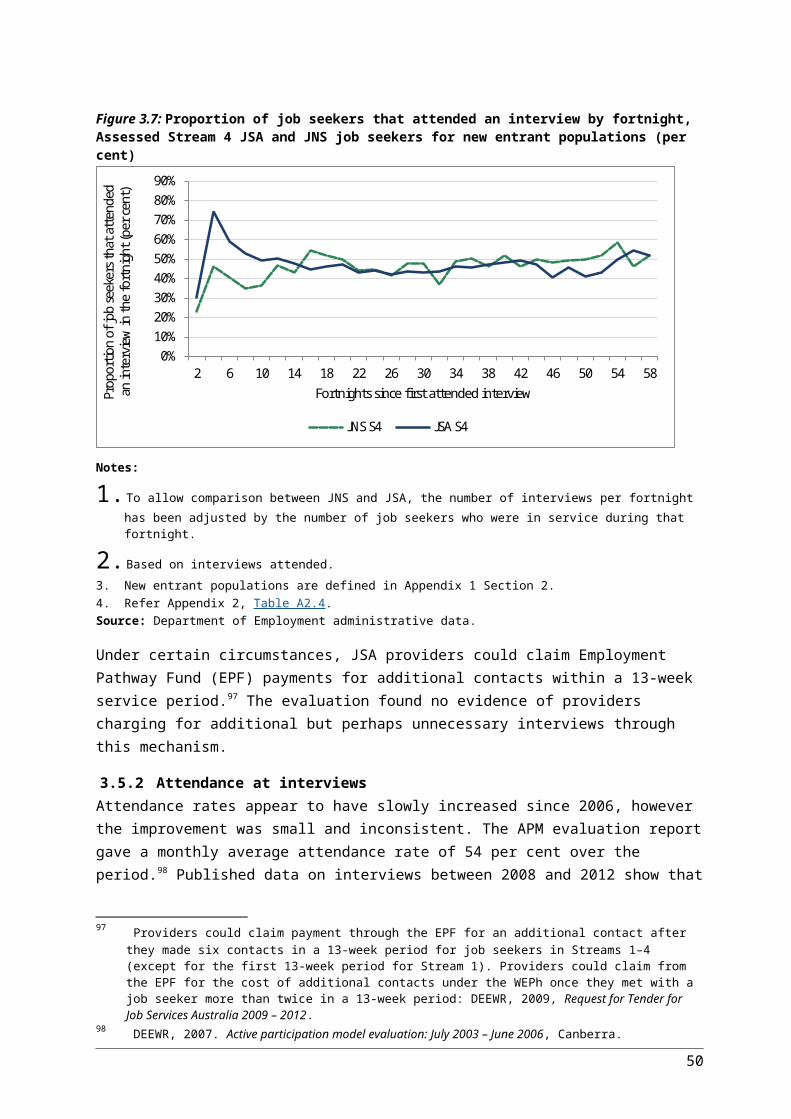
Participation in the Work Experience PhaseA job seeker in Streams 1 to 3 would typically move to the WEPh after 12 months in service and following a Stream Services Review (SSR). For Stream 4 job seekers, if the SSR deemed the job seekers would benefit from additional assistance for up to six months then entry to the WEPh was deferred. Job seekers were not required to participate if they were:
• exempt from the Activity Test or participation requirements
• aged 15 to 17 years
• a pre-release prisoner
• aged 50 years or over, unless they were aged 50 to 59 years with a full-time Activity Test requirement and the provider considered that the job seeker would benefit from full-time Work for the Dole (WfD)
• moved to a higher stream as a result of a SSR or change of circumstances assessment.
Before commencing the WEPh, participants met their provider to discuss available activity options in their area and had up to six weeks to choose a work experience activity or combination of activities. If a participant did not choose an activity, the provider placed them in a WfD or Green Corps activity. If the participant was not eligible for these activities, they were placed in another activity.
Figure 4.3 shows the proportion of the JSA caseload in the WEPh between July 2009 and June 2012. Under transitional arrangements for job seekers moving from JNS to JSA, some job seekers moved to the WEPh immediately (in July 2009, mostly Stream 3), and others moved after the first 12 months of JSA operation (Stream 1 and 2). Stream 4 proportions started to increase after 12 months of service but a sharper increase occurred after a further six months, as for these Stream 4 job seekers’ the WEPh could be deferred if additional stream service assistance was considered beneficial.
The proportion of the caseload in the WEPh in Stream 2, 3 and 4 was still increasing during the latter part of the contract period (post December 2011), whereas the proportion of Stream 1 job seekers had stabilised. These trends could to some extent indicate up-streaming activities. But the differing rates of growth in the streams essentially reflect the longer durations of unemployment in higher streams.
54

Figure 4.3: Proportion of JSA job seekers by stream in the Work Experience Phase, (WEPh) July 2009 to June 2012, caseload population (per cent)
0
5
10
15
20
25
30
35
40
45
Jul-09 Oct-09 Jan-10 Apr-10 Jul-10 Oct-10 Jan-11 Apr-11 Jul-11 Oct-11 Jan-12 Apr-12
Prop
ortio
n in
the
Wor
k Ex
perie
nce
Pha
se (p
er c
ent)
Stream 1 Stream 2 Stream 3 Stream 4
Note: Refer Appendix 2, Table A2.9.Source: Department of Employment administrative data.
Of activities undertaken in the WEPh between July 2009 and June 2012, about one-third (30 per cent) were in vocational (accredited or non-accredited) training activities, a further one-third (31 per cent) were in employment related activities (part-time or casual paid employment, voluntary work and unpaid work experience) and one-fifth (21 per cent) in WfD activities.134 Of those activities undertaken outside the WEPh (not WEPh activities), around two-fifths (41 per cent) were in vocational (accredited or non-accredited) training activities, 31 per cent were in non-vocational training, 12 per cent were employment related (unpaid work experience, part-time or casual paid employment and voluntary work) and 2 per cent were in WfD (Table 4.5).
Table 4.5: Work experience activities undertaken, 1 July 2009 to 30 June 2012 (per cent)Type of Activity Work Experience Phase Non Work Experience Phase
Vocational Training 30 41
Part-time/Casual Paid employment 26 11
Work for the Dole 21 2
Other Activities 1 10 14
Non-vocational Training 8 31
Voluntary Work 4 1
Unpaid Work Experience <1 <1
Total 100 100Note: Other Activities included minor activities of Drought Force, Green Corps, Defence Force Reserves, National Green Jobs Corps, NEIS Training, and other Approved Programmes.Source: Department of Employment administrative data.
134 March 2012 was selected because this date is close to the end of the three-year period and it avoids transitional arrangements for the subsequent contract period.
55
The proportions of job seekers undertaking various types of work experience activities varied by stream (Table A2.10). For those in the WEPh the most apparent differences across streams were:
• the proportion of job seekers undertaking employment related work experience activities was lower in higher streams (47 per cent in Stream 1 down to 19 per cent in Stream 4)
• non-vocational training accounted for 25 per cent of Stream 4 job seeker WEPh placements compared to around 5 per cent for Stream 1 to Stream 3 job seekers.135
These differences by stream indicate that providers were tailoring WEPh activities according to the needs of the individual job seeker. Employment-related activities were more common for the more job ready and non-vocational training was commonly used to address barriers for the more disadvantaged. Participants generally undertook activities that reflected their circumstances – for example, participants with low levels of education, higher levels of disadvantage or from culturally or linguistically diverse backgrounds were more likely to undertake training activities than other job seekers.136
Similar targeting of activities was also evident outside the WEPh. For example, training in job search techniques accounted for almost half (49 per cent) of work experience activities for Stream 1 job seekers compared to less than 10 per cent for Stream 2 to 4 job seekers. By contrast overall training activities made up almost two-thirds of activities for Stream 2, 3 and 4 job seekers, compared to only 21 per cent for Stream 1 job seekers.
The type of activity undertaken also varied by age group, mainly in the training and employment activity types (Table A2.11):
• New Enterprise Initiatives Scheme (NEIS) training was mostly undertaken by the 25 to 49 age group.
• Younger (18 to 24) job seekers were more likely to undertake vocational rather than non-vocational activities than job seekers in older age groups.
• Participants aged over 50 years were more likely to undertake voluntary work activities than those in younger age groups. This is likely because participants aged over 50 could meet their activity requirements by undertaking part-time voluntary or paid work.
• Participants aged over 50 were also more likely to undertake employment-related activities than participants in the other age groups.
This flexibility reflects the programme objective of tailoring services to the needs of individual job seekers.
4.4.2 Work Experience in Job Network and Job Services Australia Mutual Obligation (Work Experience under JNS) was different for job seekers than Work Experience under JSA. In JNS, WfD was the default work experience activity, whereas in JSA it was one of many
135 Non-vocational training includes intervention activities such as addiction interventions, cultural services, disability interventions, interpersonal skills training, mental health interventions, medical and health related services and skills training. It includes aspects such as counselling services, cultural acceptance/tolerance training, adjustment to disability training, assertiveness training, literacy and numeracy courses, illness and injury management training and careers counselling.
136 In this research ‘training’ includes vocational (accredited / non-accredited) training activities as well as non-vocational training in job search techniques and NEIS related training (NEIS training and Referral to NEIS panel member) activities.
56

options which included employment related activities and vocational and non-vocational training activities. In JSA the hierarchy of choice allowed for opportunities for the provider to tailor activities suited to the job seekers needs, provided such activities were available.
Participation rates in work experience activities during the mandatory Mutual Obligation phase in JNS were similar to participation in the WEPh in JSA.137 This is despite the fact that the two phases had different participation requirements.138 There were however, substantial differences in the types of activities undertaken in the Mutual Obligation/WEPh.
In JNS around 94 per cent of activities were in part-time work, WfD or job search training. This reflected the ‘work first’ philosophy of the JNS employment service model. By contrast only around 52 per cent of JSA WEPh activities were in comparable activity types (Table A2.12). This was consistent with one of JSA’s objectives, building human capital. Under JSA about one-third of WEPh activities (30 per cent) were in accredited vocational education and training, compared with less than 1 per cent for new entrants in the Mutual Obligation phase under JNS.
Participants who undertook the WEPh under both models were more likely to be young (under 21 years of age) compared with those who did not. Participants aged 50 or over were exempt from compulsory work experience participation.
The education profiles of participants in the WEPh were similar between the two models, with the majority of job seekers possessing Year 10/11, Year 12 or Certificate I to IV qualifications. For JNS the most common qualification was Year 10/11, while for JSA it was Certificate I to IV. This difference may be a consequence of the Learn or Earn policy, which resulted in different participation requirements for youth without Year 12 qualifications. Job seekers in JSA who undertook the WEPh were more likely to be disadvantaged than those who did not. Job seekers in JNS who undertook Mutual Obligation activities were less likely to be disadvantaged than those who did not. (Table A2.13 .)
4.4.3 Effectiveness of Job Services Australia Work Experience Phase activities
The referral effect of the Work Experience PhaseInternal research tracked outcomes of a population of job seekers from Streams 1 to 4 following participation in the WEPh (whether they were on income support 18 months after commencement in WEPh).139 The study population for this analysis consisted of four groups:
Group 1: Those who, 11 months after commencing in the WEPh, had not yet received a referral to a work experience activity (including both those who exited during the first 11 months of their WEPh and those who did not).
Group 2: Those who, 11 months after commencing in the WEPh, had received a referral to a work experience activity but had not commenced that activity.
Group 3: Those who, 11 months after commencing in the WEPh, had received a referral to a work experience activity and had commenced in that activity.
137 Departmental analysis of EPF and JSKA expenditure.138 Work Experience in JNS was mandatory at six months as against 12 months in JSA.139 See Section 3.5 of Appendix 1 for more detail on the methodology used for this analysis.
57

Group 4: Those who were already undertaking a work experience activity at the time of commencement in the WEPh.
Analysis showed a strong ‘referral effect’ for work experience activities for Streams 1 to 3 job seekers. The referral effect comprises both the compliance effect (where job seekers declare previously undeclared work and leave service as they cannot participate in a compulsory activity) and the ‘threat effect’ (where job seekers leave a programme to avoid participating in an activity). Exit from income support shortly before or after commencing in the WEPh or immediately following referral to such an activity is a strong indication of a referral effect (or simply the existence of the Work Experience Activity Requirement (WEAR)) has an effect.
Analysis showed that after the commencement in the WEPh, exit rates from income support were initially highest for those who did not receive a referral to an activity (Group 1) (Table A2.14). In part, this is a reflection that job seekers who exited early did not have a chance to be referred to an activity because they were already in a position to exit. It also shows the referral effect where, presented with the possibility of having to spend time in a work experience activity, job seekers either increased their job search activities or revealed existing employment. Exit rates remained higher for job seekers without a referral for a little over five months after the commencement of WEPh. After this point, job seekers without an activity referral were less likely to exit than other job seekers.
Considering only those job seekers who received a referral to a work experience activity and tracking them from the date of activity referral, (rather than date of commencement in the WEPh), the picture is similar (Table A2.15). Job seekers who did not commence in the activity to which they were referred were more likely than activity participants to exit during the first two or three months after referral, but less likely to exit thereafter. It is difficult to know to what extent this reflects a referral effect rather than the fact that people who exit early never have a chance to participate in an activity. However, 18 months after referral, job seekers who commenced their activity after WEPh commencement were the most likely to have exited income support.
For Stream 4 job seekers there is little evidence of a referral effect (Table A2.16). Weekly exit rates remained roughly equal across the observation period, noting that Stream 4 job seekers can meet participation requirements by participating in non-vocational activities. This possibly reflects the inability of these highly disadvantaged job seekers to move off income support regardless of the ’threat’ of the work experience activity. Weekly exit rates broken down by activity also showed little evidence of a referral effect, with exit rates being roughly equal across the period for all activities except part-time or casual paid employment, which showed higher exit rates overall and especially across the first six months.
The attachment effect of the Work Experience Phase The same internal research showed lower exits from income support for those participants in accredited education and training during the earlier part of the observation period (Table A2.17). This reflects the ‘attachment effect’ of training courses whereby participants cease or restrict their job search activity while they complete their training. Such an attachment effect for accredited education and training means that it takes longer for the full effect of the activity to be realised but this type of activity appears to produce more sustainable outcomes than WfD.
58
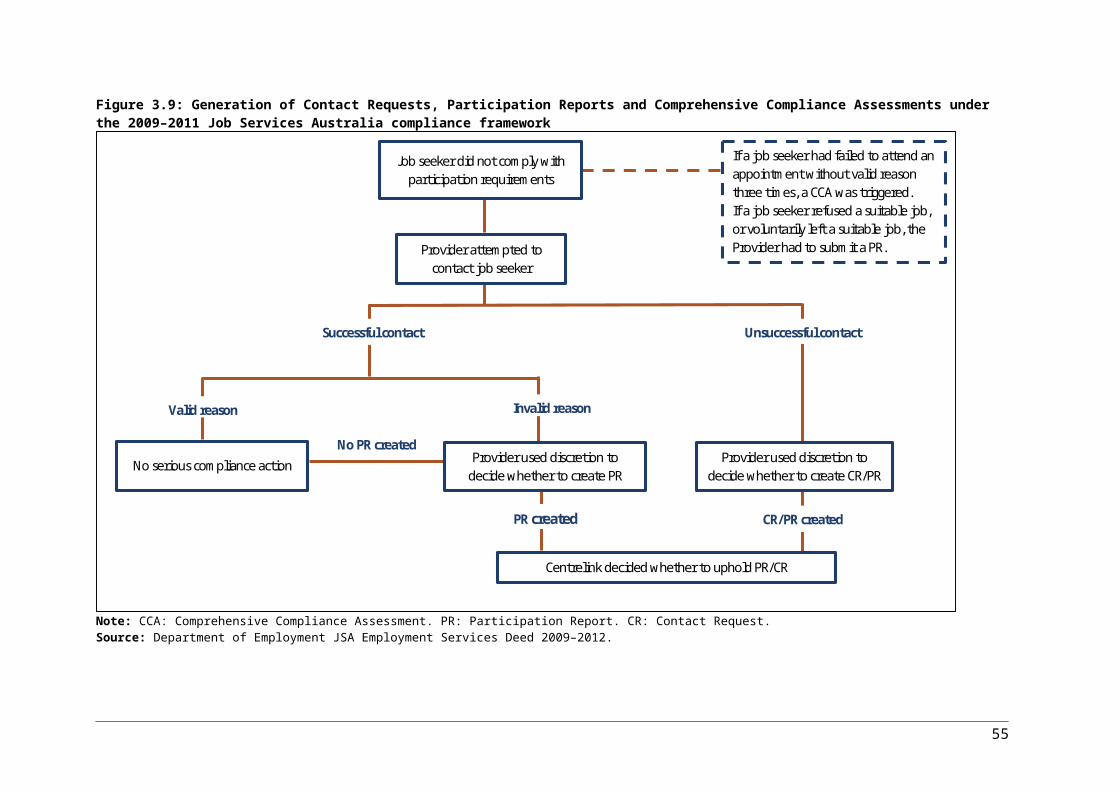
Relative effectiveness of various activity typesAnalysis of a group of new entrants to JSA assessed the relative effectiveness of different activity types in the WEPh. Almost one-third of job seekers were completely off income support 12 months after commencing in the WEPh.140
Work experience activities were grouped into four categories: employment, training, WfD and other employment-related activities (including part-time or casual paid employment, unpaid work experience, voluntary work). These other employment related activities, undertaken during a WEPh, were consistently the most effective in getting participants off income support compared with other activity types (Table A2.18). Training was generally the next most effective activity, while WfD was marginally more effective than training for job seekers with Year 10/11 or TAFE/Diploma as their highest level of education and job seekers from culturally and linguistically diverse backgrounds.141
4.5 Time to exit service or income supportThe time that it takes job seekers to exit employment services or income support can be an indication of the effectiveness of the employment service model.
Overall times to exit from employment services were very similar for JNS and JSA, although JSA had substantially shorter median times to exit than JNS for the most disadvantaged job seekers (Table 4.6).
Table 4.6: Median time to exit from services by Assessed Stream for new entrant populations (weeks)Assessed Stream JNS JSA
Stream 1 22 22
Stream 2 31 32
Stream 3 50 44
Stream 4 70 49
Total 26 24Notes: 1. Time to exit is adjusted for time on exemption or suspension from services.2. New entrant populations are defined in Appendix 1 Section 2.Source: Department of Employment administrative data.
For job seekers who were on income support on commencement in service, JNS showed higher rates of exit from income support than JSA (Figure 4.4).
140 See Appendix 1 Section 3.5 for details on the methodology for assessing the effectiveness of Work Experience Activities.
141 Training included vocational (accredited / non-accredited) training activities as well as non-vocational training in job search techniques and NEIS related training.
59

Figure 4.4: Cumulative exits from income support JSA and JNS for new entrant populations (per cent)
0
10
20
30
40
50
60
70
80
90
1 5 9 13 17 21 25 29 33 37 41 45 49 53 57 61 65 69 73 77
Cum
ulati
ve e
xits
(per
cen
t)
Weeks on income support at exit
JNS JSA
Notes: 1. New entrant populations are defined in Appendix 1 Section 2. 2. Refer Appendix 2, Table A2.19.Source: Department of Employment administrative data.
This was largely a result of a steep rise in exits at 12 weeks in JNS which was not observed in JSA (Figure 4.5). This rise in exits was most noticeable for job seekers in Assessed Streams 1 and 2, less so for Assessed Stream 3, and not present for Assessed Stream 4 (Figure 4.6).
This sharp rise in exits was the result of the widely reported referral effect of Job Search Training. This was a three-week full-time programme of training in job search techniques that took place after three months in service in JNS. It was compulsory for job seekers on activity tested payments. Job Search Training was mainly aimed at Stream 1 and 2 type job seekers (not classed as highly disadvantaged), and these were the job seekers for which the exit spike was most pronounced (Figure 4.6).
The impact of Job Search Training was further investigated by comparing a cohort of new entrant Stream 2 type job seekers of JNS to a similar cohort of JSA job seekers. Over a period of 18 months from registration, JNS job seekers showed consistently better chance of leaving income support in a regression analysis. The net impact of Job Search Training on leaving income support at 18 months was an increase of 8 percentage points in exit rate for JNS job seekers (propensity score matched job seekers) (Table A2.20).142
142 See Section 3.6 in Appendix 1 for a description of this analysis.
60

Figure 4.5: Probability of exit from income support – JSA and JNS for new entrant populations
0.000
0.005
0.010
0.015
0.020
0.025
0.030
0.035
1 5 9 13 17 21 25 29 33 37 41 45 49 53 57 61 65 69 73 77
Prob
abili
ty o
f exi
t
Weeks on income support
JNS JSA
Start of JNSIntensive Support Phase
Notes: 1. Probability of exit is the probability of a job seeker exiting during a week, given that they were on income support at
the beginning of the week.2. New entrant populations are defined in Appendix 1, Section 2.3. Refer Appendix 2, Table A2.21.Source: Department of Employment administrative data and Research and Evaluation database (RED).
Figure 4.6: Probability of exit from income support JNS by Assessed Streams 1 to 4 for new entrant populations
0.000
0.005
0.010
0.015
0.020
0.025
0.030
0.035
0.040
0.045
0.050
1 5 9 13 17 21 25 29 33 37 41 45 49 53 57 61 65 69 73 77
Prob
abili
ty o
f exi
t
Weeks on income support
JNS Stream 1 JNS Stream 2 JNS Stream 3 JNS Stream 4
Notes: 1. New entrant populations are defined in Appendix 1, Section 2.2. Refer Appendix 2, Table A2.22.Source: Department of Employment administrative data and Research and Evaluation database (RED).
61

The compulsory activity requirement at three months was not carried into the JSA model except in the reduced form of the Intensive Activity phase for Stream 1 job seekers. If the impact of the three-month intervention is removed from the exit rates shown for JNS, very similar early exit rates are seen under both models, while JSA seems to prompt higher exits later. While previous evaluations have noted high levels of deadweight and limited efficacy in increasing job search skills for similar interventions, this evaluation finds that interventions that prompt early exits can have long-term benefits and in light of the associated compliance effect are cost-effective.143 144
While overall rates of exit from income support were higher for JNS, there were substantially higher exit rates from income support after 18 months in JSA for the most disadvantaged job seekers (in Assessed Stream 4). Regression results also show a significantly higher chance of being off income support 18 months from start of service, regardless of income support type in JSA compared to JNS, for these job seekers.
4.5.1 Predicted exits from employment services for the long-term unemployedExit rates from employment services providers is one measure of the effectiveness of that model in assisting job seekers to exit employment services. Exits as measured here include: to employment; to other forms of assistance; and to leave the labour force.
To examine the effectiveness of JSA compared with JNS in assisting long-term unemployed (LTU) job seekers (those registered with employment services for one year or more), a predicted exit model was constructed. This model compared the number of exits actually experienced by a group of LTU job seekers under JNS with the predicted number of exits that they might have experienced had they participated in the JSA model. This prediction was calculated using a regression model constructed from data relating to the characteristics and outcomes associated with a group of similar job seekers in JSA. This is one way to answer the question: “How would the JNS long-term unemployed population have fared under the JSA employment services delivery model?”145
Results from this analysis show that the JNS cohort would have been more likely to exit employment services had they been serviced under the JSA programme, for every Assessed Stream except Assessed Stream 2 (Table 4.7). For example, 67.4 per cent of JNS Assessed Stream 1 job seekers exited, compared with the predicted exit rate for this group, had they been serviced in JSA, of 68.8 per cent. The difference is most marked for Assessed Stream 4, with a predicted 10.6 percentage points higher exit rate had this group been serviced in JSA.
Table 4.7: Long-term unemployed (LTU) JSA and JNS who exited employment services by Assessed Stream for study populations (per cent)
Assessed Stream JSA actual JNS actual JNS predicted Percentage points difference
Stream 1 66.9 67.4 68.8 1.3
Stream 2 54.9 60.3 58.9 -1.4
Stream 3 48.6 53.7 54.0 0.3
Stream 4 45.9 38.8 49.4 10.6
143 DEEWR, 2007. Active Participation Model evaluation: July 2003 – June 2006, Canberra.144 Productivity Commission 2002, Independent Review of the Job Network: Inquiry Report.145 See Section 2.2 of Appendix 1 for a description of this analysis.
62

Note: The JNS predicted percentage is the percentage of the JNS comparison group that modelling predicts would have exited had they been serviced under the JSA model.Source: Department of Employment administrative data and Research and Evaluation database (RED).
4.6 ConclusionThe JSA model provided services in accordance with a job seeker’s assessed level of labour market disadvantage through allocation to service streams. Assistance was funded through EPF. Credits to this fund were notionally attached to a job seeker and could be spent on tailored assistance that was vocational or non-vocational in nature. It was also not necessary to spend funds on the job seeker for whom the funds were notionally credited. Another tool in achieving employment was the EPP. This was a structured agreement between the job seeker and provider which set out the responsibilities of the job seeker, their activities, and how the provider would assist them into employment. Provider outcome fees were structured to provide an incentive to assist the most disadvantaged job seekers. A broad range of work experience activities were on offer, in keeping with the tailored assistance model.
EPPs were most successful when they: were used as a framework for discussion; were goal driven; encouraged job seekers to take ownership; and were continually updated to retain their currency. The positive correlation between provider performance and the quality of their EPPs shows that, when used appropriately, EPPs were effective in identifying and planning personalised services for job seekers. 146
Over a billion dollars of the EPF was spent from July 2009 to June 2012 across 5.8 million transactions with about half of the eligible job seekers benefiting from the expenditure. The proportion of job seekers who benefited from EPF spending varied across streams. Analysis of EPF expenditure when compared with JSKA expenditure over the first 12 months of their respective contracts shows that on average, more EPF money went to job seeker assistance than did JSKA funds. The three EPF categories with the highest share of expenditure were training, wage subsidies and provider services (which included, but was not limited to, reverse marketing).
Participants in the WEPh under JSA were offered a broad range of activities and generally undertook activities that reflected their circumstances. Employment related activities were the most effective in moving job seekers off income support 12 months after participating in work experience activities. Analysis showed evidence of a compliance effect for work experience activities for Streams 1 to 3 job seekers. The threat effect refers to job seekers who appear to leave employment services to avoid participating in an activity. This effect was not evident for Stream 4 job seekers reflecting the difficulty that these job seekers have in leaving income support.
Overall times to exit from employment services were very similar for JNS and JSA, although JSA had substantially shorter median times to exit than JNS for the most disadvantaged job seekers. A spike in exits for Assessed Stream 1 and 2 job seekers at the twelve weeks of service mark in JNS is attributable to the referral effect of Job Search Training which was compulsory for most JNS participants. JSA appears to have had very slightly better exit rates from income support in the longer-term (from week 45).
146 DEEWR, 2012, Good Practice in Job Services Australia, Canberra
63

5 Job seeker outcomes
5.1 IntroductionThe main goal of any employment service is to achieve employment outcomes for those who may not otherwise achieve them, or to achieve outcomes more efficiently than would have occurred without assistance. Many evaluations attempt to quantify the effectiveness of a given programme by comparing participant outcomes to outcomes in the absence of the programme. The fact that Australia has had a government funded employment service since 1946, together with the absence of a ‘control group’ or non-participating population, makes it impossible to evaluate Job Services Australia (JSA) in this way (see Chapter 1 and Appendix 1 Section 2 for more information). In this report the effectiveness and efficiency of JSA has been assessed by comparing the employment outcomes for new entrant populations of job seekers under the JSA service delivery model for 2009 – 2012 with outcomes for similar job seekers under the Job Network Active Participation Model (APM) contract (1 July 2006 to 30 June 2009).
This chapter reports on outcomes for job seekers by Assessed Stream.147 Outcomes for select groups of job seekers, including more information on outcomes for the long-term unemployed (LTU), are presented in Chapter 7. Education outcomes are reported in Chapter 6 and outcomes for Indigenous job seekers are discussed in Chapter 8.
Expenditures associated with service delivery and outcomes are key measures of programme efficiency and cost effectiveness. This chapter also compares the overall cost effectiveness of JSA with JNS148, as well as assessing the relative service and cost-effectiveness of different streams within JSA.
Important Note:
Many outcomes reported in this chapter are from studies specifically designed to enable the comparison of JSA with its predecessor, JNS (see Appendix 1). For this reason, they will differ from outcomes for JSA reported elsewhere and should only be used in the context of this evaluation.
5.2 Measuring effectiveness
5.2.1 Comparing outcomesJSA replaced seven different contracts under the previous model including Job Network and a number of complementary programmes including the Job Placement, Education and Training Programme (JPET) and the Personal Support Programme (PSP). The previous service model also included the operation of Job Placement Licensed Organisations (JPLOs), Community Work Coordinators, Green Corps and Harvest Labour Services (Figure 1.2).
Because JNS and JSA were designed to help similar types of job seekers it is feasible to compare outcomes between models for different client groups. Outcomes for a group of new entrant job seekers in JSA were compared to those of a similar group of new entrant job seekers in JNS. The JNS
147 See Appendix 1, Section 2 for a fuller description of Assessed Streams.148 The term Job Network Services (JNS) is used when referring to Job Network and the relevant complementary
services which JSA replaced.
64
new entrants were allocated to ‘Assessed Streams’ based on their level of labour market disadvantage using the criteria that was used to stream job seekers in JSA in the 2009 – 2012 contract. This enabled comparison of groups with similar levels of disadvantage in the labour market. For more information on how the Assessed Streams were calculated, see Appendix 1 Section 2.
The nature of new entrant comparisons meant that LTU job seekers were underrepresented in the study populations. Outcomes for these job seekers were compared using a different methodology described in Appendix 1 Section 2.
5.2.2 Measuring employment outcomesA number of outcome measures can be used to assess the programme effectiveness. While service exit rate, job placement rate and 13- and 26-week outcome rates can be drawn from programme administrative data, Post Programme Monitoring (PPM) survey data provides a slightly different array of measures, namely; employment, education and positive outcome rates. In addition, income support administrative data provides information on job seekers’ income support status and income support dependency level. As each measure has its strengths and weaknesses, a comprehensive and robust assessment of programme effectiveness requires a combination of these measures.
Administrative measuresInterpretation of exit data is difficult as not all exits from service (or even from income support) are to employment. Other possible exit reasons include changes in eligibility for service and disengagement (as a result of changes in personal circumstances). Data on reasons for exits from service is available for around 60 per cent of all exits. While all exits cannot be assumed to be positive, most are, so that exit rates over time can be used as a proxy measure of employment outcomes. The exit rates over time from JSA and JNS are compared in Chapter 4.
When a provider helped a job seeker achieve a job placement, this was recorded in the system so the placement and for 13- or 26-week outcomes could be paid, if the job seeker achieved them. Therefore, there was a strong incentive for providers to record job placements in order to claim an outcome fee.
As primary measures of employment, outcomes (job placement, 13- and 26-week outcomes) were limited by the extent to which job seekers report finding work to their provider. Another limitation was that for job seekers in Stream 1, placements were not paid for the first three months and 13- week and 26-week outcomes were not paid for the first 12 months of service. This gave little incentive for providers to record outcomes for Stream 1 job seekers. These measures are therefore not comparable across Streams 1 to 4 and cannot be used as universal measures of employment outcomes. These measures are also extremely sensitive to changes in administrative requirements and provider behaviour between models.
Post Programme Monitoring survey measuresThe PPM survey measures the labour market and education/training status of job seekers three months after a period of employment assistance, and it has been used under all JNS and JSA contract periods. While not designed specifically for evaluation, outcome data collected through the survey can, with some limitations, be matched to populations used in this evaluation. The main limitation is
65

that the points at which outcomes for Stream 4 (or Stream 4-like) job seekers were collected was different between JNS and JSA. This means that reliable PPM estimates cannot be determined for Stream 4 job seekers in this evaluation. In addition, statistical techniques which account for differences in job seeker composition and macroeconomic contexts, cannot be applied to the outcomes data. Therefore, while PPM data was used for Streams 1 to 3, the estimates should be treated with some caution.
However, the advantages of the PPM outcomes measure over other measures used include:
• PPM includes outcomes which may not have been picked up elsewhere, such as part-time employment for job seekers not on income support or who remain employed after achieving a 13-week outcome
• PPM enables a breakdown of full and part-time employment. This is particularly important for JSA as many of the outcomes are for groups with part-time participation requirements including job seekers over 50 and single parents.
• PPM records education outcomes, important in the context of JSA which has a focus on development of human capital.149
Once job seekers have left service, there is considerable interest in the sustainability of the employment outcome. That is, whether job seekers return to service or income support after exiting.
PPM does not follow up job seekers long-term after exit and the maximum length of follow up in administrative systems for payment to providers is 26 weeks. Because of this, income support status (at 12 months after exit) is used as a proxy for measuring the sustainability of the employment outcome in this evaluation.
Income support measuresIncome support status measures also vary in the way they can be used. Three types of income support measures were examined for use in this evaluation. These were:
Off Newstart Allowance (NSA)/Youth Allowance (Other) (YA(O)) rates Off income support rates percentage reliance on income support.
Many previous evaluations have used the Off NSA/YA(O) measure. This measure was appropriate for previous employment services models, including early Job Network and Commonwealth Employment Service (CES) models for two main reasons. Firstly, the goals of these employment services models was primarily to get unemployed people into jobs, and the nature of the workforce was much more attuned to full-time work, which meant job seekers would no longer be reliant on NSA/YA(O). This measure is less appropriate in the JSA 2019-12 environment since the goals expanded to include increasing the participation of people not necessarily on unemployment benefits, including job seekers with a partial capacity to work and single parents. This measure is also not particularly sensitive given the increasingly part-time and casual nature of the work force. In this situation the Off NSA/YA(O) measure represents only a partial measure of effectiveness The Off NSA/YA(O) measure also does not necessarily measure positive outcomes in that people originally on these benefits may move to other income support types – not necessarily into employment.
149 See Chapter 6 for details on education outcomes.
66

The Off-income support measure is more reflective of contemporary employment services as it is more inclusive of job seekers on other payment types. It includes outcomes for Parenting Payment (PP) and Disability Support Pension (DSP) recipients who are expected to gain work. However, as with the previous measure, Off-income support does not account for the part-time and casual nature of current employment. The very inclusiveness of the measure also contributes to its weakness in that it covers many job seekers who are not in reality expected to achieve complete independence from income support. This includes single parents with young children and job seekers with partial work capacity. As a result this measure will not accurately reflect the success of employment services in helping these job seekers.
Because of the weaknesses noted above for other income support measures a reliance on income support measure is also used in this evaluation. This measure compares the average reliance on income support over a given period for given job seekers. The initial state is 100 per cent for those on full rates of income support and will be lower for those on partial income support. Assuming similar starting rates, this is the most inclusive measure as it measures the degree to which employment services help reduce dependence on income support.
5.3 Total job placements, 13- and 26-week outcomes from JSA
5.3.1 PlacementsOver the life of the first JSA contract, 1 July 2009 to 30 June 2012, there were over 1,263,000 job placements recorded by JSA providers (Table 5.1).
Table 5.1: Total job placements by JSA providers over the period July 2009 – June 2012 by stream, (number and per cent)
Stream Number Per cent
Eligibility to be determined 414 0.0
Stream 1 Limited 5,557 0.4
Stream 1 207,750 16.4
Stream 2 562,140 44.5
Stream 3 280,730 22.2
Stream 4 206,508 16.3
Total 1,263,099 100.0Source: Department of Employment administrative data.
5.3.2 13- and 26-week outcomesOver the life of the first JSA contract, 1 July 2009 to 30 June 2012, JSA providers achieved over 523,700 13-week outcomes (over 480,000 jobs) and over 213,900 26-week outcomes (over 312,500 jobs). (Outcomes can be either employment or education outcomes) (Table 5.2).
Table 5.2: Total number of paid employment outcomes by JSA providers over the period July 2009 – June 2012 by stream, (number and per cent)
Outcomes by Stream13-week
outcomes (number)
13-week outcomes (per cent)
26-week outcomes (number)
26-week outcomes (per
cent)
Stream 1 8,805 1.8 5,565 1.8
Stream 2 281,605 58.7 193,766 62.0
67

Outcomes by Stream13-week
outcomes (number)
13-week outcomes (per cent)
26-week outcomes (number)
26-week outcomes (per
cent)
Stream 3 115,054 24.0 71,292 22.8
Stream 4 74,584 15.5 41,935 13.4
Total employment outcomes 480,048 100.0 312,558 100.0Note: Job seekers could achieve both an education and employment outcome over their period of service and therefore these combined can represent more than 100 per cent of the job seekers.Source: Department of Employment administrative data.
5.4 Context
5.4.1 Policy contextMajor policy changes that likely affected the outcomes achieved by JNS and JSA employment services over the study period included:
• the 2006 Welfare to Work policy, including changes to the eligibility and activity requirements for PP and DSP
• changes to the eligibility criteria for YA(O) and Family Tax Benefit (FTB) Part A, known as Learn or Earn (or Strengthened Participation Requirements for 15 to 20 year olds)
• changes to the operation of the Indigenous Community Development Employment Projects (CDEP)
• the uncapping of previously capped employment services for people with disability with the introduction of Disability Employment Services (DES) in March 2010
• introduction of Employment Services Assessments (ESAt) in 2011 and removal of a provider’s ability to trigger change of circumstance assessments in the same year.
5.4.2 Macroeconomic contextEconomic conditions favoured JNS insofar as providing the ability to place people into jobs compared with JSA (Section 2.1). Average unemployment during the JSA period (2009 to 2012) was 5.2 per cent compared to the 4.6 per cent under JNS (2006 to 2009).150 These differences could in part be accounted for by use of regression analysis. Where this was not possible, employment results are skewed in favour of the JNS model, as there is more scope to place people when unemployment is low.
5.4.3 Other contextual factorsAnother factor to note when comparing employment outcomes under the two models is that under the Active Participation Model (APM) in JNS, job brokerage licences were issued to both Job Network members and other (private) employment agencies (referred to as Job Placement Licensed Organisations (JPLOs)). As part of their contract obligations, JPLOs were required to register their vacancies on the Australian JobSearch website. JPLOs were more likely than Job Network providers to place job seekers who were not on income support and who were less disadvantaged.151 Vacancies found by private recruitment firms, available to Job Network providers, were not available
150 Australian Bureau of Statistics 2012, Labour Force, Australia, Cat No 6202.0, ABS, Canberra.151 DEEWR, 2007. Active participation model evaluation: July 2003 – June 2006, Canberra.
68
to JSA providers because JSA had no JPLO equivalent. The operation of JPLOs had both a direct effect, that is by having outcomes recorded for the previous model, and an indirect effect in that they registered vacancies the equivalent of which would not be available to JSA providers.
Another factor affecting jobseeking behaviour (and therefore comparisons over time) is the level at which unemployment related benefits are set against the level of wages. This is known as the unemployment related benefit replacement rate. Generally, the lower the replacement rate, that is, the lower the NSA or YA(O) payment is compared to wages, the greater the incentive for job seekers to enter employment. According to the Organisation for Economic Co-operation and Development (OECD) benefit replacement rates fell 5 per cent between 2007 and 2010 in Australia, ostensibly increasing the incentive for job seekers to actively seek employment. 152 153 While acknowledging that this may have had some impact on the relative effectiveness of each service delivery model this evaluation does not attempt to control for this in the analysis because the effect is:
• variable
• highly dependent on other factors
• difficult to quantify in relation to employment service delivery.154
5.5 OutcomesOutcomes reported in this section represent findings from a study of outcomes for new entrant job seekers under JNS and JSA (see Appendix 1 for more information).
In their Activating Jobseekers: How Australia Does It report the OECD noted that:
At an annual rate, JSA appears to be achieving fewer paid placements that the JN model did in 2005-06 and 2006-07. However, the JSA model no longer makes payments for placement in some situations where a high rate of deadweight (i.e. payments for placements that would have happened anyway) was suspected. JSA appears to be achieving about as many 13-week employment outcomes as in 2005-06 and 2006-07, but again, the detailed circumstances triggering payment and contextual features have changed.155
Findings in this report largely support the OECD findings.
5.5.1 Employment outcomes for Stream 1 to 3 type job seekersPPM outcomesEmployment outcomes as measured by PPM were lower for new entrant job seekers in Assessed Streams 1 to 3 in JSA compared with JNS (Figure 5.1).
Figure 5.1: Employment outcomes for Assessed Streams 1 to 3, JNS and JSA for new entrant populations (per cent)
152 OECD Net Replacement Rates153 These dates are chosen as they represent the end of the inflow periods for the relevant study populations.154 This is indicated by the range of estimates of the impact of this. See for example, (p. 176) OECD (2012) Activating
Jobseekers: How Australia Does It, OECD Publishing.155 OECD, 2012. Activating Jobseekers: How Australia Does It, OECD Publishing.
69

Notes: 1. PPM results are not available for this comparison (JNS with JSA) for Assessed Stream 4 job seekers due data limitations.2. New entrant populations are defined in Appendix 1, Section 2.3. Refer Appendix 2, Table A2.23 to Table A 2.26 for PPM results.
Source: Department of Employment Post Programme Monitoring Survey.
These outcome rates are in line with the shift from the ‘work first’ focus in JNS, towards building the capacity of the workforce in JSA. These job seekers achieved higher education outcome rates in JSA than comparable job seekers in JNS. Job seekers undertaking training often cease or lessen job search activities while they train, creating an ‘attachment effect’ in the short to medium-term. PPM outcome rates could not be adjusted to account for changes in job seeker composition or macroeconomic changes.156 Most of the differences in both compositional changes in the job seeker cohorts and macroeconomic conditions would have predicted higher outcome rates for JNS if all other things had been equal.157
Income support outcomes as sustainability measuresOff NSA/YA(O): JSA had fewer new entrant job seekers coming off NSA and YA(O) one year after exit than JNS. When considered by level of disadvantage, this result holds for activity tested Assessed Stream 1 job seekers. However, no significant difference was found between the models in the number of those coming off NSA and YA(O) for activity tested Assessed Streams 2 and 3 job seekers (Table A2.27). This is consistent with the fact that government employment services refocused away from those with lower levels of disadvantage in favour of those who needed more assistance.
Off income support: Measures indicate that JNS achieved more sustainable exits than JSA for Assessed Streams 1, 2 and 3 income support recipients, despite the higher rate of return to services under JNS described in Section 3.5.5 (Table A2.28). This is because a higher proportion of job seekers in the JSA study population exited services to non-activity tested income support payments such as the DSP; that is, they remained on income support and may not have re-entered employment services.
Average reliance on income support: Regression analysis that controlled for differences in the job seeker cohorts and macroeconomic conditions between the models found that in Assessed
156 Unit record data that would enable this was not available to this evaluation.157 See Chapter 2 and Section 5.4.2 for details of the differences between the cohorts and the macroeconomic contexts.
70
01020304050607080
Stream 1 Stream 2 Stream 3
Per c
ent
Employment outcomes
JNS JSA
Streams 1, 2 and 3, JSA job seekers were more reliant on income support for the first 52 weeks after exit from service compared with JNS (Table A2.29).
When interpreting these findings, it should be noted that there was a higher rate of exit from the labour force under JSA than JNS. This suggests that there was a greater movement to other income support types and that, all other things being equal, the average reliance on income support would be higher and off income support rates lower under JSA than JNS. This could be said to skew the results in favour of JNS, as people who leave the labour force are much less likely to go on to achieve outcomes as measured by the administrative and income support measures used in the study.
5.5.2 Employment outcomes for Stream 4 type job seekersAdministrative outcomesIn the absence of robust comparable data for new entrant populations from PPM for Stream 4 type job seekers, comparisons here are made using administrative data for job placements and outcomes. Table 5.3 shows job placement and 13-week outcome rates for new entrants Assessed Stream 4 job seekers under JNS and JSA.
Table 5.3: Job placement and 13-week outcome rates for Assessed Stream 4 job seekers, JNS and JSA new entrant populations, (per cent)
Outcome JNS JSA
Proportion who achieved a job placement within 18 months 17.0 37.6
Proportion who achieved a 13-week employment outcome within 18 months 6.9 21.5Source: Department of Employment administrative data
JSA outperformed JNS markedly in terms of employment outcomes for new entrant job seekers in Assessed Stream 4. Regression modelling that control for differences in the job seeker cohorts and macroeconomic circumstances between the models supports the finding of much stronger performance of JSA for this type of job seeker (Table A2.30 and Table A2.31).158
Income support outcomesA greater proportion of new entrant Stream 4 type job seekers in JSA were off income support at the end of an 18-month study period. Regression modelling also shows that these job seekers had a significantly higher chance of being off income support 18 months from start of service, regardless of income support type (Table A2.32).
However, while Assessed Stream 4 job seekers were more likely to achieve job placements and 13-week employment outcomes under JSA compared with JNS, no statistically significant difference between the two models was found in the sustainability of outcomes for Assessed Stream 4 job seekers who exited service (Table A2.27 and Table A2.28).
158 Stream 4 type new entrant job seekers were more likely to achieve a job placement (odd ratios 2.98) and a 13-week employment outcome (odds ratio 3.40) within 18 months of commencement in service under JSA compared to JNS. This modelling took into account measurable job seeker demographics (e.g. age, gender, income support profile) and local labour market factors.
71

5.6 Relative expenditureMeasures of relative expenditure are a means of assessing the efficiency of employment services. This section examines the relative expenditure of JSA compared with JNS for new entrant job seekers.
5.6.1 Published cost per employment outcome figuresThe department and its predecessors publish cost per employment outcome for employment services on an annual basis. Results from the last JNS contract period and JSA 2009 – 2012 are presented in Table 5.4.
Table 5.4: Published cost ($) per employment outcome for JNS and JSA 2009-2012 ($) Year JNS JSA Stream 1-3 JSA Stream 4
2006-07 3,698 blank blank
2007-08 3,643 blank blank
2008-09 3,933 blank blank
2009-10 blank 2,079 11,442
2010-11 blank 2,332 8,524
2011-12 blank 2,136 7,029Notes:1 Job Network results exclude results for the Personal Support Programme (PSP) and the Job Placement, Education and
Training (JPET) programme.2 Costs are as reported, and have not been adjusted for inflation.Source: Department of Employment Annual Reports for 2005-06 to 2011-12.
The employment services programme has evolved significantly over time. Reforms (minor or major) introduced with the implementation of a new contract or programme necessitate adjustments to the methodology of calculating the cost per employment outcome.
The methodologies used to calculate the published Cost per Employment Outcome figures were specific to the JNS and JSA models. The figures for the two service models therefore are not, and were not designed to be, directly comparable. More importantly, in the context of this evaluation, the figures do not address the question of how cost-effective JSA is, in comparison with JNS, for job seekers of varying levels of job seeker disadvantage (as reflected by different service streams in JSA).
5.6.2 Expenditure per outcome in this evaluationIn order to directly compare the cost effectiveness of different service streams between JSA and JNS for equivalent job seekers, expenditures for new entrant populations for both models over a 12 month period were compiled.
Expenditure analysed consists of programme administered funds only, including:
• service fees
• placement fees
• outcome fees
• Job Seeker Account (JSKA) or Employment Pathway Fund (EPF) expenditures.
72
One of the major reforms with the introduction of JSA was combining what were previously seven separate service contracts into one. For the purpose of the expenditure comparison, JNS expenditures include all the comparable relevant service contracts including JNS, JPLOs, JPET, PSP, Community Work Coordinators and Green Corps.
Average expenditure per job seeker is defined as the sum of all expenditures associated with a group of job seekers for a 12 month period from commencement, divided by the number of job seekers.
Expenditure per outcome is estimated by dividing the average expenditure per job seeker by the employment outcome rate of the corresponding period. Outcome rates used here are as reported earlier in this chapter.
5.6.3 Average expenditure for new entrants in their first 12 months of service When analysed by stream, only Stream 3 showed lower expenditure for the first 12 months of service under JSA, compared with JNS (Table 5.5). These results are at least partially explained by differences between the models in how and when job seekers were assigned to different types of services. In JSA, the streaming process assigned job seekers to services commensurate with their assessed level of disadvantage from commencement. Whereas in JNS highly disadvantaged job seekers (who would have been placed in Streams 3 or 4 in JSA) could commence immediately in Intensive Support customised assistance (period 1) (ISca1) and other Stream 4 type job seekers often had a much longer wait for a place in the capped PSP. Other job seekers in JNS did not usually receive intensive services during their first 12 months in service. In addition, JNS had a six-month Mutual Obligation phase in the first 12 months which probably contributed to the reduced overall expenditure for JNS.
This analysis is based on the first 12 months of service because of availability of employment outcomes data. Job seekers who stayed in the service longer than a year would enter very different service phases under both service models: ISca1 or ISca2 for JNS job seekers and Work Experience Phase (WEPh) for most JSA job seekers. Because the ISca service phase was more cost intensive, an expenditure comparison spanning the first two years of service could return quite different findings.
Table 5.5: Average expenditure per job seeker in first 12 months of service, new entrant populations ($)Stream JNS JNS (CPI Adjusted ) JSA Change
Overall 745 815 915 100
Stream 1 (Limited) 169 185 254 69
Stream 1 593 648 784 137
Stream 2 824 901 1462 561
Stream 3 1,940 2,120 1,903 -218
Stream 4 1,764 1,928 2,621 693Notes:1. CPI (9.3 per cent) adjusted dollar value. CPI rose 9.3 per cent between 30 September 2007 and 30 September 2010.2. The numbers above are calculated based on a job seeker’s initial start stream during the period. It is therefore likely
since job seekers are sometimes up-streamed during a year that these results will slightly overestimate costs for lower streams and slightly underestimate costs for higher streams.
3. Bulk Employment Pathway Fund (EPF) amounts, not associated with individual job seekers are not included in the JSA and JSKA calculations as they cannot be correctly attributed.
4. New entrant populations are defined in Appendix 1 Section 2.Source: Department of Employment administrative data and ABS Cat. 6401.0, Consumer Price Index, Australia, Mar 2013
73

5.6.4 Expenditure per employment outcome for new entrantsAlthough cost per outcome for Stream 4 job seekers for JSA was much lower, expenditure per employment outcome for Streams 1 to 3 job seekers was greater (Table 5.6). This result is driven by the higher employment outcome rates for Assessed Streams 1 to 3 job seekers in JNS compared with JSA described above. The operation of JPLOs, which could place the ‘easy’ job seekers quickly and inexpensively, potentially contributed to a lower cost per outcome under JNS.159
Table 5.6: Average expenditure by stream per employment outcome for new entrant populations ($)Stream JNS (CPI Adjusted ) JSA ChangeStream 1 887 1,140 253
Stream 2 1,451 2,844 1,393
Stream 3 4,249 4,563 314
Stream 4 13,780 8,797 -4,983
Notes: 1. Figures differ from those published elsewhere (such as in the Department of Education, Employment and Workplace
Relations Annual Reports as they are based on a study population of new entrant job seekers to services, and use different methodologies to other published measures.
2. New entrant populations are defined in Appendix 1 Section 2.3. Stream 4 cost per outcome is based on paid outcome rates (for both JNS and JSA) as PPM outcome rates were not
available for this population.Source: Department of Employment Administrative data and Post Programme Monitoring data.
5.7 Stream service effectiveness Service streams were at the core of JSA design. They were the mechanism by which funding was allocated and outcomes rewarded. Stream 1 was for work-ready job seekers while Streams 2 to 4 were for job seekers less equipped to compete in the labour market. The stream into which a job seeker was placed was largely determined by assessment of their level of labour market competitiveness using the Job Seeker Classification Instrument (JSCI) and, where required, an ESAt.
The level of service provided in each stream related to the job seeker’s labour market competitiveness. Accordingly, service and outcome fees differ according to the level of services each stream offer (Figure 2.3).
The effectiveness of streaming in providing price signals which drive outcomes for those who would usually be uncompetitive is a key evaluation issue. In response to this question the impact of being in a higher stream as compared with remaining in a lower stream was investigated. For Streams 1 to 3 allocation is based on the results of a JSCI and cut offs apply at stream boundaries. There is also a strongly inverse and largely linear relationship between JSCI scores and outcome rates generally.
Regression discontinuity analysis modelling, which compares outcome rates across stream boundaries was used to estimate the relative impact of streaming. The analysis used the rates at which job seekers came off income support after 12 months of service and compared results just above and just below stream boundaries. Further information on the methodology is in Appendix 1.
159 This is also known as ‘Creaming’ which refers to providers skimming off clients who are closest to the labour market and targeting services on them in the expectation that they are more likely to trigger an outcome payment. (Rees, j, Whitworth, A and Carter,E,2013)
74

Figure 5.2 presents the outcomes of the analysis which showed:
• a 14 percentage point difference in off income support rates between job seekers with JSCI scores at the top of Stream 1 compared with job seekers with JSCI scores at the bottom of Stream 2
• an eight percentage point increase in off income support rates at the boundary between Stream 2 and Stream 3.
Figure 5.2: Off income support rates at different JSCI scores - predicted and actual for Streams 1 to 3 (per cent)
0
10
20
30
40
50
60
70
80
90
10 12 14 16 18 20 22 24 26 28 30 32 34 36
Off
inco
me
supp
ort r
ate
(per
cen
t)
JSCI score Predicted off income support rate Stream 1 Predicted off income support rate Stream 2 Predicted off income support rate Stream 3 Actual off income support rate
8
14
Note: Refer Appendix 2, Table A2.33. Source: Department of Employment administrative data and Research and Evaluation database (RED).
There is a stark difference in the maximum outcome fees payable to providers between Stream 1 ($440), Stream 2 ($2,800) and Stream 3 ($6,600).160 Therefore, it might have been expected that higher streaming would have had a stronger effect on outcomes. These findings indicate that while a price signal which drives outcomes for those in higher streams did exist, the flexibility of the model enabled providers to respond to individual client needs and not respond simply and directly to that price signal.
To examine the effectiveness of streaming as a mechanism of resource distribution, an analysis of expenditure per job seeker by JSCI scores was also undertaken. Given the extra effort and resources required to help those with higher JSCI scores, an increase in expenditure per job seeker might be expected in line with increasing scores. This is likely to be affected by stream boundaries, where providers will feel they have more resources available and a stronger price signal to effect change. Figure 5.3 shows that while the expected increases occurred for Stream 1 job seekers, the same was not evident in Stream 2. In Stream 3 a reverse trend was discernible. This pattern could indicate 160 These amounts refer to the first year of service. See Figure 2.3 for further details.
75

‘parking’ of some higher JSCI score clients.161 The trend will also be affected by the rate of fall in outcome rates for these job seekers (since there will be lower outcome payments per job seeker). There is however an indication of reduced EPF expenditure at higher JSCI scores.
Figure 5.3: Average expenditure per job seeker in the first 12 months of JSA service by JSCI score ($)
0
500
1,000
1,500
2,000
2,500
10 11 12 12 14 15 16 17 18 19 20 21 22 23 24 25 26 27 28 29 30 31 32 33 34 35 36 37
Mea
n ex
pend
iture
per
job
seek
er (
$)
JSCI Score
EPF Non-EPF
Note: Refer Appendix 2, Table A2.34 . Source: Department of Employment administrative data.
In order to analyse this further a comparison was developed with JNS. Figure 5.4 shows similar results. That is, a similar pattern occurred in JNS, starting at around the same JSCI score of 27/28. This could indicate that there are some job seekers with JSCI scores above 27 that providers see little value in spending money on. This is likely to be because they are going to be particularly difficult to place regardless of the level of input which providers can help with. There was less evidence of preferential spending on lower JSCI score job seekers in JNS. This ‘parking’ hypothesis in JSA is further indicated by analysis of EPF expenditure for these job seekers, which shows a lower proportion of job seekers with higher JSCI scores benefited from such EPF expenditure. The proportion of job seekers who benefited from EPF was 54 per cent for job seekers with a JSCI score of 28 but much lower at 46 per cent for job seekers with a JSCI score of 37.
161 Parking is where those individuals deemed to be unlikely to generate an outcome payment are de-prioritised, perhaps receiving the minimum service specified in the contract. (Rees, J, Whitworth, A and Carter, E, 2013)
76

Figure 5.4: Average expenditure ($) per job seeker in the first 12 months of JNS service by JSCI score
0
500
1,000
1,500
2,000
2,500
3,000
10 11 12 13 14 15 16 17 18 19 20 21 22 23 24 25 26 27 28 29 30 31 32 33 34 35 36 37
Mea
n ex
pend
iture
per
job
seek
er ($
)
JSCI Score
JSKA Non-JSKA
Note: 1. 26 marked the boundary for clients being considered highly disadvantaged in JNS. There was a completely different
expenditure pattern for these clients.2. Refer Appendix 2, Table A2.35.
Source: Department of Employment administrative data.
5.8 ConclusionThe shift in focus in JSA toward improving workforce skills and assisting the most disadvantaged job seekers is reflected in the outcomes for JSA compared with JNS. JSA performed substantially better than JNS for job seekers assessed as Stream 4 against all measures of effectiveness and efficiency and for both new entrant and LTU job seekers (discussed in Chapter 7). JSA also showed much higher education outcomes for most cohorts of job seekers (discussed in Chapter 6).
Employment outcomes for job seekers assessed as Streams 1 to 3, were more mixed. As measured by PPM they were lower for new entrants in Assessed Streams 1 to 3 in JSA compared with JNS. It should be noted that PPM measures do not control for changes in the composition of the job seeker populations or macroeconomic circumstances between JNS and JSA. As a result of policy changes outlined in Section 5.4, JSA serviced a higher proportion of job seekers with part-time participation requirements than JNS, including job seekers with disability and single parents on activity tested payments. JNS on the other hand operated in a more favourable economic climate (Chapter 2). Together, these changes meant that JSA was servicing a higher proportion of job seekers who were likely more difficult to place in employment, in an environment in which overall employment opportunities had declined. This means that even if the JNS and JSA models were equally effective, as a consequence of differences in economic environments and job seeker cohorts it would be predicted that JNS would have achieved higher outcomes rates than JSA.
The lower employment outcomes for JSA may also in part reflect the short to medium-term attachment effects of the higher education outcomes achieved. Job seekers undertaking training will
77

tend to lessen or cease job search activity while they study, which reduces their short-term employment outcomes. To put this in context, however, other research found that training significantly improves the chances of job seekers finding employment (Chapter 6), and it is likely that over the longer-term, differences in employment outcomes between the models reduce.
It was possible to control for differences in job seeker characteristics and macroeconomic circumstances for the sustainability measures used in this analysis. Results for new entrant Assessed Stream 1-3 job seekers were mixed. Using these sustainability measures Assessed Stream 1 job seekers in JNS were more likely to be off NSA and YA(O) 12 months after exiting services than similar job seekers in JSA. No significant difference was found between the models for Assessed Streams 2 and 3 job seekers.
As measured by the off-income support and average reliance on income support 12 months after exit measures, Stream 1 to 3 new entrant job seekers in JNS achieved more sustainable exits than those in JSA. This is in part because higher proportions of these job seekers in JSA moved onto non-activity tested income support payments such as the DSP (from which they were less likely to exit completely).
Provider expenditure for new entrant job seekers was higher under JSA. Costs per employment outcome for new entrants were also higher under JSA for all streams, except Stream 4. This is at least in part due to the increased emphasis on education outcomes under JSA. For Assessed Stream 4 job seekers, substantial gains against all outcome measures were achieved in JSA at a substantially reduced cost.
There is evidence from a comparison of Streams 1 to 3 that, after taking job seeker characteristics into account, receiving higher stream services would have increased the chance of leaving income support. Research estimated that moving from Stream 1 to 2 would increase off-income support rates by 14 percentage points and moving from Stream 2 to 3 would increase off-income support rates by 8 percentage points.
78

6 Building labour force capacity
6.1 IntroductionIn the 2008 paper Conclusions on skills for improved productivity, employment growth and development, the International Labour Organization noted that:
[s]kills development is essential to address the opportunities and challenges to meet new demands of changing economies and new technologies in the context of globalization.162
Australia needs a highly-skilled labour force to further improve its economic position. The challenge of ongoing structural change across many industries makes it important to enable people to adjust to a changing labour market. A core focus of the Job Services Australia (JSA) programme was to improve the skills of unemployed people to help them take advantage of emerging job opportunities with a view to raising productivity, helping avoid future skills shortages and helping job seekers find employment.
This chapter analyses how well the JSA model addressed this major objective to help job seekers develop the skills needed to find and retain employment, meet employer needs and respond to emerging skills or labour shortages.
6.2 Skills development in Job Services AustraliaJob seekers had a number of options for skills development under the JSA model and choosing the most appropriate could be a complex process. Some factors that affected whether a job seeker was offered skills development and training included:
• aspects specific to the job seeker such as:
personal preferences and aspirations
vocational and non-vocational barriers
job seeker assessments such as their Employment Pathway Plan (EPP) and skills assessment.
• provider knowledge such as:
a judgement of the likely benefit to the job seeker from training
local skills needs and the local labour market
state/territory priority occupation lists
skill shortage lists.
• other considerations such as:
available Employment Pathway Funds (EPF) credits and competing demands for funds
different options available for the job seeker to access the desired skills development
availability of appropriate training courses and the associated costs
programme guidelines and availability.
162 ILO, 2008. Conclusions on skills for improved productivity, employment growth and development, International Labour Conference, Geneva.
79

Under the JSA 2009 – 2012 contract, providers were required to conduct a skills assessment for fully eligible Stream 1 job seekers before the end of the 17th week of service. For Streams 2, 3 and 4 job seekers, providers could conduct skills assessments whenever they were considered necessary. Skills assessments factor in aspects such as the job seeker’s job readiness, their skills and experience in relation to the local labour market and future skills and training needed to obtain sustainable employment. Almost three-quarters of providers reported having spent more than 30 minutes conducting the initial skills assessments for Stream 1 job seekers.163
As reported in Good Practice in Job Services Australia, high-performing sites were more likely than middle- and low-performing sites to engage job seekers in activities and training.164 They were also more likely to choose training and work experience activities that were suited to the interests and needs of individual job seekers and had potential to lead to employment – for example, courses that led to recognised, in-demand qualifications.
High performing sites prepared or negotiated with Registered Training Organisations (RTOs) or educational organisations to develop training material to meet identified skills needs and had a variety of contacts and sources to call on for training and work experience activities. Many took advantage of opportunities from other government programmes such as the Productivity Places Programme (PPP).165 High-performing sites also reported that they considered both the needs and interests of the job seeker as well as employers, local labour market conditions and the availability of training courses.166
In successive surveys JSA providers reported that they had substantially broadened the range of sources they used to identify suitable training courses to address local skills needs.167 In 2011 just 6 per cent of providers reported using the PPP as a means of identifying training suitable to meet local skills needs. This increased to 57 per cent the following year. Similar increases were reported for a range of training course information sources, such as internet-based research, networking, RTOs, industry bodies, media and government providers.
This growth indicates the adoption of more proactive business practices to meet training needs and was likely a response to problems reported in sourcing and accessing required training. In 2012, approximately 66 per cent of JSA providers reported they had been unable to refer some job seekers to training in the previous six months. In particular, that they had difficulty in providing training to their most disadvantaged job seeker groups.
The vast majority of providers who reported difficulty in referring job seekers to training cited access and availability issues.168 These issues included an inability to find suitable courses in their local area, a shortage of places on courses and problems finding courses that were offered at suitable times.
163 DEEWR, 2012. Survey of Employment Service Providers, Canberra.164 High-performing sites were identified using Star Rating and participant experience measures which were combined
into a 25 level rating, with the Star Ratings component weighted at 10 times the participant experience measure. The combined performance rating was then divided into low, medium and high performing sites. See Section 10.3 for further discussion of Star Ratings.
165 See Section 1.1.4 for information on the PPP.166 DEEWR, 2012. Good practice in Job Services Australia, Canberra.167 DEEWR, 2011, 2012. Survey of Employment Service Providers, Canberra.168 DEEWR, 2012. Survey of Employment Service Providers.
80

As noted in the Organisation for Economic Cooperation and Development (OECD) report, Activating Jobseekers: How Australia Does It:
JSA providers report that PPP places are rarely suitable for their clients…the level of the eligible qualifications – usually Certificate III or above – was too high for their job seekers. The crude monthly ballot was further complicated by the devolution of responsibility for the programme to the states and territories, all of which chose to implement it in different ways.169
Providers also mentioned issues such as limited transport and training opportunities in regional areas, job seekers being ineligible for PPP places or no PPP courses available locally. Anecdotal evidence gathered in fieldwork interviews conducted in 2010 indicated that the PPP was well supported and appreciated, but providers had problems accessing places.170 Some comments included:
We love it [Productivity Places Programme], please can we have more?
PPP is difficult to access and places are limited.
Referring a job seeker to an alternate subject or course was a strategy used by 57 per cent of providers in such situations. Provision of online/distance training was the second most common strategy, used by around 45 per cent of providers.171 Qualitative findings support these survey findings with one provider noting:
Not much available in area training-wise, most is distance learning and clients lack the skills to do this.172
Providers in such circumstances reported using other strategies such as referring job seekers to training outside the local area, providing training in-house or purchasing training.
Twenty-seven per cent of providers that reported difficulty in referring job seekers to training in the previous six months because of access to and/or availability of suitable courses stated they had been trying to source training relevant to local skills needs.173 This shortage of suitable courses would have had implications for a providers’ performance in assisting local employers to meet their skills needs and address local labour shortages.
In stakeholder consultations conducted for the evaluation of Building Australia’s Future Workforce (BAFW), RTOs reported well-established relationships with employment service providers. Linkages discussed included informal and ad hoc consultations, ongoing consultative relationships and joint information meetings for employers hosted by the RTOs in conjunction with providers.174
Projects to improve linkages and information sharing between JSA providers and RTOs were in progress at the time of this evaluation. For example, the purpose of the ACT Government National Partnership and Better Linkages project was to help RTOs and employment service providers
169 OECD, 2012. Activating Jobseekers: How Australia Does It. OECD Publishing.170 DEEWR, 2010. Departmental qualitative research round – See Section 1.2.3 for a description of this research.171 DEEWR, 2012. Survey of Employment Service Providers.172 DEEWR, 2010. Departmental qualitative research round – See Section 1.2.3 for a description of this research.173 DEEWR, 2012, Survey of Employment Service Providers.174 Department of Employment, 2013. Departmental qualitative research round – See Section 1.2.3 for a description of
this research.
81
develop strategies, tools and resources to improve information sharing and understand each other’s roles and operational environments.175
There were many ways in which training and skills needs were being addressed by Australian Government programmes during the period 2009 – 2012 that affected JSA operation. Some of these included:
• Productivity Places Programme (PPP): Mentioned above, the PPP was a National Partnership Agreement (NPA) which commenced on 1 January 2009 and concluded on 30 June 2012. The PPP was part of the Commonwealth Government’s Skilling Australia for the Future initiative, which aimed to reduce skills shortages and increase the productivity of industry and enterprises.176
• New Enterprise Incentive Scheme (NEIS): This scheme provided accredited small business training through the PPP, business advice and mentoring for job seekers who wanted to run their own business.
• Innovation Fund: This competitive grants programme was designed to address the needs of the most disadvantaged job seekers through funding projects that fostered innovative solutions to overcome barriers to employment.
6.3 Training in Job Services Australia
6.3.1 Expenditure on trainingBetween 2009 and 2012, training was the largest category of EPF expenditure in dollar terms for JSA, at $375.3 million, or 33.1 per cent of total expenditure (Table 4.2).177 By contrast, under JNS wage subsidies expenditure was the highest expenditure category (Table 4.2).178
6.3.2 Types of trainingStepping Stones survey data found that job seekers were most likely to report assistance from JSA with studying for a Certificate I or II course and least likely if they were studying for a university degree.179 Short courses undertaken with JSA provider assistance were more likely to be in job search skills than those undertaken by respondents under other arrangements. ‘Hospitality’, ‘First Aid’ and ‘Occupational Health & Safety’ were the most popular subjects for short courses.
Overall, during the period 1 July 2009 to 30 September 2011, 59 per cent of total EPF-funded training (vocational and non-vocational) was sourced from related or own entities as opposed to being provided by other training providers. Around 12 per cent of providers reported that they
175 ACT Government, Education and Training Directorate, Better Linkages webpage.176 Productivity_places_factsheet.pdf.177 Training funded through the EPF training expenditure category may have been for vocational or non-vocational
assistance. Internal research (discussed in other sections of this report) defined training as accredited and non-accredited vocational training activities, as well as non-vocational training in job search techniques and NEIS related training. Other non-vocational training/interventions were included in the ‘other’ category for this study. For EPF funded assistance non-vocational training was also funded under the training expenditure category while non-vocational interventions were funded from other EPF expenditure categories.
178 The term Job Network Services (JNS) is used when referring to Job Network and the relevant complementary services which JSA replaced.
179 See Appendix 1, Section 3.2 for a description of this analysis.
82
conducted most training for their job seekers in-house or through related entities, 41 per cent of providers most often referred their job seekers to RTOs, 39 per cent referred them to TAFE / government providers and around 7 per cent referred them to other private providers or group training companies.180
6.3.3 Course completion rates Some providers reported issues with getting some job seekers to attend training courses and motivating them to complete the courses.181 Around 88 per cent of providers report that maintaining contact with clients during vocational education and training was important or very important for a successful outcome.182
Analysis of Stepping Stones survey data provided an insight into which job seekers were more or less likely to discontinue courses before completion.183 184The analysis showed that (Table A2.36):
• JSA participants were least likely to complete high school courses (37.4 per cent) and most likely to complete Certificate I or II courses (16.0 per cent)
• job seekers were more likely to complete their course if they had a higher level of previous education, good access to transport and better mental health
• job seekers who lived with children under 16 years of age, especially those with very young children (up to four years of age), were less likely to complete their training courses than other job seekers.
6.3.4 Effectiveness of training in achieving employmentResearch using Stepping Stones data found that, after controlling for socio-demographic and local labour market characteristics, job seekers had one and a half times the odds of finding employment if they had completed a formal course of study or training in the previous six months when compared with job seekers who had not (Table A2.37).185 186 187
This confirms findings from internal research using administrative data, in which regression analysis showed that job seekers in Streams 2, 3 and 4 had more than double the odds of getting a job placement if they had received EPF funded vocational or non-vocational training (Table A2.41 to Table A2.43).188 The benefit from such training was observed across all types of job seekers. Providers were more likely to allocate EPF-funded training to those job seekers they deemed most likely to benefit from the assistance. While all efforts were made to account for this in the analysis, it is likely that unmeasured and/or unreported job seeker attributes affected the decisions of providers and these could not be accounted for in this analysis. As a result, it is likely that the odds ratios 180 DEEWR, 2012. Survey of Employment Service Providers.181 DEEWR, 2010. Departmental qualitative research round – See Section 1.2.3 for a description of this research.182 DEEWR, 2012. Survey of Employment Service Providers.183 See Section 1.2.3 for a description of this data source.184 See Appendix 1, Section 3.2 for a description of this analysis.185 See Appendix 1, Section 3.2 for a description of this analysis.186 This training may have been arranged with or without an employment service provider’s assistance.187 While this analysis controlled for known differences in job seeker characteristics some factors could not be taken
into account, such as the fact that JSA providers assisted job seekers to access training based on the chances that they might benefit from it. As such unobservable characteristics could not be measured means this analysis may have overestimated the effectiveness of study or training.
188 See Appendix 1, Section 3.1 for a description of this analysis.
83

slightly overestimate the effectiveness of the training per se, but they do measure the combined effectiveness of the provider selection process as well as the training intervention. The overall conclusion, that EPF-funded training was effective in helping job seekers obtain the skills they needed to gain employment, holds.
Research undertaken for this evaluation found that around 80 per cent of job seekers who were receiving JSA assistance and had undertaken some formal education reported that the main reason they undertook study was to improve their job prospects.189 This indicates that job seekers themselves understand the importance of education and training in terms of enhancing job opportunities. Nearly half of the job seekers who had studied and recently became employed reported that the study had helped them get or do their main job, with the course qualification level not affecting this result.190
Providers reported that job seekers frequently lacked a broad range of non-vocational work-related skills. More than two-thirds felt that the job seekers frequently lacked basic job readiness skills, social skills for fitting into the workplace, communication skills and planning/organisational skills. 191 With regard to literacy and numeracy training programmes in Australia, Rahmani and Crosier found that, following training job seekers reported significantly higher levels of:
• positive self-esteem
• positive self image
• employment commitment.192
Only 55 per cent of providers reported that they had usually or always been able to access training for their clients in non-vocational skills. When this training had been sourced, less than a quarter (23 per cent) felt that it had been very to extremely effective, 41 per cent felt it had been moderately effective and 35 per cent felt it was only somewhat effective.193
According to Stepping Stones survey data, cost was the most common reason given by job seekers for wanting to study and not being able to, but this was less of an issue for those on benefits than not on benefits.194 This indicates that government programmes that make study affordable for disadvantaged job seekers had an effect. Course unavailability was the reason for not being able to study most often overcome, while disability or ill-health were the least often overcome. There was a limited pool of funds available to providers to assist job seekers in their studies, and while some job seekers may have wanted to study, their needs could not always be met through the EPF.195
Analysis of the Post Programme Monitoring Survey (PPM) indicates that in the majority of cases JSA providers were discussing job opportunities and skills development needs with job seekers.196 Three
189 See Appendix 1, Section 3.2 for a description of this analysis.190 DEEWR, Stepping Stones survey data, cohort 3, wave 5 weighted data.191 DEEWR, 2012. Survey of Employment Service Providers, DEEWR.192 Rahmani, Z. and T. Crosier (2003), Impact of the Australian Literacy and Numeracy training program on job seekers.
Literacy & Numeracy Studies, 12(2), 31-45.193 DEEWR, 2012. Survey of Employment Service Providers, DEEWR.194 See Section 1.2.3 for a description of this data source.195 DEEWR, 2013. Commissioned analysis of the Stepping Stones survey data.196 See Section 1.2 for information on Post Programme Monitoring Survey.
84

months after exiting a JSA training placement, 73 per cent of job seekers who felt they needed to discuss extra skills and education that might help them to get work reported that their JSA provider had this discussion with them. Fifty-five per cent of job seekers who said they needed information about what training courses might help them get a job in an industry with local demand for labour stated that their JSA provider or the training organisation had discussed these matters with them.
The majority (62.5 per cent) of job seekers were happy with the information they received from their JSA provider, with job seekers in Stream 1 being the least, and job seekers in Stream 3 being most satisfied (Figure 6.1). A significant proportion of job seekers expressed a need for information about job opportunities and skills development and reported not receiving it from either their providers or training organisations. This indicates a need for improvement in this area. All stakeholders – JSA providers, training institutions, employers and government – play a role in disseminating this type of information to job seekers.
Figure 6.1: Job seeker satisfaction with training and education option information provided by JSA provider, June 2012 (per cent)
0
10
20
30
40
50
60
70
80
Stream 1 Stream 2 Stream 3 Stream 4
Per c
ent
Satisfied or very satisfied Neither satisfied nor dissatisfied Dissatisfied or very dissatisfied
Note: Refer Appendix 2, Table A2.44.Source: Department of Employment, Labour Market Assistance Outcomes, June 2012.
Deadweight and training for training’s sakeTraining carries with it the risk of ‘deadweight’ and ‘training for training’s sake’. Deadweight is where a job seeker is given assistance for training that they would have undertaken themselves, that does not contribute to the likelihood of employment, or does not lead to learning new skills. Some job seekers assigned to this type of programme reported that it imposed on other training that they had organised themselves and were already undertaking, while others felt that the training was unnecessary because they already possessed the relevant job search skills or had previously attended this type of programme.197
197 Rolfe, H. 2012. Requiring the long-term unemployed to train: Is benefit conditionality effective? National Institute Economic Review, 219, R65-R76.
85
Training for training’s sake is where the job seeker repeats the same training programme or attends irrelevant courses. An example of this would be repeated job search training activities. While initial job search training would be effective, overseas studies have found repeated applications for the same job seeker were ineffective.198 Training for training’s sake also relates to instances where the training offered is unlikely to make the job seeker more job ready. An example would be job search training for respondents in remote areas where there is little job availability. In such instances, other training options or interventions to address non-vocational barriers would be more likely to improve the job seeker’s employment prospects.
Discussions with JSA job seekers during qualitative research in 2011 found anecdotal evidence of deadweight and training for training’s sake raised by job seekers: 199
Job search training … How many times do you have to do it? I’ve been working since I was 13 and I’m 22 now and I know how to get a job. I found it a big waste of time. It’s good for kids just out of school, but not for me.’
Sent to compulsory activities that were ‘useless’ and took time away from job searching.’
There were no immediate intakes for Cert 4 so I just got put in Cert 2. I don’t want to do Cert 2 – I’m just sitting round, I know it all already. I could have gone straight to Cert 4, I didn’t need Cert 2 to get in but because it happened mid-year I missed the intake.
By contrast, 64 per cent of providers stated that they believed that ‘non-vocational’ work skills training that they had referred their job seekers to had been moderately to extremely effective.200
6.3.5 Employment Pathway Fund expenditure on trainingAs a response to perceived skill shortages at the time JSA was developed, this programme had a much greater focus on job seeker training and skill gain than did JNS. Education outcomes were improved under JSA for all streams of job seekers. Table 6.1 compares the costs associated with education and training of job seekers for the two service models.
The proportion of job seekers who were assisted in education or training was more than double under JSA when compared with JNS. There was also a slight increase in average expenditure for job seekers who benefited. Consequently, expenditure associated with training, when averaged across the whole study population was more than double under JSA compared to JNS.
198 Hsiao, C., Y. Shen, B. Wang and Weeks, G, 2008. Evaluating the Impacts of Washington State Repeated Job Search Services on the Earnings of Prime-Age Female TANF Recipients. Journal of Applied Econometrics, 22, 453-475.
199 DEEWR, 2010. Departmental qualitative research round – See Section 1.2.3 for a description of this research.200 DEEWR, 2012. Survey of Employment Service Providers, Canberra.
86

Table 6.1: Education and training related expenditure in the first 12 months of JNS and JSA, new entrants (per cent and $)
Expenditure JNS JSA
Proportion of job seekers that benefited from training (per cent) 6 13
Expenditure per benefited job seeker ($) 478 494
Expenditure per job seeker of the study population ($) 27 63
Contribution to average expenditure per job seeker (per cent) 3 7Note: CPI adjusted cost for Job Network Services (JNS).Source: Department of Employment administrative data.
6.4 Education outcomes in Job Services Australia
6.4.1 New entrant job seekersIn line with the shift in focus in JSA towards building the capacity of the workforce, new entrant job seekers in Assessed Streams 1 to 3 achieved higher education outcome rates than comparable job seekers in JNS (Figure 6.2). This finding holds across all job seeker groups examined, including youth (under 25 year olds), mature age (50 years and over), and select cohorts of disadvantaged job seekers (see Figure 7.5 in Chapter 7). The higher education outcome rates seen under JSA were at least partially offset by lower employment outcome rates due to the attachment effects (Section 5.5.1). This is consistent with the change from the ‘work first’ philosophy under JNS, to the priorities for JSA of skilling the workforce and social inclusion.
Figure 6.2: Education outcomes in Assessed Streams 1 to 3, JNS and JSA for new entrant populations (per cent)
Notes: 1. PPM results are not available for this comparison (JNS with JSA) for Assessed Stream 4 job seekers due data
limitations.2. New entrant populations are defined in Appendix 1 Section 2.1.3. Robust PPM data for Stream 4 were not available for this comparison.4. Refer Appendix 2, Table A2.23 to Table A2.26 for PPM results.
Source: Department of Employment Post Programme Monitoring Survey.
87
0
5
10
15
20
25
30
35
Stream 1 Stream 2 Stream 3
Per c
ent
Education outcomes
JNS JSA
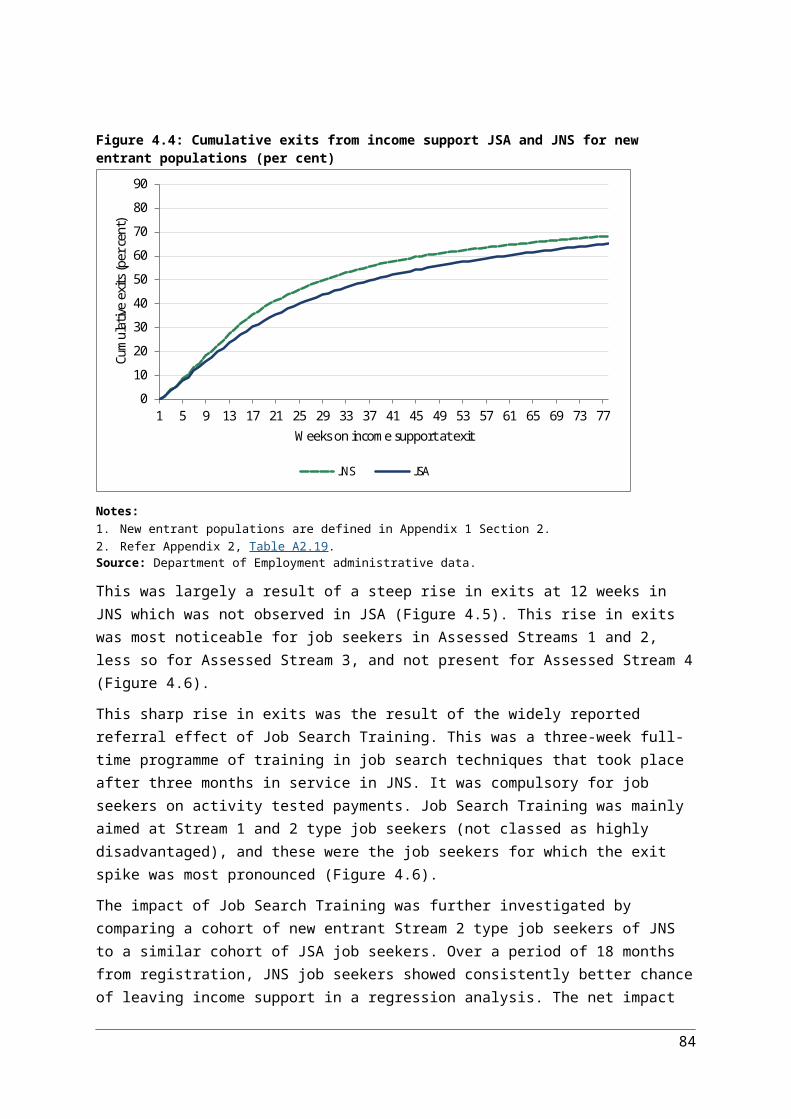
6.4.2 Long-term unemployed job seekersOutcomes for long-term unemployed (LTU) job seekers showed similar patterns to those for new entrants. Again, in line with the shift in policy focus toward education, education outcomes were substantially higher in JSA for all streams.
Figure 6.3: Education outcomes in Assessed Streams 1 to 4, JNS and JSA for long-term unemployed (LTU) job seekers (per cent)
Notes: 1. Long-term unemployed populations are defined in Appendix 1 Section 2.2.2. Refer Appendix 2, Table A2.45 to Table A2.47 for PPM results.
Source: Department of Employment Post Programme Monitoring Survey.
6.5 ConclusionThere were a number of options for skills development available to job seekers under JSA during the 2009 – 2012 contract working simultaneously with other government programmes to address skills and workforce development needs.
There is strong evidence that EPF-funded training was targeted to the more disadvantaged job seekers, reflecting the relevant JSA policy focus.
Findings on the PPP were mixed in that JSA providers reported taking advantage of the additional training but the number of places offered did not appear to have met demand. Overall, government programmes to make study more affordable for job seekers were having an effect, as cost was found to be less of a barrier to study for job seekers on income support than for job seekers not on income support.
JSA providers applied a range of strategies to address a reported lack of suitable training courses which affected specific disadvantaged groups. JSA provider assistance was more likely to be reported for Certificate I and II courses than for other accreditation levels and short courses undertaken with provider assistance were more likely to be in job search skills. While there was some anecdotal evidence of ‘deadweight’ and ‘training for training’s sake’, analysis shows that overall EPF-funded training for job seekers in Streams 2 to 4 was effective in making job seekers more job ready. Job seekers who received such training had more than double the odds of getting a job placement compared with job seekers who did not.
88
0
5
10
15
20
25
Stream 1 Stream 2 Stream 3 Stream 4
Per c
ent
Education outcomes
JNS JSA
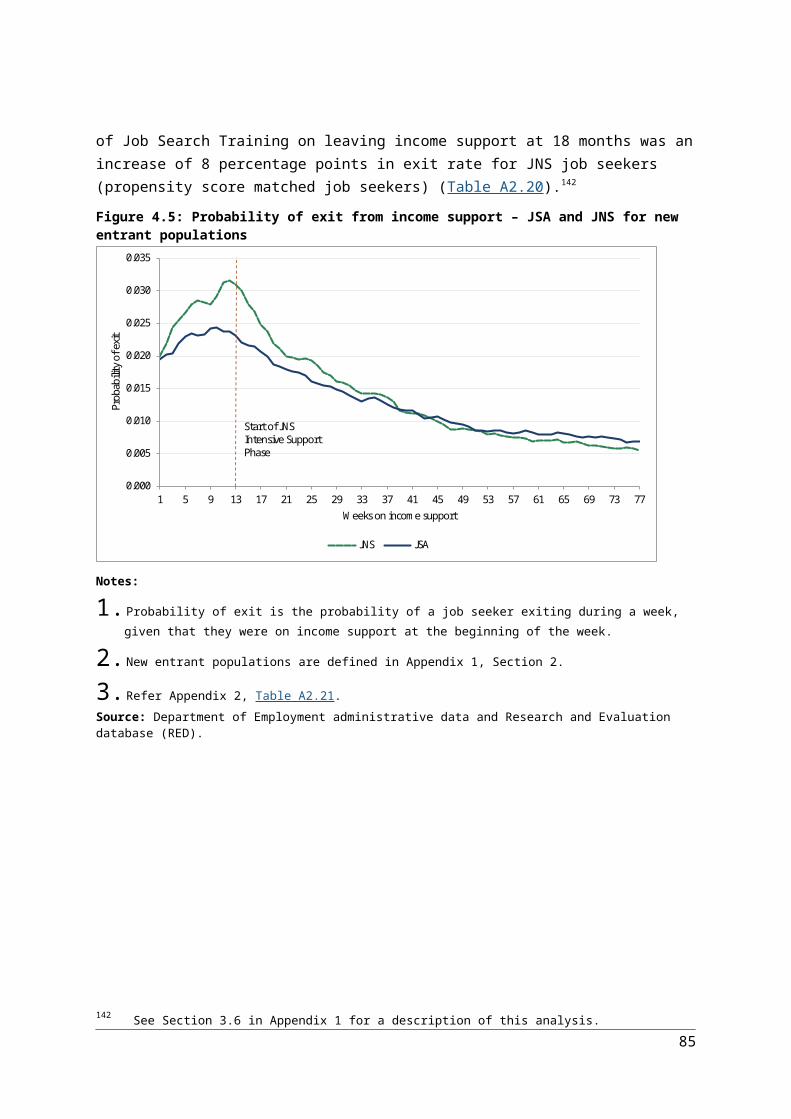
Providers reported that job seekers often lacked non-vocational skills and that they experienced problems in sourcing appropriate training in this area. However, when this training was undertaken, providers reported that most courses were effective.
Stepping Stones survey data demonstrates that job seekers were aware of the benefits of training to improve their job prospects. Almost half of job seekers who undertook study, and subsequently obtained employment, reported that the training had helped them to achieve or carry out their job.
Certain groups of job seekers were more likely to discontinue courses of study and many providers reported that maintaining contact with job seekers while they were undertaking training was important to achieving a successful outcome.
The need for improvements in communication between providers and job seekers, as well as between providers and training providers was indicated. There were initiatives underway at the time of this evaluation to improve these communication linkages.
From evidence presented it is clear that JSA was more effective than its predecessor, JNS, in helping individuals obtain skills and training. Education and training outcome rates were higher for comparable job seeker groups under JSA than under JNS. Evidence also indicates that the training and skills that JSA delivered were those needed by job seekers to secure sustainable employment. In line with the policy directions of JSA, which emphasise working toward greater participation and social inclusion, JSA was also effective in enabling participation in training and skills development for the more disadvantaged.
89

7 Disadvantaged Groups
7.1 IntroductionThe Job Services Australia (JSA) model placed a strong emphasis on servicing the most disadvantaged job seekers, investing in human capital to help them overcome their disadvantage and assisting them to become better skilled and more actively engaged in the labour market. This was in contrast to the Job Network Services (JNS) ‘work first’ focus with its emphasis on Mutual Obligation.201 This chapter examines the prevalence of different types of disadvantage in the JSA caseload; access to employment services, including access to appropriate levels of servicing; how JSA-serviced job seekers experiencing disadvantage and its comparative effectiveness against JNS servicing of the same types of groups.
7.2 Job seekers facing labour market challenges Figure 7.1 shows the prevalence of various groups in JNS as at 30 September 2007, in JSA as at 30 September 2010 and in the Australian working age (ages 15 to 64) population (as measured in the 2011 Population Census). Note that comparisons should be made with caution, as data definitions and measures vary between the different populations. People who were most likely to experience disadvantage in the labour market and therefore more likely to receive services from JSA included:
• Indigenous job seekers (11.8 per cent of the September 2010 JSA active caseload but only 2.7 per cent of the Australian working age population (ages 15 to 64))
• single parents (15.9 per cent of JSA compared with 5.4 per cent of the Australian working age population)
• people with highest level of education of less than Year 10 (15.7 per cent compared with 8.9 per cent of the Australian working age population)
• people with mixed or low English proficiency (12.7 per cent of the JSA active caseload, comparable population figure not available).202 It should be noted, however, that people from a Culturally and Linguistically Diverse (CALD) background were not overrepresented in the JSA active caseload. This indicates that proficiency in English rather than cultural background may be more important for success in the labour market.
• people who had experienced homelessness (10.3 per cent of the JSA active caseload compared with 0.5 per cent of the working age population)203
• ex-offenders (11.8 per cent of the JSA active caseload, comparable population figure not available)
• people with disability as identified by a Job Capacity Assessment (JCA) or Employment Services Assessment (ESAt) (22.3 per cent of the JSA active caseload aged 20 to 64 compared with 13.1 per cent of people in the same age group in the Australian population who have a disability and employment/schooling restriction or core activity limitation).
201 The term Job Network Services (JNS) is used when referring to Job Network and the relevant complementary services which JSA replaced
202 ABS Population Census data does not ask for proficiency in English from people born in Australia.203 COAG 2013, Affordable Housing Agreement: Homelessness 2011-12 – Comparing performance across Australia:
Report to the Council of Australian Governments (COAG).
90

Figure 7.1: JNS and JSA active caseload and Australian population aged 15–64, selected characteristics (per cent)
0
5
10
15
20
25
Indigenous Single parents Less than Year10 education
Non-Englishspeaking
background
Mixed or poorEnglish
proficiency
Homeless Ex-offenders
Per c
ent
JNS active caseload, 30 September 2007
JSA active caseload, 30 September 2010
Australian population aged 15 to 64, August 2011
Notes: 1. Information on some data items was collected in a slightly different way in JNS, JSA and the Population Census. In
particular, data on highest level of education and homeless status in JNS should be used with care. In addition, from July 2009 the Learn or Earn initiative led to an increased emphasis on accurate recording of educational qualifications for job seekers under 21 years of age.
2. Information on Indigenous Australians from the ABS Population Census has been adjusted to account for those who did not state their Indigenous status.
3. Information on homelessness in the Australian population is for people aged 12 to 64 and as reported in COAG 2013, Affordable Housing Agreement: Homelessness 2011–12 – Comparing performance across Australia: Report to the Council of Australian Governments.
4. Information on English proficiency and ex-offender status in the Australian population is not available or is not available on a comparable basis.
5. Refer Appendix 2, Table A2.48.Source: Department of Employment administrative data; Australian Bureau of Statistics, 2013 Population Census 2011.
The proportion of job seekers with disability as identified by a JCA or ESAt is lower in the JSA active caseload compared with the JNS active caseload, at 22 per cent compared with 27 per cent. This is in part due to the commencement of the uncapped Disability Employment Service (DES) in March 2010 and the ongoing effects of changes to eligibility requirements for the Disability Support Pension (DSP) from 1 July 2006 (see Chapter 1).
7.3 Multiple labour market challengesMany people face more than one type of disadvantage and according to the former Australian Social Inclusion Board (ASIB):
Multiple disadvantage can have a compounding and persistent effect, reinforcing barriers to getting ahead and increasing the likelihood of other related problems later in life.204
Multiple disadvantage presents many challenges for service provision, as employment assistance is often needed in combination with assistance in overcoming other forms of disadvantage such as homelessness or health issues. The Board estimated that around 5 per cent of the Australian 204 ASIB, 2012. Social inclusion in Australia: How Australia is faring, 2nd ed, p 6.
91

working age (ages 18 to 64) population experience multiple and complex disadvantage.205 Department estimates based on the Australian 2010 Social Survey data show:206
• unemployed people are much more likely to face multiple disadvantage (41.5 per cent of those aged 18 to 64) than either those employed (4.7 per cent) or those not in the labour force (35.1 per cent)
• people who live in a low socioeconomic area, older males, and those with dependent children aged less than 16 are more likely to face multiple disadvantage than other Australians
• unemployed people born in a country other than Australia or who live outside a major city are more likely to face multiple disadvantage than other unemployed people.207
Internal departmental research found that job seekers in the JSA caseload with these characteristics were also more likely to face multiple disadvantage (Table A2.49). In addition, job seekers in JSA who were on an activity tested payment, had been on income support for more than two of the previous 10 years, were without recent work experience or were ex-offenders were more likely to experience multiple disadvantage than other job seekers.
7.3.1 Labour market disadvantage in the Job Services Australia caseload This section describes results from internal research on disadvantage and multiple disadvantage in the JSA caseload.208 The research uses the conceptual domains of Material, Health, Social, Education and Community disadvantage.209 These domains are based on previous work measuring multiple disadvantage and social inclusion by ASIB, the Melbourne Institute and the Productivity Commission.210 211 212
The prevalence of disadvantage of each of the five domains in the JSA caseload is presented in Table 7.1. A greater proportion of males than females reported disadvantage in all domains (Material, Education, Community and Social) except Health. The prevalence of Material, Health and Social disadvantage was found to increase with age, while that of Educational and Community disadvantage decreased (data not shown) (Table A2.50). These findings have implications for the types of services that job seekers are likely to require, and how changes in the composition of the caseload could affect future service requirements.
205 ASIB, 2012. Social Inclusion in Australia: How Australia is faring, 2nd ed.206 Department analysis used similar, but not identical, measures to define multiple and complex disadvantage to those
used by ASIB. These measures were based on the work undertaken by ASIB, the Melbourne Institute and the Productivity Commission.
207 Internal analysis of ABS, 2010. General social survey, Expanded CURF file, ABS Remote Data Laboratory (RADL).208 See Appendix 1, Section 3.3 for a description of methodology.209 Material disadvantage is disadvantage caused by a lack of access to material wealth or income. It is aligned with, but
not the same as, income deprivation.210 ASIB, 2009, National social inclusion measurement and reporting strategy.211 Melbourne Institute of Applied Economic and Social Research, 2013. A statistical report on waves 1 to 10 of the
Household, Income and Labour Dynamics in Australia Survey.212 McLachlan, R, Gilfillan, G and Gordon, J, 2013. Deep and persistent disadvantage in Australia, revised, Productivity
Commission Staff Working Paper, Canberra.
92
Table 7.1: Proportion of Job Services Australia caseload that experiences disadvantage in each of five domains (per cent)
Population Material Education Health Community Social
All job seekers 52.1 55.4 45.5 29.9 40.1
Males 54.2 57.6 44.6 31.3 42.9
Females 49.6 52.9 46.5 28.1 36.8
Indigenous job seekers 66.8 79.0 43.7 48.7 70.0Note: Job seekers unemployed less than three months are excluded from the analysis.Source: Department of Employment Stepping Stones survey, cohort 3, wave 5 weighted data.
In this study, ‘multiple disadvantage’ is defined as the presence of disadvantage in three or more of these five domains. An estimated 41 per cent of JSA job seekers receiving services at February 2011 who had been unemployed for three months or more experienced multiple disadvantage. The prevalence of multiple disadvantage was much higher in an otherwise similar Indigenous population (71 per cent).
In the same study, multiple disadvantage was found to be associated with significantly lower employment outcomes. Job seekers in all streams who experienced multiple disadvantage were less likely to leave income support than job seekers who did not (Table A2.51). Similarly job seekers in Streams 2, 3 and 4 experiencing multiple disadvantage were less likely to have achieved a job placement or maintained a placement for 13 weeks than job seekers who did not experience multiple disadvantage (Table A2.52 to Table A2.53).
An investigation into the combinations of domains of disadvantage found that issues in the Material and Health domains were associated with significantly lower labour market outcomes in their own right and in terms of their interaction with the other three domains (Table A2.54 to Table A2.55).
7.4 Servicing disadvantaged job seekersThe JSA model incorporated a number of features designed to provide appropriate assistance to job seekers according to their level of disadvantage. The most important of these were the service streams, the assessment processes that allocated job seekers to them, and the emphasis on individualised servicing within each stream. Stream 4 services targeted the most disadvantaged job seekers. Many job seekers in the lower streams also experienced disadvantage, including multiple disadvantage. Figure 7.2 shows the proportions of select groups of job seekers likely to face disadvantage allocated to each stream in the JSA caseload. For instance, over half of all job seekers identified as homeless were in Stream 4, but another quarter were in either Stream 1 or 2. Mature age job seekers and single parents were the client groups with the lowest proportions in Stream 4, at 12 per cent and 14 per cent respectively.
93

Figure 7.2: JSA active caseload, disadvantaged groups by stream, September 2010 (per cent)
0 10 20 30 40 50 60 70 80 90 100
Indigenous
Disability based on ESAt or JCA
Mixed or poor English proficiency
Homeless
Ex-offenders
Single parents
Youth under 21
Mature age 50 or over
Long-term unemployed
Very long-term unemployed
Per cent
Stream 1 limited Stream 1 Stream 2 Stream 3 Stream 4
Note: Refer Appendix 2, Table A2.56.Source: Department of Employment administrative data and Research and Evaluation Dataset (RED) data.
Specialist providers in JSA delivered stream services for specific groups of disadvantaged job seekers, including:
• Indigenous job seekers
• people from CALD backgrounds, including migrants and refugees
• young people and youth at risk, including homeless youth
• job seekers with disability
• people who were homeless or at risk of homelessness
• ex-offenders.
7.4.1 Stream 4Stream 4 was designed to provide integrated, intensive assistance for job seekers with severe barriers to employment.213 It offered pre-employment and employment activities tailored to the individual needs of the most disadvantaged job seekers.
Stream 4 replaced two pre-employment programmes in JNS for highly disadvantaged job seekers: the Personal Support Programme (PSP) and the Job Placement, Education and Training Programme (JPET) (for young people).214 Job seekers assessed as suitable for PSP or JPET had similar levels of disadvantage to those placed in Stream 4 under JSA. Places in PSP were capped, however, whereas Stream 4 services were not.
213 DEEWR, 2008. Request for Tender for Employment Services 2009 – 2012.214 See Chapter 1 for more detail on these programmes.
94
The proportion of the active caseload assigned to Stream 4 had largely stabilised at around 20 per cent after increasing steadily through the first two years of the JSA period with the staged transition of highly disadvantaged job seekers from JNS. At the end of June 2012, Stream 4 job seekers comprised 21.6 per cent of the JSA active caseload (Figure 3.3).
7.4.2 Access to services for the most disadvantagedJNS and JSA differed considerably in their access to services for job seekers with multiple and complex barriers to employment. Under both models, access to higher levels of service for the most highly disadvantaged required a recommendation from a JCA or in JSA, an ESAt. Under the JNS service delivery model, places in the PSP were capped and the duration of assistance provided was limited to the time specified in the job seeker’s assessment recommendation (and capped at two years). This meant that job seekers could exit the programme without achieving any appropriate or favourable outcomes and may not have been eligible for continued specialised assistance. Under JNS, the job seeker could then effectively become ‘parked’ in employment services, tied to Mutual Obligation requirements with no real prospects of any long-term employment outcomes without the assistance of the provider that they needed to address employment barriers.
By contrast, in JSA places in Stream 4 services were not capped and there was no limit to the duration of Stream 4 assistance provided. Once job seekers had been referred to Stream 4, they could commence in that stream immediately and should not be reassigned to a lower stream during their period of assistance.
7.4.2.1 Time to commencement in servicesFor new entrant job seekers time to commencement in services could be delayed for a variety of reasons, including health or personal reasons or the need to arrange, conduct and finalise a JCA or ESAt. In addition, only job ready job seekers were eligible for RapidConnect (see Chapter 3). In JSA the median time for highly disadvantaged job seekers to commence in services was 30 days, as opposed to 14 days in JNS. The time to commence 90 per cent of highly disadvantaged job seekers was 107 days for JSA and 134 days for JNS. This delay was at least in part due to the time involved in making suitable assessments and appropriate recommendations. These figures suggest that there was room for improvement in these processes.
7.4.2.2 Time to recommendation and placement in Stream 4 type servicesThis section examines the time taken for new entrant job seekers who were assessed as highly disadvantaged at any time during their period of assistance to be referred and placed in appropriate services. It shows considerable difference between the models.
The median time from registration date to recommendation to Stream 4 type services in JSA was 14 weeks compared to 16 weeks for job seekers in JNS (Table A2.57). The median time to placement in Stream 4 type services under JSA was 16 weeks compared to 32 weeks under JNS. One year from registration, only 66 per cent of periods of assistance for those assessed as Stream 4 type job seekers had resulted in a placement in an appropriate programme in JNS, including 84 per cent of those recommended to JPET and 57 per cent of those recommended to PSP. This was mainly due to the cap on placements in PSP. By comparison, over a similar time period 88 per cent of those recommended to Stream 4 in JSA had been placed in Stream 4 (Figure 7.3). In JNS over 18 per cent
95

or 6,663 of the periods of assistance for job seekers assessed as requiring Stream 4 type services had not resulted in a placement in these services within the job seekers’ period of assistance.
Figure 7.3: Time to placement in Stream 4 type services, JNS and JSA new entrant populations (weeks)
0
10
20
30
40
50
60
70
80
90
100
1 13 25 37 49 61 73 85 97 109 121
Per c
ent
Weeks to placement in Stream 4 type services
JPET PSP JSA
Note: Refer Appendix 2, Table A2.58.Source: Department of Employment administrative data.
The above demonstrates that JSA was comparatively more effective than JNS in placing the most disadvantaged job seekers in the appropriate services. It may also help to explain why JSA was found in this evaluation to be both more effective and more cost efficient than JNS in achieving sustainable employment and education outcomes for this group.
Findings from the JSA Demonstration Pilots suggest that some changes to the assessment processes for disadvantaged job seekers in JSA could be considered.215 These results indicate that the thorough and ongoing assessment of more disadvantaged job seekers can help create structure and routine for these job seekers and assist in tracking their progress against their goals. In pilots where additional assessments (beyond the Job Seeker Classification Instrument (JSCI) and ESAt) were used, job seekers did not see the extended assessment processes as an imposition, rather, they responded positively to the process.216
7.4.3 Service planning and delivery
7.4.3.1 Approaches to overcoming barriers to employmentHow service providers managed job seeker barriers to employment varied across service providers. Good Practice in Job Services Australia reported that some common strategies included:
215 The JSA Demonstration Pilots was a discretionary grants programme which commenced in July 2011 and ceased on 30 June 2013. The projects enabled the Department to work with leading providers to capture best practice in service delivery, explore new approaches and partnerships, with the aim of achieving improved employment and education outcomes for highly disadvantaged job seekers, including those with multiple barriers to employment. For information on the JSA Demonstration Pilots see Section 1.1.3.
216 DEEWR,2013. Job Services Australia demonstration pilots: Better Practice Guide 1 – Assessment, Canberra.
96

• looking for ways to address non-vocational and vocational barriers at the same time
• engaging job seekers in activities that will improve employment opportunities
• investing more time and resources in building rapport with job seekers with greater needs.217
Middle- and high-performing sites were more likely to report that ‘non-vocational barriers often sort themselves out when a job seeker has employment’ and that vocational and non-vocational barriers should be addressed together where possible:218
Yes, welfare is important and they need care and they need development but we also need to transition them into employment because in 12 to 18 months they will be doing work experience anyway. ... A lot of them that are in a rehabilitation process, that employment is a big part of that rehabilitation, having too much spare time on their hands just puts them back perhaps to where they previously were.
Employment consultant, regional centre, Victoria219
However, around half of employment service providers believed that ‘without addressing non-vocational barriers, job seekers never achieve a sustainable job outcome’.220
High-performing sites were more likely to have access to a range of resources to help address vocational and non-vocational barriers – for example: strong links with external training providers and professional services such as psychologists or counsellors; in-house services such as life coaches or counsellors; and access to other resources such as emergency and short-term accommodation for job seekers in need of it.221
Job seekers who responded to the Employment Assistance Survey (EAS) noted the most common way in which providers helped them overcome their barriers was by providing ‘general support/ encouragement/understanding’.222
7.4.3.2 Employment Pathway Plans Employment Pathway Plans (EPP) linked identified barriers to employment to strategies that can help overcome them. These strategies should have informed decisions on Employment Pathway Fund (EPF) expenditure for individual job seekers.
Survey results indicate that, of all job seekers, disadvantaged job seekers were most positive about their EPPs, with 68 per cent of Streams 3 and 4 job seekers agreeing their EPP suited their needs compared with 58 per cent of Stream 1 and 63 per cent of Stream 2 job seekers.223
217 DEEWR, 2012. Good practice in Job Services Australia, Canberra.218 High-performing sites were identified using Star Rating and participant experience measures which were combined
into a 25 level rating, with the Star Ratings component weighted at 10 times the participant experience measure. The combined performance rating was then divided into low, medium and high performing sites. See Section 10.3 for further discussion of Star Ratings.
219 DEEWR, 2012. Good practice in Job Services Australia, Canberra, p.11.220 DEEWR, 2012. Good practice in Job Services Australia, Canberra, p.11.221 DEEWR, 2012. Good practice in Job Services Australia, Canberra.222 DEEWR ,2012. Good practice in Job Services Australia, Canberra, p.11.223 DEEWR, 2012. Employment Pathway Fund, Ch 1 – Introduction, Canberra.
97

Findings from the JSA Demonstration Pilots indicate that a strong case plan and clear goals were particularly important for Stream 4 job seekers. They suggest that, for future service provision, EPP documentation and processes for job seekers with significant barriers to employment should be reviewed to ensure that the EPP:
• provides clear expectations of job seeker compliance
• encourages job seeker ownership
• can be used as a central part of service planning and delivery, including where joint service delivery arrangements are in place.224
Other findings from these pilots support the idea that increased frequency and quality of contact with Stream 4 job seekers – for instance, by conducting more frequent, longer or more purposeful interviews in an appropriate environment – can lead to increased job seeker motivation and engagement in employment services.225
7.4.3.3 Employment Pathway Fund Under the JSA contract the amount of notional EPF credit that providers received for each job seeker was linked to the job seeker’s level of disadvantage. Providers were able to use these funds flexibly to assist any job seeker or group of job seekers. Generally, EPF purchases should meet the needs of job seekers as defined in their EPP.226
A 2012 EPF study found that, as intended, the EPF was generally used more for disadvantaged job seekers. Stream 4 job seekers received on average more EPF expenditure than other job seekers, at $1,398 and 7.2 EPF transactions per job seeker. Stream 3 job seekers received $1,150 and 6.2 EPF transactions on average. By comparison, Stream 2 job seekers received $778 and 4.3 EPF transactions per job seeker on average and Stream 1 job seekers received $245 and 2.0 EPF transactions. Approximately 23 per cent of Stream 4 job seekers and 32 per cent of Stream 3 job seekers did not receive any EPF assistance at all in the reference period.227 Possible explanations include:
• highly disadvantaged job seekers took longer to connect with services, as noted above
• highly disadvantaged job seekers were more likely to be on suspension or exemption from services than more job ready job seekers.228
• appropriate services for more highly disadvantaged job seekers may not have been available. For instance, providers reported that highly disadvantaged job seekers were among the most difficult to arrange training for.
• providers in some instances may have seen little incentive in spending EPF funds on less competitive job seekers for whom an early employment outcome was not likely.
224 DEEWR, 2013. Job Services Australia demonstration pilots: Better Practice Guide 2 – case planning, Canberra.225 DEEWR, 2013. Job Services Australia demonstration pilots: Better Practice Guide 3 – job seeker contact, Canberra.226 DEEWR, 2009. Employment Services Deed 2009 – 2012 – Stream Services. General Deed Variation No 4, Canberra.227 DEEWR, 2012. Employment Pathway Fund, Ch 1: Introduction, Canberra.228 On 30 September 2010, for example, 27 per cent of Stream 3 job seekers and 25 per cent of Stream 4 job seekers
were on suspension from services for health, employment, study, caring responsibilities or other reasons.
98
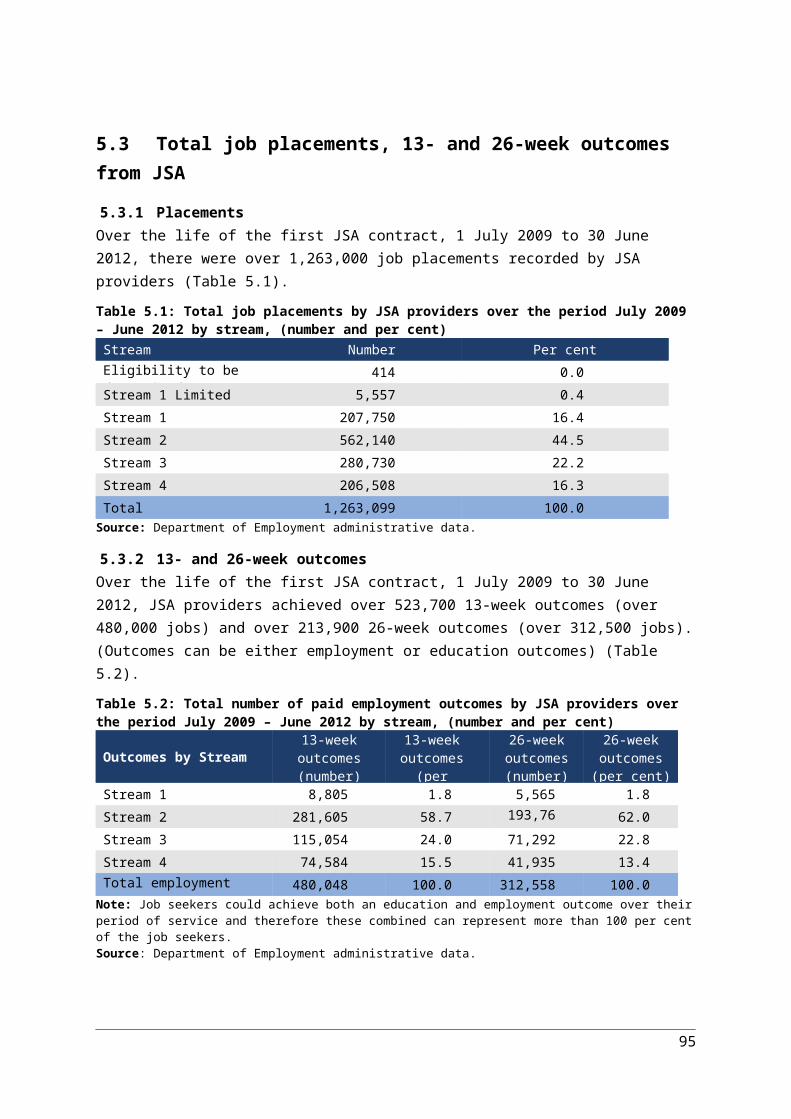
Evidence from internal research also suggests that the EPF was used to purchase appropriate services for Stream 4 job seekers. These job seekers received proportionally more of their total EPF expenditure in the Professional Services purchase category than job seekers in other streams. This category included items such as mental health counselling, vocational rehabilitation and drug and alcohol counselling and rehabilitation, reflecting the non-vocational barriers that Stream 4 job seekers experience.
7.4.3.4 Wage ConnectWage Connect was a wage subsidy which operated outside the EPF, and was aimed at supporting the employment of people with no or minimal recent work experience, who had been on income support payments for at least the last two years. Announced as part of the Australian Government’s Building Australia’s Future Workforce (BAFW) package, it became available from 1 January 2012. The objective of this subsidy was to give job seekers access to paid work in order to maximise their chances of becoming attached long-term to the labour market. As any employment outcomes from this programme would not be measurable during the period of this evaluation Wage Connect will be considered in future evaluations.
7.4.4 Work experienceUnder JSA 2009 participants who remained in Stream 4 for 12 months underwent a Stream Services Review (SSR), which determined if they would benefit from additional assistance for up to six months.229 If it was found that they would not, or at the end of the additional six months, Stream 4 job seekers entered the Work Experience Phase (WEPh). A Compulsory Activity Phase (CAP) was introduced in July 2012 as part of the BAFW package. The CAP was applied to job seekers who had been in employment services for two years. It is unlikely any measurable changes could be attributable to CAP during the period of this evaluation (to 30 June 2012). The effectiveness of the CAP introduction is assessed the JSA 2012-15 evaluation.
By June 2012 around 26 per cent of job seekers in Stream 4 had entered the WEPh. Between 1 July 2009 and 30 June 2012, around 27 per cent of WEPh activities for Stream 4 job seekers were accredited/non-accredited vocational courses (compared with 32 per cent for Stream 2), while non-vocational interventions accounted for another 26 per cent (compared with 4.7 per cent for Stream 2). This indicates the priority given to addressing non-vocational barriers for these job seekers. Sixty-one per cent of activities undertaken by Stream 4 job seekers outside of the WEPh were accredited/non-accredited vocational courses.
7.5 Outcomes for selected job seeker groups
7.5.1 New entrantsThe comparative outcomes between JNS and JSA for groups of job seekers experiencing particular types of disadvantage were mixed. Post Programme Monitoring (PPM) survey results show employment outcomes for new entrant job seekers in Assessed Streams 1 to 3 were much lower than overall results for some groups such as job seekers with disability (with work restrictions) and mature age females, although they were slightly higher than results for similar job seekers in JNS. Other groups showed considerably lower levels of employment outcomes in JSA compared with JNS,
229 Stream Service Reviews ceased from 1 July 2012.
99
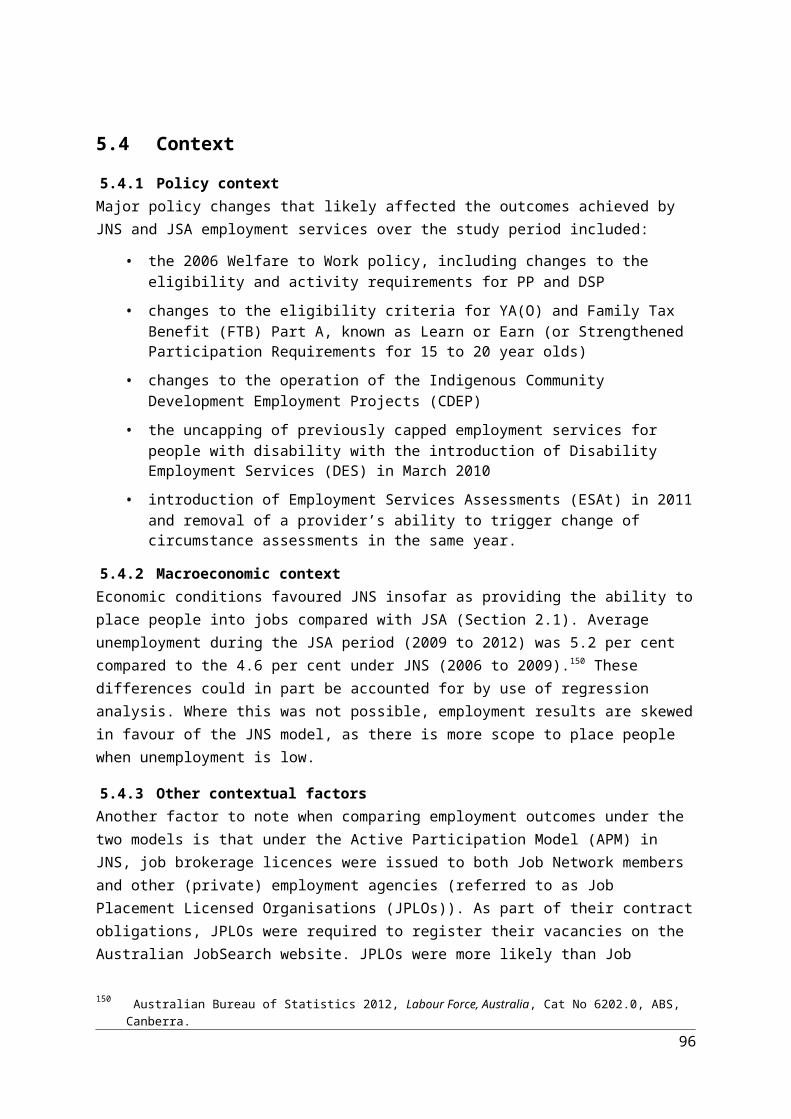
including young job seekers, job seekers with mixed or low English proficiency and job seekers from CALD backgrounds (Figure 7.4).
Figure 7.4: Employment outcomes in Assessed Streams 1 to 3, selected groups for new entrant job seekers (per cent)
Notes: 1. PPM results are not available for this comparison (JNS with JSA) of Assessed Stream 4 job seekers due to data
limitations.2. Refer Appendix 2, Table A2.23 to Table A2.26 for PPM results.
Source: Department of Employment Post Programme Monitoring Survey.
These results are at least in part due to the increased focus in JSA on education and training. All categories show better education outcomes in JSA than JNS. For example, young job seekers, show substantial increases in education outcomes for new entrant job seekers in Assessed Streams 1 to 3, as do low and non- English speakers, people with disability and single parents (Figure 7.5).
Figure 7.5: Education and training outcomes in Assessed Streams 1 to 3, selected groups for new entrant job seekers (per cent) Notes:1. PPM results are not available for this comparison (JNS with JSA) of Assessed Stream 4 job seekers due to data
limitations.2. Refer Appendix 2, Table A2.23 to Table A2.26 for PPM results.
Source: Department of Employment Post Programme Monitoring Survey.
7.5.2 Long-term unemployedFor long-term unemployed (LTU) job seekers, job seekers with disability (with employment restrictions), mixed or low English proficiency and mature age males in both JNS and JSA reported the lowest employment outcomes (Figure 7.6). There were marked improvements in education outcomes for all of these job seeker groups under the JSA model. Job seekers with mixed or low English proficiency or from a CALD background showed the highest education and training outcomes under JSA (Figure 7.7).230
Figure 7.6: Employment outcomes for long-term unemployed (LTU) job seekers, selected groups (per cent)
230 See Appendix 1, Section 2.2 for a description of how long term unemployed comparisons were made.
100
0 10 20 30 40 50 60 70 80
Single parents
JCA/ESAt identified disability
Males aged 50+ years
Females aged 50+ years
Males aged < 25 years
Females aged < 25 years
Culturally and Linguistically Diverse
Mixed or low English proficiency
Overall Assessed Stream 1 to 3
Per cent
JSA JNS

Note: Refer Appendix 2, Table A2.45 to Table A 2.47 for PPM results.Source: Department of Employment Post Programme Monitoring Survey.
Figure 7.7: Education and training outcomes for long-term unemployed (LTU) job seekers, selected groups (per cent)
JNS JSA
Single parents 11.5 19.1
JCA/ESAt identified disability 9.1 15.3
Males aged 50+ years 6.3 10.1
Females aged 50+ years 8.9 18.4
Males aged < 25 years 11.3 18.8
Females aged < 25 years 14.4 24
Culturally and Linguistically Diverse 16.2 27.8
Mixed or poor English proficiency 16.2 28.3
Overall Assessed Stream 1 to 4 10.5 17.6Note: Refer Appendix 2, Table A2.45 to Table A2.47 for PPM results.Source: Department of Employment Post Programme Monitoring Survey.
101
0 5 10 15 20 25 30
Single parents
JCA/ESAt identified disability
Males aged 50+ years
Females aged 50+ years
Males aged < 25 years
Females aged < 25 years
Culturally and Linguistically Diverse
Mixed or poor English proficiency
Overall Assessed Stream 1 to 4
Per cent
JSA JNS
0 10 20 30 40 50 60 70
Single parents
JCA/ESAt identified disability
Males aged 50+ years
Females aged 50+ years
Males aged < 25 years
Females aged < 25 years
Culturally and Linguistically Diverse
Mixed or poor English proficiency
Overall Assessed Stream 1 to 4
Per cent
JSA JNS

7.6 Client groups likely to experience labour market disadvantage This section examines services and outcomes for groups of job seekers most likely to experience disadvantage in the labour market. Services and results for Indigenous job seekers are discussed in Chapter 8.
7.6.1 Single parents
Participation in employment servicesThe Productivity Commission reported in 2013 that single parents were one of the groups most likely to experience deep, persistent and multiple disadvantage in Australia.231
The Welfare to Work reforms introduced on 1 July 2006 (see Chapter 2) resulted in an increase in the number of single parents participating in employment services, including single parents with school-age children commencing Newstart Allowance (NSA) with part-time activity requirements. It also included many existing recipients of Parenting Payment (PP) (‘grandfathered’ PP recipients), who gained participation requirements when their youngest child turned seven or from 1 July 2007, whichever came later. Many of these parents had been out of the workforce for long periods. Although they had access to Employment Preparation and other forms of support under JNS, many went on to become LTU in the JSA caseload. Over 15 per cent of both LTU study populations (15.3 per cent of JNS and 16.7 per cent of JSA) were identified as grandfathered PP recipients at some time during their period of service.
At the end of June 2012, there were over 95,000 single parents (13 per cent) in the JSA caseload. Single parents are more likely to become LTU than other job seekers and in September 2010 comprised 18 per cent of the LTU population (Table A2.59). This was due in part to more flexible participation requirements which provide activity options other than looking for full-time work.232
Outcomes The PPM measures of employment outcomes were quite high for single parents in both JNS and JSA (Figures 7.4 and 7.6). The larger proportion of single parent job seekers with part-time participation requirements in the JSA caseload compared with the JNS caseload was reflected in the difference in full-time and part-time employment outcomes for LTU single parents between the models. LTU single parents had substantially lower full-time employment outcomes in JSA compared with JNS (20 per cent compared with 38 per cent), but higher part-time employment outcomes (34 per cent compared with 26 per cent).
New entrant single parents in Stream 4 were much more likely to get both job placements and 13-week employment outcomes when compared with similar job seekers in JNS (Table A2.30 and Table A2.31).
Departmental modelling shows single parents were much less likely than other job seekers to exit services or move off income support under both JNS and JSA, despite relatively high employment outcome rates (Table A2.32). Again, this is probably due to the part-time nature of the participation requirements for this group. Job seekers identified as grandfathered PP recipients who went on to
231 McLachlan, R, Gilfillan, G and Gordon, J 2013. Deep and persistent disadvantage in Australia, Productivity Commission Staff Working Paper.
232 Department of Human Services Flexible Arrangements for Parents and Carers brochure
102
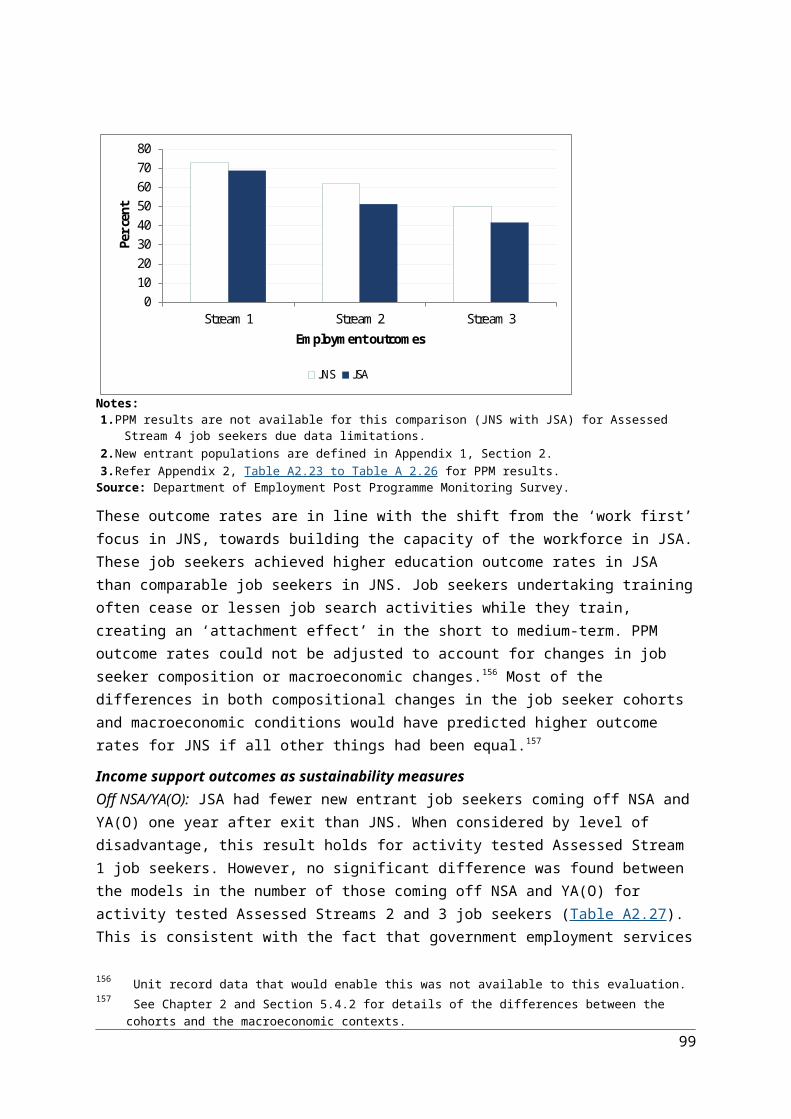
become LTU in JSA had lower odds of exiting JSA than other LTU single parents, irrespective of their benefit type or single parent status at the study caseload date (Table A2.60).233 Many of these job seekers had entered employment services after extended periods not in the labour force.
With respect to LTU single parents who did exit services, the rate at which they came off Newstart Allowance (NSA) and Youth Allowance (Other) (YA(O)) was higher for JSA than for JNS, at 73.9 per cent compared with 66.2 per cent, and average reliance on income support after exiting services was much lower at 52.7 per cent compared with 61.8 per cent (Table A2.61 to Table A2.63).
Over 12 per cent of all exits by LTU single parents from the JSA study population were due to disability, with 5 per cent moving to the DSP and 7 per cent exiting to DES (Table A2.64).234
DiscussionSingle parents made up a substantial share of the JSA caseload and more than half (59 per cent at June 2012) were LTU. Parenting responsibilities and other circumstances will mean they will likely remain in employment services for considerable periods. Under the first JSA contract single parents with school-age children were only required to undertake employment considered suitable for their circumstances – for example, during times and in locations where child care was available – and that resulted in net financial gain. In addition, parents in poor labour market areas could fulfil their activity requirements through voluntary work, and remain attached to employment services.
Surveys have found employer attitudes toward parents who have been out of the workforce for long periods are generally positive (Chapter 9).235 However many employers consider these job seekers challenging to employ. Their main concerns include a lack of necessary skills, such as up-to-date information technology skills or qualifications (28 per cent of employers) and the employees’ greater need for flexible work practices (16 per cent). These findings vindicate the increased emphasis on education and training outcomes under JSA, as these increased opportunities would likely improve employment prospects for single parents in the longer-term.
The National Employment Services Association (NESA), in its response to the Employment services — building on success discussion paper, recommended that single parents be provided access to Stream 2 services or above.236 The Australian Council of Social Service (ACOSS), in its response also recommended increased support, such as use of an employment guidance and preparation service that incorporates career guidance, work orientation and funding for training for single parents and other job seekers who have been out of work for at least two years.237
7.6.2 Job seekers with disabilityAt 30 June 2012 job seekers with disability (with employment restrictions), as identified using an ESAt, made up 18 per cent of the active, commenced caseload. Another 11 per cent of the caseload had a disability or medical condition identified by JSCI only.
233 See Appendix 1, Section 2.2 for more information about this study.234 See Appendix 1, Section 2.2 for more information about this study.235 Surveys of Employers which are conducted by the Department of Employment (formerly DEEWR) are described in
Chapter 1.236 National Employment Services Association, 2013. Realising our potential: Response to ‘Employment services —
building on success’ discussion paper, NESA, Melbourne.237 Australian Council of Social Services, 2013. Partnerships for participation: Submission to Minister for Employment —
Participation on reform of employment services, ACOSS Paper 200.
103

Participation in employment servicesThe number and characteristics of job seekers with disability in JNS and JSA changed over time due to two reasons. The first was the introduction of the uncapped DES in March 2010, which replaced the Disability Employment Network (DEN) and Vocational Rehabilitation Services (VRS) programmes, parts of which were capped. The second was changes in the eligibility requirements for the DSP from 1 July 2006. The first change is likely to have led to some job seekers with more severe disabilities transferring from JSA to DES, while the second led to an increasing number of people with disability entering JSA on NSA with participation requirements.
The majority of job seekers with an employment restriction in JSA had either physical or psychiatric primary medical conditions and most were in Streams 3 and 4 (Table 7.2). The ESAt assessed areas in which a job seeker required support. Employment support needs were identified for around three-quarters (76 per cent) of those job seekers on the JSA caseload that had an ESAt identified disability as at 30 June 2012. The assessed areas of need were to maintain employment (50 per cent of all job seekers with an ESAt identified disability), to build work capacity (46 per cent), for support with social behaviour (41 per cent), for support with learning (31 per cent) and mobility (25 per cent).
Table 7.2: Job seekers with disability with employment restrictions in the JSA active commenced caseload, by first medical condition, 30 June 2012 (per cent and total numbers)
First reported medical condition
Streams 1–2 (per cent)
Stream 3 (per cent)
Stream 4 (per cent)
Total (per cent)
Total (number)
Physical 53.0 60.5 33.3 48.6 58,244
Psychiatric 41.4 33.8 62.4 46.2 55,367
Learning 2.6 2.0 2.3 2.3 2,762
Sensory 2.2 2.7 1.4 2.1 2,491
Intellectual 0.5 0.7 0.6 0.6 744
Unknown 0.2 0.2 0.0 0.1 174
Total 100.0 100.0 100.0 100.0 119,782Notes:1. Commenced caseload includes those who commenced in JSA and were then suspended as at 30 June 2012. 2. Based on first recorded condition only.3. Numbers may not add up due to rounding.4. The proportion of job seekers who were in Stream 1 or 2 was 29.1 per cent, 35.3 per cent in Stream 3 and 35.6 per
cent in Stream 4.Source: Department of Employment administrative data.
OutcomesJob seekers with disability achieved somewhat better employment outcomes under JSA compared with JNS (Figures 7.4 and 7.6). These results are skewed in favour of JSA because of the changes in the composition of the study populations described above – in particular, the uncapping of specialist disability employment services. However internal modelling that controls for job seeker characteristics and macroeconomic change found that new entrants with disability in JSA Stream 4 were far more likely to achieve job placements and 13-week outcomes compared with similar job seekers in JNS (Table A2.30 and Table A2.31 ) .238
238 See Appendix 1, Section 2.1 for more information on research methods.
104

Employment and sustainability rates for people with disability in JSA remained much lower than for other job seekers. In both JNS and JSA, job seekers with disability were much less likely to be off income support 12 months after exiting services than those without disability (Table 7.3). This is in part due to the high proportion of people with disability who exited to the DSP or specialist disability services — sixty-three per cent of LTU job seekers with disability who exited the JSA LTU study population did so for these reasons.239
Table 7.3: Off-income support rates one year after exit from employment services for job seekers with disability with employment restrictions, JNS and JSA study population (per cent)
New entrantPopulation JNS JSAJob seekers with disability 43.6 43.6
All job seekers 74.0 69.3
Long-term unemployedPopulation JNS JSAJob seekers with disability 16.6 20.4
All job seekers 31.4 39.6
Note: See Appendix 2, Table A2.28 and Table A2.62.Source: Department of Employment administrative data and Research and Evaluation database (RED).
Job Services Australia and specialist disability servicesThe processes of assessment and referral of job seekers were complex, due to diversity within the population. The ESAt was designed as a systematic way of allocating job seekers to the most appropriate programme, allowing an element of professional judgment by the assessor. The level of support that job seekers with disability received depended largely on which employment service they were referred to. Following an ESAt, job seekers with disability could be referred to DES Disability Management Service (DMS), DES Employment Support Service (DES ESS), JSA Stream 4 or another JSA stream depending on a number of factors such as:
• the nature, severity, permanence and stability of their disability
• the type of support required to meet participation requirements
• their future work capacity
• the length of time support would be required after placement in employment
• whether they faced other non-vocational barriers to employment.
Job seekers in JSA could receive services from a JSA disability specialist or a generalist provider, depending on the availability of appropriate services and the job seeker’s preferences.
The evaluation of the DES programme found that the DES DMS achieved higher employment outcome rates than JSA, at a proportionally higher cost, for job seekers with disability-related employment restrictions. Therefore, the referral of job seekers to appropriate services was crucial for maximising job seeker outcomes and allocating resources efficiently. The interim findings of the evaluation of DES indicated that assessment procedures and guidelines for referral required review
239 See Appendix 1, Section 2.2 for more information.
105

and refinement.240 241 If clients who needed specialist assistance were not directed to a specialist programme their chances of labour market success was significantly reduced. In cases of inappropriate referral, the programme costs, however low, could be considered waste. Conversely, directing people with lower support needs to a specialist programme often resulted in high deadweight costs, because they are likely to achieve outcomes without the added expense of specialist intervention.
DiscussionJob seekers with disability (with employment restrictions) are more likely than most other job seeker cohorts to become LTU. In September 2010 this group made up over one-quarter (26 per cent) of the JSA LTU caseload (Table A2.59). Many of them also experienced other barriers to employment such as being:
Indigenous 11 per cent
single parents 12 per cent
ex-offenders 11 per cent
currently or previously homeless 13 per cent
aged 50 years or over 27 per cent
Disadvantage in the Health domain is strongly associated with multiple disadvantage and hence poorer labour market outcomes (Section 7.3), reinforcing the need for effective links between employment service providers and providers of other services – such as the health and education sectors.242
Although it is difficult to compare outcomes for job seekers with disability in JSA and JNS due to the changed composition of this group, there is evidence that JSA achieved better outcomes than JNS (Table A2.32).
The type of support that job seekers with disability receive has implications for the likelihood of an employers’ willingness to employ them. Many employers have concerns about hiring job seekers with disability (Chapter 9). These concerns relate to the job seeker’s physical ability to perform the role, safety concerns and difficulties in adapting to the physical environment. Appropriate levels of pre-and post-placement support for both employers and job seekers could, to some extent alleviate employer apprehension. Qualitative evidence from employers suggests that the level of support they receive after hiring a person with disability can be an important factor in their recruitment decisions.243
Evidence on the effectiveness of wage subsidies for job seekers with disability is not clear-cut. A large number of employers reported that being offered a financial incentive would make them less likely or much less likely to consider employing job seekers with a physical disability (18.5 per cent)
240 DEEWR, Reissue March 2012, The Evaluation of Disability Employment Services Interim Report, Canberra.241 Including submissions on National Disability Services 2013, Employment services beyond 2015: Working with what
works; the National Council on Intellectual Disability; and the Australian Federation of Disability Organisations among others.
242 Internal analysis of Stepping Stones survey, cohort 3, wave 5 weighted data.243 DEEWR, 2011. Qualitative research for the 2011 Employer Survey.
106

or mental health condition (20.0 per cent).244 Once job seekers with disability have gained employment, however, wage subsidies can enhance the sustainability of their employment. Job seekers in DES who were placed in a job using a wage subsidy had higher odds of achieving 13-week and 26-week outcomes than those who were placed without a subsidy. It is not clear whether this effect continues past the outcome reporting period.245
7.6.3 Mature age job seekers
Participation in employment servicesJob seekers aged 50 and over were slightly overrepresented in the LTU cohort. They comprised just under 19 per cent of the total active caseload and 22 per cent of the JSA LTU at 30 September 2010 (Table A2.59 ) .246
In the years before the Global Financial Crisis (GFC) in 2008 there was a steady growth in the number of job seekers aged 50 and over seeking employment services assistance.247 This is reflected in the differing profiles of mature age LTU job seekers in JNS and JSA. Of the LTU cohort, 72 per cent were aged 50 or over when they entered services in JSA compared with 49 per cent of the LTU JNS cohort.
Regression modelling, which isolates the effects of job seeker characteristics and labour market conditions, showed that mature age job seekers were less likely to receive EPF-funded training than younger job seekers (Table A2.65 to Table A2.67). EPF training was effective for those who did receive it, as it increased the odds of job seekers attaining a job placement. The size of this effect increased with age. The odds of job seekers aged 50 or more getting a job placement were 2.8 times (or 180 per cent) greater, compared with those in the same age group who did not receive this training (Table A2.40). It should be noted that there are factors that would influence a providers’ decision to allocate training which could not be accounted for in this analysis. Therefore the results above measure a combined effect of provider decision-making and the effect of training.
Outcomes Education outcomes for mature age job seekers were much higher under JSA compared with JNS (Figures 7.5 and 7.7). Results for employment outcomes were, however, mixed (Figures 7.4 and 7.6). Employment outcomes for new entrant job seekers in Streams 1 to 3 were similar in JSA and JNS. Internal modelling found that for new entrant Stream 4 job seekers aged 50 years and over, the odds of getting a job placement or 13-week outcome were four times higher under JSA than under JNS (Table A2.30 and Table A2.31).248
For LTU mature age job seekers, employment outcomes were similar for male job seekers, but slightly lower for female job seekers in JSA compared with JNS. This slight difference in female outcome rates was driven by substantially lower full-time employment outcomes (by 6.1 percentage points) partially offset by slightly higher part-time employment outcomes (by 1.9 percentage points).
244 DEEWR, 2012. Employment Pathway Fund, Chapter 2: Wage subsidies, Canberra.245 Department of Employment, 2016. The effectiveness of wage subsidies in Australian Government Services.246 See Appendix 1, Section 2.2.247 DEEWR, 2011. The Impact of the Global Economic Downturn on Job Services Australia, July 2009 – January 2010,
Canberra.248 See Appendix 1, Section 2.1.
107

The lower full-time outcomes were mainly due to the much larger proportion of job seekers with part-time participation requirements in the JSA LTU population (Table A2.45 to Table A2.47).
Mature age job seekers in both JNS and JSA exited services at a lower rate, had lower ‘off-income support’ results and higher reliance on income support after exit compared with job seekers in the prime working age group (25–49 years ) (Table A2.62 and Table A2.63). Mature age LTU job seekers were more likely than younger job seekers to exit services due to disability: 33 per cent of the JSA LTU study population in this age group exited to DSP or to specialist disability services (Table A2.64 ).249
DiscussionAlthough outcomes for mature age job seekers were higher under JSA than JNS, these job seekers remained less likely to achieve employment outcomes, exit services or move off income support than younger job seekers. Many also experienced other forms of disadvantage such as disability. In September 2010, nearly one-third (30 per cent) of all mature age job seekers had disability (with work restrictions). The majority of mature age job seekers (61 per cent) were aged 55 or over, with nearly one-third (31 per cent) aged 60 or more; and one-third (34 per cent) of all mature age job seekers had part-time or no activity requirement.250
Employer surveys found that employers viewed mature age job seekers favourably, with perceived benefits of relevant work experience, life experience and reliability, although some employers reported concerns about their physical fitness for some jobs.251 Indications were that employers were receptive to the use of wage subsidies for older job seekers.252 Initiatives were introduced to foster the employment of mature age workers and overcome age-based discrimination. Experience+, introduced in 2012, was designed to encourage mature age participation in the workforce. The package incorporated continuation of the career advice service for anyone over 45, the Work Ready programme which offered eligible job seekers aged 50 and over intensive job preparation, participation in paid work placements, and assistance for employers. The employer assistance component, Corporate Champions, provided assistance from an industry expert to help employers assess their organisation’s workplace and develop a plan to improve their practices in employing mature age people, plus the $1,000 Jobs Bonus when they employed an eligible mature age job seeker.
7.6.4 Youth
Participation in employment servicesYoung people (aged less than 25) and, in particular, young males were overrepresented in the JSA active caseload (Table A2.59 ) . Young males made up 15 per cent of the JSA caseload in September 2010 but only 10 per cent of the Australian working age population in 2011.253 In the same period, young females comprised 12 per cent of the JSA caseload and 10 per cent of the
249 See Appendix 1, Section 2.2.250 Job seekers aged 55 or over on NSA or PP can meet their participation requirements partially or fully with approved
volunteer work, and those who do remain connected to a service provider.251 Surveys of Employers conducted by the Department of Employment (formerly DEEWR) are described in Chapter 1.252 Surveys of Employers conducted by the Department of Employment (formerly DEEWR) are described in Chapter 1.253 ABS, 2013. Population Census 2011.
108

Australian working age population. Young job seekers had the lowest average duration of unemployment in the caseload.
Job seekers aged under 21 were less likely to be LTU than older participants in both JNS and JSA. Those aged 21 to less than 25 were also less likely to be LTU in JSA. In September 2010 nearly one-quarter (23 per cent) of job seekers aged less than 25 had been unemployed for two years or more. In September 2010 the following characteristics were present in young people on the JSA caseload:
were Indigenous 15 per cent
had disability (with work restriction) 12 per cent
had been identified as homeless at some stage 13 per cent
were ex-offenders 11 per cent
were in Stream 4 20 per cent
Half of all young job seekers had less than Year 12 qualifications. Males were more likely to be disadvantaged: the JSCI identified 47 per cent of males aged less than 21 as disadvantaged teenagers compared with 40 per cent of females aged less than 21.254
Introduction of the Early School Leavers policy (formerly known as Learn or Earn) on 1 July 2009 changed the way young job seekers participated in employment services.255 256 This policy may have encouraged more young people to remain in education and training rather than enter employment services. Conversely, the strengthened participation requirements may have led more young people to engage with employment services after leaving, or between episodes of training or education. Early school leavers who did enter JSA were guaranteed at least Stream 2 services.
The increased emphasis on education and training for young people in JSA was reflected in the services. Departmental analysis found that job seekers aged 15 to 19 in Streams 2, 3 and 4 were more likely to have received EPF funded training than older job seekers (Table A2.65 to Table A2.67).257 In addition, more funding was allocated to training courses for job seekers identified as vulnerable youth, whose estimated average costs of training courses were $630 compared with the estimated overall average of $441.258 The effectiveness of this training, in the context of JSA, is indicated by the fact that young job seekers aged 15 to 24 who received EPF-funded training had more than double the odds of getting a job placement than those who did not receive the training (Table A2.38).259 However, young job seekers were among the most difficult to arrange training for,
254 The JSCI identified disadvantaged teenagers as those who were sole parents, in temporary accommodation, Indigenous, disclosed ex-offenders, mainly been unemployed in the previous two years and /or had completed less than Year 10 at school.
255 Formerly known as the Learn or Earn policy; also the Strengthened Participation Requirements for 15 to 20 year olds.
256 For Information on Early school Leavers Policy see Section 1.1.3.257 See Appendix 1, Section 3.1.258 Young people aged 15 to 20 who met certain conditions, such as having at least one serious non-vocational barrier
and either being in full-time study or not on income support.259 See Appendix 1, Section 3.1 for details of this study.
109

with 58 per cent of respondents to the 2012 Survey of Employment Service Providers reporting difficulties in this area.260
OutcomesInternal analysis found that under both JNS and JSA, young LTU job seekers showed better outcomes than other LTU job seekers. Young LTU job seekers reported higher full-time and lower part-time employment outcome rates, higher off-income support rates and lower average reliance on income support 12 months after exiting services than other LTU job seekers (Tables A2.45 to Table A2.47, Table A2.62 and Table A2.63).261
Comparisons between JNS and JSA for young job seekers must be made with caution because the Early School Leavers policy affected both the composition of this cohort and the type of service they received between models. PPM employment outcomes for this group were lower in JSA than in JNS, but education outcomes were much higher, reflecting the increased emphasis on educational engagement under Learn or Earn (Figures 7.4 to 7.7). In keeping with other results for Stream 4 job seekers, young new entrant Stream 4 type job seekers showed much greater odds of getting a job placement within 18 months of commencing in services and of getting a 13-week employment outcome in JSA than in JNS (Table A2.30 and Table A2.31).262
Departmental analysis showed that job seekers aged 21 to less than 25 had an average reliance on income support 10 percentage points lower for JSA than JNS LTU job seekers in the 12 months after exiting service, while for job seekers aged less than 21 average reliance changed little between the models (Table A2.63).
DiscussionJSA resulted in better education and training outcomes for young people, in line with the changed policy focus for this group. It also produced better employment outcomes for young people in Stream 4.
It has traditionally been difficult to engage young job seekers with employment services. They have low rates of interview attendance with providers and high levels of compliance action.263 Qualitative research undertaken in 2010 found that many generalist providers struggled to engage young job seekers and it may be that more specialist service delivery would benefit this cohort.264 A number of submissions to the Employment services beyond 2015: Building on What Works paper also advocated improved strategies for engagement with young job seekers.265 In qualitative research, providers reported strategies successful at engaging young people included: spending time to identify their goals; texting or emailing job seekers rather than relying on letters and phone calls; using language, literacy and numeracy training with a practical life skills focus; and considering study options appropriate and attractive for young job seekers, such as pre-apprenticeship training, apprenticeships or traineeships.266 260 See Section 1.2.3 for a description of this data source.261 See Appendix 1, Section 2.2.262 See Appendix 1, Section 3.1 for more information on research methods.263 Disney et al, 2010. Impacts of the new Job Seeker Compliance Framework: the report of the independent review.264 See Section 1.2.3 for a description of this data source.265 Including, among others, submissions from ACOSS and the Australian Youth Affairs Coalition.266 DEEWR, 2010. Departmental qualitative research round – See Section 1.2.3 for a description of this research.
110

There is some evidence that wage subsidies could improve employment outcomes for young job seekers. In the 2011 Employer Incentives Study, the majority of respondents stated that a financial incentive would increase the likelihood that they would employ job seekers aged 21 years or younger. Still, many employers reported concerns about employing younger workers. These related to attitudes to work, reliability and, in some cases, productivity. Lack of experience was a concern for many employers, as was difficulty in retaining younger workers.267
A number of initiatives aimed at assisting young job seekers into employment were introduced, including some in the BAFW package. These included: the Indigenous Youth Careers Pathway (IYCP) Programme and Indigenous Ranger Cadetships (IRC) aimed at keeping Indigenous students at school to Year 12, while providing traineeship and apprenticeship training; Transitional Support for Early School Leavers, which provided extra EPF assistance to early school leavers; and other place-based initiatives focused on young parents and jobless families. These measures are not within the scope of this evaluation.
7.6.5 Job seekers who are culturally and linguistically diverse and / or with mixed or low English proficiency
Participation in employment servicesApproximately 18 per cent of the active JSA caseload at 30 September 2010 were CALD, as defined by country of birth (Table A2.59). Departmental analyses of this group suggest that proficiency in English is a more important determinant of success in the labour market than country of birth. CALD job seekers were less likely to become LTU in JSA than job seekers with mixed or low English proficiency.268
In September 2010 around one-third of all CALD job seekers had mixed or low English proficiency. That group were more likely to be placed in Streams 3 or 4, to be very long-term unemployed (VLTU) and have less than Year 12 education than CALD job seekers with high English proficiency (Table 7.4).
Five per cent of the JSA active caseload were from English-speaking backgrounds but had mixed or low English proficiency. Almost all of these job seekers were Australian-born and slightly less than half identified as Indigenous. This group showed higher levels of disadvantage than CALD job seekers with similar levels of English proficiency. Over one-third (36 per cent) of these job seekers were aged under 25 (Table 7.4).
267 DEEWR, 2011. Employer Incentives Survey.268 See Appendix 1, Section 2.2 for a description of this study.
111
Table 7.4: JSA job seekers from a culturally and linguistically diverse (CALD) background or with mixed or low English proficiency (per cent of job seeker category)
Population Streams 3 or 4
Very long-term
unemployed
Less than Year 12
education
Aged less than 25
Aged 50 and over
From CALD background; good English proficiency 32.7 20.9 25.2 16.2 23.1
From CALD background; mixed or low English proficiency 60.1 30.2 62.7 8.1 29.0
English-speaking background; mixed or low English proficiency 80.4 45.4 83.5 35.7 11.1
Note: JSA active caseload as at 30 September 2010.Source: Department of Employment administrative data.
OutcomesWhile employment outcomes for CALD job seekers were slightly lower than for all job seekers, outcomes for job seekers with mixed or low English proficiency were substantially lower (Figures 7.4 and 7.6). Education outcomes were still higher for CALD job seekers compared to all job seekers (Figures 7.5 and 7.7). Improved English skills are important for job seekers with mixed or low English proficiency, and the considerable gains in education outcomes under JSA indicate that assistance is being targeted appropriately for this group.
DiscussionEnglish proficiency is an important factor in improving a job seeker’s employability and a foundation skill to help overcome other vocational and non-vocational barriers. In the 2011 Survey of Employment Services Providers, 53 per cent of JSA providers surveyed stated that they had been unable to refer job seekers to training in the previous six months because the job seeker did not have the required foundation skills, such as English language skills, reading, writing or numeracy. An investigation into multiple disadvantage in the JSA caseload found that job seekers with mixed or low English proficiency were more likely to experience multiple disadvantage than those with higher English proficiency (Table A2.49).269
Job seekers in JSA with mixed or low English proficiency had higher education outcome rates than those in JNS and over time these results may lead to higher employment outcomes (Figure 7.5 and Figure 7.7). Enhanced access to effective, appropriate training and support for these job seekers is critical to success in the labour market.
7.6.6 Long-term and very long-term unemployed job seekers
Participation in employment servicesThe onset of the GFC just prior to the introduction of JSA increased the number of very long-term unemployed (VLTU) (unemployed two years or more) in employment services (and the population generally) over time. Even if it had been possible to maintain pre-GFC service exit rates post-GFC, the large influx of job seekers would have still led to an overall increase of long-term unemployed (LTU) (unemployed for one year or more) over the period of JSA operation. Despite an improvement in overall unemployment rates from July 2009 to July 2011, the number of LTU in the Australian
269 See Appendix 1, Section 3.3.
112
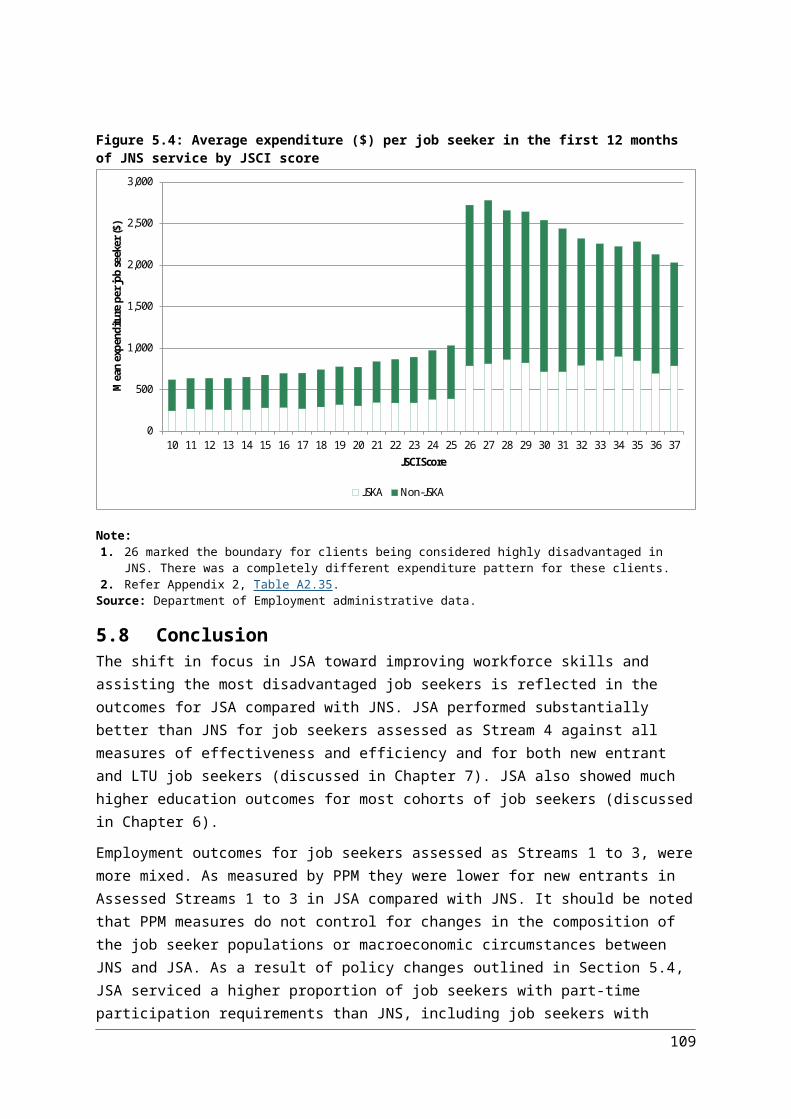
population grew by 18.9 per cent and the number of VLTU grew by 35.6 per cent.270 Over the period 2009 – 2012 the number of LTU and VLTU job seekers in JSA also increased (Figure 7.8). The focus of JSA in this context was to better prepare unemployed job seekers to take advantage of future opportunities, including in areas of emerging skills shortages.
Figure 7.8: Employment Services active caseload by length of unemployment, July 2006 to June 2012 (number)
0
50,000
100,000
150,000
200,000
250,000
300,000
350,000
400,000
450,000
500,000
Num
ber o
f job
seek
ers i
n JN
S/JS
A
Length of unemployment
Less than 12 months 12-23 months 24 months +
Introduction of JSAOnset of GFC
Note: Refer Appendix 2, Table A2.68.Source: Department of Employment administrative data.
VLTU job seekers were, and remain, among the most disadvantaged in the JSA caseload. In September 2010 the proportions of the VLTU experiencing various types of disadvantage:
were in Streams 3 or 4 84 per cent
had disability (with work restriction) 29 per cent
were aged 50 or over 24 per cent
lived in outer regional or remote locations 20 per cent
were single parents 17 per cent
were Indigenous 17 per cent
had been identified as homeless at some stage 11 per cent
were ex-offenders 11 per cent
270 Australian Bureau of Statistics 2012, Labour Force, Australia, Cat No 6202.0.
113

The focus of JSA was on the detection of barriers to employment through assessment processes such as the JSCI and ESAt and direction of job seekers to appropriate services via the streaming process with a view to preventing them from becoming LTU/VLTU.
Analysis of EPF expenditure from 1 October 2009 to 31 October 2011 found that wage subsidies were mostly used to help job seekers in their first year of unemployment. Approximately 21 per cent of wage subsidies assisted VLTU job seekers. This indicates that, while wage subsidies may have been used to prevent people from becoming LTU, they were not being used extensively to assist those who were already were.271 Evidence suggests that wage subsidies for VLTU job seekers may not always be effective. Fourteen per cent of respondents to the 2011 Employer Incentives Survey indicated that being offered a financial incentive would make them less likely or much less likely to consider employing VLTU job seekers.
Outcomes Long-term unemployment is associated with poorer employment prospects. Many studies have confirmed that job seekers who have experienced long periods of unemployment are less likely to re-enter employment than other job seekers. This is generally considered to be because employers believe LTU job seekers lose currency in their skills.272 Many employers regard VLTU job seekers as lacking necessary skills such as up-to-date information technology skills or qualifications (42 per cent of employers) or are unreliable or poorly motivated (34 per cent) (see Chapter 9).273 Qualitative evidence indicates that many employers felt very negative toward VLTU job seekers, with many feeling they lacked motivation and had been ‘forced’ into seeking work. This attitude was most evident in areas of high employment.274
In both JNS and JSA, job seekers unemployed for five years or more had substantially lower employment and education outcomes than job seekers unemployed for shorter durations (Figure 7.9).
Internal research found that LTU job seekers had slightly lower employment outcomes but substantially improved education outcomes under JSA, when compared with JNS (Figure 7.6 and Figure 7.7). Employment outcomes were affected by a large drop in full-time employment outcomes, to some extent countered by an increase in part-time employment outcomes (Figure 7.9). These results do not account for differences in composition of the LTU populations between JNS and JSA, and in particular the doubling in the proportion of the caseload with part-time participation requirements. This in turn is related to the increased participation of single parents and job seekers with disability as a result of the Welfare to Work reforms of July 2006 (see Sections 7.6.1 and 7.6.2).
271 DEEWR, 2012. Employment Pathway Fund, Chapter 2: Wage subsidies, Canberra.272 Fowkes, L, 2011. Australian Policy Online Topic Guide: Long-term unemployment in Australia, Australian Policy
Online.273 Survey of Employers, 2012. See Section 1.2.3 for more information on this data source.274 DEEWR, 2010. Departmental qualitative research round – See Section 1.2.3 for a description of this research.
114
Figure 7.9: Full-time and part-time employment outcome and education outcome rates by length of unemployment, JNS and JSA (per cent)
0.0
5.0
10.0
15.0
20.0
25.0
30.0
35.0
Full-time employment Part-time employment Education
Per c
ent
JNS 1 to less than 2 years JSA 1 to less than 2 years
JNS 2 to less than 5 years JSA 2 to less than 5 years
JNS 5 years or more JSA 5 years or more
Note: Refer Appendix 2, Table A2.69.Source: Department of Employment Post Programme Monitoring Survey.
Internal analysis found that LTU job seekers who exited JSA had more sustainable outcomes than similar job seekers exiting JNS. Twelve months after exiting, job seekers in JSA had higher off NSA/YA(O) rates (73.2 per cent for JSA compared with 64.6 per cent for JNS), higher off-income support rates (39.6 per cent compared with 31.4 per cent) and lower average reliance on income support (47.3 per cent compared with 55.1 per cent). This result holds for job seekers in all Assessed Streams and in all age groups (Table A2.61, Table A2.62 and Table A2.63).275
Over one-quarter of LTU job seekers in JSA in September 2010 were in Stream 4. Analysis on outcomes for LTU job seekers in Stream 4 type services found that, after controlling for job seeker characteristics and macroeconomic conditions, those in JNS would have been more likely to exit from employment services had they been serviced under JSA – a 10.6 percentage point higher exit rate was predicted had this group been serviced in JSA (Table 4.7).276
A substantial proportion of all exits of LTU job seekers were of job seekers receiving the DSP or transferring to DES (22.5 per cent of those in JNS and 20.8 per cent of those in JSA. For LTU job seekers in Stream 4, the proportions were much higher, at 37.9 per cent and 35.7 per cent respectively) (Table A2.64).277
Discussion The ongoing effects of the Welfare to Work reforms resulted in higher proportions of single parents and job seekers with disability (with employment restrictions) entering employment services with many of these job seekers likely to remain in services for longer periods of time. Over one-quarter of
275 See Appendix 1, Section 2.2 for a description of how outcomes for LTU job seekers were compared.276 See Appendix 1, Section 2.2 for a description of how outcomes for LTU job seekers were compared.277 See Appendix 1, Section 2.2 for a description of how outcomes for LTU job seekers were compared.
115

the JSA LTU caseload had part-time participation requirements and were, therefore unlikely to enter full-time employment. The longer-term effects of the GFC also contributed to increasing numbers of LTU job seekers in the JSA caseload.
LTU job seekers face many vocational and non-vocational barriers to employment. Nonetheless JSA produced outcome rates for these job seekers which were comparable with or better than outcome rates for similar job seekers in JNS. The higher rates of educational outcomes also indicate that JSA was to some extent at least, meeting its objective of preparing these job seekers for employment.
Many LTU job seekers in the JSA caseload were not necessarily unemployed according to the ABS definition (Section 3.2). Analysis of the active caseload at September 2010 found that: 8 per cent of the LTU caseload were in the process of exiting services; another 7 per cent had casual or part-time employment for at least five days in the preceding month; 7 per cent were engaged in education or training activities; 5 per cent were engaged in CDEP or volunteer work; and over 15 per cent were exempt from participation requirements for health or medical reasons or because of caring responsibilities.
NESA, in response to Employment Services — Building on Success Discussion Paper, recommended that employment services reforms should include measures to more adequately identify and address the barriers faced by LTU job seekers, such as: reweighting the duration of unemployment factor in the JSCI; including a factor relating to jobless families; and introducing automatic up-streaming for job seekers who reach a maximum duration in each stream.278 Research conducted by the department also found that the JSCI could benefit from the addition of measures to better identify social disadvantage, such as coming from a jobless family, and that earlier assistance to some job seekers could also be considered.
7.7 ConclusionJSA substantially improved services and outcomes for the most disadvantaged job seekers when compared with JNS. This has been the result of a combination of factors including its increased focus on disadvantaged job seekers, changed assessment processes and earlier provision of uncapped services for the most disadvantaged (Stream 4).
The overall level of disadvantage in the JSA caseload from 2009 to 2012 was higher compared with that in JNS. This is partly due to the accumulated effects of the Welfare to Work policies and other moves to bring more groups of people into the labour force, including single parents with school-age children, people with disability (with participation requirements) and young people aged less than 21 and not in education.
Findings in this chapter highlight the extensive vocational and non-vocational difficulties often experienced by people who have been disengaged from the labour force for lengthy periods. The task of assisting these job seekers transition to employment can be long and complex.
Many job seekers in the JSA caseload faced multiple, reinforcing barriers to employment. Appropriate assessment and referral processes are critical to providing appropriate levels of servicing to job seekers. The JSA assessment processes and streams of assistance were working
278 NESA, 2013. Realising our potential: Response to ‘Employment services — building on success’ discussion paper, NESA, Melbourne.
116

reasonably well in this regard, but improvements could be made to these processes, especially for job seekers with disability. The identification of social disadvantage and multiple and complex disadvantage could also be improved. Evidence from the JSA Demonstration Pilots indicate that enhanced assessment tools and processes for disadvantaged job seekers can be useful in assisting service providers to deliver services and encouraging job seeker engagement.
The EPP was functioning well as both a communication tool between service provider and job seeker and a means of planning and monitoring service delivery. Again, for disadvantaged job seekers, the additional, appropriately framed use of this tool has been beneficial in engaging and motivating job seekers and service providers.
Providers reported that highly disadvantaged job seekers were among the most difficult to arrange training for. Training outcomes for new entrant job seeker groups show that JSA performed better than JNS in Assessed Streams 1 to 3 for all selected groups. Education and training outcomes for LTU job seekers were also better under JSA than JNS.
Mature age job seekers were less likely to receive EPF-funded training than youth. However the odds of job seekers aged 50 or more getting a job placement were 2.8 times (or 180 per cent) greater, compared with those in the same age group who did not receive this training. Young job seekers aged 15 to 24 who received EPF-funded training had more than double the odds of getting a job placement than those who did not receive the training.
JSA providers reported difficulties referring some job seekers to training because they did not have the required foundation skills, such as English language skills, reading, writing or numeracy. Enhanced access to effective, appropriate training and support for these job seekers is critical to success in the labour market.
Wage subsidies can be an important tool to assist disadvantaged job seekers into employment. However, there is strong evidence from employers and service providers that they should only be used for job seekers who are job ready and have suitable skills for the job vacancy in question.
Ultimately, employers reported that what they most looked for when recruiting was the job seeker who was best suited to the vacancy and one who was willing to work. Employment services have a substantial role to play in preparing disadvantaged job seekers to compete on these terms.
117

8 Indigenous job seekers
8.1 IntroductionJob Services Australia (JSA) was the largest provider of employment services for Indigenous Australians from 2009 to 2012. That remained the case despite the introduction in July 2013 of the Remote Jobs and Communities Programme (RJCP). RJCP was designed to overcome the specific difficulties in servicing remote areas and delivered services formerly provided by JSA, Disability Employment Services (DES), the Indigenous Employment Programme (IEP) and Community Development Employment Projects (CDEP) in designated remote regions.
One of the key objectives of JSA was to help meet the Closing the Gap objective of ‘halving the gap in employment outcomes between Indigenous and non-Indigenous Australians within a decade (by 2018)’. 279 280 Indigenous Australians are much less likely to participate in the labour force and those who do are much more likely to be unemployed than non-Indigenous Australians. In 2011 the rate of Indigenous participation in the labour force was 20.5 percentage points lower than the non-Indigenous rate (55.8 per cent compared with 76.4 per cent).281 The Indigenous unemployment rate was more than three times the rate for non-Indigenous Australians (17.2 per cent compared with 5.5 per cent).282
The Indigenous population has a much younger age profile and correspondingly younger labour force than the non-Indigenous population. This underpins the importance of providing opportunities and support for education and skills acquisition to young Indigenous job seekers.283 Indigenous Australians are also far more likely to live in regional and remote areas, which often have weaker labour markets and limited employment opportunities. Even in areas with strong local labour markets, there is evidence that this may not be enough to produce good employment rates for Indigenous Australians. Some regions with low non-Indigenous unemployment rates have high Indigenous unemployment rates.284 Remote areas present specific challenges in service delivery and support.
8.2 Employment services for Indigenous job seekersOn its introduction in 2009, JSA, alongside the reformed CDEP Projects and IEP, became the main provider of employment services for Indigenous job seekers. These three programmes were designed or redesigned to help address the Closing the Gap employment objective and assist
279 DEEWR, 2008. The future of employment services in Australia: A discussion paper, Canberra.280 Department of Families, Housing, Community Services and Indigenous Affairs, 2010. Closing the Gap – Prime
Minister's Report, FaHCSIA, Canberra, p 1.281 The participation rate is the number of people in the labour force (in employment or actively looking and
immediately available for employment) expressed as a proportion of the population. See Australian Bureau of Statistics, Labour Statistics: Concepts, Sources and Methods, 2013, Cat. No. 6102.0.55.001.
282 Australian Bureau of Statistics 2013, Australian Social Trends, Cat No 4102.0. Data is from the 2011 Census of Population and Housing.
283 DEEWR. 2012. Servicing Indigenous Job Seekers in Job Services Australia, Canberra.284 DEEWR, 2012. Servicing Indigenous Job Seekers in Job Services Australia, Canberra.
118

Indigenous job seekers. 285 The programmes were intended to work together to develop packages of services for individual job seekers.286
Major changes to services for Indigenous job seekers were announced for the second JSA period 2012-2015. These are described in Section 8.8.
8.2.1 Community Development Employment ProjectsCDEP was a long-established programme combining community work job creation with labour market programme elements. It was designed in particular for participants in regional and remote areas. In 2009, CDEP ceased in locations with established economies and was replaced by JSA in these regions. The focus of CDEP in remote Indigenous communities was also changed from directly providing employment to building participant skills to find jobs outside CDEP. The CDEP funding model and programme deliverables were amended to focus on outcomes in the specific areas of Work Readiness services, including pre-vocational and vocational training and work experience; and Community Development, a stream of assistance focusing on supporting and developing Indigenous communities and organisations. In June 2013 transition arrangements for CDEP were announced. CDEP projects in remote areas were transitioned to RJCP. In the eight CDEP locations outside RJCP regions, CDEP providers had their existing funding agreements extended for up to 12 months.287
8.2.2 Indigenous Employment ProgrammeThe IEP provided a range of tools to achieve employment and economic development for Indigenous Australians. The IEP Employment Panel and the IEP Economic Development and Business Support Panel assisted the department in providing services under the IEP, and gave direct support to activities with employers, Indigenous businesses and organisations and Indigenous communities.288
The IEP complemented the services available through JSA and DES. It offered tailored solutions to provide:
• assistance for employers to recruit, train and provide sustainable employment for Indigenous Australians
• customised and flexible assistance for Indigenous job seekers, including pre-employment and job-specific training
• employment placement, support and mentoring to help Indigenous Australians stay in work
• support for employers, including wage subsidies and support for cross-cultural training
• support for Indigenous Australians to pursue self-employment and business development opportunities.289
The IEP also managed the Indigenous Wage Subsidy (IWS) – an incentive paid to employers to employ eligible Indigenous job seekers. The subsidy could also assist with training costs for eligible employees.
285 DEEWR, 2008. The future of employment services in Australia: A discussion paper, Canberra.286 DEEWR, 2009. Employment Services Deed 2009–2012, clause 116, Canberra.287 Department of Social Services, 2013.CDEP Programme 288 DEEWR, 2009. Indigenous Employment Program 2009 – 12: program guidelines, Canberra.289 DEEWR, 2013. Annual report 2012–13, Canberra.
119

8.2.3 Other programmesDES is the national employment services system specifically for job seekers with significant disability. Around 5 per cent of people on the DES caseload at the end of June 2012 (over 7,000) were Indigenous.
The Indigenous Opportunity Policy (IOP) commenced in 2011. Under this policy, major suppliers to the Australian Government in areas with significant Indigenous populations were required to demonstrate their commitment to Indigenous employment, through the provision of employment and training opportunities to local Indigenous Australians and the use of Indigenous business suppliers.290
Other programmes supporting Indigenous Australians to enter employment included the Council of Australian Government (COAG) National Partnership Agreement for Indigenous Economic Participation; the Australian Employment Covenant (AEC); the Aboriginal Employment Strategy (AES) Ltd; the Remote Enterprise Centre and Indigenous Business Australia.
8.3 Indigenous job seekers in Job Services Australia
8.3.1 OverviewAlthough Indigenous Australians make up less than 3 per cent of the Australian working age population, in September 2010 Indigenous job seekers were nearly 12 per cent of the JSA active caseload (Table A2.59). There were between 88,000 and 96,000 Indigenous job seekers on the JSA active caseload at any one time during this evaluation period.
The profile of these job seekers was different from that of non-Indigenous job seekers. The age structure of the Indigenous job seeker population was considerably younger. Around one-half (51 per cent) were aged less than 30, compared with just over one-third (37 per cent) of the non-Indigenous job seeker population. In particular, there was a much higher proportion of Indigenous males in the younger age groups.291
Indigenous job seekers were far more likely to have longer periods of unemployment than non-Indigenous job seekers, comprising more than 22 per cent of job seekers in JSA who had been unemployed for five years or more but less than 10 per cent of those who had been unemployed for less than 12 months.292
The geographic distribution of Indigenous job seekers was also very different. In November 2011, nearly one-third lived in very remote regions compared with less than 1 per cent of non-Indigenous job seekers.
8.3.2 Disadvantage and streamingOn average, Indigenous job seekers had higher levels of labour market disadvantage as measured by the Job Seeker Classification Instrument (JSCI), averaging 34 points compared with 21 points for non-Indigenous job seekers. Figure 8.1 shows the distributions of JSCI scores. The two vertical lines indicate the uppermost score for Stream 1 (19 points) and the lowermost score for Stream 3
290 Department of Employment, 2013. IOP Guidelines.291 Analysis based on Department of Employment administrative data.292 DEEWR, 2012. Servicing Indigenous Job Seekers in Job Services Australia, Canberra.
120

(29 points). It is important to note that the JSCI score does not always determine the actual stream in which JSA clients are placed. Access to Stream 4 was determined separately by the Employment Services Assessment (ESAt). In addition, some job seekers were provided with early access to intensive assistance through Stream 2, even if their JSCI score would normally have placed them in Stream 1.293
Figure 8.1: Distribution of Job Seeker Classification Instrument (JSCI) scores for Indigenous and non-Indigenous job seekers, July 2009 to February 2011 (per cent)
0
2
4
6
8
10
12
0 2 4 6 8 10 12 14 16 18 20 22 24 26 28 30 32 34 36 38 40 42 44 46 48 50 52 54 56 58 60 62 64 66 68 70 72
Per c
ent
JSCI score
Non-Indigenous clients Indigenous clients Indigenous clients, no Indigenous factors
Stream 1 Stream 2 Stream 3
Notes: 1. Where JSA clients were assessed using previous versions of the JSCI, the scores have been adjusted, as far as
possible, to reflect the operation of the JSCI during the 2009 – 2012 period.2. Scores from July 2009 to February 2011.3. Refer Appendix 2, Table A2.70.
Source: Department of Employment administrative data.
Around two-thirds of the difference in average JSCI scores of the two groups was due to factors designed to measure barriers that were particularly relevant for Indigenous job seekers. These included living in a location where CDEP was prevalent, being distant from a labour market or in a region where Indigenous disadvantage had been identified, a general Indigenous factor and speaking an Indigenous language as a child.
The solid blue line in Figure 8.1 indicates how the distribution of assistance would be affected by removal of these components from the JSCI. Under this scenario, 42 per cent of Indigenous clients would have been assessed in a lower stream. Even without the Indigenous factors, the level of measured disadvantage in the Indigenous job seeker population remains higher than in the non-Indigenous population.
293 These job seekers included some redundant workers, some job seekers who transitioned from JNS and young people under the age of 21 years who were granted YA(O) after 1 July 2009 and who did not have a year 12 or equivalent level of educational attainment.
121

The proportions of Indigenous and non-Indigenous job seekers tend to be higher in groups more likely to experience disadvantage in the JSA active caseload. Reflecting this, 28 per cent of Indigenous job seekers were in Stream 4, compared with only 18 per cent of non-Indigenous job seekers. Indigenous job seekers in JSA were also more likely to be ex-offenders or homeless than non-Indigenous job seekers. They were slightly less likely to be single parents or have disability (with employment restrictions), noting that disability appears to be under identified in the Indigenous population (Figure 8.2).
Figure 8.2: Select client groups in JSA active caseload, Indigenous and non-Indigenous job seekers, at 30 September 2010 (per cent)
0
5
10
15
20
25
30Single Parents
Ex-offenders
HomelessDisability
Stream 4
Indigenous Non-Indigenous
Note: Refer Appendix 2, Table A2.71.Source: Department of Employment administrative data.
Indigenous job seekers experienced higher rates of disadvantage than the general job seeker population in four of the five domains measured294, including Material, Education, Community and Social, and the differences in levels of disadvantage between Indigenous and non-Indigenous job seekers were considerable (Figure 8.3).295 In addition, although the proportion of Indigenous job seekers with disadvantage in the Health domain appeared to be slightly lower than for non-Indigenous job seekers, there is considerable evidence that health issues may be under-recognised and under-reported by Indigenous job seekers. The Australian Bureau of Statistics has previously reported that:
294 See Appendix 1, Section 3.3 for an explanation of the five domains of disadvantage measured.295 See Appendix 1, Section 3.3 for an explanation of the five domains of disadvantage measured
122
…in non-remote areas, Aboriginal and Torres Strait Islander adults were one and a half times as likely as non-Indigenous adults to have a disability or long-term health condition, and more than twice as likely to have a profound/severe core activity limitation.296
Figure 8.3: Estimated proportions of JSA job seekers who experienced each domain of disadvantage (per cent)
0
10
20
30
40
50
60
70
80
90
Material Education Health Community Social
Per c
ent
All job seekers Indigenous job seekers
Notes: 1. Job seekers unemployed less than three months are excluded from the analysis.2. Refer Appendix 2, Table A2.72.
Source: Department of Employment Stepping Stones survey data cohort 3, wave 5 weighted data.
Almost three-quarters of Indigenous job seekers in JSA experienced multiple disadvantage (that is, disadvantage in three or more of the five domains) compared with 41 per cent of all job seekers. Not all of these job seekers were in Streams 3 or 4. Approximately 27 per cent of Stream 1 and 44 per cent of Stream 2 Indigenous job seekers experience multiple disadvantage.
The entry of job seekers to Stream 4 depended on the results of the ESAt. It can be more difficult for people who live in remote and very remote areas with restricted access to medical and mental health services to provide adequate documentation to have non-vocational barriers recognised through the ESAt. Analysis conducted by the department in 2011 indicated that this was a factor restricting access to Stream 4 for job seekers in remote areas. Other factors such as the higher proportion of Indigenous Australians in remote areas who do not speak English as a first language and the probable under-reporting of disability may have led to lower numbers of Indigenous job seekers reporting non-vocational barriers.297 New ESAt processes introduced on 1 July 2011 were designed to help overcome some of these problems.
296 Australian Bureau of Statistics 2010. The Health and Welfare of Australia's Aboriginal and Torres Strait Islander Peoples, October, Cat No 4704.0.
297 DEEWR, 2012. Servicing Indigenous Job Seekers in Job Services Australia, Canberra.
123

8.4 Servicing Indigenous job seekers
8.4.1 Engaging Indigenous job seekersAfter controlling for stream, geographic location and other factors, Indigenous job seekers were significantly less likely to attend their initial appointment and significantly less likely to attend engagement appointments than non-Indigenous job seekers. As a result, Indigenous job seekers were also more likely to be subject to action under the JSA compliance framework.298
Qualitative research with Indigenous job seekers and service providers found that those service providers who created strong links with local Indigenous organisations and communities, employed Indigenous staff and provided cultural awareness training for their staff found it easier to engage with Indigenous job seekers. The office environment created by service providers was also an important factor in how well they engaged with Indigenous job seekers. Some specific effective strategies that providers reported using to engage Indigenous job seekers and support them in employment included: displaying Indigenous artwork, flags or posters to provide a welcoming environment and; having and using an Indigenous Employment Strategy and developing the cultural awareness of employers, especially through post-placement support.299
8.4.2 Assisting Indigenous job seekers
Specialist Indigenous service providersSpecialist Indigenous service providers can provide more culturally appropriate services for Indigenous job seekers and may have better connections with the local Indigenous community and organisations than generalist providers. At the end of the first JSA contact period, there were 24 service provider organisations, or around one-quarter of all service provider organisations, contracted to provide specialist Indigenous services for JSA. Specialist providers were delivering services in 27 Employment Service Areas (ESAs) at a total of 154 sites. Around one-quarter of Indigenous job seekers in JSA from 2009 to 2012 who were in ESAs with specialist Indigenous service providers were serviced by specialist Indigenous providers.
Employment Pathway FundEmployment Pathway Fund (EPF) expenditure for Indigenous job seekers reflected the greater levels of disadvantage experienced by this group, with Indigenous job seekers receiving on average more assistance through the EPF than non-Indigenous job seekers.300
Indigenous job seekers in remote areas received more EPF expenditure per job seeker and had a greater number of EPF transactions than Indigenous job seekers in other areas. This reflects in part the operation of the ‘remote multiplier’ whereby job seekers in areas defined as remote301 attracted a 1.7 times multiplier for their EPF credits. This multiplier was designed to take into account the additional costs of servicing remote job seekers. The average amount of EPF expenditure per job
298 DEEWR, 2012. Servicing Indigenous Job Seekers in Job Services Australia, Canberra.299 DEEWR, 2012. Servicing Indigenous Job Seekers in Job Services Australia, Canberra.300 DEEWR, 2013. Employment Pathway Fund, Chapter 1: Introduction, Canberra.301 As defined in the Employment Services Deed 4 (ESD4)
124

seeker for Indigenous job seekers in remote areas was almost double that of non-Indigenous job seekers in remote areas.302
The patterns of EPF expenditure also reflected the challenges experienced by Indigenous job seekers. The proportion of EPF expenditure on these job seekers attributed to training and outreach services was higher than for non-Indigenous job seekers.303 Analysis of training funded through the EPF found that the odds of Indigenous job seekers receiving EPF training were higher than those of non-Indigenous job seekers (Table A2.65 to Table A2.67).304
The proportion of EPF expenditure on wage subsidies and reverse marketing for Indigenous job seekers was lower than for non-Indigenous job seekers. These categories of expenditure should generally only be used for job seekers who are job ready.305 However, analysis of EPF expenditure on reverse marketing found that, when other job seeker characteristics are taken into account, Indigenous job seekers were less likely than other job seekers to receive reverse marketing. This is the case although evidence on employers’ attitudes suggests that these are arguably among the job seekers who, when job ready, are more likely to require reverse marketing.306 See Chapter 9 for more information on employer attitudes.
Work experienceThe pattern of participation in work experience activities for job seekers during their Work Experience Phase in JSA was different for Indigenous job seekers compared with their non-Indigenous counterparts.307 Indigenous job seekers were much less likely to be involved in ‘Employment related activities’ such as part-time or casual paid employment, unpaid work experience and voluntary work and more likely to be involved in ‘Other activities’. ‘Other activities’ included non-vocational training/interventions, Green Corps, Drought Force and other approved activities such as the Commonwealth literacy and numeracy programme, the Australian Apprenticeships Access Programme, CDEP and other community work and pre-employment programmes such as Youth Connections (Table 8.1).
Table 8.1: Work Experience Phase (WEPh) activity types participated in during the WEPh (per cent of job seeker population)
PopulationEmployment
related activities
Training Work for the Dole
Other activities Total
Indigenous job seekers 24.0 30.4 12.8 32.9 100.0
Overall job seeker population 41.4 31.1 18.0 9.5 100.0
Source: Department of Employment administrative data.
The activities undertaken by Indigenous job seekers reflected the overall relative labour market disadvantage and lower levels of educational and vocational qualifications of Indigenous job seekers. In September 2010, 72 per cent of all Indigenous job seekers in JSA had less than Year 12 education 302 DEEWR, 2012. Servicing Indigenous Job Seekers in Job Services Australia, Canberra.303 DEEWR, 2012. Servicing Indigenous Job Seekers in Job Services Australia, Canberra.304 See Appendix 1, Section 3.1 for detail of this analysis.305 DEEWR, 2012. Servicing Indigenous Job Seekers in Job Services Australia, Canberra.306 DEEWR, 2012. Employment Pathway Fund, Chapter 3: Reverse marketing, Canberra.307 See Appendix 1, Section 3.5 for a description of the methodology used.
125

compared with 46 per cent of non-Indigenous job seekers.308 In this context, pre-employment and similar programmes are likely to be the most appropriate activity for Indigenous job seekers.
The effectiveness of various activities also differed for Indigenous job seekers from that for the overall caseload. For the overall job seeker population, regression analysis that controlled other job seeker characteristics found that ‘Employment related activities’ were most likely to result in the job seeker leaving Newstart Allowance (NSA) and Youth Allowance (Other) (YA(O)), followed by Training, Work for the Dole (WfD) and ‘Other activities’ in that order. It appears that for Indigenous job seekers, however WfD was actually less effective than ‘Other activities’ (Table 8.2).
Table 8.2: Odds ratios of coming off Newstart Allowance (NSA) and Youth Allowance (Other) (YA(O)) for different activity types compared with the employment-related activities type
Population Training Work for the Dole Other activities
Indigenous job seekers n.a. 0.560 0.599
Overall job seeker population 0.789 0.732 0.715Notes: 1. n.a. – No statistical difference in the odds.2. An odds ratio less than one indicates lower odds of an outcome in the reported group than that with which it is
compared. In the table above the comparison group is the ‘Employment related activities’ type.3. See Appendix 2, Table A2.18.
Source: Department of Employment administrative data and Research and Evaluation database (RED).
Activities that effectively engage had one or more of the following characteristics: The activity involved a variety of ‘on-the-job’ tasks and training. Hands-on, tactile activities
such as construction and working with machinery were found to be very popular with young men.
Shadowing other employees and ‘learning by doing’ were found to be very effective as ways to build skills and confidence.
Placing the job seeker with a respected mentor or supervisor. Often it was a one-on-one relationship with a respected person in the workplace that kept a job seeker engaged rather than the nature of the activity itself. Mentors could also play a crucial role in supporting the job seeker if a work experience placement turned into paid employment.
The activity involved a sense of ownership, either through connecting to the job seeker’s aspirations or to the priorities of the local community. Projects where the benefits to the community were apparent (for example, health, education and youth services) were popular.
The activity connected with culture and maintaining cultural heritage through art, craft, music, working on the land or looking after areas of cultural significance.
The activity was family or clan based. Many job seekers reported they preferred group activities to working on tasks individually.
The activity was seen to lead to ongoing work through developing the skills required for jobs that were available locally.
The activity involved sport in some way.309
308 Analysis based on Department of Employment administrative data.309 DEEWR, 2012. Servicing Indigenous Job Seekers in Job Services Australia, Canberra.
126
8.5 Outcomes
8.5.1 OverviewResults for Indigenous job seekers in JSA were mixed. Outcomes for Indigenous job seekers were generally lower than for non-Indigenous job seekers. However, for several measures, results for Indigenous job seekers in JSA were better than under Job Network Services (JNS).310
According to the Post Programme Monitoring survey (PPM) results for the 12 months before the end of the first JSA contract, Indigenous outcome rates were far lower than for the overall job seeker population (Figure 8.4).311 This was the case for employment, education and positive outcomes. Indigenous job seekers in JSA were also much more likely to be unemployed and slightly more likely to have left the workforce three months after leaving assistance than the general job seeker population.312
Figure 8.4: Outcome rates for overall job seeker population and Indigenous job seekers, as at June, 2012 (per cent)
0
10
20
30
40
50
60
70
Employedfull-time
Employedpart-time
Employedtotal
Unemployed Not in thelabour force
Education &training
Positiveoutcomes
Per c
ent
Overall Indigenous
Notes: 1. This figure refers to outcomes and employment status for job seekers who participated in JSA in the 12 months to
June 2012, with outcomes measured around three months later (as estimated by PPM survey results).2. Refer Appendix 2, Table A2.73.
Source: Department of Employment Labour market assistance outcomes, September 2012 issue.
310 Job Network Services (JNS) includes Job Network and the complementary programmes which JSA replaced. See Chapter 1 for definitions.
311 See Chapter 1 for a description of the PPM survey.312 DEEWR, 2012. Labour market assistance outcomes September 2012.
127
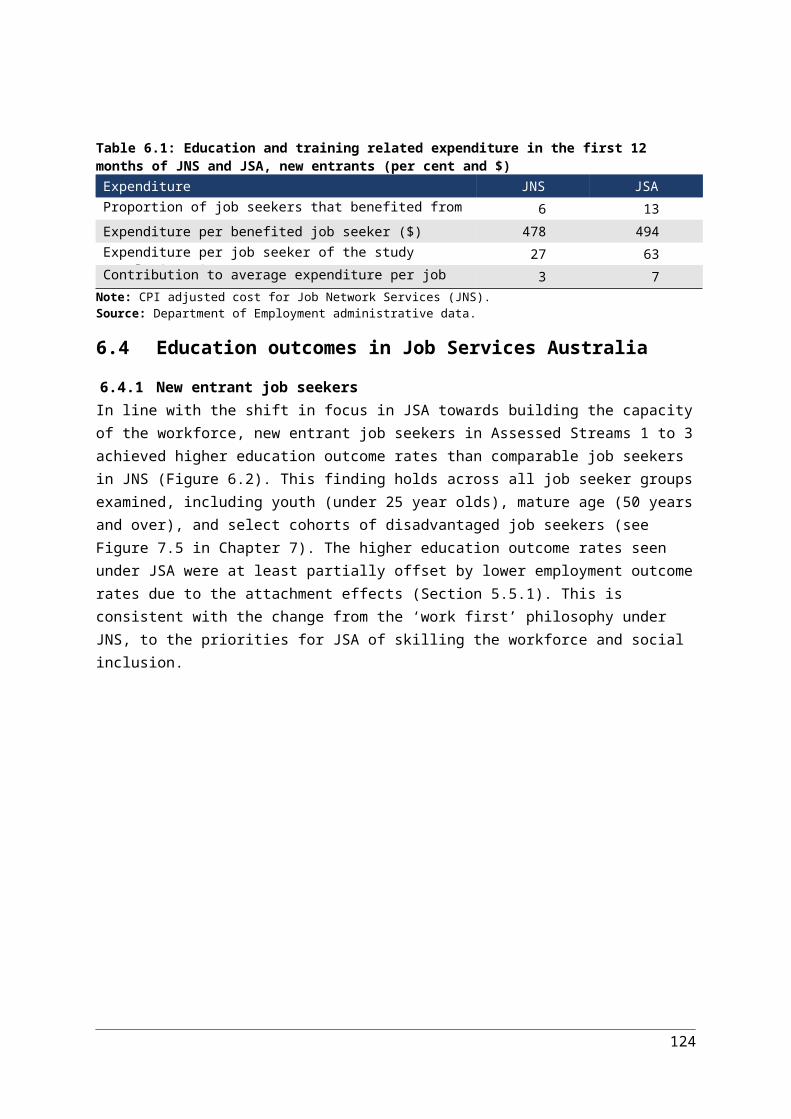
8.5.2 Comparing Job Services Australia with Job Network Services
CAUTIONARY NOTE
The difficulties involved in evaluating the relative effectiveness of JNS and JSA are compounded for Indigenous job seekers by the changes to CDEP. Many CDEP participants were also registered with employment services under both JNS and JSA. Of all Indigenous job seekers on the JNS active caseload at a point in time, around 29 per cent or just less than 23,000 participated in a CDEP activity at some time during the JNS 2006–2009 contract period. By contrast, only 10 per cent or around 9,000 of the Indigenous job seekers in the JSA caseload participated in CDEP activities during the first JSA Contract from 2009 to 2012.313
CDEP participants could meet their activity requirements by undertaking CDEP activities and this participation could be counted as an employment outcome in the PPM survey. As it was much easier to place participants in CDEP than in mainstream labour markets, the subsequent reduction in CDEP activity in the JSA contract period means that, in PPM results, Indigenous employment outcomes are skewed considerably in favour of JNS.
Outcomes for new entrantsThis section examines outcomes for Indigenous job seekers in JSA compared with JNS. Section 8.7 examines progress against the Closing the Gap employment objectives.
Employment outcomesThe gap in employment outcomes between Indigenous and non-Indigenous job seekers, as measured by PPM, appeared to widen between JNS and JSA for Streams 1, 2 and 3 (Figure 7.4).314 Employment outcomes for new entrant Indigenous job seekers in these streams dropped from 60 per cent for JNS to 46 per cent for JSA, while outcomes for non-Indigenous job seekers remained about the same (66 per cent in JNS compared with 65 per cent in JSA). However, these results do not control for differences in job seeker characteristics between the models. They are also affected by the change to CDEP noted above.
In JSA, results for Indigenous job seekers in Stream 4 were far more positive. New entrant job seekers in this stream had a much better chance of obtaining a job placement (odds ratio of 2.07, or just over twice the odds) or 13-week outcome (odds ratio of 2.09) under JSA than under JNS (controlling for job seeker characteristics) (Table A2.30 and Table A2.31).
Education outcomesThere were also much higher PPM education outcomes for new entrant Indigenous job seekers in Streams 1, 2 and 3. (Figure 7.5) Education outcomes increased threefold, from 12 per cent in JNS to 39 per cent in JSA, for job seekers in Stream 1, while education outcomes for non-Indigenous job seekers in Stream 1 increased from 13 per cent to 22 per cent. This suggests that, in JSA, Indigenous job seekers in particular benefited from the increased focus on skills and training.
313 The point in time used for this analysis was 30 September 2007 for JNS and 30 September 2010 for JSA.314 PPM results are not available for job seekers in Stream 4 for this exercise due to data availability issues.
128

Income support statusFor new entrant job seekers, regression modelling to compare income support status 18 months after commencing in employment services shows that Indigenous job seekers had a lower likelihood of leaving income support than non-Indigenous job seekers (odds ratio of 0.72, or 72 per cent of the odds for non-Indigenous job seekers) under JSA (Table A2.74). The gap in this outcome between Indigenous and non-Indigenous job seekers remained about the same from JNS to JSA.315
Outcomes for long-term unemployedFor Indigenous long-term unemployed (LTU) job seekers, employment results for those in Stream 4 as measured by PPM improved under JSA compared with JNS – from 14 per cent for JNS to 19 per cent for JSA, despite the drop in CDEP employment (Table A2.45 to Table A2.47). Across all streams, the gap in employment outcomes between Indigenous and non-Indigenous job seekers widened slightly. Overall results for LTU Indigenous job seekers were stronger than for the new entrant population, largely because of the high proportion of Indigenous LTU job seekers in Stream 4.
LTU Indigenous job seekers remained less likely to exit employment services compared with non-Indigenous job seekers under both JNS and JSA. The odds of exiting for Indigenous job seekers were 76 per cent of the odds for non-Indigenous job seekers in Stream 1 and around 85 per cent of the odds for non-Indigenous job seekers in Streams 2 to 4 (Table A2.60). However, for those who did exit, their outcomes were more sustainable under JSA than JNS. Higher proportions of Indigenous job seekers were off both NSA/YA(O) (68.7 per cent compared with 61.7 per cent) and all income support types (32.9 per cent compared with 29.7 per cent) after exiting JSA than JNS. As a result, the average reliance on income support after exit was lower for the LTU Indigenous job seekers in JSA compared with JNS (52.4 per cent compared with 56.2 per cent) groups (Table A2.61, Table A2.62 and Table A2.63).316
8.6 Supporting Indigenous employmentJSA also had a broader role to play in improving employment outcomes for Indigenous job seekers. It was designed to:
• improve Indigenous employment within employment services
• foster positive relationships with other organisations in the domain of Indigenous employment to improve opportunities for Indigenous job seekers
• support employers to increase their employment of Indigenous Australians.
8.6.1 Indigenous employment strategiesThe JSA 2009 – 2012 contract included a requirement that provider organisations develop and implement an Indigenous Employment Strategy (IES) to encourage demand for Indigenous labour within employment services and improve servicing for Indigenous job seekers. An IES set out an organisation’s commitment to, and procedures for the recruitment and retention of Indigenous staff. The exact form and content of the IES should have been tailored to the organisation but generally included components such as how the organisation would attract and retain Indigenous employees,
315 See Appendix 1, Section 2.1 for a description of the methodology used.316 See Appendix 1, Section 2.2.
129

how it would provide a culturally safe and appropriate environment for staff and clients and how it would work with local Indigenous communities and organisations.
Seventy-six per cent of service provider organisations who responded employed Indigenous staff in 2010 – up from 70 per cent at the commencement of JSA in 2009. Of those organisations that employed Indigenous staff, 76 per cent reported that this had improved linkages with local Indigenous communities and 70 per cent reported that it had improved the way that Indigenous job seekers viewed the organisation.317
Provider organisations’ views on the effect of having an IES were mixed. Most providers reported it had a positive effect on the perceptions of Indigenous employees among their non-Indigenous employees (60 per cent positive). They also felt it had a positive effect on the view of their organisation by the community (57 per cent). Responses were less positive about its effect on developing and retaining Indigenous employees (41 per cent positive) and attracting Indigenous employees (30 per cent). Only 38 per cent of those who responded considered that having an IES had a positive effect on Indigenous job seeker outcomes.318
At the JSA site level, there was limited awareness of the organisation’s IES.319 The Servicing Indigenous Job Seekers in Job Services Australia report of 2012 recommended that service providers could do more to communicate and effectively use their IES within their organisations.320 In response to these and other issues, the Service Guarantee for JSA 2012–2015 included a strengthened requirement for culturally appropriate services for Indigenous job seekers.321 The requirement to have an IES, however, was relaxed for JSA 2012-15, with only some providers required to have an IES.
8.6.2 Working with Community Development Employment Projects, the Indigenous Employment Programme and other providers
It was a requirement of the JSA 2009 – 2012 contract that providers enter into Partnership Agreements with the local CDEP providers in locations where both were operating. These Service Level Agreements (SLAs) set out how organisations would work in partnership to coordinate service delivery and maximise work readiness and employment outcomes for Indigenous job seekers.322
Qualitative research in remote areas found that the relationship between JSA and CDEP providers varied considerably between locations. In some areas the relationship worked well and providers collaborated to deliver services. In others community members and staff reported that relationships were not functional, with disagreements over roles and responsibilities impeding service delivery.323
Formal agreements such as SLAs between organisations can increase understanding, reduce uncertainty in relationships between service providers and ultimately improve service delivery.
317 DEEWR, 2012. Servicing Indigenous Job Seekers in Job Services Australia, Canberra. Proportions are calculated by excluding missing values.
318 DEEWR, 2012. Servicing Indigenous Job Seekers in Job Services Australia, Canberra. Proportions are calculated by excluding missing values.
319 DEEWR, 2012. Servicing Indigenous Job Seekers in Job Services Australia, Canberra.320 DEEWR, 2012. Servicing Indigenous Job Seekers in Job Services Australia, Canberra.321 DEEWR, 2011. Request for Tender for Job Services Australia 2012–2015 – Overview, Canberra.322 DEEWR, 2009, Employment Services Deed 2009 – 2012, clause 116, Canberra.323 DEEWR, 2012. Servicing Indigenous Job Seekers in Job Services Australia, Canberra.
130

Service provision for Indigenous job seekers in particular could be improved if JSA providers strengthened and formalised their relationships with other organisations in their local areas.324
The RJCP was designed to overcome some of these issues in remote areas.
8.6.3 Employer attitudesJust over one-third (39 per cent) of employers surveyed had employed an Indigenous staff member, at some time in the past (Table 9.2). Only a small proportion reported that their organisation had a written or unwritten policy for recruiting and employing Indigenous workers.
Overall, employers were mixed in their attitude to employing Indigenous workers. Where they had reservations, these were most likely that it could be hard to find Indigenous workers with the relevant skills or experience (32 per cent of employers voicing reservations). In terms of general attitudes toward Indigenous employees, nearly a third (29 per cent) of all employers agreed or strongly agreed that retaining Indigenous staff could be difficult; that there could be challenges with Indigenous workers fitting into the workplace (15 per cent); with their perceived requirements for extra flexibility in work arrangements (16 per cent); and with their cultural commitments (17 per cent). This indicates that some negative perceptions among employers are a reality that Indigenous job seekers and service providers must deal with.325 Several submissions to the Employment services – building on success discussion paper326 recommended simplifying and improving access to information about support for employers who employ Indigenous job seekers.327
Other research has emphasised the need for Indigenous job seekers to have appropriate skills for success in the labour market, including ‘soft skills’ such as presentation, communication, general work readiness skills and an understanding of workplace cultures.328
8.7 Closing the GapOne of the objectives of JSA was to help meet the Closing the Gap objective329 of halving the gap in employment outcomes between Indigenous and non-Indigenous Australians by 2018.
Closing the Gap was a Council of Australian Governments (COAG) initiative through the National Indigenous Reform Agreement, which aims to reduce the economic and social disparities between Indigenous and other Australians. The Closing the Gap agenda includes six specific targets across key areas of physical, social and economic wellbeing.330 The Closing the Gap target in employment is to halve the gap in employment outcomes between Indigenous and non-Indigenous Australians by 2018.
324 DEEWR, 2012. Servicing Indigenous Job Seekers in Job Services Australia, Canberra.325 DEEWR, 2012. Servicing Indigenous Job Seekers in Job Services Australia, Canberra. Figures in this report have been
updated with finalised survey results.326 DEEWR, 2012.Employment Services – Building on Success Issues Paper.327 Including submissions from, among others, Kalwum Development Cooperation Limited Health Service Division;
Dreamtime Public Relations.328 Generation One, 2011. Walk in my shoes: A research report prepared by Auspoll, Generation One.329 DEEWR, 2008. The future of employment services in Australia: A discussion paper, Canberra.330 Department of Families, Housing, Community Services and Indigenous Affairs, 2010. Closing the Gap – Prime
Minister's Report, FaHCSIA, Canberra.
131

When Closing the Gap was announced in 2008, 53.8 per cent of Indigenous Australians aged 15 to 64 years were employed compared with 75.0 per cent of non-Indigenous in the same age range – a gap of 21.2 percentage points. In order to achieve the target of halving the gap in employment outcomes by 2018, this gap would need to have been reduced to below 11 percentage points.331 332
8.7.1 Measuring progressMeasuring progress against the Closing the Gap target is difficult for a number of reasons. Firstly, reliable data on Indigenous employment, particularly in remote areas, is difficult to collect and estimate. COAG identified the National Aboriginal and Torres Strait Islander Social Survey (NATSISS) and the National Aboriginal and Torres Strait Islander Health Survey (NATSIHS) as appropriate data sources for measuring Indigenous employment outcomes.333 For this report, the NATSISS data from 2008 was used to set the baseline measure for the Closing the Gap target. Employment results from the 2012–2013 NATSIHS showed that just under half (47 per cent) of Indigenous Australians aged 15 to 64 were employed (29.7 per cent full-time and 17.8 per cent part-time).334 Population Census data, which is often used in the interim, is not directly comparable with either NATSISS or NATSIHS data, and is also only available every five years.335
Secondly, the baseline used to measure progress against the Closing the Gap target includes CDEP employment. Changes to CDEP from 2006 have resulted in a drop in employment in CDEP from 32,800 in 2006 to 10,692 in 2011.336 Over the same time frame, the proportion of the Indigenous adult population who were CDEP participants fell from 7 per cent in 2006 to 2 per cent in 2011 for women and from 13 per cent to 3 per cent for men.337 These changes should be considered when assessing progress against the baseline figures.
8.7.2 Job Services Australia and Closing the GapAssessing the contribution of JSA to Closing the Gap is also highly problematic. JSA is part of a complex set of interrelated programmes at national and state level. Indigenous employment outcomes are influenced by many factors, including macroeconomic conditions and the effects of other government and non-government policies and services such as health, education and training and housing services.
The target for Closing the Gap is defined as the proportion of the working age population in employment. This measure can be affected by demographic and other factors apart from success in the labour market. Populations with a younger age structure, such as the Indigenous population, are likely to have higher proportions of the working age population engaged in study and training and 331 Department of Families, Housing, Community Services and Indigenous Affairs, 2010. Closing the Gap – Prime
Minister's Report, FaHCSIA, Canberra, p 28.332 Data is based on results from the NATSISS 2008 survey.333 COAG Reform Council, 2011. National Indigenous Reform Agreement: Performance report for 2009–10, COAG
Reform Council, Sydney.334 Australian Bureau of Statistics, June 2014. Australian Aboriginal and Torres Strait Islander Health Survey: Updated
Results, 2012–13, Cat. No. 4727.0.55.006.335 Department of Families, Housing, Community Services and Indigenous Affairs, 2012. Closing the Gap – Prime
Minister's Report, FaHCSIA, Canberra.336 Gray, M, Hunter, Band Howlett, M, 2013. Indigenous employment: A story of continuing growth, CAEPR Topical Issue
No 2/2013, Centre for Aboriginal Economic Policy Research (CAEPR). Data are based on CDEP administrative data.337 Gray, M, Hunter, Band Howlett, M, 2013. Indigenous employment: A story of continuing growth, CAEPR Topical Issue
No 2/2013, Centre for Aboriginal Economic Policy Research (CAEPR).
132

hence out of the labour force. Work to Close the Gap for Indigenous Australians in education outcomes has already improved Year 12 or equivalent attainment rates.338 Increasing the participation of Indigenous Australians of all ages in education and training is crucial to overcoming barriers to employment, including the attitudes of many employers to employing Indigenous Australians described above. Yet the short and medium-term effects of progress in this area may well be a short-term attachment effect and consequent short to medium-term decrease in employment outcomes.
8.7.3 ResultsThe Closing the Gap Prime Minister’s report 2013 used Population Census data from 2006 and 2011 to assess progress against the target. By this measure, the gap in employment outcomes increased from 23.7 percentage points in 2006 to 25.9 percentage points in 2011 as the Indigenous employment rate fell from 48.0 per cent to 46.2 per cent and the non-Indigenous employment rate increased from 71.7 per cent to 72.2 per cent. However, in recognition of the effect that the decline in CDEP employment has on measuring the Gap, the report also noted that when CDEP employment is excluded, there had been an increase in the proportion of Indigenous job seekers aged 15 to 64 employed in mainstream jobs: from 42.4 per cent in 2006 to 44.7 per cent in 2011.339 The largest growth in non-CDEP employment occurred in remote areas, partially due to an increase in employment in mining, but growth also occurred in non-remote regions.340
In this context, the record of JSA in improving Indigenous employment outcomes is mixed. Employment outcomes for job seekers in Streams 1 to 3 apparently fell compared with those achieved under JNS, although this was at least partly due to the decrease in CDEP employment. Results for the most disadvantaged Indigenous job seekers, those in Stream 4, were more positive and JSA clearly improved employment outcomes for these job seekers. As Stream 4 job seekers generally made up around one-third of the JSA Indigenous caseload, this was a considerable achievement.
JSA contributed to improved educational achievements and skills development for Indigenous job seekers, with higher education outcomes across all streams. Where this training was appropriately targeted, it could be expected to lead to improved employment outcomes in the longer-term.
JSA contributed to improving economic opportunities for Indigenous Australians by encouraging Indigenous employment within employment services and working with other services and programmes such as DES and IEP to improve opportunities and outcomes for Indigenous job seekers. It played an important role in encouraging and supporting employers to employ Indigenous job seekers and in assisting them to provide safe and culturally appropriate workplaces.
338 Department of Families, Housing, Community Services and Indigenous Affairs, 2013. Closing the Gap – Prime Minister's Report, FaHCSIA, Canberra.
339 Department of Families, Housing, Community Services and Indigenous Affairs, 2013. Closing the Gap – Prime Minister's Report, FaHCSIA, Canberra.
340 Gray, M, Hunter, Band Howlett, M, 2013. Indigenous employment: A story of continuing growth, CAEPR Topical Issue No 2/2013, Centre for Aboriginal Economic Policy Research (CAEPR).
133

8.8 New developments and future directionsMajor changes to employment services for Indigenous job seekers were introduced in the second contract period for JSA 2012–2015. In addition, a number of new employment-related programmes for Indigenous job seekers commenced during or after the JSA 2009 – 2012 contract period.
Indigenous Youth Careers Pathways Programme (IYCP) commenced on 1 January 2012 as part of the Building Australia’s Future Workforce (BAFW) suite of measures. The programme facilitated school-based traineeships for Indigenous students and assisted students to engage with mainstream employment services, find a job or move into further study. Through aspirational activities and events, the programme aimed to inspire and support Indigenous students, including younger students, to complete their schooling and make an effective transition to further education or a job.
The Indigenous Ranger Cadetship (IRC) also a BAFW measure, a pilot that commenced on 1 January 2012 and was intended to test approaches to the development and implementation of IRC programmes in regional and remote communities. The IRC pilot aimed to assist young Indigenous Australians to complete school and build their capacity for further study, training, jobs and careers in land, sea and natural resource management.
8.9 ConclusionIndigenous job seekers were a substantial proportion of the JSA job seeker group in 2009 – 2012 and remained so after the introduction of the RJCP in July 2013. This group was younger, with a higher proportion living in regional and remote areas and a very substantial proportion with high barriers to employment compared with non-Indigenous job seekers. Each of these characteristics presented challenges for employment service providers including:
• more young people, particularly young men nearing working age, increased the importance of providing effective and appropriate education and training opportunities to these job seekers
• providing services and achieving employment, education and training outcomes in remote areas also presented a number of challenges. RJCP was introduced on 1 July 2013 in recognition of these challenges.
At the end of the first JSA contract period, nearly half of Indigenous job seekers were in Stream 3 and a further 33 per cent were in Stream 4. Only 5 per cent of the Indigenous active caseload was work ready – that is, in Stream 1. This emphasises the need for providers to be able to assist job seekers to overcome both vocational and non-vocational barriers, including by building strong links with other organisations, such as those in homelessness and disability services, and with employers.
Based on the available evidence, JSA 2009 – 2012 assisted many Indigenous job seekers into employment. Comparisons with results for similar job seekers under JNS are difficult because of the large reduction since July 2009 of CDEP activities that had previously counted as employment. However, Stream 4 Indigenous job seekers in particular showed much improved employment outcomes compared with similar job seekers in JNS. Results for Indigenous job seekers in Streams 1 to 3 were mixed, but sustainability measures indicated that Indigenous job seekers in JSA were achieving outcomes that were comparable, and in some cases more sustainable, than those recorded under JNS.
134
Education and training outcomes for Indigenous job seekers were substantially improved under JSA compared with JNS, in line with the increased focus under JSA on education and skills development.
The contribution of JSA to helping Close the Gap in employment outcomes for Indigenous Australians is difficult to assess. Indigenous employment outcomes are influenced by many factors, such as macroeconomic conditions, demographic trends, other policies and programmes and the negative attitudes that some employers hold towards employing Indigenous seekers.
While employment outcomes for Indigenous job seekers under JSA were somewhat mixed, the higher rate of educational outcomes achieved under JSA may in the longer-term result in improved employment outcomes.
There was evidence that the quality and effectiveness of services for Indigenous job seekers could be improved if providers built stronger links with local Indigenous communities and other service providers and by improving the cultural competency of staff. These areas have been addressed to some extent in the JSA 2012 – 2015 contract but require ongoing emphasis.
The importance of mentoring and post-placement support for Indigenous job seekers – in particular, in the transition from school or from long-term unemployment into work – is increasingly acknowledged.341 New programmes introduced as part of the BAFW package were designed to help fill this role but JSA providers could have done more in this area.
Other areas where JSA providers could have improved the assistance to Indigenous job seekers included: working more effectively with employers to better understand their requirements; supplying employers with suitable Indigenous candidates; and providing better post-placement support and support with cultural awareness.
341 See, for instance, Generation One, 2011. Walk in my shoes: A research report prepared by Auspoll; submissions to Employment services — Building on success discussion paper, including those from Kalwum Development Cooperation Limited Health Service Division.
135
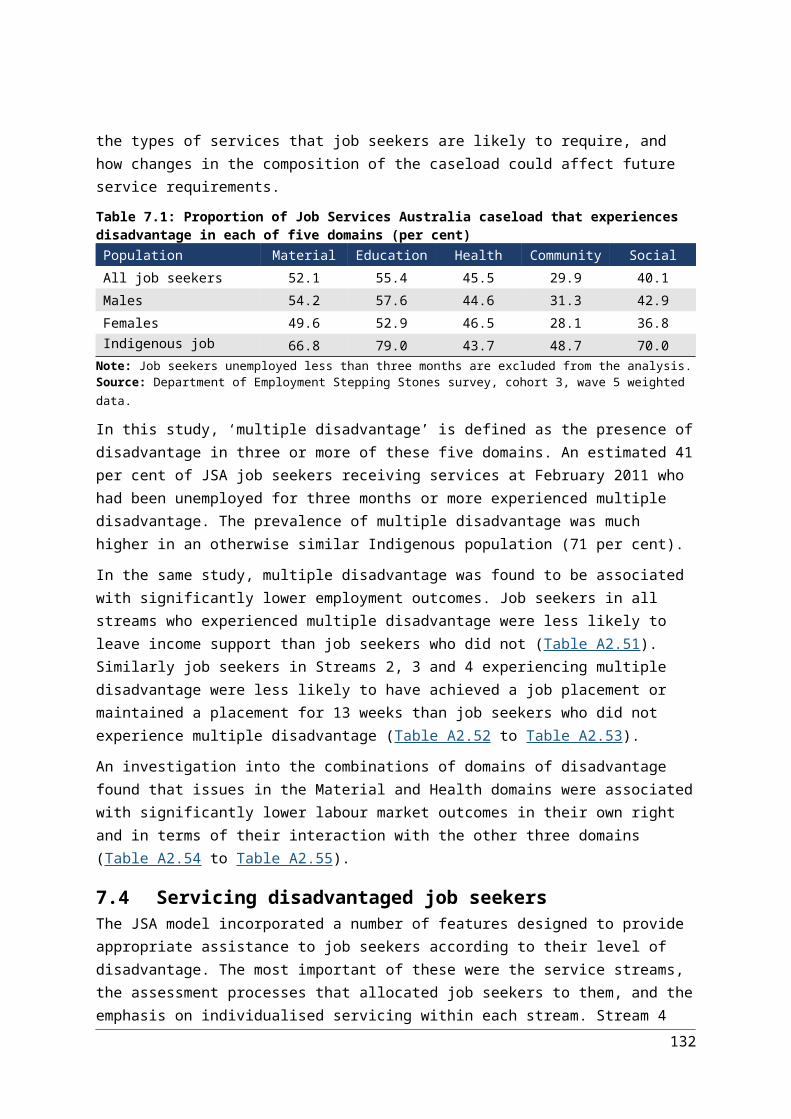
9 Employer servicing
9.1 IntroductionA strong working relationship between service providers and employers is essential for effective employment service delivery. Under the Job Services Australia (JSA) service delivery model, providers were required to work with employers to determine their needs and focus on skills development to meet skill shortages. In this chapter, factors that contributed to the provider–employer relationship are explored.
9.2 Employers’ use of employment agencies
9.2.1 Employers’ awareness and use of Job Services AustraliaThere was a significant difference in employers’ reported levels of awareness and use of government-funded employment services between the Job Network Services (JNS) and the JSA model (Table 9.1).342 In 2012, 65 per cent of employers were aware of government-funded employment services, however awareness of JSA, specifically, was significantly lower (28 per cent).
Table 9.1: Proportion of employers aware of JNS and JSA and their usage of such services (per cent)Awareness/Use JN (2007) JSA (2012)Awareness 70 28
Use 18 9
Notes: 1. Usage questions were only asked of those that were aware of the services.2. These results were obtained from random samples of employers who had recruited or tried to recruit in the previous
12 monthsSources: Department of Employment 2007 Survey of Employers and 2012 Survey of Employers.
It should be remembered that when the 2007 Survey of Employers was conducted, the Job Network brand had existed for over nine years (from May 1998). By contrast, when the 2012 Survey of Employers was conducted, the Job Services Australia (JSA) brand had only been in existence for around three years. In qualitative work, some employers still referred to government-funded employment services as Job Network well after JSA was introduced. Evidence of similar brand confusion was found in 2001 following the transition from the Commonwealth Employment Service (CES) to Job Network.343
Brand recognition was a common theme raised in public consultations to the Employment services beyond 2015 Issues Paper.344 One issue raised was the need to increase promotion of employment services to employers and peak industry bodies.345 It was suggested that the focus model on competition in the JSA had led to providers moving away from the generic JSA brand in favour of their own organisation’s brand. The National Employment Services Association (NESA) noted that:346
342 The term Job Network Services (JNS) is used when referring to Job Network and the relevant complementary services which JSA replaced.
343 DEWR and NFO Donovan Research, 2001. Employer endorsement of Job Network, Employer survey papers, Topic 2, Canberra.
344 Internal analysis of responses to Employment services beyond 2015 Issues Paper.345 Department of Employment 2013, Employment services beyond 2015 Issues Paper.
136

Providers of Australian employment services are contractually obliged to adopt the designated program branding and approved logos consistent with guidelines. However, as contracted providers operating in a competitive framework they also need to achieve differentiation in the market through their unique selling propositions and organisational identity.
It is likely that awareness and use of government-funded employment services is under-reported by employers due to a lack of brand recognition of JSA. For this reason, recent Employer Surveys have been modified to remind respondents of the organisation brand names of government-funded employment service providers to improve the accuracy of their responses. In the 2012 Employers Survey, employers who had used the services of a JSA provider in the previous 12 months reported that the main reason they chose the provider was:
the employer was approached by the service provider 38 per cent
based on the provider’s local knowledge / provider being local 23 per cent the employer had heard of /knew of the provider or their good reputation 16 per cent.
Qualitative research undertaken in 2010 found that those employers who had established a positive working relationship with one provider were more likely to return to them for repeat business.347
9.3 Attributes that employers value
9.3.1 What employers want in job seekersEmployers overwhelmingly report that their main priority when recruiting was finding ‘the right person for the job’. In the 2012 Survey of Employers the most reported characteristics sought in applicants were ‘reliability’ and ‘willingness to work’. The 2009 combined Survey of Employers’ Recruitment Experiences similarly found that three-quarters of employers placed a high degree of importance on job seekers’ attitudes and motivation to work.
There is a perception among some employers that job seekers from government-funded employment services lack these qualities.348 The need for providers to ensure that they screen candidates so that only suitable, motivated ‘work ready’ applicants attend interviews was also raised in public consultations for employment services beyond 2015.349
9.3.2 Satisfaction with Job Services Australia servicesLevels of employer satisfaction with providers (as reported in employer surveys) were higher under JSA than under JNS. Almost 9 out of 10 employers (89 per cent) who had used a JSA provider for their last vacancy were satisfied or very satisfied with that agency compared with 77 per cent of employers who had used a JNS provider for the same purpose in 2007.350
In 2012, a quarter of employers rated their experience of using a JSA agency as ‘acceptable’ and a further two-thirds (65 per cent) rated their most recent experience as ‘good’ or ‘very good’. Eighty
346 National Employment Services Association, 2013. Realising our potential: Response to ‘Employment Services – Building on Success’ discussion paper, NESA
347 DEEWR, 2010. Departmental qualitative research round – See Section 1.2.3 for a description of this research.348 DEEWR, 2010, 2012. Survey of Employers.349 Department of Employment, 2013. Employment services beyond 2015.350 DEEWR, 2007, 2010. Survey of Employers.
137
per cent of large, 77 per cent of medium and 73 per cent of small businesses stated that they would use the same agency again.351
Employers who had received job applicants from a JSA provider ‘agreed’ or ‘strongly agreed’ that the applicants sent:352
were well presented 73 per cent were willing to work 59 per cent were reliable 53 per cent had relevant work skills 53 per cent had relevant previous work experience 48 per cent.
These figures confirm perceptions that some employers had about job applicants from government-funded job agencies lacking relevant and necessary work skills.
These employers also either ‘agreed’ or ‘strongly agreed’ that the service providers:353
understood their business needs 73 per cent accurately described the skills and abilities of the people they sent 68 per cent sent job applicants with relevant skills and abilities 64 per cent.
These 2012 results show some discrepancy between what employers want and what some perceive was available through government-funded employment services. This gap in expectations may have been a barrier to the uptake of JSA services, recommendations to other employers and repeat business.
In 2012, when asked to list the strengths and weaknesses of government-funded employment services, employers who had used JSA reported the following strengths:354
providing suitable applicants 23 per cent providing a screening process 19 per cent service is free of charge 19 per cent incentives/subsidies 16 per cent fast efficient service/ saves us time 16 per cent.
While employer satisfaction with JSA services was generally high, there was a perception among dissatisfied users that the calibre of job seekers sourced from government-funded employment service providers was low. The most frequently reported problems were355:
351 DEEWR, 2012. Survey of Employers.352 DEEWR, 2012. Survey of Employers.353 DEEWR, 2012. Survey of Employers.354 DEEWR, 2012. Survey of Employers.355 DEEWR, 2012. Survey of Employers.
138

not sending suitable candidates 13 per cent poor quality candidates 13 per cent sending job seekers who do not want to work 11 per cent.
The overlap between the aspects given as strengths and weaknesses of JSA suggests employers experienced variable service quality. This variability indicates that there was room for improvement in how some JSA providers work with employers. What employers value most from services were being provided with suitable and appropriate candidates and the quality (and lack of cost) of the services provided.356
9.3.3 Employer attitudes to disadvantaged job seeker groupsMost employers reported that they would employ job seekers from disadvantaged groups if they demonstrated the skills and experience to perform the role. In most cases, the job seeker’s skills outweighed any perceived barriers or risks posed by their disability/background. Regarding people with disability, some employers were also unaware that they had hired a person with disability until it was disclosed by the job seeker.357
Despite employers reporting negative perceptions of certain groups of job seekers, those perceptions did not always affect hiring practices (Table 9.2).
Table 9.2: Proportion of employers reporting current or previous employment of disadvantaged job seeker groups (per cent)
Type of job seeker Per cent
Indigenous Australians 39
People with disability 42
Young people (15 to 24 years old) 85
Mature age people (50 years or older) 78
People previously unemployed for two years or more 34
Parents out of workforce for two years or more 41Sources: Department of Employment 2010 Survey of Employers and 2012 Survey of Employers.
Information about specific groups mentioned below suggests that employer perceptions of each of the groups considered are specific, and that different approaches are needed to address them.358
Indigenous Australians
Attitudes to Indigenous employees were generally neutral in tone and dependent on personal experience. The most pressing impediment to hiring Indigenous job seekers was their perceived lack of availability with relevant skills or experience for the job. Some employers also cited challenges with reliability, difficulties in retention and difficulties in providing Indigenous staff with extra flexibility in work arrangements which was sometimes required. More detailed information about employer attitudes to Indigenous job seekers is in Section 8.6.3.
356 DEEWR, 2012. Survey of Employers.357 DEEWR, 2012. Qualitative research for the Survey of Employers.358 DEEWR, 2010, 2012. Qualitative research for the Survey of Employers.
139

People with disability
While hiring people with disability was seen as increasing workforce diversity and fulfilling corporate social responsibility, there was a strong level of concern regarding the capability, adaptability and safety of staff with disability. Fifty-four per cent of employers indicated that they would be willing to hire people with disability, while 24 per cent said that it would ‘depend’.
Youth
Attitudes towards younger workers were generally less favourable compared with the other groups, especially in terms of attitude to work, reliability and, in some cases, productivity. Lack of experience was a concern for many employers, as was difficulty in retaining younger workers.
Mature age job seekers
This group was perceived in a more positive light than other groups. The most pressing issue perceived by employers was lower physical limitations or fitness levels. However, this was balanced by the perception that mature age people had work and life experience and were likely to be reliable. Ninety per cent of employers indicated that they would be willing to hire mature age people and 5 per cent said it would ‘depend’.
Very long-term unemployed job seekers
Very long-term unemployed (VLTU) job seekers were generally viewed less favourably than other groups, especially in terms of attitude, reliability, and consistency. However, this group was perceived to be keen to work and to a lesser extent motivated to do well. Seventy-one per cent of employers indicated that they would be willing to hire VLTU job seekers and 15 per cent said it would ‘depend’.
Parents who have been out of the workforce for a long period
This group was generally considered positively. Employers saw them as keen to work and having life experience. Eighty-nine per cent of employers indicated that they would be willing to hire parents who had been out of the workforce for a long time and 7 per cent said it would ‘depend’.
9.4 Strategies for servicing employersGood Practice in Job Services Australia noted that high-performing provider sites were more likely than mid- and low-performing sites to:359360
• use a wide range of strategies to identify employers’ skills needs
• use knowledge of the local employment market and employers’ skills needs to customise training and activities or promote relevant apprenticeships and traineeships
• maintain good relationships with employers by:
providing consistently high-quality service
clearly explaining the services they provide
359 High-performing sites were identified using Star Rating and participant experience measures which were combined into a 25 level rating, with the Star Ratings component weighted at 10 times the participant experience measure. The combined performance rating was then divided into low, medium and high performing sites. See Section 10.3 for further discussion of Star Ratings.
360 DEEWR, 2012. Good practice in Job Services Australia, Canberra.
140

appreciating the value of the employer’s time
developing an understanding of the employer’s business
placing job seekers that were job ready and appropriate for the job
• provide effective post-placement support to employers
• provide good service and maintain good relationships with employers, maximising the opportunity for repeat business and referrals.
The types of services employers reported having received from JSA providers in the preceding 12 months are shown in Figure 9.1.
Figure 9.1: Services received by employers who used JSA 2012 (per cent)
0 10 20 30 40 50 60 70 80 90
Candidate screening and short-listing
Work experience or trial placement of a candidate
Training before an employee started
Training after an employee started
Support and follow-up after an employee started
Wage subsidies in the last 12 months
Per cent
z
Notes:1. Wage subsidies are expressed as a percentage of those employers who were aware of wage subsidies.2. Training and support/follow-up are expressed as a percentage of those employers who had recruited someone
through a JSA agency in the previous 12 months.3. Refer Appendix 2, Table A2.75.
Source: Department of Employment 2012 Survey of Employers.
Some strategies which providers could use to deliver more effective service to employers include:
• making more use of the Employment Pathway Fund (EPF)
• increasing access to work experience and skills development activities
• obtaining information to identify employers’ skills needs from a variety of sources
• accessing other government initiatives.
9.4.1 Candidate screening and short-listing Around 60 per cent of employers who had used a JSA provider in the previous 12 months reported that the provider had screened or short-listed applicants for them. High-performing JSA provider
141
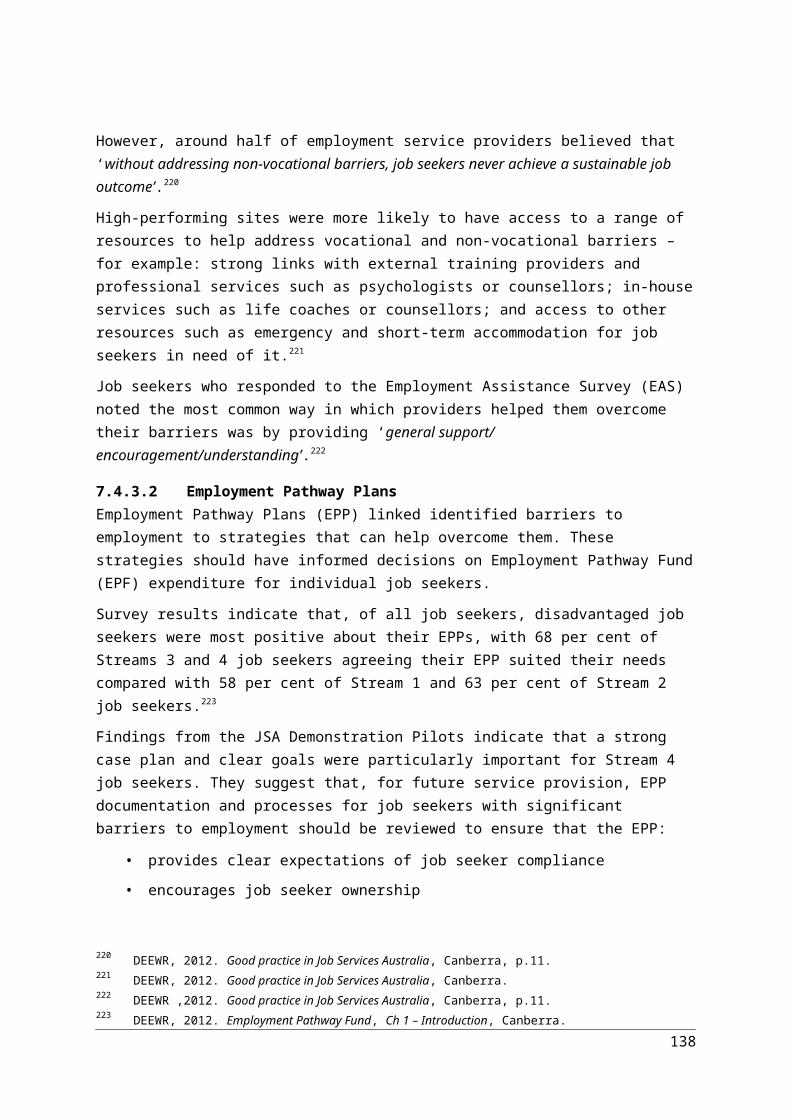
sites were more likely than mid and low-performing sites to take a goal-oriented, individually tailored attitude to job placements.
High-performing sites, more than low to mid-performing sites:361
• attempted to find the best match between a job and the job seeker’s interests and goals
• worked with employers to tailor the job to suit both the job seeker and the employer
• ensured that job seekers were job ready and met the expectations of employers they were placed with.362
9.4.2 Understanding employer needsHigh-performing sites were more proactive in their relationships with employers when compared with mid and low-performing sites. They worked to understand employers’ skills needs, referring or reverse marketing job seekers to them, and effectively supported employers after placing job seekers. High-performing sites worked to maintain good relationships with employers by:
• providing consistently high-quality customer service
• clearly explaining what services they provided
• demonstrating that they understood the value of the employer’s time
• developing an understanding of the employer’s business
• minimising ‘red tape’ as much as possible or even doing the administrative work for the employer when appropriate
• ensuring that employers did not have to repeat information by either using the same staff member to contact the employer each time or ensuring that all relevant information was passed between staff members
• providing good post-placement support that was appropriate to the needs of the job seeker and employer.363
Providers reported using a variety of ways to identify the needs of employers including networking with other stakeholders (including 99 per cent who networked with employers and 73 per cent with chambers of commerce and industry associations). Providers also reported reverse marketing, which they consistently used as a way of marketing job seekers, as a way of identifying employer needs (97 per cent). Lower levels of inter-provider networking (41 per cent) were likely to be a result of the competitive nature of the industry (Figure 9.2).
Of those providers located in Priority Employment Areas (PEA), 68 per cent reported attending Centrelink Jobs Expos and 34 per cent reported talking to Local Employment Coordinators (LEC) to assist them to identify employers’ needs.
361 High-performing sites were identified using Star Rating and participant experience measures which were combined into a 25 level rating, with the Star Ratings component weighted at 10 times the participant experience measure. The combined performance rating was then divided into low, medium and high performing sites. See Section 10.3 for further discussion of Star Ratings.
362 DEEWR, 2012. Good practice in Job Services Australia, Canberra.363 DEEWR, 2012. Good practice in Job Services Australia, Canberra.
142

Figure 9.2: Strategies reportedly used JSA providers to identify skills needs of employers 2012 (per cent)
0 10 20 30 40 50 60 70 80 90 100
Working with Employer Broker
Focus on job as described by employer
Reverse marketing
Attend Department of HumanServices Jobs Expos
Talking withLocal Employment Coordinator (LEC)
Working with NationalDisability Recruitment Coordinator
Attending meetings of chambers ofcommerce /industry associations
Networking with other providers
Networking with employers
Proportion of providers
Notes: 1. Talking with Local Employment Coordinators’ and ‘Attend Centrelink Job Expos’ only related to providers located in
Priority Employment Areas.2. Refer Appendix 2, Table A2.76.
Source: Department of Employment 2012 Survey of Employment Service Providers.
Despite the range of tools JSA providers used to determine the needs of employers, the weaknesses of JSA services as reported by some employers – for example, poor job seeker suitability and quality – suggest that employers’ needs may not have been fully understood by some providers. In 2012, 86 per cent of providers either ‘agreed’ or ‘strongly agreed’ with the statement ‘this site facilitates development activities for job seekers that meet the local needs of employers’ (similar results were recorded in 2010 and 2011). While the majority of providers believed that they were making efforts in this area the disparity between these two findings may be because providers did not fully understand local employer needs, local employers were not clearly articulating their needs to providers or some provider efforts were not sufficient to meet employer expectations.
Only one-half of providers (49 per cent) reported that they always focused on the role as described by the employer and 13 per cent stated that they seldom focused on the role.364 This suggests that the needs of employers may not have been taken in to consideration, which to some extent explains
364 DEEWR, 2012. Survey of Employment Service Providers.
143

some of the employer dissatisfaction results discussed previously. A successful job placement is dependent on meeting the needs of both job seeker and the employer.
Figure 9.3: Methods used by JSA providers to facilitate job placements 2012 (per cent)
0 20 40 60 80 100
Reverse market clients to new and existing employers
Focus on the role as described by the employer
Offer support to supervisors and co-workers
Encourage employers to tailor the role to meet theclient's needs
Educate employers about available wage subsidies
Educate employers about available support (such asJobAccess, Workplace Modifications)
Provide on-the-job training as part of post-placementsupport
Proportion of providers (per cent)Always Usually Seldom
Note: Refer Appendix 2, Table A2.77.Source: Department of Employment 2012 Survey of Employment Service Providers.
Providers need to focus more on understanding employer needs and supporting employers to ensure their needs are understood and met. This need and the implications were summarised in the following Australian Chamber of Commerce and Industry (ACCI) statement:
Industry feedback suggests that some JSA providers do not have sufficient specialist industry knowledge to make a satisfactory placement so opportunities for real employment outcomes are lost. JSAs with strong industry links and understanding enable those JSAs to better understand the needs of employers, the skills and labour requirements for that industry and better link training services for job seekers to ensure that training is relevant to the needs of the employer.365
Putting employers central to the employment services system was also a common theme raised in public consultations for employment services beyond 2015.366
9.4.3 Employer BrokersThe Employer Broker Programme was a component of the JSA 2009 – 2012 contract. The programme objective was to ensure that employment services focused on matching the needs of job seekers with the labour requirements of employers. Results from the Survey of Employment Service Providers showed awareness and use of the Employer Broker programme among providers and
365 Australian Chamber of Commerce and Industry, 2013. Employment services – Building on success: ACCI response, March, ACCI.
366 Department of Employment, 2013. Employment services beyond 2015.
144
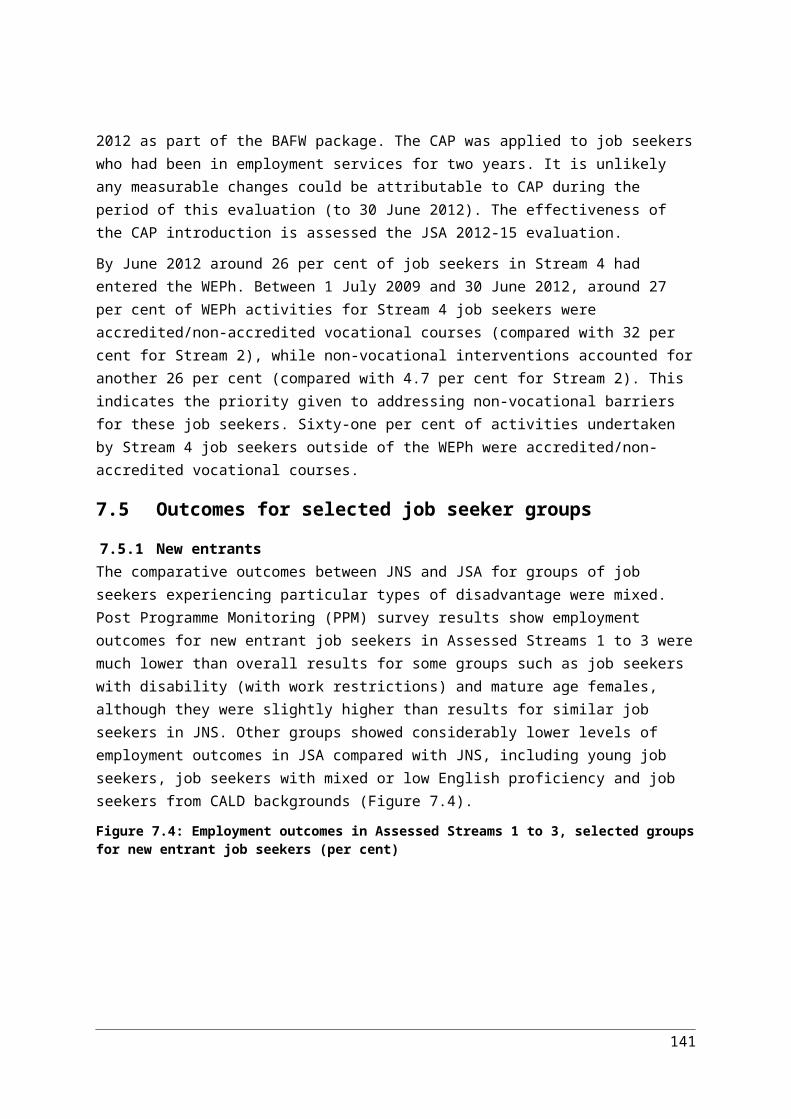
other stakeholders was low in 2010 but had increased substantially by 2011.367 The majority of providers who had contact with an Employer Broker reported that the services were useful. However, there was little evidence of a national impact in linking providers with employers to meet local demand for skills. Given that the programme was capped at thirty projects with a total value of approximately $4.5 million it would not be expected to have measurable impact at a national level. These projects ended on 30 June 2012.368
9.4.4 Wage subsidiesIn the JSA model, wage subsidies were used as an incentive to encourage employers to hire disadvantaged job seekers on an ongoing basis. Employers could receive a wage subsidy for any eligible job seeker at the provider’s discretion using the money in the EPF. The level of subsidy was to be commensurate with the level of the job seeker's disadvantage and was expected to be higher for job seekers in higher streams. The length of time for which the wage subsidy was paid, the amount paid and the payment schedule were negotiated between provider and employer. In the JSA 2009 – 12 contract, in addition to the EPF, wage subsidies were available to various job seeker groups under programmes such as the Indigenous Employment Programme (IEP).
Employer awareness of wage subsidiesResearch showed that employers were more likely to be aware of wage subsidies if they had dealt with a JSA provider in the previous 12 months. Nearly 80 per cent said they were aware of wage subsidies compared to 68 per cent of the general employer population.369 370
Large businesses that had dealt with a JSA provider in the previous 12 months had higher awareness rates (88 per cent) than medium (85 per cent) and small businesses (79 per cent). Regional businesses were more aware of wage subsidies (83 per cent) than metropolitan employers (76 per cent).371
Employers who had dealt with a JSA provider in the previous 12 months most commonly reported becoming aware of wage subsidies from government-funded employment agencies (68 per cent) and by word of mouth from family, friends or business contacts (16 per cent). These results varied by business size and location. Just over 39 per cent of employers who had used JSA in the last 12 months indicated that they had received a wage subsidy. Overall, 80 per cent of the employers who had received a wage subsidy stated that the subsidy was suggested by the provider. Twenty per cent had approached the employment agency requesting a subsidy.372
Employer use of wage subsidiesThe main factors that attracted employers to a wage subsidy were:
to reduce costs while the job seeker learnt the necessary skills 43 per cent
to see if the job seeker would fit into the organisation 30 per cent
367 DEEWR, 2010, 2011. Survey of Employment Service Providers.368 DEEWR, 2012. Annual Report, 2011–12.369 These subsidies included those funded through the EPF, DES and the IEP.370 DEEWR, 2012. Survey of Employers, Canberra.371 DEEWR, 2012. Survey of Employers, Canberra.372 DEEWR, 2012. Survey of Employers, Canberra.
145
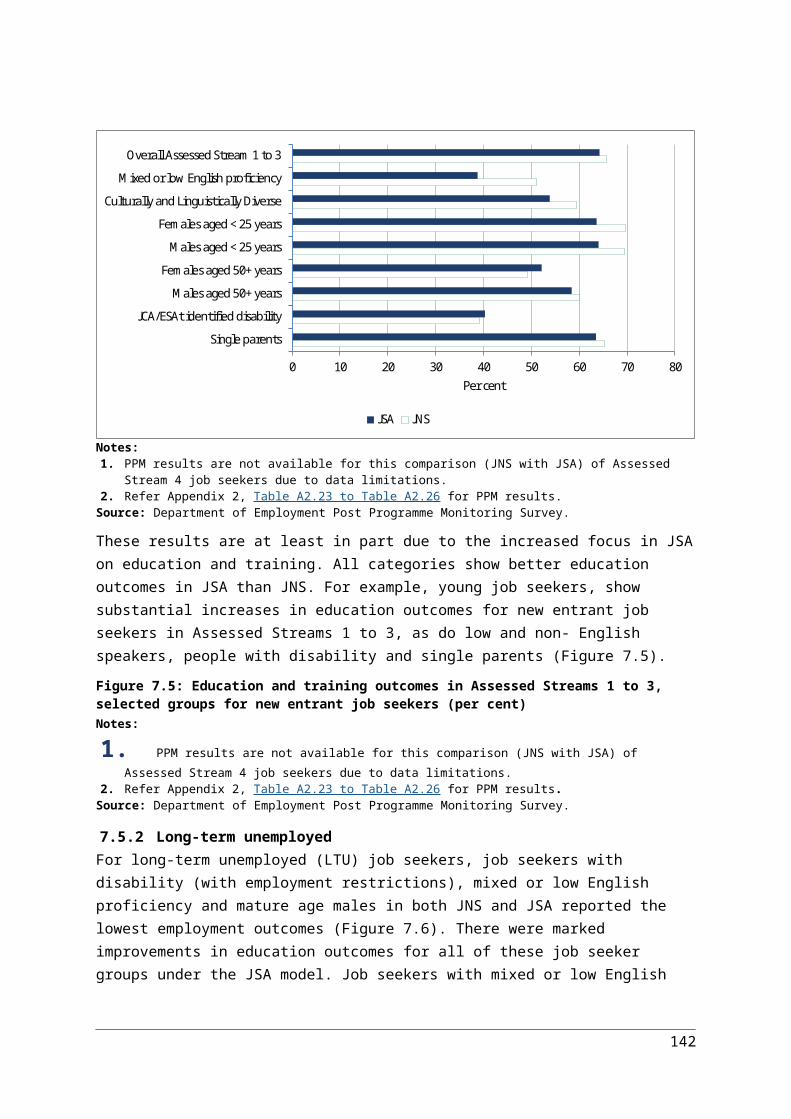
for financial/business benefit 10 per cent
because it enabled the employer to increase hours of employment 7 per cent
because it enabled the employer to employ a job seeker full-time 7 per cent
because it enabled the employer to employ other staff as well 4 per cent.
These employers said that the wage subsidy moneys were primarily used:
to supplement the employee’s wages/hours of work 50 per cent
for general funds and were not used for anything specific 28 per cent
to pay for training for the employee 25 per cent.
Around 96 per cent of employers who had received a wage subsidy reported they would consider them again. Of those employers who refused an applicant with a wage subsidy, the most common reasons were:
the job seeker did not have the right motivation / work ethic 37 per cent
the job seeker did not have the right skills 32 per cent
the employer could not guarantee a minimum number of hours / ongoing work 19 per cent.373
The fact that these employers refused a wage subsidy for these reasons may indicate two factors at play. Firstly, providers were dealing with a more disadvantaged client base than the labour market in general, therefore the pool of appropriately skilled candidates they can choose from is smaller. Secondly, selection practices may lead the provider to give a less than suitable client the benefit of the doubt, leading them to put forward candidates that may have some, but not all, the skills the employer requires.
During the period 1 October 2009 to 31 October 2011, the majority of wage subsidies were provided to job seekers within their first six months of service (which indicates they were being used to prevent people from becoming very long-term unemployed rather than assisting those who were already very long-term unemployed).374
Outcomes for wage subsidiesWage subsidies under JSA stream services were effective in that they led to sustained outcomes and were associated with better 12-month off-income support outcomes and reduced reliance on income support. After controlling for measurable job seeker characteristics, the odds of a job seeker being off income support 12 months after their initial job placement were 14 per cent higher for job seekers who had received a wage subsidy.375 It should be noted that this difference in outcomes in part reflects differences in the types of jobs that attracted wage subsidies and those that did not.
Provider use of wage subsidiesProviders considered wage subsidies to be highly effective in getting job seekers placed with employers. In the 2012 Survey of Employment Service Providers , 60 per cent of JSA providers 373 DEEWR, 2012. Survey of Employers.374 DEEWR, 2012. Employment Pathway Fund, Ch 2: Wage subsidies, Canberra375 DEEWR, 2012. Employment Pathway Fund, Ch 2: Wage subsidies, Canberra.
146
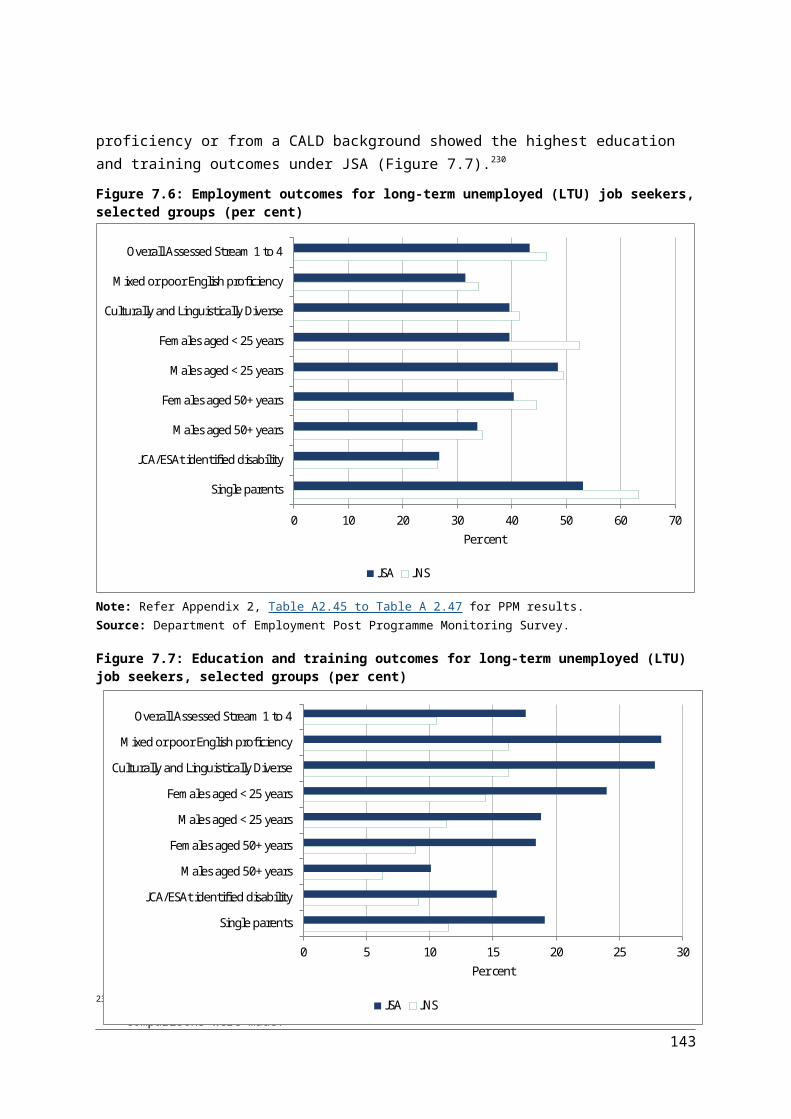
reported that they ‘usually’ or ‘always’ used wage subsidies until a person was established in a job, while almost three-quarters (70 per cent) thought that wage subsidies were ‘important’ or ‘very important’ in encouraging employers to provide sustainable jobs for job seekers.376
The following comments, from qualitative research interviews with providers, also highlight this: 377
We offer an incentive of $150 to employers to hire someone for two days for work experience. Wage subsidies are like gold. A company … will employ these job seekers 30 hours part-time instead of just giving them casual hours. If the employer asks me about the wage subsidies then I tell them that a wage subsidy is not what they need because the worker that they have will not be right for them. I do not sell the idea of a wage subsidy I give it to the employer as a closing argument when they have decided on the right worker for them.
JSA provider, regional NSW
Using the wage subsidy would be the most valuable to us … Especially with our parents or our restricted work capacity clients, we’re sort of selling this to an employer … we’re trying to tell them, we’re going to assist you financially with the wage subsidy.
Case manager, metropolitan NSW
Employment service provider CEOs indicated that wage subsidies had some limitations including limited impact in large organisations, possible exploitation of subsidies by employers and increased expectations among employers for wage subsidies:
Employers will call and ask about wage subsidies. It’s been taken to the extreme. It reduces the sustainability of employment. Some people will be employed for 26 weeks, then the employer gets the incentive and they’re terminated.
JSA provider, regional/rural area
Effectiveness of wage subsidiesMeasurement of the effectiveness of wage subsidies should consider the following effects:
• Additionality: whether provision of wage subsidies created ‘new’ jobs by encouraging employers to fill vacancies that would otherwise not be filled.
• Substitution: whether wage subsidies encouraged employers to employ a job seeker in the target group (such as VLTU job seekers or job seekers with disability) instead of a job seeker who was not in the target group.
• Deadweight: whether wage subsidies were paid for jobs which would have been achieved anyway.
Table 9.3 summarises the results of the Employer Incentives Survey 2011. This survey was designed to estimate the effectiveness of, and assess employer attitudes to, the JSA wage subsidy programme using responses about recently filled jobs.
The majority of employers surveyed (81 per cent) indicated that they intended to provide a permanent job when the job seeker was hired and 85 per cent said that they would consider using a wage subsidy again if they had a vacancy in the future. Employers reported that:
376 DEEWR, 2012. Survey of Employers.377 DEEWR, 2010. Departmental qualitative research round – See Section 1.2.3 for a description of this research.
147

• Approximately one-quarter of JSA wage subsidy job seekers got a job they would not have, if not for the wage subsidy. Some of these job seekers got jobs which would not have been offered at all (additional jobs) and others got jobs which other job seekers may have got if a wage subsidy had not been offered (substitution jobs).
• Around 44 per cent of JSA wage subsidy placements, while provided to job seekers who would have been placed anyway, were used to provide either the job seekers with better conditions or the business with secondary benefits.378
Table 9.3: Effectiveness of JSA wage subsidy job placements, Caseload population (per cent)Effectiveness Per cent
Total additional jobs 10.6
Total substitution jobs 12.9
Pure deadweight 31.9
Other benefits 44.7Notes: 1. The additional and substitution jobs categories included jobs where the wage subsidy was also used to provide other
benefits. 2. The deadweight category does not include jobs where other benefits were provided by the wage subsidy. 3. The other benefits category represents jobs which would have been filled regardless, but where the wage subsidy
was used to provide other benefits to either the job seeker or the business.Source: Department of Employment Employer Incentives Survey 2011.
9.4.5 Reverse marketingReverse marketing could be funded through the EPF in order to encourage JSA providers to pro-actively market job seekers to potential employers where vacancies have not been advertised. Reverse marketing provides a mechanism to stimulate demand for labour by pre-empting employers’ labour needs before they create a vacancy. Effective reverse marketing can play an important role in the wider employment services framework by providing job ready job seekers with access to vacancies that may not necessarily be created otherwise.
Provider use of reverse marketingProvider organisation CEOs indicated that reverse marketing was an essential tool in employer servicing and that it was most effective when targeted to employer needs and when the limitations of job seekers were disclosed.379
Reverse marketing was similar to the general servicing that JSA providers were contractually obliged to deliver, but with some key differences. These differences are sometimes difficult to distinguish and could be open to interpretation and possible inappropriate practical application.
Surveys suggest that, whereas reverse marketing was standard and regular practice for less than half of providers in 2008 (43 per cent), this increased to around two-thirds of providers under JSA (63 per cent in 2010, and up to 70 per cent in 2011 and 2012.
Provider services (which include but are not limited to reverse marketing) accounted for around $127 million, or 11.2 per cent, of EPF expenditure between 1 July 2009 and 30 June 2012.380 378 DEEWR, 2012. Employment Pathway Fund, Ch 2: Wage subsidies, March, DEEWR, Canberra.379 DEEWR, 2011. Survey of Employment Service Providers.380 Department of Employment administrative data.
148

As reported in Good Practice in Job Services Australia, high-performing sites used a higher proportion of their EPF transactions on reverse marketing than other sites (18.5 per cent for high-performing sites compared with 15.3 per cent of mid-performing sites and 12.3 per cent for low-performing sites). High-performing sites engaged in reverse marketing more often than low-performing sites and included wage subsidies in their reverse marketing strategies.381 382
Although reverse marketing was used by most service providers, sites tended to differ in how they used it. Staff at high-performing sites said they used it as part of their overall relationship-building with employers. This enabled them to make effective use of their knowledge of the employer, industry, local labour market and other external factors. Many reportedly focused on finding the job seeker suitable employment rather than ‘overselling’ the job seeker into unsuitable positions. Some sites dedicated a set time each week for employment consultants to reverse market, while others had specialist staff dedicated to it as part of a broader employer engagement strategy.383
Outcomes from reverse marketingJob seekers who were reverse marketed had higher rates of job referral and placement than job seekers who were not, and this result holds true when job seeker characteristics are taken into account. There were however slightly lower conversion rates from job referral to job placement for those who had been reverse marketed compared with job seekers who had not. This suggests that targeting of reverse marketing could be improved. The general increase in reverse marketing, if not properly targeted, could result in a decrease in efficiency and dilute the value of the intervention.
Overuse of reverse marketing had the potential to make employers feel their needs were secondary to job seekers and result in ‘contact fatigue’. 384
9.4.6 Post-placement supportPost-placement support is designed to assist job seekers in their transition into employment. This is where providers work with job seekers and employers to address any issues. Under the JSA model, post-placement support can be funded through the EPF.
Use of post-placement supportAround 20 per cent of job seekers reported receiving assistance from their JSA provider after a job placement. The majority of these job seekers (79 per cent) indicated that the assistance they received improved their chance of keeping their job. 385 This highlights the importance of post-placement support in helping to sustain employment and reinforces findings from other internal research that this is an area where service delivery could be improved, in particular for disadvantaged job seekers.
Qualitative research suggests that where a good relationship with an employer is established, employers will contact providers for assistance if there are problems before taking action to
381 DEEWR, 2012. Good practice in Job Services Australia, Canberra.382 High-performing sites were identified using Star Rating and participant experience measures which were combined
into a 25 level rating, with the Star Ratings component weighted at 10 times the participant experience measure. The combined performance rating was then divided into low, medium and high performing sites. See Section 10.3 for further discussion of Star Ratings.
383 DEEWR, 2012. Good practice in Job Services Australia, Canberra.384 DEEWR, 2012. Employment Pathway Fund, Ch 3: Reverse marketing, Canberra.385 DEEWR, 2008-2009,. Employment Assistance Survey.
149

terminate a job placement.386 This gives providers a chance to resolve any issues and ensure that employment is sustained for job seekers.
The Business Council of Australia noted that:
Employers do not always have experience in working with disadvantaged job seekers. For this reason, employers would value more assistance from JSA providers, such as the type of post-recruitment support (for example, mentoring) and physical and technological adjustments to the work environment (for people with disability) that may be required to achieve a successful placement.387
RisksIt is also important for providers to understand job seeker and employer perspectives on post-placement support. When post-placement contact is focused solely on substantiating outcomes, it can be an excessive burden on both job seeker and employer. In extreme cases, job seekers have reported losing their job because their employer tired of repeated contact from the provider.388
Contact fatigue has also been reported by employers.389
This highlights the importance of striking a balance between the preferences of job seekers and employers, and providers’ need to substantiate outcomes. Ensuring that post-placement contacts are appropriate and sensitive is vital to safeguarding job placements and encouraging repeat business from employers.390
Post-placement support strategiesAlmost half of providers (47 per cent) reported that they always or usually provide on-the-job training as part of post-placement support.391 Over half of providers (55 per cent) reported that they always provided intensive support in the early weeks after a placement and half (50 per cent) always provided ongoing support in the workplace, while two-thirds (66 per cent) reported that they seldom coach and support the person’s supervisor (see Figure 9.4).
When asked how important these strategies were, the following proportions of providers rated them as either ‘important’ or ‘very important’:
intensive support in the early weeks after placement 91 per cent
ongoing support in the workplace 86 per cent
pre-placement training for the participant 72 per cent
coaching and supporting the person’s supervisor 56 per cent.
There is an obvious disparity between the recognised importance of most of these strategies and the extent to which they are being used.
Figure 9.4: Strategies JSA providers reported using to sustain employment (per cent)
386 DEEWR, 2010. Departmental qualitative research round – See Section 1.2.3 for a description of this research.387 Business Council of Australia, 2013. Submission to the DEEWR regarding the Employment services: building on
success issues paper.388 DEEWR, 2010. Departmental qualitative research round – See Section 1.2.3 for a description of this research.389 DEEWR, 2010. Departmental qualitative research round – See Section 1.2.3 for a description of this research390 DEEWR, 2012. Good practice in Job Services Australia, Canberra.391 DEEWR, 2012.Survey of Employment Service Providers.
150

0% 20% 40% 60% 80% 100%
Coaching and supporting the person's supervisor
Ongoing support in the workplace
Intensive support in the early weeks after placement
Pre-placement training for the participant
Proportion of providers
Always Usually Seldom
Note: Refer Appendix 2, Table A2.78.Source: Department of Employment 2012 Survey of Employment Service Providers.
Good Practice in Job Services Australia found that high-performing provider sites were more likely than mid and low-performing sites to392:
provide effective support for job seekers by providing support that was tailored to the job seeker both before and after they started employment
provide good support for employers who have employed a job seeker by clearly explaining what support is available, ensuring contacts with employers are sensitively handled and appropriate, and monitoring the placement for problems.393
Providers commonly reported that frequent and purposeful contact with the job seeker enabled them to identify emerging issues and address them before the job became at risk. Providers also said that, for many Stream 4 job seekers, a good relationship with the employer was a major factor in determining success.394
9.5 ConclusionSurveys indicate that employer satisfaction with providers was higher among users of JSA than JNS. Employers chose JSA providers because of an active approach by the provider or because they were local or had local knowledge. Knowledge of the Job Services Australia brand was lower than of Job Network. This may have been due to a combination of JNS having been in existence for longer and providers moving away from the generic JSA brand in favour of stronger use of their own organisation’s brand.
392 High-performing sites were identified using Star Rating and participant experience measures which were combined into a 25 level rating, with the Star Ratings component weighted at 10 times the participant experience measure. The combined performance rating was then divided into low, medium and high performing sites. See Section 10.3 for further discussion of Star Ratings.
393 DEEWR, 2012.Good practice in Job Services Australia, Canberra.394 Department of Employment 2013, Job Services Australia demonstration pilots, Better Practice Guide 6 – post-
placement support.
151

Employers overwhelmingly reported that their main recruitment priority was finding ‘the right person for the job’. Surveys indicated that candidates with relevant skills and experience combined with attitudes including a motivation to work and reliability are what employers look for in job seekers. However they also indicated that they often do not get this type of candidate from providers. High performing service providers were more likely to be proactive in their relationships with employers. These providers reported using a variety of ways to connect with employers to identify skills needs, such as networking and reverse marketing. The providers’ ability to appropriately screen and recommend job seekers with the traits that employers wanted was key to successful job placement.
Employer attitudes to job seekers from disadvantaged groups varied, but overall, most employers were prepared to employ these job seekers. There were however strong concerns regarding suitability, reliability or capability of some job seeker groups – especially Indigenous job seekers, youth, the VLTU and job seekers with disability. This suggests that government-funded employment services have a large role to play in facilitating the employment of job seekers from these groups.
The strategies providers used to service employers included: reverse marketing, post-placement support and use of wage subsidies.
The majority of providers considered wage subsidies highly effective in placing job seekers with employers. Wage subsidies were found to be effective in leading to sustained outcomes, with job seekers attached to a wage subsidy more likely to be off income support 12 months after placement than other job seekers, after other job seeker characteristics have been taken into account. Around two-thirds of employers stated that the wage subsidy produced some primary or secondary benefit (such as the ability to employ others or retain existing staff, and increase staff hours). However, there were risks of high deadweight costs if wage subsidies were not targeted appropriately.
Provider organisation CEOs indicated that reverse marketing was essential to employer servicing and was most effective when targeted to employer needs and used for job seekers ready to work.
Wage subsidies and reverse marketing should only be used for job ready job seekers, otherwise the provider risked damaging the relationship with the employer and could end up steering the employer away from government-funded employment services.
High performing JSA providers were more likely to provide support to employers after placing a job seeker which, according to some job seekers, helped sustain their jobs. There was some indication that in addition to post-placement support for job seekers there should be more support provided to employers. There was also evidence of contact fatigue from some employers and job seekers, indicating that any post-placement contact is best carried out sensitively.
152

10 Job Services Australia providers
10.1 IntroductionThe Job Services Australia (JSA) service delivery model replaced seven contracts (Job Network and its complementary programmes) with one and introduced an Employment Services Charter of Contract Management (the Charter). These changes were in part made to drive efficiencies, cut waste, and introduce flexibility. JSA was designed to enable providers to focus more on job seekers than administration.395 To achieve mutual goals and outcomes in the delivery of employment services, it is considered vitally important that government departments and providers work cooperatively.
10.2 OverviewAt the start of the first JSA contract period, there were 141 contracted provider organisations. Three-quarters (77 per cent) were not for profit organisations with the remainder (23 per cent) being for profit organisations. The providers operated from more than 2000 sites. The distribution of JSA service sites within Labour Market Regions as at 31 March 2011 is shown in Table 10.1.
Table 10.1: JSA service sites by Labour Market Regions (as at 31 March 2011) (number and per cent)
Labour Market Region JSA site (number)
Proportion (per cent)
Adelaide 86 4.0
Brisbane 192 8.9
Central and Northern Queensland 203 9.4
Eastern Victoria 90 4.2
Greater Western Australia 135 6.3
Hunter 107 5.0
Melbourne 189 8.8
Northern New South Wales 116 5.4
Northern Territory 122 5.7
Perth 68 3.2
South Australia Country 83 3.8
Southern New South Wales 140 6.5
Southern Queensland 70 3.2
Sydney 172 8.0
Tasmania 85 3.9
Western New South Wales 140 6.5
Western Victoria 158 7.3
Total 2,156 100.0
Source: Department of Employment administrative data.
395 DEEWR, 2008. The future of employment services in Australia, fact sheet, p3 Canberra.
153
The total number of providers varied slightly throughout the first contract period. As a result of a midterm review and subsequent business reallocation process, four contracted organisations ceased to deliver JSA services.396 There were also a number of providers who relinquished their contracts prior to the midterm review.
Providers were contracted to deliver generalist, specialist or both types of services. Specialist services included services to the homeless, youth, people with disabilities, Indigenous job seekers, people from Culturally and Linguistically Diverse (CALD) background, and ex-offenders.
The proportions of sites providing generalist vs specialist services by provider status (for profit or not for profit) as at January 2014, are presented at Table 10.2.
Table 10.2: Proportion of sites providing generalist versus specialist services by JSA provider for profit or not for profit status Jan 2014(per cent)
Provider type Not for profit For profit Total
Generalist 45.4 33.5 78.9
Specialist 13.4 7.7 21.1
Total 58.8 41.2 100.0Source: Department of Employment administrative data.
10.3 Provider performance JSA provider performance as measured by Star Ratings was continuously and systematically monitored from its implementation. Star Ratings use regression analysis to compare service effectiveness and efficiency of providers across Australia.
Specialist providersAverage Star Ratings for specialist and generalist providers from June 2010 to September 2013 are shown in Figure 10.1. Most noticeable is the extent to which the average Star Rating improved for specialist providers. At June 2010, specialist providers averaged 0.6 Stars lower than generalist providers but by September 2012 specialist providers had achieve similar Star Ratings and then edged slightly ahead of the generalists. The average Star Rating remained largely unchanged for generalist providers.
396 In accordance with the Employment Services Deed, 2009-2012, the department undertook a formal performance assessment of JSA providers mid-way through the contract term.
154

Figure 10.1: Average Star Ratings for all generalist and specialist providers over JSA operation period
2.0
2.2
2.4
2.6
2.8
3.0
3.2
3.4
Jun 10 Dec 10 Jun 11 Dec 11 Jun 12 Dec 12 Jun 13
Star
ratin
g
Generalist Specialist
Note: Refer Appendix 2, Table A2.79.Source: Department of Employment contract level Star Ratings.
The significantly lower Star Ratings and subsequently reduced number of contracts during the first JSA contract period indicate that specialist providers appear to have had more difficulty adapting to the JSA service model. The midterm business review and reallocation, and the 2012 tender processes contributed significantly to improving Star Ratings by removing under-performing contracts. Specialist providers also made significant improvements in their performance in the lead-up and into 2013.
They also performed better over the life of the contract on measures of quality Key Performance Indicator 3 (KPI3). There is also evidence from Australia that specialisation in employment service provides value. The evaluation of Job Network 2003 to 2006 found notable differences between specialist and generalist providers.397 Client experience surveys indicated that clients of specialist providers experienced longer interviews with their case managers and rated their providers significantly higher on ‘Job Network helped overcome barriers’.
The Productivity Commission’s Independent Review of the Job Network recommended that ‘there should be no constraints on the capacity of Job Network providers to specialise – so that they can cater for any mixture of job seekers.’ 398
The benefit of specialisation for some groups of job seekers was also found in the evaluation of Disability Employment Services 2010-2013.399
397 DEEWR, 2007. Active Participation Model Evaluation July 2003-June 2006, Canberra398 Productivity Commission, 2002. Independent Review of Job Network. Inquiry Report, Report No. 21.399 DEEWR, Reissue March 2012. The Evaluation of Disability Employment Services Interim Report, Canberra.
155

The Organisation for Economic Cooperation and Development (OECD) also noted that specialist providers, providers in remote sites and some low socio-economic metropolitan areas had low Star Ratings on average during the first contract period. They suggested that research should investigate why the Star Rating regression over-predicted expected outcomes for certain disadvantaged groups.400 This over-prediction could be linked to the overall identification of disadvantage and the fact that more work may be required to properly identify disadvantage and quantify its impact (see Section 7.4).
The departments’ evaluation, however, found that specialist providers were better than generalist providers at achieving outcomes for their target cohort. This being the case appropriate assessment and allocation of job seekers to these providers would be key to their overall performance.
10.4 Performance frameworkThe JSA Performance Management Framework was designed to ensure quality, effective and efficient services were delivered to job seekers, help inform employer and job seeker choice of provider and provide timely and accurate feedback to providers on their performance.
The main elements of the Performance Framework included:
• Key Performance Indicators (KPIs) that assessed the efficiency, effectiveness and quality of provider service
• performance ratings that reflected a provider’s performance compared to the average performance
• six-monthly performance feedback
• a mid-contract performance-based business reallocation.
10.4.1 Measurement of performanceIn the first JSA contract Star Ratings were used to assess provider performance against efficiency and effectiveness KPIs. Each provider’s performance was measured relative to other providers, taking into account differences in caseload and labour market characteristics using regression analysis.
Relative performance was calculated using a range of performance measures which were weighted to reflect the government’s priorities. Star Ratings were determined on the basis of a provider’s performance compared to the average of all providers, referred to as the ‘Star Percentages’ Providers receive Star Ratings and Star Percentages for each of the four streams and for JSA overall for each Employment Service Area (ESA) and Site.
Each individual performance measure was weighted to calculate a stream level rating. Sustained outcomes were emphasised with the highest weightings allocated to 13- and 26-week outcome performance measures. The streams were also weighted to produce a provider’s overall ESA or Site Star Rating, with higher weightings for streams with higher levels of disadvantage.
The Star Ratings did not rate the quality of a provider’s services. However, KPI 3 (Quality) was a key consideration in business reallocation decisions and for giving clear and timely feedback to providers about the quality of their services. Star Ratings were continued, with some changes in the second contract as a robust way of measuring provider performance.400 OECD, 2012. Activating Jobseekers: How Australia Does It, OECD Publishing.
156

10.4.2 Charter of Contract Management The Employment Services Charter of Contract Management set out the department’s commitment to working collaboratively with employment service providers to build a strong and vibrant employment services sector which continuously improves and builds on good practice to achieve outcomes for unemployed Australians.
This principles-based Charter set out the standards and conduct that providers could expect from the department in overseeing and administering the delivery of employment services.
10.4.3 Provider brokered outcomesThe JSA model initially differentiated between two types of outcomes:
• Provider brokered outcomes – these outcomes attracted higher outcome fees, and were paid where the provider had engaged directly with an employer to identify an appropriate vacancy or assignment, obtained the employer’s consent to lodge the vacancy on the department’s IT system on the employers behalf, and then screened, matched, referred and placed a job seeker in to the vacancy. There were similar brokered outcomes for education or training related activities.
• Provider assisted outcomes – these outcomes attracted lower outcome fees and were paid in instances where there was no pre-existing relationship between the provider and the employer when the job seeker was selected for the job. That is, the provider was not directly involved in sourcing the vacancy.
The two-tiered outcome rate model was seen as a means of incentivising higher levels of employer servicing. An independent inquiry of provider brokered outcomes was commissioned in 2012.401 The initial audit of 14 JSA organisations found weaknesses in the administrative standards of some providers. Following a final audit in the same year, changes were made to the two-tiered payment structure for 13- and 26-week employment outcomes.402 The two-tiered system was not carried into the 2012 – 2015 JSA model.
10.5 Provider satisfaction
10.5.1 Satisfaction with the Department of Education, Employment and Workplace RelationsJSA had an increased focus on partnership and collaboration between the Department of Education, Employment and Workplace Relations (DEEWR)403 and employment services providers compared with its predecessor Job Network Services (JNS).404 The Employment Service Deed and the Charter documented the standards and conduct that providers could expect from DEEWR (the department) in administering the delivery of employment services.
Provider satisfaction with contracted information and support was measured in an annual Survey of Employment Service Providers. The departmental target for service provider satisfaction during the JSA 09-12 period was set in the Federal Budget and published in the department’s Portfolio Budget 401 Butterworth, R, 2012. Provider brokered outcomes audit: First stage report, Canberra.402 DEEWR, 2012. Job Services Australia provider brokered outcomes, Canberra.403 Now the Department of Employment and the Department of Education.404 The term Job Network Services (JNS) is used when referring to Job Network and the relevant complementary
services which JSA replaced.
157
Statements.405 For the period of the JSA 09-12 contract, the department reported its achievement against this measure in its annual reports. The target (usually 80 per cent) related to the level of overall provider satisfaction – that is, for JSA and Disability Employment Services (DES) providers combined. This target was exceeded each year.406 This indicates JSA providers had a high level of satisfaction with the department.
The main reasons given by providers who were dissatisfied with the department’s service were ‘lack of quality/consistency of advice or information service’ and ‘lack of understanding/flexibility around individual circumstances’.407
10.5.2 Satisfaction with the Department of Human Services
CentrelinkThe success of the JSA contract and the efficient and effective delivery of employment services in the first contract period also relied on a good, effective working relationship between Centrelink and employment service providers. Centrelink was the main entry point for job seekers into JSA. Key activities that Centrelink performed for job seekers that affected provider business processes included:
• referring job seekers to employment service providers while processing their income support claims
• conducting Job Seeker Classification Instrument (JSCI) assessments for streaming
• working with providers to monitor activity test or participation requirements
• applying job seeker compliance measures.
Survey data from 2010 showed that 75 per cent of JSA providers that reported having had contact with Centrelink in the previous six months reported being satisfied with the quality of services provided to their organisation. In 2011 the satisfaction levels decreased to 58 per cent. In 2012, JSA provider satisfaction with Centrelink’s service quality had improved but not to the levels reported in 2010. Sixty-four per cent of providers reported being satisfied with the services they received in 2012.408,409
405 The measure is ‘Level of satisfaction of service providers with contracted information and support services’.406 DEEWR, 2010, 2011, 2012. Annual Reports, 2009-10, 2010-11, 2011-12.407 DEEWR, 2012. Survey of Employment Service Providers.408 While there were changes made to the survey question and response scale over this period, subsequent analysis has
shown that the differences recorded in provider satisfaction were not affected by these changes.409 DEEWR, 2010, 2011 and 2012. Surveys of Employment Service Providers.
158

The main reasons given by the 36 per cent of JSA providers who were dissatisfied with the overall level of service provided by Centrelink were:
Centrelink staff lacking knowledge or understanding of issues 43 per cent
incorrect, inconsistent or contradictory information provided 41 per cent
poor staff attitude 18 per cent
Centrelink too lenient on compliance 14 per cent
response time poor or calls not returned 14 per cent
Centrelink sending inappropriate referrals 14 per cent.410
In 2012, 82 per cent of all surveyed JSA providers stated that they found Centrelink staff they dealt with at Customer Service Centres were courteous and friendly, 41 per cent felt that those Centrelink staff knew about the employment services market, 30 per cent felt that they understood the providers business needs and 45 per cent felt that they acted quickly to meet the provider’s business needs.411
Recommendations made by the National Employment Services Association (NESA) in its submission to the review of employment services beyond 2015 touched on some of these issues. Two of the recommendations were to:
• Improve opportunities for person to person communication between DHS and employment service frontline workforces and specialist service areas such as social work
• Improve mutual understanding of respective roles and responsibilities of DHS and employment services through joint training and development initiatives412
The lower level of provider satisfaction with Centrelink services compared with the level of satisfaction reported for the department/provider relationship demonstrates a gap between Centrelink service delivery and JSA provider expectations. To some extent this was addressed through the introduction of joint servicing initiatives such as Connection Interviews which were expanded under the Building Australia’s Future Workforce (BAFW) package. Under this initiative, selected at risk disadvantaged job seekers undertook joint interviews in Centrelink offices with the provider and the Centrelink officer. Early qualitative evidence from internal research indicated that this improved communication between the two organisations and prompted a greater understanding of each other’s roles.413
Centrelink (DHS) Assessment ServicesAnother important aspect of the partnership between the department and Centrelink in the first contract was assessment services. Assessments conducted by Centrelink were used to identify job seekers’ vocational and non-vocational barriers to find and maintain employment, their work capacity and the most appropriate programmes of support. Referral to Stream 4 services was only possible through an Employment Services Assessment (ESAt).
410 DEEWR, 2012 Survey of Employment Service Providers.411 DEEWR, 2012. Survey of Employment Service Providers.412 NESA, 2013. Realising our potential – Response to ‘Employment Services – Building on Success, discussion paper.413 Department of Employment, 2013. Departmental qualitative research round – See Section 1.2.3 for a description of
this research.
159
Job Capacity Assessments (JCAs) were initially introduced in 2006 as part of the Welfare to Work reforms. From 1 July 2011 ESAts replaced JCAs.414 At the same time, the delivery of all assessment services was brought into Centrelink as the single provider.415 Previously, JCAs were conducted by 18 contracted providers that included Centrelink, the Commonwealth Rehabilitation Service Australia (CRS) and Health Services Australia Group (HSA), all of which were Human Services portfolio agencies.
Centrelink used qualified health and allied health professionals from a variety of disciplines to conduct ESAts and JCAs. In 2011–12 DHS Assessment Services had around 600 staff across a network of 312 sites.416 Professionals carrying out assessments included psychologists (54 per cent), social workers (12 per cent) and registered nurses (10 per cent).417 Assessors used available information about the job seeker, including current and past medical/disability status, and prior participation and employment history to assess work capacity and barriers to finding and maintaining employment. Assessors could also liaise with treating doctors and other relevant health professionals as required.
Surveys measuring the level of service provider satisfaction with DHS Assessment Services showed that:418
in 2011, 81 per cent of JSA providers reporting having had contact with a JCA provider in the previous six months were satisfied with the interaction
in 2012, 85 per cent of JSA providers reporting having had contact with DHS Assessment Services in the previous six months were satisfied with the level of service they received. Eighty-one per cent of providers agreed that DHS Assessment Services was responsive to their requests and 88 per cent agreed DHS Assessment Services was open to providing clarification when required.
This reported level of satisfaction was good but open to improvement.
10.6 Administrative burdenAs a consequence of combining seven JNS programmes (each requiring its own contract) into one JSA contract, there was a significant reduction in compliance requirements on providers at that time.419 As noted by Butterworth:420
JSA is a large and complex human services program, with over 6.5 million transactions recorded through the information technology system that connects DEEWR, employment services providers and the Department of Human Services every day.
The scale of JSA, the diversity of providers and the provision of flexible and individualised services means that the management of JSA needs to balance accountability while aiming to keep the administrative burden on providers as low as possible.
414 JCAs post 1 July 2011 are only used for Disability Support Pension (DSP) customers.415 Department of Human Services, 2011, untitled presentation.416 Department of Human Services, 2011, untitled presentation.417 Department of Human Services 2012, Annual report 2011–12, DHS, Canberra.418 DEEWR, 2010, 2011 and 2012. Surveys of Employment Service Providers.419 DEEWR, 2011 Advisory Panel on Employment Services Administration and Accountability Discussion paper, Canberra.420 Butterworth, R, 2012. Job Services Australia Provider Brokered Outcomes.
160

The administrative and compliance burden associated with employment service delivery affects providers, job seekers and government staff working in the programmes.
The high rate of staff turnover for employment service providers (over 30 per cent annually)421 was seen as indicative of several systemic problems. NESA has stated that the high level of administrative requirements was partially to blame. Many staff believed administrative tasks impeded their primary purpose of assisting clients.422 NESA estimated that 50 per cent of ‘client-facing staff time’ was spent doing administration.423
In 2011, the Australian Government convened an independent panel – the Advisory Panel on Employment Services Administration and Accountability (APESAA) – to identify potential improvements to the JSA and Disability Employment Services (DES) programmes, with a focus on ‘red tape’ reduction. This panel consulted extensively, issuing a discussion paper in November 2011 and presenting its final report in May 2012. While improvements recommended by the panel were to inform the 2015 contract period and beyond, submissions and findings were a useful source of evidence of administrative burden during the first JSA contract period.
Information about provider satisfaction with administrative burden was gathered in surveys of Employment Service Providers from 2010. The APESAA review noted that many providers maintain parallel data management systems. This is an additional administrative burden not required by the employment service delivery model.424 While the aim of the Employment Service Providers surveys was to analyse perceptions of the administrative load imposed by the department, respondents may have found it difficult to distinguish between the department's administration and that of their own provider organisations. Therefore the data quoted below may over-state the department’s administrative burden.
10.6.1 Comparison of administrative load between Job Network and Job Services AustraliaIn 2010, JSA providers with previous JNS experience were asked about their assessment of changes in administrative load between the two employment service delivery models. Providers were asked to compare the IT systems and three processes in providing job seeker services: 425
• The majority of providers (62 per cent) felt that the new information technology systems were an improvement on those used for JNS, 18 per cent disagreed with this and 20 per cent neither agreed nor disagreed.
• Views about the referral and assessment process changes were divided. Forty-two per cent agreed that the processes were more streamlined and less complex, 24 per cent neither agreed nor disagreed with this and 33 per cent disagreed.
• Sixty-two per cent of respondents indicated that there was more administration associated with Employment Pathway Plans (EPPs) than with previous activity agreements and intervention plans.
421 DEEWR, 2012 , Advisory Panel on Employment Services Administration and Accountability Final Report Feedback www.jobs.gov.au
422 DEEWR, 2012. Advisory Panel on Employment Services Administration and Accountability final report, Canberra.423 NESA, 2013. Realising our potential – Response to ‘Employment services – building on success’ discussion paper.424 DEEWR, 2012. Advisory Panel on Employment Services Administration and Accountability final report, Canberra.425 DEEWR, 2010. Survey of Employment Service Providers.
161

• Sixty-eight per cent believed that the new fee structure required more administration than under JNS.
The majority of JSA provider sites (79 per cent) believed that, overall, the administrative load had increased between JNS and JSA, while 16 per cent felt it had stayed the same and 5 per cent felt it had decreased.
10.6.2 Approach to administrative work Providers reported that the majority of their JSA contract administration (on average 83 per cent in 2012) was conducted onsite rather than centrally. Almost all providers (94 per cent in 2012) reported doing at least 50 per cent of their administration onsite.426
More than two-thirds of providers (71 per cent) estimated that staff spent more than half their time on administrative work.427 This figure is similar to the 50 per cent quoted by NESA and aligns with qualitative information gathered during fieldwork in 2010.428 429
10.6.3 Unnecessary departmental administrative requirementsFieldwork from 2010 suggested that most providers did not object to the administrative requirement in the contract overall, but were particularly frustrated by aspects of the data entry process. This issue was seen as separate to the requirement for comprehensive administration for the purposes of accountability.
Many sites visited in 2010 spoke about particular instances of overly time-consuming tasks, repetition and/or duplication of effort between the Centrelink and JSA systems as well as within the JSA system, and the burdensome requirement of both paper and electronic record-keeping.430
In 2012, one-third of providers surveyed felt that some of the departments administrative requirements did not serve a useful purpose or were more complex than they needed to be, 45 per cent did not have issue with any of these requirements and the remaining 22 per cent were unsure. Of the one-third of providers who did have concerns about the department’s administrative requirements, the main issues raised were:
too time-consuming 74 per cent duplication of information 64 per cent too complex, could be made simpler 56 per cent not streamlined enough 54 per cent
too much paperwork 49 per cent.
The Employment Services System (ESS) IT system was raised as an issue by one-fifth (19 per cent) of these providers (6 per cent of all providers surveyed). Findings from the 2010 fieldwork suggest that
426 DEEWR, 2012. Survey of Employment Service Providers.427 DEEWR, 2012. Survey of Employment Service Providers.428 NESA, 2012, Response to the Advisory Panel on Employment Services Administration and Accountability Final Report
and DEEWR Responses.429 DEEWR, 2010. Departmental qualitative research round – See Section 1.2.3 for a description of this research.430 DEEWR, 2010. Departmental qualitative research round – See Section 1.2.3 for a description of this research.
162

data entry and interface, as well as a perception of wasted effort account for much of these providers’ views that administrative requirements are overly burdensome.431
No significant relationship was found between the amount of onsite administration and views about unnecessary administrative requirements.
The APESAA review recommended that the department review all administrative requirements and process steps in the employment services model for redundant or poor design, including:432
• individual fields and questions in forms and IT systems
• requirements to retain or present documents and other evidence
• mandatory compliance steps and actions
• any other design features of the employment services model.
The panel also recommended that providers undertake the same exercise for their own ‘shadow systems’ to ensure that these do not unnecessarily cause duplication and red tape.
NESA suggested that providers use third-party products to address business needs not available from ESS. While they recognised that the use of third-party systems added administrative costs, they considered that the benefits outweighed this burden. They reported:
Feedback from members also acknowledges that often unnecessary administration is created by providers’ with documentary evidence requirements in many cases exceeded to ‘protect’ themselves. A key concern is a lack of confidence that evidence requirements will not change and/or be applied retrospectively as has occurred in the past.433
10.6.4 Red tape reductionA reduction in the number of contracts (from seven to one) led to a significant reduction in compliance requirements under JSA compared to JNS. The OECD notes, however, that while Australia does have a relatively strong central management of its employment services this is necessary as only central management can consistently implement Star Ratings and monitor the quality of service.434 The same report suggests some design changes which could reduce the volume of transactions and ‘red tape’, including:
• reducing the number of job seeker assessments undertaken
• replacing the acquittal nature of the Employment Pathway Fund (EPF) with ‘untied’ payments
• limiting the assessment of ‘quality’
• introducing provider accreditation, with accredited providers allowed to assess their own EPPs and manage their EPF without ongoing departmental auditing.
431 DEEWR, 2010. Departmental qualitative research round – See Section 1.2.3 for a description of this research.432 DEEWR, 2012. Advisory Panel on Employment Services Administration and Accountability final report, Canberra.433 NESA, 2012. Response to the Advisory Panel on Employment Services Administration and Accountability final report
and DEEWR responses.434 OECD, 2012. Activating Jobseekers: How Australia Does It, OECD Publishing.
163
The report also noted that there are trade-offs involved, with a risk that these suggested changes reduce the information available to the department and thereby its ability to monitor and improve the quality of service. Another risk is that such changes could facilitate ‘gaming’ of payments.
As administrative and compliance burdens impact providers, job seekers and government staff who work on programmes, it is important to achieve the appropriate level of reporting requirements. In response to provider concerns changes were made to the JSA contract for 2012 – 15 to reduce red tape. These included:
• providers were no longer required to retain paper copies of all of their records
• from 1 December 2013 the department would usually make changes to the contract guidelines only on a quarterly basis. Under previous arrangements the guidelines could be changed at any time
• Stream Services Reviews (SSR) were no longer contractual requirements for providers
• the timeframe for lodging certain claims was extended from 28 to 56 days.
10.7 Impact of the economic downturnConceived before the Global Financial Crisis (GFC), JSA responded well to the larger numbers of job seekers resulting from the downturn and their changing needs for assistance.435 As noted by the OECD:
In 2009, as soon as the JSA model entered operation, service fees and outcome fees for placing workers who had been made redundant were increased. The integrated outsourcing model allows a rapid response to a recession or perhaps another crisis, through fee changes and related incentives.436
Further discussion on job seeker profiles is in Chapter 7. Further discussion of the impact of the economic downturn on JSA is in Section 2.1 and The Impact of the Global Economic Downturn on Job Services Australia.437
10.8 ConclusionGood, cooperative working partnerships between employment service providers, the department, Centrelink and the DHS Assessment Services were crucial for the effective delivery of employment services.
Provider satisfaction with the department’s service delivery was high (above 95 per cent), which exceeded the 80 per cent target set by government for each year of the first JSA contract.
Provider satisfaction with Centrelink services was lower than that for the department’s services, with only 64 per cent of providers reporting satisfaction with Centrelink service delivery in 2012. The main issues raised by providers related to Centrelink staff knowledge and the accuracy of advice provided. NESA raised similar concerns, suggesting that improvements in person to person communication and the mutual understanding of respective roles were required.
435 DEEWR, 2011. The Impact of the Global Economic Downturn on Job Services Australia, July 2009 – January 2010.436 OECD, 2012. Activating Jobseekers: How Australia Does It, OECD Publishing. 437 DEEWR, 2011. The Impact of the Global Economic Downturn on Job Services Australia, July 2009 – January 2010.
164

Provider satisfaction with DHS Assessment Services was much higher (85 per cent of providers satisfied with this service in 2012). While the figure is high, there was still room for improvement in the provider satisfaction rating. This may mean either that DHS Assessment Services need to improve service delivery or that providers need to gain a better appreciation of the role and responsibilities of DHS Assessment Services.
Reduction of red tape was consistently noted as requiring attention. It was a key issue in the public submission process for consideration of employment services beyond 2015. When questioned, the majority of JSA providers stated that the overall administrative load had increased between JNS and JSA. One-third of providers felt some of the department’s administrative requirements did not serve a useful purpose or were more complex than necessary.
The APESAA review recommended the department review all administrative requirements and process steps in the employment services model and that providers undertake the same exercise for their own ‘shadow systems’. NESA suggested that providers use third-party products to address business needs not available from the ESS. While this would add to administration costs, they believed that the benefits would outweigh the added burden.
While there is a readiness by all parties to reduce administrative burden, a fine balance is needed so that changes will not compromise the department’s accountability for public funds, adversely impinge on service provider business processes or affect service delivery to job seekers.
165

ReferencesACT Government Education and Training Directorate, 2013. Better linkages, http://www.det.act.gov.au
Advisory Panel on Employment Services Administration and Accountability, November 2011. Discussion paper, Department of Education, Employment and Workplace Relations.
Advisory Panel on Employment Services Administration and Accountability, May 2012. Final report, Department of Education, Employment and Workplace Relations.
Australian Bureau of Statistics (ABS), October 2010. The Health and Welfare of Australia’s Aboriginal and Torres Strait Islander Peoples, Cat. No. 4704.0.
Australian Bureau of Statistics (ABS), November 2012. Labour Force, Australia, Cat. No. 6202.0.
Australian Bureau of Statistics (ABS), November 2013. Australian Social Trends, Cat. No. 4102.
Australian Bureau of Statistics (ABS), November 2013, 2011 Population Census, http://www.abs.gov.au/websitedbs/censushome.nsf/home/quickstats
Australian Bureau of Statistics (ABS), June 2014. Australian Aboriginal and Torres Strait Islander Health Survey: Updated Results, 2012–13, Cat. No. 4727.0.55.006.
Australian Chamber of Commerce and Industry (ACCI), March 2013. Employment services – building on success: ACCI response. <http://home.deewr.gov.au/submissions/BuildingonSuccess/index.htm>.
Australian Council of Social Services (ACOSS), March 2013. Partnerships for participation: Submission to Minister for Employment – Participation on reform of employment services (ACOSS Paper 200). <http://home.deewr.gov.au/submissions/BuildingonSuccess/index.htm>.
Australian Federation of Disability Organisations (AFDO), March 2013. Rewriting the story of disability from unemployment and poverty to employment and wages: AFDO submission to the discussion paper ‘Building on success’.< http://home.deewr.gov.au/submissions/BuildingonSuccess/index.htm>.
Australian Parliament 2008, Portfolio Budget Statements 2008–09: Budget Related Paper No. 1.5 – Education, Employment and Workplace Relations Portfolio.
Australian Parliament, May 2011. Budget 2011–12 – Building Australia’s Future Workforce: trained up and ready for work.<http://www.budget.gov.au/2011-12/content/glossy/skills/html/skills_overview_01.htm>.
Australian Parliament, 2012. Closing the Gap: Prime Minister’s report 2012.
Australian Parliament, July 2013. Jobs and sustainable communities for people in remote Australia.
Australian Parliament, 2013. Closing the Gap: Prime Minister’s report 2013.
Australian Social Inclusion Board (ASIB), 2009. National social inclusion measurement and reporting strategy.
Australian Social Inclusion Board (ASIB), 2012. Social inclusion in Australia: How Australia is faring (2nd edition).
166

Australian Youth Affairs Coalition (AYAC) March 2013, Employment services beyond 2015 submission.
<http://home.deewr.gov.au/submissions/BuildingonSuccess/index.htm > .
Buddelmeyer, H and Wooden M, May, 2008. Transitions from Casual Employment in Australia, Melbourne Institute Working Paper 7/08.
Business Council of Australia (BCA), March 2013. Submission to the Department of Education, Employment and Workplace Relations regarding the ‘Employment services: building on success’ issues paper. <http://home.deewr.gov.au/submissions/BuildingonSuccess/index.htm. > .
Butterworth, R 2012. Provider brokered outcomes audit: First stage report, Department of Education, Employment and Workplace Relations.
Connolly, G, and Tang, S 2011. Department of Education, Employment and Workplace Relations (DEEWR), Filling in the Gaps in the ABS Job Vacancies Series, Paper presented at ABS Labour Statistics Advisory Group Meeting, ABS House, Belconnen, ACT, 23 March 2011.
Council of Australian Governments (COAG) 2009, Council of Australian Governments fact sheet: National Partnership for Productivity Places Programme.
Council of Australian Governments (COAG), 2013, Skills and training, viewed 15 November <http://www.coag.gov.au/skills_and_training >.
Council of Australian Governments (COAG), 2013. Affordable Housing Agreement: Homelessness 2011–12 – Comparing performance across Australia: Report to the Council of Australian Governments.
Council of Australian Governments Reform Council, 2011. National Indigenous Reform Agreement: Performance report for 2009–10.
Davidson, P 2013, Is Job Services Australia made to measure for disadvantaged jobseekers? Centre for Public Policy, Employment Services for the Future Conference, University of Melbourne, viewed February. <: http://public-policy.unimelb.edu.au/sites/default/files/public/davidson-employment%20services%20conference13.pdf>.
Department of Education, Employment and Workplace Relations – see DEEWR
DEEWR 2007, Active participation model evaluation: July 2003 – June 2006. <www.employment.gov.au>.
DEEWR 2008, Request for Tender for Employment Services 2009 – 12.
DEEWR 2008, Labour market assistance outcomes year ending 30 June 2008. <www.employment.gov.au>
DEEWR, 2008. The future of employment services in Australia: a discussion paper.
DEEWR, 2008. The future of employment services in Australia: fact sheet.
DEEWR, 2009. Labour market assistance outcomes year ending 30 June 2009. www.employment.gov.au.
167
DEEWR, 2009. Evaluation Strategy for Job Services Australia 2009 – 2012. Available from: <http://www.employment.gov.au>
DEEWR, 2009. Indigenous Employment Program 2009–12: program guidelines.
DEEWR, 2009. Department of Education, Employment and Workplace Relations Employment Services Deed 2009 – 2012.
DEEWR, 2011. Request for tender for Job Services Australia 2012–2015.
DEEWR, 2011. Department of Education, Employment and Workplace Relations Annual Report 2009-10.
DEEWR, June 2011. The Impact of the Global Economic Downturn on Job Services Australia, July 2009 – January 2010.
DEEWR, 2011. Labour market assistance outcomes year ending 30 June 2011. <http://www.employment.gov.au>
DEEWR, 2011. Advisory Panel on Employment Services Administration and Accountability Discussion paper, November, DEEWR, Canberra
DEEWR, 2012. Advisory Panel on Employment Services Administration and Accountability final report, May, DEEWR, Canberra
DEEWR, 2012. Advisory Panel on Employment Services Administration and Accountability final report, Feedback http://www.jobs.gov.au
DEEWR, 2012. Labour market assistance outcomes year ending 30 June 2012. <http://www.employment.gov.au>
DEEWR, 2012. Department of Education, Employment and Workplace Relations Annual Report 2010-11.
DEEWR, January 2012. Servicing Indigenous Job Seekers in Job Services Australia. <http://www.employment.gov.au>
DEEWR, March 2012. The Evaluation of Disability Employment Services Interim Report Reissue March 2012
DEEWR, March 2012. Employment Pathway Fund – Introduction. <http://www.employment.gov.au>
DEEWR, March 2012. Employment Pathway Fund – Wage subsidies. <http://www.employment.gov.au>
DEEWR, March 2012. Employment Pathway Fund – Reverse marketing. <http://www.employment.gov.au>
DEEWR, March 2012. Good Practice in Job Services Australia. <http://www.employment.gov.au>
DEEWR, September 2012. Job Services Australia provider brokered outcomes.
DEEWR, 2013, Department of Education, Employment and Workplace Relations Annual Report 2011-12.
168

DEEWR October 2013, Innovation Fund and Job Services Australia demonstration pilots. Available from: <http://www.employment.gov.au >
DEEWR 2013, Department of Education, Employment and Workplace Relations Annual Report 2012–13.
DEEWR 2013, Job Services Australia demonstration pilots: Better Practice Guide 1 – Assessment.
DEEWR 2013, Job Services Australia demonstration pilots: Better Practice Guide 2 – Case planning.
Department of Education 2013, Compact with young Australians. <http://education.gov.au/compact-young-australians >
Department of Employment 2012, Labour market assistance outcomes September 2012.
Department of Employment, Education and Workplace Relations (2012), Employment Services – Building on Success Issues Paper <http://www.employment.gov.au >
Department of Employment 2013, JSA Effectiveness: Long-term Unemployed Job Seekers (unpublished).
Department of Employment 2013, Indigenous Opportunities Policy guidelines. : <http://www.employment.gov.au >
Department of Employment 2013, Job Services Australia demonstration pilots: Better Practice Guide 6 – Post-placement support. <http://www.employment.gov.au >
Department of Employment October 2013, New Enterprise Incentive Scheme (NEIS). Available from: http://www.employment.gov.au/new-enterprise-incentive-scheme-neis.
Department of Employment 2013, Employment services beyond 2015. Accessed 19 December 2013, <http://www.employment.gov.au>.
Department of Employment 2016, The effectiveness of wage subsidies in Australian Government Services.
Department of Employment and Workplace Relations (DEWR) and NFO Donovan Research 2001, Employer survey papers Topic 2: Employer endorsement of Job Network.
Department of Employment and Workplace Relations (DEWR) and NFO Donovan Research 2001, Employer endorsement of Job Network, Employer survey papers, Topic 2, DEWR, Canberra
Department of Families, Housing, Community Services and Indigenous Affairs (FaHCSIA) 2010, Closing the Gap – Prime Minister’s report.
Department of Finance 2009, Strategic Review of the Job Capacity Assessment Program, <http://www.finance.gov.au >
Department of Human Services (DHS) 2012, Annual Report 2011–12.
Department of Human Services (DHS), untitled presentation. Accessed 25 November 2013. <www.nds.org.au>
169

Department of Human Services (DHS), Centrelink, Information you need to know about your claim for Newstart Allowance / Widow Allowance. Accessed 28 January 2014<http://www.humanservices.gov.au>)
Department of Human Services Flexible Arrangements for Parents and Carers brochure <http://www.humanservices.gov.au >
Department of Infrastructure and Regional Development, Regional Fund guidelines. <http://www.regional.gov.au>
Department of the Prime Minister and Cabinet (PM&C) November 2013, Indigenous Affairs webpage. <http://www.dpmc.gov.au>
Department of Social Services 2013, CDEP Program webpage <http://www.dss.gov.au>
Disney, J, Buduls, A and Grant, P 2010, Impacts of the new Job Seeker Compliance Framework: the report of the independent review.
Dreamtime Public Relations March 2013, untitled submission in response to DEEWR issues paper Employment services – building on success. <http://wwe.deewr.gov.au>
Fowkes, L October 2011, Long-term unemployment in Australia, Australian Policy Online. <http://apo.org.au>.
Generation One 2011, Walk in my shoes: a research report prepared by Auspoll.
Gray, M, Hunter, B and Howlett, M 2013, Indigenous employment: a story of continuing growth, CAEPR Topical Issue No. 2/2013, Centre for Aboriginal Economic Policy Research.
Hsiao, C., Y. Shen, B. Wang and G Weeks (2008). Evaluating the Impacts of Washington State Repeated Job Search Services on the Earnings of Prime-Age Female TANF Recipients. Journal of Applied Econometrics, 22, 453-475.
International Labour Organization (ILO) 2008, Conclusions on skills for improved productivity, employment growth and development, International Labour Conference, Geneva.
Kalwum Development Corporation Limited Health Service Division March 2013, Submission to the employment services – issues paper. <http://www.deewr.gov.au>.
Mayer, G, & Levine, L. (2010). Long-Term Unemployment and Recession. Congressional Research Service. Downloaded from <<http://www.crs.gov>.
McLachlan, R, Gilfillan, G and Gordon, J 2013, Deep and persistent disadvantage in Australia, rev. Productivity Commission staff working paper.
Melbourne Institute of Applied Economic and Social Research 2013, A statistical report on waves 1 to 10 of the Household, Income and Labour Dynamics in Australia Survey.
National Council on Intellectual Disability (NCID) March 2013, untitled submission in response to DEEWR issues paper Employment services – building on success. Available from: http://home.deewr.gov.au/submissions/BuildingonSuccess/index.htm.
170

National Disability Services (NDS) March 2013, NDS submission – Employment services beyond 2015: Working with what works. Available from: http://home.deewr.gov.au/submissions/BuildingonSuccess/index.htm.
National Employment Services Association (NESA) May 2012, Response to the Advisory Panel on Employment Services Administration and Accountability final report and DEEWR responses.
National Employment Services Association (NESA) 2013, Realising our potential: Response to ‘Employment services – building on success’ discussion paper.
OECD (2012), Activating Jobseekers: How Australia Does It, OECD Publishing. http://dx.doi.org/10.1787/9789264185920-en
ORIMA Research December 2012, ‘Business use of government employment services (“employer”) survey summary report’, prepared for Department of Education, Employment and Workplace Relations (unpublished).
Portfolio Budget Statements 2008–09, Budget Related Paper No 1.5, Education, Employment and Workplace Relations Portfolio, Australian Government, Canberra
Productivity Commission, 2002, Independent Review of Job Network. Inquiry Report, Report No. 21.
Rahmani, Z. and T. Crosier, Impact of the Australian Literacy and Numeracy training program on job seekers. Literacy & Numeracy Studies, 12 (2), 31-45.
Rolfe, H. (2012). Requiring the long-term unemployed to train: Is benefit conditionality effective? National Institute Economic Review, 219, R65-R76.
Service Skills Australia 2013, Productivity Places Programme webpage. http://www.serviceskills.com.au/productivity-places-program.
Skills Connect 2013, Local employment coordinators webpage. http://skillsconnect.gov.au/home/local-employment-coordinators/.
Rees, J, Whitworth, A and Carter, E. (2013). Support for all in the UK Work Programme? Differential payments, same old problem…Third Sector Research Centre, Working Paper 115..
171

Appendix 1 Methodology
1 IntroductionThis evaluation relied heavily on internal analysis of data held by the Department of Employment (the department). Different analyses were undertaken either to:
• compare Job Network and its complementary programmes (JNS) and Job Services Australia (JSA) outcomes, or
• answer specific questions.
The methodology used for each analysis greatly depended on the intent of the analysis, and is described below.
2 Comparing JNS and JSA
2.1 New entrant comparisonsVarious quantitative measures were used to compare JSA to the previous model of employment service delivery, which comprised Job Network and its complementary programmes (JNS) including the Job Placement, Education and Training Programme (JPET) and the Personal Support Programme (PSP). It also included the operation of Job Placement Licensed Organisations (JPLOs).
Since both of these models of service delivery were designed to service similar types of clients it was feasible to compare outcomes for different client groups. To enable this high level comparison, two distinct populations were constructed. The comparison populations were created to be similar in as many aspects as possible, given the differences in both the economic and policy contexts and the models under which the employment services were delivered. This enabled an input - outcome analysis which took the two service delivery models as separate operations and compared outcomes. Because the models operated over different time periods the populations of interest were drawn from two distinct time periods.
The analysis compared the first contract period of JSA (which was in place from 1 July 2009 to 30 June 2012) to the extension of the Active Participation Model (APM) contract (which was in place from 1 July 2006 to 30 June 2009). In each case the first three months of the contract were excluded from the reference period to exclude transition effects and allow assessment of the normal operation of the model.438 The upper bound of the reference period was three months before the end of the contract period. Again this was to exclude transition effects and to allow administrative data to stabilise for analysis (for JSA). 439
As a general principle, the JNS comparison population was constructed to match the JSA population, because this allowed for examination of the extent to which JSA met its own objectives.
438 Transition effects are those that result from employment service providers “bedding down” their operations under a new Employment Services Contract (or Deed). Analysis of the Department’s administrative data indicates that these effects had settled by three months into the contract. There was also a concern that administrative patterns may change in the last 3 months of a contract (particularly for providers who not covered by the new contract).
439 This allowed time for amendments to administrative data to be made as well as information captured where there was a time lag in data entry.
172

This comparative analysis was designed to compare job seekers with similar levels of labour market disadvantage (regardless of their service types).440 New entrant populations were used rather than existing caseload to ensure that job seekers in the study cohorts had no recent experience of the previous employment model. In this way, the effects of the various employment services models were more easily attributed than they would be for job seekers who had received continuing periods of service under multiple models. As job seekers were not streamed under JNS in the same way as they were in JSA an assessment streaming methodology was applied to the JNS study population. For Streams 1 to 3 this was done using the Job Seeker Classification Instrument (JSCI) information for JNS job seekers reweighted to equate with JSA weights. Job seekers assessed as suitable for PSP or JPET under JNS had similar levels of disadvantage to those placed in Stream 4 under JSA, and so for this study were assigned to Assessed Stream 4. This process enabled comparisons of the effectiveness of each model for job seekers of similar levels of labour market disadvantage.
The main characteristics of the new entrant study populations are set out in Table A1.1 below. Also see Table A2.80 and Table A2.81 .
2.2 Long-term unemployed comparisonsThe new entrant population which was used in general comparisons was by its nature inappropriate for use in comparing outcomes across models for the long-term unemployed. Because of this, two additional study populations were constructed. These were drawn from the caseload on selected snapshot dates, and included all job seekers who:
• had been registered with employment services for one year or more at the relevant snapshot date
• had an active registration at the snapshot date
• had commenced with relevant services at the snapshot date.
Many job seekers in the JSA long-term unemployed (LTU) study population commenced under JNS or earlier models of employment assistance, and were subsequently transitioned to JSA. The transition arrangements allocated job seekers to JSA streams based on their level of disadvantage as measured by the JSCI, a Job Capacity Assessment (JCA) or Employment Services Assessment (ESAt) if appropriate, their length of unemployment and whether or not they were participants in PSP or JPET or on the waiting list for PSP.
An assessed streaming methodology (similar to that applied to the new entrant population) was applied to these populations to enable comparisons of LTU job seekers with similar levels of labour market disadvantage.
The main characteristics of the study populations created for both new entrant and long-term unemployed comparisons are set out in Table A1.1. Also see Table A2.59.
440 Job seekers who were given improved access to services under the Jobs and Training Compact redundant workers policy were removed from the JSA study population as they were given early access to stream services in JSA as a response to the Global Financial Crisis (GFC) in 2009.
173
Table A1.1: Definitions of study populations for the new entrant and long-term unemployed study populations
New entrant study:JNS JSA
Inflow interval 1 October 2006 to 30 September 2007 1 October 2009 to 30 September 2010
Reference Period 1 October 2006 to 31 March 2009 1 October 2009 to 31 March 2012
Quarantine period 1 June 2006 to 30 September 2006 1 June 2009 to 30 September 2009
Long-term unemployed studyJNS JSA
Snapshot date 30 September 2007 30 September 2010
Reference Period 1 October 2007 to 31 March 2009 1 October 2010 to 31 March 2012
Notes: 1. New entrant study population defined as job seekers who:
registered in the Inflow Interval had no periods of assistance in the Quarantine Period.For these job seekers, all periods of assistance that started within the Reference Period were selected.
2. LTU study population defined as job seekers who: were long-term unemployed at the snapshot date had an active referral to JNS/JPET/PSP or JSA had active registrations at the snapshot date.These job seekers were followed though out the Reference Period until they left employment services, or to the end of the Reference Period, whichever came first.
3. Dates are inclusive.
2.3 Outcome measures used Connection time measures the time from registration to commencement in employment services. It compares how long this connection process took for the two service models. The measure provided an indication of the relative efficiency of the different employment services.
Time in service is the time from registration in employment services to exit from them. This was used as an indicator of how quickly employment services were moving people out of service. The time in service duration was adjusted to exclude ‘time-outs’ (suspensions and exemptions). Durations analysed include only periods for job seekers who exited services, not those ended for transfer or other reasons. As job seekers exit services for a variety of reasons, this measure cannot be assumed to be a time to employment measure. This measure should be considered in conjunction with the time on income support measure.
Time on income support is the period from registration date, if a job seeker was already on an income support or started on an income support starting date within 28 days of registration (as previously used in the APM evaluation) to time of exit from income support. It was adjusted to exclude ‘time-outs’ (suspensions and exemptions). This was another measure of the efficiency of the programme, measuring how quickly people were moved off income support. The measure complements the time in service measure, but was only available for job seekers on income support
174

at commencement, and is less likely to have been affected by administrative differences between the programmes.
Predicted exits from employment services is the predicted number of exits that one group of job seekers might have experienced if they had participated in a different employment services model. The prediction was performed using a regression model constructed from data on the characteristics and outcomes associated with a different group of job seekers who actually did participate in the second employment services delivery model over an 18-month study period.
Employment outcome rate is a critical outcome measure. The employment rates from the Post Programme Monitoring (PPM) survey were used where possible. However for some cohorts, such as Assessed Stream 4 job seekers in the new entrant study population, data quality and comparability issues prevented its use for some analyses. Programme operation and payment differences between the models made comparisons based on administrative data impractical for many study cohorts. The PPM survey-based employment rates proved to be the most consistent measure for the two service models compared.
Job placement and paid 13-week outcome rates were used for Assessed Stream 4 new entrant job seekers. For highly disadvantaged job seekers there was good comparability of administration data and payment rules between models. The measure compares total job placements and 13-week paid outcomes achieved within 18 months of commencing a period of assistance.
Education outcome rate measures education training status as reported by the PPM survey. This represents an additional, and essential, outcome measure. The measure was not available for all job seeker cohorts, as education outcomes were not consistently and systematically recorded in the administration data system.
Positive outcome rate is a combined measure of PPM employment and education outcome rates. Again, this measure was not available for all job seeker cohorts.
Off Newstart Allowance (NSA)/ Youth Allowance (Other) (YA(O)) rate considers recipient status of job seekers who were in receipt of either NSA or YA(O) at either commencement in assistance for the new entrant populations or on the snapshot date for the long-term unemployed populations. NSA and YA(O) represent the two unemployment related benefit types. The off NSA/YA(O) rate measures the proportion of job seekers who either moved off income support entirely or moved to another form of income support, other than NSA or YA(O). The measure was chosen for the primary reason of providing a historically consistent estimate of exit rates from activity tested unemployment benefits. This measure was also used to gauge employment sustainability by examining off NSA/YAO rates 12 months after exit from a period of assistance.
Off-income support rate is similar to the off NSA/YA(O) rate measure but it considers a larger cohort of job seekers, all those in receipt of any form of income support at the time of commencement in assistance for new entrant populations or the snapshot date for long-term unemployed populations. Moving off all forms of income support is considered a successful outcome for this measure. This measure was also used to gauge employment sustainability by examining income support status 12 months after exit from a period of assistance.
175
Reliance on income support determines what percentage of the income support base rate payment was received on average over the 12-month period. Base rates used in this calculation may vary over the 12-month period if job seekers moved from one type of income support payment type to another. So the actual dollar amount received could feasibly have gone down over the analysis period while the percentage of base rate received increased and vice versa. This measure does not take in to consideration the comparability of base rates between income support payment types. The purpose of this measure is not to ascertain any increase or decrease in the nominal amount of income support received over the 12-month period but job seekers’ relative reliance on whichever type of income support payment they were receiving at the time. This measure was used to gauge employment sustainability by examining average reliance on income support during the first 12 months after exit from a period of assistance.
2.4 Cost effectiveness comparisonsCost effectiveness measures were calculated for the new entrant study populations only. Expenditure consisted of programme administered funds only which included:
• service fees
• placement fees
• outcome fees
• Job Seeker Account or Employment Pathway Fund (EPF) expenditures.
For the purposes of comparison with JSA, JNS expenditures calculated for this report included all the comparable relevant service contracts including JN, JPLOs, JPET, PSP, Community Work Coordinators and Green Corps.
Some payments for the JNS study population were necessarily imputed. This included service fees which were paid based on the service providers’ business allocation on a quarterly basis. As these fees were not associated with individual job seekers, they could not be extracted directly for the study populations. Imputation was based on records of service referral placement type and duration and in accordance with the prevailing contract specifications. Funding paid under a grant for JPET programme providers was also imputed based on what would have been paid for job seekers in the study population.
Expenditure per outcome was estimated by the division of the total expenditure over the period by the number of corresponding new entrant job seeker outcomes. Outcomes were based on employment and positive outcome rates after 12 months service for Stream 1 to 3 as determined by the PPM survey. For Stream 4, job placement rates based on the department’s administrative data were used. The selection of these outcome measures was primarily based on their comparability between the service models and their relative consistency between Stream 4 and the other service streams.
Expenditure per job seeker is defined as the sum of all expenditures associated with a job seeker for a fixed period.
Expenditure per employment outcome is defined as average expenditure per job seeker (the averaged sum of all expenditures associated with a job seeker for a given period) divided by an
176

employment outcome rate for the corresponding period. This is a primary cost effectiveness measure.
Expenditure per positive outcome is similar to the expenditure per employment outcome measure except that the employment rate is replaced by the positive outcome rate.
2.5 Cost per employment outcomeThe published Job Network (JNS) cost per employment outcome was calculated as the unit cost of assistance divided by employment outcome rate (as measured through the PPM survey). The job seeker population used for this calculation was based on commencements in certain phases of assistance under Job Network in a 12-month period. All subsequent costs (including commencement, assistance such as Job Seeker Account, interview attendance and outcome payments) for each of those job seekers in the nine months following commencement were collected to determine the unit cost of assistance. An employment rate for the relevant phases combined was calculated based on the results from the PPM survey.
This methodology was developed with a primary focus of being able to compare with the cost per employment outcomes for the first two employment services contracts. The main limitation of this methodology is that not all costs and employment outcomes were captured. Costs and outcomes for job seekers who left assistance in the Job Search Support phase and those with very long periods of employment assistance were not included. As a result, the cost per employment outcome figures represent useful estimates in comparison with the previous two service contracts, but do not represent complete estimates for the service model itself. The methodology was a purely inflow (that is commencements) population methodology.
The introduction of JSA brought major changes to the model of employment service delivery. This necessitated changes to the methodology used to calculate the cost per employment outcome. As JSA consists of four service streams, the new method estimates two cost per employment outcome figures – one for the combined Stream 1 to 3 and another one for the most disadvantaged job seekers in Stream 4. In the first instance, all recorded costs in a 12-month period for Streams 1 to 3 job seekers are combined to produce the total cost figure for employment assistance. This cost figure is then divided by the number of employment outcomes as estimated through the PPM survey. The cost per employment outcome for Stream 4 is similarly estimated.
3 Other analyses undertaken
3.1 Quantifying the effectiveness of training in JSAThis analysis used administrative data on expenditure from the EPF on training from 1 July 2009 to 30 September 2011. An outcome of effective training was defined as a job seeker with increased job readiness. Regression analysis was conducted to assess the effectiveness of EPF training expenditure, using the odds of achieving a job placement within three months of receiving EPF funded training as an indicator of improved job readiness.
A random sample of 60,000 placements that received EPF funded training course transactions (for job seekers in Streams 2 to 4) was matched on a one-to-one basis with 60,000 JSA placements that did not receive any EPF training funds during the same time period. Matching was based on age group, gender, stream, registration duration, and whether the registration period had commenced
177

under Job Network or JSA. Registration duration referred to the job seeker’s period of service with their provider from when the job seeker registered with employment services and included any allowable breaks in service. The factors included in the regression consisted of information about the job seeker, their unemployment history and local labour market.
There were many other factors that could not be accounted for in the regression analysis that would also have influenced job seeker outcomes. Providers would have considered many of these factors when choosing training as against other forms of assistance to get job seekers job ready such as the job seeker’s motivation, preferences and aspirations.
Providers allocated EPF funded training to those job seekers most likely to benefit from the assistance. In light of this it is possible that the results derived using this methodology may have overestimated the effectiveness of training given the selection process of job seekers who received training.
3.2 Quantifying other training aspectsOther estimates of the effectiveness of training were derived from analysis of Stepping Stones (DAISES) survey data. This analysis explored the educational attainment of job seekers via an analysis of the Stepping Stones Cohort 2 dataset. The analysis aimed to describe the educational experiences of DAISES respondents, including:
• the course field and levels of study undertaken
• the barriers which keep them from studying
• the outcomes from their study
• the role of JSA in getting job seekers into successful training programmes.
3.3 Analysing social exclusion and disadvantageThe extent of disadvantage among JSA job seekers was estimated using weighted cohort 3, wave 5 Stepping Stones survey data collected in 2011. Only respondents who were representative of the JSA Caseload (in Streams 1 to 4) who had been unemployed for at least three months were included in the analyses.
Five domains of disadvantage were considered: Material, Education, Health, Community and Social domains. Fourteen separate indicators were used to determine the presence or absence of disadvantage in these five domains. Respondents were defined as suffering social exclusion if they had three or more of the five domains of disadvantage present. This data was used to assess the impact of this disadvantage on labour market outcomes. Context was provided by use of the Australian Bureau of Statistics’ (ABS) General Social Survey (GSS) data to investigate the prevalence of disadvantage in society, and specifically how this varies between people who are employed, unemployed and not in the labour force.
3.4 Comparing specialist and generalist providersThis research investigated how specialist providers performed compared to generalist providers in terms of outcomes and how well specialist providers served the overall JSA caseload. A number of quantitative as well as qualitative data sources were used:
• Star Ratings at contract level for June 2010 to September 2013178
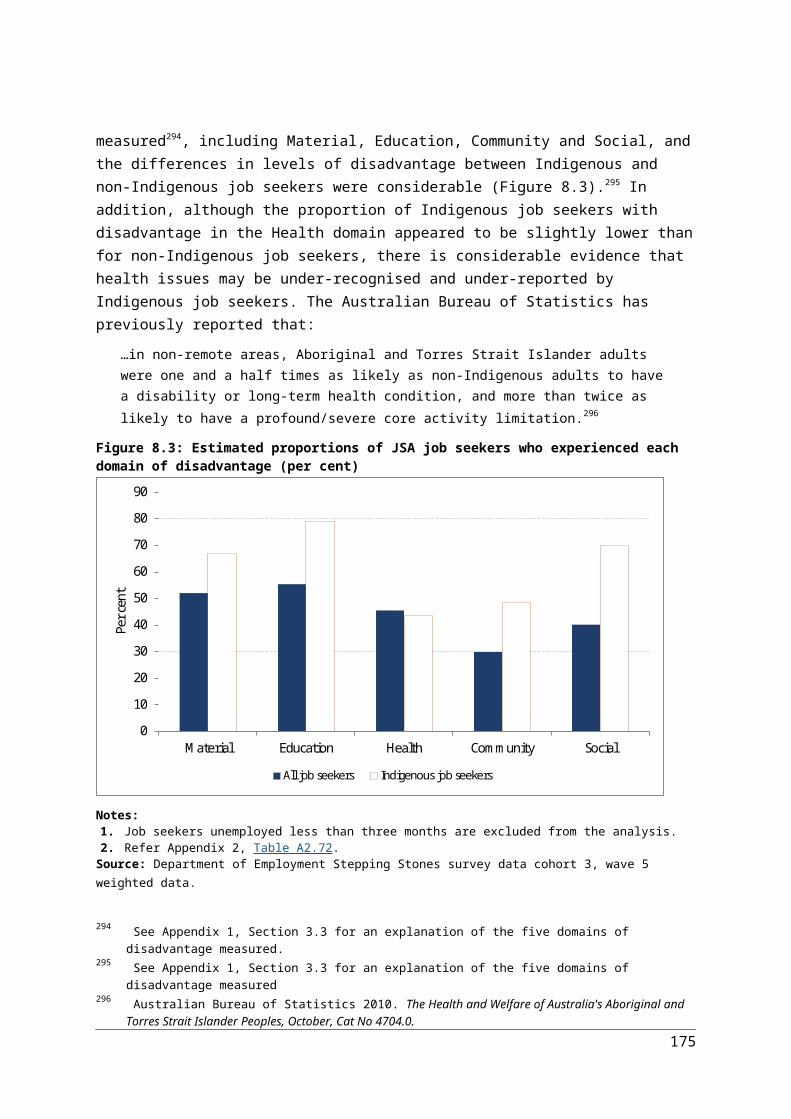
• job seeker unit record level data for Star Ratings June 2012
• site and contract level Star Ratings file June 2012
• PPM client experience survey data from January 2010 to August 2013 at the contract level
• JSA expenditure data
• JSA qualitative research data.
Logistic regressions were performed to compare the performance of specialist and generalist providers as measured by full 13-week outcomes, taking into account job seeker characteristics and macroeconomic circumstances. Qualitative data was analysed thematically using QSR International’s NVivo software.
3.5 Estimating the relative effectiveness of Work ExperienceThis investigation of work experience activity comprised two separate analyses.
Analysis 1 - the new entrant populations established for the comparisons of JNS and JSA were used to examine the pattern of participation in work experience for job seekers in JSA.441
Analysis was only performed on work experience activities that occurred during a participant’s Work Experience Phase (WEPh) (usually occurs approximately 12 months after commencement in JSA). Activities that occurred outside of these periods were not included. Outcomes were calculated 12 months after commencing the WEPh (usually approximately 24 months after commencement).
To determine the effectiveness of different activity types, all activity types were condensed into four main categories to simplify regression analysis:
1. Employment – includes Part-Time/Casual Paid Employment, Unpaid Work Experience, Voluntary Work in community/non-profit sector.
2. Training – includes Accredited Education and Training (Vocational), NEIS (New Enterprise Incentive Scheme) Training, Referral to NEIS Panel Member, Training in Job Search Techniques, Vocational Assistance.
3. Work for the Dole (WfD)4. Other – includes Defence Force Reserves, Interventions, Greens Corps, Non-vocational
Assistance, Other Approved Programmes, Other Non-vocational.
Logistic regression was used to determine the odds of getting off benefit (i.e. off employment-related benefits) if a participant undertook a certain activity group compared to if they undertook an Employment activity type.
Analysis 2 - examined work experience activity participation over a longer period, which enabled more robust analysis on a greater number of job seekers. This study aggregated work experience activities into the same four groups as in Analysis 1. The study population consisted of job seekers who commenced in the WEPh between 1 September 2009 and 1 May 2011, had a Work Experience Activity Requirement (WEAR) and were in receipt of income support on the day they commenced in WEPh and were in JSA Streams 1-3 (over 68,000 job seekers) or Stream 4 (more than 9,800 job seekers).
441 See Section 2 in this Appendix.
179
The effect of a referral to a work experience activity on the likelihood of leaving income support or income support (for job seekers who received a referral to a work experience activity) was examined using logistic regression modelling.
3.6 Estimating the impact of Intensive Support job search trainingThe Intensive Support job search training (ISjst) activity was compulsory for most activity tested job seekers in Job Network. There was no equivalent in JSA. In order to examine the effects of ISjst, study populations were drawn from the new entrant populations constructed for the comparison of JNS and JSA.442 In Job Network, those who were referred to Job Search Training were mainly Stream 2 equivalent job seekers, as more job ready job seekers tended to leave services within three months of commencement (and therefore before the ISjst), and more disadvantaged job seekers were more likely to be referred for intensive services earlier than the three-month mark. The study populations were therefore constructed as:
• Stream 2 equivalent, both at the start and end of registration
• on NSA or YA(O) within 28 days of registration
• commenced in employment services.
Logistic regression was used to examine the rate of exit from income support, controlling for temporal and compositional differences between the study population (JNS) and the control group (JSA).
3.7 Quantifying the effectiveness of streamingThe study used the JSA and JNS new entrant populations as defined in Section 2.1 of this Appendix. Expenditure and income support data was extracted from administrative data.
Outcomes measures used were off-income support rate at 12 months from JSA/JNS registration date, average expenditure per job seeker for the first 12 months in service and average expenditure per off income support outcome. Initial analysis did not show the expected discontinuities at stream boundaries. Many job seekers change stream during assistance and many job seekers (such as youth) receive services which do not align with their Job Seeker Classification Instrument (JSCI) scores. Once these two types of job seekers are removed from the initial population, it makes the analysis of streaming based on JSCI cleaner.
To systematically estimate stream effect, data points close to stream boundaries were then used to fit a linear model for each of the streams. The predicted outcome rates for each stream with one point extrapolation for the adjacent upper stream were used to estimate the difference that streaming made across the boundaries.
Average expenditure per job seeker included all service fees, outcome fees as well as Job Seeker Account or EPF expenditures. Average expenditure per job seeker in the first 12 months for JSA and JNS restricted cohorts were calculated.
Expenditure per outcome, which is determined by average expenditure per job seeker and outcome rate, was also calculated as another measure of cost effectiveness.
442 See Section 2 in this Appendix.
180

4 Conclusion
As shown by the variety and number of analyses listed above, this report involves detailed analysis conducted over several years, using different time frames and different methodologies depending on the intent of the analysis. It is important to bear this in mind and not attempt to compare data reported here in response to specific issues with that published as general monitoring information.
181

Appendix 2 Statistical tables
List of TablesTable A1.1: Definitions of study populations for the new entrant and long-term unemployed study
populations.................................................................................................................................Table A2.1: JSA monthly commencements and exits and monthly unemployment rate, July 2009 to June
2012............................................................................................................................................Table A2.2: Time from registration for employment services to commencement in service by entry
process for new entrant populations, JNS and JSA (per cent).....................................................Table A2.3: JSA job seekers by Stream, July 2009 to June 2012 – active caseload (number)............................Table A2.4: Proportion of job seekers who attended an interview in the fortnight since first interview,
JSA and JNS job seekers for new entrant populations by Stream................................................Table A2.5: Attendance at appointments with providers 2008 to 2012 by quarter for caseload and new
entrant populations (per cent)....................................................................................................Table A2.6: Likelihood of obtaining a 26 week employment outcome after previous short-term job
placements, Stream 3 and 4 job seekers.....................................................................................Table A2.7: Average time spent by providers with JSA job seekers on initial contact tasks caseload
population (per cent)..................................................................................................................Table A2.8: Differences in EPF expenditure between specialist and generalist JSA providers (per cent)..........Table A2.9: Proportion of JSA job seekers by Stream in the Work Experience Phase, July 2009 to June
2012, caseload population (per cent)..........................................................................................Table A2.10: Work Experience activities by Stream of service, 1 July 2009 to 30 June 2012 (number).............Table A2.11: Work Experience activities by age, 1 July 2009 to 30 June 2012 (number)...................................Table A2.12: Work Experience activities by activity type (per cent)..................................................................Table A2.13: Demographics of Work Experience Phase participants (per cent)................................................Table A2.14: Weekly exit rates from income support after job seeker commenced in the Work
Experience Phase (per cent)........................................................................................................Table A2.15: Cumulative exits from income support after activity referral (per cent)......................................Table A2.16: Weekly exit rates from income support after activity referral, by activity Stream 4 (per
cent)............................................................................................................................................Table A2.17: Percentage of job seekers in study population who were off Income Support 18 months
after referral to a Work Experience activity, Streams 1 to 3 (per cent).......................................Table A2.18: Odds of getting off benefit for different activity groups compared to the Employment
activity group, by various subpopulations...................................................................................Table A2.19: Cumulative exits from income support Job Services Australia (JSA) and Job Network
Services (JNS) for new entrant populations (per cent)................................................................Table A2.20: Estimation of net impact of Job Search Training using the proportion of job seekers off
income support by number of weeks since registration.............................................................Table A2.21: Probability of exit from income support – Job Services Australia (JSA) and Job Network
Services (JNS) for new entrant populations (probability)............................................................Table A2.22: Probability of exit from income support –JNS by Assessed Stream for new entrant
populations (probability).............................................................................................................Table A2.23: Comparison of new entrant employment and education outcomes, JNS and JSA, Assessed
Stream 1......................................................................................................................................Table A2.24: Comparison of new entrant employment and education outcomes, JNS and JSA, Assessed
Stream 2......................................................................................................................................Table A2.25: Comparison of new entrant employment and education outcomes, JNS and JSA, Assessed
Stream 3......................................................................................................................................Table A2.26: Comparison of new entrant employment and education outcomes, JNS and JSA, Assessed
Streams 1 to 3.............................................................................................................................Table A2.27: Off NSA/YA(O) rates one year after exit from service, JNS compared with JSA (per cent)............Table A2.28: Off income support rates one year after exit from service, JNS compared with JSA (per
cent)............................................................................................................................................Table A2.29: Average reliance on income support one year after exit from service, JNS compared with
JSA (average rate).......................................................................................................................
182
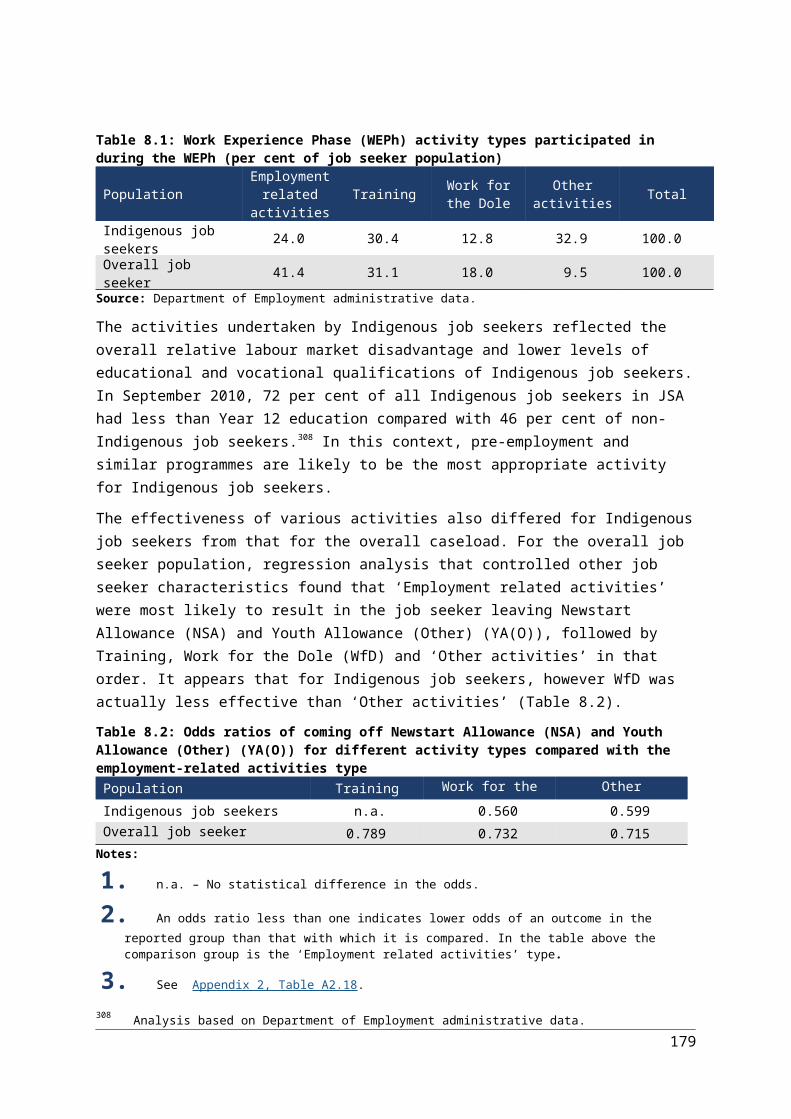
Table A2.30: Odds of getting a job placement within 18 months of registration commencement under JSA compared to JNS for those assessed as Stream 4 type new entrant job seekers..................
Table A2.31: Odds of getting a 13-week employment outcome of registration commencement under JSA compared to JNS for those assessed as Stream 4 type new entrant job seekers........................
Table A2.32: Comparison of programme effect on the likelihood of leaving income support 18 months after registration (for all new entrant analysed groups).............................................................
Table A2.35: Average expenditure per job seeker in the first 12 months of JNS service by JSCI score ($)........Table A2.36: Regression predicting non-completion of study by characteristics at time of starting
training course............................................................................................................................Table A2.37: Effect on employment success of behavioural factors controlling for socio-demographic
effects.........................................................................................................................................Table A2.38: Effectiveness of EPF training – the likelihood of getting a job placement, 15 to 24 years old......Table A2.39: Effectiveness of EPF training – the likelihood of getting a job placement, 25 to 49 years old......Table A2.40: Effectiveness of EPF training – the likelihood of getting a job placement, 50+ years old..............Table A2.41: Effectiveness of EPF training – the likelihood of getting a job placement, Stream 2.....................Table A2.42: Effectiveness of EPF training – the likelihood of getting a job placement, Stream 3.....................Table A2.43: Effectiveness of EPF training – the likelihood of getting a job placement, Stream 4.....................Table A2.44: Job seeker satisfaction with training and education option information provided by JSA
provider, June 2012 (per cent)....................................................................................................Table A2.45: Employment and education outcomes for LTU job seekers, JNS (per cent)..................................Table A2.46: Employment and education outcomes for LTU job seekers, JSA (per cent)..................................Table A2.47: Comparison of employment and education outcomes for LTU job seekers, JNS and JSA
(ppt difference)...........................................................................................................................Table A2.48: JNS and JSA active caseload and Australian population aged 15–64, selected characteristics
(per cent)....................................................................................................................................Table A2.49: Odds ratios of those more likely to face multiple disadvantage in JSA caseload..........................Table A2.50: Estimated proportions of each type of JSA job seeker who experienced each domain of
disadvantage by age, gender and service Stream (18 to 65 years of age) (per cent)..................Table A2.51: Odds ratio of off income support by JSA Stream of service for those who did and did not
experience multiple disadvantage..............................................................................................Table A2.52: Odds ratio of achieving a job placement by JSA Stream of service for those who did and did
not experience multiple disadvantage........................................................................................Table A2.53: Odds ratio of achieving a 13-week employment outcome by JSA Stream of service for those
who did and did not experience multiple disadvantage..............................................................Table A2.54: Regression model of achieving a job placement by JSA Stream of service considering
interactions of the five domains of disadvantage (maximum likelihood estimate – MLE)..........Table A2.55: Regression model of achieving a 13-week employment outcome by JSA Stream of service
considering interactions of the five domains of disadvantage (maximum likelihood estimate – MLE)..........................................................................................................................
Table A2.56: JSA active caseload, disadvantaged groups by stream, September 2010 (per cent).....................Table A2.57: Time to recommendation to Stream 4 type services, JNS and JSA new entrant populations
(per cent)....................................................................................................................................Table A2.58: Time to placement in Stream 4 type services, JNS and JSA new entrant populations (per
cent)............................................................................................................................................Table A2.59: Characteristics of JNS and JSA LTU study populations and total Active Caseload (per cent)........Table A2.60: Estimated odds ratios of exits from employment services for variables in the logistic
regression models, by Assessed Stream, for the JSA LTU study population................................Table A2.61: Off NSA/YA(O) one year after exiting rates for job seekers who exited employment
services, JNS and JSA LTU study populations (per cent)..............................................................Table A2.62: Off income support one year after exiting rates for job seekers who exited employment
services, JNS and JSA LTU study populations (per cent)..............................................................Table A2.63: Average reliance on income support one year after exiting rates for job seekers who exited
employment services by job seeker characteristics, JNS and JSA LTU study populations (average rate)..............................................................................................................................
Table A2.64: Exits from employment services due to disability, selected job seeker groups (per cent of job seekers who exited)..............................................................................................................
Table A2.65: Likelihood of receiving EPF training funding, Stream 2.................................................................
183
Table A2.66: Likelihood of receiving EPF training funding, Stream 3.................................................................Table A2.67: Likelihood of receiving EPF training funding, Stream 4.................................................................Table A2.68: Employment Services active caseload by length of unemployment, July 2006 to June 2012
(number).....................................................................................................................................Table A2.69: Full-time and part-time employment outcome and education outcome rates by length of
unemployment, JNS and JSA (per cent).......................................................................................Table A2.70: Distribution of Job Seeker Classification Instrument (JSCI) scores for Indigenous and non-
Indigenous job seekers, July 2009 to February 2011 (per cent)..................................................Table A2.71: Select client groups in JSA active caseload, Indigenous and non-Indigenous job seekers, at
30 September 2010 (per cent)....................................................................................................Table A2.72: Estimated proportions of JSA job seekers who experienced each domain of disadvantage
(per cent)....................................................................................................................................Table A2.73: Outcome rates for overall job seeker population and Indigenous job seekers, as at June
2012 (per cent)............................................................................................................................Table A2.74: Comparison of effects of new entrant job seeker characteristics on the likelihood of leaving
income support 18 months after registration.............................................................................Table A2.75: Services received by employers who used JSA 2012 (per cent)....................................................Table A2.76: Strategies reportedly used JSA providers to identify skills needs of employers 2012 (per
cent)............................................................................................................................................Table A2.77: Methods used by JSA providers to facilitate job placements 2012 (per cent)..............................Table A2.78: Strategies JSA providers reported using to sustain employment (per cent).................................Table A2.79: Average Star Ratings for all generalist and specialist providers over JSA operation period..........Table A2.80: Periods of assistance, JNS and JSA new entrant study populations and JSA active caseload
(per cent)....................................................................................................................................Table A2.81: Periods of assistance for Fully Eligible job seekers, JNS and JSA new entrant study
populations and JSA caseload (per cent).....................................................................................
184
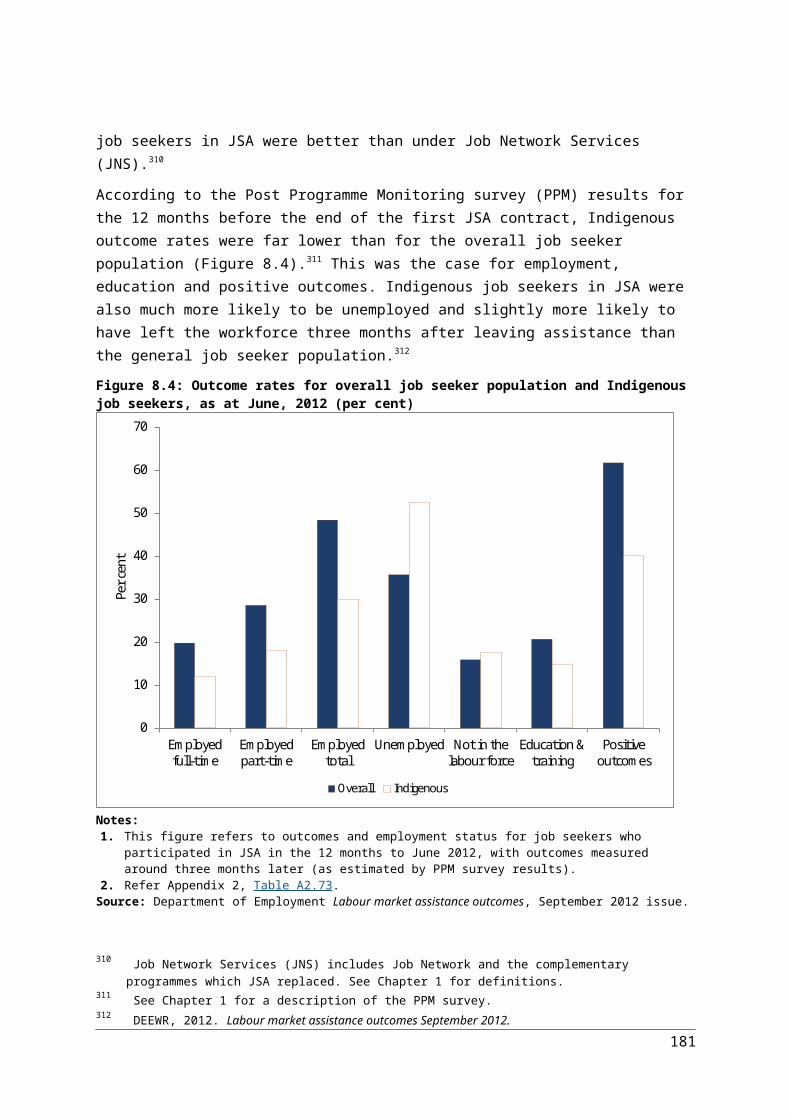
Table A2.1: JSA monthly commencements and exits and monthly unemployment rate, July 2009 to June 2012
Month Exits from JSA service (number)
JSA commencements
(number)
Australian unemployment rate (per cent)
July 2009 70,993 78,133 5.3August 2009 71,139 67,519 5.5September 2009 61,279 65,622 5.7October 2009 62,175 57,657 5.4November 2009 61,449 58,164 5.2December 2009 60,441 65,002 5.3January 2010 51,856 67,730 5.7February 2010 66,823 70,091 6.0March 2010 82,124 70,446 5.7April 2010 66,965 51,527 5.5May 2010 68,686 57,743 5.2June 2010 70,663 52,829 5.0July 2010 74,761 54,472 4.9August 2010 75,219 53,312 4.9September 2010 70,653 49,884 5.1October 2010 65,830 45,509 5.0November 2010 68,463 53,304 4.8December 2010 61,879 54,204 4.8January 2011 52,480 56,267 5.4February 2011 69,947 58,523 5.6March 2011 78,121 64,952 5.3April 2011 62,338 46,619 5.0May 2011 72,417 56,426 5.0June 2011 71,145 53,537 4.8July 2011 66,824 50,511 4.8August 2011 73,670 53,228 5.1September 2011 64,777 48,457 5.2October 2011 58,501 44,433 5.0November 2011 63,020 51,186 4.9December 2011 52,171 49,937 5.0January 2012 50,799 63,174 5.5February 2012 69,258 64,950 5.9March 2012 66,760 56,462 5.5April 2012 57,635 46,150 5.0May 2012 68,009 56,913 5.2June 2012 58,839 49,559 5.0
Source: Department of Employment administrative data and Australian Bureau of Statistics, Labour Force Australia, Cat. 6202, Nov. 2012
Return to Figure 3.1 where this data is referenced.
185

Table A2.2: Time from registration for employment services to commencement in service by entry process for new entrant populations, JNS and JSA (per cent)
Days to commencement JNS Rapid Connect JNS Other JSA Rapid Connect JSA Other
1 12.4 6.8 9.0 5.82 44.4 15.8 45.0 13.93 64.8 24.1 58.8 18.14 74.9 30.5 70.1 21.85 83.8 37.2 78.5 24.86 88.5 42.6 84.3 27.67 92.3 48.2 88.4 30.38 93.7 50.6 91.8 33.59 94.4 52.1 93.7 35.8
10 95.1 53.7 94.7 37.411 95.8 55.2 95.6 38.912 96.4 56.7 96.3 40.313 97.0 58.2 97.1 41.814 97.5 59.9 97.8 43.815 97.9 61.3 98.4 46.116 98.2 62.4 98.7 47.917 98.4 63.5 98.9 49.118 98.6 64.6 99.1 50.219 98.7 65.7 99.2 51.220 98.9 66.8 99.3 52.221 99.1 68.0 99.4 53.522 99.2 69.0 99.5 55.123 99.3 69.7 99.6 56.324 99.4 70.5 99.7 57.225 99.5 71.2 99.7 58.026 99.6 72.0 99.8 58.827 99.7 72.8 99.8 59.528 99.8 73.8 99.9 60.629 99.9 74.5 99.9 61.930 99.9 75.1 100.0 62.831 100.0 75.7 100.0 63.532 100.0 76.3 100.0 64.133 100.0 77.0 100.0 64.734 100.0 77.8 100.0 65.335 100.0 78.8 100.0 66.136 100.0 79.4 100.0 67.137 100.0 79.8 100.0 67.838 100.0 80.4 100.0 68.439 100.0 81.0 100.0 68.840 100.0 81.5 100.0 69.341 100.0 82.0 100.0 69.7
186

Days to commencement JNS Rapid Connect JNS Other JSA Rapid Connect JSA Other
42 100.0 82.6 100.0 70.443 100.0 83.0 100.0 71.244 100.0 83.3 100.0 71.845 100.0 83.6 100.0 72.246 100.0 84.0 100.0 72.647 100.0 84.3 100.0 73.048 100.0 84.6 100.0 73.349 100.0 85.0 100.0 73.850 100.0 85.3 100.0 74.451 100.0 85.5 100.0 74.952 100.0 85.8 100.0 75.353 100.0 86.0 100.0 75.654 100.0 86.3 100.0 75.955 100.0 86.6 100.0 76.256 100.0 86.9 100.0 76.757 100.0 87.2 100.0 77.258 100.0 87.4 100.0 77.659 100.0 87.6 100.0 77.960 100.0 87.8 100.0 78.261 100.0 88.0 100.0 78.462 100.0 88.2 100.0 78.763 100.0 88.5 100.0 79.164 100.0 88.7 100.0 79.565 100.0 88.9 100.0 79.966 100.0 89.0 100.0 80.267 100.0 89.2 100.0 80.468 100.0 89.4 100.0 80.669 100.0 89.6 100.0 80.870 100.0 89.8 100.0 81.171 100.0 90.0 100.0 81.572 100.0 90.1 100.0 81.873 100.0 90.3 100.0 82.074 100.0 90.4 100.0 82.275 100.0 90.6 100.0 82.476 100.0 90.7 100.0 82.677 100.0 90.9 100.0 82.978 100.0 91.1 100.0 83.279 100.0 91.2 100.0 83.480 100.0 91.3 100.0 83.681 100.0 91.4 100.0 83.882 100.0 91.5 100.0 84.083 100.0 91.6 100.0 84.184 100.0 91.7 100.0 84.485 100.0 91.8 100.0 84.786 100.0 92.0 100.0 84.9
187

Days to commencement JNS Rapid Connect JNS Other JSA Rapid Connect JSA Other
87 100.0 92.1 100.0 85.188 100.0 92.2 100.0 85.389 100.0 92.3 100.0 85.590 100.0 92.4 100.0 85.691 100.0 92.6 100.0 85.992 100.0 92.7 100.0 86.293 100.0 92.9 100.0 86.594 100.0 93.0 100.0 86.695 100.0 93.1 100.0 86.896 100.0 93.2 100.0 87.097 100.0 93.3 100.0 87.198 100.0 93.4 100.0 87.4
Note: See Appendix 1, Section 2 for a description of how new entrant comparisons were made and outcome measures used.
Source: Department of Employment administrative data.
Return to Figure 3.2 where this data is referenced.
188
Table A2.3: JSA job seekers by Stream, July 2009 to June 2012 – active caseload (number)
Month Eligibility not yet determined Stream 1 (Limited) Stream 1 Stream 2 Stream 3 Stream 4 Total
July 2009 3,362 15,888 302,057 122,117 225,163 83,295 751,882
August 2009 4,237 24,135 273,224 145,522 214,835 89,032 750,985
September 2009 5,241 30,514 256,100 165,421 210,555 94,983 762,814
October 2009 5,483 28,367 242,282 183,993 208,027 100,795 768,947
November 2009 5,925 26,936 233,437 198,739 205,442 106,064 776,543
December 2009 6,263 23,207 235,920 212,160 202,964 110,780 791,294
January 2010 6,588 24,532 242,366 227,407 202,720 115,401 819,014
February 2010 6,570 27,472 238,325 236,353 199,879 119,876 828,475
March 2010 6,826 29,284 226,482 240,472 197,954 125,053 826,071
April 2010 6,201 29,312 215,212 242,121 195,063 128,595 816,504
May 2010 6,806 26,666 206,190 250,283 193,249 133,186 816,380
June 2010 6,435 25,762 195,664 250,601 190,053 136,785 805,300
July 2010 6,422 23,447 177,611 252,183 193,729 140,542 793,934
August 2010 6,262 21,858 161,868 244,871 205,409 144,747 785,015
September 2010 6,035 20,422 151,364 238,827 206,768 148,403 771,819
October 2010 5,758 19,783 145,491 235,280 203,252 151,263 760,827
November 2010 5,515 20,147 146,561 231,656 198,619 154,215 756,713
December 2010 5,224 18,253 156,764 230,642 194,199 157,045 762,127
January 2011 5,284 19,400 169,211 228,961 193,297 160,656 776,809
February 2011 5,258 19,883 172,674 223,936 192,811 164,213 778,775
189

Month Eligibility not yet determined Stream 1 (Limited) Stream 1 Stream 2 Stream 3 Stream 4 Total
March 2011 4,529 22,519 175,826 218,013 190,084 163,847 774,818
April 2011 4,028 21,862 174,527 212,880 188,030 162,800 764,127
May 2011 3,733 21,676 177,621 208,240 186,836 161,736 759,842
June 2011 3,666 20,825 177,358 202,940 183,997 160,431 749,217
July 2011 3,550 20,771 175,362 198,668 181,258 159,388 738,997
August 2011 3,119 20,464 171,230 193,772 178,156 158,085 724,826
September 2011 3,234 18,297 168,786 191,007 177,649 158,395 717,368
October 2011 3,214 17,398 167,317 188,055 176,624 158,075 710,683
November 2011 3,147 15,741 171,635 183,605 175,126 157,636 706,890
December 2011 2,908 14,808 183,607 182,701 172,323 156,896 713,243
January 2012 2,933 16,042 200,561 186,720 174,169 158,974 739,399
February 2012 2,915 17,180 204,016 185,841 174,051 159,148 743,151
March 2012 2,902 18,708 203,347 184,100 172,986 159,190 741,233
April 2012 2,024 17,886 204,642 183,013 172,566 159,161 739,292
May 2012 1,308 16,924 208,617 181,001 171,406 159,530 738,786
June 1012 768 16,338 211,574 180,642 170,262 159,872 739,456
Note: ‘Stream 1 (Limited)’ participants comprised not fully eligible participants (such as those not working or studying full-time and not receiving activity tested income support, and who wished to volunteer into JSA to get help finding get a job).
Source: Department of Employment administrative data.
Return to Figure 3.3 where this data is referenced.
190

Table A2.4: Proportion of job seekers who attended an interview in the fortnight since first interview, JSA and JNS job seekers for new entrant populations by Stream
Fortnights since first attended interview
JNS Stream 1 JSA Stream 1 JNS Stream 2 JSA Stream 2 JNS Stream 3 JSA Stream 3 JNS Stream 4 JSA Stream 4
1 0.117 0.067 0.139 0.141 0.331 0.124 0.231 0.305
2 0.229 0.166 0.259 0.560 0.543 0.448 0.461 0.746
3 0.218 0.172 0.237 0.636 0.497 0.574 0.405 0.589
4 0.171 0.153 0.190 0.555 0.437 0.457 0.350 0.529
5 0.141 0.155 0.169 0.545 0.412 0.473 0.367 0.493
6 0.150 0.162 0.187 0.517 0.432 0.449 0.469 0.503
7 0.597 0.232 0.616 0.501 0.589 0.437 0.430 0.478
8 0.809 0.575 0.764 0.504 0.602 0.431 0.546 0.449
9 0.668 0.614 0.606 0.490 0.538 0.421 0.521 0.464
10 0.587 0.556 0.539 0.470 0.484 0.412 0.497 0.473
11 0.534 0.503 0.487 0.465 0.471 0.405 0.444 0.433
12 0.493 0.481 0.447 0.471 0.448 0.407 0.446 0.444
13 0.461 0.465 0.419 0.459 0.450 0.415 0.415 0.420
14 0.447 0.455 0.426 0.453 0.472 0.398 0.481 0.436
15 0.455 0.456 0.422 0.457 0.466 0.397 0.479 0.433
16 0.480 0.446 0.438 0.449 0.454 0.400 0.369 0.440
17 0.513 0.441 0.457 0.447 0.459 0.376 0.491 0.463
18 0.515 0.436 0.468 0.453 0.476 0.408 0.506 0.457
19 0.466 0.442 0.429 0.460 0.433 0.392 0.465 0.473
20 0.451 0.438 0.417 0.446 0.423 0.392 0.520 0.483
21 0.445 0.434 0.425 0.448 0.420 0.407 0.466 0.493
22 0.473 0.441 0.452 0.452 0.452 0.410 0.497 0.475
23 0.477 0.442 0.443 0.452 0.469 0.400 0.487 0.407
191

Fortnights since first attended interview
JNS Stream 1 JSA Stream 1 JNS Stream 2 JSA Stream 2 JNS Stream 3 JSA Stream 3 JNS Stream 4 JSA Stream 4
24 0.451 0.441 0.431 0.443 0.437 0.429 0.497 0.460
25 0.445 0.444 0.424 0.461 0.428 0.411 0.498 0.409
26 0.473 0.453 0.448 0.455 0.438 0.420 0.519 0.431
27 0.584 0.484 0.540 0.486 0.476 0.444 0.585 0.497
28 0.579 0.487 0.569 0.485 0.491 0.434 0.462 0.547
29 0.576 0.506 0.542 0.493 0.507 0.435 0.518 0.519
Notes:
4. To allow comparison between JNS and JSA, the number of interviews per fortnight has been adjusted by the number of job seekers who were in service during that fortnight. The actual number of interviews held in any period will depend on the number of job seekers still in service.
Based on interviews attended. See Appendix 1, Section 2 for a description of how new entrant comparisons were made and outcome measures used.
Source: Department of Employment administrative data.
This data is referenced by four figures:
Return to text where Stream 1 data is referenced (Figure 3.4) Return to text where Stream 2 data is referenced (Figure 3.5) Return to text where Stream 3 data is referenced (Figure 3.6) Return to text where Stream 4 data is referenced (Figure 3.7).
192

Table A2.5: Attendance at appointments with providers 2008 to 2012 by quarter for caseload and new entrant populations (per cent)
Year and quarter Caseload based New entrants
2008 quarter 3 55.5 60.0
2008 quarter 4 55.7 59.9
2009 quarter 1 58.0 61.7
2009 quarter 2 56.2 Not available
2009 quarter 3 59.0 Not available
2009 quarter 4 58.3 Not available
2010 quarter 1 58.5 60.5
2010 quarter 2 56.2 58.2
2010 quarter 3 55.6 57.7
2010 quarter 4 54.6 56.5
2011 quarter 1 55.4 56.2
2011 quarter 2 56.2 57.2
2011 quarter 3 57.6 59.1
2011 quarter 4 57.1 58.4
2012 quarter 1 58.4 60.2
2012 quarter 2 57.4 Not available
Notes:
1. The caseload data includes initial interview appointments, whereas the new entrant population excludes initial appointments.
2. There was a gap in the inflow data in 2009 during the transition period between JNS and JSA.
3. See Appendix 1, Section 2 for a description of how new entrant comparisons were made and outcome measures used.
Source: Department of Employment administrative data.
Return to Figure 3.8 where this data is referenced.
193

Table A2.6: Likelihood of obtaining a 26 week employment outcome after previous short-term job placements, Stream 3 and 4 job seekers
Category Reference category Odds RatioLower 95% Confidence
Limit
Upper 95% Confidence
Limit FJNE Not FJNE 1.455 * 1.220 1.736
Stream 4 Stream 3 1.147 * 1.091 1.207Had 1 prior job placement prior to that which lead to 26-week employment outcome
No prior job placements 1.734 * 1.639 1.834
Had 2 prior job placements prior to that which lead to 26-week employment outcome
No prior job placements 2.031 * 1.855 2.224
Had 3 prior job placements prior to that which lead to 26-week employment outcome
No prior job placements 2.407 * 2.070 2.798
Had 4 or more prior job placements prior to that which lead to 26-week employment outcome
No prior job placements 2.461 * 2.035 2.977
Had at least one 13-week outcome that did not lead to 26-week outcome
No prior 13-week outcomes 0.163 * 0.152 0.175
Has a disability No disability or medical condition 0.983 0.910 1.062
Access to transport: Other private transport Own transport 0.821 * 0.759 0.888
Access to transport: Public transport Own transport 0.776 * 0.734 0.821
Access to transport: No transport Own transport 0.777 * 0.695 0.869
Medium disadvantage COB Very low/Low disadvantage COB 1.301 * 1.194 1.418
High disadvantage COB Very low/Low disadvantage COB 1.241 * 1.057 1.456
Stability of residence: Primary/Secondary homeless Stable accommodation 1.003 0.929 1.084
Ex-offender with sentence >1 fortnight Not an ex-offender/minor sentence 0.961 0.868 1.065
Country of birth language: Other than English English 0.942 0.808 1.099
Vocational qualifications not useful Has useful vocational qualifications 1.026 0.882 1.193
No vocational qualifications Has useful vocational qualifications 1.065 * 1.007 1.126
Mixed/Poor English proficiency Good English proficiency 1.153 * 1.060 1.254
194

Category Reference category Odds RatioLower 95% Confidence
Limit
Upper 95% Confidence
Limit Job seeker residence: Low to Moderate disadvantage ESA Very low disadvantage ESA 1.032 0.966 1.103
Job seeker residence: High disadvantage ESA Very low disadvantage ESA 1.076 0.987 1.173
Job seeker residence: Very high/Extreme disadvantage ESA Very low disadvantage ESA 1.112 * 1.006 1.230
Not contactable by phone Contactable by phone 0.948 0.874 1.030
Living circumstances: Single parent Lives alone 1.254 * 1.125 1.398
Living circumstances: Lives with spouse/partner Lives alone 1.084 0.992 1.185
Living circumstances: Other living conditions Lives alone 1.125 * 1.052 1.203
Personal factors from JCA : Low impact/Other No impact 1.050 0.921 1.198
Personal factors from JCA : Medium impact No impact 1.019 0.904 1.150
Personal factors from JCA : High impact No impact 1.056 0.961 1.159
Job seeker history 1: More than one time income support First time income support 0.834 * 0.793 0.877
Job seeker history 2: Crisis payment No crisis payment 0.749 * 0.587 0.957
Recent work experience: Part-time/Seasonal work Full-time 0.807 * 0.753 0.866
Recent work experience: Outside the labour force Full-time 0.787 * 0.738 0.839
Recent work experience: Unemployed Full-time 0.741 * 0.667 0.822
Duration on income support: 12-23 months Less than 12 months 1.106 0.959 1.276
Duration on income support: 24+ months Less than 12 months 1.166 * 1.036 1.313
Duration on income support: No income support Less than 12 months 1.006 0.905 1.118
Indigenous Not indigenous 1.412 0.897 2.223
Indigenous location: Very low disadvantage ESA Not an indigenous labour market ESA 0.667 0.421 1.056
Indigenous location: Low / Medium disadvantage ESA Not an indigenous labour market ESA 0.770 0.487 1.217
Indigenous location: High / Very High disadvantage ESA Not an indigenous labour market ESA 0.703 0.443 1.116Proximity to labour market: Outer regional, remote, very remote or migratory
Metropolitan or inner regional 0.970 0.910 1.034
195

Category Reference category Odds RatioLower 95% Confidence
Limit
Upper 95% Confidence
Limit Income support type: PPS/PPP NSA/YAO 1.191 * 1.061 1.336
Income support type: Other type of income support NSA/YAO 0.921 0.807 1.051
Income support type: Not on income support NSA/YAO 1.154 * 1.092 1.219
Age: 21 to 24 years Under 21 years of age 1.259 * 1.148 1.382
Age: 25 to 34 years Under 21 years of age 1.474 * 1.355 1.603
Age: 35 to 49 years Under 21 years of age 1.662 * 1.531 1.804
Age: 50 to 64 years Under 21 years of age 1.454 * 1.322 1.601
Female/Unknown Male 0.952 0.904 1.003
Highest level of education: Year 10/11 Less than Year 10 1.157 * 1.076 1.245
Highest level of education: Year 12/TAFE/Diploma Less than Year 10 1.436 * 1.328 1.552
Highest level of education: Degree/Post graduate Less than Year 10 1.428 * 1.246 1.637
Number of days registered 0.999 * 0.998 0.999
Note: * indicates significant.
Source: Department of Employment administrative data.
Return to text where data is referenced.
196

Table A2.7: Average time spent by providers with JSA job seekers on initial contact tasks caseload population (per cent)
StreamUp to 15 minutes
16-30 minutes
31-60 minutes
More than one hour
Total
Stream 1: Initial contact and registration 17 47 33 3 100
Stream 1: Initial skills assessment 4 25 59 12 100
Stream 1: First EPP update 10 45 42 3 100
Stream 2 - 3: Initial contact and registration 1 11 70 19 100
Stream 4: Initial contact and registration 0 4 48 47 100
Note: Numbers may not add up due to rounding.
Source: Department of Employment Survey of Employment Service Providers 2010.
Return to Figure 4.2 where this data is referenced.
197

Table A2.8: Differences in EPF expenditure between specialist and generalist JSA providers (per cent)
EPF expenditure category Generalist Specialist Difference
Training - Courses 40.20 32.68 -7.52
Wage Subsidy 12.30 10.82 -1.48
Personal Development 2.11 1.53 -0.58
Vocational Rehabilitation 0.58 0.15 -0.43
Fares and Petrol 1.50 1.15 -0.35
Outreach Services 0.51 0.22 -0.29
Vocational Counselling 1.27 1.12 -0.15
Anger Management 0.07 0.03 -0.04
Goods Transport 0.11 0.08 -0.03
Intensive activity 0.48 0.45 -0.03
Car Repairs & Registration 0.88 0.85 -0.03
Skills assessment tool 0.02 0.00 -0.01
NEIS Additional Support 0.01 0.00 0.00
Furniture Storage 0.02 0.02 0.00
Travel Costs for Training and Activities 0.01 0.01 0.00
Travel Cost to New Location 0.11 0.11 0.00
Overhead Costs 0.00 0.00 0.00
Legal Costs 0.01 0.01 0.00
Short-Term Child Care Assistance 0.01 0.02 0.00
Accommodation Costs for Training and Activities 0.00 0.02 0.01
Family Mediation 0.00 0.02 0.01
Medication and Therapies 0.14 0.16 0.02
Business Support 0.20 0.22 0.02
Financial Advice 0.00 0.03 0.03
Utilities 0.11 0.15 0.04
Short-term Accommodation Assistance 0.17 0.22 0.04
Food 0.12 0.17 0.05
Post Placement Support 1.26 1.34 0.08
Medical, Dental and Optical Costs 0.49 0.61 0.12
Provider Transport Costs 0.13 0.27 0.14
Transport Purchases 0.34 0.49 0.15
Drug and Alcohol Counselling & Rehabilitation 0.09 0.27 0.19
Work-Related Licensing 2.40 2.64 0.24
Rent and Crisis Accommodation 0.79 1.06 0.27
Training - Books & Equipment 1.16 1.44 0.28
Clothing and Presentation 8.84 9.15 0.31
Tools, Computers, Mobile Phones and Equipment 1.21 1.57 0.36Pre-employment Checks &Work-Related Documentation 1.39 1.77 0.38
198

EPF expenditure category Generalist Specialist Difference
Additional Contacts 0.86 1.38 0.52
Interpreter Services 0.76 2.15 1.38
Reverse Marketing 10.14 11.61 1.47
Mental Health Counselling & Support 5.53 7.03 1.49
Driving Lessons 1.76 3.27 1.51
Other 1.92 3.73 1.81
Total 100.00 100.00 0.00
Notes:
1. Numbers may not add up due to rounding.
2. See Appendix 1, Section 3.4 for a description of this analysis.
Source: Department of Employment administrative data.
Return to text where data is referenced.
199

Table A2.9: Proportion of JSA job seekers by Stream in the Work Experience Phase, July 2009 to June 2012, caseload population (per cent)
Month Stream 1 Stream 2 Stream 3 Stream 4
July 2009 0.0 0.0 18.9 1.8August 2009 0.0 0.0 27.6 2.6September 2009 0.0 0.0 31.2 2.7October 2009 0.0 0.0 32.1 2.6November 2009 0.0 0.0 32.2 2.4December 2009 0.0 0.0 32.0 2.3January 2010 0.0 0.0 31.6 2.2February 2010 0.0 0.0 31.1 2.0March 2010 0.0 0.1 30.4 1.9April 2010 0.0 0.3 30.2 1.8May 2010 0.0 0.4 29.8 1.7June 2010 0.1 0.8 29.8 1.6July 2010 1.3 1.8 29.7 1.6August 2010 3.1 3.1 28.8 1.7September 2010 4.4 4.3 29.3 2.0October 2010 5.2 5.3 30.4 2.5November 2010 5.5 6.3 31.3 2.9December 2010 5.3 6.8 31.7 3.2January 2011 5.2 7.7 32.1 4.1February 2011 5.2 8.8 32.3 5.5March 2011 5.3 9.9 32.9 7.1April 2011 5.3 10.7 33.3 8.4May 2011 5.2 11.6 33.6 9.9June 2011 5.2 12.5 34.4 11.3July 2011 5.2 13.2 35.2 12.7August 2011 5.2 14.0 36.2 14.3September 2011 5.2 14.8 36.8 15.5October 2011 5.2 15.3 37.5 16.7November 2011 5.0 15.8 38.1 18.0December 2011 4.6 15.9 38.6 18.9January 2012 4.4 16.1 38.7 20.1February 2012 4.5 16.4 39.0 21.3March 202 4.6 16.6 39.4 22.5April 2012 4.7 17.0 39.6 23.4May 2012 4.9 17.2 40.0 24.7June 2012 4.9 17.2 40.1 25.5
Source: Department of Employment administrative data.
Return to Figure 4.3 where this data is referenced.
200

Table A2.10: Work Experience activities by Stream of service, 1 July 2009 to 30 June 2012 (number)
For those in the Work Experience Phase
Activity type Stream 1 Stream 2 Stream 3 Stream 4 Total
Work for the Dole 6,963 14,124 42,591 10,952 74,630
Green Corps 78 206 1,027 174 1,485
Drought Force 4 25 227 - 256
Voluntary Work in community/non profit sector 1,152 2,394 9,910 1,948 15,404
Brokered Unpaid 98 233 974 137 1,442
Accredited / Non Accredited Education / Training (Vocational) 8,563 22,340 63,768 14,757 109,428
Non Vocational Assistance and Interventions 1,483 3,309 11,284 14,128 30,204
Part-Time/Casual Paid Employment 14,799 23,848 48,781 8,209 95,637
Other Approved Programmes 1,076 3,400 27,066 3,987 35,529
Total 34,216 69,879 205,628 54,292 364,015
For those not in the Work Experience Phase
Activity type Eligibility not yet determined
Stream1 (Limited) Stream 1 Stream 2 Stream 3 Stream 4 Total
Work for the Dole 10 19 5,740 5,604 4,053 4,712 20,138
Green Corps - - 191 199 128 205 723
Drought Force - - 188 214 120 10 532
Voluntary Work in community/non profit sector - 2 6,445 1,286 1,157 769 9,659
Brokered Unpaid 2 9 1,295 940 662 559 3,467
201

Activity type Eligibility not yet determined
Stream1 (Limited) Stream 1 Stream 2 Stream 3 Stream 4 Total
Accredited / Non Accredited Education / Training (Vocational) 101 1,054 100,328 149,557 82,212 74,733 407,985
Non Vocational Assistance and Interventions 21 122 246,521 25,463 12,717 17,099 301,943
Part-Time/Casual Paid Employment 4 44 96,600 3,785 2,082 1,116 103,631
Other Approved Programmes 413 1,928 34,345 42,343 34,537 23,396 136,962
Total 551 3,178 491,653 229,391 137,668 122,599 985,040
Notes:1. Accredited / Non Accredited Education / Training (Vocational) includes:
a. Accredited education and training (Vocational) b. Vocational assistance
2. Non-vocational assistance and interventions includes:a. Non-vocational assistanceb. Training in job search techniquesc. Other non-vocational assistance and interventions.
3. Other approved programmes includes:a. Defence force reserves b. National Green Jobs Corpsc. Referral to a NEIS panel memberd. NEIS traininge. Other approved programmes.
Source: Department of Employment administrative data.
Return to text where data is referenced.
202

Table A2.11: Work Experience activities by age, 1 July 2009 to 30 June 2012 (number)
For those in the Work Experience Phase
Activity Type Under 18 18 - 24 25 - 39 40 - 49 50 - 54 Over 55 Total
Work for the Dole 112 20,035 29,546 19,752 2,979 2,206 74,630
Green Corps 4 467 617 313 45 39 1,485
Drought Force 0 46 107 53 12 38 256
Voluntary Work in community/non profit sector 16 2,616 4,885 4,592 1,027 2,268 15,404
Brokered Unpaid 2 452 560 305 75 48 1,442
Accredited / Non Accredited Education / Training (Vocational) 669 34,195 38,513 23,530 6,954 5,567 109,428
Non Vocational Assistance and Interventions 109 6,664 11,425 7,265 2,549 2,192 30,204
Part-Time/Casual Paid Employment 189 21,877 36,913 27,867 4,849 3,942 95,637
Other Approved Programmes 185 8,068 12,770 8,893 2,994 2,619 35,529
Total 1,286 94,420 135,336 92,570 21,484 18,919 364,015
For those not in the Work Experience Phase
Activity Type Under 18 18 - 24 25 - 39 40 - 49 50 - 54 Over 55 Total
Work for the Dole 1,619 7,508 5,472 3,039 1,184 ,316 20,138
Green Corps 74 330 185 77 34 23 723
Drought Force 8 198 197 62 18 49 532
Voluntary Work in community/non profit sector 196 2,142 2,320 1,714 796 2,491 9,659
Brokered Unpaid 164 1,486 1,034 480 171 132 3,467
203

Activity Type Under 18 18 - 24 25 - 39 40 - 49 50 - 54 Over 55 Total
Accredited / Non Accredited Education / Training (Vocational) 35,411 150,593 117,811 64,205 21,395 18,570 407,985
Non Vocational Assistance and Interventions 8,130 97,094 107,668 53,235 19,803 16,013 301,943
Part-Time/Casual Paid Employment 1,939 29,143 36,246 22,214 8,233 5,856 103,631
Other Approved Programmes 8,940 31,771 46,536 29,255 10,392 10,068 136,962
Total 56,481 320,265 317,469 174,281 62,026 54,518 985,040 Notes:
1. Accredited / Non Accredited Education / Training (Vocational) includes:a. Accredited education and training (Vocational) b. Vocational assistance
2. Non-vocational assistance and interventions includes:a. Non-vocational assistanceb. Training in job search techniquesc. Other non-vocational assistance and interventions.
3. Other approved programmes includes:a. Defence force reserves b. National Green Jobs Corpsc. Referral to a NEIS panel memberd. NEIS traininge. Other approved programmes.
Source: Department of Employment administrative data.
Return to text where data is referenced.
204

Table A2.12: Work Experience activities by activity type (per cent)
Activity Type JNS JSA
Part-Time/Casual Paid Employment 55.4 31.4
Work for the Dole 20.6 17.0
Training in Job Search Techniques 18.1 3.2
Other Approved Programmes 2.0 5.0
Non Vocational Assistance 1.0 0.9
Vocational Assistance 1.0 2.9
Accredited Education and Training (Vocational) 0.7 32.1
NEIS Training 0.4 1.6
Voluntary Work in community/non profit sector 0.4 3.0
Other Non-vocational 0.2 0.7
Defence Force Reserves 0.0 0.1
Interventions 0.0 1.1
Green Corps 0.0 0.6
Unpaid Work Experience 0.0 0.3
Total 100.0 100.0
Notes:
1. This table includes data only for those activities commenced in either the Mutual Obligation phase for JN or the Work Experience Phase (WEPh) for JSA.
2. Numbers may not add up due to rounding.
3. See Appendix 1, Section 3.5 for a description of this analysis.
Source: Department of Employment administrative data.
Return to text where data is referenced.
205
Table A2.13: Demographics of Work Experience Phase participants (per cent)
Age
JN (WEPh) JSA (WEPh) JN (No WEPh) JSA (No WEPh)
Under 21 23.8 31.6 19.7 26.0
21 - 24 17.1 14.6 13.6 15.5
25 -34 26.1 20.5 24.6 22.2
35-49 33.1 27.6 29.9 23.8
50 and over <0.0 5.8 13.3 12.6
Total 100.0 100.0 100.0 100.0
Gender
JN (WEPh) JSA (WEPh) JN (No WEPh) JSA (No WEPh)
Female 43.8 46.7 48.9 47.5
Male 56.2 53.3 51.1 52.5
Total 100.0 100.0 100.0 100.0
Highest level of education JN (WEPh) JSA (WEPh) JN (No WEPh) JSA (No WEPh)
Did not attend school 0.2 0.4 0.2 0.3
Special school <0.0 <0.0 <0.0 <0.0
Less than year 10 8.1 8.1 10.2 6.8
Year 10/11 29.1 21.9 28.7 23.1
Year 12 21.9 18.1 20.6 21.9
Certificate I-IV 21.7 34.1 18.8 25.7
Diploma/Advanced Diploma 8.1 6.3 8.8 7.1
Bachelor 9.1 7.6 11.1 11.2
Graduate 1.4 2.2 1.0 2.1
Post graduate 0.5 1.4 0.5 1.8
Total 100.0 100.0 100.0 100.0
Start Stream
JN (WEPh) JSA (WEPh) JN (No WEPh) JSA (No WEPh)
Stream 1 81.4 60.6 68.2 76.7
Stream 2 15.9 21.6 16.0 15.2
Stream 3 2.3 13.7 13.3 5.0
Stream 4 0.4 4.1 2.5 3.1
Total 100.0 100.0 100.0 100.0
Other characteristics
JN (WEPh) JSA (WEPh) JN (No WEPh) JSA (No WEPh)
CALD 14.5 19.1 16.4 17.0
Disability 5.2 3.7 5.7 4.0
Ex-offender 7.9 6.2 6.7 5.9
206

JN (WEPh) JSA (WEPh) JN (No WEPh) JSA (No WEPh)
Indigenous 3.8 10.7 6.0 5.7
Single parent 5.1 9.8 11.7 7.0
Any of the five categories above 32.8 42.5 39.3 34.9
Notes:
1. This table includes data only for those activities commenced in either the Mutual Obligation phase for JN or the Work Experience Phase (WEPh) for JSA.
2. Numbers may not add up due to rounding.
3. See Appendix 1, Section 3.5 for a description of this analysis.
Source: Department of Employment administrative data.
Return to text where data is referenced.
207
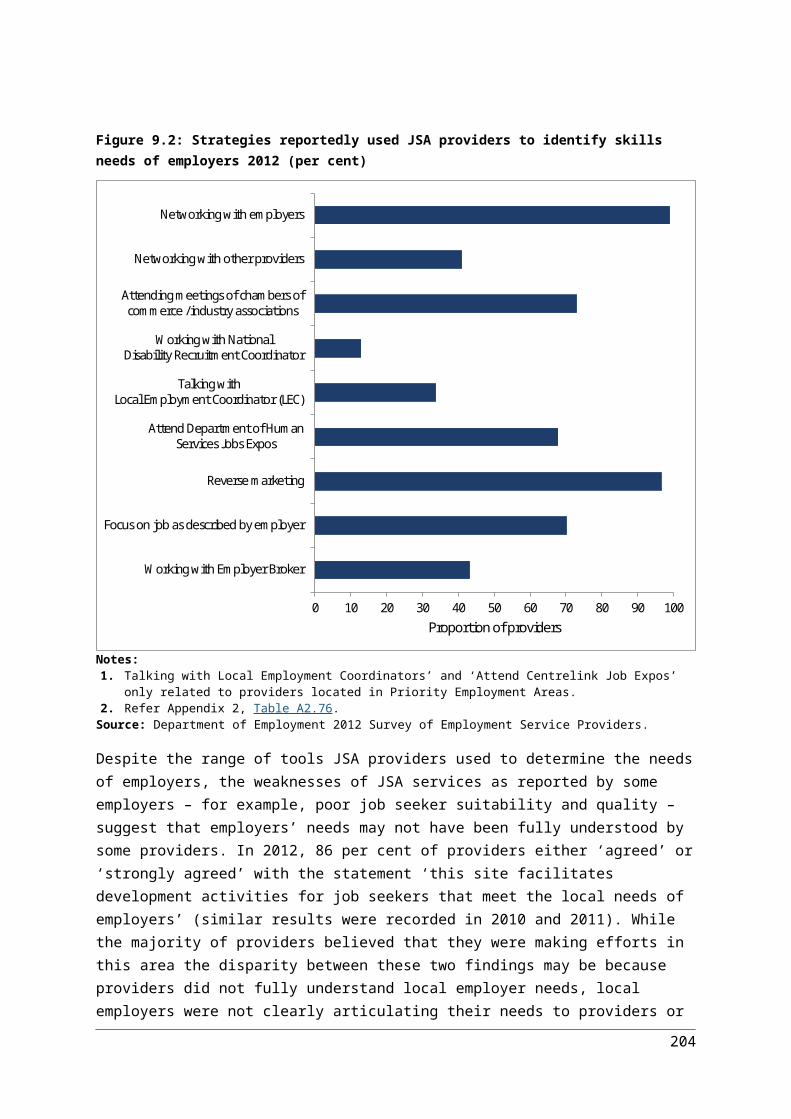
Table A2.14: Weekly exit rates from income support after job seeker commenced in the Work Experience Phase (per cent)
Week Not referred to activity
Did not commence activity
Commenced activity
Already in activity at WEPh start Total
1 1.2 0.2 0.2 0.6 0.42 1.6 0.4 0.3 0.8 0.63 1.7 0.7 0.5 0.8 0.74 1.8 0.7 0.5 0.8 0.75 1.9 0.9 0.6 0.9 0.86 1.7 0.9 0.6 0.8 0.87 1.4 0.8 0.6 0.8 0.88 1.6 0.6 0.6 0.7 0.89 1.2 0.9 0.7 0.8 0.8
10 1.3 0.6 0.7 0.8 0.811 1.4 0.6 0.8 0.9 0.912 1.4 0.5 0.7 0.9 0.813 1.2 1.0 0.7 1.1 0.914 1.1 0.5 0.6 0.7 0.715 0.9 0.8 0.7 0.8 0.716 1.1 0.8 0.7 0.7 0.817 0.9 0.7 0.8 0.8 0.818 1.0 0.3 0.7 0.7 0.719 1.1 0.5 0.8 1.0 0.920 0.9 0.6 0.7 0.7 0.721 0.8 0.5 0.7 0.8 0.722 0.9 0.6 0.7 0.8 0.823 0.9 0.9 0.8 0.9 0.824 0.7 0.6 0.7 0.9 0.725 0.7 0.7 0.8 0.8 0.826 0.8 0.7 0.7 0.8 0.727 0.8 0.5 0.8 0.8 0.828 0.8 0.4 0.7 0.8 0.729 0.6 0.8 0.8 0.8 0.830 0.7 0.6 0.7 0.7 0.731 0.6 0.5 0.8 0.7 0.732 0.6 0.8 0.7 0.7 0.733 0.6 0.7 0.8 0.8 0.734 0.7 0.5 0.7 0.7 0.735 0.5 0.3 0.7 0.6 0.736 0.6 0.6 0.7 0.7 0.737 0.7 0.5 0.7 0.7 0.738 0.5 0.7 0.7 0.8 0.739 0.4 0.6 0.7 0.8 0.740 0.5 0.7 0.7 0.8 0.741 0.4 0.7 0.7 0.5 0.642 0.3 0.4 0.7 0.6 0.643 0.4 0.5 0.7 0.8 0.6
208

Week Not referred to activity
Did not commence activity
Commenced activity
Already in activity at WEPh start Total
44 0.5 0.6 0.7 0.6 0.745 0.5 0.7 0.6 0.9 0.646 0.3 0.5 0.7 0.9 0.647 0.3 0.5 0.7 0.6 0.648 0.3 0.4 0.7 0.6 0.649 0.3 0.6 0.6 1.0 0.650 0.5 0.6 0.7 0.7 0.751 0.2 0.4 0.8 0.7 0.752 0.4 0.5 0.7 0.6 0.653 0.3 0.5 0.7 0.8 0.754 0.3 0.6 0.7 0.5 0.655 0.3 0.5 0.6 0.5 0.656 0.4 0.5 0.6 0.8 0.657 0.3 0.4 0.6 0.9 0.658 0.4 0.5 0.7 0.6 0.659 0.3 0.5 0.6 0.8 0.660 0.3 0.4 0.6 0.6 0.661 0.4 0.4 0.7 0.4 0.662 0.4 0.4 0.6 0.8 0.663 0.4 0.3 0.7 0.6 0.664 0.4 0.5 0.6 0.5 0.565 0.3 0.4 0.5 0.6 0.566 0.4 0.3 0.5 0.5 0.567 0.3 0.5 0.5 0.6 0.568 0.3 0.3 0.5 0.5 0.569 0.4 0.4 0.6 0.5 0.570 0.4 0.4 0.6 0.4 0.571 0.5 0.4 0.6 0.5 0.672 0.4 0.3 0.5 0.5 0.573 0.4 0.2 0.6 0.6 0.574 0.6 0.3 0.5 0.5 0.575 0.4 0.4 0.5 0.5 0.576 0.4 0.3 0.5 0.7 0.577 0.5 0.4 0.6 0.3 0.578 0.5 0.5 0.5 0.6 0.5
Notes:
1. Population: JSA Stream 1-3 job seekers in the Work Experience Phase with a WEAR and in receipt of Income Support.
2. The Work Experience phase generally begins 12 months after commencing services then repeats every 12 months as long as the job seeker has not found employment.
3. See Appendix 1, Section 3.5 for a description of this analysis.
Source: Department of Employment administrative data and Research and Evaluation Database (RED).
Return to text where data is referenced.
209

Table A2.15: Cumulative exits from income support after activity referral (per cent)
Week Did not commence activity
Commenced activity
Already in activity at WEPh start Total
1 1.2 0.5 0.1 0.52 2.8 1.4 0.4 1.33 4.7 2.4 0.8 2.34 6.1 3.4 1.2 3.25 7.3 4.2 1.6 4.06 8.5 5.1 2.1 4.87 9.4 5.9 2.7 5.68 10.1 6.8 3.2 6.49 10.9 7.7 3.6 7.3
10 11.6 8.5 4.1 8.011 12.6 9.5 4.6 8.912 13.4 10.4 5.3 9.713 14.2 11.2 5.8 10.514 14.8 11.9 6.5 11.215 15.5 12.7 7.0 12.016 16.1 13.5 7.6 12.717 16.7 14.2 8.2 13.418 17.2 14.9 8.7 14.019 17.7 15.6 9.1 14.720 18.5 16.4 9.8 15.521 19.3 17.2 10.3 16.222 19.8 17.9 10.8 16.923 20.3 18.6 11.4 17.524 21.2 19.2 11.9 18.225 21.6 19.9 12.5 18.826 22.0 20.5 13.0 19.427 22.3 21.1 13.6 20.028 22.8 21.7 14.2 20.529 23.2 22.3 14.8 21.230 23.7 22.9 15.3 21.831 24.1 23.5 15.8 22.332 24.7 24.0 16.3 22.833 25.1 24.6 16.9 23.434 25.5 25.2 17.5 24.035 25.8 25.8 17.9 24.536 26.1 26.3 18.4 25.037 26.7 26.9 18.9 25.638 27.2 27.4 19.6 26.139 27.5 27.9 20.1 26.640 28.0 28.3 20.7 27.141 28.5 28.9 21.3 27.642 28.8 29.4 21.8 28.143 29.0 29.9 22.5 28.644 29.3 30.3 23.0 29.145 29.6 30.7 23.4 29.5
210

Week Did not commence activity
Commenced activity
Already in activity at WEPh start Total
46 29.9 31.1 24.0 29.947 30.2 31.5 24.6 30.348 30.6 32.0 25.2 30.849 30.9 32.5 25.7 31.350 31.2 32.9 26.3 31.751 31.3 33.4 26.8 32.252 31.7 33.8 27.4 32.653 32.0 34.2 28.0 33.054 32.3 34.6 28.4 33.455 32.5 34.9 28.9 33.856 32.7 35.3 29.5 34.257 32.9 35.7 29.9 34.658 33.1 36.1 30.4 35.059 33.4 36.4 30.9 35.360 33.6 36.8 31.5 35.761 33.9 37.2 31.9 36.162 34.1 37.5 32.5 36.563 34.3 37.9 33.0 36.864 34.6 38.2 33.3 37.265 34.8 38.5 33.8 37.566 35.0 38.8 34.3 37.867 35.1 39.1 34.6 38.168 35.4 39.4 34.9 38.469 35.8 39.7 35.2 38.870 36.1 40.1 35.6 39.171 36.4 40.3 36.1 39.472 36.6 40.6 36.5 39.773 36.8 40.9 36.9 40.074 36.9 41.2 37.3 40.375 37.3 41.5 37.6 40.676 37.4 41.7 38.0 40.877 37.7 41.9 38.3 41.178 37.9 42.2 38.7 41.4
Notes:
1. Population: JSA Stream 1-3 job seekers in the Work Experience Phase with a WEAR and in receipt of Income Support who were referred to a Work Experience Activity within 11 months of commencing the Work Experience Phase or were already in an activity on Work Experience Phase commencement.
2. The Work Experience phase generally begins 12 months after commencing services then repeats every 12 months as long as the job seeker has not found employment.
3. See Appendix 1, Section 3.5 for a description of this analysis.
Source: Department of Employment administrative data and Research and Evaluation Database (RED).
Return to text where data is referenced.
211
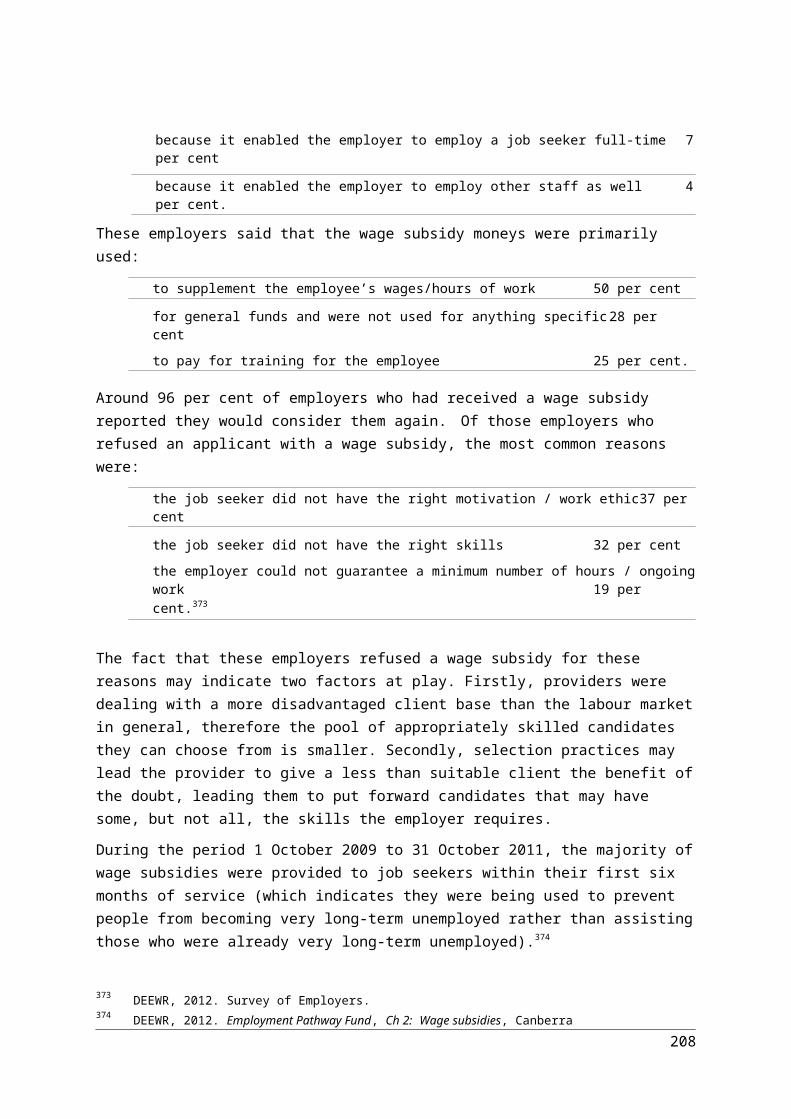
Table A2.16: Weekly exit rates from income support after activity referral, by activity Stream 4 (per cent)
WeekAccredited
Education and Training
Part-time/Casual
Employment
Work for the Dole Other Total
1 0.2 0.8 0.3 0.2 0.32 0.1 1.4 0.5 0.1 0.43 0.2 1.2 0.3 0.2 0.44 0.1 1.5 0.8 0.3 0.55 0.1 1.8 0.3 0.3 0.56 0.1 1.6 0.3 0.3 0.57 0.1 1.2 0.2 0.1 0.38 0.3 0.7 0.4 0.3 0.49 0.1 1.6 0.4 0.2 0.4
10 0.2 0.6 0.1 0.1 0.211 0.2 0.7 0.4 0.3 0.312 0.1 1.2 0.5 0.2 0.413 0.2 1.0 0.4 0.4 0.414 0.4 1.2 0.4 0.3 0.515 0.5 0.8 0.4 0.3 0.416 0.3 0.3 0.2 0.3 0.317 0.2 0.9 0.4 0.1 0.318 0.6 1.2 0.2 0.2 0.419 0.3 1.0 0.2 0.5 0.520 0.2 0.1 0.1 0.3 0.221 0.3 0.1 0.4 0.3 0.322 0.1 0.5 0.5 0.3 0.323 0.4 1.0 0.2 0.4 0.424 0.5 1.3 0.3 0.6 0.625 0.3 0.9 0.1 0.3 0.426 0.4 1.0 0.5 0.3 0.527 0.3 1.1 0.3 0.2 0.428 0.4 0.6 0.2 0.5 0.429 0.5 0.5 0.1 0.3 0.330 0.5 0.3 0.2 0.3 0.331 0.3 0.1 0.6 0.3 0.332 0.6 0.5 0.4 0.2 0.433 0.3 0.9 0.3 0.3 0.434 0.8 0.7 0.5 0.2 0.435 0.4 0.8 0.5 0.4 0.536 0.4 0.4 0.3 0.3 0.337 0.5 0.8 0.4 0.2 0.438 0.3 0.4 0.3 0.2 0.339 0.3 0.8 0.3 0.2 0.340 0.4 1.1 0.1 0.3 0.441 0.3 0.5 0.4 0.3 0.342 0.6 0.3 0.2 0.2 0.343 0.5 0.7 0.2 0.2 0.344 0.4 0.3 0.2 0.4 0.3
212

WeekAccredited
Education and Training
Part-time/Casual
Employment
Work for the Dole Other Total
45 0.3 0.2 0.1 0.3 0.346 0.2 0.2 0.4 0.3 0.347 0.5 0.2 0.3 0.2 0.348 0.4 0.8 0.4 0.2 0.449 0.4 0.6 0.3 0.4 0.450 0.4 0.2 0.2 0.2 0.351 0.3 0.4 0.2 0.3 0.352 0.4 0.4 0.4 0.1 0.353 0.3 0.1 0.1 0.2 0.254 0.4 0.5 0.3 0.4 0.455 0.4 0.6 0.5 0.2 0.456 0.5 0.4 0.4 0.4 0.457 0.3 0.2 0.1 0.4 0.358 0.4 0.2 0.4 0.4 0.459 0.2 0.4 0.1 0.2 0.260 0.3 0.4 0.2 0.1 0.261 0.3 0.5 0.3 0.1 0.262 0.1 0.2 0.3 0.1 0.263 0.3 0.1 0.4 0.1 0.264 0.1 0.6 0.3 0.3 0.365 0.4 0.0 0.2 0.3 0.366 0.3 0.4 0.4 0.1 0.367 0.2 0.3 0.4 0.0 0.268 0.1 0.8 0.3 0.2 0.269 0.1 0.1 0.2 0.2 0.270 0.3 1.3 0.0 0.3 0.471 0.1 0.5 0.5 0.1 0.272 0.3 0.0 0.2 0.1 0.273 0.3 0.3 0.4 0.2 0.274 0.2 0.4 0.3 0.1 0.275 0.3 0.7 0.1 0.2 0.276 0.4 0.3 0.4 0.2 0.377 0.3 0.1 0.4 0.2 0.278 0.2 0.4 0.5 0.1 0.3
Notes: 1. Population: JSA Stream 4 job seekers in the Work Experience Phase with a WEAR and in receipt of Income
Support who were referred to a Work Experience Activity within 11 months of commencing the Work Experience Phase and commenced that activity during that period or were already in an activity on Work Experience Phase commencement.
2. The Work Experience phase generally begins 12 months after commencing services then repeats every 12 months as long as the job seeker has not found employment.
3. See Appendix 1, Section 3.5 for a description of this analysis.
Source: Department of Employment administrative data and Research and Evaluation Database (RED).
Return to text where data is referenced.
213

Table A2.17: Percentage of job seekers in study population who were off Income Support 18 months after referral to a Work Experience activity, Streams 1 to 3 (per cent)
Work Experience activity Per cent
Part-Time or Casual Paid Employment 41.9
Accredited Education and Training 30.2
Work for the Dole 28.9
Other 26.4
Total 32.8
Notes:
1. Population: JSA Stream 1-3 job seekers in the Work Experience Phase with a WEAR and in receipt of Income Support who were referred to a Work Experience Activity within 11 months of commencing the Work Experience Phase or were already in an activity on Work Experience Phase commencement.
2. The Work Experience phase generally begins 12 months after commencing services then repeats every 12 months as long as the job seeker has not found employment.
3. See Appendix 1, Section 3.5 for a description of this analysis.
Source: Department of Employment administrative data and Research and Evaluation Database (RED).
Return to text where data is referenced.
214

Table A2.18: Odds of getting off benefit for different activity groups compared to the Employment activity group, by various subpopulations
Accredited Education and Training
Work for the Dole
Other
Age: Under 21 years 0.644 0.596 0.474
Age: 21-24 years 0.707 0.591 n.a.
Age: 25-34 years 0.758 n.a. 0.614
Age: 35-49 years n.a. 0.744 n.a.
Age: 50 or older n.a. n.a. n.a.
Female 0.807 0.755 0.626
Male 0.660 0.652 0.657
Highest education level: Less than Year 10 0.696 0.565 0.527
Highest education level: Year 10/11 0.698 0.714 0.687
Highest education level: Year 12 n.a. 0.666 n.a.
Highest education level: TAFE/Diploma 0.715 0.749 n.a.
Highest education level: Degree/Post graduate n.a. n.a. n.a.
Start Stream: Stream 1 0.735 0.689 0.605
Start Stream: Stream 2 0.659 0.651 0.517
Start Stream: Stream 3 n.a. n.a. n.a.
Start Stream: Stream 4 n.a. n.a. 0.460
CALD 0.670 0.718 0.539
Disability n.a. n.a. n.a.
Ex-offender n.a. n.a. n.a.
Indigenous n.a. 0.560 0.599
Single Parent n.a. n.a. n.a.
Overall 0.789 0.732 0.715n.a. indicates results were not found to be significant at the 0.01 level.
Note: See Appendix 1, Section 3.5 for a description of this analysis.
Source: Department of Employment administrative data and Research and Evaluation Database (RED).
This data is referenced in more than one location.
Return to discussion about the WEPh where this data is referenced. Return to discussion about Indigenous job seekers where this data is referenced.
215

Table A2.19: Cumulative exits from income support Job Services Australia (JSA) and Job Network Services (JNS) for new entrant populations (per cent)
Weeks on income support JNS JSA
1 0.0 0.02 1.3 1.33 4.0 3.94 5.6 5.35 8.6 7.76 10.3 9.47 13.4 11.98 15.3 13.69 18.3 16.0
10 20.0 17.611 22.8 20.012 24.6 21.513 27.6 23.714 29.3 25.215 32.0 27.216 33.5 28.517 35.8 30.418 37.0 31.519 38.9 33.220 40.0 34.221 41.6 35.722 42.5 36.623 43.9 38.024 44.8 38.825 46.1 40.126 46.9 40.927 48.1 42.028 48.9 42.829 49.9 43.830 50.6 44.531 51.5 45.532 52.1 46.133 53.0 47.034 53.5 47.635 54.3 48.436 54.9 49.037 55.6 49.838 56.1 50.339 56.8 51.040 57.3 51.541 57.8 52.242 58.2 52.643 58.8 53.344 59.1 53.7
216

Weeks on income support JNS JSA
45 59.7 54.346 60.0 54.647 60.5 55.248 60.8 55.649 61.2 56.150 61.4 56.451 61.8 56.952 62.1 57.253 62.5 57.754 62.7 58.055 63.1 58.456 63.3 58.757 63.7 59.158 63.9 59.459 64.2 59.860 64.4 60.061 64.7 60.462 64.9 60.763 65.2 61.164 65.4 61.365 65.7 61.766 65.9 62.067 66.2 62.368 66.4 62.669 66.6 62.970 66.8 63.171 67.1 63.572 67.2 63.773 67.5 64.074 67.6 64.275 67.8 64.576 68.0 64.777 68.2 65.0
Note: See Appendix 1, Section 2 for a description of how new entrant comparisons were made and outcome measures used.
Source: Department of Employment administrative data and Research and Evaluation database (RED).
Return to text where data is referenced.
217

Table A2.20: Estimation of net impact of Job Search Training using the proportion of job seekers off income support by number of weeks since registration
Weeks since registration
Referred to Job Search Training
(per cent)
JN(per cent)
JSA(per cent)
Referral net impact(2)
(ppt difference)
Overall net impact(3)
(ppt difference)
Week 9 13.2 21.6 16.7 -3.5 4.9
Week 13 24.6 31.1 23.4 1.2 7.7
Week 17 34.0 38.9 29.0 4.9 9.9
Week 25 46.1 49.1 38.1 8.0 11.1
Week 45 62.4 63.4 52.9 9.6 10.6
Week 53 65.8 66.5 56.4 9.3 10.0
Week 78 72.3 72.7 64.1 8.2 8.6
Notes:
1. Stream 2 equivalents in Job Network who were referred to Job Search Training (referral only and commenced groups combined).
2. Referral net impact is the difference in off-income support outcomes between Stream 2 equivalent job seekers in Job Network who were referred to Job Search Training (referral only and commenced groups combined) and Assessed Stream 2 in Job Services Australia.
3. Overall net impact is the difference in off-income support outcomes between the entire Stream 2 equivalent group in Job Network and the entire JSA Assessed Stream 2 group.
4. See Appendix 1, Section 3.6 for a description of this analysis.
Source: Department of Employment administrative data and Research and Evaluation Dataset (RED).
Return to text where data is referenced.
218

Table A2.21: Probability of exit from income support – Job Services Australia (JSA) and Job Network Services (JNS) for new entrant populations (probability)
Weeks on income support JNS JSA
1 0.020 0.0192 0.022 0.0203 0.024 0.0204 0.026 0.0225 0.027 0.0236 0.028 0.0237 0.029 0.0238 0.028 0.0239 0.028 0.024
10 0.029 0.02411 0.031 0.02412 0.032 0.02413 0.031 0.02314 0.030 0.02215 0.028 0.02216 0.027 0.02217 0.025 0.02118 0.024 0.02019 0.022 0.01920 0.021 0.01821 0.020 0.01822 0.020 0.01823 0.019 0.01724 0.020 0.01725 0.019 0.01626 0.019 0.01627 0.017 0.01628 0.017 0.01529 0.016 0.01530 0.016 0.01531 0.015 0.01432 0.015 0.01333 0.014 0.01334 0.014 0.01435 0.014 0.01436 0.014 0.01337 0.014 0.01338 0.013 0.01239 0.012 0.01240 0.011 0.01241 0.011 0.01242 0.011 0.01143 0.011 0.010
219

Weeks on income support JNS JSA44 0.010 0.01145 0.010 0.01146 0.009 0.01047 0.009 0.01048 0.009 0.01049 0.009 0.01050 0.009 0.00951 0.009 0.00952 0.008 0.00953 0.008 0.00854 0.008 0.00955 0.008 0.00956 0.008 0.00857 0.007 0.00858 0.007 0.00859 0.007 0.00960 0.007 0.00861 0.007 0.00862 0.007 0.00863 0.007 0.00864 0.007 0.00865 0.007 0.00866 0.007 0.00867 0.007 0.00868 0.007 0.00869 0.006 0.00870 0.006 0.00871 0.006 0.00872 0.006 0.00773 0.006 0.00774 0.006 0.00775 0.006 0.00776 0.006 0.00777 0.006 0.007
Notes:
1. Probability of exit is the probability of a job seeker exiting during a week, given that they were on income support at the beginning of the week.
2. See Appendix 1, Section 2 for a description of how new entrant comparisons were made and outcome measures used.
Source: Department of Employment administrative data and Research and Evaluation database (RED).
Return to Figure 4.5 where this data is referenced.
220
Table A2.22: Probability of exit from income support –JNS by Assessed Stream for new entrant populations (probability)
Weeks on income support Stream 1 Stream 2 Stream 3 Stream 4
1 0.026 0.012 0.005 0.0062 0.029 0.013 0.005 0.0063 0.033 0.014 0.006 0.0064 0.035 0.014 0.006 0.0075 0.037 0.016 0.006 0.0076 0.038 0.016 0.006 0.0077 0.040 0.016 0.006 0.0068 0.040 0.016 0.006 0.0079 0.039 0.018 0.006 0.008
10 0.041 0.018 0.007 0.00811 0.045 0.019 0.006 0.00712 0.046 0.019 0.007 0.00813 0.045 0.020 0.007 0.00714 0.044 0.020 0.006 0.00815 0.042 0.018 0.006 0.00716 0.040 0.019 0.006 0.00617 0.037 0.017 0.006 0.00718 0.036 0.016 0.006 0.00819 0.033 0.015 0.006 0.00820 0.032 0.014 0.006 0.00821 0.031 0.013 0.006 0.00822 0.030 0.014 0.005 0.00723 0.030 0.014 0.006 0.00724 0.030 0.014 0.006 0.00825 0.030 0.015 0.006 0.00726 0.029 0.014 0.006 0.00727 0.027 0.013 0.005 0.00628 0.027 0.012 0.005 0.00729 0.025 0.012 0.006 0.00730 0.025 0.012 0.006 0.00731 0.024 0.012 0.005 0.00632 0.023 0.012 0.005 0.00633 0.022 0.011 0.005 0.00834 0.022 0.011 0.005 0.00835 0.023 0.011 0.005 0.00836 0.023 0.011 0.005 0.00737 0.022 0.011 0.004 0.00638 0.021 0.010 0.004 0.00639 0.019 0.010 0.004 0.00640 0.018 0.010 0.004 0.00741 0.018 0.009 0.004 0.00642 0.018 0.008 0.004 0.00643 0.018 0.008 0.004 0.00644 0.017 0.008 0.004 0.005
221

Weeks on income support Stream 1 Stream 2 Stream 3 Stream 4
45 0.016 0.008 0.004 0.00546 0.015 0.008 0.004 0.00447 0.014 0.007 0.004 0.00448 0.014 0.007 0.004 0.00449 0.014 0.008 0.004 0.00450 0.014 0.007 0.004 0.00451 0.014 0.007 0.004 0.00552 0.014 0.007 0.004 0.00553 0.012 0.007 0.004 0.00554 0.013 0.008 0.003 0.00555 0.012 0.007 0.003 0.00456 0.012 0.007 0.003 0.00457 0.012 0.007 0.003 0.00558 0.012 0.007 0.003 0.00559 0.012 0.007 0.003 0.00560 0.011 0.006 0.003 0.00561 0.011 0.006 0.003 0.00462 0.011 0.006 0.003 0.00563 0.012 0.006 0.003 0.00564 0.012 0.006 0.003 0.00465 0.011 0.006 0.003 0.00466 0.011 0.006 0.003 0.00367 0.011 0.006 0.003 0.00368 0.011 0.006 0.003 0.00469 0.010 0.005 0.003 0.00470 0.010 0.006 0.003 0.00371 0.010 0.005 0.003 0.00472 0.010 0.005 0.003 0.00473 0.009 0.005 0.003 0.00474 0.009 0.005 0.003 0.00475 0.009 0.005 0.003 0.00576 0.009 0.005 0.003 0.004
Notes:
1. Probability of exit is the probability of a job seeker exiting during a week, given that they were on income support at the beginning of the week.
2. See Appendix 1, Section 2 for a description of how new entrant comparisons were made and outcome measures used.
Source: Department of Employment administrative data and Research and Evaluation database (RED).
Return to Figure 4.6 where this data is referenced.
222

Table A2.23: Comparison of new entrant employment and education outcomes, JNS and JSA, Assessed Stream 1
JNS Employment
(per cent)
JNS Education(per cent)
JSA Employment
(per cent)
JSA Education(per cent)
Employment difference
(ppt difference)
Education difference
(ppt difference)Males aged < 25 years 70.8 17.5 65.8 30.7 -5.0 13.2
Males aged 25-49 years 74.8 7.1 73.9 16.1 -0.9 9.0
Males ages 50+ years 68.9 5.5 64.7 6.6 -4.2 1.1
Females aged < 25 years 73.7 21.3 67.7 33.2 -6.0 11.9
Females aged 25-49 years 74.4 13.3 69.9 21.7 -4.5 8.4
Females aged 50+ years 68.1 6.9 62.4 14.8 -5.7 7.9
Job seeker residence - Major city 73.1 13.5 68.1 21.7 -5.0 8.2
Job seeker residence - Inner regional area 69.3 13.3 70.7 21.9 1.4 8.6
Job seeker residence - Other 74.6 8.6 69.5 20.9 -5.1 12.3
Highest level of education: Less than Year 10 62.3 8.1 53.2 21.4 -9.1 13.3
Highest level of education: Year 10/11 70.1 8.9 62.7 17.4 -7.4 8.5
Highest level of education: Year 12 73.3 18.5 66.6 30.0 -6.7 11.5
Highest level of education: TAFE/Diploma 75.3 12.3 71.8 18.0 -3.5 5.7
Highest level of education: Degree/Post-graduate 82.5 14.3 76.5 20.9 -6.0 6.6
No disability 75.3 13.4 72.2 21.6 -3.1 8.2
JCA/ESAt identified disability 46.7 10.5 44.8 24.2 -1.9 13.7
Not single parent 72.4 13.0 68.5 21.7 -3.9 8.7
Single parent 80.2 11.9 74.7 20.7 -5.5 8.8
Did not identify as Indigenous Australian 72.9 13.0 68.9 21.5 -4.0 8.5
223

JNS Employment
(per cent)
JNS Education(per cent)
JSA Employment
(per cent)
JSA Education(per cent)
Employment difference
(ppt difference)
Education difference
(ppt difference)Indigenous 72.7 12.4 59.1 39.3 -13.6 26.9
Job seeker's income support at commencement: NSA/YA(O) 71.0 14.8 67.9 23.5 -3.1 8.7
Job seeker's income support at commencement: PPP/PPS 72.4 11.1 65.3 22.2 -7.1 11.1
Job seeker's income support at commencement: other income support type 61.7 33.5 45.3 32.1 -16.4 -1.4
Job seeker's income support at commencement: not on income support 74.1 10.6 71.9 19.0 -2.2 8.4
Overall Assessed Stream 1 73.0 13.0 68.8 21.7 -4.2 8.7
^ Relative standard error too high to provide reliable estimate
Notes:
1. Outcomes reported 3 months after exit from service by those who exited a period of assistance within twelve months of commencing assistance, and 3 months after reaching twelve months in service for those who participated in a period of assistance for at least twelve months.
2. See Appendix 1, Section 2 for a description of how new entrant comparisons were made and outcome measures used.
Source: Department of Employment Post Programme Monitoring survey.
This data is referenced in several locations.
Return to Figure 5.1 where this data is referenced. Return to Figure 6.2 where this data is referenced. Return to Figure 7.4 where this data is referenced. Return to Figure 7.5 where this data is referenced.
224

Table A2.24: Comparison of new entrant employment and education outcomes, JNS and JSA, Assessed Stream 2
JNS Employment
(per cent)
JNS Education(per cent)
JSA Employment
(per cent)
JSA Education(per cent)
Employment difference
(ppt difference)
Education difference
(ppt difference)Males aged < 25 years 58.6 11.9 56.9 38.6 -1.7 26.7
Males aged 25-49 years 68.8 7.3 57.3 29.6 -11.5 22.3
Males ages 50+ years 59.4 5.0 44.6 9.0 -14.8 4.0
Females aged < 25 years 59.5 24.7 57.5 45.6 -2.0 20.9
Females aged 25-49 years 64.2 14.5 56.1 30.2 -8.1 15.7
Females aged 50+ years 55.9 8.5 39.3 16.8 -16.6 8.3
Job seeker residence - Major city 61.5 11.4 50.4 29.7 -11.1 18.3
Job seeker residence - Inner regional area 62.1 14.2 52.6 27.1 -9.5 12.9
Job seeker residence - Other 62.0 11.7 52.0 21.8 -10.0 10.1
Highest level of education: Less than Year 10 58.6 5.6 34.4 27.6 -24.2 22.0
Highest level of education: Year 10/11 60.3 9.2 47.9 24.9 -12.4 15.7
Highest level of education: Year 12 62.1 18.6 54.1 37.6 -8.0 19.0
Highest level of education: TAFE/Diploma 65.2 13.5 56.7 22.3 -8.5 8.8
Highest level of education: Degree/Post-graduate 68.9 14.6 65.0 26.4 -3.9 11.8
No disability 66.4 12.8 55.2 28.6 -11.2 15.8
JCA/ESAt identified disability 42.9 10.5 31.0 24.4 -11.9 13.9
Not single parent 60.3 11.8 49.5 28.3 -10.8 16.5
Single parent 71.4 12.3 62.5 25.4 -8.9 13.1
Did not identify as Indigenous Australian 61.7 11.7 51.7 27.6 -10.0 15.9
225

JNS Employment
(per cent)
JNS Education(per cent)
JSA Employment
(per cent)
JSA Education(per cent)
Employment difference
(ppt difference)
Education difference
(ppt difference)Indigenous 63.4 19.2 43.8 31.5 -19.6 12.3
Job seeker's income support at commencement: NSA/YA(O) 59.5 14.2 52.3 35.0 -7.2 20.8
Job seeker's income support at commencement: PPP/PPS 63.5 12.3 61.9 25.5 -1.6 13.2
Job seeker's income support at commencement: other income support type 46.9 15.5 45.4 35.2 -1.5 19.7
Job seeker's income support at commencement: not on income support 63.6 9.0 46.0 17.1 -17.6 8.1
Overall Assessed Stream 2 62.1 11.9 51.4 27.9 -10.7 16.0
^ Relative standard error too high to provide reliable estimate
Notes:
1. Outcomes reported 3 months after exit from service by those who exited a period of assistance within twelve months of commencing assistance, and 3 months after reaching twelve months in service for those who participated in a period of assistance for at least twelve months.
2. See Appendix 1, Section 2 for a description of how new entrant comparisons were made and outcome measures used.
Source: Department of Employment Post Programme Monitoring survey.
This data is referenced in several locations.
Return to Figure 5.1 where this data is referenced. Return to Figure 6.2 where this data is referenced. Return to Figure 7.4 where this data is referenced. Return to Figure 7.5 where this data is referenced.
226

Table A2.25: Comparison of new entrant employment and education outcomes, JNS and JSA, Assessed Stream 3
JNS Employment
(per cent)
JNS Education(per cent)
JSA Employment
(per cent)
JSA Education(per cent)
Employment difference
(ppt difference)
Education difference
(ppt difference)Males aged < 25 years 54.7 23.4 ^ 47.6 ^ 24.2
Males aged 25-49 years 57.3 9.9 48.8 28.0 -8.5 18.1
Males ages 50+ years 44.9 8.6 37.3 ^ -7.6 ^
Females aged < 25 years 45.8 27.3 36.5 40.0 -9.3 12.7
Females aged 25-49 years 55.3 15.5 43.8 35.8 -11.5 20.3
Females aged 50+ years 35.7 11.3 38.6 22.2 2.9 10.9
Job seeker residence - Major City 48.2 15.5 37.8 35.8 -10.4 20.3
Job seeker residence - Inner Regional area 51.9 11.3 43.1 25.2 -8.8 13.9
Job seeker residence - Other 52.3 11.8 46.0 32.3 -6.3 20.5
Highest level of education: Less than Year 10 45.6 11.4 27.1 32.7 -18.5 21.3
Highest level of education: Year 10/11 52.4 12.7 37.6 34.6 -14.8 21.9
Highest level of education: Year 12 49.8 19.7 51.9 32.6 2.1 12.9
Highest level of education: TAFE/Diploma 53.1 16.5 46.9 36.0 -6.2 19.5
Highest level of education: Degree/Post-graduate 49.8 14.3 45.6 35.4 -4.2 21.1
No disability 58.6 14.8 44.8 37.5 -13.8 22.7
JCA/ESAt identified disability 27.2 11.0 27.1 21.0 -0.1 10.0
Not single parent 43.1 14.1 39.7 33.2 -3.4 19.1
Single parent 58.5 13.3 44.7 32.1 -13.8 18.8
Did not identify as Indigenous Australian 49.0 13.8 41.5 33.6 -7.5 19.8
227
JNS Employment
(per cent)
JNS Education(per cent)
JSA Employment
(per cent)
JSA Education(per cent)
Employment difference
(ppt difference)
Education difference
(ppt difference)Indigenous 53.5 15.0 39.6 33.3 -13.9 18.3
Job seeker's income support at commencement: NSA/YA(O) 47.3 16.3 38.0 36.0 -9.3 19.7
Job seeker's income support at commencement: PPP/PPS 54.6 15.2 43.9 34.3 -10.7 19.1
Job seeker's income support at commencement: DSP 27.4 18.8 28.1 ^ 0.7 ^
Job seeker's income support at commencement: other income support type 22.9 13.4 37.0 23.0 14.1 9.6
Job seeker's income support at commencement: not on income support 45.7 7.5 38.2 27.2 -7.5 19.7
Overall Assessed Stream 3 49.9 13.8 41.7 33.3 -8.2 19.5
^ Relative standard error too high to provide reliable estimate
Notes:
1. Outcomes reported 3 months after exit from service by those who exited a period of assistance within twelve months of commencing assistance, and 3 months after reaching twelve months in service for those who participated in a period of assistance for at least twelve months.
2. See Appendix 1, Section 2 for a description of how new entrant comparisons were made and outcome measures used.
Source: Department of Employment Post Programme Monitoring survey.
This data is referenced in several locations.
Return to Figure 5.1 where this data is referenced. Return to Figure 6.2 where this data is referenced. Return to Figure 7.4 where this data is referenced. Return to Figure 7.5 where this data is referenced.
228
Table A2.26: Comparison of new entrant employment and education outcomes, JNS and JSA, Assessed Streams 1 to 3
JNS Employment
(per cent)
JNS Education(per cent)
JSA Employment
(per cent)
JSA Education(per cent)
Employment difference
(ppt difference)
Education difference
(ppt difference)
Males aged < 25 years 69.5 17.4 64.0 32.1 -5.5 14.7
Males aged 25-49 years 73.5 7.2 72.2 17.4 -1.3 10.2
Males ages 50+ years 60.0 5.6 58.4 7.5 -1.6 1.9
Females aged < 25 years 69.7 23.0 63.6 36.5 -6.1 13.5
Females aged 25-49 years 66.5 13.4 64.5 24.9 -2.0 11.5
Females aged 50+ years 49.1 8.8 52.1 15.8 3.0 7.0
Job seeker residence - Major city 66.3 12.0 64.4 23.3 -1.9 11.3
Job seeker residence - Inner regional area 63.0 11.6 65.4 23.2 2.4 11.6
Job seeker residence - Other 65.1 11.0 61.3 22.5 -3.8 11.5
Highest level of education: Less than Year 10 53.8 8.8 41.6 25.5 -12.2 16.7
Highest level of education: Year 10/11 63.3 8.8 57.7 19.7 -5.6 10.9
Highest level of education: Year 12 68.9 17.6 63.7 31.3 -5.2 13.7
Highest level of education: TAFE/Diploma 70.5 12.9 69.4 19.0 -1.1 6.1
Highest level of education: Degree/Post-graduate 77.6 13.1 75.0 21.6 -2.6 8.5
No disability 69.9 12.2 68.0 23.4 -1.9 11.2
JCA/ESAt identified disability 39.2 10.6 40.3 23.9 1.1 13.3
Not single parents 65.4 11.9 64.3 23.0 -1.1 11.1
229

JNS Employment
(per cent)
JNS Education(per cent)
JSA Employment
(per cent)
JSA Education(per cent)
Employment difference
(ppt difference)
Education difference
(ppt difference)
Single parents 65.3 12.5 63.5 25.3 -1.8 12.8
Did not identify as Indigenous Australian 65.9 11.6 65.1 22.8 -0.8 11.2
Indigenous 60.2 14.9 45.8 35.3 -14.4 20.4
Job seeker's income support at commencement: NSA/YA(O) 66.9 14.2 64.2 26.0 -2.7 11.8
Job seeker's income support at commencement: PPP/PPS 59.1 14.0 56.0 27.0 -3.1 13.0
Job seeker's income support at commencement: other income support type 46.9 18.0 45.1 32.8 -1.8 14.8
Job seeker's income support at commencement: not on income support 59.1 14.0 56.0 27.0 -3.1 13.0
Overall Assessed Streams 1 to 3 65.7 11.8 64.2 23.2 -1.5 11.4
^ Relative standard error too high to provide reliable estimate
Notes:
1. Outcomes reported 3 months after exit from service by those who exited a period of assistance within twelve months of commencing assistance, and 3 months after reaching twelve months in service for those who participated in a period of assistance for at least twelve months.
2. See Appendix 1, Section 2 for a description of how new entrant comparisons were made and outcome measures used.
Source: Department of Employment Post Programme Monitoring survey.
This data is referenced in several locations.
Return to Figure 5.1 where this data is referenced. Return to Figure 6.2 where this data is referenced. Return to Figure 7.4 where this data is referenced. Return to Figure 7.5 where this data is referenced.
230

Table A2.27: Off NSA/YA(O) rates one year after exit from service, JNS compared with JSA (per cent)
Off benefit at 52 weeks JNS JSA Difference
Assessed Stream 1 90.1 88.5 -1.6Assessed Stream 2 85.8 85.2 -0.5Assessed Stream 3 80.6 79.1 -1.5Assessed Stream 4 75.1 75.5 0.3Under 21 years 88.6 84.7 -3.921-24 years 91.8 90.7 -1.025-34 years 89.0 88.9 -0.135-49 years 87.6 86.9 -0.650-64 years 88.2 86.0 -2.2Females 90.9 89.1 -1.8Males 87.7 86.4 -1.3Job seeker residence: Major city 89.7 88.3 -1.4Job seeker residence: Inner regional Australia 88.2 86.7 -1.5
Job seeker residence: Outer regional Australia 87.6 85.7 -1.9
Job seeker residence: Remote Australia 84.8 84.3 -0.5Job seeker residence: Very remote Australia 80.2 84.5 4.3
Less than Year 10 81.7 79.5 -2.1
Year 10/11 85.6 82.7 -2.9
Year 12 90.7 88.3 -2.4TAFE/Diploma/degree or higher 92.3 90.3 -2.0No disability 89.7 88.9 -0.8JCA/ESAt identified disability 77.5 73.8 -3.8Did not identify as Indigenous 89.5 88.1 -1.4Indigenous 79.7 78.9 -0.8Not single parents 89.1 87.7 -1.5Single parents 86.1 87.3 1.2Total 89.1 87.7 -1.4
Notes:
1. Numbers may not add up due to rounding.
2. See Appendix 1, Section 2 for a description of how new entrant comparisons were made and outcome measures used.
Source: Department of Employment administrative data and Research and Evaluation dataset (RED).
Return to Streams 1 to 3 job seeker discussion where this data is referenced.
Return to Stream 4 job seeker discussion where this data is referenced.
231

Table A2.28: Off income support rates one year after exit from service, JNS compared with JSA (per cent)
JNS JSA DifferenceAssessed Stream 1 80.6 75.8 -4.8Assessed Stream 2 62.5 55.7 -6.8Assessed Stream 3 38.4 30.3 -8.1Assessed Stream 4 57.1 43.8 -13.3Under 21 years 70.9 60.2 -10.721-24 years 80.0 76.1 -3.925-34 years 75.1 72.6 -2.535-49 years 73.0 71.7 -1.350-64 years 67.5 62.7 -4.8Females 67.2 63.5 -3.8Males 80.2 75.0 -5.3Job seeker residence: Major city 75.4 71.0 -4.4Job seeker residence: Inner regional Australia 71.6 66.4 -5.2
Job seeker residence: Outer regional Australia 71.7 65.2 -6.5
Job seeker residence: Remote Australia 69.3 64.6 -4.7Job seeker residence: Very remote Australia 64.8 62.4 -2.4
Less than Year 10 61.5 50.1 -11.5Year 10/11 69.3 62.1 -7.2Year 12 74.2 66.2 -7.9TAFE/Diploma/degree or higher 80.9 76.7 -4.2No disability 75.9 71.7 -4.2JCA/ESAt identified disability 43.6 43.6 0.0Did not identify as Indigenous 74.7 70.3 -4.4Indigenous 59.8 52.0 -7.8Not single parents 77.2 71.6 -5.6Single parents 43.7 41.7 -2.0Total 74.0 69.3 -4.7
Notes:
1. Numbers may not add up due to rounding.
2. See Appendix 1, Section 2 for a description of how new entrant comparisons were made and outcome measures used.
Source: Department of Employment administrative data and Research and Evaluation dataset (RED).
Return to Streams 1 to 3 job seeker discussion where this data is referenced.
Return to Stream 4 job seeker discussion where this data is referenced.
232

Table A2.29: Average reliance on income support one year after exit from service, JNS compared with JSA (average rate)
JNS JSA DifferenceAssessed Stream 1 15.2 18.8 3.6Assessed Stream 2 28.2 35.8 7.6Assessed Stream 3 48.6 60.1 11.5Assessed Stream 4 38.8 49.0 10.2Females, Under 21 years 29.2 38.0 8.8Males, Under 21 years 20.4 29.7 9.4Females, 21-24 years 20.5 23.2 2.6Males, 21-24 years 13.2 15.2 2.0Females, 25-34 years 27.5 32.1 4.6Males, 25-34 years 14.0 15.5 1.5Females, 35-49 years 26.3 30.5 4.2Males, 35-49 years 14.9 16.4 1.6Females 50-64 years 29.8 35.1 5.3Males 50-64 years 22.7 27.1 4.4Females 26.3 31.6 5.3Males 16.0 20.1 4.1Job seeker residence: Major city 19.3 23.4 4.0Job seeker residence: Inner regional Australia 21.6 26.3 4.7
Job seeker residence: Outer regional Australia 21.2 26.9 5.7
Job seeker residence: Remote Australia 23.1 27.4 4.2Job seeker residence: Very remote Australia 25.4 30.1 4.8
Less than Year 10 30.1 42.4 12.3Year 10/11 23.8 30.9 7.1Year 12 20.4 27.2 6.9TAFE/Diploma/Degree or higher 14.4 17.7 3.3No disability 18.4 22.0 3.6JCA/ESAt identified disability 48.8 50.8 2.0Does not identify as Indigenous 20.6 25.2 4.7Indigenous 30.7 36.3 5.7Not single parents 17.8 22.4 4.6Single parents 41.4 48.7 7.3Total 21.0 25.9 4.9
Notes:
1. Numbers may not add up due to rounding.
2. See Appendix 1, Section 2 for a description of how new entrant comparisons were made and outcome measures used.
Source: Department of Employment administrative data and Research and Evaluation dataset (RED).
Return to text where data is referenced.
233

Table A2.30: Odds of getting a job placement within 18 months of registration commencement under JSA compared to JNS for those assessed as Stream 4 type new entrant job seekers
Odds ratio 95% lower limit 95% upper limit
Male 2.906** 2.520 3.352
Female 3.017** 2.578 3.531
Total aged <21 years 2.015** 1.708 2.377
Total aged 21-24 years 2.446** 1.551 3.859
Total aged 25-34 years 3.632** 2.781 4.744
Total aged 35-49 years 4.593** 3.662 5.762
Total aged 50+ years 4.484** 2.813 7.146
Male aged <25 years 2.128** 1.726 2.624
Male aged 25-34 years 3.032** 2.194 4.191
Male aged 35+ years 4.466** 3.391 5.883
Female aged <25 years 1.936** 1.553 2.414
Female aged 25-34 years 5.105** 3.077 8.470
Female aged 35+ years 4.481** 3.318 6.051
Job seeker residence - Major City 3.234** 2.822 3.705
Job seeker residence - Inner regional Australia 2.758** 2.210 3.441
Job seeker residence - Other 2.241** 1.716 2.927
No JCA/ESAt identified disability 2.857** 2.524 3.233
JCA/ESAt identified disability 3.197** 2.606 3.922
Very low or low disadvantage country of birth 3.042** 2.728 3.392
Medium to very high disadvantage country of birth 2.898** 1.979 4.243
Not single parents 2.730** 2.450 3.041
Single parents 7.217** 4.510 11.549
Does not identify as Indigenous 3.142** 2.804 3.521
Indigenous 2.071** 1.561 2.747
234

Odds ratio 95% lower limit 95% upper limit
Job seeker’s income support at registration – on NSA/YA(O) 2.517** 2.210 2.865
Job seeker’s income support at registration - not on NSA/YA(O) 3.970** 3.299 4.778
Overall Stream 4 2.980** 2.683 3.310
** Significant difference found between the two models at the 95 per cent confidence level.
Notes:
1. Each row in the above table is derived from a separate logistic regression for the sub-group shown in column one, controlling for job seeker, local labour market and macroeconomic factors.
2. See Appendix 1, Section 2 for a description of how new entrant comparisons were made and outcome measures used.
Source: Department of Employment administrative data.
This data is referenced in several locations.
Return to discussion of Stream 4 outcomes where this data is referenced.\ Return to discussion of single parents where this data is referenced. Return to discussion of those with disability where this data is referenced. Return to discussion about mature age job seekers where this data is referenced. Return to discussion about youth where this data is referenced. Return to discussion about Indigenous job seekers where this data is referenced.
235

Table A2.31: Odds of getting a 13-week employment outcome of registration commencement under JSA compared to JNS for those assessed as Stream 4 type new entrant job seekers
Odds ratio 95% lower limit 95% upper limit
Male 3.379** 2.803 4.073
Female 3.347** 2.699 4.151
Total aged <21 years 3.599** 2.789 4.646
Total aged 21-24 years 1.911** 1.143 3.195
Total aged 25-34 years 2.780** 2.021 3.824
Total aged 35-49 years 3.603** 2.756 4.710
Total aged 50+ years 4.020** 2.283 7.078
Male aged <25 years 3.430** 2.529 4.653
Male aged 25-34 years 2.669** 1.815 3.924
Male aged 35+ years 3.807** 2.745 5.281
Female aged <25 years 3.170** 2.281 4.405
Female aged 25-34 years 2.816** 1.564 5.070
Female aged 35+ years 3.470** 2.420 4.975
Job seeker residence - Major City of Australia 3.619** 3.030 4.322
Job seeker residence - Inner Regional Australia 3.413** 2.514 4.633
Job seeker residence - other 2.508** 1.730 3.635
No JCA/ESAt identified disability 3.577** 3.030 4.222
JCA/ESAt identified disability 2.843** 2.173 3.720
Very low or low disadvantage country of birth 3.496** 3.018 4.049
Medium to very high disadvantage country of birth 3.646** 2.241 5.930
Not a single parent 3.416** 2.954 3.951
Single parent 3.978** 2.258 7.008
Does not identify as Indigenous 3.701** 3.190 4.294
Indigenous 2.087** 1.380 3.156
236
Odds ratio 95% lower limit 95% upper limit
Job seeker’s income support at registration - NSA/YA(O) 2.848** 2.401 3.379
Job seeker’s income support at registration - not on NSA/YA(O) 4.849** 3.752 6.265
Overall Stream 4 3.406** 2.960 3.920
** Significant difference found between the two models at the 95 per cent confidence level.
Notes:
1. Each row in the above table is derived from a separate logistic regression for the sub-group shown in column one, controlling for job seeker, local labour market and macroeconomic factors.
2. See Appendix 1, Section 2 for a description of how new entrant comparisons were made and outcome measures used.
Source: Department of Employment administrative data.
This data is referenced in several locations.
Return to discussion of Stream 4 outcomes where this data is referenced. Return to discussion of single parents where this data is referenced. Return to discussion of those with disability where this data is referenced. Return to discussion about mature age job seekers where this data is referenced. Return to discussion about youth where this data is referenced. Return to discussion about Indigenous job seekers where this data is referenced.
237

Table A2.32: Comparison of programme effect on the likelihood of leaving income support 18 months after registration (for all new entrant analysed groups)
Odds ratio (JSA/JNS)
95% Wald lower limit
95% Wald upper limit
Wald test p
JSA/JNS 0.79 0.78 0.80 <.0001
Stream 1 0.74 0.73 0.75 <.0001
Stream 2 0.67 0.65 0.69 <.0001
Stream 3 0.85 0.81 0.89 <.0001
Stream 4 1.22 1.13 1.32 <.0001
Off income support 0.96 0.94 1.00 0.0223
Newstart Allowance 0.76 0.75 0.78 <.0001
Youth Allowance (Other) 0.70 0.68 0.72 <.0001
Youth Allowance (Student) 0.64 0.57 0.72 <.0001
Parenting Payment Partnered 0.84 0.78 0.91 <.0001
Parenting Payment Single 0.68 0.65 0.72 <.0001
Other income support 0.86 0.78 0.94 0.0007
Disability Support Pension 0.95 0.73 1.23 0.6714
Income support zero rate 0.96 0.93 0.98 0.002
Income support part rate 0.70 0.68 0.72 <.0001
Income support full rate 0.77 0.76 0.78 <.0001
Male aged under 21 years 0.78 0.75 0.81 <.0001
Female/unknown aged under 21 years 0.77 0.74 0.79 <.0001
Male aged 21 to 24 years 0.71 0.68 0.74 <.0001
Female/unknown aged 21 to 24 years 0.72 0.69 0.75 <.0001
Male aged 25 to 34 years 0.81 0.79 0.84 <.0001
Female/unknown aged 25 to 34 years 0.82 0.79 0.85 <.0001
Male aged 35 to 49 years 0.81 0.78 0.83 <.0001
Female/unknown aged 35 to 49 years 0.74 0.72 0.76 <.0001
Male aged 50 or more years 0.89 0.85 0.93 <.0001
Female/unknown aged 50 or more years 0.83 0.79 0.87 <.0001
Job seeker residence: Inner Regional 0.80 0.78 0.82 <.0001
Job seeker residence: Major City 0.77 0.76 0.78 <.0001
Job seeker residence: Outer Regional 0.83 0.80 0.86 <.0001
Job seeker residence: Remote 0.88 0.80 0.97 0.0122
Job seeker residence: Very Remote 1.01 0.89 1.15 0.9087
Country of birth - low disadvantage 0.79 0.78 0.80 <.0001
Country of birth - moderate disadvantage 0.74 0.72 0.77 <.0001
Country of birth - high disadvantage 0.82 0.76 0.89 <.0001
JCA/ESAt assessed disability - no 0.79 0.78 0.80 <.0001
JCA/ESAt assessed disability - yes 1.08 1.05 1.12 <.0001
238

Odds ratio (JSA/JNS)
95% Wald lower limit
95% Wald upper limit
Wald test p
Personal impact - no 0.78 0.77 0.79 <.0001
Personal impact - low/medium 0.90 0.83 0.98 0.0141
Personal impact - high 1.13 1.02 1.24 0.0155
Activity tested 0.76 0.75 0.77 <.0001
Volunteer 0.82 0.80 0.83 <.0001
Past duration on income support 0-12 months 0.79 0.78 0.80 <.0001
Past duration on income support >12 months 0.63 0.61 0.66 <.0001
Education: Less than Year 10 0.90 0.87 0.94 <.0001
Education: Year 10 to 11 0.85 0.83 0.86 <.0001
Education: Year 12 0.84 0.82 0.86 <.0001
Education: Higher than Year 12 0.74 0.72 0.75 <.0001
Useful vocational qualifications 0.79 0.77 0.81 <.0001
Not useful vocational qualifications 0.76 0.70 0.82 <.0001
No vocational qualifications 0.83 0.82 0.84 <.0001
Contactable by phone 0.79 0.78 0.80 <.0001
Not contactable by phone 0.94 0.90 0.99 0.0165
Own transport 0.93 0.91 0.94 <.0001
Other private transport 0.81 0.78 0.85 <.0001
Public transport 0.65 0.63 0.66 <.0001
No transport 0.74 0.69 0.80 <.0001
Does not Identify as Indigenous 0.79 0.78 0.80 <.0001
Identifies as Indigenous 0.91 0.86 0.95 <.0001
Not single parent 0.80 0.79 0.81 <.0001
Single parent 0.70 0.68 0.73 <.0001
Male 0.80 0.79 0.81 <.0001
Female/Unknown 0.77 0.76 0.79 <.0001
Under 21 years 0.77 0.75 0.79 <.0001
21 to 24 years 0.71 0.69 0.74 <.0001
25 to 34 years 0.82 0.80 0.84 <.0001
35 to 49 years 0.77 0.75 0.79 <.0001
50 or more years 0.86 0.83 0.88 <.0001
Note: See Appendix 1, Section 2 for a description of how new entrant comparisons were made and outcome measures used.Source: Department of Employment administrative data and Research and Evaluation dataset (RED).This data is referenced in several locations.
Return to discussion of Stream 4 outcomes where this data is referenced. Return to discussion of single parents where this data is referenced. Return to discussion of those with disability where this data is referenced.
239

Table A2.33: Off income support rates at different JSCI scores –predicted and actual for Streams 1 to 3 (per cent)
JSCI score Actual Predicted Stream 1
Predicted Stream 2
Predicted Stream 3
10
80.8
84.0
na
na
11
79.6
80.1
na
na
12
76.4
76.3
na
na
13
73.9
72.4
na
na
14
71.4
68.6
na
na
15
67.4
64.8
na
na
16
61.4
60.9
na
na
17
56.6
57.1
na
na
18
51.3
53.2
na
na
19
48.0
49.4
na
na
20
60.4
45.6
59.9
na
21
54.7
na
56.9
na
22
54.3
na
54.0
na
23
52.4
na
51.0
na
24
47.3
na
48.1
na
25
47.5
na
45.1
na
264
2.na
42.
na
240

JSCI score Actual Predicted Stream 1
Predicted Stream 2
Predicted Stream 3
2 1
27
38.1
na
39.2
na
28
35.7
na
36.2
na
29
42.8
na
33.2
41.1
30
37.5
na
na
38.7
31
36.8
na
na
36.2
32
30.2
na
na
33.8
33
33.8
na
na
31.4
34
28.5
na
na
29.0
35
27.2
na
na
26.6
36
24.1
na
na
24.2
37
21.9
na
na
21.8
na – Not applicableNote: See Appendix 1, Section 3.7 for a description of this analysis.Source: Department of Employment administrative data and Research and Evaluation database (RED).Return to Figure 5.2 where data is referenced.
241
Table A2.34: Average expenditure per job seeker in the first 12 months of JSA service by JSCI score ($)
JSCI score EPF expenditure Non EPF expenditure
10 19.8 458.7
11 20.0 457.7
12 19.8 475.2
13 23.8 494.0
14 24.7 504.9
15 28.2 527.5
16 30.6 543.1
17 37.5 575.9
18 44.9 592.4
19 48.5 623.8
20 300.7
1,161.5
21 310.8
1,145.8
22 307.3
1,157.9
23 277.5
1,170.2
24 327.8
1,159.5
25 316.7
1,154.6
26 329.5
1,163.8
27 320.1
1,122.7
28 316.2
1,088.6
29 454.2
1,622.2
30 577.8
1,558.6
31 392.3
1,530.7
32 349.5
1,517.7
33 309.7
1,339.6
34 426.6
1,503.3
35 311.5
1,442.1
36 319.2
1,410.8
37 298.9
1,351.3
Note: See Appendix 1, Section 2 for a description of how new entrant comparisons were made and outcome measures used.Source: Department of Employment administrative data.Return to Figure 5.3 where this data is referenced.
242
Table A2.35: Average expenditure per job seeker in the first 12 months of JNS service by JSCI score ($)
JSCI score JSKA expenditure Non JSKA expenditure
10 247.0 370.3
11 270.6 365.5
12 263.9 374.6
13 256.9 381.4
14 261.0 389.4
15 281.8 394.0
16 287.9 407.8
17 271.6 428.3
18 292.2 447.5
19 322.1 452.1
20 305.8 465.1
21 349.4 487.9
22 340.5 523.6
23 341.9 550.3
24 383.7 587.7
25 391.2 638.4
26 788.0 1,932.2
27 812.6 1,965.1
28 864.5 1,792.5
29 825.1 1,814.5
30 716.7 1,822.7
31 717.4 1,719.4
32 794.9 1,522.2
33 854.8 1,400.5
34 902.5 1,319.5
35 850.7 1,428.6
36 698.6 1,427.3
37 788.1 1,239.4
Note:1. 26 marked the boundary for clients being considered highly disadvantaged in JNS. There was a completely different
expenditure pattern for these clients.2. See Appendix 1, Section 2 for a description of how new entrant comparisons were made and outcome measures used.Source: Department of Employment administrative data.Return to Figure 5.4 where this data is referenced.
243

Table A2.36: Regression predicting non-completion of study by characteristics at time of starting training course
Category Reference category Odds ratio Lower limit Upper limit
Age: 21-30 Under 21 1.10 0.78 1.54
Age: 31-45 Under 21 1.00 0.66 1.50
Age: 46+ Under 21 1.23 0.77 1.97
Male Female 1.03 0.85 1.24
Lives with children aged under 16 :Youngest aged 0-4 No children 1.52 1.14 2.02
Lives with children aged under 16 :Youngest aged 5-10 No children 1.32 0.98 1.77
Lives with children aged under 16 :Youngest aged 11-16 No children 1.21 0.91 1.60
Has a partner Does not have a partner 0.95 0.72 1.26
Indigenous Did not identify as Indigenous 0.87 0.64 1.18
Interviewed in language other than English Interviews in English 1.07 0.54 2.12
Highest education: University Year 12 0.56 0.40 0.80
Highest education: Diploma Year 12 0.65 0.44 0.95
Highest education : Certificate 3 or 4 Year 12 0.44 0.32 0.59
Highest education: Certificate 1 or 2 Year 12 0.85 0.59 1.21
244

Category Reference category Odds ratio Lower limit Upper limit
Highest education: <Year 12 Year 12 1.88 1.44 2.45
Highest education: Other Year 12 5.82 0.89 38.28
Housing tenure : Public rental Private rental 0.99 0.69 1.41
Housing tenure : Paying mortgage Private rental 0.73 0.47 1.14
Housing tenure : Owned outright Private rental 0.73 0.42 1.28
Housing tenure : No fixed address Private rental 0.90 0.56 1.44
Housing tenure : Life tenure Private rental 0.97 0.74 1.26
Housing tenure : Other Private rental 0.36 0.07 1.92
Time in current home : Less than 1 month 10 or more years 1.16 0.73 1.84
Time in current home : 1-6 months 10 or more years 1.24 0.92 1.67
Time in current home : 6-12 months 10 or more years 0.82 0.59 1.14
Time in current home : 1-4 years 10 or more years 1.03 0.77 1.36
Time in current home : 5-9 years 10 or more years 1.45 1.03 2.04
Remoteness: Accessible Highly accessible 1.22 0.96 1.55
Remoteness: Moderately Accessible Highly accessible 1.49 0.98 2.27
245

Category Reference category Odds ratio Lower limit Upper limit
Remoteness: Remote Highly accessible 1.42 0.71 2.82
Remoteness: Very Remote Highly accessible 1.03 0.29 3.71
Transport situation: Sometimes have difficulty getting to the places
Can easily get places needed 1.19 0.97 1.46
Transport situation: Often have difficulty getting to places needed
Can easily get places needed 1.36 1.02 1.80
Transport situation: Can't get to the places needed/never leave the house
Can easily get places needed 2.43 1.34 4.38
Difficulty due to health: A little bit Not at all 1.11 0.87 1.42
Difficulty due to health: Some Not at all 1.02 0.75 1.40
Difficulty due to health: Quite a lot Not at all 1.37 0.90 2.07
Difficulty due to health: Could not do daily work Not at all 1.42 0.66 3.07
Difficulty due to emotional problems: Very little Not at all 1.24 0.99 1.56
Difficulty due to emotional problems: Somewhat Not at all 1.52 1.18 1.98
Difficulty due to emotional problems: Quite a lot Not at all 1.87 1.35 2.59
Difficulty due to emotional problems: Could not do daily activities
Not at all 2.71 1.29 5.69
Is a carer Is not a carer 1.03 0.74 1.43
Labour force status: Unemployed Employed 1.06 0.86 1.30
246

Category Reference category Odds ratio Lower limit Upper limit
Labour force status: Not in labour force Employed 1.00 0.77 1.30
Stepping Stones Wave 4 Wave 3 0.90 0.72 1.12
Stepping Stones Wave 5 Wave 3 0.72 0.51 1.03
Benefit type: Disability Support Pension No benefit 1.45 0.48 4.43
Benefit type: Newstart Allowance No benefit 1.04 0.73 1.48
Benefit type: Parenting Payment Partnered No benefit 0.73 0.27 1.97
Benefit type: Parenting Payment Single No benefit 0.97 0.58 1.64
Benefit type: Wife Allowance No benefit 1.22 0.63 2.37
Benefit type: Youth allowance No benefit 1.14 0.83 1.57
Benefit type: Other No benefit 1.10 0.50 2.41
In contact with JSA Not in contact with JSA 1.00 0.76 1.31
JSCI score 1.00 0.99 1.01
Previous education level: University Less than Year 12 1.23 0.76 1.98
Previous education level: Diploma Less than Year 12 1.09 0.67 1.78
Previous education level: Certificate III or IV Less than Year 12 0.84 0.55 1.28
247

Category Reference category Odds ratio Lower limit Upper limit
Previous education level: Certificate I or II Less than Year 12 0.42 0.27 0.65
Notes:1. The unit of analysis is a course. Respondents could be included multiple times if they had undertaken multiple courses during the study. 2. Analysis conducted by the Social Research Centre for the Department of Employment in June 2012.3. See Appendix 1, Section 3.2 for a description of this analysis.
Source: Stepping Stones survey data, Cohort 2, waves 3 to 6, collected between April 2009 and December 2010, and Department of Employment administrative data. Return to text where data is referenced.
248

Table A2.37: Effect on employment success of behavioural factors controlling for socio-demographic effects
Category Reference category Odds RatioLower 95% confidence
limit
Upper 95% confidence
limit
Age: 21-30 Under 21 1.08 0.81 1.44
Age: 31-40 Under 21 1.14 0.81 1.59
Age: 41-54 Under 21 1.19 0.84 1.69
Age: 55+ Under 21 0.52 0.32 0.84
Male Female 1.35 1.11 1.63
Interviewed in language other than English Interviewed in English 0.24 0.11 0.53
Highest education: Degree or higher Year 10 1.41 0.99 2.01
Highest education: Diploma Year 10 1.08 0.74 1.57
Highest education: Certificate III or IV Year 10 1.22 0.90 1.65
Highest education: Certificate I or II Year 10 1.30 0.92 1.83
Highest education: Year 12 Year 10 1.46 1.09 1.96
Highest education: Year 11 Year 10 1.01 0.69 1.50
Highest education: Junior Secondary or below Year 10 1.15 0.71 1.86
Highest education: Miscellaneous Year 10 1.56 0.71 3.43
Financial Hardship: 1 adverse event No adverse events 1.14 0.88 1.47
Financial Hardship: 2 adverse events No adverse events 1.23 0.92 1.64
Financial Hardship: 3 adverse events No adverse events 1.18 0.87 1.58
Financial Hardship: 4 adverse events No adverse events 1.01 0.70 1.47
Financial Hardship: 5 adverse events No adverse events 0.72 0.45 1.13
249

Category Reference category Odds RatioLower 95% confidence
limit
Upper 95% confidence
limit
Financial Hardship: 6 adverse events No adverse events 0.68 0.39 1.18
Housing tenure: Public housing rental Private rental/board 0.70 0.49 0.99
Housing tenure: Buying home Private rental/board 1.63 1.18 2.24
Housing tenure: Own outright Private rental/board 1.07 0.69 1.65
Housing tenure: No fixed address Private rental/board 0.66 0.44 1.00
Housing tenure: Living rent free/life tenure Private rental/board 1.26 0.92 1.73
Housing tenure: Other Private rental/board 0.64 0.30 1.37
Time in current home: Less than one month 10 or more years 0.88 0.54 1.43
Time in current home: 1 to 6 months 10 or more years 0.89 0.54 1.46
Time in current home: 6 to 12 months 10 or more years 0.74 0.46 1.19
Time in current home: 1 to 5 years 10 or more years 0.86 0.52 1.42
Time in current home: 6 to 10 years 10 or more years 0.60 0.37 0.99
Has internet access at home No internet access at home 1.07 0.85 1.34
Area unemployment rate Continuous variable 0.95 0.90 1.01
Access to car: Other private vehicle Own vehicle 0.60 0.41 0.87
Access to car: Public transport Own vehicle 0.73 0.59 0.91
Access to car: No transport Own vehicle 0.74 0.36 1.52
Living with somebody employed in the home Is not living with somebody employed in the home
1.08 0.88 1.32
Disability: Single disability No disability 1.15 0.80 1.66
250
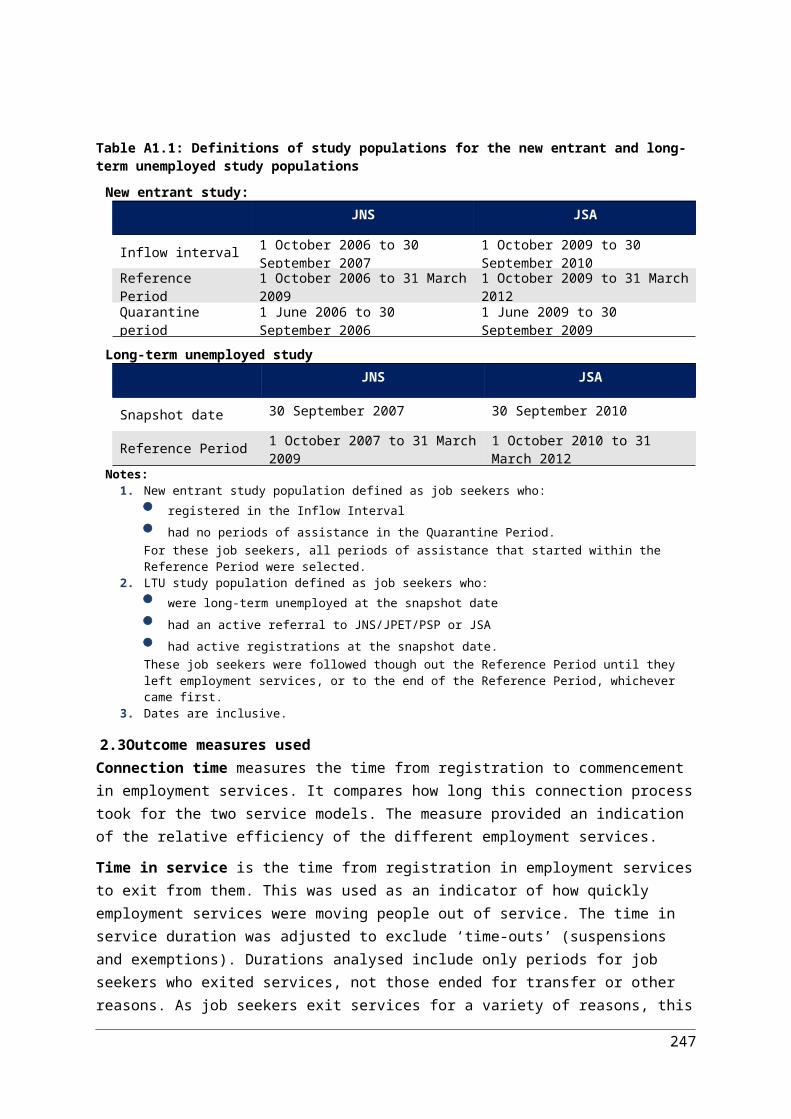
Category Reference category Odds RatioLower 95% confidence
limit
Upper 95% confidence
limit
Disability: Multiple disabilities No disability 0.90 0.51 1.58
Disability: Work capacity 23-29 hours/week No disability 1.71 0.92 3.18
Disability: Work capacity 15-22 hours/week No disability 0.78 0.49 1.23
Disability: Work capacity <15 hours/week No disability 0.45 0.29 0.69
Disability: Work capacity >8 hours/week No disability 0.59 0.14 2.55
Is a carer Not a carer 0.88 0.66 1.17
Difficulty working because of health: A little bit None at all 0.96 0.74 1.26
Difficulty working because of health: Some None at all 0.81 0.59 1.11
Difficulty working because of health: Quite a lot None at all 0.62 0.41 0.94
Difficulty working because of health: Could not do daily work None at all 1.09 0.56 2.14
Effect of emotional problems on daily life: A little bit None at all 0.90 0.71 1.14
Effect of emotional problems on daily life: Some None at all 1.15 0.85 1.56
Effect of emotional problems on daily life: Quite a lot None at all 1.00 0.69 1.45
Effect of emotional problems on daily life: Could not do daily work
None at all 0.51 0.27 0.97
JSCI score 0.98 0.97 0.99
Worked in the last 6 months Those who had not 2.61 2.13 3.19
Looked for work in the last 6 months Those who had not 2.76 2.01 3.79
Number of types of job search activities performed weekly: 1 0 1.38 1.10 1.74
Number of types of job search activities performed weekly: 2 0 1.26 0.92 1.72
Number of types of job search activities performed weekly: 3 0 1.05 0.62 1.78
251

Category Reference category Odds RatioLower 95% confidence
limit
Upper 95% confidence
limit
Currently studying Those who were not 1.21 0.96 1.52
Finished a course in the last 6 months Those who had not 1.51 1.05 2.17
Did short course in the last 6 months Those who had not 1.06 0.85 1.32
Performed Work Experience activity/ volunteer work Those who had not 1.14 0.94 1.40
Notes: 1. “Formal” was described to respondents as “something that will lead to a recognised certificate or qualification, completed at a school, TAFE, business college, university or some
other educational institution.”2. “Short courses” were described to respondents as “short training courses to learn or update work-related skills.”3. Analysis conducted by the Social Research Centre for the Department of Employment in June 2012.4. See Appendix 1, Section 3.2 for a description of this analysis.
Source: Stepping Stones survey data, Cohort 2, waves 3 to 6, collected between April 2009 and December 2010, and Department of Employment administrative data. Return to text where data is referenced.
252

Table A2.38: Effectiveness of EPF training – the likelihood of getting a job placement, 15 to 24 years old
Category Reference category Odds Ratio95% lower confidence limit
95% upper confidence limit
Received EPF training Did not receive EPF training 2.225 * 2.122 2.334Education qualifications: Year 10 or 11 Less than Year 10 1.203 * 1.118 1.295Education qualifications: Year 12, TAFE or diploma Less than Year 10 1.410 * 1.302 1.527Education qualifications: Degree of post graduate Less than Year 10 2.335 * 1.965 2.774Current income support: Newstart Allowance Not on income support 1.112 * 1.039 1.190Current income support: Other type of income support Not on income support 0.963 0.904 1.027Disadvantaged Indigenous labour market Not indigenous location 0.929 0.855 1.010Country of birth: Medium to very high disadvantage Very low to low disadvantage 0.952 0.861 1.053Disability/Medical condition: Other than reduced work capacity No disability or medical condition 0.890 * 0.826 0.958Disability/Medical condition: Work capacity <30 hours per week No disability or medical condition 0.645 * 0.561 0.742Duration on income support: 24+ months Less than 24 months 0.913 * 0.859 0.970Duration on income support: Not on income support Less than 24 months 0.881 * 0.829 0.936Access to transport: Other private transport Own transport 0.722 * 0.671 0.777Access to transport: Public transport Own transport 0.690 * 0.650 0.731Access to transport: No access to transport Own transport 0.657 * 0.592 0.730Primary or secondary homeless Stable residence 1.050 0.985 1.120Ex-offender Not ex-offender 1.029 0.892 1.186Country of birth: Non-English language English language 0.663 * 0.562 0.783Not useful vocational qualifications Has useful vocational qualifications 0.954 0.757 1.202Does not have vocational qualifications Has useful vocational qualifications 0.893 * 0.848 0.942English proficiency: Poor or mixed language level Good language level 0.912 * 0.838 0.993Geographic location: Low to moderate disadvantage ESA Very low disadvantage ESA 0.872 * 0.812 0.935Geographic location: High disadvantage ESA Very low disadvantage ESA 0.896 * 0.821 0.977Geographic location: Very high to extreme disadvantage ESA Very low disadvantage ESA 0.844 * 0.764 0.932Not contactable by phone Contactable by phone 0.775 * 0.710 0.847Living circumstances: Single parent Lives alone 0.641 * 0.532 0.772
253

Category Reference category Odds Ratio95% lower confidence limit
95% upper confidence limit
Living circumstances: Lives with spouse / partner Lives alone 0.863 * 0.754 0.987Living circumstances: Other living conditions Lives alone 0.905 * 0.826 0.991Personal factors from JCA: Low impact No impact 0.997 0.922 1.078Personal factors from JCA: Medium impact No impact 0.910 * 0.845 0.981Personal factors from JCA: High impact No impact 0.819 * 0.764 0.877Job seeker history 1: More than one episode of income support First time on income support 1.037 0.985 1.093Job seeker history 2: Had crisis payment(s) No crisis payments 1.016 0.820 1.259Recent work experience: Part-time or seasonal work Full-time employment 0.823 * 0.762 0.889Recent work experience: Outside labour force or unpaid Full-time employment 0.613 * 0.573 0.655Recent work experience: Unemployed Full-time employment 0.613 * 0.570 0.659Indigenous Not indigenous 0.783 * 0.708 0.865Proximity to labour market: Outer regional, remote, very remote or migratory
Metropolitan or inner regional 0.961 0.899 1.028
* indicates significant.Note: See Appendix 1, Section 3.1 for a description of this analysis.Source: Department of Employment administrative data.Return to discussion about youth where this data is referenced.
254
Table A2.39: Effectiveness of EPF training – the likelihood of getting a job placement, 25 to 49 years old
Category Reference category Odds Ratio95% lower confidence limit
95% upper confidence limit
Received EPF training Did not receive EPF training 2.402 * 2.309 2.499Education qualifications: Year 10 or 11 Less than Year 10 1.107 * 1.042 1.177Education qualifications: Year 12, TAFE or diploma Less than Year 10 1.094 * 1.026 1.168Education qualifications: Degree of post graduate Less than Year 10 0.951 0.863 1.048Current income support: Newstart Allowance Not on income support 0.931 * 0.879 0.986Current income support: Other type of income support Not on income support 0.633 * 0.585 0.686Disadvantaged Indigenous labour market Not indigenous location 0.741 * 0.698 0.786Country of birth: Medium to very high disadvantage Very low to low disadvantage 0.907 * 0.852 0.966Disability/Medical condition: Other than reduced work capacity No disability or medical condition 0.866 * 0.820 0.913Disability/Medical condition: Work capacity <30 hours per week No disability or medical condition 0.632 * 0.587 0.681Duration on income support: 24+ months Less than 24 months 0.839 * 0.799 0.881Duration on income support: Not on income support Less than 24 months 0.960 0.909 1.013Access to transport: Other private transport Own transport 0.739 * 0.694 0.787Access to transport: Public transport Own transport 0.792 * 0.758 0.829Access to transport: No access to transport Own transport 0.656 * 0.596 0.723Primary or secondary homeless Stable residence 1.156 * 1.090 1.226Ex-offender Not ex-offender 1.072 0.988 1.163Country of birth: Non-English language English language 0.740 * 0.664 0.825Not useful vocational qualifications Has useful vocational qualifications 0.905 * 0.823 0.995Does not have vocational qualifications Has useful vocational qualifications 0.824 * 0.789 0.861English proficiency: Poor or mixed language level Good language level 0.904 * 0.846 0.965Geographic location: Low to moderate disadvantage ESA Very low disadvantage ESA 0.898 * 0.846 0.952Geographic location: High disadvantage ESA Very low disadvantage ESA 0.876 * 0.814 0.942Geographic location: Very high to extreme disadvantage ESA Very low disadvantage ESA 0.850 * 0.781 0.926Not contactable by phone Contactable by phone 0.769 * 0.715 0.828Living circumstances: Single parent Lives alone 1.078 * 1.002 1.159
255
Category Reference category Odds Ratio95% lower confidence limit
95% upper confidence limit
Living circumstances: Lives with spouse / partner Lives alone 0.895 * 0.836 0.958Living circumstances: Other living conditions Lives alone 1.015 0.964 1.068Personal factors from JCA: Low impact No impact 1.012 0.946 1.081Personal factors from JCA: Medium impact No impact 0.902 * 0.848 0.959Personal factors from JCA: High impact No impact 0.867 * 0.821 0.916Job seeker history 1: More than one episode of income support First time on income support 1.134 * 1.087 1.183Job seeker history 2: Had crisis payment(s) No crisis payments 1.062 0.926 1.218Recent work experience: Part-time or seasonal work Full-time employment 0.814 * 0.769 0.861Recent work experience: Outside labour force or unpaid Full-time employment 0.546 * 0.517 0.577Recent work experience: Unemployed Full-time employment 0.590 * 0.558 0.624Indigenous Not indigenous 0.950 0.875 1.030Proximity to labour market: Outer regional, remote, very remote or migratory
Metropolitan or inner regional 0.962 0.908 1.018
* indicates significant.Note: See Appendix 1, Section 3.1 for a description of this analysis.Source: Department of Employment administrative data.
256
Table A2.40: Effectiveness of EPF training – the likelihood of getting a job placement, 50+ years old
Category Reference categoryOdds Ratio
95% lower confidence limit
95% upper confidence limit
Received EPF training Did not receive EPF training 2.821
2.601 3.059Education qualifications: Year 10 or 11 Less than Year 10 1.12
30.994 1.269
Education qualifications: Year 12, TAFE or diploma Less than Year 10 1.026
0.904 1.164Education qualifications: Degree of post graduate Less than Year 10 0.76
60.641 0.916
Current income support: Newstart Allowance Not on income support 0.748
0.674 0.832Current income support: Other type of income support Not on income support 0.46
80.387 0.564
Disadvantaged Indigenous labour market Not indigenous location 0.706
0.625 0.798Country of birth: Medium to very high disadvantage Very low to low disadvantage 0.88
30.782 0.998
Disability/Medical condition: Other than reduced work capacity
No disability or medical condition 0.801
0.720 0.891Disability/Medical condition: Work capacity <30 hours per week
No disability or medical condition 0.608
0.528 0.700Duration on income support: 24+ months Less than 24 months 0.78
10.704 0.866
Duration on income support: Not on income support Less than 24 months 0.938
0.847 1.038Access to transport: Other private transport Own transport 0.64
20.557 0.739
Access to transport: Public transport Own transport 0.709
0.643 0.783Access to transport: No access to transport Own transport 0.69
60.539 0.900
Primary or secondary homeless Stable residence 1.193
1.026 1.388Ex-offender Not ex-offender 1.37
61.032 1.835
Country of birth: Non-English language English language 0.735
0.549 0.983Not useful vocational qualifications Has useful vocational qualifications 0.81
40.690 0.961
Does not have vocational qualifications Has useful vocational qualifications 0.798
0.730 0.872English proficiency: Poor or mixed language level Good language level 0.79
20.689 0.911
Geographic location: Low to moderate disadvantage ESA Very low disadvantage ESA 0.821
0.727 0.926Geographic location: High disadvantage ESA Very low disadvantage ESA 0.78
80.680 0.914
Geographic location: Very high to extreme disadvantage ESA
Very low disadvantage ESA 0.698
0.588 0.827
257

Category Reference categoryOdds Ratio
95% lower confidence limit
95% upper confidence limit
Not contactable by phone Contactable by phone 0.855
0.720 1.014Living circumstances: Single parent Lives alone 1.43
61.176 1.753
Living circumstances: Lives with spouse / partner Lives alone 0.825
0.745 0.913Living circumstances: Other living conditions Lives alone 1.06
80.975 1.169
Personal factors from JCA: Low impact No impact 1.199
1.055 1.362Personal factors from JCA: Medium impact No impact 1.08
00.949 1.228
Personal factors from JCA: High impact No impact 0.968
0.846 1.108Job seeker history 1: More than one episode of income support
First time on income support 1.139
1.052 1.234Job seeker history 2: Had crisis payment(s) No crisis payments 0.82
50.448 1.520
Recent work experience: Part-time or seasonal work Full-time employment 0.838
0.757 0.927Recent work experience: Outside labour force or unpaid Full-time employment 0.45
40.405 0.509
Recent work experience: Unemployed Full-time employment 0.604
0.542 0.673Indigenous Not indigenous 1.13
50.909 1.418
Proximity to labour market: Outer regional, remote, very remote or migratory
Metropolitan or inner regional 1.059
0.949 1.181
* indicates significant.Note: See Appendix 1, Section 3.1 for a description of this analysis.Source: Department of Employment administrative data.Return to discussion about mature age job seekers where this data is referenced.
258

Table A2.41: Effectiveness of EPF training – the likelihood of getting a job placement, Stream 2
Category Reference category Odds Ratio95% Wald Confidence Limit (lower)
95% Wald Confidence Limit (upper)
Received EPF training Did not receive EPF training 2.315 * 2.227 2.406Education qualifications: Year 10 or 11 Less than Year 10 1.142 * 1.062 1.228Education qualifications: Year 12, TAFE or diploma Less than Year 10 1.166 * 1.082 1.257Education qualifications: Degree of post graduate Less than Year 10 1.167 * 1.055 1.291Current income support: Newstart Allowance Not on income support 1.134 * 1.080 1.190Current income support: Other type of income support Not on income support 0.921 * 0.869 0.977Disadvantaged Indigenous labour market Not indigenous location 0.915 * 0.849 0.986Country of birth: Medium to very high disadvantage Very low to low disadvantage 0.827 * 0.776 0.882Disability/Medical condition: Other than reduced work capacity (A)
No disability or medical condition 0.854 * 0.798 0.913Disability/Medical condition: Work capacity <30 hours per week (B)
No disability or medical condition 0.544 * 0.471 0.629Duration on income support: 24+ months Less than 24 months 1.064 * 1.003 1.129Duration on income support: Not on income support Less than 24 months 0.988 0.941 1.037Access to transport: Other private transport Own transport 0.842 * 0.790 0.897Access to transport: Public transport Own transport 0.788 * 0.754 0.824Access to transport: No access to transport Own transport 0.765 * 0.683 0.856Primary or secondary homeless Stable residence 1.119 * 1.040 1.204Ex-offender Not ex-offender 1.092 0.952 1.253Country of birth: Non-English language English language 0.773 * 0.668 0.894Not useful vocational qualifications Has useful vocational qualifications 0.851 * 0.758 0.956Does not have vocational qualifications Has useful vocational qualifications 0.873 * 0.836 0.911English proficiency: Poor or mixed language level Good language level 0.907 * 0.838 0.982Geographic location: Low to moderate disadvantage ESA Very low disadvantage ESA 0.880 * 0.832 0.931Geographic location: High disadvantage ESA Very low disadvantage ESA 0.897 * 0.835 0.964Geographic location: Very high to extreme disadvantage ESA Very low disadvantage ESA 0.858 * 0.786 0.936Not contactable by phone Contactable by phone 0.866 * 0.793 0.947
259
Category Reference category Odds Ratio95% Wald Confidence Limit (lower)
95% Wald Confidence Limit (upper)
Living circumstances: Single parent Lives alone 0.826 * 0.757 0.900Living circumstances: Lives with spouse / partner Lives alone 0.783 * 0.730 0.840Living circumstances: Other living conditions Lives alone 1.076 * 1.018 1.137Personal factors from JCA: Low impact No impact 1.050 0.981 1.124Personal factors from JCA: Medium impact No impact 0.913 * 0.845 0.987Personal factors from JCA: High impact No impact 0.913 0.824 1.011Job seeker history 1: More than one episode of income support First time on income support 1.096 * 1.052 1.141Job seeker history 2: Had crisis payment(s) No crisis payments 0.939 0.739 1.192Recent work experience: Part-time or seasonal work Full-time employment 0.800 * 0.759 0.843Recent work experience: Outside labour force or unpaid Full-time employment 0.626 * 0.594 0.659Recent work experience: Unemployed Full-time employment 0.676 * 0.637 0.718Indigenous Not indigenous 1.010 0.910 1.122Proximity to labour market: Outer regional, remote, very remote or migratory
Metropolitan or inner regional 1.020 0.963 1.080
* indicates significant.Note: See Appendix 1, Section 3.1 for a description of this analysis.Source: Department of Employment administrative data.Return to Section 6.3.4 where this data is referenced.
260
Table A2.42: Effectiveness of EPF training – the likelihood of getting a job placement, Stream 3
Category Reference category Odds Ratio95% Wald Confidence Limit (lower)
95% Wald Confidence Limit (upper)
Received EPF training Did not receive EPF training 2.299 * 2.174 2.431Education qualifications: Year 10 or 11 Less than Year 10 1.108 * 1.028 1.194Education qualifications: Year 12, TAFE or diploma Less than Year 10 1.148 * 1.059 1.244Education qualifications: Degree of post graduate Less than Year 10 0.829 * 0.704 0.975Current income support: Newstart Allowance Not on income support 0.584 * 0.534 0.638Current income support: Other type of income support Not on income support 0.505 * 0.457 0.557Disadvantaged Indigenous labour market Not indigenous location 0.743 * 0.689 0.801Country of birth: Medium to very high disadvantage Very low to low disadvantage 0.916 0.837 1.002Disability/Medical condition: Other than reduced work capacity No disability or medical condition 0.886 * 0.823 0.953Disability/Medical condition: Work capacity <30 hours per week No disability or medical condition 0.659 * 0.598 0.725Duration on income support: 24+ months Less than 24 months 0.830 * 0.779 0.885Duration on income support: Not on income support Less than 24 months 0.787 * 0.713 0.868Access to transport: Other private transport Own transport 0.801 * 0.732 0.877Access to transport: Public transport Own transport 0.800 * 0.752 0.851Access to transport: No access to transport Own transport 0.653 * 0.584 0.730Primary or secondary homeless Stable residence 1.247 * 1.153 1.350Ex-offender Not ex-offender 1.211 * 1.072 1.367Country of birth: Non-English language English language 0.780 * 0.689 0.884Not useful vocational qualifications Has useful vocational qualifications 0.781 * 0.682 0.895Does not have vocational qualifications Has useful vocational qualifications 0.828 * 0.780 0.880English proficiency: Poor or mixed language level Good language level 0.855 * 0.787 0.928Geographic location: Low to moderate disadvantage ESA Very low disadvantage ESA 0.953 0.867 1.046Geographic location: High disadvantage ESA Very low disadvantage ESA 0.966 0.868 1.076Geographic location: Very high to extreme disadvantage ESA Very low disadvantage ESA 0.871 * 0.776 0.977Not contactable by phone Contactable by phone 0.736 * 0.670 0.808
261
Category Reference category Odds Ratio95% Wald Confidence Limit (lower)
95% Wald Confidence Limit (upper)
Living circumstances: Single parent Lives alone 1.246 * 1.129 1.375Living circumstances: Lives with spouse / partner Lives alone 0.946 0.859 1.042Living circumstances: Other living conditions Lives alone 1.196 * 1.107 1.292Personal factors from JCA: Low impact No impact 1.142 * 1.054 1.236Personal factors from JCA: Medium impact No impact 1.042 0.966 1.123Personal factors from JCA: High impact No impact 0.996 0.916 1.082Job seeker history 1: More than one episode of income support First time on income support 1.107 * 1.047 1.170Job seeker history 2: Had crisis payment(s) No crisis payments 0.989 0.794 1.231Recent work experience: Part-time or seasonal work Full-time employment 0.839 * 0.762 0.925Recent work experience: Outside labour force or unpaid Full-time employment 0.586 * 0.536 0.640Recent work experience: Unemployed Full-time employment 0.635 * 0.582 0.693Indigenous Not indigenous 0.981 0.893 1.077Proximity to labour market: Outer regional, remote, very remote or migratory
Metropolitan or inner regional 0.940 0.874 1.011
* indicates significant.Note: See Appendix 1, Section 3.1 for a description of this analysis.Source: Department of Employment administrative data.Return to Section 6.3.4 where this data is referenced.
262

Table A2.43: Effectiveness of EPF training – the likelihood of getting a job placement, Stream 4
Category Reference categoryOdds Ratio
95% Wald Confidence Limit (lower)
95% Wald Confidence Limit (upper)
Received EPF training Did not receive EPF training 2.742 2.574 2.921Education qualifications: Year 10 or 11 Less than Year 10 1.155 1.064 1.254Education qualifications: Year 12, TAFE or diploma Less than Year 10 1.244 1.133 1.366Education qualifications: Degree of post graduate Less than Year 10 0.778 0.631 0.960Current income support: Newstart Allowance Not on income support 0.680 0.611 0.756Current income support: Other type of income support Not on income support 0.564 0.500 0.635Disadvantaged Indigenous labour market Not indigenous location 0.636 0.580 0.697Country of birth: Medium to very high disadvantage Very low to low disadvantage 0.924 0.816 1.047Disability/Medical condition: Other than reduced work capacity
No disability or medical condition 0.845 0.788 0.906
Disability/Medical condition: Work capacity <30 hours per week
No disability or medical condition 0.610 0.558 0.667
Duration on income support: 24+ months Less than 24 months 0.794 0.737 0.856Duration on income support: Not on income support Less than 24 months 0.930 0.856 1.011Access to transport: Other private transport Own transport 0.609 0.554 0.669Access to transport: Public transport Own transport 0.731 0.676 0.791Access to transport: No access to transport Own transport 0.716 0.623 0.823Primary or secondary homeless Stable residence 1.141 1.067 1.221Ex-offender Not ex-offender 1.032 0.928 1.149Country of birth: Non-English language English language 0.699 0.561 0.871Not useful vocational qualifications Has useful vocational qualifications 0.840 0.719 0.981Does not have vocational qualifications Has useful vocational qualifications 0.792 0.738 0.850English proficiency: Poor or mixed language level Good language level 0.894 0.814 0.982
263
Category Reference categoryOdds Ratio
95% Wald Confidence Limit (lower)
95% Wald Confidence Limit (upper)
Geographic location: Low to moderate disadvantage ESA
Very low disadvantage ESA 0.872 0.798 0.952
Geographic location: High disadvantage ESA Very low disadvantage ESA 0.820 0.732 0.918Geographic location: Very high to extreme disadvantage ESA
Very low disadvantage ESA 0.873 0.763 0.999
Not contactable by phone Contactable by phone 0.800 0.725 0.882Living circumstances: Single parent Lives alone 0.959 0.839 1.097Living circumstances: Lives with spouse / partner Lives alone 0.876 0.764 1.004Living circumstances: Other living conditions Lives alone 1.026 0.952 1.107Personal factors from JCA: Low impact No impact 0.923 0.799 1.066Personal factors from JCA: Medium impact No impact 0.963 0.855 1.084Personal factors from JCA: High impact No impact 0.893 0.802 0.994Job seeker history 1: More than one episode of income support
First time on income support 1.119 1.044 1.200
Job seeker history 2: Had crisis payment(s) No crisis payments 1.084 0.922 1.274Recent work experience: Part-time or seasonal work Full-time employment 0.808 0.733 0.891Recent work experience: Outside labour force or unpaid
Full-time employment 0.510 0.467 0.556
Recent work experience: Unemployed Full-time employment 0.554 0.509 0.604Indigenous Not indigenous 1.013 0.898 1.144Proximity to labour market: Outer regional, remote, very remote or migratory
Metropolitan or inner regional 1.007 0.916 1.106
* indicates significant.Note: See Appendix 1, Section 3.1 for a description of this analysis.Source: Department of Employment administrative data.Return to Section 6.3.4 where this data is referenced.
264
Table A2.44: Job seeker satisfaction with training and education option information provided by JSA provider, June 2012 (per cent)
Stream Satisfied or very satisfied
Neither satisfied nor dissatisfied
Dissatisfied or very dissatisfied
Stream 1 50.3 28.3 21.5
Stream 2 65.3 21.6 13.1
Stream 3 71.1 19.1 9.8
Stream 4 70.8 16.1 13.2
Total Streams 1 to 4 62.5 22.4 15.2
Note: Numbers may not add to 100 due to rounding errors.
Source: Department of Employment Labour Market Assistance Outcomes, June 2012.
Return to Figure 6.1 where this data is referenced.
265

Table A2.45: Employment and education outcomes for LTU job seekers, JNS (per cent)
Characteristics Full-time Employment
Part-time Employment
Total Employment Education
Stream 1 40.6 24.4 65.0 10.9Stream 2 31.1 23.7 54.8 11.1Stream 3 21.7 21.6 43.3 10.6Stream 4 9.2 10.3 19.5 9.1Males aged < 25 years 37.7 11.9 49.6 11.3
Males aged 25-49 years 26.4 14.3 40.7 8.9Males aged 50+ years 16.3 18.3 34.6 6.3Females aged < 25 years 31.3 20.9 52.2 14.4Females aged 25-49 years 27.7 24.6 52.3 13.1Females aged 50+ years 15.1 29.5 44.6 8.9Length of unemployment: 1 to less than 2 years 32.6 23.2 55.8 12.0
Length of unemployment: 2 to less than 5 years 24.4 19.5 43.9 10.0Length of unemployment: 5 years or more 15.9 17.5 33.4 6.9Participation requirement: Full-time 23.2 19.9 43.1 10.0Participation requirement: Part-time 27.7 23.6 51.3 11.4
Participation requirement: Volunteer 30.4 17.8 48.2 11.8Newstart Allowance 21.6 20.8 42.4 9.7Youth Allowance (Other) 27.0 15.6 42.6 13.0Parenting Payment 37.9 23.2 61.1 13.8Disability Support Pension 11.6 11.4 23.0 8.9
266

Characteristics Full-time Employment
Part-time Employment
Total Employment Education
Other income support type 17.6 20.3 37.9 9.1
Not on income support 47.0 18.6 65.6 10.6
Job seeker residence: Major City 26.3 18.7 45.0 11.3Job seeker residence: Inner Regional 27.2 22.9 50.1 9.5Job seeker residence: Other 22.6 23.3 45.9 8.9Education: Less than Year 10 19.8 16.7 36.5 9.6Education: Year 10/11 26.2 21.3 47.5 8.2Education: Year 12 32.6 21.9 54.5 13.4Education: TAFE/Diploma 28.9 22.3 51.2 12.1Education: Degree/Post-graduate 27.0 25.1 52.1 15.2Indigenous 19.9 18.0 37.9 7.8Does not identify as Indigenous 26.7 20.9 47.6 10.9
Job seekers with a disability as identified by JCA/ESAt 11.3 15.1 26.4 9.1Culturally and Linguistically Diverse 22.9 18.6 41.5 16.2Low or mixed English proficiency 18.0 15.9 33.9 16.2Single parents 37.6 25.7 63.3 11.5Ex-offenders 21.3 11.1 32.4 6.6Total 25.9 20.6 46.5 10.5
267

Indigenous status by Stream
Characteristics Stream 1 Stream 2 Stream 3 Stream 4 Total
Indigenous - Employment 47.6 43.8 42.9 14.4 37.9
Indigenous - Education ^ ^ 7.4 ^ 7.8Does not identify as Indigenous - Employment 65.1 55.2 42.8 20.3 47.6Does not identify as Indigenous - Education 11.1 11.2 11.2 9.4 10.9
^ Relative standard error too high to provide reliable estimate.
Note: Numbers may not add up due to rounding.
Source: Department of Employment Post Programme Monitoring survey.
This data is referenced in several locations.
Return to Figure 6.3 where data is referenced. Return to Figure 7.6 where data is referenced. Return to Figure 7.7 where data is referenced. Return to discussion about mature age job seekers where this data is referenced. Return to discussion about youth where this data is referenced. Return to discussion about Indigenous job seekers where this data is referenced.
268

Table A2.46: Employment and education outcomes for LTU job seekers, JSA (per cent)
Characteristics Full-time Employment
Part-time Employment
Total Employment Education
Stream 1 32.4 28.6 61.0 15.7Stream 2 23.0 28.9 51.9 17.8Stream 3 15.2 23.7 38.9 19.1Stream 4 14.7 13.9 28.6 16.4Males aged < 25 years 32.6 15.9 48.5 18.8Males aged 25-49 years 25.9 17.3 43.2 14.3Males aged 50+ years 16.4 17.3 33.7 10.1
Females aged < 25 years 19.1 20.5 39.6 24.0Females aged 25-49 years 16.5 29.7 46.2 22.3Females aged 50+ years 9.1 31.3 40.4 18.4Length of unemployment: 1 to less than 2 years 25.4 25.2 50.6 19.1Length of unemployment: 2 to less than 5 years 18.0 23.2 41.2 18.0Length of unemployment: 5 years or more 10.2 20.2 30.4 13.0
Participation requirement: Full-time 21.0 21.0 41.9 17.3Participation requirement: Part-time 13.5 29.2 42.7 18.9Participation requirement: Volunteer 30.0 18.0 48.0 14.1Newstart Allowance 18.3 22.3 40.6 17.0
Youth Allowance (Other) 23.9 15.5 39.4 25.0Parenting Payment 17.8 33.4 51.2 19.1Disability Support Pension 6.4 12.8 19.2 10.1Other income support type 5.4 27.0 32.4 14.8
269

Characteristics Full-time Employment
Part-time Employment
Total Employment Education
Not on income support 43.9 17.4 61.3 17.6Job seeker residence: Major City 19.6 22.3 41.9 19.3Job seeker residence: Inner Regional 19.6 27.0 46.6 15.1
Job seeker residence: Other 21.2 22.8 44.0 14.9Education: Less than Year 10 14.2 16.7 30.9 21.4Education: Year 10/11 20.2 22.8 43.0 13.8Education: Year 12 21.4 25.1 46.5 21.9Education: TAFE/Diploma 22.9 27.6 50.5 15.9Education: Degree/Post-graduate 22.4 29.6 52.0 19.5Indigenous 18.0 12.4 30.4 15.1Does not identify as Indigenous 20.4 24.4 44.8 17.7Job seekers with a disability as identified by JCA/ESAt 9.5 17.2 26.7 15.3Culturally and Linguistically Diverse 18.0 21.6 39.6 27.8
Low or mixed English proficiency 15.1 16.4 31.5 28.3Single parents 19.6 33.5 53.1 19.1Ex-offenders 23.2 14.9 38.1 11.4Total 19.9 23.5 43.4 17.6
270
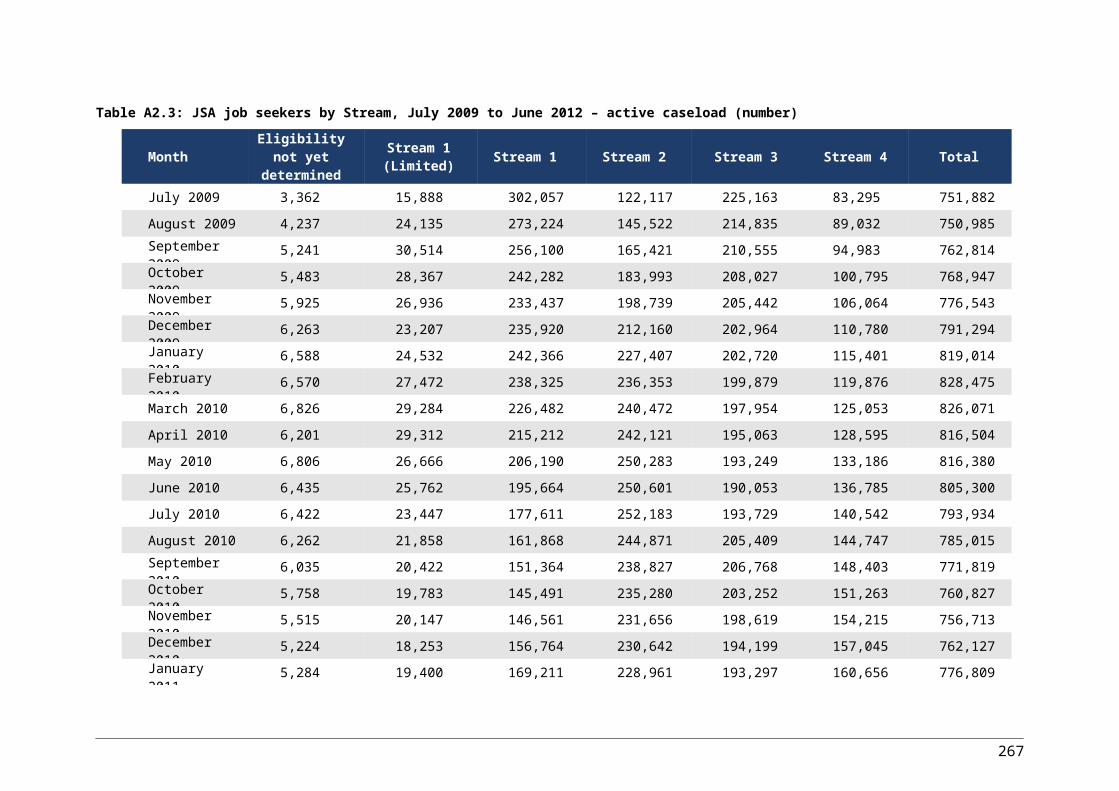
Indigenous status by Stream
Characteristics Stream 1 Stream 2 Stream 3 Stream 4 Total
Indigenous - Employment ^ 39.0 34.2 19.0 30.4Indigenous - Education ^ 19.5 15.5 15.1 15.1Does not identify as Indigenous - Employment 61.2 52.6 39.2 29.9 44.8Does not identify as Indigenous - Education 16.0 17.8 19.4 16.3 17.7
^ Relative standard error too high to provide reliable estimate.
Note: Numbers may not add up due to rounding.
Source: Department of Employment Post Programme Monitoring survey.
This data is referenced in several locations.
Return to Figure 6.3 where data is referenced. Return to Figure 7.6 where data is referenced. Return to Figure 7.7 where data is referenced. Return to discussion about mature age job seekers where this data is referenced. Return to discussion about youth where this data is referenced. Return to discussion about Indigenous job seekers where this data is referenced.
271

Table A2.47: Comparison of employment and education outcomes for LTU job seekers, JNS and JSA (ppt difference)
Characteristics Full-time Employment
Part-time Employment
Total Employment Education
Stream 1 -8.2 4.2 -4.0 4.8Stream 2 -8.1 5.2 -2.9 6.7Stream 3 -6.5 2.1 -4.4 8.5Stream 4 5.5 3.6 9.1 7.3Males aged < 25 years -5.1 4.0 -1.1 7.5Males aged 25-49 years -0.5 3.0 2.5 5.4Males aged 50+ years 0.1 -1.0 -0.9 3.8
Females aged < 25 years -12.2 -0.4 -12.6 9.6Females aged 25-49 years -11.2 5.1 -6.1 9.2Females aged 50+ years -6.1 1.9 -4.2 9.5Length of unemployment: 1 to less than 2 years -7.2 2.0 -5.2 7.1Length of unemployment: 2 to less than 5 years -6.4 3.7 -2.7 8.0Length of unemployment: 5 years or more -5.7 2.7 -3.0 6.1
Participation requirement: Full-time -2.2 1.0 -1.2 7.3Participation requirement: Part-time -14.2 5.6 -8.6 7.5Participation requirement: Volunteer -0.4 0.2 -0.2 2.3Newstart Allowance -3.4 1.6 -1.8 7.3
Youth Allowance (Other) -3.1 -0.1 -3.2 12.0Parenting Payment -20.1 10.2 -9.9 5.3Disability Support Pension -5.2 1.4 -3.8 1.2Other income support type -12.2 6.7 -5.5 5.7
272

Characteristics Full-time Employment
Part-time Employment
Total Employment Education
Not on income support -3.1 -1.2 -4.3 7.0Job seeker residence: Major City -6.7 3.6 -3.1 8.0Job seeker residence: Inner Regional -7.6 4.1 -3.5 5.6
Job seeker residence: Other -1.4 -0.5 -1.9 6.0Education: Less than Year 10 -5.6 0.0 -5.6 11.8Education: Year 10/11 -5.9 1.4 -4.5 5.6Education: Year 12 -11.2 3.2 -8.0 8.5Education: TAFE/Diploma -6.0 5.3 -0.7 3.8Education: Degree/Post-graduate -4.7 4.6 -0.1 4.3Indigenous -1.9 -5.6 -7.5 7.3Does not identify as Indigenous -6.4 3.6 -2.8 6.8Job seekers with a disability as identified by JCA/ESAt -1.8 2.1 0.3 6.2Culturally and Linguistically Diverse -4.9 3.0 -1.9 11.6
Low or mixed English proficiency -2.9 0.5 -2.4 12.1Single parents -18.0 7.8 -10.2 7.6Ex-offenders 1.9 3.8 5.7 4.8Total -6.0 2.9 -3.1 7.1
273
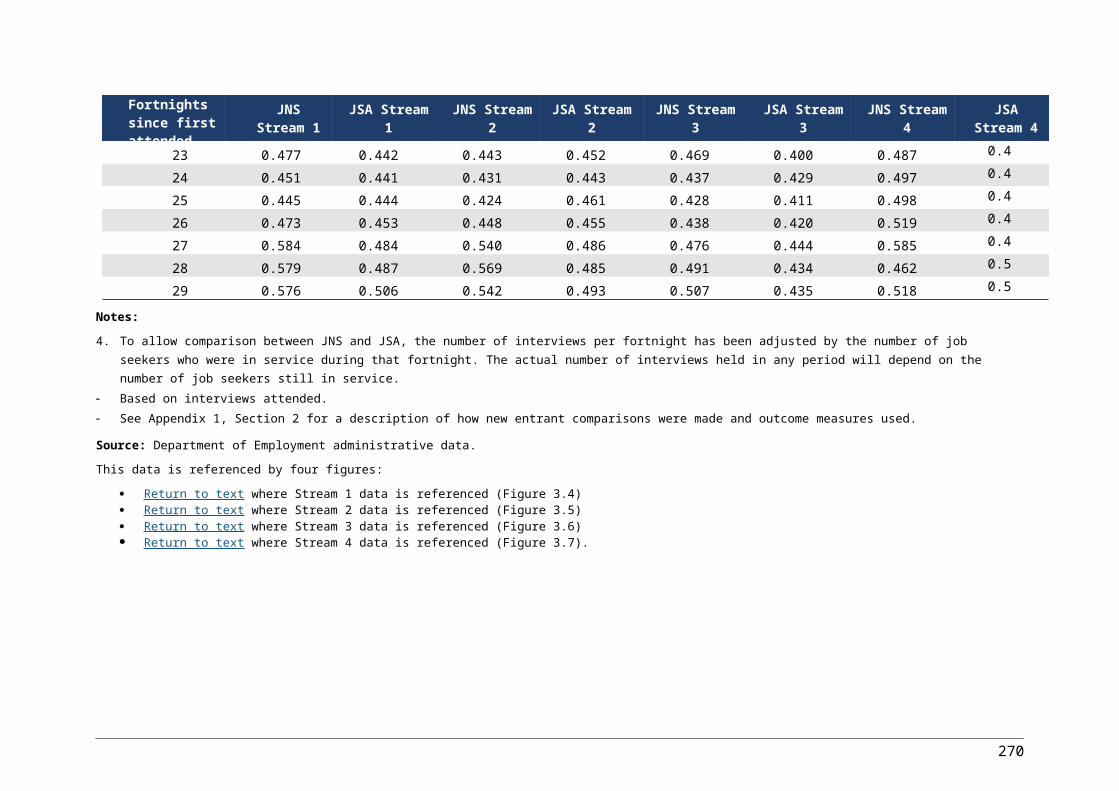
Indigenous status by Stream
Characteristics Stream 1 Stream 2 Stream 3 Stream 4 Total
Indigenous - Employment ^ -4.8 -8.7 4.6 -7.5Indigenous - Education ^ ^ 8.1 ^ 7.3Does not identify as Indigenous - Employment -3.9 -2.6 -3.6 9.6 -2.8Does not identify as Indigenous - Education 4.9 6.6 8.2 6.9 6.8
^ Relative standard error too high to provide reliable estimate.
Note: Numbers may not add up due to rounding.
Source: Department of Employment Post Programme Monitoring survey.
This data is referenced in several locations.
Return to Figure 6.3 where data is referenced. Return to Figure 7.6 where data is referenced. Return to Figure 7.7 where data is referenced. Return to discussion about mature age job seekers where this data is referenced. Return to discussion about youth where this data is referenced. Return to discussion about Indigenous job seekers where this data is referenced.
274
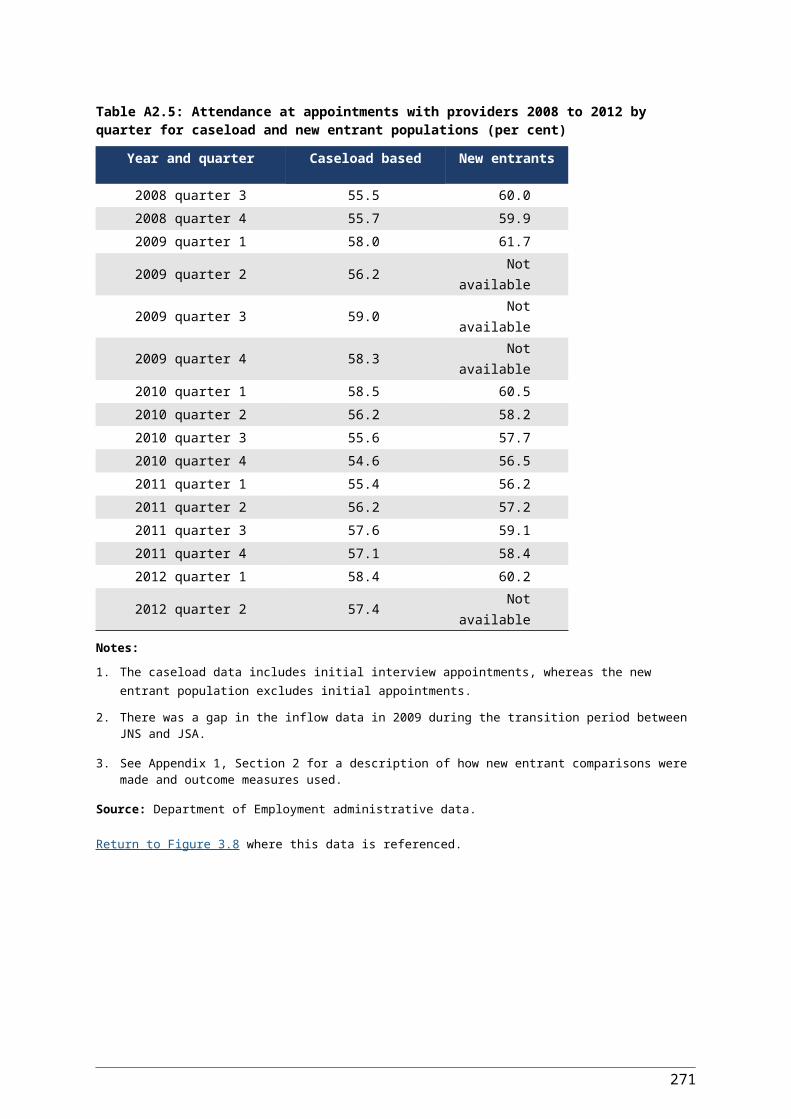
Table A2.48: JNS and JSA active caseload and Australian population aged 15–64, selected characteristics (per cent)
Job seeker characteristic JNS active caseload JSA active caseload Australian population
Indigenous 11.8 11.8 2.7
Single parents 18.9 15.9 5.4
Less than Year 10 education 20.6 15.7 8.9
Culturally and Linguistically Diverse
16.7 17.9 18.0
Mixed or poor English proficiency 13.4 12.7 *
Homeless 11.2 10.3 0.5
Ex-offenders 12.4 11.8 *
*Information on English proficiency and ex-offender status in the Australian population is not available or is not available on a comparable basis. Notes:1. JNS active caseload at 30 September 2007.2. JSA active caseload at 30 September 2010.3. Australian population aged 15 to 64 years at August 2011.4. Information on some data items was collected in a slightly different way in JNS, JSA and the Population Census. In
particular, data on highest level of education and homeless status in JNS should be used with care. In addition, from July 2009 the Learn or Earn initiative led to an increased emphasis on accurate recording of educational qualifications for job seekers under 21 years of age.
5. Information on Indigenous Australians from the ABS Population Census has been adjusted to account for those who did not state their Indigenous status.
6. Information on homelessness in the Australian population is for people aged 12 to 64 and as reported in COAG 2013, Affordable Housing Agreement: Homelessness 2011–12 – Comparing performance across Australia: Report to the Council of Australian Governments.
Source: Department of Employment administrative data; Australian Bureau of Statistics data from the 2011 Population Census.Return to Figure 7.1 where this data is referenced.
275

Table A2.49: Odds ratios of those more likely to face multiple disadvantage in JSA caseload
Category Reference category Odds ratio
Lower 95% confidence interval
Upper 95% confidence interval
Not activity tested NSA/YA(O) Activity tested NSA/YA(O) 0.637 * 0.517 0.785
High socio-economic area (60%-100% SEIFA )
Mid-range socio-economic area (40%-60% + SEIFA )
0.742 * 0.607 0.907
Low socio-economic area (0%-40% SEIFA)
Mid-range socio-economic area (40%-60% + SEIFA )
1.103 0.922 1.320
Moderately accessible to very remote ARIA
Accessible/Highly accessible ARIA 1.179 0.875 1.588
Country of birth: Medium - very high disadvantage No/low disadvantage 0.637 * 0.510 0.794
Indigenous Labour Market: Low-Very high disadvantage Indigenous ESA
No disadvantage/very low disadvantage Indigenous ESA
0.682 0.493 0.943
Recent work experience: Other Full/Part-time 8-30 hours 1.538 * 1.325 1.786
Duration on income support: 24+ months in past 10 years
0-12 months in past 10 years 2.159 * 1.681 2.773
Duration on income support: 12-23 months in past 10 years
0-12 months in past 10 years 1.322 0.974 1.795
Not contactable by phone Contactable by phone 1.366 0.960 1.944Ex-offender Not an ex-offender 2.012 * 1.576 2.568
Mixed/Poor English proficiency Good English proficiency 2.818 * 2.179
Socially married Not socially married 0.945 0.793 1.127
Has dependent children Does not have dependent children 1.408 * 1.185 1.674
50 or older 25 to 34 year olds 1.475 *35 - 49 years 25 to 34 year olds 1.395 *
Notes: 1. Job seekers unemployed less than 3 months excluded from the analysis.2. See Appendix 1, Section 3.3 for a description of the methodology.
Source: Department of Employment administrative data and Stepping Stones survey, cohort 3 wave 5.This data is referenced in several locations.
Return to discussion about multiple labour market challenges where this data is referenced. Return to discussion about job seekers from non-English speaking backgrounds where this data is referenced.
276
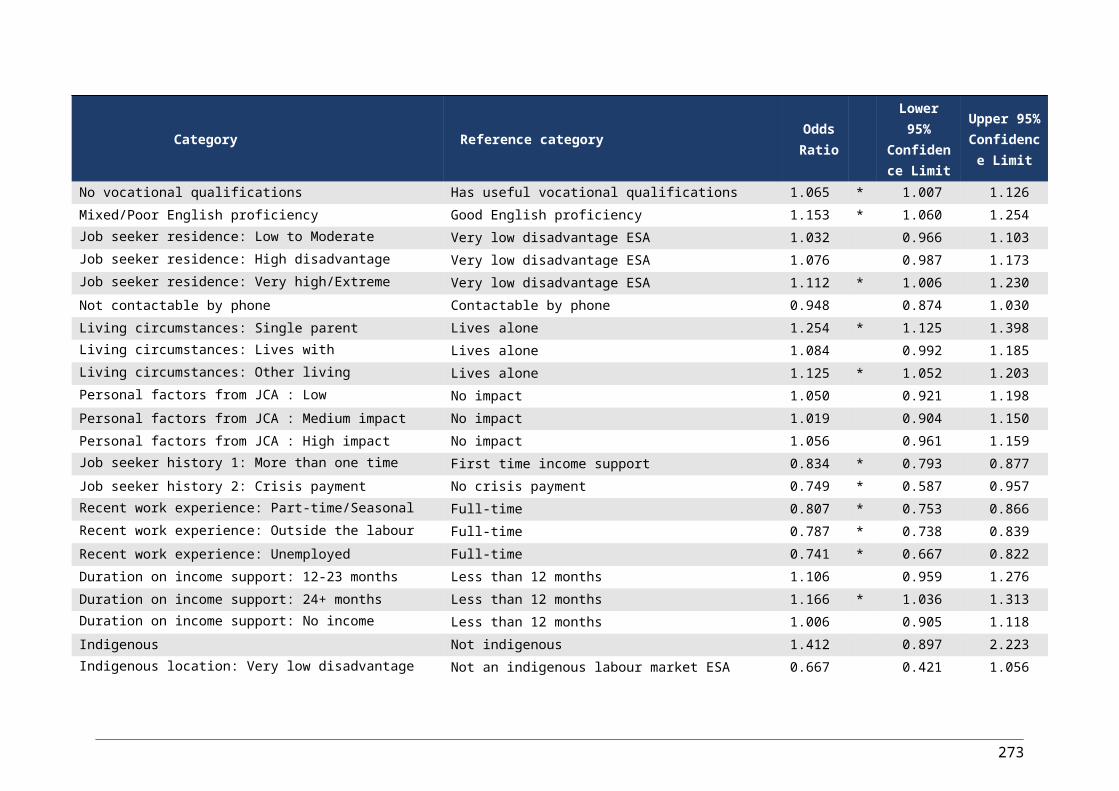
Table A2.50: Estimated proportions of each type of JSA job seeker who experienced each domain of disadvantage by age, gender and service Stream (18 to 65 years of age) (per cent)
Material Education Health Community
Social
Males 54.
57.6
44
31.3
42
Females 49.
52.9
46
28.1
36Under
21 years4
1.78.
328
39.3
3521-24
years4
5.69.
933
38.0
3425-34
years5
2.46.
742
34.6
3735 - 49
years5
2.50.
449
29.9
4350 years
or older5
9.53.
156
16.5
43
Stream 1 34.
39.5
30
23.4
27
Stream 2 44.
52.7
37
27.6
30
Stream 3 59.
59.2
51
28.9
46
Stream 4 68.
68.5
63
39.6
57Indigeno
us 6
6.79.
043
48.7
70All job
seekers5
2.55.
445
29.9
40
Notes: 1. Job seekers unemployed less than 3 months excluded from the analysis.2. See Appendix 1, Section 3.3 for a description of the methodology.
Source: Department of Employment administrative data and Stepping Stones survey, cohort 3 wave 5.Return to text where data is referenced.
277
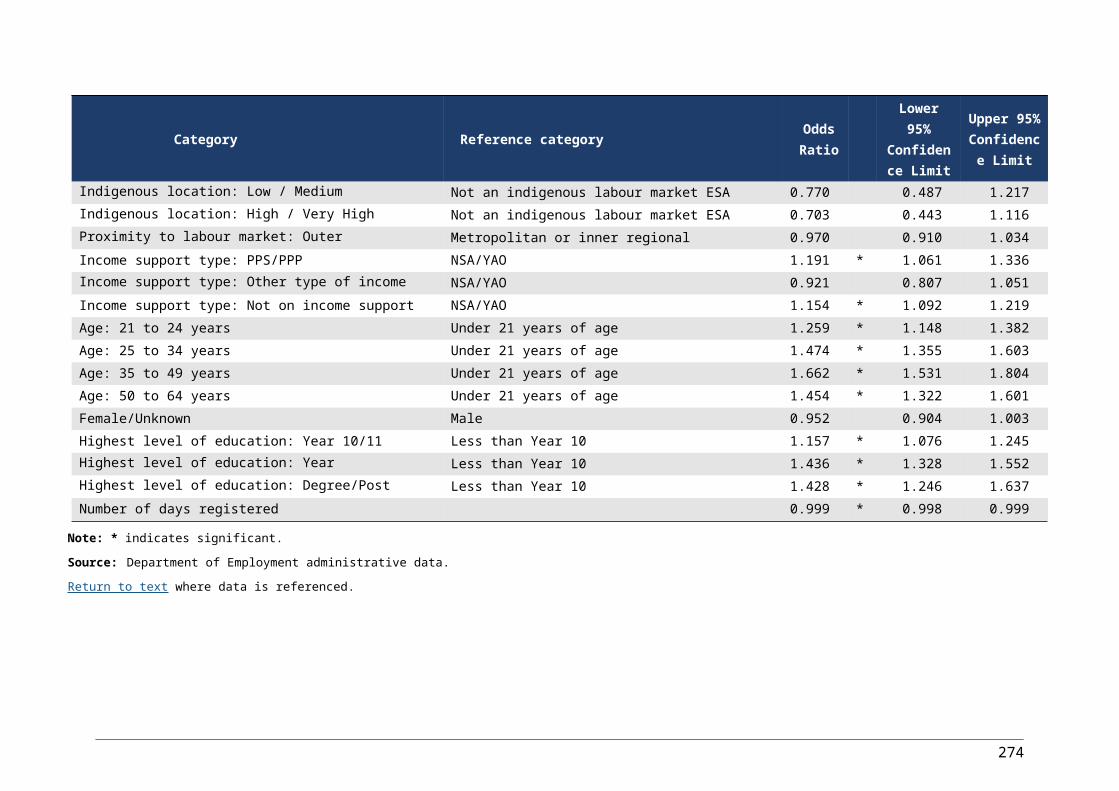
Table A2.51: Odds ratio of off income support by JSA Stream of service for those who did and did not experience multiple disadvantage
Stream1
Characteristic Reference category Odds ratioLower 95% confidence limit
Upper 95% confidence limit
Has multiple disadvantage Does not have multiple disadvantage
0.
62
0.
41
0.
92
Not activity tested NSA or YAO Activity tested NSA or YAO
0.
90
0.
51
1.
60
High socio-economic area (60%-100% SEIFA ) Mid-range socio-economic area (40%-60% SEIFA )
1.
32
0.
87
2.
00
Low socio-economic area (0%- 40% SEIFA ) Mid-range socio-economic area (40%-60% SEIFA )
0.
96
0.
63
1.
45
Moderately accessible to very remote ARIA Accessible/Highly accessible ARIA
1.
49
0.
73
3.
05
Country of birth: Medium - very high disadvantage No/low disadvantage country of birth
0.
95
0.
62
1.
45
Low-Very high disadvantage Indigenous labour market ESA No disadvantage/very low disadvantage Indigenous ESA 0.
1
0.
0
1.
6
278

Characteristic Reference category Odds ratioLower 95% confidence limit
Upper 95% confidence limit
9 2 1
Recent work experience: Other Full/Part-time employment
1.
21
0.
87
1.
68
Duration on income support: 24 months or more in past 10 years 0-12 months in past 10 years
0.
46
0.
31
0.
69
Duration on income support: 12-23 months in past 10 years 0-12 months in past 10 years
0.
63
0.
39
1.
00
Not contactable by phone Contactable by phone
2.
40
1.
01
5.
71
Ex-offender Not an ex-offender
0.
44
0.
21
0.
94
Mixed/Poor English proficiency Good English proficiency
0.
89
0.
39
2.
02
Socially married Not socially married
1.
01
0.
68
1.
49
Has dependent children Does not have dependent children 0.
0.
1.
279

Characteristic Reference category Odds ratioLower 95% confidence limit
Upper 95% confidence limit
96
66
41
Time since registered for JSA: Over 2 years Less than 6 months
0.
49
0.
25
0.
95
Time since registered for JSA: 1 to 2 years Less than 6 months
0.
46
0.
30
0.
71
Time since registered for JSA: 6 months to 1 year Less than 6 months
0.
69
0.
48
0.
99
280

Stream2
Characteristic Reference category Odds ratioLower 95% confidence limit
Upper 95% confidence limit
Has multiple disadvantage Does not have multiple disadvantage 0.34 0.22 0.52Not activity tested NSA or YAO Activity tested NSA or YAO 0.52 0.30 0.91High socio-economic area (60%-100% SEIFA ) Mid-range socio-economic area (40%-60% SEIFA ) 0.98 0.61 1.59Low socio-economic area (0%- 40% SEIFA ) Mid-range socio-economic area (40%-60% SEIFA ) 0.84 0.54 1.33Moderately accessible to very remote ARIA Accessible/Highly accessible ARIA 1.59 0.70 3.62Country of birth: Medium - very high disadvantage No/low disadvantage country of birth 0.93 0.55 1.58Low-Very high disadvantage Indigenous labour market ESA No disadvantage/very low disadvantage Indigenous ESA 0.85 0.24 3.03Recent work experience: Other Full/Part-time employment 0.82 0.57 1.18Duration on income support: 24 months or more in past 10 years 0-12 months in past 10 years 0.85 0.49 1.48Duration on income support: 12-23 months in past 10 years 0-12 months in past 10 years 1.44 0.77 2.69Not contactable by phone Contactable by phone 1.12 0.41 3.05Ex-offender Not an ex-offender 1.89 0.96 3.72Mixed/Poor English proficiency Good English proficiency 0.74 0.32 1.71Socially married Not socially married 1.56 0.99 2.46Has dependent children Does not have dependent children 1.02 0.65 1.60Time since registered for JSA: Over 2 years Less than 6 months 0.36 0.20 0.64Time since registered for JSA: 1 to 2 years Less than 6 months 0.49 0.29 0.86Time since registered for JSA: 6 months to 1 year Less than 6 months 0.49 0.28 0.86
281

Stream 3
Characteristic Reference category Odds ratioLower 95% confidence limit
Upper 95% confidence limit
Has multiple disadvantage Does not have multiple disadvantage 0.58 0.39 0.86Not activity tested NSA or YAO Activity tested NSA or YAO 0.53 0.29 0.97High socio-economic area (60%-100% SEIFA ) Mid-range socio-economic area (40%-60% SEIFA ) 1.20 0.70 2.03Low socio-economic area (0%- 40% SEIFA ) Mid-range socio-economic area (40%-60% SEIFA ) 0.90 0.56 1.44Moderately accessible to very remote ARIA Accessible/Highly accessible ARIA 1.21 0.60 2.44Country of birth: Medium - very high disadvantage No/low disadvantage country of birth 1.80 1.11 2.89Low-Very high disadvantage Indigenous labour market ESA No disadvantage/very low disadvantage Indigenous ESA 0.59 0.26 1.35Recent work experience: Other Full/Part-time employment 0.67 0.45 1.00Duration on income support: 24 months or more in past 10 years 0-12 months in past 10 years 0.48 0.18 1.29Duration on income support: 12-23 months in past 10 years 0-12 months in past 10 years 0.75 0.25 2.26Not contactable by phone Contactable by phone 0.85 0.40 1.83Ex-offender Not an ex-offender 1.17 0.64 2.15Mixed/Poor English proficiency Good English proficiency 1.12 0.62 2.01Socially married Not socially married 1.04 0.68 1.60Has dependent children Does not have dependent children 1.26 0.80 1.97Time since registered for JSA: Over 2 years Less than 6 months 0.49 0.18 1.31Time since registered for JSA: 1 to 2 years Less than 6 months 0.63 0.22 1.77Time since registered for JSA: 6 months to 1 year Less than 6 months 0.68 0.23 1.99
282

Stream 4
Characteristic Reference category Odds ratioLower 95% confidence limit
Upper 95% confidence limit
Has multiple disadvantage Does not have multiple disadvantage 0.40 0.28 0.56Not activity tested NSA or YAO Activity tested NSA or YAO 0.42 0.20 0.87High socio-economic area (60%-100% SEIFA ) Mid-range socio-economic area (40%-60% SEIFA ) 1.35 0.84 2.17Low socio-economic area (0%- 40% SEIFA ) Mid-range socio-economic area (40%-60% SEIFA ) 1.50 0.96 2.33Moderately accessible to very remote ARIA Accessible/Highly accessible ARIA 0.35 0.12 1.01Country of birth: Medium - very high disadvantage No/low disadvantage country of birth 1.07 0.61 1.87Low-Very high disadvantage Indigenous labour market ESA No disadvantage/very low disadvantage Indigenous ESA 1.27 0.54 2.96Recent work experience: Other Full/Part-time employment 0.55 0.39 0.78Duration on income support: 24 months or more in past 10 years 0-12 months in past 10 years 0.72 0.37 1.41Duration on income support: 12-23 months in past 10 years 0-12 months in past 10 years 0.95 0.45 2.00Not contactable by phone Contactable by phone 1.26 0.65 2.44Ex-offender Not an ex-offender 1.51 0.99 2.30Mixed/Poor English proficiency Good English proficiency 0.97 0.58 1.63Socially married Not socially married 1.08 0.67 1.75Has dependent children Does not have dependent children 1.42 0.95 2.11Time since registered for JSA: Over 2 years Less than 6 months 0.40 0.22 0.72Time since registered for JSA: 1 to 2 years Less than 6 months 0.52 0.29 0.95Time since registered for JSA: 6 months to 1 year Less than 6 months 0.86 0.44 1.66
283

Total
Characteristic Reference category Odds ratioLower 95% confidence limit
Upper 95% confidence limit
Has multiple disadvantage Does not have multiple disadvantage 0.43 0.35 0.52Not activity tested NSA or YAO Activity tested NSA or YAO 0.56 0.42 0.75High socio-economic area (60%-100% SEIFA ) Mid-range socio-economic area (40%-60% SEIFA ) 1.20 0.95 1.52Low socio-economic area (0%- 40% SEIFA ) Mid-range socio-economic area (40%-60% SEIFA ) 0.97 0.78 1.21Moderately accessible to very remote ARIA Accessible/Highly accessible ARIA 1.06 0.72 1.56Country of birth: Medium - very high disadvantage No/low disadvantage country of birth 1.12 0.88 1.43Low-Very high disadvantage Indigenous labour market ESA No disadvantage/very low disadvantage Indigenous ESA 0.73 0.44 1.23Recent work experience: Other Full/Part-time employment 0.78 0.66 0.94Duration on income support: 24 months or more in past 10 years 0-12 months in past 10 years 0.62 0.47 0.81Duration on income support: 12-23 months in past 10 years 0-12 months in past 10 years 0.97 0.71 1.34Not contactable by phone Contactable by phone 1.24 0.85 1.81Ex-offender Not an ex-offender 1.21 0.91 1.62Mixed/Poor English proficiency Good English proficiency 0.87 0.63 1.20Socially married Not socially married 1.21 0.97 1.50Has dependent children Does not have dependent children 1.10 0.89 1.37Time since registered for JSA: Over 2 years Less than 6 months 0.32 0.25 0.42Time since registered for JSA: 1 to 2 years Less than 6 months 0.48 0.37 0.62Time since registered for JSA: 6 months to 1 year Less than 6 months 0.62 0.47 0.80
Notes: 1. Job seekers unemployed less than 3 months excluded from the analysis.2. See Appendix 1, Section 3.3 for a description of the methodology.
Source: Department of Employment administrative data and Stepping Stones survey, cohort 3 wave 5.Return to text where data is referenced.
284

Table A2.52: Odds ratio of achieving a job placement by JSA Stream of service for those who did and did not experience multiple disadvantage
Stream 2
Characteristic Reference category Odds ratioLower 95% confidence limit
Upper 95% confidence limit
Has multiple disadvantage Does not have multiple disadvantage 0.62 0.44 0.86Not activity tested NSA or YAO Activity tested NSA or YAO 0.63 0.42 0.94High socio-economic area (60%-100% SEIFA ) Mid-range socio-economic area (40%-60% SEIFA ) 0.96 0.64 1.44Low socio-economic area (0%- 40% SEIFA ) Mid-range socio-economic area (40%-60% SEIFA ) 0.83 0.57 1.22Moderately accessible to very remote ARIA Accessible/Highly accessible ARIA 0.77 0.38 1.59Country of birth: Medium - very high disadvantage No/low disadvantage country of birth 0.88 0.57 1.37Low-Very high disadvantage Indigenous labour market ESA No disadvantage/very low disadvantage Indigenous ESA 0.65 0.23 1.88Recent work experience: Other Full/Part-time employment 0.93 0.69 1.27Duration on income support: 24 months or more in past 10 years 0-12 months in past 10 years 1.08 0.67 1.76Duration on income support: 12-23 months in past 10 years 0-12 months in past 10 years 0.84 0.49 1.44Not contactable by phone Contactable by phone 1.08 0.45 2.55Ex-offender Not an ex-offender 2.68 1.39 5.17Mixed/Poor English proficiency Good English proficiency 0.71 0.36 1.42Socially married Not socially married 0.73 0.50 1.07Has dependent children Does not have dependent children 0.97 0.66 1.43Time since registered for JSA: Over 2 years Less than 6 months 0.47 0.28 0.78Time since registered for JSA: 1 to 2 years Less than 6 months 0.69 0.42 1.11Time since registered for JSA: 6 months to 1 year Less than 6 months 0.56 0.34 0.91
285

Stream 3
Characteristic Reference category Odds ratioLower 95% confidence limit
Upper 95% confidence limit
Has multiple disadvantage Does not have multiple disadvantage 0.55 0.42 0.72Not activity tested NSA or YAO Activity tested NSA or YAO 0.64 0.44 0.95High socio-economic area (60%-100% SEIFA ) Mid-range socio-economic area (40%-60% SEIFA ) 1.14 0.78 1.68Low socio-economic area (0%- 40% SEIFA ) Mid-range socio-economic area (40%-60% SEIFA ) 1.03 0.74 1.42Moderately accessible to very remote ARIA Accessible/Highly accessible ARIA 1.37 0.87 2.16Country of birth: Medium - very high disadvantage No/low disadvantage country of birth 1.24 0.85 1.83Low-Very high disadvantage Indigenous labour market ESA No disadvantage/very low disadvantage Indigenous ESA 0.93 0.57 1.51Recent work experience: Other Full/Part-time employment 0.81 0.61 1.07Duration on income support: 24 months or more in past 10 years 0-12 months in past 10 years 0.87 0.40 1.91Duration on income support: 12-23 months in past 10 years 0-12 months in past 10 years 1.07 0.43 2.66Not contactable by phone Contactable by phone 0.98 0.54 1.77Ex-offender Not an ex-offender 1.49 0.98 2.29Mixed/Poor English proficiency Good English proficiency 0.80 0.50 1.26Socially married Not socially married 0.72 0.53 0.99Has dependent children Does not have dependent children 1.37 0.97 1.93Time since registered for JSA: Over 2 years Less than 6 months 1.47 0.64 3.35Time since registered for JSA: 1 to 2 years Less than 6 months 1.84 0.78 4.34Time since registered for JSA: 6 months to 1 year Less than 6 months 2.46 1.01 6.01
286
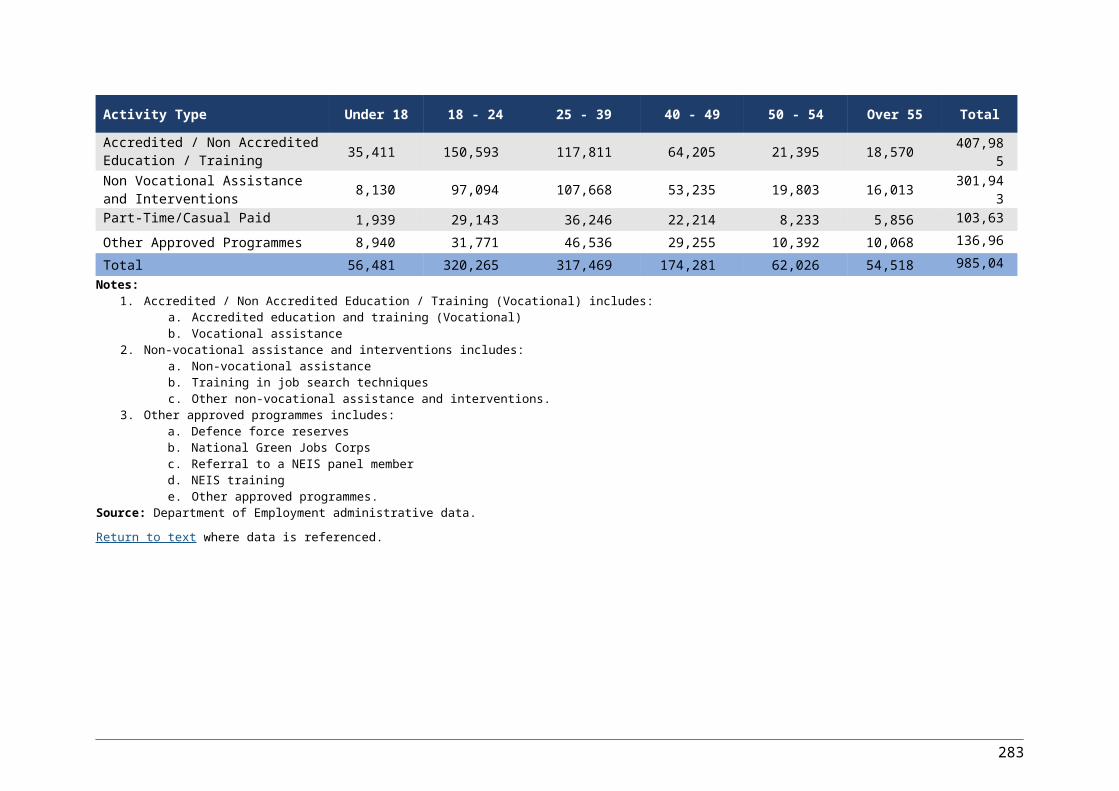
Stream 4
Characteristic Reference category Odds ratioLower 95% confidence limit
Upper 95% confidence limit
Has multiple disadvantage Does not have multiple disadvantage 0.51 0.39 0.66Not activity tested NSA or YAO Activity tested NSA or YAO 0.72 0.47 1.12High socio-economic area (60%-100% SEIFA ) Mid-range socio-economic area (40%-60% SEIFA ) 0.96 0.66 1.39Low socio-economic area (0%- 40% SEIFA ) Mid-range socio-economic area (40%-60% SEIFA ) 1.10 0.78 1.53Moderately accessible to very remote ARIA Accessible/Highly accessible ARIA 0.65 0.36 1.18Country of birth: Medium - very high disadvantage No/low disadvantage country of birth 0.88 0.57 1.36Low-Very high disadvantage Indigenous labour market ESA No disadvantage/very low disadvantage Indigenous ESA 1.29 0.71 2.34Recent work experience: Other Full/Part-time employment 0.55 0.41 0.72Duration on income support: 24 months or more in past 10 years 0-12 months in past 10 years 1.07 0.57 2.01Duration on income support: 12-23 months in past 10 years 0-12 months in past 10 years 1.44 0.71 2.89Not contactable by phone Contactable by phone 0.97 0.58 1.62Ex-offender Not an ex-offender 1.10 0.77 1.58Mixed/Poor English proficiency Good English proficiency 0.68 0.45 1.04Socially married Not socially married 0.76 0.51 1.11Has dependent children Does not have dependent children 1.08 0.79 1.47Time since registered for JSA: Over 2 years Less than 6 months 0.65 0.39 1.09Time since registered for JSA: 1 to 2 years Less than 6 months 0.68 0.40 1.16Time since registered for JSA: 6 months to 1 year Less than 6 months 0.75 0.41 1.38
287

Total Stream 2 to 4
Characteristic Reference category Odds ratioLower 95% confidence limit
Upper 95% confidence limit
Has multiple disadvantage Does not have multiple disadvantage 0.54 0.46 0.64Not activity tested NSA or YAO Activity tested NSA or YAO 0.66 0.52 0.84High socio-economic area (60%-100% SEIFA ) Mid-range socio-economic area (40%-60% SEIFA ) 1.01 0.81 1.27Low socio-economic area (0%- 40% SEIFA ) Mid-range socio-economic area (40%-60% SEIFA ) 0.96 0.78 1.17Moderately accessible to very remote ARIA Accessible/Highly accessible ARIA 0.92 0.66 1.28Country of birth: Medium - very high disadvantage No/low disadvantage country of birth 1.05 0.82 1.34Low-Very high disadvantage Indigenous labour market ESA No disadvantage/very low disadvantage Indigenous ESA 0.91 0.64 1.31Recent work experience: Other Full/Part-time employment 0.77 0.65 0.91Duration on income support: 24 months or more in past 10 years 0-12 months in past 10 years 0.99 0.71 1.39Duration on income support: 12-23 months in past 10 years 0-12 months in past 10 years 0.97 0.66 1.43Not contactable by phone Contactable by phone 0.99 0.69 1.42Ex-offender Not an ex-offender 1.48 1.15 1.90Mixed/Poor English proficiency Good English proficiency 0.71 0.53 0.95Socially married Not socially married 0.75 0.61 0.93Has dependent children Does not have dependent children 1.11 0.91 1.36Time since registered for JSA: Over 2 years Less than 6 months 0.56 0.41 0.75Time since registered for JSA: 1 to 2 years Less than 6 months 0.75 0.54 1.03Time since registered for JSA: 6 months to 1 year Less than 6 months 0.73 0.52 1.02
Notes: 1. Job seekers unemployed less than 3 months excluded from the analysis.2. See Appendix 1, Section 3.3 for a description of the methodology.
Source: Department of Employment administrative data and Stepping Stones survey, cohort 3 wave 5.Return to text where data is referenced.
288

Table A2.53: Odds ratio of achieving a 13-week employment outcome by JSA Stream of service for those who did and did not experience multiple disadvantage
Stream 2
Characteristic Reference category Odds ratioLower 95% confidence limit
Upper 95% confidence limit
Has multiple disadvantage Does not have multiple disadvantage 0.40 0.27 0.60Not activity tested NSA or YAO Activity tested NSA or YAO 0.72 0.46 1.11High socio-economic area (60%-100% SEIFA ) Mid-range socio-economic area (40%-60% SEIFA ) 0.99 0.63 1.55Low socio-economic area (0%- 40% SEIFA ) Mid-range socio-economic area (40%-60% SEIFA ) 0.74 0.49 1.14Moderately accessible to very remote ARIA Accessible/Highly accessible ARIA 1.04 0.44 2.46Country of birth: Medium - very high disadvantage No/low disadvantage country of birth 0.89 0.55 1.43Low-Very high disadvantage Indigenous labour market ESA No disadvantage/very low disadvantage Indigenous ESA 0.46 0.11 1.95Recent work experience: Other Full/Part-time employment 0.85 0.61 1.19Duration on income support: 24 months or more in past 10 years 0-12 months in past 10 years 1.13 0.67 1.88Duration on income support: 12-23 months in past 10 years 0-12 months in past 10 years 1.25 0.70 2.23Not contactable by phone Contactable by phone 0.88 0.32 2.46Ex-offender Not an ex-offender 2.15 1.15 4.04Mixed/Poor English proficiency Good English proficiency 1.00 0.46 2.21Socially married Not socially married 0.89 0.58 1.35Has dependent children Does not have dependent children 0.88 0.58 1.35Time since registered for JSA: Over 2 years Less than 6 months 0.51 0.30 0.87Time since registered for JSA: 1 to 2 years Less than 6 months 0.50 0.30 0.83Time since registered for JSA: 6 months to 1 year Less than 6 months 0.49 0.29 0.83
289
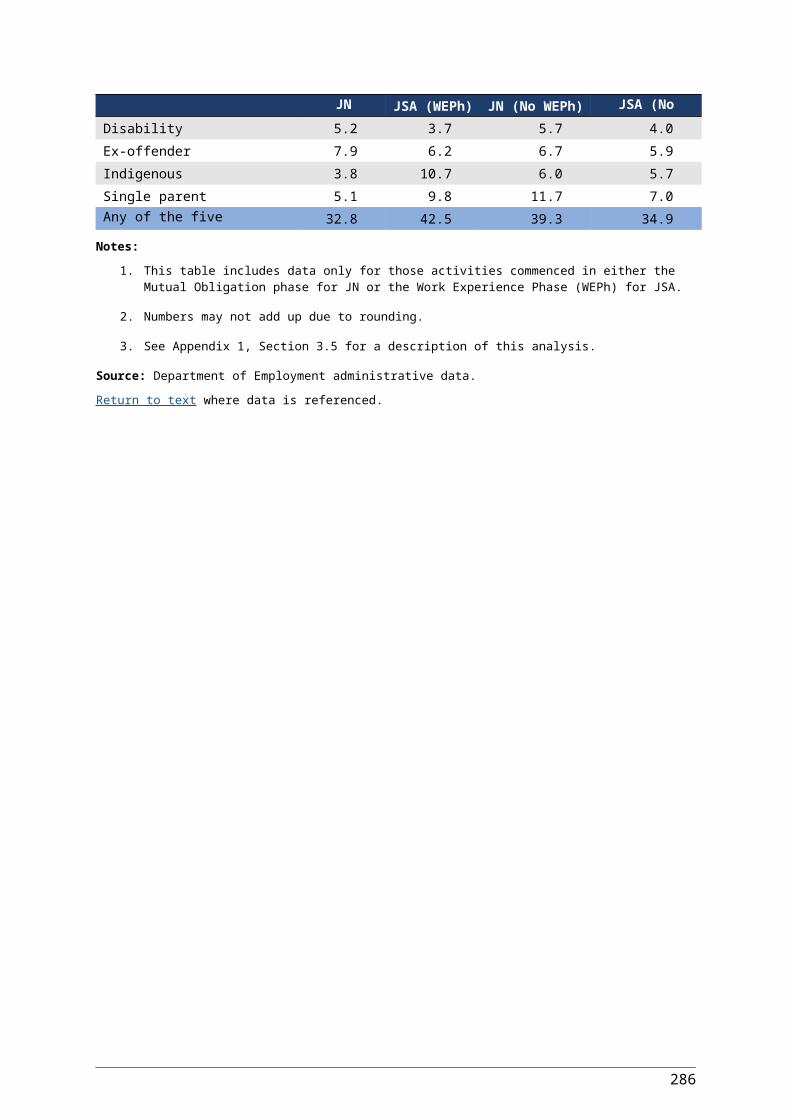
Stream 3
Characteristic Reference category Odds ratioLower 95% confidence limit
Upper 95% confidence limit
Has multiple disadvantage Does not have multiple disadvantage 0.44 0.31 0.62Not activity tested NSA or YAO Activity tested NSA or YAO 0.92 0.57 1.47High socio-economic area (60%-100% SEIFA ) Mid-range socio-economic area (40%-60% SEIFA ) 1.17 0.75 1.84Low socio-economic area (0%- 40% SEIFA ) Mid-range socio-economic area (40%-60% SEIFA ) 0.91 0.62 1.35Moderately accessible to very remote ARIA Accessible/Highly accessible ARIA 1.16 0.67 2.02Country of birth: Medium - very high disadvantage No/low disadvantage country of birth 1.09 0.68 1.73Low-Very high disadvantage Indigenous labour market ESA No disadvantage/very low disadvantage Indigenous ESA 0.85 0.46 1.58Recent work experience: Other Full/Part-time employment 0.93 0.66 1.30Duration on income support: 24 months or more in past 10 years 0-12 months in past 10 years 0.77 0.32 1.86Duration on income support: 12-23 months in past 10 years 0-12 months in past 10 years 0.72 0.25 2.06Not contactable by phone Contactable by phone 1.10 0.54 2.24Ex-offender Not an ex-offender 1.07 0.65 1.77Mixed/Poor English proficiency Good English proficiency 0.65 0.37 1.17Socially married Not socially married 0.79 0.54 1.17Has dependent children Does not have dependent children 1.25 0.83 1.88Time since registered for JSA: Over 2 years Less than 6 months 2.98 0.85 10.43Time since registered for JSA: 1 to 2 years Less than 6 months 3.71 1.02 13.47Time since registered for JSA: 6 months to 1 year Less than 6 months 5.64 1.50 21.28
290
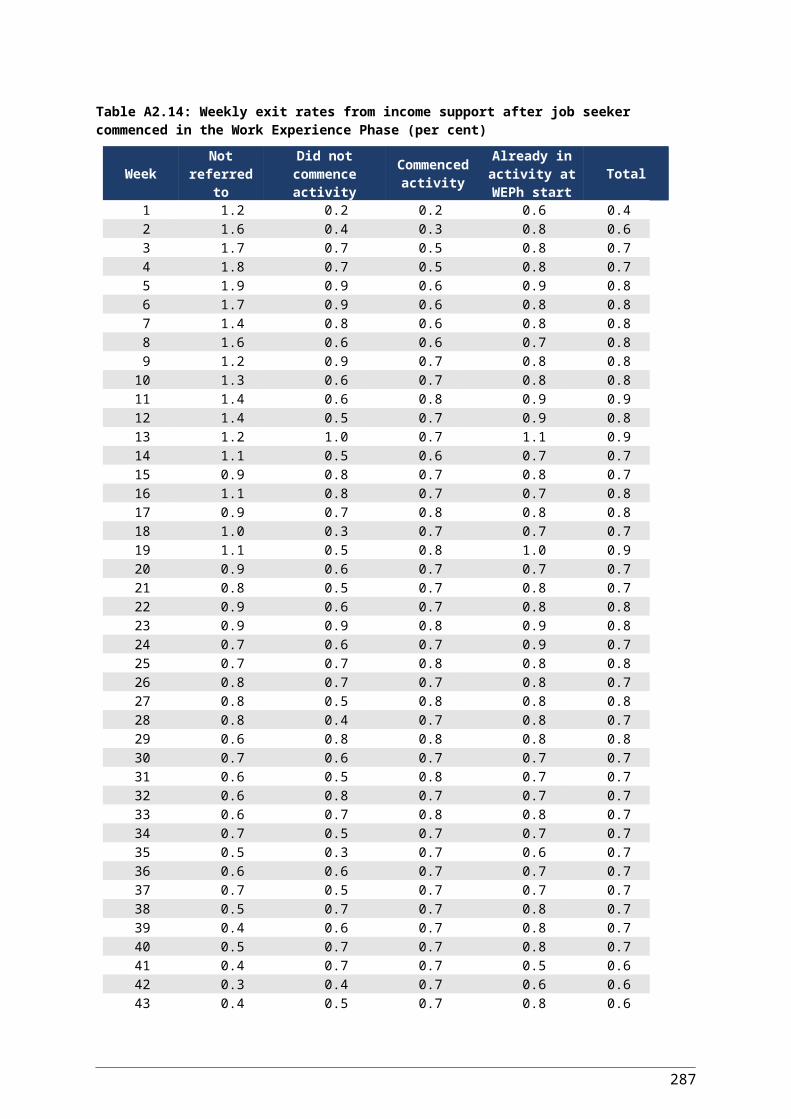
Stream 4
Characteristic Reference category Odds ratioLower 95% confidence limit
Upper 95% confidence limit
Has multiple disadvantage Does not have multiple disadvantage 0.38 0.27 0.53Not activity tested NSA or YAO Activity tested NSA or YAO 0.85 0.50 1.43High socio-economic area (60%-100% SEIFA ) Mid-range socio-economic area (40%-60% SEIFA ) 0.92 0.59 1.43Low socio-economic area (0%- 40% SEIFA ) Mid-range socio-economic area (40%-60% SEIFA ) 1.13 0.75 1.70Moderately accessible to very remote ARIA Accessible/Highly accessible ARIA 0.84 0.43 1.64Country of birth: Medium - very high disadvantage No/low disadvantage country of birth 0.72 0.41 1.25Low-Very high disadvantage Indigenous labour market ESA No disadvantage/very low disadvantage Indigenous ESA 1.78 0.89 3.55Recent work experience: Other Full/Part-time employment 0.57 0.41 0.79Duration on income support: 24 months or more in past 10 years 0-12 months in past 10 years 0.54 0.28 1.05Duration on income support: 12-23 months in past 10 years 0-12 months in past 10 years 0.66 0.31 1.43Not contactable by phone Contactable by phone 0.89 0.45 1.77Ex-offender Not an ex-offender 0.86 0.55 1.36Mixed/Poor English proficiency Good English proficiency 0.84 0.50 1.43Socially married Not socially married 0.79 0.49 1.28Has dependent children Does not have dependent children 1.07 0.73 1.57Time since registered for JSA: Over 2 years Less than 6 months 0.78 0.43 1.41Time since registered for JSA: 1 to 2 years Less than 6 months 0.84 0.46 1.55Time since registered for JSA: 6 months to 1 year Less than 6 months 0.63 0.31 1.29
291
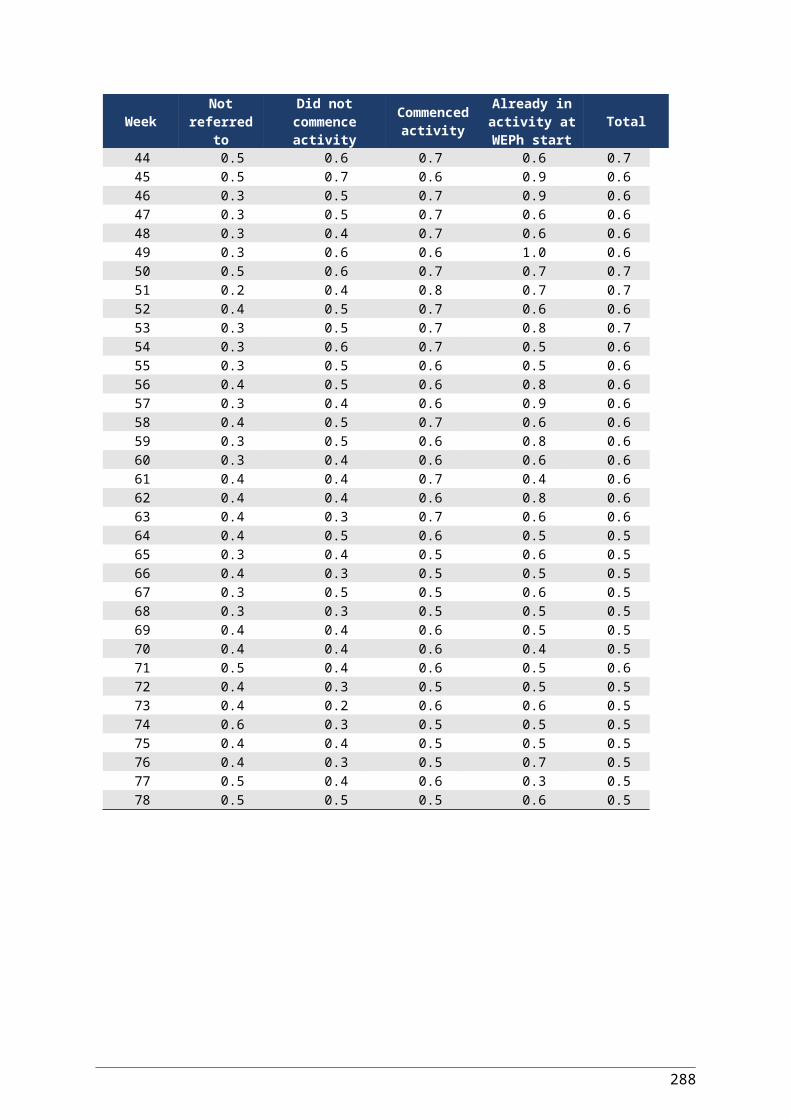
Total Stream 2-4
Characteristic Reference category Odds ratioLower 95% confidence limit
Upper 95% confidence limit
Has multiple disadvantage Does not have multiple disadvantage 0.40 0.32 0.49Not activity tested NSA or YAO Activity tested NSA or YAO 0.81 0.62 1.06High socio-economic area (60%-100% SEIFA ) Mid-range socio-economic area (40%-60% SEIFA ) 1.03 0.79 1.35Low socio-economic area (0%- 40% SEIFA ) Mid-range socio-economic area (40%-60% SEIFA ) 0.88 0.69 1.12Moderately accessible to very remote ARIA Accessible/Highly accessible ARIA 1.01 0.67 1.52Country of birth: Medium - very high disadvantage No/low disadvantage country of birth 0.99 0.75 1.31Low-Very high disadvantage Indigenous labour market ESA No disadvantage/very low disadvantage Indigenous ESA 0.90 0.58 1.39Recent work experience: Other Full/Part-time employment 0.79 0.65 0.96Duration on income support: 24 months or more in past 10 years 0-12 months in past 10 years 0.89 0.61 1.29Duration on income support: 12-23 months in past 10 years 0-12 months in past 10 years 1.02 0.67 1.57Not contactable by phone Contactable by phone 0.97 0.61 1.54Ex-offender Not an ex-offender 1.24 0.92 1.67Mixed/Poor English proficiency Good English proficiency 0.79 0.55 1.12Socially married Not socially married 0.82 0.64 1.05Has dependent children Does not have dependent children 1.04 0.82 1.32Time since registered for JSA: Over 2 years Less than 6 months 0.57 0.41 0.80Time since registered for JSA: 1 to 2 years Less than 6 months 0.65 0.46 0.93Time since registered for JSA: 6 months to 1 year Less than 6 months 0.68 0.47 0.99
Notes: 1. Job seekers unemployed less than 3 months excluded from the analysis.2. See Appendix 1, Section 3.3 for a description of the methodology.
Source: Department of Employment administrative data and Stepping Stones survey, cohort 3 wave 5.Return to text where data is referenced.
292

Table A2.54: Regression model of achieving a job placement by JSA Stream of service considering interactions of the five domains of disadvantage (maximum likelihood estimate – MLE)
Stream 2
Parameter Category Reference category MLE StandardError
WaldChi-
Square
Pr > ChiSq
Intercept 1.077 0.442 5.936 0.015Single level Material -0.153 0.357 0.184 0.668Single level Education -0.241 0.340 0.503 0.478Two way interaction Material*Education 0.044 0.543 0.007 0.936Single level Health -0.784 0.410 3.666 0.056Two way interaction Material*Health 0.321 0.598 0.288 0.592Two way interaction Education*Health 0.396 0.624 0.403 0.526Three way interaction Material*Education*Health -0.188 0.907 0.043 0.836Single level Community -0.113 0.485 0.054 0.816Two way interaction Material*Community 0.995 1.061 0.879 0.348Two way interaction Education*Community -0.636 0.733 0.754 0.385Three way interaction Material*Education*Community -0.449 1.354 0.110 0.740Two way interaction Health*Community 0.539 0.792 0.463 0.496Three way interaction Material*Health*Community -2.433 1.765 1.900 0.168Three way interaction Education*Health*Community 0.280 1.187 0.056 0.813Four way interaction Material*Education*Health*Community 1.659 2.180 0.579 0.447Single level Social -0.139 0.448 0.097 0.756Two way interaction Material*Social 0.496 0.690 0.515 0.473Two way interaction Education*Social 0.303 0.662 0.210 0.647Three way interaction Material*Education*Social -0.469 1.015 0.214 0.644Two way interaction Health*Social 1.439 0.925 2.423 0.120Three way interaction Material*Health*Social -2.052 1.245 2.716 0.099Three way interaction Education*Health*Social -2.438 1.304 3.496 0.062
293

Parameter Category Reference category MLE StandardError
WaldChi-
Square
Pr > ChiSq
Four way interaction Material*Education*Health*Social 1.470 1.803 0.665 0.415Two way interaction Community*Social -1.893 1.216 2.426 0.119Three way interaction Material*Community*Social 0.087 1.751 0.002 0.961Three way interaction Education*Community*Social 3.512 1.545 5.168 0.023Four way interaction Material*Education*Community*Social -2.630 2.264 1.349 0.246Three way interaction Health*Community*Social -13.808 1.703 65.746 <.0001Four way interaction Material*Health*Community*Social 16.457 2.627 39.234 <.0001Four way interaction Education*Health*Community*Social 12.889 2.325 30.736 <.0001Five way interaction Material*Education*Health*Community*Social -13.096 3.397 14.864 0.000Age 50 or older 25-34 years 0.027 0.317 0.007 0.932Age 35 - 49 years 25-34 years 0.202 0.317 0.404 0.525Age <25 years 25-34 years 0.358 0.328 1.195 0.274Gender Female Male 0.272 0.390 0.488 0.485Age - gender interaction Female, 50 or older Male, 50 or older -1.024 0.506 4.094 0.043Age - gender interaction Female, 35 - 49 years Male, 35 - 49 years -0.571 0.490 1.358 0.244Age - gender interaction Female, <25 years Male, <25 years -0.754 0.494 2.327 0.127Activity tested status Not activity tested NSA or YAO Activity tested NSA or YAO -0.467 0.221 4.457 0.035Socio-economic variable level 1 High socio-economic area (60%-100% SEIFA ) Mid-range socio-economic area
(40%-60% SEIFA ) -0.051 0.224 0.053 0.819
Socio-economic variable level 2 Low socio-economic area (0%- 40% SEIFA ) Mid-range socio-economic area
(40%-60% SEIFA ) -0.160 0.206 0.603 0.438
Geographic location Moderately accessible to very remote ARIA Accessible/Highly accessible ARIA -0.339 0.389 0.759 0.384
Country of birth Medium - very high disadvantage No/low disadvantage country of birth -0.152 0.242 0.392 0.532
Indigenous labour market Low-Very high disadvantage Indigenous labour market ESA
No disadvantage/very low disadvantage Indigenous ESA -0.222 0.565 0.154 0.694
Recent work experience Other Full/Part-time employment -0.047 0.170 0.077 0.782
294

Parameter Category Reference category MLE StandardError
WaldChi-
Square
Pr > ChiSq
Duration on income support level 1 24 months or more in past 10 years 0-12 months in past 10 years 0.159 0.264 0.364 0.547
Duration on income support level 2 12-23 months in past 10 years 0-12 months in past 10 years -0.207 0.291 0.505 0.478
Ability to contact by telephone Not contactable by phone Contactable by phone 0.161 0.483 0.111 0.739
Ex-offender status Ex-offender Not an ex-offender 1.075 0.357 9.072 0.003English proficiency Mixed/Poor Good -0.250 0.379 0.437 0.509Social marital status Socially married Not socially married -0.272 0.206 1.752 0.186Dependent children status Has dependent children Does not have dependent children -0.093 0.214 0.191 0.662Time since registered level 1 Over 2 years Less than 6 months -0.826 0.290 8.113 0.004Time since registered level 2 1 to 2 years Less than 6 months -0.444 0.265 2.813 0.094Time since registered level 3 6 months to 1 year Less than 6 months -0.640 0.274 5.473 0.019
Stream 3
Parameter Category Reference category MLE StandardError
WaldChi-
Square
Pr > ChiSq
Intercept 0.114 0.739 0.024 0.878Single level Material -0.042 0.378 0.012 0.912Single level Education -0.006 0.369 0.000 0.986Two way interaction Material*Education -0.492 0.542 0.826 0.363Single level Health -0.075 0.385 0.038 0.846Two way interaction Material*Health -0.555 0.572 0.943 0.332Two way interaction Education*Health -0.477 0.576 0.685 0.408Three way interaction Material*Education*Health 1.102 0.822 1.799 0.180Single level Community 1.044 0.528 3.903 0.048
295

Parameter Category Reference category MLE StandardError
WaldChi-
Square
Pr > ChiSq
Two way interaction Material*Community -1.962 0.843 5.419 0.020Two way interaction Education*Community 0.247 0.967 0.065 0.798Three way interaction Material*Education*Community 1.099 1.272 0.746 0.388Two way interaction Health*Community -0.078 0.823 0.009 0.925Three way interaction Material*Health*Community 0.589 1.211 0.237 0.627Three way interaction Education*Health*Community -0.896 1.357 0.437 0.509Four way interaction Material*Education*Health*Community -1.351 1.829 0.546 0.460Single level Social 0.550 0.547 1.012 0.315Two way interaction Material*Social -0.663 0.720 0.849 0.357Two way interaction Education*Social -0.077 0.677 0.013 0.909Three way interaction Material*Education*Social 0.631 0.911 0.479 0.489Two way interaction Health*Social -0.637 0.719 0.785 0.376Three way interaction Material*Health*Social -0.126 1.066 0.014 0.906Three way interaction Education*Health*Social 0.957 0.940 1.037 0.309Four way interaction Material*Education*Health*Social -1.230 1.350 0.831 0.362Two way interaction Community*Social -1.579 0.942 2.810 0.094Three way interaction Material*Community*Social 2.349 1.325 3.142 0.076Three way interaction Education*Community*Social -0.357 1.415 0.064 0.801Four way interaction Material*Education*Community*Social -1.718 1.828 0.883 0.347Three way interaction Health*Community*Social 1.278 1.421 0.809 0.368Four way interaction Material*Health*Community*Social -1.676 1.988 0.710 0.399Four way interaction Education*Health*Community*Social -0.400 2.013 0.039 0.843Five way interaction Material*Education*Health*Community*Social 3.403 2.667 1.629 0.202Age 50 or older 25-34 years -0.467 0.293 2.536 0.111Age 35 - 49 years 25-34 years -0.539 0.296 3.321 0.068Age <25 years 25-34 years -0.486 0.360 1.817 0.178Gender Female Male -0.727 0.331 4.826 0.028
296
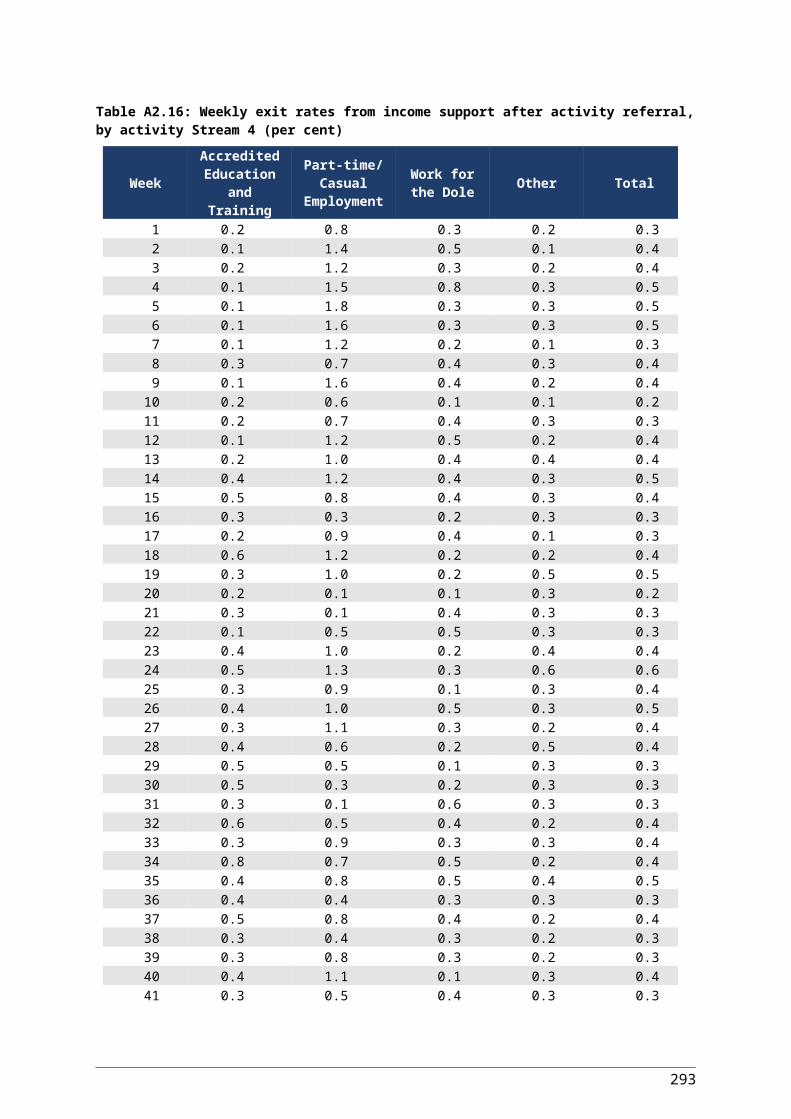
Parameter Category Reference category MLE StandardError
WaldChi-
Square
Pr > ChiSq
Age - gender interaction Female, 50 or older Male, 50 or older 0.194 0.398 0.237 0.626Age - gender interaction Female, 35 - 49 years Male, 35 - 49 years 0.573 0.396 2.094 0.148Age - gender interaction Female, <25 years Male, <25 years 0.932 0.490 3.615 0.057Activity tested status Not activity tested NSA or YAO Activity tested NSA or YAO -0.472 0.212 4.964 0.026Socio-economic variable level 1 High socio-economic area (60%-100% SEIFA ) Mid-range socio-economic area
(40%-60% SEIFA ) 0.092 0.203 0.205 0.651
Socio-economic variable level 2 Low socio-economic area (0%- 40% SEIFA ) Mid-range socio-economic area
(40%-60% SEIFA ) 0.038 0.171 0.049 0.826
Geographic location Moderately accessible to very remote ARIA Accessible/Highly accessible ARIA 0.372 0.233 2.549 0.110
Country of birth Medium - very high disadvantage No/low disadvantage country of birth 0.205 0.208 0.965 0.326
Indigenous labour market Low-Very high disadvantage Indigenous labour market ESA
No disadvantage/very low disadvantage Indigenous ESA -0.145 0.254 0.327 0.568
Recent work experience Other Full/Part-time employment -0.106 0.156 0.466 0.495Duration on income support level 1 24 months or more in past 10 years 0-12 months in past 10 years -0.236 0.437 0.292 0.589
Duration on income support level 2 12-23 months in past 10 years 0-12 months in past 10 years -0.047 0.516 0.008 0.927
Ability to contact by telephone Not contactable by phone Contactable by phone -0.090 0.310 0.085 0.770
Ex-offender status Ex-offender Not an ex-offender 0.414 0.225 3.377 0.066English proficiency Mixed/Poor Good -0.290 0.244 1.418 0.234Social marital status Socially married Not socially married -0.358 0.169 4.489 0.034Dependent children status Has dependent children Does not have dependent children 0.344 0.191 3.257 0.071Time since registered level 1 Over 2 years Less than 6 months 0.371 0.462 0.647 0.421Time since registered level 2 1 to 2 years Less than 6 months 0.615 0.476 1.668 0.197Time since registered level 3 6 months to 1 year Less than 6 months 0.925 0.495 3.496 0.062
297

Stream 4
Parameter Category Reference category MLE StandardError
WaldChi-
Square
Pr > ChiSq
Intercept 0.805 0.522 2.381 0.123Single level Material -0.943 0.611 2.388 0.122Single level Education 0.570 0.513 1.232 0.267Two way interaction Material*Education 0.261 0.787 0.110 0.740Single level Health -0.197 0.511 0.149 0.700Two way interaction Material*Health -0.012 0.793 0.000 0.988Two way interaction Education*Health -0.880 0.755 1.356 0.244Three way interaction Material*Education*Health -0.348 1.064 0.107 0.744Single level Community -0.753 0.738 1.040 0.308Two way interaction Material*Community 1.320 1.144 1.331 0.249Two way interaction Education*Community 0.061 0.949 0.004 0.948Three way interaction Material*Education*Community -1.475 1.414 1.088 0.297Two way interaction Health*Community 0.859 1.114 0.595 0.441Three way interaction Material*Health*Community -0.710 1.537 0.214 0.644Three way interaction Education*Health*Community -0.151 1.440 0.011 0.917Four way interaction Material*Education*Health*Community 1.371 1.928 0.505 0.477Single level Social 0.936 0.595 2.475 0.116Two way interaction Material*Social -0.086 0.871 0.010 0.922Two way interaction Education*Social -1.310 0.828 2.506 0.113Three way interaction Material*Education*Social 0.020 1.125 0.000 0.986Two way interaction Health*Social -0.843 0.831 1.029 0.311Three way interaction Material*Health*Social 0.342 1.152 0.088 0.766Three way interaction Education*Health*Social 1.723 1.150 2.244 0.134Four way interaction Material*Education*Health*Social -0.544 1.502 0.131 0.717Two way interaction Community*Social 0.564 1.303 0.187 0.665Three way interaction Material*Community*Social -0.022 1.831 0.000 0.991
298

Parameter Category Reference category MLE StandardError
WaldChi-
Square
Pr > ChiSq
Three way interaction Education*Community*Social 0.080 1.579 0.003 0.959Four way interaction Material*Education*Community*Social -0.019 2.161 0.000 0.993Three way interaction Health*Community*Social -0.336 1.735 0.038 0.846Four way interaction Material*Health*Community*Social -1.234 2.292 0.290 0.590Four way interaction Education*Health*Community*Social -0.068 2.154 0.001 0.975Five way interaction Material*Education*Health*Community*Social 0.649 2.779 0.055 0.815Age 50 or older 25-34 years -0.644 0.299 4.652 0.031Age 35 - 49 years 25-34 years 0.018 0.232 0.006 0.938Age <25 years 25-34 years 0.349 0.252 1.916 0.166Gender Female Male -0.398 0.318 1.566 0.211Age - gender interaction Female, 50 or older Male, 50 or older 0.199 0.463 0.184 0.668Age - gender interaction Female, 35 - 49 years Male, 35 - 49 years 0.029 0.387 0.006 0.940Age - gender interaction Female, <25 years Male, <25 years 0.117 0.421 0.077 0.781Activity tested status Not activity tested NSA or YAO Activity tested NSA or YAO -0.316 0.234 1.829 0.176Socio-economic variable level 1 High socio-economic area (60%-100% SEIFA ) Mid-range socio-economic area
(40%-60% SEIFA ) -0.041 0.200 0.041 0.839
Socio-economic variable level 2 Low socio-economic area (0%- 40% SEIFA ) Mid-range socio-economic area
(40%-60% SEIFA ) 0.123 0.181 0.464 0.496
Geographic location Moderately accessible to very remote ARIA Accessible/Highly accessible ARIA -0.437 0.311 1.980 0.159
Country of birth Medium - very high disadvantage No/low disadvantage country of birth -0.345 0.240 2.070 0.150
Indigenous labour market Low-Very high disadvantage Indigenous labour market ESA
No disadvantage/very low disadvantage Indigenous ESA 0.122 0.322 0.143 0.705
Recent work experience Other Full/Part-time employment -0.615 0.151 16.544 <.0001Duration on income support level 1 24 months or more in past 10 years 0-12 months in past 10 years 0.239 0.318 0.562 0.453
Duration on income support level 2 12-23 months in past 10 years 0-12 months in past 10 years 0.440 0.359 1.502 0.220
Ability to contact by Not contactable by phone Contactable by phone -0.199 0.278 0.513 0.474
299

Parameter Category Reference category MLE StandardError
WaldChi-
Square
Pr > ChiSq
telephoneEx-offender status Ex-offender Not an ex-offender 0.065 0.192 0.116 0.733English proficiency Mixed/Poor Good -0.370 0.227 2.645 0.104Social marital status Socially married Not socially married -0.147 0.203 0.518 0.472Dependent children status Has dependent children Does not have dependent children 0.105 0.168 0.388 0.533Time since registered level 1 Over 2 years Less than 6 months -0.417 0.280 2.226 0.136Time since registered level 2 1 to 2 years Less than 6 months -0.423 0.289 2.134 0.144Time since registered level 3 6 months to 1 year Less than 6 months -0.280 0.324 0.746 0.388
Total Stream 2-4
Parameter Category Reference category MLE StandardError
WaldChi-
Square
Pr > ChiSq
Intercept 0.921 0.271 11.555 0.001Single level Material -0.171 0.236 0.525 0.469Single level Education -0.035 0.226 0.024 0.877Two way interaction Material*Education -0.145 0.342 0.179 0.672Single level Health -0.476 0.253 3.542 0.060Two way interaction Material*Health -0.073 0.361 0.041 0.839Two way interaction Education*Health -0.102 0.371 0.075 0.784Three way interaction Material*Education*Health 0.067 0.520 0.017 0.897Single level Community 0.188 0.325 0.334 0.563Two way interaction Material*Community -0.270 0.545 0.245 0.620Two way interaction Education*Community -0.511 0.486 1.105 0.293Three way interaction Material*Education*Community 0.421 0.739 0.325 0.569Two way interaction Health*Community 0.280 0.506 0.305 0.581Three way interaction Material*Health*Community -0.457 0.768 0.353 0.552
300
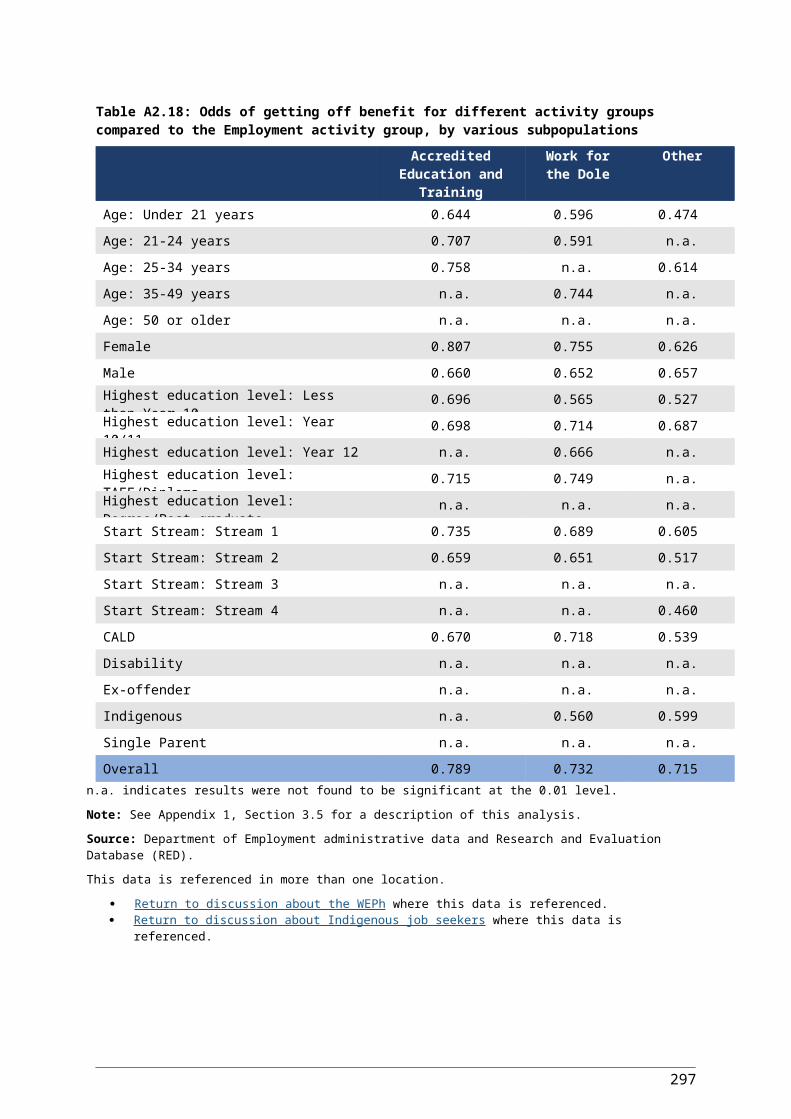
Parameter Category Reference category MLE StandardError
WaldChi-
Square
Pr > ChiSq
Three way interaction Education*Health*Community 0.157 0.745 0.045 0.833Four way interaction Material*Education*Health*Community 0.065 1.048 0.004 0.951Single level Social 0.222 0.293 0.573 0.449Two way interaction Material*Social -0.136 0.411 0.109 0.741Two way interaction Education*Social -0.026 0.398 0.004 0.948Three way interaction Material*Education*Social -0.028 0.556 0.003 0.959Two way interaction Health*Social 0.199 0.443 0.203 0.652Three way interaction Material*Health*Social -0.663 0.608 1.190 0.275Three way interaction Education*Health*Social -0.209 0.608 0.118 0.731Four way interaction Material*Education*Health*Social 0.160 0.820 0.038 0.846Two way interaction Community*Social -1.245 0.574 4.707 0.030Three way interaction Material*Community*Social 1.039 0.851 1.492 0.222Three way interaction Education*Community*Social 1.610 0.778 4.286 0.038Four way interaction Material*Education*Community*Social -1.902 1.100 2.987 0.084Three way interaction Health*Community*Social 0.255 0.891 0.082 0.774Four way interaction Material*Health*Community*Social 0.006 1.215 0.000 0.996Four way interaction Education*Health*Community*Social -0.533 1.177 0.205 0.651Five way interaction Material*Education*Health*Community*Social 1.234 1.560 0.626 0.429Age 50 or older 25-34 years -0.193 0.167 1.342 0.247Age 35 - 49 years 25-34 years -0.077 0.154 0.250 0.617Age <25 years 25-34 years 0.210 0.175 1.448 0.229Gender Female Male -0.224 0.189 1.416 0.234Age - gender interaction Female, 50 or older Male, 50 or older -0.355 0.250 2.014 0.156Age - gender interaction Female, 35 - 49 years Male, 35 - 49 years -0.038 0.231 0.028 0.868Age - gender interaction Female, <25 years Male, <25 years -0.103 0.259 0.157 0.692Activity tested status Not activity tested NSA or YAO Activity tested NSA or YAO -0.412 0.125 10.926 0.001Socio-economic variable level 1 High socio-economic area (60%-100% SEIFA ) Mid-range socio-economic area
(40%-60% SEIFA ) 0.013 0.119 0.011 0.916
301
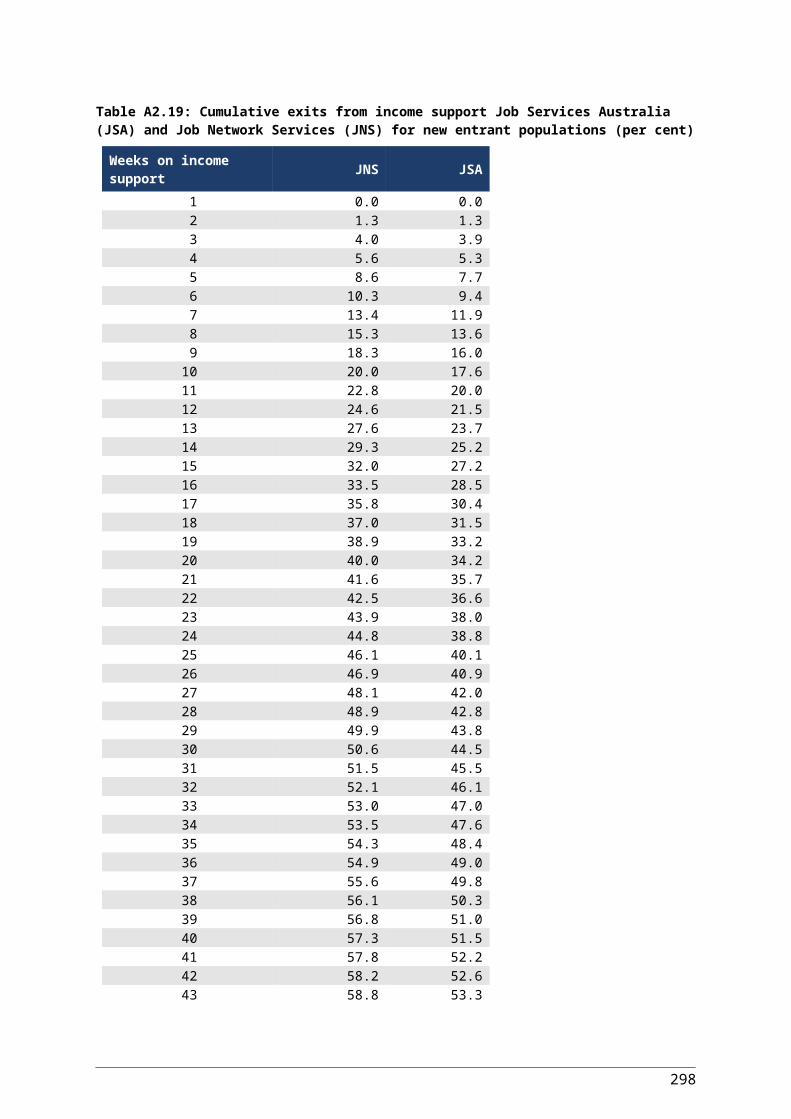
Parameter Category Reference category MLE StandardError
WaldChi-
Square
Pr > ChiSq
Socio-economic variable level 2 Low socio-economic area (0%- 40% SEIFA ) Mid-range socio-economic area
(40%-60% SEIFA ) -0.030 0.104 0.084 0.773
Geographic location Moderately accessible to very remote ARIA Accessible/Highly accessible ARIA -0.113 0.171 0.436 0.509
Country of birth Medium - very high disadvantage No/low disadvantage country of birth 0.005 0.128 0.002 0.969
Indigenous labour market Low-Very high disadvantage Indigenous labour market ESA
No disadvantage/very low disadvantage Indigenous ESA -0.136 0.181 0.568 0.451
Recent work experience Other Full/Part-time employment -0.217 0.089 5.906 0.015Duration on income support level 1 24 months or more in past 10 years 0-12 months in past 10 years 0.032 0.176 0.032 0.858
Duration on income support level 2 12-23 months in past 10 years 0-12 months in past 10 years -0.051 0.200 0.064 0.801
Ability to contact by telephone Not contactable by phone Contactable by phone -0.019 0.190 0.010 0.920
Ex-offender status Ex-offender Not an ex-offender 0.391 0.130 9.041 0.003English proficiency Mixed/Poor Good -0.311 0.149 4.346 0.037Social marital status Socially married Not socially married -0.258 0.109 5.594 0.018Dependent children status Has dependent children Does not have dependent children 0.059 0.107 0.305 0.581Time since registered level 1 Over 2 years Less than 6 months -0.595 0.163 13.254 0.000Time since registered level 2 1 to 2 years Less than 6 months -0.284 0.169 2.845 0.092Time since registered level 3 6 months to 1 year Less than 6 months -0.308 0.179 2.943 0.086
Notes: 1. Job seekers unemployed less than 3 months excluded from the analysis.2. See Appendix 1, Section 3.3 for a description of the methodology.
Source: Department of Employment administrative data and Stepping Stones survey, cohort 3 wave 5.Return to text where data is referenced.
302

Table A2.55: Regression model of achieving a 13-week employment outcome by JSA Stream of service considering interactions of the five domains of disadvantage (maximum likelihood estimate – MLE)
Stream 2
Parameter Category Reference category MLE StandardError
WaldChi-
Square
Pr > ChiSq
Intercept 0.484 0.470 1.061 0.303Single level Material -1.026 0.401 6.536 0.011Single level Education 0.117 0.356 0.108 0.742Two way interaction Material*Education -0.002 0.601 0.000 0.997Single level Health -1.053 0.454 5.391 0.020Two way interaction Material*Health 1.218 0.682 3.194 0.074Two way interaction Education*Health 0.384 0.683 0.316 0.574Three way interaction Material*Education*Health -0.868 1.055 0.678 0.410Single level Community 0.097 0.505 0.037 0.848Two way interaction Material*Community 1.175 1.011 1.352 0.245Two way interaction Education*Community -0.522 0.749 0.486 0.486Three way interaction Material*Education*Community -0.377 1.316 0.082 0.775Two way interaction Health*Community 0.403 0.864 0.218 0.641Three way interaction Material*Health*Community -2.359 1.975 1.427 0.232Three way interaction Education*Health*Community -0.436 1.370 0.101 0.750Four way interaction Material*Education*Health*Community 0.842 2.609 0.104 0.747Single level Social -0.466 0.486 0.922 0.337Two way interaction Material*Social 1.385 0.776 3.188 0.074Two way interaction Education*Social 0.656 0.695 0.891 0.345Three way interaction Material*Education*Social -1.247 1.113 1.256 0.263Two way interaction Health*Social 2.197 0.942 5.440 0.020Three way interaction Material*Health*Social -3.890 1.434 7.354 0.007Three way interaction Education*Health*Social -2.582 1.335 3.739 0.053
303
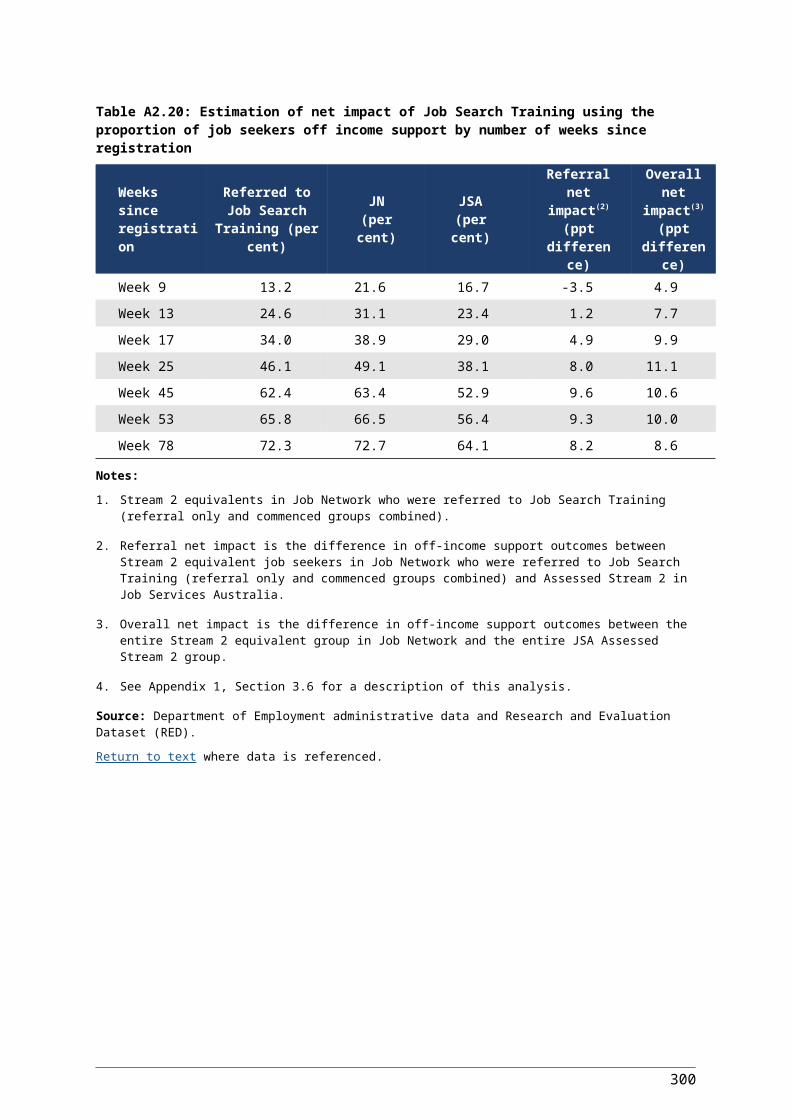
Parameter Category Reference category MLE StandardError
WaldChi-
Square
Pr > ChiSq
Four way interaction Material*Education*Health*Social 2.237 2.187 1.047 0.306Two way interaction Community*Social -1.295 1.237 1.096 0.295Three way interaction Material*Community*Social -0.540 1.764 0.094 0.760Three way interaction Education*Community*Social 0.425 1.573 0.073 0.787Four way interaction Material*Education*Community*Social -13.362 2.213 36.468 <.0001Three way interaction Health*Community*Social -15.151 1.721 77.552 <.0001Four way interaction Material*Health*Community*Social 18.513 2.848 42.271 <.0001Four way interaction Education*Health*Community*Social 16.660 2.368 49.502 <.0001Five way interaction Material*Education*Health*Community*Social -2.766 3.813 0.526 0.468Age 50 or older 25-34 years -0.265 0.361 0.538 0.464Age 35 - 49 years 25-34 years -0.099 0.353 0.079 0.779Age <25 years 25-34 years 0.036 0.352 0.010 0.919Gender Female Male 0.583 0.418 1.948 0.163Age - gender interaction Female, 50 or older Male, 50 or older -1.184 0.572 4.277 0.039Age - gender interaction Female, 35 - 49 years Male, 35 - 49 years -0.565 0.525 1.157 0.282Age - gender interaction Female, <25 years Male, <25 years -1.173 0.537 4.772 0.029Activity tested status Not activity tested NSA or YAO Activity tested NSA or YAO -0.424 0.240 3.133 0.077Socio-economic variable level 1 High socio-economic area (60%-100% SEIFA ) Mid-range socio-economic area
(40%-60% SEIFA ) 0.065 0.245 0.070 0.791
Socio-economic variable level 2 Low socio-economic area (0%- 40% SEIFA ) Mid-range socio-economic area
(40%-60% SEIFA ) -0.182 0.232 0.617 0.432
Geographic location Moderately accessible to very remote ARIA Accessible/Highly accessible ARIA -0.135 0.452 0.089 0.766
Country of birth Medium - very high disadvantage No/low disadvantage country of birth -0.097 0.264 0.135 0.713
Indigenous labour market Low-Very high disadvantage Indigenous labour market ESA
No disadvantage/very low disadvantage Indigenous ESA -0.694 0.708 0.962 0.327
Recent work experience Other Full/Part-time employment -0.069 0.188 0.134 0.715Duration on income support 24 months or more in past 10 years 0-12 months in past 10 years 0.109 0.279 0.153 0.696
304

Parameter Category Reference category MLE StandardError
WaldChi-
Square
Pr > ChiSq
level 1Duration on income support level 2 12-23 months in past 10 years 0-12 months in past 10 years 0.195 0.318 0.377 0.539
Ability to contact by telephone Not contactable by phone Contactable by phone -0.217 0.555 0.154 0.695
Ex-offender status Ex-offender Not an ex-offender 0.744 0.356 4.367 0.037English proficiency Mixed/Poor Good 0.028 0.417 0.005 0.946Social marital status Socially married Not socially married -0.032 0.231 0.019 0.891Dependent children status Has dependent children Does not have dependent children -0.271 0.238 1.299 0.254Time since registered level 1 Over 2 years Less than 6 months -0.649 0.302 4.628 0.031Time since registered level 2 1 to 2 years Less than 6 months -0.731 0.281 6.757 0.009Time since registered level 3 6 months to 1 year Less than 6 months -0.667 0.291 5.259 0.022
Stream 3
Parameter Category Reference category MLE StandardError
WaldChi-
Square
Pr > ChiSq
Intercept -0.839 0.972 0.745 0.388Single level Material -0.693 0.440 2.479 0.115Single level Education -0.211 0.389 0.295 0.587Two way interaction Material*Education -0.036 0.632 0.003 0.955Single level Health -0.376 0.414 0.824 0.364Two way interaction Material*Health 0.047 0.649 0.005 0.942Two way interaction Education*Health -0.414 0.658 0.396 0.529Three way interaction Material*Education*Health 0.290 0.994 0.085 0.770Single level Community 0.400 0.561 0.509 0.476Two way interaction Material*Community -0.704 0.927 0.577 0.448Two way interaction Education*Community -0.116 1.012 0.013 0.909
305
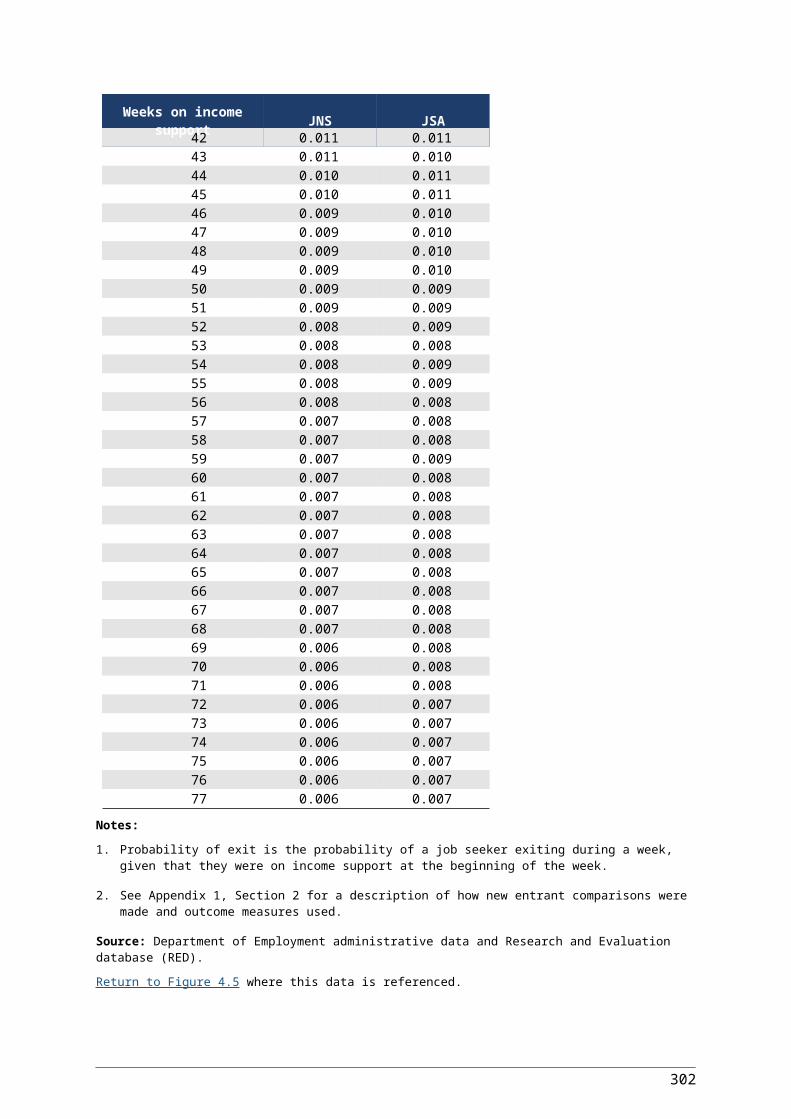
Parameter Category Reference category MLE StandardError
WaldChi-
Square
Pr > ChiSq
Three way interaction Material*Education*Community 0.563 1.474 0.146 0.703Two way interaction Health*Community 0.393 0.816 0.232 0.630Three way interaction Material*Health*Community -0.847 1.384 0.375 0.541Three way interaction Education*Health*Community -0.592 1.492 0.158 0.691Four way interaction Material*Education*Health*Community 0.476 2.203 0.047 0.829Single level Social -0.014 0.571 0.001 0.980Two way interaction Material*Social -0.272 0.831 0.107 0.743Two way interaction Education*Social 0.587 0.706 0.691 0.406Three way interaction Material*Education*Social 0.189 1.050 0.032 0.857Two way interaction Health*Social -0.772 0.814 0.900 0.343Three way interaction Material*Health*Social 0.486 1.262 0.148 0.700Three way interaction Education*Health*Social 0.773 1.072 0.520 0.471Four way interaction Material*Education*Health*Social -1.660 1.645 1.019 0.313Two way interaction Community*Social -1.379 1.155 1.425 0.233Three way interaction Material*Community*Social 1.417 1.675 0.715 0.398Three way interaction Education*Community*Social -0.599 1.648 0.132 0.716Four way interaction Material*Education*Community*Social -0.533 2.262 0.056 0.814Three way interaction Health*Community*Social 1.460 1.707 0.732 0.392Four way interaction Material*Health*Community*Social -0.997 2.509 0.158 0.691Four way interaction Education*Health*Community*Social -0.154 2.445 0.004 0.950Five way interaction Material*Education*Health*Community*Social 1.125 3.409 0.109 0.741Age 50 or older 25-34 years -0.567 0.346 2.681 0.102Age 35 - 49 years 25-34 years -0.553 0.342 2.612 0.106Age <25 years 25-34 years -0.869 0.444 3.836 0.050Gender Female Male -0.645 0.376 2.933 0.087Age - gender interaction Female, 50 or older Male, 50 or older 0.028 0.472 0.003 0.953Age - gender interaction Female, 35 - 49 years Male, 35 - 49 years 0.405 0.453 0.803 0.370
306

Parameter Category Reference category MLE StandardError
WaldChi-
Square
Pr > ChiSq
Age - gender interaction Female, <25 years Male, <25 years 0.554 0.619 0.800 0.371Activity tested status Not activity tested NSA or YAO Activity tested NSA or YAO -0.106 0.250 0.180 0.672Socio-economic variable level 1 High socio-economic area (60%-100% SEIFA ) Mid-range socio-economic area
(40%-60% SEIFA ) 0.092 0.243 0.143 0.705
Socio-economic variable level 2 Low socio-economic area (0%- 40% SEIFA ) Mid-range socio-economic area
(40%-60% SEIFA ) -0.113 0.211 0.288 0.592
Geographic location Moderately accessible to very remote ARIA Accessible/Highly accessible ARIA 0.222 0.292 0.580 0.446
Country of birth Medium - very high disadvantage No/low disadvantage country of birth 0.077 0.251 0.095 0.758
Indigenous labour market Low-Very high disadvantage Indigenous labour market ESA
No disadvantage/very low disadvantage Indigenous ESA -0.179 0.318 0.317 0.574
Recent work experience Other Full/Part-time employment 0.079 0.190 0.174 0.676Duration on income support level 1 24 months or more in past 10 years 0-12 months in past 10 years -0.355 0.507 0.489 0.485
Duration on income support level 2 12-23 months in past 10 years 0-12 months in past 10 years -0.417 0.607 0.473 0.492
Ability to contact by telephone Not contactable by phone Contactable by phone 0.042 0.365 0.013 0.908
Ex-offender status Ex-offender Not an ex-offender 0.051 0.275 0.034 0.854English proficiency Mixed/Poor Good -0.451 0.296 2.323 0.127Social marital status Socially married Not socially married -0.261 0.204 1.649 0.199Dependent children status Has dependent children Does not have dependent children 0.251 0.226 1.232 0.267Time since registered level 1 Over 2 years Less than 6 months 1.094 0.698 2.455 0.117Time since registered level 2 1 to 2 years Less than 6 months 1.302 0.720 3.270 0.071Time since registered level 3 6 months to 1 year Less than 6 months 1.753 0.738 5.649 0.018
307

Stream 4
Parameter Category Reference category MLE StandardError
WaldChi-
Square
Pr > ChiSq
Intercept 0.455 0.567 0.643 0.423Single level Material -0.950 0.713 1.774 0.183Single level Education 0.649 0.501 1.674 0.196Two way interaction Material*Education -1.043 0.935 1.243 0.265Single level Health -0.305 0.549 0.308 0.579Two way interaction Material*Health 0.283 0.914 0.096 0.757Two way interaction Education*Health -0.917 0.784 1.369 0.242Three way interaction Material*Education*Health 0.490 1.252 0.153 0.696Single level Community 0.053 0.691 0.006 0.938Two way interaction Material*Community 0.356 1.216 0.086 0.770Two way interaction Education*Community -0.454 0.894 0.258 0.611Three way interaction Material*Education*Community -0.031 1.568 0.000 0.984Two way interaction Health*Community -1.455 1.318 1.219 0.270Three way interaction Material*Health*Community 1.219 1.793 0.462 0.497Three way interaction Education*Health*Community 2.064 1.594 1.677 0.195Four way interaction Material*Education*Health*Community -1.534 2.270 0.457 0.499Single level Social 0.411 0.597 0.473 0.492Two way interaction Material*Social -0.348 1.009 0.119 0.730Two way interaction Education*Social -0.920 0.800 1.323 0.250Three way interaction Material*Education*Social 0.887 1.320 0.451 0.502Two way interaction Health*Social -0.332 0.873 0.145 0.704Three way interaction Material*Health*Social 0.037 1.339 0.001 0.978Three way interaction Education*Health*Social 0.852 1.198 0.506 0.477Four way interaction Material*Education*Health*Social -0.785 1.782 0.194 0.660Two way interaction Community*Social -0.484 1.256 0.149 0.700Three way interaction Material*Community*Social 2.056 1.862 1.219 0.270
308

Parameter Category Reference category MLE StandardError
WaldChi-
Square
Pr > ChiSq
Three way interaction Education*Community*Social 1.035 1.506 0.472 0.492Four way interaction Material*Education*Community*Social -2.548 2.304 1.223 0.269Three way interaction Health*Community*Social 2.363 1.885 1.571 0.210Four way interaction Material*Health*Community*Social -5.244 2.574 4.152 0.042Four way interaction Education*Health*Community*Social -2.861 2.265 1.596 0.207Five way interaction Material*Education*Health*Community*Social 5.854 3.190 3.367 0.067Age 50 or older 25-34 years -0.433 0.399 1.183 0.277Age 35 - 49 years 25-34 years 0.336 0.272 1.528 0.217Age <25 years 25-34 years -0.282 0.323 0.761 0.383Gender Female Male -0.311 0.406 0.588 0.443Age - gender interaction Female, 50 or older Male, 50 or older 0.271 0.611 0.197 0.658Age - gender interaction Female, 35 - 49 years Male, 35 - 49 years -0.280 0.488 0.329 0.566Age - gender interaction Female, <25 years Male, <25 years 0.647 0.527 1.505 0.220Activity tested status Not activity tested NSA or YAO Activity tested NSA or YAO -0.192 0.284 0.458 0.498Socio-economic variable level 1 High socio-economic area (60%-100% SEIFA ) Mid-range socio-economic area
(40%-60% SEIFA ) -0.088 0.241 0.132 0.716
Socio-economic variable level 2 Low socio-economic area (0%- 40% SEIFA ) Mid-range socio-economic area
(40%-60% SEIFA ) 0.190 0.220 0.746 0.388
Geographic location Moderately accessible to very remote ARIA Accessible/Highly accessible ARIA -0.201 0.371 0.295 0.587
Country of birth Medium - very high disadvantage No/low disadvantage country of birth -0.506 0.296 2.921 0.087
Indigenous labour market Low-Very high disadvantage Indigenous labour market ESA
No disadvantage/very low disadvantage Indigenous ESA 0.263 0.374 0.496 0.482
Recent work experience Other Full/Part-time employment -0.492 0.184 7.107 0.008Duration on income support level 1 24 months or more in past 10 years 0-12 months in past 10 years -0.361 0.368 0.962 0.327
Duration on income support level 2 12-23 months in past 10 years 0-12 months in past 10 years -0.246 0.419 0.343 0.558
309
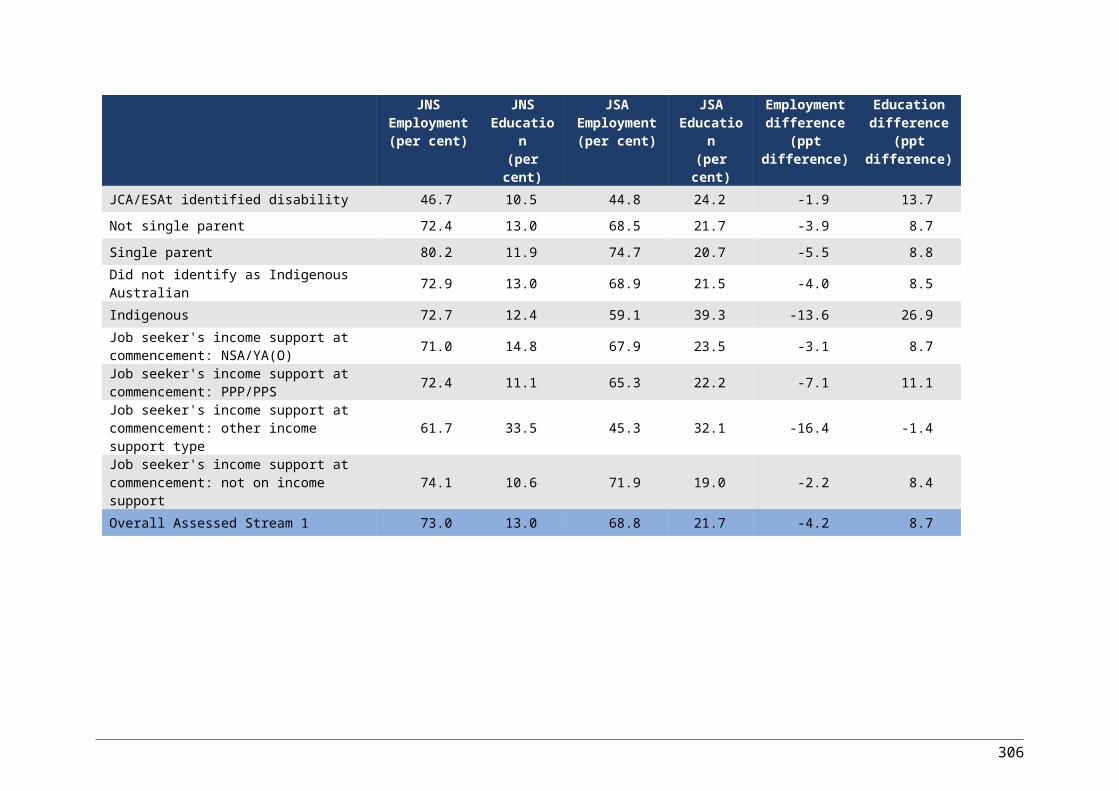
Parameter Category Reference category MLE StandardError
WaldChi-
Square
Pr > ChiSq
Ability to contact by telephone Not contactable by phone Contactable by phone -0.344 0.371 0.859 0.354
Ex-offender status Ex-offender Not an ex-offender -0.249 0.252 0.979 0.322English proficiency Mixed/Poor Good -0.163 0.296 0.304 0.581Social marital status Socially married Not socially married -0.117 0.258 0.204 0.652Dependent children status Has dependent children Does not have dependent children 0.029 0.201 0.020 0.887Time since registered level 1 Over 2 years Less than 6 months -0.301 0.334 0.810 0.368Time since registered level 2 1 to 2 years Less than 6 months -0.275 0.343 0.642 0.423Time since registered level 3 6 months to 1 year Less than 6 months -0.528 0.391 1.826 0.177
Total Stream 2 to 4
Parameter Category Reference category MLE StandardError
WaldChi-
Square
Pr > ChiSq
Intercept 0.392 0.297 1.737 0.188Single level Material -0.854 0.272 9.843 0.002Single level Education 0.170 0.235 0.522 0.470Two way interaction Material*Education -0.202 0.394 0.263 0.608Single level Health -0.685 0.271 6.376 0.012Two way interaction Material*Health 0.652 0.409 2.543 0.111Two way interaction Education*Health -0.161 0.410 0.153 0.696Three way interaction Material*Education*Health -0.351 0.615 0.325 0.569Single level Community 0.212 0.331 0.412 0.521Two way interaction Material*Community 0.256 0.593 0.186 0.666Two way interaction Education*Community -0.416 0.482 0.744 0.389Three way interaction Material*Education*Community 0.139 0.800 0.030 0.862Two way interaction Health*Community 0.048 0.530 0.008 0.928Three way interaction Material*Health*Community -0.934 0.876 1.136 0.287
310
Parameter Category Reference category MLE StandardError
WaldChi-
Square
Pr > ChiSq
Three way interaction Education*Health*Community 0.133 0.797 0.028 0.868Four way interaction Material*Education*Health*Community 0.137 1.228 0.012 0.911Single level Social -0.193 0.299 0.419 0.517Two way interaction Material*Social 0.409 0.468 0.764 0.382Two way interaction Education*Social 0.270 0.406 0.443 0.506Three way interaction Material*Education*Social -0.396 0.633 0.391 0.532Two way interaction Health*Social 0.502 0.475 1.120 0.290Three way interaction Material*Health*Social -1.323 0.708 3.499 0.061Three way interaction Education*Health*Social -0.541 0.666 0.660 0.417Four way interaction Material*Education*Health*Social 0.554 0.978 0.320 0.571Two way interaction Community*Social -1.067 0.663 2.585 0.108Three way interaction Material*Community*Social 0.544 0.985 0.305 0.581Three way interaction Education*Community*Social 0.464 0.850 0.298 0.585Four way interaction Material*Education*Community*Social -1.035 1.262 0.672 0.412Three way interaction Health*Community*Social 0.563 0.989 0.323 0.570Four way interaction Material*Health*Community*Social 0.142 1.433 0.010 0.921Four way interaction Education*Health*Community*Social 0.191 1.300 0.022 0.883Five way interaction Material*Education*Health*Community*Social 1.034 1.864 0.308 0.579Age 50 or older 25-34 years -0.259 0.199 1.698 0.193Age 35 - 49 years 25-34 years -0.026 0.179 0.022 0.883Age <25 years 25-34 years -0.201 0.202 0.993 0.319Gender Female Male 0.057 0.216 0.069 0.793Age - gender interaction Female, 50 or older Male, 50 or older -0.583 0.301 3.750 0.053Age - gender interaction Female, 35 - 49 years Male, 35 - 49 years -0.323 0.269 1.443 0.230Age - gender interaction Female, <25 years Male, <25 years -0.275 0.301 0.835 0.361Activity tested status Not activity tested NSA or YAO Activity tested NSA or YAO -0.252 0.142 3.144 0.076Socio-economic variable level 1 High socio-economic area (60%-100% SEIFA ) Mid-range socio-economic area
(40%-60% SEIFA ) 0.032 0.139 0.054 0.816
311

Parameter Category Reference category MLE StandardError
WaldChi-
Square
Pr > ChiSq
Socio-economic variable level 2 Low socio-economic area (0%- 40% SEIFA ) Mid-range socio-economic area
(40%-60% SEIFA ) -0.097 0.126 0.598 0.439
Geographic location Moderately accessible to very remote ARIA Accessible/Highly accessible ARIA -0.026 0.213 0.015 0.902
Country of birth Medium - very high disadvantage No/low disadvantage country of birth 0.004 0.148 0.001 0.976
Indigenous labour market Low-Very high disadvantage Indigenous labour market ESA
No disadvantage/very low disadvantage Indigenous ESA -0.174 0.221 0.618 0.432
Recent work experience Other Full/Part-time employment -0.128 0.106 1.454 0.228Duration on income support level 1 24 months or more in past 10 years 0-12 months in past 10 years -0.096 0.196 0.238 0.626
Duration on income support level 2 12-23 months in past 10 years 0-12 months in past 10 years -0.002 0.227 0.000 0.992
Ability to contact by telephone Not contactable by phone Contactable by phone -0.069 0.242 0.081 0.777
Ex-offender status Ex-offender Not an ex-offender 0.154 0.161 0.910 0.340English proficiency Mixed/Poor Good -0.235 0.185 1.611 0.204Social marital status Socially married Not socially married -0.171 0.133 1.639 0.200Dependent children status Has dependent children Does not have dependent children -0.044 0.126 0.124 0.725Time since registered level 1 Over 2 years Less than 6 months -0.541 0.184 8.592 0.003Time since registered level 2 1 to 2 years Less than 6 months -0.426 0.191 4.983 0.026Time since registered level 3 6 months to 1 year Less than 6 months -0.343 0.200 2.934 0.087
Notes: 1. Job seekers unemployed less than 3 months excluded from the analysis.2. See Appendix 1, Section 3.3 for a description of the methodology.
Source: Department of Employment administrative data and Stepping Stones survey, cohort 3 wave 5.Return to text where data is referenced.
312

Table A2.56: JSA active caseload, disadvantaged groups by stream, September 2010 (per cent)
Stream 1 Limited Stream 1 Stream 2 Stream 3 Stream 4 Total
Very long-term unemployed0.3
2.4 13.7 50.6 33.0 100.0
Long-term unemployed0.4
8.3 24.6 39.5 27.2 100.0
Mature age 50 or over3.1
12.1 31.1 41.3 12.4 100.0
Youth under 210.3
19.5 42.1 17.2 20.9 100.0
Single parents1.9
13.6 30.8 39.6 14.0 100.0
Ex-offenders0.6
9.8 22.8 28.0 38.8 100.0
Homeless0.8
6.0 18.2 23.7 51.3 100.0
Mixed or poor English proficiency1.4
7.5 21.3 40.6 29.1 100.0
Disability based on ESAt or JCA1.1
9.8 20.0 34.1 34.9 100.0
Indigenous1.2
2.5 14.4 53.4 28.5 100.0
Note: Numbers may not add up due to rounding.Source: Department of Employment administrative data and Research and Evaluation database (RED).Return to Figure 7.2 where this data is referenced.
313

Table A2.57: Time to recommendation to Stream 4 type services, JNS and JSA new entrant populations (per cent)
Weeks to recommendation
JN
JS1 1
04.2 1
7143 2
3234 2
7295 3
0336 3
3367 3
5388 3
7419 3
94210 4
14411 4
24612 4
44713 4
54914 4
65015 4
85216 5
05417 5
15618 5
25819 5
45920 5
56121 5
66222 5
86323 5
96524 6
06625 6
16726 6
26827 6
36928 6
47129 6
57230 6
67331 6
77432 6
87533 6
97634 7
07635 7
17736 7
27837 7
37938 7
38039 7
48040 7
58141 7
68242 7
68243 7
78344 7
88445 7
884
314

Weeks to recommendation
JN
JS46 7
98547 7
98548 8
08649 8
18650 8
18751 8
28852 8
28853 8
38954 8
38955 8
48956 8
49057 8
59058 8
59159 8
69160 8
69261 8
79262 8
79263 8
79264 8
89365 8
89366 8
99367 8
99468 8
99469 9
09470 9
09471 9
09572 9
19573 9
19574 9
19575 9
29576 9
29677 9
29678 9
39679 9
39680 9
39681 9
49682 9
49783 9
49784 9
59785 9
59786 9
59787 9
59788 9
59789 9
69890 9
69891 9
69892 9
69893 9
698
315

Weeks to recommendation
JN
JS94 9
79895 9
79896 9
79897 9
79898 9
79899 9
798100 9
899101 9
899102 9
899103 9
899104 9
899105 9
899106 9
899107 9
899108 9
999109 9
999110 9
999111 9
999112 9
999113 9
999114 9
999115 9
999116 9
999117 9
999118 9
999119 9
999120 9
999121 9
999122 9
910123 9
910124 9
910125 9
910126 9
910127 1
010128 1
010129 1
010130 1
010
Note: See Appendix 1, Section 2 for a description of how new entrant comparisons were made and outcome measures used.Source: Department of Employment administrative data.Return to text where data is referenced.
316

Table A2.58: Time to placement in Stream 4 type services, JNS and JSA new entrant populations (per cent)
Weeks to placement JPET PSP JSA
1 26.1 0.4 3.82 29.1 2.1 10.63 32.0 4.1 17.74 34.3 6.1 23.15 36.2 7.9 27.16 38.1 9.6 30.37 39.8 11.0 32.98 41.3 12.4 35.29 42.7 13.7 37.3
10 43.9 14.9 39.111 45.2 16.1 41.012 46.5 17.3 42.613 47.8 18.4 44.414 49.2 19.5 46.315 50.5 20.8 48.316 51.7 21.9 50.417 52.8 23.3 52.518 53.9 24.6 54.319 54.8 25.9 56.120 55.9 26.9 57.921 57.2 28.0 59.522 58.3 29.1 61.023 59.6 30.1 62.424 60.7 31.3 63.725 61.9 32.4 65.026 63.2 33.5 66.327 64.5 34.6 67.528 65.5 35.8 68.629 66.7 36.9 69.930 67.9 38.0 71.131 69.0 39.2 72.232 70.0 40.3 73.333 71.2 41.2 74.334 72.3 42.1 75.335 73.4 43.0 76.236 74.2 43.9 77.137 75.1 44.9 77.938 75.8 45.9 78.739 76.4 46.8 79.640 77.1 47.6 80.341 77.7 48.3 81.142 78.2 49.1 81.743 78.9 49.8 82.544 79.4 50.7 83.145 80.1 51.6 83.7
317

Weeks to placement JPET PSP JSA
46 80.6 52.4 84.447 81.1 53.2 85.048 81.6 53.8 85.549 82.1 54.5 86.150 82.6 55.1 86.651 83.1 55.8 87.252 83.5 56.5 87.753 83.9 57.1 88.354 84.3 57.8 88.855 84.9 58.5 89.256 85.2 59.2 89.757 85.6 59.9 90.258 85.9 60.5 90.759 86.3 61.3 91.060 86.7 61.8 91.561 87.1 62.3 91.862 87.4 62.9 92.263 87.8 63.6 92.564 88.3 64.1 92.865 88.6 64.8 93.166 89.0 65.3 93.567 89.3 65.8 93.768 89.7 66.3 94.069 90.0 66.8 94.270 90.3 67.4 94.571 90.5 67.9 94.872 90.9 68.4 95.073 91.1 68.9 95.274 91.3 69.4 95.475 91.6 69.9 95.676 91.9 70.4 95.877 92.1 70.9 96.078 92.4 71.4 96.279 92.6 71.9 96.380 93.0 72.3 96.581 93.3 72.7 96.782 93.7 73.2 96.983 93.9 73.7 97.084 94.2 74.1 97.285 94.4 74.5 97.386 94.6 75.0 97.587 94.8 75.4 97.688 94.9 75.8 97.889 95.2 76.3 97.990 95.4 76.7 98.091 95.5 77.1 98.192 95.7 77.4 98.2
318

Weeks to placement JPET PSP JSA
93 95.8 77.8 98.394 95.9 78.2 98.495 96.1 78.5 98.596 96.3 78.8 98.697 96.4 79.1 98.798 96.6 79.5 98.799 96.7 79.8 98.8
100 96.9 80.1 98.9101 97.0 80.5 99.0102 97.1 80.8 99.1103 97.2 81.1 99.2104 97.3 81.4 99.3105 97.4 81.6 99.3106 97.5 82.0 99.4107 97.5 82.3 99.4108 97.6 82.6 99.5109 97.7 82.9 99.5110 97.8 83.3 99.6111 98.0 83.6 99.6112 98.0 84.0 99.7113 98.2 84.3 99.7114 98.3 84.6 99.7115 98.3 84.9 99.8116 98.3 85.0 99.8117 98.4 85.3 99.8118 98.4 85.6 99.9119 98.4 85.9 99.9120 98.6 86.2 99.9121 98.6 86.5 99.9122 98.7 86.7 99.9123 98.8 87.0 100.0124 98.9 87.4 100.0125 98.9 87.7 100.0126 99.0 87.9 100.0127 99.1 88.4 100.0128 99.1 88.5 100.0129 99.1 88.6 100.0130 99.3 88.7 100.0
Note: See Appendix 1, Section 2 for a description of how new entrant comparisons were made and outcome measures used.Source: Department of Employment administrative data.Return to Figure 7.3 where this data is referenced.
319

Table A2.59: Characteristics of JNS and JSA LTU study populations and total Active Caseload (per cent)
JNS stud
y popu
JSA study
JNS active
JSA ac
Assessed Stream: Stream 1 (Limited) 7. 0 8 2
Assessed Stream: Stream 1 1 1 3 3
Assessed Stream: Stream 2 1 2 1 2
Assessed Stream: Stream 3 3 3 2 2
Assessed Stream: Stream 4 1 2 1 1
Unable to allocate (JSCI not valid for assessed 3. 0 2 1
Actual Stream: Stream 1 (Limited) N 0 N 2
Actual Stream: Stream 1 N 8 N 1
Actual Stream: Stream 2 N 2 N 3
Actual Stream: Stream 3 N 3 N 2
Actual Stream: Stream 4 N 2 N 1
Actual Stream: Unable to allocate N 0 N 0
Male less than 21 years old 7. 6 9 7
Male 21 to 24 years old 6. 6 6 7
Male 25 to 34 years old 1 1 1 1
Male 35 to 49 years old 1 1 1 1
Male 50 to 64 years old 1 1 9 9
Male 65 years and over 0. 0 0 0
Male total 5 5 5 5
Males average age 3 3 3 3
Female less than 21 years old 7. 5 9 6
Female 21 to 24 years old 6. 4 5 4
Female 25 to 34 years old 8. 8 9 8
Female 35 to 49 years old 1 1 1 1
Female 50 to 64 years old 9. 1 8 8
Female 65 years and over 0. 0 0 0
Female total 4 4 4 4
Females average age 3 3 3 3
Persons less than 21 years old 1 1 1 1
Persons 21 to 24 years old 1 1 1 1
Persons 25 to 34 years old 1 2 2 2
Persons 35 to 49 years old 3 3 3 3
Persons 50 to 64 years old 2 2 1 1
Persons 65 years and over 0. 0 0 0
Persons total 1 1 1 1
Persons average age 3 3 3 3
Indigenous 1 1 1 1
320

JNS stud
y popu
JSA study
JNS active
JSA ac
Did not identify as Indigenous 8 8 8 8
Culturally and Linguistically Diverse 1 1 1 1
Disability based on ESAt or JCA 3 2 2 2
Disability based on JSCI only 4. 1 4 9
Total people with disability 3 3 2 3
Mixed or poor English proficiency 1 1 1 1
Homeless 1 1 1 1
Ex-offenders 1 1 1 1
Single parents 1 1 1 1
Benefit type: Newstart Allowance 5 6 4 6
Youth Allowance (Other) 6. 8 7 9
Disability Support Pension 7. 2 4 1
Parenting Payment Partnered 2. 2 3 1
Parenting Payment Single 1 1 1 1
Other income support type 3. 1 2 1
Not in income support 1 6 2 1
Newstart Allowance, full-time participation 5 5 4 4
Newstart Allowance, part-time 4. 1 4 9
Youth Allowance (Other), full-time 6. 7 6 9
Youth Allowance (Other), part-time 0. 0 0 0
Disability Support Pension, full or part-time 0. 0 0 0
Disability Support Pension, volunteer 6. 1 4 1
Parenting Payment, part-time participation 8. 1 1 1
Parenting Payment, volunteer 5. 1 5 2
Other benefit type and participation 1 8 2 1
Highest level of education: Less than Year 2 2 2 1
Highest level of education: Year 10/11 3 3 3 3
Highest level of education: Year 12 1 1 1 1
Highest level of education: Vocational 1 1 1 1
Highest level of education: Tertiary 7. 1 9 1
Highest level of education: Unknown / not 1 0 1 2
Visa type: Refugee/special global 1. 2 1 2
Visa type: Skilled immigrant 0. 0 0 0
Visa type: Other/ no visa/no visa 9 9 9 9
Job seeker residence: Major City 5 5 5 6
Job seeker residence: Inner Regional 2 2 2 2
Job seeker residence: Outer Regional 1 1 1 1
Job seeker residence: Remote 2. 2 2 2
321

JNS stud
y popu
JSA study
JNS active
JSA ac
Job seeker residence: Very Remote 2. 3 2 2
Job seeker residence: Unknown Job seeker 0. 0 0 0
Length of unemployment: Less than 1 year N N 4 4
Length of unemployment: 1 to less than 2 3 4 1 2
Length of unemployment: 2 to less than 5 4 3 2 2
Length of unemployment: 5 years or more 2 1 1 9
Total job seekers 3 4 6 7
Notes:1. Characteristics are those at the snapshot date (JNS: 30 September 2007 and JSA: 30 September 2010) except for
disability status, which is derived from information closest to the end of the job seekers’ period of assistance.2. A substantial proportion of job seekers, particularly in the JNS study and caseload populations, did not have recent
(within 2 years of snapshot date) JSCI or other information available for some job seeker characteristics. For this reason percentages of job seekers in some client groups are calculated as a percentage of job seekers for whom recent information was available. The proportions of each population for which recent information was not available are:For the JNS LTU study population: Indigenous status: 3.5 per cent; English proficiency and homeless status: 28.2 per cent; single parent status: 24.5; ex-offender status: 30.1 per cent. For the JSA LTU study population: Indigenous status: 1.6 per cent; English proficiency and homeless status: 12.2 per cent; single parent status: 9.5 per cent; ex-offender status: 13.6 per cent. For the JNS caseload population: Indigenous status: 2.8 per cent; English proficiency and homeless status: 21.3 per cent; single parent status: 18.8 per cent; ex-offender status: 23.0 per cent. For the JSA caseload population: Indigenous status: 1.6 per cent; English proficiency and homeless status: 10.3 per cent; single parent status: 8.3 per cent; ex-offender status: 11.6 per cent.
3. Many job seekers in the JSA populations had different Assessed Streams to their actual Stream at snapshot date. This is partly because of the transition arrangements from JNS to JSA, by which job seekers were allocated to Streams in JSA based on their length of unemployment and prior level of service in JNS as well as on assessment information (see Section 1.5 for more information). In addition, some job seekers received services at a higher Stream than their Assessed Stream because of the Learn or Earn policy or other special circumstances.
4. Information on highest level of education was collected in a slightly different way in the 2009 revision of the JSCI. In particular, more attention is now paid to vocational qualifications. In addition, from July 2009 the Learn or Earn initiative led to an increased emphasis on accurate recording of educational qualifications for job seekers under 21 years of age. For these reasons, comparisons of this item between the JNS and JSA study and caseload populations should be undertaken with caution.
5. Geographical locations are defined using the Australian Standard Geographical Classification (ASGC) developed by the Australian Bureau of Statistics. This classification provides an indication of the degree of remoteness (or distance) from major cities (ABS, 2006). The geographical locations defined are not comparable with those used to classify JSA Labour Market Regions, as defined in the Employment Services Deed ESD4.
6. Job seekers are assigned to geographical locations using the job seeker’s home postcode at the snapshot date.7. Numbers may not add up due to rounding.8. See Appendix 1, Section 2 for a description of how LTU comparisons were made and outcome measures used.Source: Department of Employment administrative data and Research and Evaluation database (RED).This data is referenced in several locations.
Return to discussion about single parents where this data is referenced. Return to discussion about job seekers with disability where this data is referenced. Return to discussion about mature age job seekers where this data is referenced. Return to discussion about youth where this data is referenced. Return to discussion about job seekers from non-English speaking backgrounds where this data is referenced. Return to discussion about Indigenous job seekers where this data is referenced. Return to discussion of LTU study population in Appendix 1.
322
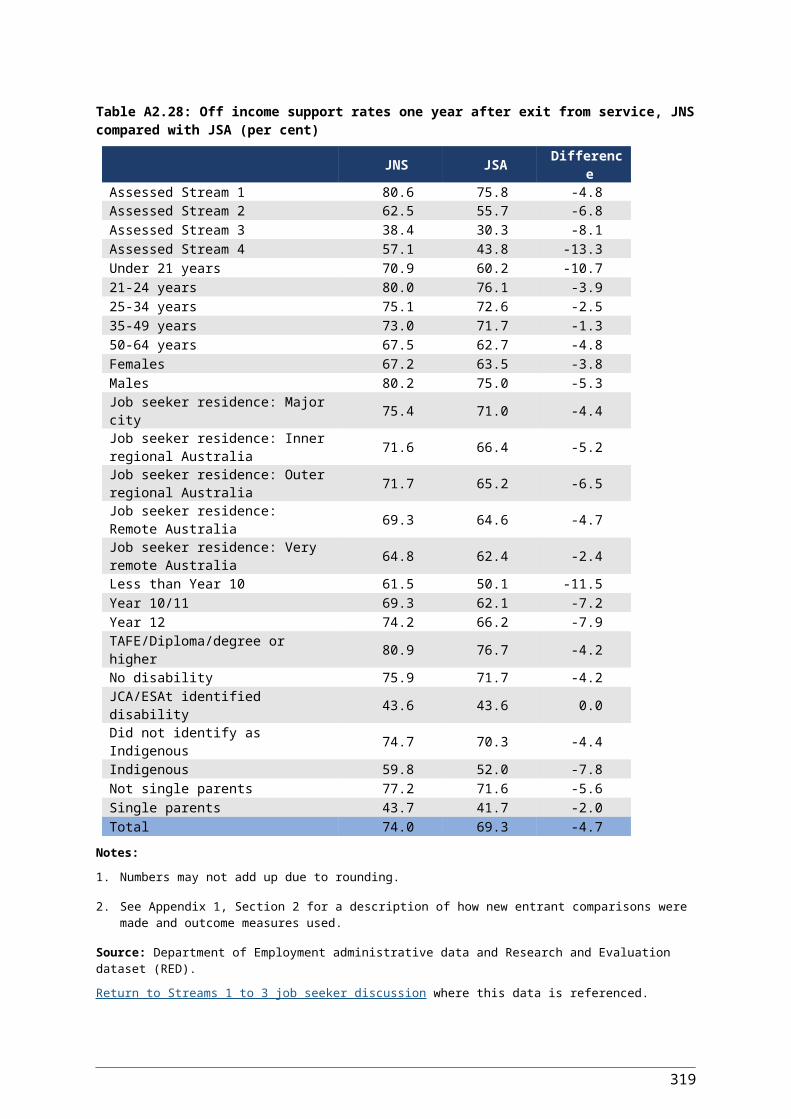
323

Table A2.60: Estimated odds ratios of exits from employment services for variables in the logistic regression models, by Assessed Stream, for the JSA LTU study population
Category Reference category Assessed Stream 1
Assessed Stream 2
Assessed Stream 3
Assessed Stream 4
Females under 21 Females 25 to 34 years 1.31 1.18 1.37 1.35
Females 21 to 24 years Females 25 to 34 years 1.21 1.18 1.33 1.34
Females 35 to 49 years Females 25 to 34 years 0.73 0.70 0.76 0.86
Females 50 years or older Females 25 to 34 years 0.47 0.55 0.72 n.s.
Males under 21 Males 25 to 34 years n.s. 0.82 0.90 0.87
Males 21 to 24 years Males 25 to 34 years 1.17 n.s. n.s. n.s.
Males 35 to 49 years Males 25 to 34 years 0.85 0.87 0.93 0.96
Males 50 years or older Males 25 to 34 years 0.58 0.72 0.93 n.s.
Females under 21 Males under 21 1.55 1.55 1.59 1.62
Females 21 to 24 years Males 21 to 24 years 1.19 1.33 1.33 1.32
Females 25 to 34 years Males 25 to 34 years 1.15 1.08 n.s. n.s.
Females 35 to 49 years Males 35 to 49 years n.s. 0.88 0.86 0.95
Females 50 years or older Males 50 years or older n.s. 0.83 0.80 n.s.
Highest level of education: Less than Year 10 Years 10 or 11 0.90 0.93 0.96 n.s.
Highest level of education: Year 12 Years 10 or 11 1.17 1.05 1.11 1.10
Highest level of education: Trade or TAFE qualification Years 10 or 11 1.14 1.31 1.06 1.07
Highest level of education: Tertiary qualification Years 10 or 11 1.17 1.27 1.13 1.13
Has useful vocational qualifications No vocational qualifications 1.10 n.s. 1.06 1.04
Vocational qualifications not useful No vocational qualifications n.s. n.s. n.s. n.s.
Participation requirement: Part-time activity requirement Full-time requirement 0.76 n.s. 1.06 0.95
Participation requirement :Volunteer Full-time requirement 1.76 2.19 2.47 2.03
324

Category Reference category Assessed Stream 1
Assessed Stream 2
Assessed Stream 3
Assessed Stream 4
Length of unemployment: 2 to less than 5 years 1 to less than 2 years 0.79 0.76 0.80 0.77
Length of unemployment: 5 years or more 1 to less than 2 years 0.56 0.56 0.62 0.59
Recent work experience: Previously employed full-time or part-time (8-30 hours a week)
Unemployed 1.28 1.16 1.24 1.28
Recent work experience: Previously employed part-time (less than 8 hours a week) or seasonally
Unemployed n.s. 1.10 1.10 1.12
Recent work experience: Previously outside the labour force Unemployed n.s. n.s. 1.11 n.s.
Newstart Allowance or YA (Other) Not on benefit 0.36 0.44 0.55 0.41
Parenting Payment Partnered or Single Not on benefit 0.54 0.58 0.72 0.57
Other Income support type Not on benefit n.s. 1.90 2.83 3.71
Job seeker residence: Inner Regional Australia Major cities n.s. 0.88 0.93 n.s.
Job seeker residence: Outer Regional Australia Major cities n.s. 0.89 0.83 n.s.
Job seeker residence: Remote Australia Major cities n.s. 0.82 0.78 n.s.
Job seeker residence: Very Remote Australia Major cities n.s. 0.61 0.55 0.56
Personal factors: High impact No impact 0.71 0.91 0.90 0.94
Personal factors: Medium impact No impact n.s. 0.91 0.92 n.s.
Personal factors: Low impact No impact 0.82 n.s. 0.95 n.s.
Indigenous Did not identify as Indigenous 0.76 0.86 0.85 0.85
Single parent Not single parent n.s. 0.90 0.93 0.88
Disability identified by JCA/ESAt No disability 1.21 2.14 3.20 2.21
Grandfathered Parenting Payment recipient Not grandfathered PP recipient 0.78 0.82 0.80 0.82
Medium, high or very highly disadvantaged country of birth Low disadvantaged country of birth 1.11 n.s. n.s. n.s.
325
Category Reference category Assessed Stream 1
Assessed Stream 2
Assessed Stream 3
Assessed Stream 4
Refugee, special global humanitarian or protection visa in the past 7 years
Not refugee, special global humanitarian or protection visa in the past 7 years
n.s. 1.14 1.18 1.22
Percentage change in odds of exits from employment services (per percentage point increase)
Assessed Stream 1
Assessed Stream 2
Assessed Stream 3
Assessed Stream 4
Average monthly unemployment rate 0.94 0.96 0.99 0.96
n.s. Not significant at the 95 per cent level.
Note: See Appendix 1, Section 2 for a description of how LTU comparisons were made and outcome measures used.
Source: Department of Employment administrative data and Research and Evaluation database (RED).
This data is referenced in more than one location.
Return to discussion about single parents where this data is referenced. Return to discussion about Indigenous job seekers where this data is referenced.
326
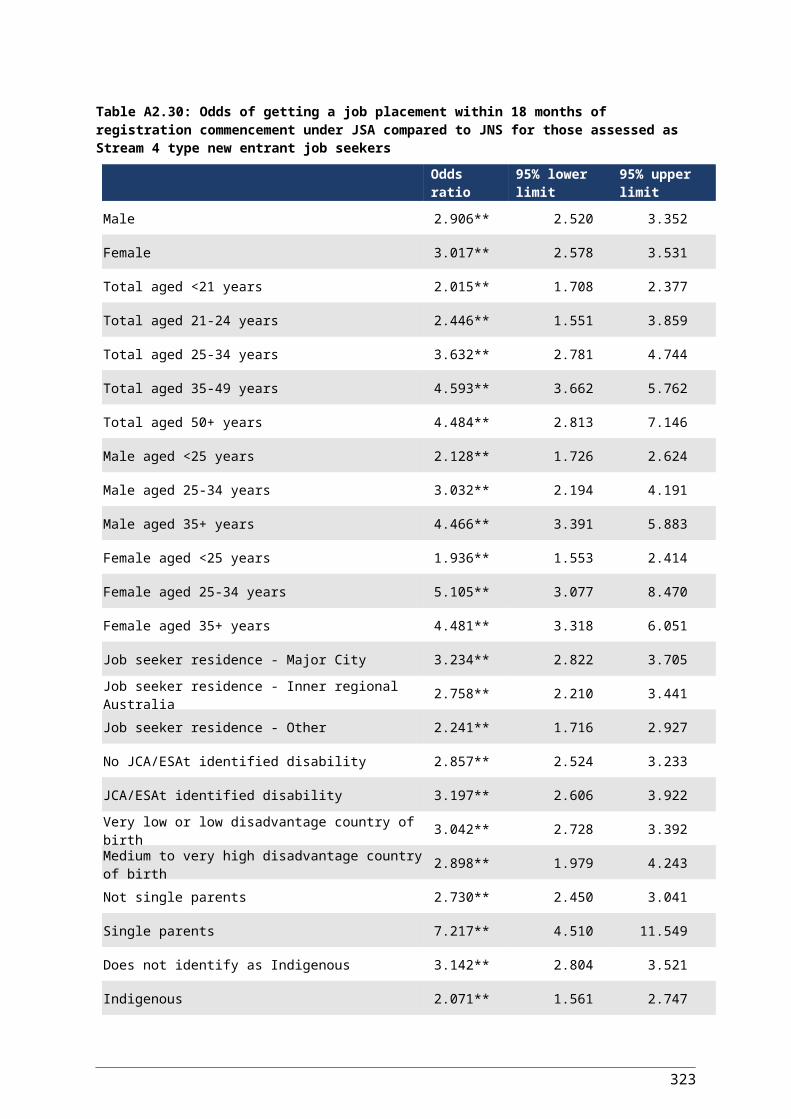
Table A2.61: Off NSA/YA(O) one year after exiting rates for job seekers who exited employment services, JNS and JSA LTU study populations (per cent)
JNS LTU study
population JSA LTU study
population Percentage point
difference
Assessed Stream 1 68.8 77.8 9.0
Assessed Stream 2 66.0 75.1 9.1
Assessed Stream 3 61.8 71.5 9.7
Assessed Stream 4 62.3 69.3 7.0
Less than 21 years old 66.7 72.7 6.0
21 to 24 years old 63.4 72.0 8.6
25 to 34 years old 60.2 70.5 10.3
35 to 49 years old 61.9 71.2 9.3
50 years and over 71.8 79.6 7.8
Indigenous 61.7 68.7 7.0
Did not identify as Indigenous 65.0 73.1 8.1
Job seekers with disability as identified by JCA/ESAt
57.2 65.1 7.9
Single parents 66.2 73.9 7.7
Ex-offenders 55.2 65.5 10.3
Total 64.6 73.2 8.6
Notes:
1. Figures represent percentage of job seekers who were on NSA or YA(O) at the snapshot date and who exited employment services.
2. Excludes job seekers for whom Assessed Stream could not be derived.3. Numbers may not add up due to rounding.
4. See Appendix 1, Section 2 for a description of how LTU comparisons were made and outcome measures used.
Source: Department of Employment administrative data and Research and Evaluation database (RED).
This data is referenced more than once in this report.
Return to discussion about single parents where this data is referenced. Return to discussion about LTU job seekers where this data is referenced. Return to discussion about Indigenous job seekers where this data is referenced.
327

Table A2.62: Off income support one year after exiting rates for job seekers who exited employment services, JNS and JSA LTU study populations (per cent)
JNS LTU study population
JSA LTU study population
Percentage point difference
Assessed Stream 1 47.4 60.6 13.2
Assessed Stream 2 35.4 47.7 12.3
Assessed Stream 3 23.8 29.8 6.0
Assessed Stream 4 22.3 27.7 5.4
Less than 21 years old 34.3 42.5 8.2
21 to 24 years old 36.7 46.7 10.0
25 to 34 years old 33.8 43.5 9.7
35 to 49 years old 32.3 41.0 8.7
50 years and over 24.7 27.7 3.7
Indigenous 29.7 32.9 3.2
Did not identify as Indigenous 32.7 41.6 8.9
Job seekers with disability as identified by JCA/ESAt
16.6 20.4 3.8
Single parents 22.3 33.5 11.2
Ex-offenders 32.5 42.0 9.5
Total 31.4 39.6 8.2
Notes:
1. Excludes job seekers for whom Assessed Stream could not be derived.
2. Numbers may not add up due to rounding.
3. See Appendix 1, Section 2 for a description of how LTU comparisons were made and outcome measures used.
Source: Department of Employment administrative data and Research and Evaluation database (RED).
This data is referenced more than once in this report.
Return to discussion about single parents where this data is referenced. Return to discussion about mature age job seekers where this data is referenced. Return to discussion about youth where this data is referenced. Return to discussion about LTU job seekers where this data is referenced. Return to discussion about Indigenous job seekers where this data is referenced.
328

Table A2.63: Average reliance on income support one year after exiting rates for job seekers who exited employment services by job seeker characteristics, JNS and JSA LTU study populations (average rate)
JNS LTU study population
JSA LTU study population Difference
Assessed Stream 1 35.34 25.35 -9.99
Assessed Stream 2 50.53 38.70 -11.83
Assessed Stream 3 65.29 58.39 -6.90
Assessed Stream 4 70.49 62.29 -8.20
Less than 21 years old 39.91 39.27 -0.64
21 to 24 years old 50.29 40.36 -9.93
25 to 34 years old 54.42 43.52 -10.90
35 to 49 years old 55.85 46.23 -9.62
50 years and over 67.11 62.00 -5.11
Indigenous 56.19 52.38 -3.81
Did not identify as Indigenous 53.18 45.41 -7.77
Job seekers with disability as identified by JCA/ESAt
77.40 73.03 -4.37
Single parents 61.78 52.71 -9.07
Ex-offenders 54.31 43.02 -11.29
Total 55.06 47.30 -7.76
Notes:
1. Excludes job seekers for whom Assessed Stream could not be derived, job seekers who participated in CDEP, and job seekers with incomplete income support payment records.
2. Numbers may not add up due to rounding.
3. See Appendix 1, Section 2 for a description of how LTU comparisons were made and outcome measures used.
Source: Department of Employment administrative data and Research and Evaluation database (RED).
This data is referenced more than once in this report.
Return to discussion about single parents where this data is referenced. Return to discussion about mature age job seekers where this data is referenced. Return to discussion about youth where this data is referenced. Return to discussion about LTU job seekers where this data is referenced. Return to discussion about Indigenous job seekers where this data is referenced.
329

Table A2.64: Exits from employment services due to disability, selected job seeker groups (per cent of job seekers who exited)
JNS
On DSP
Exited to specialist disability
employment services
On DSP and exited to specialist disability
employment services
Total
Assessed Stream 1 3 3.8 0.2 7.0
Assessed Stream 2 8 6.9 0.5 16.2
Assessed Stream 3 1 10.3 0.9 30.7
Assessed Stream 4 2 9.3 1.4 37.9
Less than 21 years 2 1.6 0.2 4.6
21 to 24 years 6 3.9 0.2 10.2
25 to 34 years 1 6.5 0.6 17.7
35 to 49 years 1 10.1 0.9 27.7
50 and over years 2 11.6 1.1 38.1
Indigenous 1 3.5 0.5 15.6
Did not identify as 1 8.3 0.6 21.8
Job seekers with a disability as identified by JCA/ESAt
33.
7
20.5 1.6 55.8
Single parents5.
05.7 0.3 11.0
Ex-offenders
13.
4
6.5 0.6 20.5
Total
14.
1
7.7 0.7 22.5
JSA
On DSP
Exited to specialist disability
employment services
On DSP and exited to specialist disability
employment services
Total
Assessed Stream 11.
74.3 0.2 6.2
330
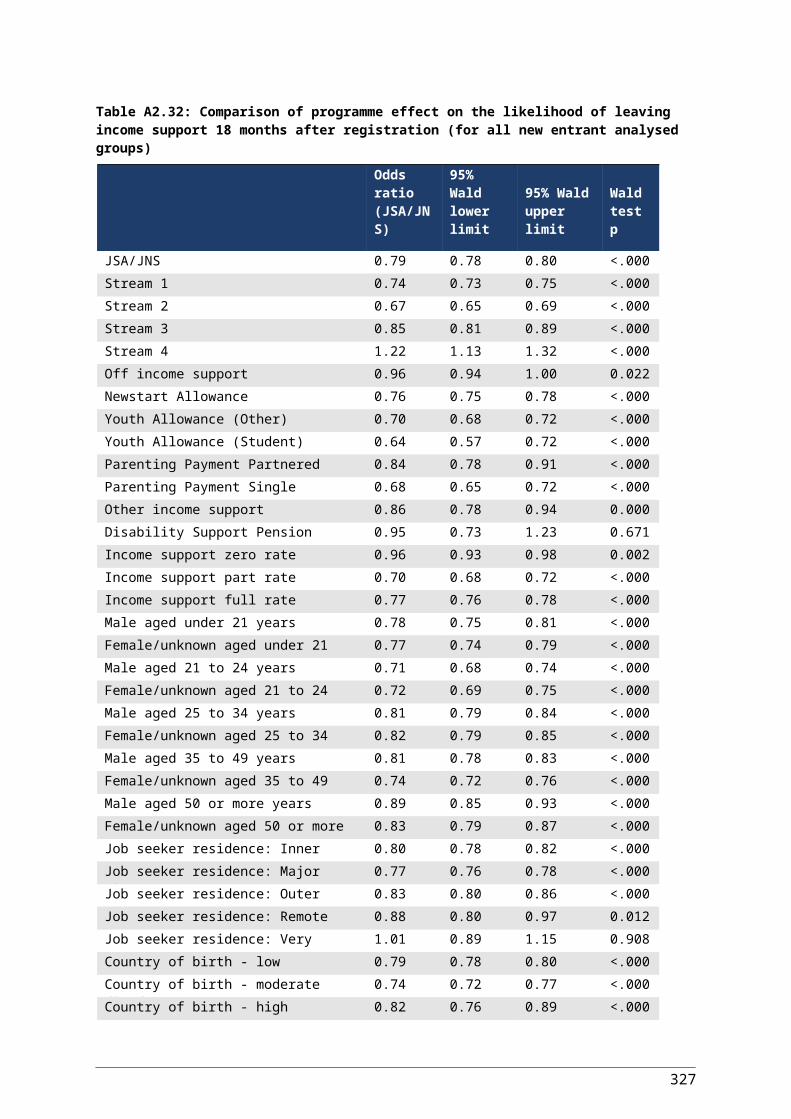
On DSP
Exited to specialist disability
employment services
On DSP and exited to specialist disability
employment services
Total
Assessed Stream 24.
37.5 0.4 12.2
Assessed Stream 3
12.
0
13.6 0.8 26.5
Assessed Stream 4
23.
0
11.7 1.0 35.7
Less than 21 years2.
43.7 0.3 6.4
21 to 24 years4.
25.9 0.4 10.4
25 to 34 years7.
77.7 0.5 15.9
35 to 49 years
13.
3
11.9 0.8 26.0
50 and over years
18.
0
13.9 0.9 32.7
Indigenous
13.
9
4.8 0.5 19.2
Did not identify as Indigenous
10.
0
10.6 0.7 21.2
Job seekers with a disability as identified by JCA/ESAt
31.
4
29.5 1.9 62.8
331
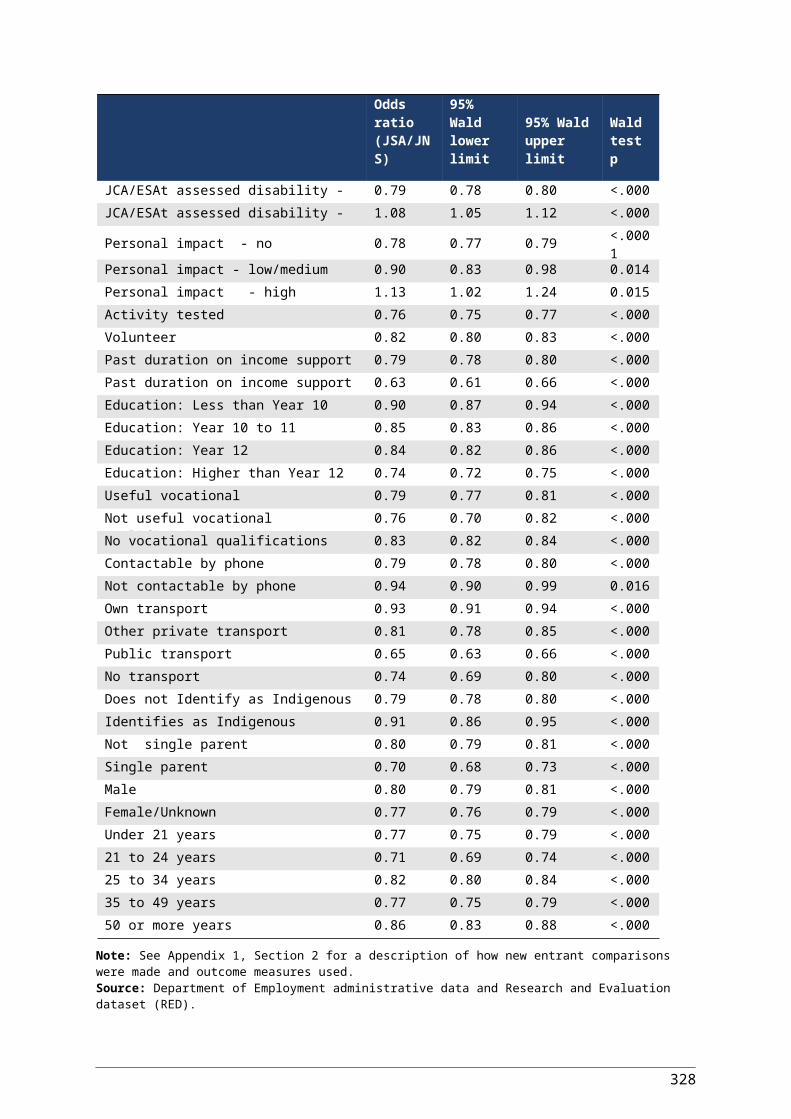
On DSP
Exited to specialist disability
employment services
On DSP and exited to specialist disability
employment services
Total
Single parents5.
17.1 0.4 12.5
Ex-offenders9.
77.1 0.4 17.2
Total
10.
6
9.6 0.6 20.8
Notes: 1. Categories are mutually exclusive.2. Numbers may not add up due to rounding.3. See Appendix 1, Section 2 for a description of how LTU comparisons were made and outcome measures used.
Source: Department of Employment administrative data and Research and Evaluation database (RED).This data is referenced more than once in this report.
Return to discussion about single parents where this data is referenced. Return to discussion about mature age job seekers where this data is referenced. Return to discussion about LTU job seekers where this data is referenced.
332

Table A2.65: Likelihood of receiving EPF training funding, Stream 2
Category Reference category Odds Ratio95% lower confidence limit
95% upper confidence limit
Disability/Medical condition: Other than reduced work capacity No disability or medical condition 0.815 * 0.779 0.854Disability/Medical condition: Work capacity 23-29 hours per week No disability or medical condition 0.612 * 0.524 0.714Disability/Medical condition: Work capacity 15-22 hours per week No disability or medical condition 0.580 * 0.516 0.653Disability/Medical condition: Work capacity <15 hours per week No disability or medical condition 0.490 * 0.409 0.586Disability/Medical condition: Work capacity >8 hours DSP recipient No disability or medical condition 0.648 0.327 1.282Access to transport: Other private transport Own transport 0.976 0.934 1.019Access to transport: Public transport Own transport 1.156 * 1.120 1.192Access to transport: No access to transport Own transport 1.124 * 1.038 1.218Country of birth: Medium disadvantage Very low to low disadvantage 1.074 * 1.028 1.122Country of birth: High disadvantage Very low to low disadvantage 1.237 * 1.115 1.372Country of birth: Very high disadvantage Very low to low disadvantage 1.240 0.939 1.638Primary or secondary homeless Stable residence 0.919 * 0.873 0.968Ex-offender Not ex-offender 0.841 * 0.764 0.926Country of birth language: Other than English English language 0.845 * 0.769 0.928Not useful vocational qualifications Has useful vocational qualifications 1.034 0.957 1.117Does not have vocational qualifications Has useful vocational qualifications 0.886 * 0.860 0.912English proficiency: Poor or mixed language level Good language level 0.771 * 0.733 0.811Geographic location: Low to moderate disadvantage ESA Very low disadvantage ESA 1.188 * 1.143 1.234Geographic location: High disadvantage ESA Very low disadvantage ESA 1.356 * 1.290 1.424Geographic location: Very high to extreme disadvantage ESA Very low disadvantage ESA 1.705 * 1.603 1.813Not contactable by phone Contactable by phone 0.952 0.899 1.009Living circumstances: Single parent Lives alone 0.876 * 0.819 0.936Living circumstances: Lives with spouse / partner Lives alone 0.929 * 0.886 0.974Living circumstances: Other living conditions Lives alone 0.990 0.950 1.030Personal factors from JCA: Low impact No impact 1.226 * 1.168 1.286Personal factors from JCA: Medium impact No impact 1.275 * 1.207 1.347Personal factors from JCA: High impact No impact 1.239 * 1.152 1.331Job seeker history: More than one episode of income support First time on income support 1.116 * 1.085 1.149

Category Reference category Odds Ratio95% lower confidence limit
95% upper confidence limit
Job seeker history: Had crisis payment(s) No crisis payments 0.548 * 0.472 0.635Recent work experience: Part-time or seasonal work Full-time 0.966 0.932 1.002Recent work experience: Outside labour force or unpaid Full-time 0.952 * 0.918 0.987Recent work experience: Unemployed Full-time 1.343 * 1.285 1.404Duration on income support: 12 to 23 months Less than 12 months 0.973 0.928 1.020Duration on income support : 24+ months Less than 12 months 0.899 * 0.858 0.941Duration on income support : Not on income support Less than 12 months 0.731 * 0.704 0.759Indigenous Does not identify as indigenous 2.182 * 2.031 2.344Indigenous labour market location: Very low labour market disadvantage Not indigenous location 0.451 * 0.425 0.478Indigenous labour market location: Low to medium disadvantage Not indigenous location 0.470 * 0.439 0.503Indigenous labour market location: High to very high disadvantage Not indigenous location 0.404 * 0.374 0.436Proximity to labour market: Outer regional, remote, very remote or migratory Metropolitan or inner regional 0.906 * 0.871 0.942Income support: Newstart Not on income support 1.923 * 1.856 1.992Income support: PPS or PPP Not on income support 1.500 * 1.399 1.609Income support: Youth Allowance (YAO) Not on income support 1.342 * 1.275 1.413Income support: Other, non-activity tested payment Not on income support 1.525 * 1.386 1.677Highest level of education: Year 10 or 11 Less than Year 10 1.145 * 1.093 1.200Highest level of education: Year 12, TAFE or diploma Less than Year 10 1.189 * 1.133 1.247Highest level of education: Degree of post graduate Less than Year 10 0.929 * 0.870 0.99215 - 19 year old male 25 – 34 year old male 1.578 * 1.473 1.69115 - 19 year old male 35 – 44 year old male 1.452 * 1.352 1.56015 - 19 year old male 45 – 54 year old male 1.255 * 1.165 1.35215 - 19 year old male 55 - 59 year old male 1.318 * 1.201 1.44715 - 19 year old male 60+ year old male 1.944 * 1.775 2.12820 – 24 year old male 15 - 19 year old male 0.804 * 0.753 0.85820 – 24 year old male 25 – 34 year old male 1.268 * 1.199 1.34220 – 24 year old male 35 – 44 year old male 1.167 * 1.100 1.23820 – 24 year old male 45 – 54 year old male 1.009 0.947 1.07520 – 24 year old male 55 - 59 year old male 1.060 0.974 1.15320 – 24 year old male 60+ year old male 1.563 * 1.440 1.696
334

Category Reference category Odds Ratio95% lower confidence limit
95% upper confidence limit
25 – 34 year old male 35 – 44 year old male 0.920 * 0.873 0.97025 – 34 year old male 45 – 54 year old male 0.795 * 0.751 0.84325 – 34 year old male 55 - 59 year old male 0.835 * 0.771 0.90525 – 34 year old male 60+ year old male 1.232 * 1.140 1.33135 – 44 year old male 45 – 54 year old male 0.864 * 0.815 0.91735 – 44 year old male 55 - 59 year old male 0.908 * 0.837 0.98435 – 44 year old male 60+ year old male 1.338 * 1.238 1.44745 – 54 year old male 55 - 59 year old male 1.050 0.967 1.14145 – 54 year old male 60+ year old male 1.549 * 1.430 1.67855 - 59 year old male 60+ year old male 1.474 * 1.339 1.62420 – 24 year old female 15 - 19 year old female 0.718 * 0.668 0.77120 – 24 year old female 25 – 34 year old female 1.150 * 1.072 1.23420 – 24 year old female 35 – 44 year old female 1.021 0.952 1.09520 – 24 year old female 45 – 54 year old female 0.906 * 0.844 0.97320 – 24 year old female 55 - 59 year old female 1.101 * 1.001 1.21120 – 24 year old female 60+ year old female 1.843 * 1.664 2.04115 - 19 year old female 25 – 34 year old female 1.603 * 1.482 1.73315 - 19 year old female 35 – 44 year old female 1.423 * 1.316 1.53815 - 19 year old female 45 – 54 year old female 1.263 * 1.167 1.36615 - 19 year old female 55 - 59 year old female 1.534 * 1.388 1.69615 - 19 year old female 60+ year old female 2.568 * 2.308 2.85725 – 34 year old female 35 – 44 year old female 0.888 * 0.835 0.94425 – 34 year old female 45 – 54 year old female 0.788 * 0.737 0.84225 – 34 year old female 55 - 59 year old female 0.957 0.872 1.05125 – 34 year old female 60+ year old female 1.602 * 1.449 1.77135 – 44 year old female 45 – 54 year old female 0.887 * 0.832 0.94635 – 44 year old female 55 - 59 year old female 1.078 0.983 1.18235 – 44 year old female 60+ year old female 1.805 * 1.634 1.99345 – 54 year old female 55 - 59 year old female 1.215 * 1.108 1.33345 – 54 year old female 60+ year old female 2.034 * 1.841 2.246
335

Category Reference category Odds Ratio95% lower confidence limit
95% upper confidence limit
55 - 59 year old female 60+ year old female 1.674 * 1.490 1.87915 - 19 year old male 15 - 19 year old female 1.070 * 1.013 1.13120 – 24 year old male 20 – 24 year old female 1.199 * 1.124 1.27925 – 34 year old male 25 – 34 year old female 1.087 * 1.023 1.15535 – 44 year old male 35 – 44 year old female 1.049 0.986 1.11645 – 54 year old male 45 – 54 year old female 1.077 * 1.008 1.15155 - 59 year old male 55 - 59 year old female 1.246 * 1.121 1.38460+ year old male 60+ year old female 1.414 * 1.269 1.576
Notes: * indicates significant Source: Department of Employment administrative data.This data is referenced in several locations.
Return to discussion about mature age job seekers where this data is referenced. Return to discussion about youth where this data is referenced . Return to discussion about Indigenous job seekers where this data is referenced.
336

Table A2.66: Likelihood of receiving EPF training funding, Stream 3
Category Reference category Odds Ratio95% lower confidence limit
95% upper confidence limit
Disability/Medical condition: Other than reduced work capacity No disability or medical condition 0.867 * 0.824 0.912Disability/Medical condition: Work capacity 23-29 hours per week No disability or medical condition 0.775 * 0.684 0.877Disability/Medical condition: Work capacity 15-22 hours per week No disability or medical condition 0.539 * 0.501 0.581Disability/Medical condition: Work capacity <15 hours per week No disability or medical condition 0.510 * 0.463 0.560Disability/Medical condition: Work capacity >8 hours DSP recipient No disability or medical condition 0.986 0.731 1.331Access to transport: Other private transport Own transport 1.018 0.956 1.082Access to transport: Public transport Own transport 1.034 0.991 1.079Access to transport: No access to transport Own transport 0.987 0.919 1.059Country of birth: Medium disadvantage Very low to low disadvantage 0.950 0.894 1.009Country of birth: High disadvantage Very low to low disadvantage 1.347 1.188 1.528Country of birth: Very high disadvantage Very low to low disadvantage 1.114 0.932 1.332Primary or secondary homeless Stable residence 0.994 0.941 1.051Ex-offender Not ex-offender 0.851 * 0.781 0.928Country of birth language: Other than English English language 0.780 * 0.725 0.838Not useful vocational qualifications Has useful vocational qualifications 0.888 * 0.813 0.970Does not have vocational qualifications Has useful vocational qualifications 0.785 * 0.753 0.819English proficiency: Poor or mixed language level Good language level 0.798 * 0.759 0.840Geographic location: Low to moderate disadvantage ESA Very low disadvantage ESA 1.153 * 1.086 1.224Geographic location: High disadvantage ESA Very low disadvantage ESA 1.116 * 1.041 1.197Geographic location: Very high to extreme disadvantage ESA Very low disadvantage ESA 1.192 * 1.107 1.284Not contactable by phone Contactable by phone 0.799 * 0.756 0.844Living circumstances: Single parent Lives alone 1.010 0.937 1.089Living circumstances: Lives with spouse / partner Lives alone 0.858 * 0.808 0.912Living circumstances: Other living conditions Lives alone 1.069 * 1.013 1.127Personal factors from JCA: Low impact No impact 1.192 * 1.127 1.260Personal factors from JCA: Medium impact No impact 1.217 * 1.155 1.282Personal factors from JCA: High impact No impact 1.124 * 1.065 1.186Job seeker history: More than one episode of income support First time on income support 1.029 0.991 1.068
337
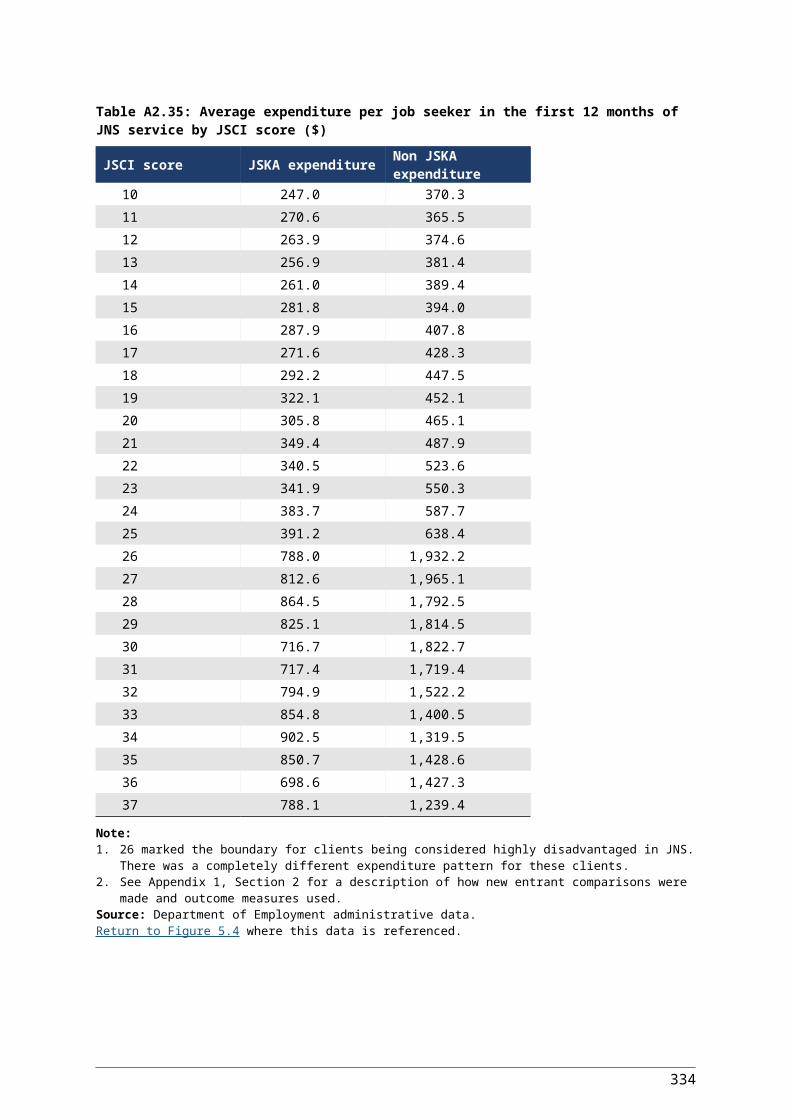
Category Reference category Odds Ratio95% lower confidence limit
95% upper confidence limit
Job seeker history: Had crisis payment(s) No crisis payments 0.665 * 0.578 0.765Recent work experience: Part-time or seasonal work Full-time 1.033 0.966 1.106Recent work experience: Outside labour force or unpaid Full-time 1.027 0.966 1.092Recent work experience: Unemployed Full-time 1.353 * 1.273 1.438Duration on income support: 12 to 23 months Less than 12 months 1.344 * 1.263 1.430Duration on income support: 24+ months Less than 12 months 1.310 * 1.247 1.377Duration on income support: Not on income support Less than 12 months 1.035 0.967 1.107Indigenous Does not identify as indigenous 1.867 * 1.755 1.985Indigenous labour market location: Very low labour market disadvantage Not indigenous location 0.370 * 0.350 0.392Indigenous labour market location: Low to medium disadvantage Not indigenous location 0.393 * 0.371 0.417Indigenous labour market location: High to very high disadvantage Not indigenous location 0.374 * 0.351 0.398Proximity to labour market: Outer regional, remote, very remote or migratory Metropolitan or inner regional 0.909 * 0.865 0.956Income support: Newstart Not on income support 1.263 * 1.170 1.364Income support: PPS or PPP Not on income support 0.967 0.880 1.062Income support: Youth Allowance (YAO) Not on income support 1.021 0.916 1.139Income support: Other, non-activity tested payment Not on income support 1.194 * 1.061 1.343Education qualifications: Year 10 or 11 Less than year 10 1.100 * 1.050 1.152Education qualifications: Year 12, TAFE or diploma Less than year 10 1.159 * 1.102 1.219Education qualifications: Degree of post graduate Less than year 10 1.165 * 1.052 1.29015 - 19 year old male 25 – 34 year old male 1.053 0.927 1.19715 - 19 year old male 35 – 44 year old male 1.136 0.999 1.29315 - 19 year old male 45 – 54 year old male 1.211 * 1.061 1.38215 - 19 year old male 55 - 59 year old male 1.715 * 1.483 1.98315 - 19 year old male 60+ year old male 2.388 * 2.065 2.76020 – 24 year old male 15 - 19 year old male 1.115 0.982 1.26720 – 24 year old male 25 – 34 year old male 1.175 * 1.074 1.28620 – 24 year old male 35 – 44 year old male 1.267 * 1.156 1.38920 – 24 year old male 45 – 54 year old male 1.351 * 1.227 1.48720 – 24 year old male 55 - 59 year old male 1.913 * 1.708 2.14220 – 24 year old male 60+ year old male 2.663 * 2.379 2.982
338

Category Reference category Odds Ratio95% lower confidence limit
95% upper confidence limit
25 – 34 year old male 35 – 44 year old male 1.079 0.996 1.16825 – 34 year old male 45 – 54 year old male 1.149 * 1.056 1.25125 – 34 year old male 55 - 59 year old male 1.628 * 1.468 1.80525 – 34 year old male 60+ year old male 2.267 * 2.044 2.51435 – 44 year old male 45 – 54 year old male 1.066 0.980 1.15935 – 44 year old male 55 - 59 year old male 1.509 * 1.362 1.67235 – 44 year old male 60+ year old male 2.101 * 1.897 2.32845 – 54 year old male 55 - 59 year old male 1.416 * 1.277 1.57145 – 54 year old male 60+ year old male 1.972 * 1.778 2.18755 - 59 year old male 60+ year old male 1.392 * 1.238 1.56520 – 24 year old female 15 - 19 year old female 0.860 * 0.765 0.96720 – 24 year old female 25 – 34 year old female 1.085 0.997 1.18020 – 24 year old female 35 – 44 year old female 1.015 0.934 1.10320 – 24 year old female 45 – 54 year old female 0.991 0.909 1.08020 – 24 year old female 55 - 59 year old female 1.621 * 1.449 1.81320 – 24 year old female 60+ year old female 2.374 * 2.084 2.70415 - 19 year old female 25 – 34 year old female 1.261 * 1.120 1.42015 - 19 year old female 35 – 44 year old female 1.180 * 1.049 1.32815 - 19 year old female 45 – 54 year old female 1.152 * 1.022 1.29915 - 19 year old female 55 - 59 year old female 1.885 * 1.639 2.16715 - 19 year old female 60+ year old female 2.760 * 2.365 3.22025 – 34 year old female 35 – 44 year old female 0.936 0.875 1.00025 – 34 year old female 45 – 54 year old female 0.913 * 0.849 0.98225 – 34 year old female 55 - 59 year old female 1.494 * 1.347 1.65725 – 34 year old female 60+ year old female 2.188 * 1.934 2.47535 – 44 year old female 45 – 54 year old female 0.976 0.911 1.04535 – 44 year old female 55 - 59 year old female 1.597 * 1.443 1.76735 – 44 year old female 60+ year old female 2.338 * 2.071 2.63945 – 54 year old female 55 - 59 year old female 1.636 * 1.479 1.81045 – 54 year old female 60+ year old female 2.396 * 2.123 2.704
339

Category Reference category Odds Ratio95% lower confidence limit
95% upper confidence limit
55 - 59 year old female 60+ year old female 1.464 * 1.276 1.68115 - 19 year old male 15 - 19 year old female 1.013 0.907 1.13120 – 24 year old male 20 – 24 year old female 1.314 * 1.193 1.44825 – 34 year old male 25 – 34 year old female 1.213 * 1.120 1.31435 – 44 year old male 35 – 44 year old female 1.053 0.974 1.13845 – 54 year old male 45 – 54 year old female 0.964 0.888 1.04655 - 59 year old male 55 - 59 year old female 1.113 0.987 1.25660+ year old male 60+ year old female 1.171 * 1.023 1.341
Notes: * indicates significant Source: Department of Employment administrative data.This data is referenced in several locations.
Return to discussion about mature age job seekers . Return to discussion about youth. Return to discussion about Indigenous job seekers where this data is referenced.
340

Table A2.67: Likelihood of receiving EPF training funding, Stream 4
Category Reference category Odds Ratio95% lower confidence limit
95% upper confidence limit
Disability/Medical condition: Other than reduced work capacity No disability or medical condition 0.990 0.939 1.043Disability/Medical condition: Work capacity 23-29 hours per week No disability or medical condition 0.854 * 0.747 0.975Disability/Medical condition: Work capacity 15-22 hours per week No disability or medical condition 0.773 * 0.716 0.835Disability/Medical condition: Work capacity <15 hours per week No disability or medical condition 0.610 * 0.560 0.664Disability/Medical condition: Work capacity >8 hours DSP recipient No disability or medical condition 1.316 0.863 2.007Access to transport: Other private transport Own transport 1.355 * 1.261 1.456Access to transport: Public transport Own transport 0.976 0.921 1.035Access to transport: No access to transport Own transport 0.989 0.895 1.092Country of birth: Medium disadvantage Very low to low disadvantage 0.743 * 0.684 0.808Country of birth: High disadvantage Very low to low disadvantage 1.243 * 1.023 1.511Country of birth: Very high disadvantage Very low to low disadvantage 0.695 * 0.515 0.938Primary or secondary homeless Stable residence 1.084 * 1.031 1.139Ex-offender Not ex-offender 0.774 * 0.719 0.833Country of birth language: Other than English English language 0.787 * 0.699 0.886Not useful vocational qualifications Has useful vocational qualifications 0.957 0.857 1.069Does not have vocational qualifications Has useful vocational qualifications 0.901 * 0.854 0.950English proficiency: Poor or mixed language level Good language level 0.764 * 0.720 0.812Geographic location: Low to moderate disadvantage ESA Very low disadvantage ESA 1.108 * 1.038 1.183Geographic location: High disadvantage ESA Very low disadvantage ESA 1.1500 * 1.059 1.249Geographic location: Very high to extreme disadvantage ESA Very low disadvantage ESA 1.327 * 1.202 1.464Not contactable by phone Contactable by phone 0.848 * 0.794 0.906Living circumstances: Single parent Lives alone 1.074 0.968 1.191Living circumstances: Lives with spouse / partner Lives alone 0.957 0.873 1.049Living circumstances: Other living conditions Lives alone 1.028 0.972 1.086Personal factors from JCA: Low impact No impact 1.156 * 1.043 1.282Personal factors from JCA: Medium impact No impact 1.134 * 1.044 1.233Personal factors from JCA: High impact No impact 1.094 * 1.016 1.178Job seeker history: More than one episode of income support First time on income support 1.021 0.969 1.074
341

Category Reference category Odds Ratio95% lower confidence limit
95% upper confidence limit
Job seeker history: Had crisis payment(s) No crisis payments 0.731 * 0.654 0.816Recent work experience: Part-time or seasonal work Full-time 1.063 0.984 1.149Recent work experience: Outside labour force or unpaid Full-time 0.992 0.928 1.061Recent work experience: Unemployed Full-time 1.051 0.984 1.123Duration on income support: 12 to 23 months Less than 12 months 1.307 * 1.215 1.407Duration on income support: 24+ months Less than 12 months 1.497 * 1.411 1.587Duration on income support: Not on income support Less than 12 months 0.868 * 0.813 0.927Indigenous Does not identify as indigenous 1.505 * 1.389 1.631Indigenous labour market location: Very low labour market disadvantage Not indigenous location 0.518 * 0.481 0.557Indigenous labour market location: Low to medium disadvantage Not indigenous location 0.462 * 0.428 0.499Indigenous labour market location: High to very high disadvantage Not indigenous location 0.422 * 0.387 0.461Proximity to labour market: Outer regional, remote, very remote or migratory
Metropolitan or inner regional 1.033 0.963 1.107
Income support: Newstart Not on income support 0.783 * 0.700 0.875Income support: PPS or PPP Not on income support 0.635 * 0.549 0.734Income support: Youth Allowance (YAO) Not on income support 0.557 * 0.484 0.641Income support: Other, non-activity tested payment Not on income support 0.714 * 0.609 0.836Education qualifications: Year 10 or 11 Less than year 10 1.208 * 1.143 1.276Education qualifications: Year 12, TAFE or diploma Less than year 10 1.170 * 1.097 1.248Education qualifications: Degree of post graduate Less than year 10 1.213 * 1.055 1.39415 - 19 year old male 25 – 34 year old male 1.752 * 1.519 2.02015 - 19 year old male 35 – 44 year old male 1.949 * 1.687 2.25315 - 19 year old male 45 – 54 year old male 2.098 * 1.799 2.44615 - 19 year old male 55 - 59 year old male 2.507 * 2.036 3.08715 - 19 year old male 60+ year old male 3.336 * 2.618 4.25120 – 24 year old male 15 - 19 year old male 0.740 * 0.644 0.85020 – 24 year old male 25 – 34 year old male 1.296 * 1.186 1.41720 – 24 year old male 35 – 44 year old male 1.442 * 1.315 1.58220 – 24 year old male 45 – 54 year old male 1.553 * 1.396 1.72720 – 24 year old male 55 - 59 year old male 1.855 * 1.555 2.213
342
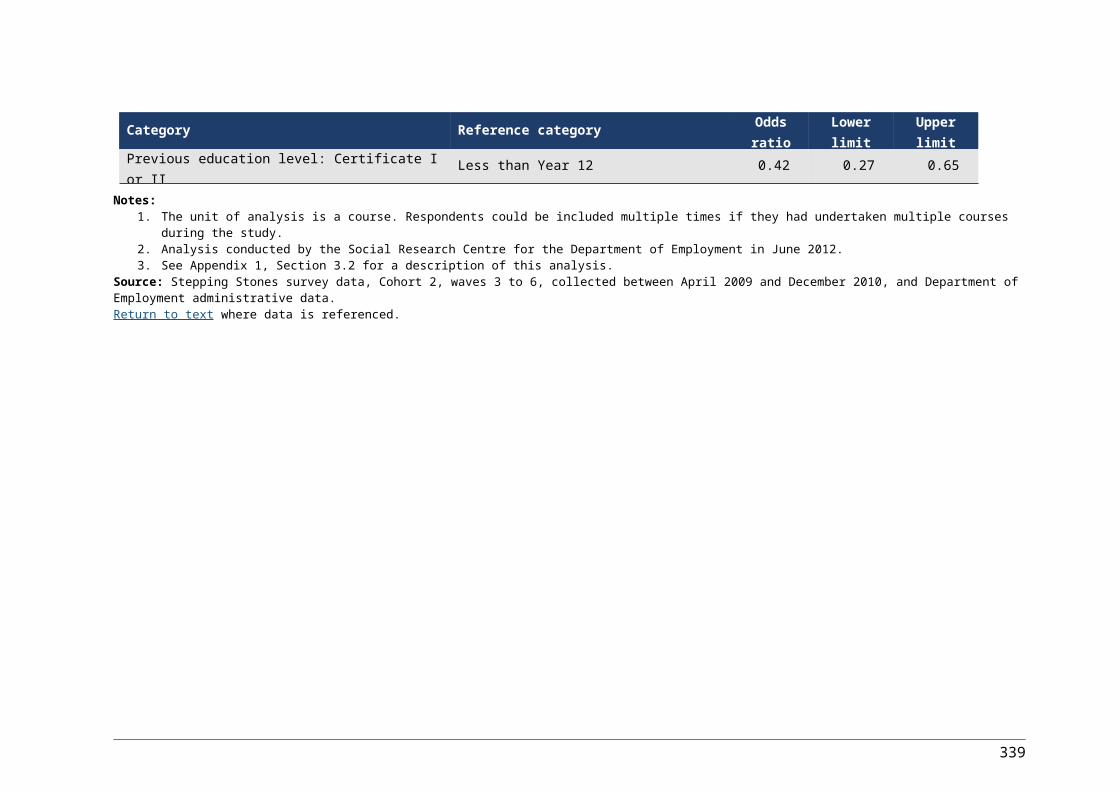
Category Reference category Odds Ratio95% lower confidence limit
95% upper confidence limit
20 – 24 year old male 60+ year old male 2.468 * 1.989 3.06325 – 34 year old male 35 – 44 year old male 1.113 * 1.032 1.20025 – 34 year old male 45 – 54 year old male 1.198 * 1.093 1.31325 – 34 year old male 55 - 59 year old male 1.431 * 1.210 1.69325 – 34 year old male 60+ year old male 1.904 * 1.545 2.34735 – 44 year old male 45 – 54 year old male 1.076 0.981 1.18135 – 44 year old male 55 - 59 year old male 1.286 * 1.087 1.52235 – 44 year old male 60+ year old male 1.711 * 1.388 2.10945 – 54 year old male 55 - 59 year old male 1.195 * 1.003 1.42345 – 54 year old male 60+ year old male 1.590 * 1.283 1.96955 - 59 year old male 60+ year old male 1.330 * 1.031 1.71720 – 24 year old female 15 - 19 year old female 0.652 * 0.558 0.76220 – 24 year old female 25 – 34 year old female 1.292 * 1.140 1.46520 – 24 year old female 35 – 44 year old female 1.229 * 1.087 1.38920 – 24 year old female 45 – 54 year old female 1.351 * 1.190 1.53320 – 24 year old female 55 - 59 year old female 1.888 * 1.549 2.30120 – 24 year old female 60+ year old female 2.372 * 1.758 3.20115 - 19 year old female 25 – 34 year old female 1.981 * 1.694 2.31615 - 19 year old female 35 – 44 year old female 1.883 * 1.615 2.19615 - 19 year old female 45 – 54 year old female 2.070 * 1.770 2.42215 - 19 year old female 55 - 59 year old female 2.893 * 2.325 3.60015 - 19 year old female 60+ year old female 3.635 * 2.657 4.97425 – 34 year old female 35 – 44 year old female 0.951 0.861 1.05025 – 34 year old female 45 – 54 year old female 1.045 0.940 1.16225 – 34 year old female 55 - 59 year old female 1.461 * 1.212 1.76025 – 34 year old female 60+ year old female 1.835 * 1.370 2.45835 – 44 year old female 45 – 54 year old female 1.100 0.996 1.21435 – 44 year old female 55 - 59 year old female 1.537 * 1.279 1.84535 – 44 year old female 60+ year old female 1.931 * 1.445 2.58045 – 54 year old female 55 - 59 year old female 1.397 * 1.162 1.681
343

Category Reference category Odds Ratio95% lower confidence limit
95% upper confidence limit
45 – 54 year old female 60+ year old female 1.756 * 1.313 2.34855 - 59 year old female 60+ year old female 1.256 0.906 1.74315 - 19 year old male 15 - 19 year old female 1.031 0.922 1.15320 – 24 year old male 20 – 24 year old female 1.169 * 1.036 1.32025 – 34 year old male 25 – 34 year old female 1.166 * 1.061 1.28135 – 44 year old male 35 – 44 year old female 0.996 0.909 1.09245 – 54 year old male 45 – 54 year old female 1.018 0.914 1.13355 - 59 year old male 55 - 59 year old female 1.190 0.944 1.50060+ year old male 60+ year old female 1.124 0.796 1.586
Notes: * indicates significant Source: Department of Employment administrative data.This data is referenced in several locations.
Return to discussion about mature age job seekers . Return to discussion about youth. Return to discussion about Indigenous job seekers where this data is referenced.
344

Table A2.68: Employment Services active caseload by length of unemployment, July 2006 to June 2012 (number)
Month Less than 12 months 12 to 23 months 24 months or more
July 2006 431,258 144,721 247,681
August 2006 420,031 144,374 248,017
September 2006 416,168 141,352 246,320
October 2006 410,162 142,210 246,742
November 2006 408,611 143,325 247,914
December 2006 414,491 143,112 250,340
January 2007 432,967 144,748 254,758
February 2007 428,322 144,094 256,742
March 2007 416,936 142,463 255,355
April 2007 402,678 139,680 256,201
May 2007 386,621 138,153 255,930
June 2007 377,631 136,782 255,301
July 2007 368,204 129,340 242,534
August 2007 355,561 124,838 232,484
September 2007 349,864 124,448 228,769
October 2007 343,110 123,603 225,109
November 2007 345,779 123,567 224,595
December 2007 351,517 123,354 224,300
January 2008 367,516 124,275 224,850
February 2008 368,806 122,971 223,644
March 2008 359,632 120,518 221,984
April 2008 359,608 118,676 219,632
May 2008 356,806 116,634 218,332
June 2008 356,692 114,522 216,640
July 2008 348,240 115,145 213,672
August 2008 339,576 116,769 212,469
September 2008 336,662 117,380 212,700
October 2008 337,715 117,909 212,751
November 2008 351,374 119,850 214,112
December 2008 368,003 120,053 213,439
January 2009 406,354 122,862 216,946
February 2009 432,868 124,536 218,953
March 2009 460,411 126,069 220,621
April 2009 465,779 127,161 208,549
May 2009 472,202 130,628 211,570
June 2009 468,430 133,605 213,320
July 2009 433,788 127,254 190,840
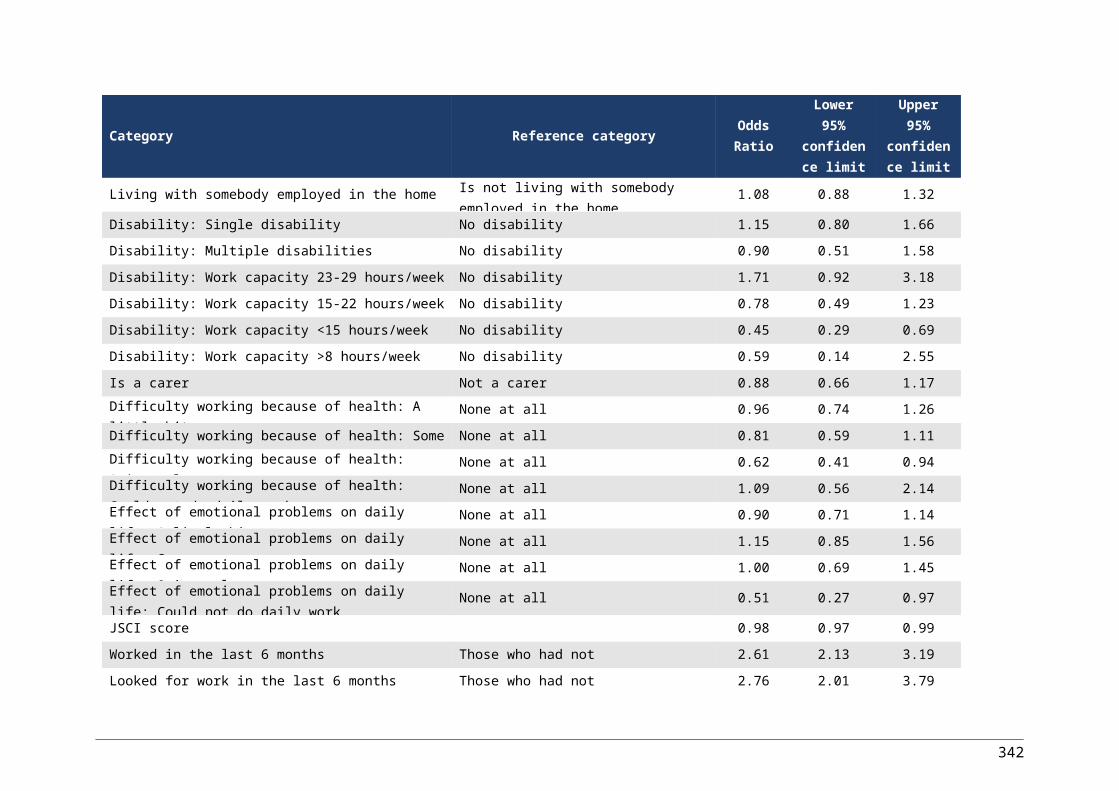
Month Less than 12 months 12 to 23 months 24 months or more
August 2009 437,104 122,663 191,218
September 2009 445,719 123,930 193,165
October 2009 444,121 127,258 197,568
November 2009 444,460 130,866 201,217
December 2009 447,328 140,430 203,536
January 2010 459,759 151,017 208,238
February 2010 458,721 159,891 209,863
March 2010 449,539 166,725 209,807
April 2010 435,686 170,340 210,478
May 2010 431,881 173,083 211,416
June 2010 418,890 175,171 211,239
July 2010 406,087 175,307 212,540
August 2010 395,203 174,605 215,207
September 2010 383,813 172,115 215,891
October 2010 374,965 168,253 217,609
November 2010 374,104 165,001 217,608
December 2010 377,697 163,857 220,573
January 2011 387,620 162,569 226,620
February 2011 388,466 159,305 231,004
March 2011 388,049 154,440 232,329
April 2011 381,746 148,599 233,782
May 2011 379,371 145,808 234,663
June 2011 373,284 140,424 235,509
July 2011 364,566 137,572 236,859
August 2011 356,763 133,014 235,049
September 2011 351,321 129,886 236,161
October 2011 346,822 127,897 235,964
November 2011 344,711 126,651 235,528
December 2011 349,530 127,383 236,330
January 2012 369,722 129,437 240,240
February 2012 370,396 130,931 241,824
March 2012 365,952 131,800 243,481
April 2012 363,348 132,065 243,879
May 2012 363,588 131,378 243,820
June 2012 362,143 133,148 244,165
Source: Department of Employment administrative data.
Return to text where data is referenced.
Return to Figure 7.8 where data is referenced.
346
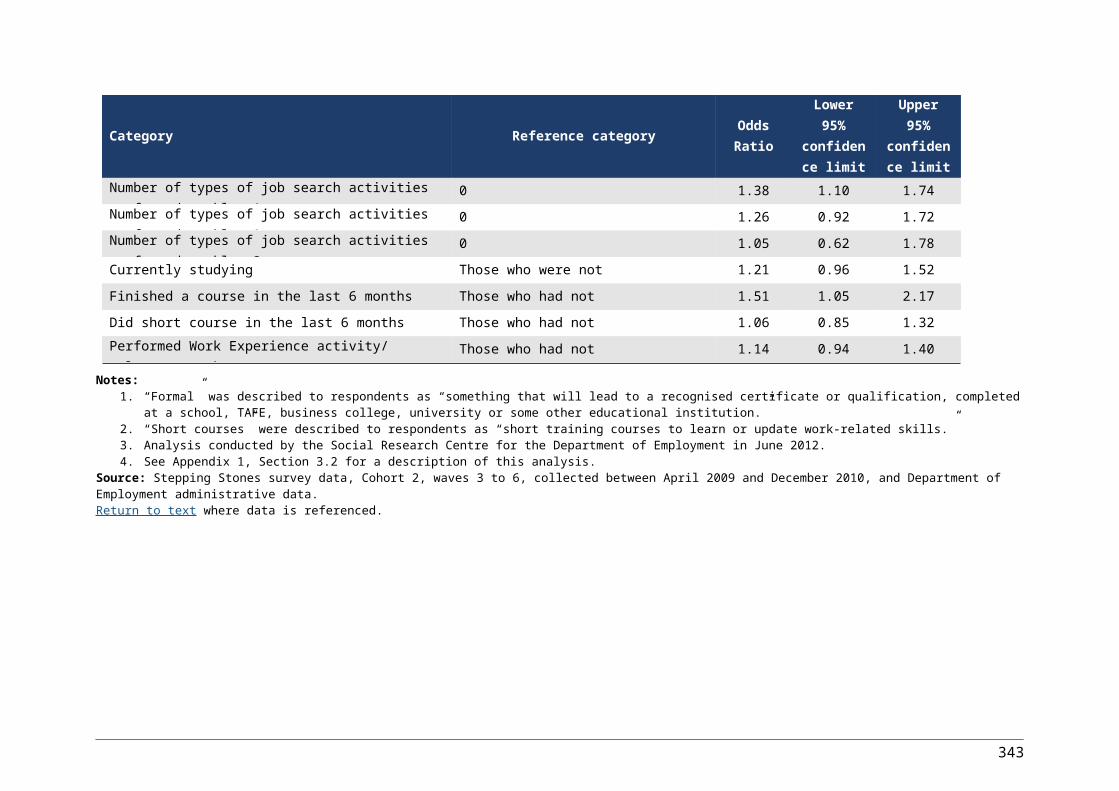
Table A2.69: Full-time and part-time employment outcome and education outcome rates by length of unemployment, JNS and JSA (per cent)
Full-time employment
Part-time employment
Education
JNS: 1 to less than 2 years 31.7 22.5 12.0
JNS: 2 to less than 5 years 23.6 18.9 10.0
JNS: 5 years or more 15.0 16.5 6.9
JSA: 1 to less than 2 years 24.7 24.5 19.1
JSA: 2 to less than 5 years 17.1 22.0 18.0
JSA: 5 years or more 9.5 18.8 13.0
Source: Department of Employment Post Programme Monitoring Survey.
Return to Figure 7.9 where data is referenced.
347

Table A2.70: Distribution of Job Seeker Classification Instrument (JSCI) scores for Indigenous and non-Indigenous job seekers, July 2009 to February 2011 (per cent)
JSCI score Non-Indigenous clients Indigenous clients Indigenous clients, no Indigenous factors
0 0.1 0.0 0.02 0.3 0.0 0.04 1.4 0.1 0.26 4.1 0.2 1.18 7.7 0.4 2.5
10 9.8 0.9 4.212 9.4 1.4 5.314 7.7 2.2 5.916 6.1 2.9 6.218 5.3 3.7 6.420 5.4 4.5 6.222 5.2 4.7 6.024 5.3 5.0 6.026 5.1 5.0 6.328 4.8 5.3 6.430 4.3 5.7 6.532 3.7 5.7 6.034 3.1 6.0 5.436 2.7 6.0 4.638 2.3 5.9 4.040 1.9 5.5 3.142 1.4 5.1 2.544 1.1 4.6 1.846 0.7 4.1 1.348 0.5 3.6 0.950 0.3 3.0 0.552 0.2 2.4 0.354 0.1 1.8 0.256 0.0 1.3 0.158 0.0 0.9 0.060 0.0 0.6 0.062 0.0 0.5 0.064 0.0 0.3 0.066 0.0 0.2 0.068 0.0 0.1 0.070 0.0 0.1 0.072 0.0 0.1 0.0
Note: Where JSA clients were assessed using previous versions of the JSCI, the scores have been adjusted, as far as possible, to reflect the operation of the JSCI during the 2009 – 2012 period.
Source: Department of Employment administrative data.
Return to Figure 8.1 where data is referenced.
348

Table A2.71: Select client groups in JSA active caseload, Indigenous and non-Indigenous job seekers, at 30 September 2010 (per cent)
Job seeker characteristic Indigenous Non-Indigenous
Single parents 13.8 16.0
Ex-offenders 24.0 10.2
Homeless 15.3 9.7
Disability 17.1 21.7
Stream 4 28.5 18.3
Source: Department of Employment administrative data.
Return to Figure 8.2 where data is referenced.
349

Table A2.72: Estimated proportions of JSA job seekers who experienced each domain of disadvantage (per cent)
Material Education Health Community Social
All job seekers 52.1 55.4 45.5 29.9 40.1
Indigenous job seekers 66.8 79.0 43.7 48.7 70.0
Note:
1. Job seekers unemployed less than three months are excluded from the analysis.
2. See Appendix 1, Section 3.3 for a description of this analysis.
Source: Department of Employment Stepping Stones survey data, cohort 3, wave 5.
Return to Figure 8.3 where data is referenced.
350

Table A2.73: Outcome rates for overall job seeker population and Indigenous job seekers, as at June 2012 (per cent)
Employed full-time
Employed part-time
Total employed Unemployed
Not in the labour force
Education and training
Positive outcomes
Indigenous 11.9 18.1 30.0 52.4 17.6 14.8 40.1
Overall 19.8 28.6 48.4 35.7 15.9 20.7 61.7
Notes:
1. This data refers to outcomes and employment status for job seekers who participated in JSA in the 12 months to June 2012, with outcomes measured around three months later (as estimated by PPM survey results).
2. Numbers may not add up due to rounding.
Source: Department of Employment Labour market assistance outcomes, September 2012 issue.
Return to Figure 8.4 where data is referenced.
351

Table A2.74: Comparison of effects of new entrant job seeker characteristics on the likelihood of leaving income support 18 months after registration
Category JNS Odds Ratio
JNS Wald Test p
JSA Odds Ratio
JSA Wald Test p
18 month average unemployment rate (per unit increase)
0.93 <.0001 0.94 <.0001
Age (squared, per unit increase) 1.00 <.0001 1.00 <.0001
Non-Indigenous vs Indigenous Australians 1.38 <.0001 1.37 <.0001
Non-single parent vs single parent 1.26 <.0001 1.43 <.0001
Female/Unknown vs male 0.74 <.0001 0.77 <.0001
Job seeker residence: Inner Regional Australia vs Very Remote Australia
1.02 <.0001 0.76 <.0001
Job seeker residence: Major Cities of Australia vs Very Remote Australia
1.15 <.0001 0.90 0.0151
Job seeker residence: Outer Regional Australia vs Very Remote Australia
1.09 0.4662 0.84 0.0074
Job seeker residence: Remote Australia vs Very Remote Australia
1.16 0.007 0.88 0.7208
Country of birth: high/very high disadvantage vs low/very low disadvantage
0.55 <.0001 0.52 <.0001
Country of birth: medium disadvantage vs low/very low disadvantage
0.92 <.0001 0.88 <.0001
JCA/ESAt identified disability vs no JCA/ESAt identified disability
0.25 <.0001 0.32 <.0001
JCA assessed condition with high impact (from JCA) vs other/low /medium impact
0.85 <.0001 1.15 0.0652
JCA assessed condition with no impact vs other/low/medium impact
1.01 <.0001 1.15 0.0021
Activity tested vs Volunteer 1.02 0.0378 1.03 0.0105
Past duration on income support: 0–12 months vs 13-more months
1.19 <.0001 1.20 <.0001
Past work experience: full-time/part-time (8-30 hours/week) vs unemployed
1.34 <.0001 1.32 <.0001
Past work experience: outside the labour force/unpaid vs unemployed
1.02 <.0001 1.00 <.0001
Past work experience: part-time( (less than 8 hours/week) vs unemployed
1.19 0.0225 1.11 0.6685
Education: Less than Year 10 vs Year 12 0.67 <.0001 0.64 <.0001
Education: TAFE/Diploma/Degree/Post Graduate vs Year 12
1.26 <.0001 1.09 <.0001
Education: Year 10/11 vs Year 12 0.81 <.0001 0.78 <.0001
With useful vocational qualifications vs no useful vocational qualifications
1.10 <.0001 1.27 <.0001
No vocational qualifications vs no useful vocational qualifications
0.97 <.0001 1.09 0.0431
352
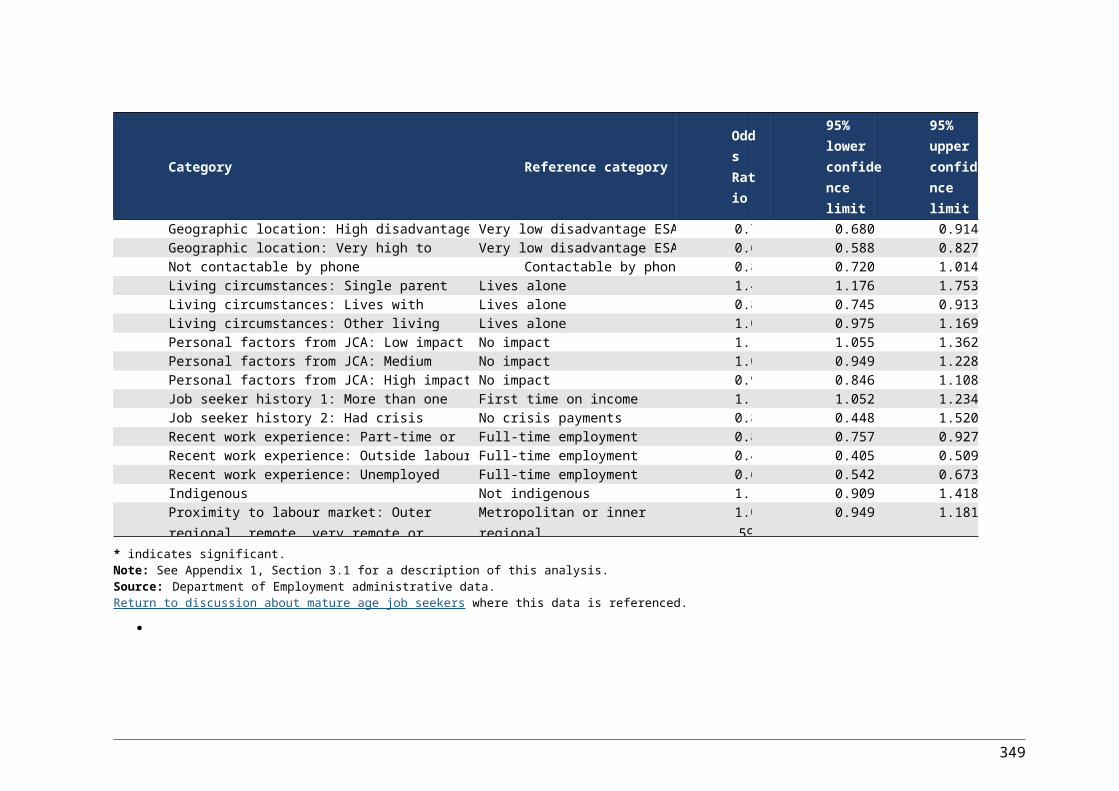
Category JNS Odds Ratio
JNS Wald Test p
JSA Odds Ratio
JSA Wald Test p
Contactable by phone vs not contactable by phone
1.16 <.0001 1.05 0.0015
No transport vs public transport 0.86 <.0001 0.94 <.0001
Other private transport vs public transport 0.93 0.1717 1.18 0.0011
Own Transport vs public transport 1.01 <.0001 1.51 <.0001
Age: Under 21 vs 50 and above years 0.45 <.0001 0.41 <.0001
Age: 21 to 24 vs 50 and above years 0.64 <.0001 0.54 <.0001
Age: 25 to 34 vs 50 and above years 0.70 0.0013 0.65 0.1107
Age: 35 to 49 vs 50 and above years 0.98 <.0001 0.89 <.0001
Off income support vs DSP 4.78 <.0001 7.34 <.0001
NSA vs DSP 2.22 <.0001 3.15 <.0001
YA(O) vs DSP 2.14 <.0001 2.93 <.0001
YA(S) vs DSP 1.81 <.0001 2.53 <.0001
PPP vs DSP 1.18 <.0001 1.58 <.0001
PPS vs DSP 0.65 <.0001 0.70 <.0001
Other benefits vs DSP 1.00 <.0001 1.61 <.0001
Income support zero rate vs full rate 1.47 <.0001 1.68 <.0001
Income support partial rate vs full rate 1.28 <.0001 1.15 <.0001
Assessed Stream 1 vs Assessed Stream 4 3.22 <.0001 2.09 <.0001
Assessed Stream 2 vs Assessed Stream 4 2.29 <.0001 1.59 0.0177
Assessed Stream 3 vs Assessed Stream 4 1.74 <.0001 1.31 <.0001
Note: See Appendix 1, Section 2 for a description of how new entrant comparisons were made and outcome measures used.
Source: Department of Employment administrative data and Research and Evaluation database (RED).
Return to text where data is referenced.
353
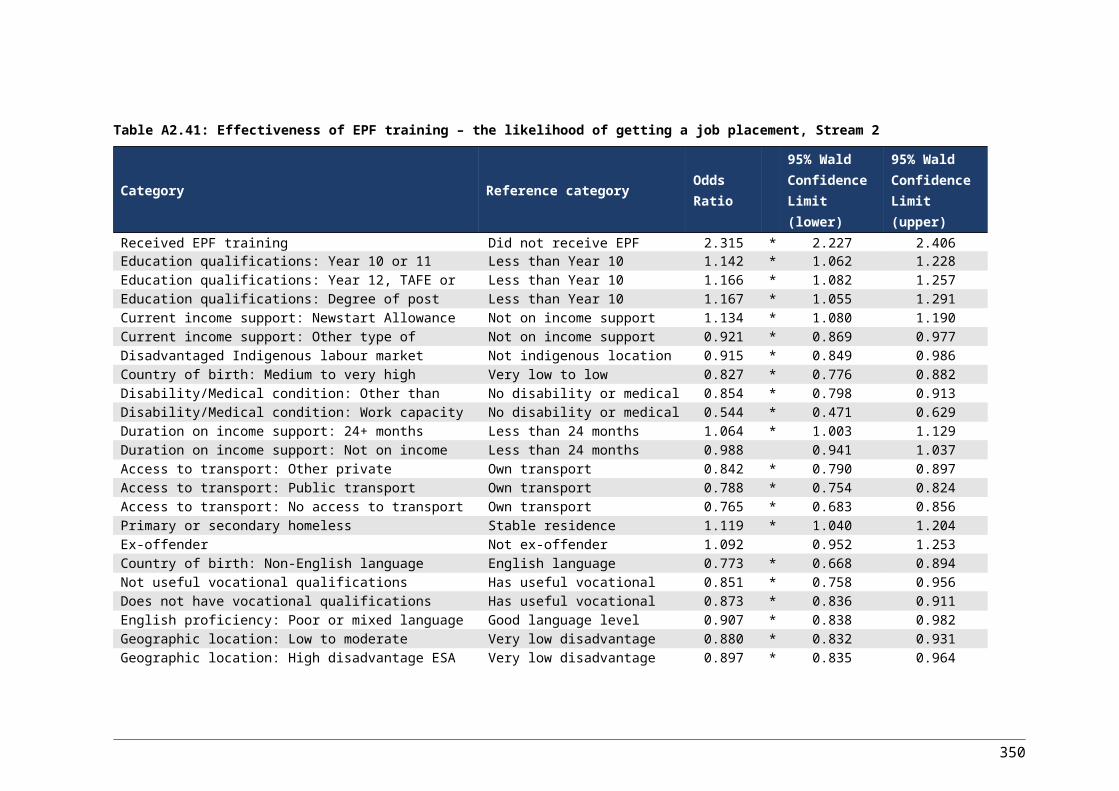
Table A2.75: Services received by employers who used JSA 2012 (per cent)
Service Per cent
Wage subsidies in the last 12 months 39.3
Support and follow-up after an employee started 77.7
Training after an employee started 10.0
Training before an employee started 14.4
Work experience or trial placement of a candidate 35.5
Candidate screening and short-listing 59.6
Notes:
1. Wage subsidies are expressed as a percentage of those employers who were aware of wage subsidies.2. Training and support/follow-up are expressed as a percentage of those employers who had recruited
someone through a JSA agency in the previous 12 months.
Source: Department of Employment 2012 Survey of Employers.
Return to Figure 9.1 where data is referenced.
354
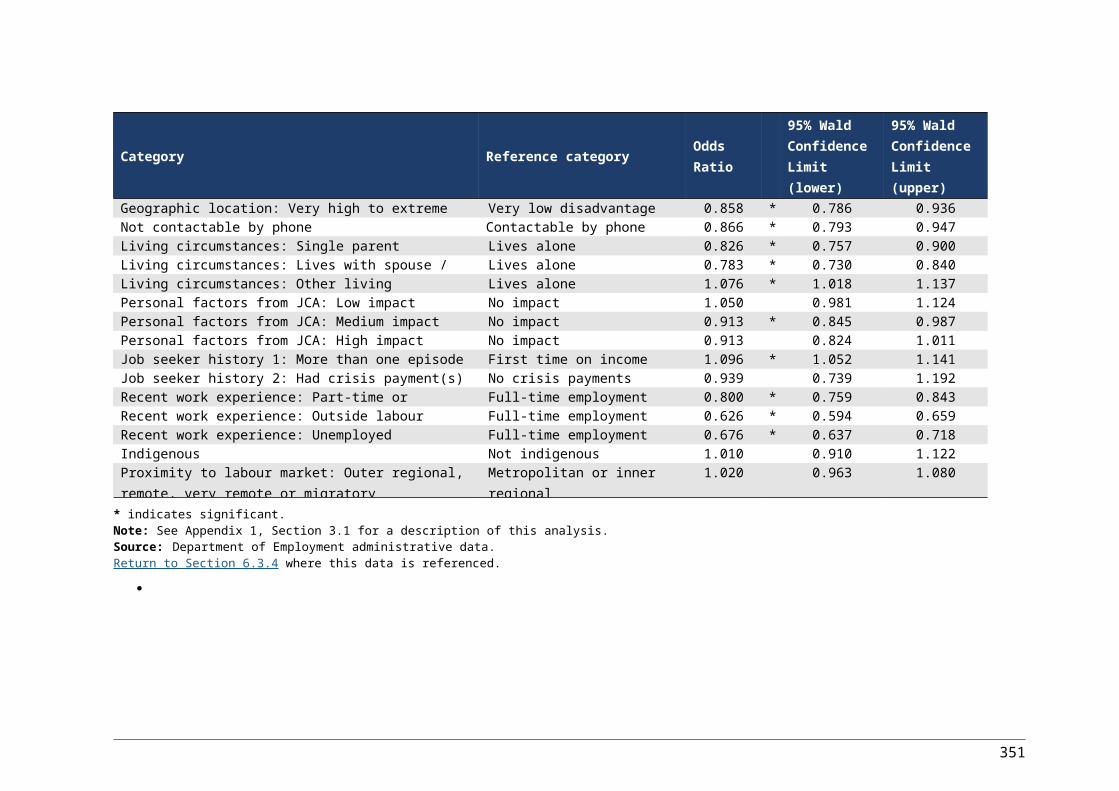
Table A2.76: Strategies reportedly used JSA providers to identify skills needs of employers 2012 (per cent)
Strategy Per cent
Networking with employers 99.0
Networking with other providers 40.9
Attending meetings of chambers of commerce /industry associations 73.0
Working with National Disability Recruitment Coordinator 12.8
Talking with Local Employment Coordinator (LEC) 33.7
Attend Department of Human Services Jobs Expos 67.8
Reverse marketing 96.6
Focus on job as described by employer 70.1
Working with Employer Broker 43.1
Note: ‘Talking with Local Employment Coordinator’ and ‘Attend Centrelink Job Expos’ only relate to providers located in Priority Employment Areas.
Source: Department of Employment 2012 Survey of Employment Service Providers.
Return to Figure 9.2 where data is referenced.
355

Table A2.77: Methods used by JSA providers to facilitate job placements 2012 (per cent)
Method Always Usually Seldom Total
Provide on-the-job training as part of post-placement support? 25.8 21.2 53.0 100.0
Educate employers about available support (such as JobAccess, Workplace Modifications)? 28.2 27.6 44.3 100.0
Educate employers about available wage subsidies? 59.5 31.7 8.8 100.0
Encourage employers to tailor the role to meet the client's needs? 26.8 28.8 44.4 100.0
Offer support to supervisors and co-workers? 43.0 28.5 28.5 100.0
Focus on the role as described by the employer? 49.5 38.0 12.6 100.0
Reverse market clients to new and existing employers? 66.2 28.7 5.1 100.0
Notes:
1. A five point scale was used to record responses for this question in the 2012 Survey of Employment Service Providers (1=never, 2=rarely, 3=sometimes, 4=usually, 5=always). ‘Seldom’ is the combination of ‘never’, ‘rarely’ and ‘sometimes’ responses.
2. Numbers may not add up due to rounding.
Source: Department of Employment 2012 Survey of Employment Service Providers.
Return to Figure 9.3 where data is referenced.
356

Table A2.78: Strategies JSA providers reported using to sustain employment (per cent)
Strategy Always Usually Seldom Total
Pre-placement training for the participant 20.3 31.7 48.0 100.0
Intensive support in the early weeks after placement 54.9 31.5 13.6 100.0
Ongoing support in the workplace 50.2 29.0 20.9 100.0
Coaching and supporting the person's supervisor 14.5 19.5 66.0 100.0
Note: Numbers may not add up due to rounding.
Source: Department of Employment 2012 Survey of Employment Service Providers.
Return to Figure 9.4 where data is referenced.
357

Table A2.79: Average Star Ratings for all generalist and specialist providers over JSA operation period
Release date Generalist Specialist
June 2010 3.1 2.5
September 2010 3.2 2.6
December 2010 3.2 2.7
March 2011 3.1 2.7
June 2011 3.1 2.8
August 2011 3.1 2.8
December 2011 3.1 2.9
March 2012 3.1 2.9
June 2012 3.1 3.0
September 2012 3.0 3.0
December 2012 3.1 3.1
March 2013 3.0 3.1
June 2013 3.0 3.0
September 2013 3.0 3.1
Note: See Appendix 1, Section 3.4 for a description of this analysis.
Source: Department of Employment contract level Star ratings.
Return to Figure 10.1 where data is referenced.
358

Table A2.80: Periods of assistance, JNS and JSA new entrant study populations and JSA active caseload (per cent)
Category JNS study population
JSA study population
JSA active commenced caseload
Assessed Stream 1 (Limited) 13.6 15.4 2.5
Assessed Stream 1 56.8 61.5 35.1
Assessed Stream 2 13.1 13.7 20.4
Assessed Stream 3 10.0 5.1 22.6
Assessed Stream 4 2.5 4.3 19.3
Assessed Unable to allocate 4.1 — 0.0
Actual start Stream 1 (Limited) n.a 14.2 2.5
Actual start Stream 1 n.a 44.5 20.0
Actual start Stream 2 n.a 21.7 31.6
Actual start Stream 3 n.a 10.7 26.6
Actual start Stream 4 n.a 8.9 19.3
Unable to allocate n.a — 0.0
Male less than 21 years old 9.0 11.3 7.8
Male 21 to 24 years old 7.3 7.5 7.8
Male 25 to 34 years old 14.9 12.9 13.8
Male 35 to 49 years old 14.6 12.7 15.6
Male 50 to 64 years old 6.9 6.7 9.6
Male 65 years and over 0.1 0.2 0.1
Male total 53.0 51.2 54.8
Female less than 21 years old 8.6 10.9 6.8
Female 21 to 24 years old 6.0 6.9 5.1
Female 25 to 34 years old 10.8 11.3 8.5
Female 35 to 49 years old 15.8 13.6 16.4
Female 50 to 64 years old 5.7 6.0 8.3
Female 65 years and over 0.0 0.1 0.0
Female total 47.0 48.8 45.2
Persons less than 21 years old 17.6 22.1 14.7
Persons 21 to 24 years old 13.4 14.5 12.9
Persons 25 to 34 years old 25.8 24.2 22.4
Persons 35 to 49 years old 30.4 26.3 32.0
Persons 50 to 64 years old 12.6 12.7 17.9
Persons 65 years and over 0.2 0.2 0.1
359

Category JNS study population
JSA study population
JSA active commenced caseload
Indigenous 6.2 6.2 11.6
Did not identify as Indigenous 92.0 92.7 87.0
Culturally and Linguistically Diverse 19.0 20.7 18.0
Redundant workers n.a n.a 13.7
Early School Leavers n.a 7.4 6.0
Total number periods of assistance 742,863 515,223 691,035
n.a. not applicable.
Notes:
1. Characteristics are those at the start of the period of assistance.
2. Numbers may not add up due to rounding.
3. See Appendix 1, Section 2.1 for a description of how new entrant comparisons were made.
Source: Department of Employment administrative data.
Return to discussion of new entrant study population in Appendix 1.
360
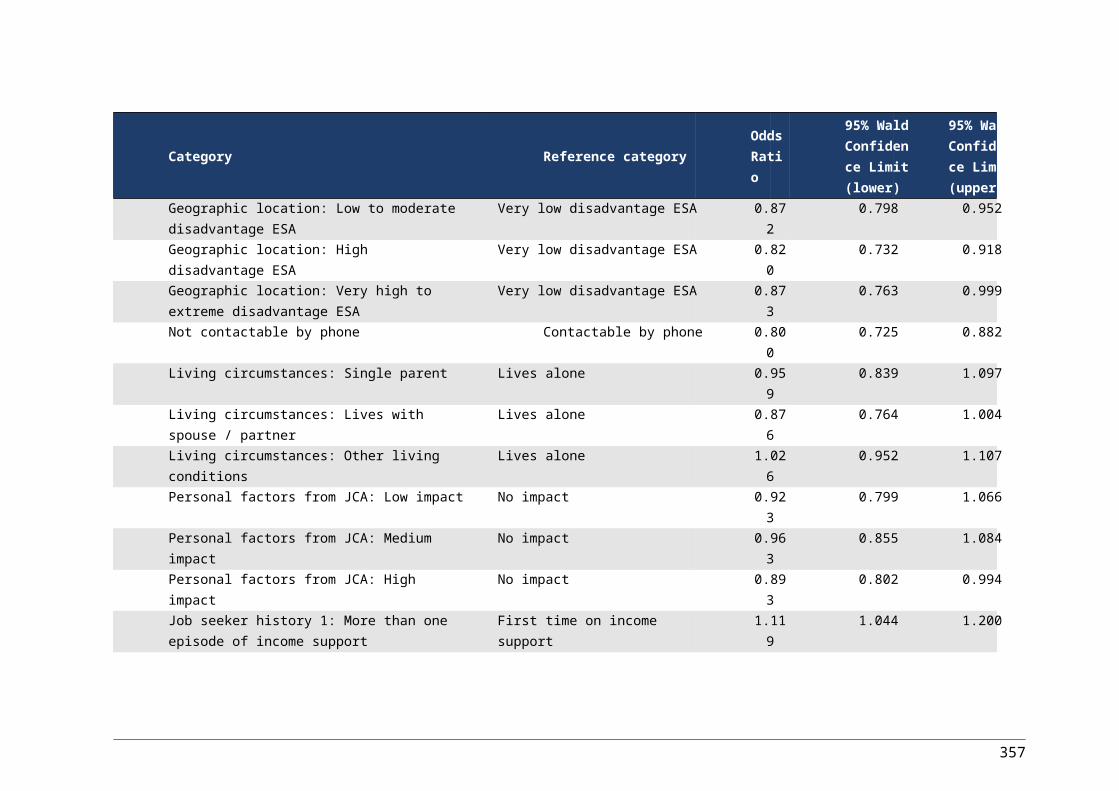
Table A2.81: Periods of assistance for Fully Eligible job seekers, JNS and JSA new entrant study populations and JSA caseload (per cent)
Category JNS study population
JSA study population JSA caseload
Job seeker residence: Major City 63.4 66.1 57.8
Job seeker residence: Inner Regional 21.3 21.1 21.2
Job seeker residence: Outer Regional 10.5 10.3 11.4
Job seeker residence: Remote 1.5 1.4 1.8
Job seeker residence: Very Remote 0.8 1.1 1.9
Job seeker residence: Unknown/not able to classify 2.6 0.1 6.0
Disability based on ESAt or JCA 11.0 11.4 15.5
Disability based on JSCI only 2.6 6.2 8.6
Total people with disability 13.6 17.6 24.1
Mixed or poor English proficiency 6.9 6.8 11.6
Homeless 7.1 4.4 9.4
Ex-offenders 7.5 6.5 10.9
Single parents 10.0 8.2 10.4
Highest level of education: Less than Year 10 12.9 7.9 11.2
Highest level of education: Year 10/11 31.2 25.7 23.1
Highest level of education: Year 12 21.9 22.2 10.2
Highest level of education: Vocational qualification 18.5 27.5 16.5
Highest level of education: Tertiary qualification 9.5 13.4 5.8
Highest level of education: Unknown / not stated 6.1 3.4 33.1
Total number periods of assistance 610,415 429,683 660,930
Notes:1. Characteristics are those at the start of the period of assistance, except for disability status, which is derived from
information closest to the end of the period of assistance.
2. For JNS, information was not available on English proficiency, single parent status and homelessness for 6.1 per cent of the population, and on ex-offender status for 7.4 per cent of the population.
3. For JSA, information was not available on English proficiency, single parent status and homelessness for 3.4 per cent of the population, and on ex-offender status for 4.6 per cent of the population.
4. Information on highest level of education was collected in a slightly different form from July 2009. In particular, more attention is now paid to vocational qualifications. In addition, the Learn or Earn initiative has led to an increased emphasis on accurate recording of educational qualifications for job seekers under 21 years of age. For these reasons, comparisons of this item between the JNS and JSA study populations should be undertaken with caution.
5. Geographical locations are defined using the Australian Standard Geographical Classification (ASGC) developed by the Australian Bureau of Statistics. This classification provides an indication of the degree of remoteness (or distance) from major cities (ABS, 2006). The geographical locations defined are not comparable with those used to classify JSA Labour Market Regions, as defined in the Employment Services Deed ESD4.
361

6. Periods of assistance are assigned to geographical locations using the job seeker’s home postcode at time of registration.
7. Numbers may not add up due to rounding.
8. See Appendix 1, Section 2.1 for a description of how new entrant comparisons were made.
Source: Department of Employment administrative data.
Return to discussion of new entrant study population in Appendix 1.
362