The euro area bank lending survey - European …...The euro area bank lending survey – Third...
61
The euro area bank lending survey Third quarter of 2019 October 2019
Transcript of The euro area bank lending survey - European …...The euro area bank lending survey – Third...

The euro area bank lending survey Third quarter of 2019
October 2019

The euro area bank lending survey – Third quarter of 2019 1
Contents
Introduction 2
1 Overview of results 3
Box 1 General notes 5
2 Developments in credit standards, terms and conditions, and net demand for loans in the euro area 8
2.1 Loans to enterprises 8
2.2 Loans to households for house purchase 13
2.3 Consumer credit and other lending to households 18
3 Ad hoc questions 25
3.1 Banks’ access to retail and wholesale funding 25
3.2 The impact of the ECB’s asset purchase programme 26
3.3 The impact of the ECB’s negative deposit facility rate 30
Annexes A1

The euro area bank lending survey – Third quarter of 2019 2
Introduction
The results reported in the October 2019 bank lending survey (BLS) relate to changes observed during the third quarter of 2019 and expectations for the fourth quarter of 2019. The survey was conducted between 13 and 30 September 2019. The response rate was 100%. In addition to results for the euro area as a whole, this report also contains results for the five largest euro area countries.1
A number of ad hoc questions were included in the October 2019 survey. They address the impact of the situation in financial markets on banks’ access to retail and wholesale funding, the impact of the ECB’s asset purchase programme and the impact of the ECB’s negative deposit facility rate on their lending policies.
1 The five largest euro area countries in terms of gross domestic product are Germany, France, Italy,
Spain and the Netherlands.
The euro area bank lending survey – Third quarter of 2019 3
1 Overview of results
Credit standards eased slightly in the third quarter of 2019 for loans to enterprises and loans to households for house purchase, also supported by more favourable funding conditions. This was in spite of a continued tightening contribution of risk perceptions related to the economic outlook. Credit standards, instead, continued to tighten for consumer credit. Loan demand remained broadly stable for enterprises and continued to increase for housing loans and consumer credit.
Credit standards (i.e. banks’ internal guidelines or loan approval criteria) for loans to enterprises eased slightly in the third quarter of 2019 (net percentage of reporting banks of -2%, after 5% in the second quarter of 2019), while banks had expected them to remain unchanged in the previous survey round. Credit standards on loans to households for house purchase also slightly eased (net percentage of reporting banks of -2%, after -1% in the second quarter of 2019), in contrast to expectations that they would remain unchanged. Credit standards on consumer credit and other lending to households tightened further (3%, after 4% in the second quarter of 2019), instead of the net easing expected in the previous quarter (-4%). For the fourth quarter of 2019, banks expect credit standards to remain broadly unchanged for all loan categories.
The slight net easing of credit standards on loans to enterprises was driven by the impact of competition (mainly from other banks), whereas risk perceptions (related to a deterioration in the general economic and firm-specific situation) continued to exert pressure in the opposite direction. However, in contrast to the last round, banks’ cost of funds and balance sheet constraints and risk tolerance ceased to have a tightening contribution. Moving to other loan segments, credit standards for loans to households for house purchase eased and continued to be supported by the easing pressure from competition and, to a lesser extent, by lower risk perceptions. For consumer credit and other lending to households, there was also a significant weakening in the easing pressure coming from competition.
Banks’ overall terms and conditions (i.e. banks’ actual terms and conditions agreed in the loan contract) for new loans to enterprises continued to tighten. The tightening impact was driven entirely by margins on riskier non-financial corporation (NFC) loans (defined as the spread over relevant market reference rates), while there was an easing contribution from margins on average loans. There was also a tightening of banks’ overall terms and conditions for housing loans, driven mainly by margins on riskier loans and, to a lesser extent, margins on average loans. Terms and conditions for consumer credit remained broadly unchanged, where there was a reduction in average margins, while margins on riskier loans remained broadly stable.
The net percentage share of rejected loan applications increased across all loan categories, in particular for loans to enterprises.
Net demand for loans to enterprises remained broadly stable in the third quarter of 2019, in spite of an expected increase (net percentage of 1%, after 6% in the second quarter of 2019). Banks expect demand to remain broadly unchanged also in the

The euro area bank lending survey – Third quarter of 2019 4
fourth quarter of 2019 (net percentage of 1%). There was a net increase in demand for consumer credit (net percentage of 8%, up from 4%) and a more pronounced increase for housing loans (net percentage of 15%, down from 26%). For the fourth quarter of 2019, banks expect an increase in net demand for housing loans (20%) and for consumer credit (14%).
The increase in net demand for housing loans continued to be driven mainly by the low general level of interest rates and, to a lesser extent, by favourable housing market prospects. The increase in net demand for consumer credit and other lending to households is mainly explained by the general level of interest rates and consumer confidence, where these positive contributions both increased relative to the previous period.
Among the largest euro area countries, credit standards on loans to enterprises eased in Italy and the Netherlands, remained unchanged in Spain and slightly tightened in France and Germany in the third quarter of 2019 (see overview table). For housing loans, credit standards eased in Italy and the Netherlands, and remained unchanged in France, Germany and Spain. Net demand for loans to enterprises increased in France and Germany, while it declined in Italy, Spain and, to a lesser extent, the Netherlands in the third quarter of 2019. For housing loans, net demand increased in most large euro area countries, except for Spain where it notably decreased.
Overview table Latest developments in BLS results in the largest euro area countries
(net percentages of banks reporting tightening credit standards or an increase in loan demand)
Enterprises House purchase Consumer credit
Credit standards Demand Credit standards Demand Credit standards Demand
Country Q2 19
Q3 19 Avg.
Q2 19
Q3 19 Avg.
Q2 19
Q3 19 Avg.
Q2 19
Q3 19 Avg.
Q2 19
Q3 19 Avg.
Q2 19
Q3 19 Avg.
Euro area 5 -2 9 6 1 -1 -1 -2 6 26 15 5 4 3 4 4 8 1
Germany 3 3 3 9 9 5 -3 0 2 38 28 8 0 0 0 10 6 9
Spain 0 0 9 -10 -30 -4 11 0 14 0 -33 -8 20 20 6 -10 -10 -6
France 15 3 6 20 29 -10 -2 0 1 28 28 8 0 0 -1 13 26 0
Italy 20 -10 13 20 -20 5 0 -10 1 20 10 15 0 -10 6 -10 -10 14
Netherlands -24 -24 8 -51 -2 0 -34 -30 10 50 14 2 0 0 12 0 0 -14
Notes: The “Avg.” columns contain historical averages, which are calculated over the period since the beginning of the survey, excluding the most recent round. For France and the Netherlands, net percentages are weighted on the basis of outstanding loan amounts for individual banks in the respective national samples.
The October 2019 BLS also included a number of ad hoc questions. Regarding euro area banks’ access to wholesale funding, banks reported in net terms that access improved in the third quarter of 2019 for debt securities and to a small extent also for money markets and securitisation. As regards retail funding, banks indicated that it remained broadly unchanged for the third quarter of 2019.
With respect to the impact of the ECB’s asset purchase programme (APP), euro area BLS banks continued to report a positive impact of the APP on their liquidity position and on market financing conditions and a negative impact on their profitability over the past six months. In addition, the impact of the APP was mainly on housing loans over the past six months, where banks reported an easing impact

The euro area bank lending survey – Third quarter of 2019 5
on their credit terms and conditions and a positive impact on their lending volumes. Importantly, over the coming six months, banks expect a favourable impact on terms and conditions, and on loan volumes, with the exception of loan volumes for enterprises where they expect them to remain unchanged.
Euro area BLS banks reported that the ECB’s negative deposit facility rate (DFR) continued to contribute to an increase in lending volumes and a decrease in lending rates across all loan categories. Banks also indicated that the negative DFR has a negative impact on their net interest income.
Box 1 General notes
The bank lending survey (BLS) is addressed to senior loan officers at a representative sample of euro area banks. In the current survey round, 144 banks participated in the survey, representing all euro area countries and reflecting the characteristics of their respective national banking structures. The main purpose of the BLS is to enhance the Eurosystem’s knowledge of bank lending conditions in the euro area.2
BLS questionnaire
The BLS questionnaire contains 22 standard questions on past and expected future developments: 18 backward-looking questions and four forward-looking questions. In addition, it contains one open-ended question. Those questions focus on developments in loans to euro area residents (i.e. domestic and euro area cross-border loans) and distinguish between three loan categories: loans or credit lines to enterprises; loans to households for house purchase; and consumer credit and other lending to households. For all three categories, questions are asked about the credit standards applied to the approval of loans, the terms and conditions of new loans, loan demand, the factors affecting loan supply and demand conditions, and the percentage of loan applications that are rejected. Survey questions are generally phrased in terms of changes over the past three months or expected changes over the next three months. Survey participants are asked to indicate in a qualitative way the strength of any tightening or easing or the strength of any decrease or increase, reporting changes using the following five-point scale: (1) tightened/decreased considerably, (2) tightened/decreased somewhat, (3) basically no change, (4) eased/increased somewhat or (5) eased/increased considerably.
In addition to the standard questions, the BLS questionnaire may contain ad hoc questions on specific topics of interest. Whereas the standard questions cover a three-month time period, the ad hoc questions tend to refer to changes over a longer time period (e.g. over the past and next six months).
Aggregation of banks’ replies to national and euro area BLS results
The responses of the individual banks participating in the BLS are aggregated in two steps. In the first step, the responses of individual banks are aggregated to form national results for euro area countries. And in the second step, those national BLS results are aggregated to form euro area BLS results.
2 For more detailed information on the bank lending survey, see the article entitled “A bank lending
survey for the euro area”, Monthly Bulletin, ECB, April 2003; and Köhler-Ulbrich, P., Hempell, H. and Scopel, S., “The euro area bank lending survey”, Occasional Paper Series, No 179, ECB, 2016.

The euro area bank lending survey – Third quarter of 2019 6
In the first step, banks’ replies can be aggregated to form national BLS results by applying equal weights to all banks in the sample3 or, alternatively, by applying a weighting scheme based on outstanding loans to non-financial corporations and households for the individual banks in the respective national samples. Specifically, for France, Malta, the Netherlands and Slovakia, an explicit weighting scheme is applied.
In the second step, since the numbers of banks in the national samples differ considerably and do not always reflect those countries’ respective shares of lending to euro area non-financial corporations and households, the national survey results are aggregated to form euro area BLS results by applying a weighting scheme based on national shares of outstanding loans to euro area non-financial corporations and households.
BLS indicators
Responses to questions related to credit standards are analysed in this report by looking at the difference (the “net percentage”) between the percentage of banks reporting that credit standards applied in the approval of loans have been tightened and the percentage of banks reporting that they have been eased. For all questions, the net percentage is determined on the basis of all participating banks that have business in or exposure to the respective loan categories (i.e. they are all included in the denominator when calculating the net percentage). This means that banks that specialise in certain loan categories (e.g. banks that only grant loans to enterprises) are only included in the aggregation for those categories. All other participating banks are included in the aggregation of all questions, even if a bank replies that a question is “not applicable” (“NA”). This harmonised aggregation method was introduced by the Eurosystem in the April 2018 BLS. It has been applied to all euro area and national BLS results in the current BLS questionnaire, including backdata.4 The resulting revisions for the standard BLS questions have generally been small, but revisions for some ad hoc questions have been larger owing to a higher number of “not applicable” replies by banks.
A positive net percentage indicates that a larger proportion of banks have tightened credit standards (“net tightening”), whereas a negative net percentage indicates that a larger proportion of banks have eased credit standards (“net easing”).
Likewise, the term “net demand” refers to the difference between the percentage of banks reporting an increase in loan demand (i.e. an increase in bank loan financing needs) and the percentage of banks reporting a decline. Net demand will therefore be positive if a larger proportion of banks have reported an increase in loan demand, whereas negative net demand indicates that a larger proportion of banks have reported a decline in loan demand.
In the assessment of survey balances for the euro area, net percentages between -1 and +1 are generally referred to as “broadly unchanged”. For the country results, net percentage changes are reported in a factual manner, as differing sample sizes across countries mean that the answers of individual banks have differing impacts on the magnitude of net percentage changes.
In addition to the “net percentage” indicator, the ECB also publishes an alternative measure of banks’ responses to questions related to changes in credit standards and net demand. This
3 In this case, the selected sample banks are generally of similar size or their lending behaviour is typical
of a larger group of banks. 4 The non-harmonised historical data differ from the harmonised data mainly as a result of
heterogeneous treatment of “NA” replies and specialised banks across questions and countries. Non-harmonised historical BLS data are published for discontinued BLS questions and ad hoc questions.

The euro area bank lending survey – Third quarter of 2019 7
measure is the weighted difference (“diffusion index”) between the percentage of banks reporting that credit standards have been tightened and the percentage of banks reporting that they have been eased. Likewise, as regards demand for loans, the diffusion index refers to the weighted difference between the percentage of banks reporting an increase in loan demand and the percentage of banks reporting a decline. The diffusion index is constructed in the following way: lenders who have answered “considerably” are given a weight (score of 1) twice as high as lenders having answered “somewhat” (score of 0.5). The interpretation of the diffusion indices follows the same logic as the interpretation of net percentages.
Detailed tables and charts based on the responses provided can be found in Annex 1 for the standard questions and Annex 2 for the ad hoc questions. In addition, BLS time series data are available on the ECB’s website via the Statistical Data Warehouse.
A copy of the questionnaire, a glossary of BLS terms and a BLS user guide with information on the BLS series keys can all be found at: https://www.ecb.europa.eu/stats/ecb_surveys/bank_lending_survey/html/index.en.html

The euro area bank lending survey – Third quarter of 2019 8
2 Developments in credit standards, terms and conditions, and net demand for loans in the euro area
2.1 Loans to enterprises
2.1.1 Credit standards eased slightly for loans to enterprises
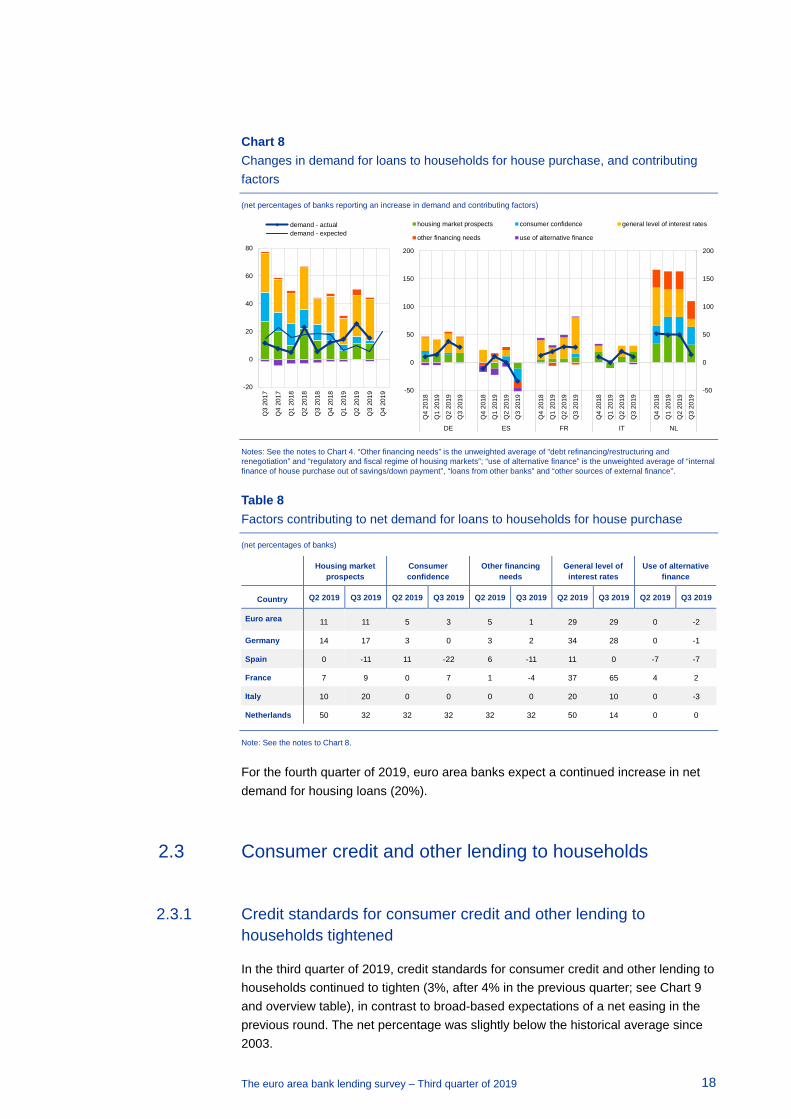
Credit standards (i.e. banks’ internal guidelines or loan approval criteria) for loans to enterprises eased slightly in the third quarter of 2019 (net percentage of reporting banks of -2%, after 5% in the second quarter of 2019; see Chart 1 and overview table). By contrast, banks had expected them to remain unchanged in the previous round. Across the different firm sizes, credit standards slightly eased for loans to small and medium-sized enterprises (-2%) and remained broadly unchanged for loans to large firms (-1%).
Chart 1 Changes in credit standards applied to the approval of loans or credit lines to enterprises, and contributing factors
(net percentages of banks reporting tightening credit standards and contributing factors)
Notes: “Actual” values are changes that have occurred, while “expected” values are changes anticipated by banks. Net percentages are defined as the difference between the sum of the percentages of banks responding “tightened considerably” and “tightened somewhat” and the sum of the percentages of banks responding “eased somewhat” and “eased considerably”. The net percentages for responses to questions related to contributing factors are defined as the difference between the percentage of banks reporting that the given factor contributed to a tightening and the percentage reporting that it contributed to an easing. “Cost of funds and balance sheet constraints” is the unweighted average of “costs related to capital position”, “access to market financing” and “liquidity position”; “risk perceptions” is the unweighted average of “general economic situation and outlook”, “industry or firm-specific situation and outlook/borrower’s creditworthiness” and “risk related to the collateral demanded”; “competition” is the unweighted average of “competition from other banks”, “competition from non-banks” and “competition from market financing”.
The slight net easing of credit standards on loans to enterprises was largely driven by the impact of competition (mainly from other banks), whereas risk perceptions, related to a deterioration in the general economic and firm-specific situation, continued to exert pressure in the opposite direction. However, in contrast to the
-20
-15
-10
-5
0
5
10
Q3
2017
Q4
2017
Q1
2018
Q2
2018
Q3
2018
Q4
2018
Q1
2019
Q2
2019
Q3
2019
Q4
2019
credit standards - actual
credit standards - expected
-50
-40
-30
-20
-10
0
10
20
30
-50
-40
-30
-20
-10
0
10
20
30
Q4
2018
Q1
2019
Q2
2019
Q3
2019
Q4
2018
Q1
2019
Q2
2019
Q3
2019
Q4
2018
Q1
2019
Q2
2019
Q3
2019
Q4
2018
Q1
2019
Q2
2019
Q3
2019
Q4
2018
Q1
2019
Q2
2019
Q3
2019
DE ES FR IT NL
banks' risk tolerancerisk perceptionscompetitioncost of funds and balance sheet constraints

The euro area bank lending survey – Third quarter of 2019 9
previous round, banks’ cost of funds and balance sheet constraints and risk tolerance ceased to make a tightening contribution (see Chart 1 and Table 1).5
Across the large euro area countries, credit standards on loans to enterprises eased in Italy and the Netherlands, remained unchanged in Spain and slightly tightened in France and Germany in the third quarter of 2019 (see overview table). Competitive pressure contributed to an easing of credit standards in all large countries except for Germany. By contrast, risk perceptions related to the general economic and firm-specific situation contributed to a tightening in most large countries, except for the Netherlands. Risk tolerance continued to have a tightening impact in France, but in contrast to the last round, risk tolerance ceased to have a tightening contribution in Italy, where it now has an easing contribution. Only banks in the Netherlands reported a tightening impact of banks’ cost of funds and balance sheet constraints.
Looking ahead to the fourth quarter of 2019, euro area banks foresee no change in credit standards for loans to enterprises.
Table 1 Factors contributing to the net easing of credit standards for loans or credit lines to enterprises
(net percentages of banks)
Cost of funds and balance sheet
constraints Pressure from competition Perception of risk Banks’ risk tolerance
Country Q2 2019 Q3 2019 Q2 2019 Q3 2019 Q2 2019 Q3 2019 Q2 2019 Q3 2019
Euro area 2 0 -4 -5 5 5 2 -1
Germany 1 1 -1 0 3 3 0 0
Spain 3 0 -7 -3 3 7 0 0
France 1 0 -4 -10 7 8 3 3
Italy 0 -3 -7 -3 13 7 10 -10
Netherlands 8 8 -16 -16 0 0 0 0
Note: See the notes to Chart 1.
2.1.2 Terms and conditions for loans to enterprises tightened
In the third quarter of 2019, overall terms and conditions that banks apply when granting new loans or credit lines (i.e. the actual terms and conditions agreed in the loan contract) to enterprises continued to tighten (see Chart 2) after an extended period of easing. The tightening impact was driven entirely by margins on riskier NFC loans, whereas there was, in fact, a slight easing for margins on average loans. Collateral requirements remained broadly unchanged, while other credit terms and conditions eased slightly.
5 The calculation of a simple average when combining factors in broader categories assumes that all
factors have the same importance for the banks. This partly explains some inconsistencies in the respective charts between developments in credit standards and developments in the main underlying factor categories.

The euro area bank lending survey – Third quarter of 2019 10
Chart 2 Changes in terms and conditions for loans or credit lines to enterprises
(net percentages of banks reporting tightening terms and conditions)
Notes: “Margins” are defined as the spread over a relevant market reference rate. “Other terms and conditions” is the unweighted average of “non-interest rate charges”, “size of the loan or credit line”, “loan covenants” and “maturity”.
Across the largest euro area countries, overall terms and conditions on new loans or credit lines to enterprises tightened only in France, while they remained unchanged in the other countries. For margins on average loans only Germany reported a tightening, while France reported an easing. For margins on riskier loans, France, Germany and Spain all reported a tightening. Following the tightening reported in the previous quarter, margins on riskier loans had a neutral impact in Italy. None of the components changed for the Netherlands in the third quarter of 2019.
Table 2 Changes in terms and conditions for loans or credit lines to enterprises
(net percentages of banks)
Overall terms and conditions Banks’ margins on average
loans Banks’ margins on riskier
loans
Country Q2 2019 Q3 2019 Q2 2019 Q3 2019 Q2 2019 Q3 2019
Euro area 4 3 3 -2 7 8
Germany 6 0 3 6 3 16
Spain -10 0 -10 0 10 10
France 12 12 19 -6 12 6
Italy 0 0 0 0 10 0
Netherlands 0 0 0 0 0 0
Note: See the notes to Chart 2.
Regarding the factors contributing to changes in overall credit terms and conditions, banks’ cost of funds and balance sheet constraints and risk perceptions were the main drivers of the tightening, while competition continued to ease terms and conditions (see Table 3).
Across the largest euro area countries, competitive pressure contributed to easier credit terms and conditions in most countries, except Italy and the Netherlands, where they ceased to have an easing contribution. Risk perceptions had a tightening contribution in all countries except for the Netherlands. Cost of funds and balance
-50
-40
-30
-20
-10
0
10
20
Q3
2017
Q4
2017
Q1
2018
Q2
2018
Q3
2018
Q4
2018
Q1
2019
Q2
2019
Q3
2019
overall terms and conditions
-60
-40
-20
0
20
40
60
-60
-40
-20
0
20
40
60
Q4
2018
Q1
2019
Q2
2019
Q3
2019
Q4
2018
Q1
2019
Q2
2019
Q3
2019
Q4
2018
Q1
2019
Q2
2019
Q3
2019
Q4
2018
Q1
2019
Q2
2019
Q3
2019
Q4
2018
Q1
2019
Q2
2019
Q3
2019
DE ES FR IT NL
margins on average loans margins on riskier loanscollateral requirements other terms and conditions

The euro area bank lending survey – Third quarter of 2019 11
sheet constraints had a tightening impact on terms and conditions in France, Germany and the Netherlands, while they were neutral in Italy and Spain.
Table 3 Factors contributing to the net tightening of overall terms and conditions for loans or credit lines to enterprises
(net percentages of banks)
Cost of funds and balance sheet
constraints Pressure from competition Perception of risk Banks’ risk tolerance
Country Q2 2019 Q3 2019 Q2 2019 Q3 2019 Q2 2019 Q3 2019 Q2 2019 Q3 2019
Euro area 3 8 -13 -11 7 6 1 0
Germany 3 9 -9 -6 0 3 0 -3
Spain -10 0 -10 -10 0 10 0 0
France 0 12 -12 -17 22 9 3 3
Italy 0 0 -10 0 10 10 0 0
Netherlands 24 24 -24 0 0 0 0 0
Note: The net percentages for these questions relating to contributing factors are defined as the difference between the percentage of banks reporting that the given factor contributed to a tightening and the percentage reporting that it contributed to an easing.
2.1.3 Rejection rate for loans to enterprises continued to increase
The net percentage share of rejected loan applications (i.e. the difference between the sum of the percentages of banks reporting an increase and that of banks reporting a decline in the share of loan rejections) continued to increase for loans to euro area enterprises in the third quarter of 2019 (7%; see Chart 3).
Chart 3 Change in the share of rejected applications for loans to enterprises
(net percentages of banks reporting an increase in the share of rejections)
Note: Share of loan rejections relative to the volume of all loan applications in that loan category.
Across the largest euro area countries, the net rejection rate increased in Germany and the Netherlands, while it remained unchanged in France, Italy and Spain.
-30
-20
-10
0
10
20
30
-30
-20
-10
0
10
20
30
Q4
2018
Q1
2019
Q2
2019
Q3
2019
Q4
2018
Q1
2019
Q2
2019
Q3
2019
Q4
2018
Q1
2019
Q2
2019
Q3
2019
Q4
2018
Q1
2019
Q2
2019
Q3
2019
Q4
2018
Q1
2019
Q2
2019
Q3
2019
DE ES FR IT NL
euro area DE ES FR IT NL
-10
-5
0
5
10
Q3
2019
Q2
2019
Q1
2019
Q4
2018
Q3
2018
Q2
2018
Q1
2018
Q4
2017
Q3
2017

The euro area bank lending survey – Third quarter of 2019 12
2.1.4 Net demand for loans to enterprises remained broadly unchanged
Net demand for loans to enterprises remained broadly unchanged in the third quarter of 2019, in spite of expectations of an increase in the previous round (net percentage of 1%, after 6% in the second quarter of 2019; see Chart 4 and overview table). Demand slightly increased for loans to SMEs, but decreased for loans to large firms.
Across the large euro area countries, net demand for loans to enterprises increased in France and Germany, while it declined in Italy and Spain, and to a lesser extent in the Netherlands.
Chart 4 Changes in demand for loans or credit lines to enterprises, and contributing factors
(net percentages of banks reporting an increase in demand and contributing factors)
Notes: “Actual” values are changes that have occurred, while “expected” values are changes anticipated by banks. Net percentages for the questions on demand for loans are defined as the difference between the sum of the percentages of banks responding “increased considerably” and “increased somewhat” and the sum of the percentages of banks responding “decreased somewhat” and “decreased considerably”. The net percentages for responses to questions related to contributing factors are defined as the difference between the percentage of banks reporting that the given factor contributed to increasing demand and the percentage reporting that it contributed to decreasing demand. “Other financing needs” is the unweighted average of “mergers/acquisitions and corporate restructuring” and “debt refinancing/restructuring and renegotiation”; “use of alternative finance” is the unweighted average of “internal financing”, “loans from other banks”, “loans from non-banks”, “issuance/redemption of debt securities” and “issuance/redemption of equity”.
Demand for loans to enterprises was mainly supported by the low general level of interest rates and, to a lesser extent, other financing needs. There was a further reduction in the positive contribution of fixed investment. M&A activity also contributed to the growth in demand (this is included in “other financing needs”; see Chart 4 and Table 4). By contrast, inventories and the recourse to working capital contributed negatively to loan demand, with the largest negative net percentage since 2013.6
6 The calculation of a simple average when combining factors in broader categories assumes that all
factors have the same importance for the banks. This partly explains some inconsistencies between developments in demand for loans and developments in the main underlying factor categories.
-10
0
10
20
30
40
50
60
Q3
2017
Q4
2017
Q1
2018
Q2
2018
Q3
2018
Q4
2018
Q1
2019
Q2
2019
Q3
2019
Q4
2019
demand - actualdemand - expected
-125
-100
-75
-50
-25
0
25
50
75
100
125
150
175
-125
-100
-75
-50
-25
0
25
50
75
100
125
150
175Q
4 20
18
Q1
2019
Q2
2019
Q3
2019
Q4
2018
Q1
2019
Q2
2019
Q3
2019
Q4
2018
Q1
2019
Q2
2019
Q3
2019
Q4
2018
Q1
2019
Q2
2019
Q3
2019
Q4
2018
Q1
2019
Q2
2019
Q3
2019
DE ES FR IT NL
fixed investment inventories and working capital general level of interest rates
other financing needs use of alternative finance

The euro area bank lending survey – Third quarter of 2019 13
Table 4 Factors contributing to net demand for loans or credit lines to enterprises
(net percentages of banks)
Fixed investment Inventories and working capital
Other financing needs
General level of interest rates
Use of alternative finance
Country Q2 2019 Q3 2019 Q2 2019 Q3 2019 Q2 2019 Q3 2019 Q2 2019 Q3 2019 Q2 2019 Q3 2019
Euro area 6 2 -1 -5 3 5 6 10 -1 -3
Germany 13 13 -3 -6 -2 5 3 16 -3 -3
Spain -10 -30 -10 -10 0 5 10 10 -6 -18
France 12 29 0 17 11 15 10 22 -2 0
Italy 20 -20 10 -20 5 5 20 0 -6 0
Netherlands -29 -24 -27 -44 -28 -24 -29 -24 26 0
Note: See the notes to Chart 4.
Across the largest euro area countries, the low level of interest rates supported loan demand in most major countries, except in Italy where it was unchanged and in the Netherlands where it continued to have a negative impact. Fixed investment continued to support demand in France and Germany, but dragged it down in Italy, Spain and the Netherlands. Inventories and working capital had a negative impact in all countries except France where the contribution was positive. Banks in Germany, France and Italy registered positive impacts from M&A activity, while the Netherlands experienced the opposite effect. The use of alternative finance sources had a negative effect in Spain and to a lesser extent in Germany.
For the fourth quarter of 2019, banks expect loan demand from enterprises to remain broadly unchanged (net percentage of 1%).
2.2 Loans to households for house purchase
2.2.1 Credit standards for loans to households for house purchase eased slightly
Credit standards on loans to households for house purchase eased slightly in the third quarter of 2019 (-2%, after -1% in the previous quarter; see Chart 5 and overview table). This was in contrast to expectations of them remaining unchanged in the last quarter.
Across the largest euro area countries, banks eased their credit standards in Italy and the Netherlands, while they remained unchanged in France, Germany and Spain.

The euro area bank lending survey – Third quarter of 2019 14
Chart 5 Changes in credit standards applied to the approval of loans to households for house purchase, and contributing factors
(net percentages of banks reporting tightening credit standards and contributing factors)
Notes: See the notes to Chart 1. “Risk perceptions” is the unweighted average of “general economic situation and outlook”, “housing market prospects, including expected house price developments” and “borrower’s creditworthiness”; “competition” is the unweighted average of “competition from other banks” and “competition from non-banks”.
Competitive pressure and lower risk perceptions were the main drivers behind the easing, while banks’ risk tolerance continued to have a tightening impact on credit standards (see Chart 5 and Table 5).
Across the largest euro area countries, the easing in Italy was driven by competition, while in the Netherlands it was driven by competition and banks’ risk perceptions, but with a slight tightening pressure coming from banks’ risk tolerance. There were no changes reported for the components in Germany and Spain, while France reported a slight easing pressure coming from risk perceptions.
Looking ahead, euro area banks expect that credit standards for housing loans will remain unchanged in the fourth quarter of 2019.
Table 5 Factors contributing to the net tightening of credit standards for loans to households for house purchase
(net percentages of banks)
Cost of funds and balance sheet
constraints Pressure from competition Perception of risk Banks’ risk tolerance
Country Q2 2019 Q3 2019 Q2 2019 Q3 2019 Q2 2019 Q3 2019 Q2 2019 Q3 2019
Euro area 2 0 -6 -5 -2 -2 3 2
Germany 3 0 -3 0 0 0 0 0
Spain 0 0 0 0 0 0 11 0
France 0 0 -6 0 0 -3 -2 0
Italy 0 0 0 -5 3 0 0 0
Netherlands 0 0 -33 -32 -32 -32 -2 2
Note: See the notes to Chart 5.
-90
-75
-60
-45
-30
-15
0
15
30
-90
-75
-60
-45
-30
-15
0
15
30
Q4
2018
Q1
2019
Q2
2019
Q3
2019
Q4
2018
Q1
2019
Q2
2019
Q3
2019
Q4
2018
Q1
2019
Q2
2019
Q3
2019
Q4
2018
Q1
2019
Q2
2019
Q3
2019
Q4
2018
Q1
2019
Q2
2019
Q3
2019
DE ES FR IT NL
banks' risk tolerancerisk perceptionscompetitioncost of funds and balance sheet constraints
-20
-15
-10
-5
0
5
10Q
3 20
17Q
4 20
17Q
1 20
18Q
2 20
18Q
3 20
18Q
4 20
18Q
1 20
19Q
2 20
19Q
3 20
19Q
4 20
19
credit standards - actualcredit standards - expected

The euro area bank lending survey – Third quarter of 2019 15
2.2.2 Terms and conditions for loans to households for house purchase tightened
Banks’ overall terms and conditions for new loans to households for house purchase tightened in the third quarter of 2019 (see Chart 6 and Table 6). The tightening was mainly driven by margins on riskier loans, which increased to a net percentage not registered for six years. There is also now a small tightening of margins on average loans. Most other terms and conditions remained broadly unchanged.
Chart 6 Changes in terms and conditions for loans to households for house purchase
(net percentages of banks reporting tightening terms and conditions)
Notes: “Margins” are defined as the spread over a relevant market reference rate. “Other terms and conditions” is the unweighted average of “loan-to-value ratio”, “other loan size limits”, “non-interest rate charges” and “maturity”.
Of the largest euro area countries, banks in France and Germany reported a tightening of terms and conditions on housing loans driven by the increase in margins on riskier loans; however, German banks also reported a tightening contribution coming from margins on average loans and, to a lesser extent, from collateral requirements. Margins on both average and riskier loans increased also in the Netherlands, although overall terms and conditions did not change. By contrast, Italian and Spanish banks reported an easing of terms and conditions, driven by a reduction in the margins on average loans.
Table 6 Changes in terms and conditions for loans to households for house purchase
(net percentages of banks)
Overall terms and conditions Banks’ margins on average
loans Banks’ margins on riskier
loans
Country Q2 2019 Q3 2019 Q2 2019 Q3 2019 Q2 2019 Q3 2019
Euro area 1 3 -6 3 5 14
Germany 7 10 -3 17 7 28
Spain 0 -11 0 -11 11 0
France -7 7 -13 1 0 7
Italy 0 -10 0 -10 10 0
Netherlands 0 0 0 34 0 34
Note: See the notes to Chart 6.
-60
-30
0
30
60
90
-60
-30
0
30
60
90
Q4
2018
Q1
2019
Q2
2019
Q3
2019
Q4
2018
Q1
2019
Q2
2019
Q3
2019
Q4
2018
Q1
2019
Q2
2019
Q3
2019
Q4
2018
Q1
2019
Q2
2019
Q3
2019
Q4
2018
Q1
2019
Q2
2019
Q3
2019
DE ES FR IT NL
margins on average loans margins on riskier loanscollateral requirements other terms and conditions
-50
-40
-30
-20
-10
0
10
20
Q3
2017
Q4
2017
Q1
2018
Q2
2018
Q3
2018
Q4
2018
Q1
2019
Q2
2019
Q3
2019
overall terms and conditions

The euro area bank lending survey – Third quarter of 2019 16
Banks’ cost of funds and balance sheet constraints were the main contributor to the tightening of overall terms and conditions on housing loans at the euro area level, while competitive pressure remained the main easing driver (see Table 7). Risk perceptions also had some easing impact, while banks’ risk tolerance had a neutral impact on terms and conditions on housing loans at the euro area level.
While the easing impact of competitive pressures applied across most large euro area countries with the exception of Germany, the tightening impact of banks’ cost of funds and balance sheet situation was concentrated in France and Germany. While perception of risk continued to be an easing driver in the Netherlands, banks’ risk tolerance has shown a slight tightening contribution there.
Table 7 Factors contributing to the net tightening of overall terms and conditions for loans to households for house purchase
(net percentages of banks)
Cost of funds and balance sheet
constraints Pressure from competition Perception of risk Banks’ risk tolerance
Country Q2 2019 Q3 2019 Q2 2019 Q3 2019 Q2 2019 Q3 2019 Q2 2019 Q3 2019
Euro area 3 8 -15 -15 -2 -3 1 0
Germany 3 14 -3 0 0 0 0 0
Spain 0 0 -11 -33 0 0 0 0
France 7 14 -28 -12 0 0 0 0
Italy 0 0 0 -10 0 0 0 0
Netherlands 0 0 -35 -33 -32 -32 -2 2
Note: The net percentages for these questions relating to contributing factors are defined as the difference between the percentage of banks reporting that the given factor contributed to a tightening and the percentage reporting that it contributed to an easing.
2.2.3 Rejection rate for housing loans increased
According to euro area banks, the net share of rejected applications for loans to households for house purchase increased again in the third quarter of 2019 (3%, unchanged from the previous survey round; see Chart 7).
Across the largest euro area countries, the rejection rate for housing loans increased in Germany and Spain, and slightly increased in France, while it remained unchanged in the Netherlands and decreased in Italy.

The euro area bank lending survey – Third quarter of 2019 17
Chart 7 Change in the share of rejected applications for loans to households for house purchase
(net percentages of banks reporting an increase in the share of rejections)
Note: Share of loan rejections relative to the volume of all loan applications in that loan category.
2.2.4 Net demand for housing loans continued to increase
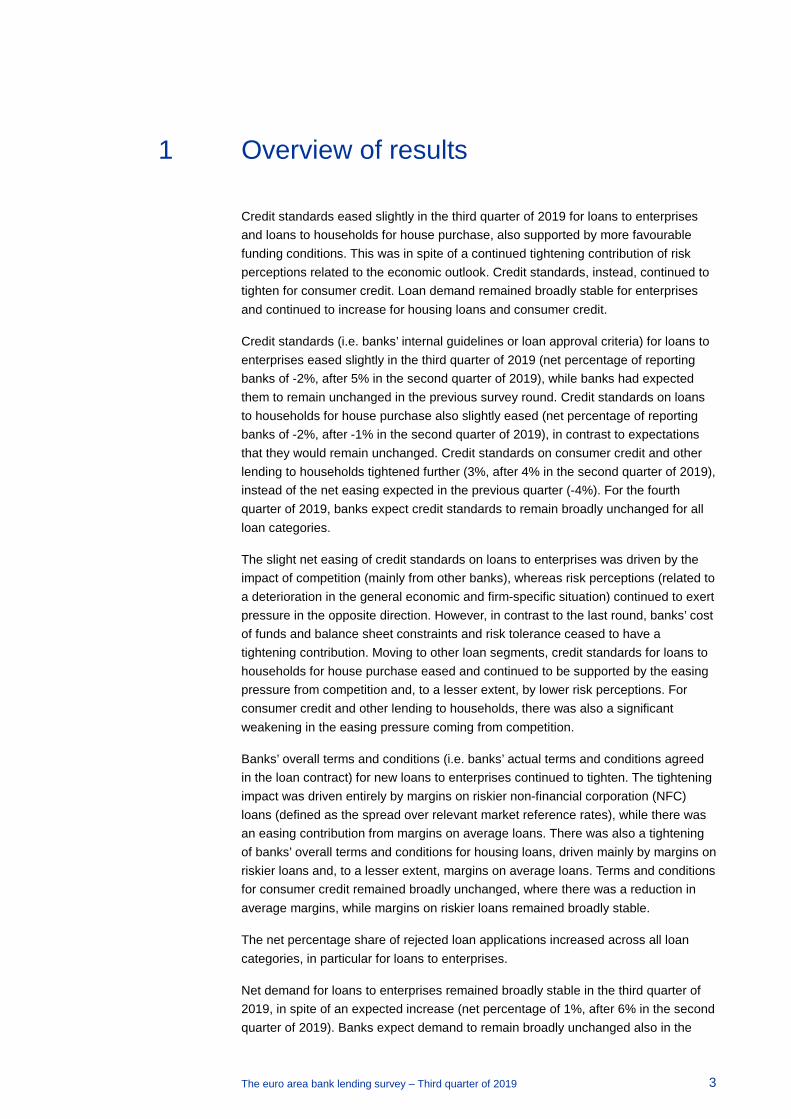
In the third quarter of 2019, banks reported a substantial net increase in demand for housing loans (15%, after 26% in the previous quarter; see Chart 8 and overview table), which was above the historical average for housing loan demand, and higher than expected by banks in the previous survey round (6%).
Net demand increased in all large euro area countries, except for Spain where it notably decreased.
Net demand for housing loans continued to be driven mainly by the low general level of interest rates and, to a lesser extent, favourable housing market prospects, while consumer confidence contributed less than in the previous quarter. By contrast, the use of alternative sources of finance had a slightly negative effect on demand (see Chart 8 and Table 8).
Looking at the large euro area countries, the low general level of interest rates had a positive impact on housing loan demand in all countries except for Spain. In addition, favourable housing market prospects supported housing loan demand in most large countries, with the exception of Spain where it was negative. Consumer confidence supported housing demand only in France and the Netherlands, and made a negative contribution in Spain. Favourable debt refinancing, restructuring or renegotiation supported demand in Germany and the Netherlands, while regulatory and fiscal regimes of housing markets had a positive impact on demand in the Netherlands, but a negative impact in France and Spain. Finally, the use of alternative finance dampened demand in Italy and Spain as a result of a greater role of loans from other banks and households’ internal financing capacity, but these factors instead made a positive contribution to net demand in France.
-20
-10
0
10
20
30
40
-20
-10
0
10
20
30
40
Q4
2018
Q1
2019
Q2
2019
Q3
2019
Q4
2018
Q1
2019
Q2
2019
Q3
2019
Q4
2018
Q1
2019
Q2
2019
Q3
2019
Q4
2018
Q1
2019
Q2
2019
Q3
2019
Q4
2018
Q1
2019
Q2
2019
Q3
2019
DE ES FR IT NL
euro area DE ES FR IT NL
-5
0
5
10
Q3
2019
Q2
2019
Q1
2019
Q4
2018
Q3
2018
Q2
2018
Q1
2018
Q4
2017
Q3
2017
The euro area bank lending survey – Third quarter of 2019 18
Chart 8 Changes in demand for loans to households for house purchase, and contributing factors
(net percentages of banks reporting an increase in demand and contributing factors)
Notes: See the notes to Chart 4. “Other financing needs” is the unweighted average of “debt refinancing/restructuring and renegotiation” and “regulatory and fiscal regime of housing markets”; “use of alternative finance” is the unweighted average of “internal finance of house purchase out of savings/down payment”, “loans from other banks” and “other sources of external finance”.
Table 8 Factors contributing to net demand for loans to households for house purchase
(net percentages of banks)
Housing market prospects
Consumer confidence
Other financing needs
General level of interest rates
Use of alternative finance
Country Q2 2019 Q3 2019 Q2 2019 Q3 2019 Q2 2019 Q3 2019 Q2 2019 Q3 2019 Q2 2019 Q3 2019
Euro area 11 11 5 3 5 1 29 29 0 -2
Germany 14 17 3 0 3 2 34 28 0 -1
Spain 0 -11 11 -22 6 -11 11 0 -7 -7
France 7 9 0 7 1 -4 37 65 4 2
Italy 10 20 0 0 0 0 20 10 0 -3
Netherlands 50 32 32 32 32 32 50 14 0 0
Note: See the notes to Chart 8.
For the fourth quarter of 2019, euro area banks expect a continued increase in net demand for housing loans (20%).
2.3 Consumer credit and other lending to households
2.3.1 Credit standards for consumer credit and other lending to households tightened
In the third quarter of 2019, credit standards for consumer credit and other lending to households continued to tighten (3%, after 4% in the previous quarter; see Chart 9 and overview table), in contrast to broad-based expectations of a net easing in the previous round. The net percentage was slightly below the historical average since 2003.
-20
0
20
40
60
80
Q3
2017
Q4
2017
Q1
2018
Q2
2018
Q3
2018
Q4
2018
Q1
2019
Q2
2019
Q3
2019
Q4
2019
demand - actualdemand - expected
-50
0
50
100
150
200
-50
0
50
100
150
200
Q4
2018
Q1
2019
Q2
2019
Q3
2019
Q4
2018
Q1
2019
Q2
2019
Q3
2019
Q4
2018
Q1
2019
Q2
2019
Q3
2019
Q4
2018
Q1
2019
Q2
2019
Q3
2019
Q4
2018
Q1
2019
Q2
2019
Q3
2019
DE ES FR IT NL
housing market prospects consumer confidence general level of interest rates
other financing needs use of alternative finance

The euro area bank lending survey – Third quarter of 2019 19
Across the largest euro area countries, the tightening of credit standards for consumer lending was concentrated among Spanish banks, while banks in the other countries reported a neutral impact, with the exception of Italian banks which reported a net easing.
According to euro area banks, risk tolerance had a minor tightening impact (see Chart 9 and Table 9). There was a significant weakening in the easing pressure coming from the impact of competition.
Looking at the largest euro area countries, the large tightening in Spain was mainly driven by a stricter attitude towards risk by banks and increased risk perceptions. While banks’ risk tolerance had an easing contribution in Italy, lower risk perceptions continued to have an easing contribution in the Netherlands. The easing contributions from competition to credit standards in France, Germany and Italy which were observed in the first two quarters disappeared in the third quarter of 2019.
Chart 9 Changes in credit standards applied to the approval of consumer credit and other lending to households, and contributing factors
(net percentages of banks reporting tightening credit standards and contributing factors)
Notes: See the notes to Chart 1. “Risk perceptions” is the unweighted average of “general economic situation and outlook”, “creditworthiness of consumers” and “risk on the collateral demanded”; “competition” is the unweighted average of “competition from other banks” and “competition from non-banks”.
Looking ahead to the fourth quarter of 2019, euro area banks expect credit standards on consumer credit and other lending to households to remain broadly unchanged (1%).
-10
-5
0
5
Q3
2017
Q4
2017
Q1
2018
Q2
2018
Q3
2018
Q4
2018
Q1
2019
Q2
2019
Q3
2019
Q4
2019
credit standards - actualcredit standards - expected
-30
-20
-10
0
10
20
30
40
-30
-20
-10
0
10
20
30
40
Q4
2018
Q1
2019
Q2
2019
Q3
2019
Q4
2018
Q1
2019
Q2
2019
Q3
2019
Q4
2018
Q1
2019
Q2
2019
Q3
2019
Q4
2018
Q1
2019
Q2
2019
Q3
2019
Q4
2018
Q1
2019
Q2
2019
Q3
2019
DE ES FR IT NL
cost of funds and balance sheet constraints competition risk perceptions banks' risk tolerance

The euro area bank lending survey – Third quarter of 2019 20
Table 9 Factors contributing to the net tightening of credit standards for consumer credit and other lending to households
(net percentages of banks)
Cost of funds and balance sheet
constraints Pressure from competition Perception of risk Banks’ risk tolerance
Country Q2 2019 Q3 2019 Q2 2019 Q3 2019 Q2 2019 Q3 2019 Q2 2019 Q3 2019
Euro area 0 0 -3 0 -1 0 4 1
Germany 0 0 -3 0 -1 0 0 0
Spain 0 0 0 0 3 10 30 10
France 0 0 -6 0 0 0 0 0
Italy 0 0 0 0 0 0 0 -10
Netherlands 0 0 0 0 -14 -14 0 0
Note: See the notes to Chart 9.
2.3.2 Terms and conditions for consumer credit and other lending to households remained broadly unchanged
In the third quarter of 2019, banks’ overall terms and conditions applied when granting new consumer credit and other lending to households remained broadly unchanged. There was a reduction in the easing contribution of margins on average loans, while margins on riskier loans now had a neutral contribution after a tightening contribution in the previous quarter. There was also a slight increase in the tightening contribution of collateral (see Chart 10 and Table 10).
Across the large euro area countries, overall terms and conditions on consumer credit and other lending to households tightened only in Germany, while they remained unchanged in the other countries. Margins on average loans compressed across Germany and the Netherlands, but tightened in France. Margins on riskier loans widened in the Netherlands, but compressed in Germany.

The euro area bank lending survey – Third quarter of 2019 21
Chart 10 Changes in terms and conditions for consumer credit and other lending to households
(net percentages of banks reporting tightening terms and conditions)
Notes: “Margins” are defined as the spread over a relevant market reference rate. “Other terms and conditions” is the unweighted average of “size of the loan”, “non-interest rate charges” and “maturity”.
Table 10 Changes in terms and conditions for consumer credit and other lending to households
(net percentages of banks)
Overall terms and conditions Banks’ margins on average
loans Banks’ margins on riskier
loans
Country Q2 2019 Q3 2019 Q2 2019 Q3 2019 Q2 2019 Q3 2019
Euro area -2 1 -6 -2 3 0
Germany -3 3 -3 -10 0 -10
Spain -10 0 -10 0 0 0
France 0 0 -7 7 7 0
Italy 0 0 0 0 0 0
Netherlands 0 0 -43 -27 0 15
Note: See the notes to Chart 10.
The main factors underlying the tightening of terms and conditions were banks’ cost of funds and balance sheet constraints and, to a lesser extent, banks’ risk tolerance. Competitive pressures continued to contribute to an easing, while risk perceptions now have a neutral effect after previously making an easing contribution (see Table 11).
Across the largest euro area countries, banks’ cost of funds and balance sheet constraints had a tightening impact on terms and conditions in France and Germany, where banks tended to lay down more favourable terms in loan contracts in response to competition. Banks in Spain were the only ones to report a tightening due to risk perceptions. Italian banks reported neutral contributions for all factors. The easing contribution of perceived risk continued in the Netherlands, but there is now a tightening contribution coming from banks’ risk tolerance.
-75
-60
-45
-30
-15
0
15
30
-75
-60
-45
-30
-15
0
15
30
Q4
2018
Q1
2019
Q2
2019
Q3
2019
Q4
2018
Q1
2019
Q2
2019
Q3
2019
Q4
2018
Q1
2019
Q2
2019
Q3
2019
Q4
2018
Q1
2019
Q2
2019
Q3
2019
Q4
2018
Q1
2019
Q2
2019
Q3
2019
DE ES FR IT NL
margins on average loans margins on riskier loanscollateral requirements other terms and conditions
-15
-10
-5
0
5
Q3
2017
Q4
2017
Q1
2018
Q2
2018
Q3
2018
Q4
2018
Q1
2019
Q2
2019
Q3
2019
overall terms and conditions

The euro area bank lending survey – Third quarter of 2019 22
Table 11 Factors contributing to the net tightening of overall terms and conditions for consumer credit and other lending to households
(net percentages of banks)
Cost of funds and balance sheet
constraints Pressure from competition Perception of risk Banks’ risk tolerance
Country Q2 2019 Q3 2019 Q2 2019 Q3 2019 Q2 2019 Q3 2019 Q2 2019 Q3 2019
Euro area 3 3 -5 -4 -3 0 1 2
Germany 3 3 -6 -6 0 0 0 0
Spain 0 0 -10 0 0 10 0 0
France 7 7 -7 -7 0 0 0 0
Italy 0 0 0 0 0 0 0 0
Netherlands 0 0 0 0 -43 -43 0 15
Note: The net percentages for these questions relating to contributing factors are defined as the difference between the percentage of banks reporting that the given factor contributed to a tightening and the percentage reporting that it contributed to an easing.
2.3.3 Rejection rate for consumer credit and other lending to households increased
The net share of rejected applications for consumer credit and other lending to households increased in the third quarter of 2019 according to reporting banks, after remaining broadly unchanged in the previous quarter (6%, after 1% in the previous survey round; see Chart 11).
Across the largest euro area countries, the rejection rate increased for banks in Spain and the Netherlands, and to a lesser extent in Germany, while it remained unchanged for banks in France and Italy.
Chart 11 Change in the share of rejected applications for consumer credit and other lending to households
(net percentages of banks reporting an increase in the share of rejections)
Note: Share of loan rejections relative to the volume of all loan applications in that loan category.
-40
-30
-20
-10
0
10
20
30
40
-40
-30
-20
-10
0
10
20
30
40
Q4
2018
Q1
2019
Q2
2019
Q3
2019
Q4
2018
Q1
2019
Q2
2019
Q3
2019
Q4
2018
Q1
2019
Q2
2019
Q3
2019
Q4
2018
Q1
2019
Q2
2019
Q3
2019
Q4
2018
Q1
2019
Q2
2019
Q3
2019
DE ES FR IT NL
euro area DE ES FR IT NL
-15
-10
-5
0
5
10
15
Q3
2019
Q2
2019
Q1
2019
Q4
2018
Q3
2018
Q2
2018
Q1
2018
Q4
2017
Q3
2017

The euro area bank lending survey – Third quarter of 2019 23
2.3.4 Net demand for consumer credit and other lending to households increased
According to euro area banks, net demand for consumer credit and other lending to households increased in the third quarter of 2019 (net percentage of 8%, after 4% in the previous quarter; see Chart 12 and overview table). The increase in demand was lower than expected in the previous survey round, even though it stood above its historical average.
Across the large euro area countries, net demand for consumer credit and other lending to households increased in Germany and France, while it declined in Spain and Italy.
Among the factors driving the demand at the euro area level, the low general level of interest rates and consumer confidence contributed positively to demand, while spending on durable goods now only contributes slightly after an extended period of making a strong positive contribution (see Chart 12 and Table 12).
Looking at the largest euro area countries, banks in Germany, France and the Netherlands reported a positive contribution of the general level of interest rates to demand for consumer credit, where there was a significant increase in the contribution for France. Spending on durable goods made a negative contribution in France, Italy and Spain. Consumer confidence was considered a particularly relevant factor supporting demand in the Netherlands and France, and to a much lesser degree in Germany. Consumers’ assessment of economic and financial trends saw a significant negative contribution in Spain, and was neutral in Italy.
Chart 12 Changes in demand for consumer credit and other lending to households, and contributing factors
(net percentages of banks reporting an increase in demand and contributing factors)
Notes: See the notes to Chart 4. “Use of alternative finance” is the unweighted average of “internal financing out of savings”, “loans from other banks” and “other sources of external finance”. “Consumption exp. (real estate)” denotes “consumption expenditure financed through real estate-guaranteed loans”.
-10
0
10
20
30
40
50
60
Q3
2017
Q4
2017
Q1
2018
Q2
2018
Q3
2018
Q4
2018
Q1
2019
Q2
2019
Q3
2019
Q4
2019
demand - actual
demand - expected
-25
0
25
50
75
100
125
150
175
200
-25
0
25
50
75
100
125
150
175
200
Q4
2018
Q1
2019
Q2
2019
Q3
2019
Q4
2018
Q1
2019
Q2
2019
Q3
2019
Q4
2018
Q1
2019
Q2
2019
Q3
2019
Q4
2018
Q1
2019
Q2
2019
Q3
2019
Q4
2018
Q1
2019
Q2
2019
Q3
2019
DE ES FR IT NL
spending on durable goods consumer confidence general level of interest rates
consumption exp. (real estate) use of alternative finance

The euro area bank lending survey – Third quarter of 2019 24
Table 12 Factors contributing to net demand for consumer credit and other lending to households
(net percentages of banks)
Spending on
durable goods Consumer confidence
Consumption exp. (real estate)
General level of interest rates
Use of alternative finance
Country Q2 2019 Q3 2019 Q2 2019 Q3 2019 Q2 2019 Q3 2019 Q2 2019 Q3 2019 Q2 2019 Q3 2019
Euro area 5 2 6 12 0 0 8 18 -1 0
Germany 0 6 3 3 0 0 3 10 0 -1
Spain -10 -10 0 -10 0 0 0 0 -3 -3
France 14 -6 8 29 0 0 9 41 0 2
Italy -10 -10 -10 0 0 0 0 0 -3 0
Netherlands 43 43 43 43 0 0 43 43 0 0
Note: See the notes to Chart 12.
For the fourth quarter of 2019, euro area banks expect net demand for consumer credit and other lending to households to increase (14%).

The euro area bank lending survey – Third quarter of 2019 25
3 Ad hoc questions
3.1 Banks’ access to retail and wholesale funding
As in previous survey rounds, the October 2019 survey questionnaire included a question assessing the extent to which the situation in financial markets was affecting banks’ access to retail and wholesale funding. Banks were asked whether their access to funding had deteriorated or eased over the past three months. Negative net percentages indicate an improvement, while positive figures indicate a deterioration in net terms.
For the third quarter of 2019, euro area banks reported in net terms that their access to wholesale funding continued to improve for debt securities issuance, especially in the medium-to-long-term part of the curve, in line with bank bond market developments and following the announcement of the third series of targeted longer-term refinancing operations (TLTRO III). It was also indicated that access to the interbank unsecured money market improved, while access to securitisation improved only marginally with the improvement being limited to the corporate loan segment (see Chart 13 and Table 13).7 In contrast to the two previous quarters, banks reported a broadly neutral access to retail funding.
Chart 13 Banks’ assessment of funding conditions and the ability to transfer credit risk off the balance sheet
(net percentages of banks reporting a deterioration in market access)
Note: The net percentages are defined as the difference between the sum of the percentages for “deteriorated considerably” and “deteriorated somewhat” and the sum of the percentages for “eased somewhat” and “eased considerably”.
7 For the results on securitisation, a large number of banks replied “not applicable” as this source
of funding is not relevant for them (between 42% and 49% depending on the type of securitisation in the third quarter of 2019).
-20
-10
0
10
20
Q4 2019(exp.)
Q3 2019Q2 2019Q1 2019Q4 2018Q3 2018Q2 2018Q1 2018Q4 2017Q3 2017
retail fundingmoney markets
debt securitiessecuritisation

The euro area bank lending survey – Third quarter of 2019 26
Looking ahead to the fourth quarter of 2019, euro area banks expect a continued improvement in their access to debt securities markets and securitisation, while retail funding and access to money markets should remain unchanged.
Table 13 Banks’ assessment of funding conditions and the ability to transfer credit risk off the balance sheet
(net percentages of banks reporting a deterioration in market access)
Retail funding Interbank unsecured money
market Wholesale debt
securities Securitisation
Q2 2019 -6 -3 -15 -2
Q3 2019 1 -3 -14 -2
Note: See the notes to Chart 13.
3.2 The impact of the ECB’s asset purchase programme
The October 2019 survey questionnaire included two bi-annual ad hoc questions gauging the impact of the ECB’s asset purchase programme (APP). When answering the questions on the APP impact over the past and next six months, banks were asked to take into account the impact of the reinvestment of the principal payments from maturing securities purchased under the APP. Banks were also asked to consider both direct and indirect effects of the APP, as there may be indirect effects on banks’ financial situation and asset allocation.
In this survey round, banks reported the impact of the APP on their financial situation. In addition, banks provided an assessment of the impact of the APP on their lending conditions and loan volumes.
3.2.1 Impact of the ECB’s asset purchase programme on banks’ financial situation
Euro area banks reported that the APP has contributed over the past six months to an improvement of their liquidity position and their market financing conditions, but to a deterioration of their profitability (see Chart 14). Over the next six months, euro area banks expect a continued positive impact on their liquidity position and their market financing conditions from the APP.

The euro area bank lending survey – Third quarter of 2019 27
Chart 14 Overview of the impact of the APP on euro area banks’ financial situation
(net percentages of banks)
Notes: The net percentages are defined as the difference between the sum of the percentages for “increased/improved considerably” and “increased/improved somewhat” and the sum of the percentages for “decreased/deteriorated somewhat” and “decreased/deteriorated considerably”. The periods in the legend refer to the respective BLS survey rounds. “Expected” denotes expectations indicated by banks in the current round.
In detail, euro area BLS banks reported that the APP had a slightly positive impact on their total assets over the past six months (net percentage of banks of 2%, after 1% in the April 2019 survey). At the same time, the APP contributed to a further decrease in their holdings of sovereign bonds (net percentage of -5%, after -14%; see Chart 14).
Euro area banks expect a small positive impact on their total assets and a slight decline in their holdings of euro area sovereign bonds over the next six months as a consequence of the APP.
Banks indicated a positive impact of the APP on their liquidity situation in net terms over the past six months (net percentage of banks of 7%, after 7% in the April 2019 survey). Banks expect the size of this positive impact to slightly diminish over the next six months (net percentage of 5%; see Chart 14).
Euro area banks also reported an improvement in their market financing conditions owing to the APP (net percentage of banks of 11%, after 14% in the April 2019 survey; see Chart 14). Banks expect a continued positive impact of the APP on their market financing conditions over the next six months (net percentage of banks of 18%).
A slightly lower net percentage of the euro area BLS banks reported an overall negative impact of the APP on their profitability over the past six months (-26%, after -28% in the April 2019 survey round; see Chart 15). The negative impact on euro area banks’ profitability was due to a negative impact on banks’ net interest margins (net percentage of banks of -35%, after -37%), whereas the impact from capital gains/losses owing to the APP remained broadly neutral (1%, after 1%). Over the next six months, a larger net percentage of the participating euro area banks expect a dampening impact of the APP on their profitability (-26%).
-5
0
5
10
15
20
total assets liquidity position market financing conditions capital ratio
Apr-19 Oct-19 expected

The euro area bank lending survey – Third quarter of 2019 28
Chart 15 Impact of the APP on euro area banks’ profitability
(net percentages of banks)
Note: See the notes to Chart 14.
With regard to banks’ capital position, euro area banks indicated that the impact of the APP on their capital ratio remained broadly unchanged (0%, after 3%) over the past six months (see Chart 14).
3.2.2 Impact of the ECB’s asset purchase programme on banks’ lending conditions and lending volumes
Euro area banks indicated a broadly neutral impact of the APP on their credit standards across all loan categories over the past six months (for loans to enterprises: 1%, after -1% in the April 2019 survey round, for loans to households for house purchase: -1%, after -1%; for consumer credit: 1%, after 0%; see Chart 16, left-hand side). Over the next six months, banks expect a neutral impact of the APP on credit standards for loans to enterprises and housing loans and a small net easing impact for consumer credit.
-40
-30
-20
-10
0
10
total net interestmargin
capital gains/losses
Apr-19 Oct-19 expected

The euro area bank lending survey – Third quarter of 2019 29
Chart 16 Impact of the APP on bank lending conditions
(net percentages of banks)
Notes: The net percentages are defined as the difference between the sum of the percentages for “tightened considerably” and “tightened somewhat” and the sum of the percentages for “eased somewhat” and “eased considerably”. The periods in the legend refer to the respective BLS survey rounds. “Expected” denotes expectations indicated by banks in the current round.
The APP continued to have a net easing impact only on the terms and conditions of new loans to households for house purchase according to reporting banks (loans to enterprises: 0%, after -3% in the April 2019 survey; housing loans: -2%, after -2%; consumer credit and other lending to households: 0%, after -3%; see Chart 16, right-hand side). The APP impact on terms and conditions is expected by euro area banks to become more favourable over the next six months for all loan categories.
Chart 17 Impact of the APP on bank lending volumes
(net percentages of banks)
Notes: The net percentages are defined as the difference between the sum of the percentages for “increased considerably” and “increased somewhat” and the sum of the percentages for “decreased somewhat” and “decreased considerably”. The periods in the legend refer to the respective BLS survey rounds. “Expected” denotes expectations indicated by banks in the current round.
-6
-4
-2
0
2
enterprises households for housepurchase
consumer credit andother lending
enterprises households for housepurchase
consumer credit andother lending
credit standards terms and conditions
Apr-19 Oct-19 expected
-2
0
2
4
6
enterprises households for house purchase consumer credit and other lending
Apr-19 Oct-19 expected

The euro area bank lending survey – Third quarter of 2019 30
Euro area banks were also asked to indicate the APP impact on their lending volumes.8 They reported a positive impact only on their lending volumes for housing loans over the past six months (4%, remaining unchanged from the April 2019 survey; see Chart 17). In addition, banks reported a broadly neutral impact of the APP on their lending volumes for loans to enterprises and consumer credit and other lending to households (loans to enterprises: 1%, after 3% in April 2019 survey; consumer credit: 1%, after 1%). For the next six months, banks expect a stronger positive APP impact on their lending volumes for loans for house purchase and consumer credit, but expect a broadly neutral impact for loans to enterprises.
3.3 The impact of the ECB’s negative deposit facility rate
The October 2019 survey questionnaire included a bi-annual ad hoc question aimed at gauging the impact of the ECB’s negative deposit facility rate (DFR) on banks’ net interest income, lending conditions and lending volumes. Banks were asked to consider both direct and indirect effects of the negative DFR over the past and next six months, as there may be indirect effects on banks’ financial situation and lending conditions even if the respective bank has no excess liquidity.
With respect to the effect of the ECB’s negative DFR on banks’ net interest income,9 euro area BLS banks continued to report a negative impact over the past six months (net percentage of banks of -74%, after -73% in the April 2019 BLS round; see Chart 18). A smaller impact is expected over the coming six months (net percentage of -54%).
8 Since April 2018, this has replaced the question on the use of the additional liquidity related to the APP
for granting loans. 9 The net interest income is defined as the difference between the interest earned and interest
paid on the outstanding amount of interest-bearing assets and liabilities by the bank.

The euro area bank lending survey – Third quarter of 2019 31
Chart 18 Impact of the negative DFR on banks’ net interest income and bank lending
(net percentages of banks)
Notes: The net percentages are defined as the difference between the sum of the percentages for “increased considerably” and “increased somewhat” and the sum of the percentages for “decreased somewhat” and “decreased considerably”. The periods in the legend refer to the respective BLS survey rounds. “Expected” denotes expectations indicated by banks in the current round.
Regarding the DFR impact on loans to enterprises, euro area banks continued to report in net terms a decrease of their lending rates over the past six months (net percentage of banks of -42%, after -31% in the April 2019 survey round) and a negative DFR impact on their loan margins10 (-24%, after -32%; see Chart 18). At the same time, banks indicated a positive impact of the negative DFR on their non-interest rate charges for loans to enterprises over the past six months (4%, after 0%). In terms of lending volumes to enterprises, banks reported a positive impact of the DFR for the past six months (net percentage of banks of 11%, after 10% in the April 2019 survey round; see Chart 18).
For the next six months, a smaller net percentage of banks expects a decline of their lending rates (-39%) owing to the DFR, while they expect the negative impact on loan margins to remain unchanged (-24%). In addition, euro area banks expect a positive impact of the DFR on non-interest rate charges (3%) and an ongoing positive effect on lending volumes to enterprises (8%) in net terms.
Regarding the DFR impact on loans to households for house purchase, the impact reported by euro area banks was overall broadly in line with the impact reported for loans to enterprises. Euro area banks also indicated a downward impact on their lending rates (net percentage of banks of -37%, after -32% in the April 2019 survey) and their loan margins (-18%, after -33%; see Chart 18) over the past six months. Euro area banks also indicated that the negative DFR had a positive impact on their non-interest rate charges (2%, after 1% in the April 2019 survey round) and their lending volumes (13%, after 16%) for housing loans over the past six months.
For the next six months, a smaller net percentage of banks expects a negative impact of the DFR on housing lending rates (-34%) and a positive impact on lending 10 The loan margin is defined as the spread of the bank’s lending rates on new loans over a
relevant market reference rate.
-100
-75
-50
-25
0
25
net i
nter
est i
ncom
e
lend
ing
rate
s
loan
mar
gin
non-
int.
rate
cha
rges
lend
ing
volu
mes
lend
ing
rate
s
loan
mar
gin
non-
int.
rate
cha
rges
lend
ing
volu
mes
lend
ing
rate
s
loan
mar
gin
non-
int.
rate
cha
rges
lend
ing
volu
mes
enterprises households for house purchase consumer credit and other lending
Apr-19 Oct-19 expected

The euro area bank lending survey – Third quarter of 2019 32
volumes (10%), while a larger percentage of banks expects a negative impact on loan margins (-21%).
With regard to consumer credit and other lending to households, 23% of the euro area banks indicated in net terms a negative DFR impact on their lending rates over the past six months (after -26%) and 9% indicated a negative impact on their loan margins (after -25%; see Chart 18). Euro area banks reported a slight positive impact of the DFR on non-interest rate charges for consumer credit over the past six months (2%, after -1%). In terms of lending volumes for consumer credit, euro area banks reported a positive effect of the DFR (net percentage of banks of 6%, after 3%; see Chart 18).
For the next six months, banks expect a negative DFR impact on lending rates (-23%) and loan margins (-8%), a neutral impact on non-interest rate charges (1%) and a positive impact on lending volumes (3%) for consumer credit.
Question 1
Jul 19 Oct 19 Jul 19 Oct 19 Jul 19 Oct 19 Jul 19 Oct 19 Jul 19 Oct 19
Tightened considerably 0 0 0 0 0 0 0 0 0 0
Tightened somewhat 7 2 9 2 4 3 3 2 6 3
Remained basically unchanged 91 93 85 92 92 93 92 93 91 94
Eased somewhat 2 4 4 4 3 4 4 4 3 3
Eased considerably 0 0 0 0 0 0 0 0 0 0
NA7 0 0 2 2 0 1 1 1 0 0
Total 100 100 100 100 100 100 100 100 100 100
Net percentage 5 -2 5 -2 1 -1 0 -2 3 1
Diffusion index 2 -1 2 -1 0 -1 0 -1 2 0
Mean 2.95 3.02 2.95 3.02 2.99 3.01 3.00 3.02 2.97 2.99
Number of banks responding 135 135 132 132 129 129 135 135 135 135
* Figures might not add up to 100 due to rounding
Annex 1
Results for the standard questions*
Loans or credit lines to enterprises
Over the past three months, how have your bank’s credit standards1 as applied to the approval of loans or credit
lines to enterprises2, 3, 4
changed? Please note that we are asking about the change in credit standards, rather
than about their level.
1) See Glossary for Credit standards.
2) See Glossary for Loans.
3) See Glossary for Credit line.
4) See Glossary for Enterprises.
5) See Glossary for Enterprise size.
6) See Glossary for Maturity.
7) “NA” (not applicable) does not include banks which do not have any business in or exposure to the respective lending category.
Notes: The net percentage is defined as the difference between the sum of the percentages for “tightened considerably” and “tightened somewhat”, and the sum of the
percentages for “eased somewhat” and “eased considerably”. The diffusion index is defined as the net percentage weighted according to the intensity of the response, giving
lenders who have answered “considerably” a weight twice as high (score of 1) as lenders having answered “somewhat” (score of 0.5). The mean of the banks’ responses is
calculated using weights from 1 to 5 for the five possible response options. The number of banks responding refers to all participating banks which have business in or exposure to
the respective lending category.
(in percentages, unless otherwise stated)
Long-term loans6
Overall
Loans to small
and medium-sized
enterprises5
Loans to large
enterprises5
Short-term loans6
The euro area bank lending survey - Third quarter of 2019 A1

Question 2
Jul 19 Oct 19 Jul 19 Oct 19 Jul 19 Oct 19
Overall
A) Cost of funds and balance sheet constraints1
Costs related to your bank's capital position2 0 5 91 1 0 3 6 4 3 2 2.94 2.96
Your bank's ability to access market financing3 0 0 94 0 0 6 0 0 0 0 3.00 3.00
Your bank's liquidity position 0 0 94 3 0 3 0 -3 0 -2 3.00 3.03
B) Pressure from competition
Competition from other banks 0 1 82 14 0 3 -10 -13 -5 -7 3.10 3.14
Competition from non-banks4 0 0 92 2 0 6 -2 -2 -1 -1 3.02 3.02
Competition from market financing 0 0 94 0 0 6 -1 0 -1 0 3.01 3.00
C) Perception of risk5
General economic situation and outlook 0 7 93 0 0 0 7 7 3 4 2.93 2.93
Industry or firm-specific situation and
outlook/borrower's creditworthiness6 0 8 92 0 0 0 7 8 4 4 2.93 2.92
Risk related to the collateral demanded 0 0 100 0 0 0 0 0 0 0 3.00 3.00
D) Your bank's risk tolerance5
Your bank's risk tolerance 0 1 98 1 0 0 2 -1 1 0 2.98 3.01
Small and medium-sized enterprises
A) Cost of funds and balance sheet constraints1
Costs related to your bank's capital position2 0 2 93 1 0 4 3 1 2 1 2.97 2.99
Your bank's ability to access market financing3 0 0 93 1 0 7 0 -1 0 0 3.00 3.01
Your bank's liquidity position 0 0 92 4 0 4 0 -4 0 -2 3.00 3.04
B) Pressure from competition
Competition from other banks 0 0 83 11 0 5 -10 -12 -5 -6 3.10 3.13
Competition from non-banks4 0 0 93 0 0 7 0 0 0 0 3.00 3.00
Competition from market financing 0 0 93 0 0 7 0 0 0 0 3.00 3.00
C) Perception of risk5
General economic situation and outlook 0 6 93 0 0 2 5 5 3 3 2.94 2.94
Industry or firm-specific situation and
outlook/borrower's creditworthiness6 0 8 90 0 0 2 8 8 4 4 2.92 2.92
Risk related to the collateral demanded 0 0 98 0 0 2 0 0 0 0 3.00 3.00
D) Your bank's risk tolerance5
Your bank's risk tolerance 0 1 95 2 0 2 1 -1 1 -1 2.99 3.01
Over the past three months, how have the following factors affected your bank’s credit standards as applied to
the approval of loans or credit lines to enterprises?
(in percentages, unless otherwise stated)
Mean
+ NA7
-
NetP DI
°-- ++
The euro area bank lending survey - Third quarter of 2019 A2

Jul 19 Oct 19 Jul 19 Oct 19 Jul 19 Oct 19
Large enterprises
A) Cost of funds and balance sheet constraints1
Costs related to your bank's capital position2 0 6 90 1 0 4 4 5 2 3 2.96 2.95
Your bank's ability to access market financing3 0 0 93 0 0 6 0 0 0 0 3.00 3.00
Your bank's liquidity position 0 0 94 2 0 4 0 -2 0 -1 3.00 3.02
B) Pressure from competition
Competition from other banks 0 1 85 10 0 4 -7 -9 -4 -5 3.07 3.09
Competition from non-banks4 0 0 92 2 0 6 -2 -2 -1 -1 3.02 3.02
Competition from market financing 0 0 93 0 0 6 -1 0 -1 0 3.01 3.00
C) Perception of risk5
General economic situation and outlook 0 6 93 0 0 1 4 6 2 3 2.96 2.94
Industry or firm-specific situation and
outlook/borrower's creditworthiness6 0 8 91 0 0 1 8 8 4 4 2.92 2.92
Risk related to the collateral demanded 0 0 99 0 0 1 0 0 0 0 3.00 3.00
D) Your bank's risk tolerance5
Your bank's risk tolerance 0 1 99 0 0 1 2 1 1 0 2.98 2.99
1) See Glossary for Cost of funds and balance sheet constraints.
2) Can involve the use of credit derivatives, with the loans remaining on the bank’s balance sheet.
3) Involves the sale of loans from the bank’s balance sheet, i.e. off-balance sheet funding.
4) See Glossary for Non-banks.
5) See Glossary for Perception of risk and risk tolerance.
6) Risks related to non-performing loans may be reflected not only in the "industry or firm-specific situation and outlook/borrower's creditworthiness", but also in the bank's "cost of
funds and balance sheet constraints".
7) “NA” (not applicable) does not include banks which do not have any business in or exposure to the respective lending category.
Notes: The net percentage (NetP) is defined as the difference between the sum of banks responding “--” (contributed considerably to tightening) and “-” (contributed somewhat to
tightening), and the sum of banks responding “+” (contributed somewhat to easing) and “++” (contributed considerably to easing). “°” means “contributed to basically unchanged
credit standards”. The diffusion index (DI) is defined as the net percentage weighted according to the intensity of the response, giving lenders who have answered “considerably” a
weight twice as high (score of 1) as lenders having answered “somewhat” (score of 0.5). The mean of the banks’ responses is calculated using weights from 1 to 5 for the five
possible response options.
DI Mean
NA7
NetP
+°--- ++
The euro area bank lending survey - Third quarter of 2019 A3

Question 3
(in percentages, unless otherwise stated)
Jul 19 Oct 19 Jul 19 Oct 19 Jul 19 Oct 19
Overall
A) Overall terms and conditions1
Overall terms and conditions 0 5 92 2 0 0 4 3 2 2 2.96 2.97
B) Margins
Your bank's margin on average loans2 0 9 80 11 0 0 3 -2 1 -1 2.97 3.02
Your bank's margin on riskier loans 0 11 85 3 0 1 7 8 3 4 2.93 2.92
C) Other conditions and terms
Non-interest rate charges3 0 2 94 1 0 2 1 1 0 0 2.99 2.99
Size of the loan or credit line 0 0 97 3 0 0 -3 -3 -2 -1 3.03 3.03
Collateral4 requirements 0 0 99 1 0 0 3 -1 1 0 2.97 3.01
Loan covenants5 0 1 94 5 0 0 -1 -4 -1 -2 3.01 3.04
Maturity 0 1 98 1 0 0 1 0 0 0 2.99 3.00
Small and medium-sized enterprises
A) Overall terms and conditions1
Overall terms and conditions 0 5 92 1 0 2 5 3 2 2 2.95 2.97
B) Margins
Your bank's margin on average loans2 0 8 80 10 0 2 3 -2 1 -1 2.97 3.02
Your bank's margin on riskier loans 0 11 85 2 0 2 5 9 2 4 2.95 2.91
C) Other conditions and terms
Non-interest rate charges3 0 2 93 2 0 4 1 0 0 0 2.99 3.00
Size of the loan or credit line 0 0 98 1 0 2 -1 -1 0 0 3.01 3.01
Collateral4 requirements 0 0 97 1 0 2 3 0 1 0 2.97 3.00
Loan covenants5 0 2 93 4 0 2 -1 -2 0 -1 3.01 3.02
Maturity 0 0 97 1 0 2 6 -1 3 -1 2.94 3.01
Large enterprises
A) Overall terms and conditions1
Overall terms and conditions 0 5 89 5 0 1 0 0 0 0 3.00 3.00
B) Margins
Your bank's margin on average loans2 0 8 75 16 0 1 -1 -7 -1 -4 3.01 3.08
Your bank's margin on riskier loans 0 11 82 7 0 1 6 4 3 2 2.94 2.96
C) Other conditions and terms
Non-interest rate charges3 0 0 92 5 0 3 -1 -4 -1 -2 3.01 3.05
Size of the loan or credit line 0 0 93 6 0 1 -2 -6 -1 -3 3.02 3.06
Collateral4 requirements 0 1 92 6 0 1 -4 -5 -2 -3 3.04 3.05
Loan covenants5 0 2 89 8 0 1 -3 -6 -1 -3 3.03 3.06
Maturity 0 1 92 6 0 1 -2 -5 -1 -3 3.02 3.05
Over the past three months, how have your bank’s terms and conditions1 for new loans or credit lines to
enterprises changed?
NA6
NetP DI Mean
++
1) See Glossary for Credit terms and conditions.
2) See Glossary for Loan margin/spread over a relevant market reference rate.
3) See Glossary for Non-interest rate charges.
4) See Glossary for Collateral.
5) See Glossary for Covenant.
6) “NA” (not applicable) does not include banks which do not have any business in or exposure to the respective lending category.
Notes: The net percentage (NetP) is defined as the difference between the sum of banks responding “--” (contributed considerably to tightening) and “-” (contributed somewhat to
tightening), and the sum of banks responding “+” (contributed somewhat to easing) and “++” (contributed considerably to easing). “°” means “contributed to keeping credit terms
and conditions basically unchanged”. The diffusion index (DI) is defined as the net percentage weighted according to the intensity of the response, giving lenders who have
answered “considerably” a weight twice as high (score of 1) as lenders having answered “somewhat” (score of 0.5). The mean of the banks’ responses is calculated using weights
from 1 to 5 for the five possible response options.
° +-- -
The euro area bank lending survey - Third quarter of 2019 A4

Question 4
Jul 19 Oct 19 Jul 19 Oct 19 Jul 19 Oct 19
A) Cost of funds and balance sheet constraints
Cost of funds and balance sheet constraints 0 8 89 0 0 2 3 8 1 4 3 2.92
B) Pressure from competition
Pressure from competition 0 0 87 12 0 1 -13 -11 -6 -6 3 3.11
C) Perception of risk
Perception of risk 0 6 94 0 0 0 7 6 3 3 3 2.94
D) Your bank's risk tolerance
Your bank's risk tolerance 0 1 98 1 0 0 1 0 0 0 3 3.00
A) Cost of funds and balance sheet constraints
Cost of funds and balance sheet constraints 0 10 86 2 0 2 3 9 1 4 3 2.91
B) Pressure from competition
Pressure from competition 0 0 82 16 0 1 -14 -16 -7 -8 3 3.16
C) Perception of risk
Perception of risk 0 5 95 0 0 0 5 5 2 2 3 2.95
D) Your bank's risk tolerance
Your bank's risk tolerance 0 1 99 0 0 0 1 1 0 0 3 2.99
A) Cost of funds and balance sheet constraints
Cost of funds and balance sheet constraints 0 7 89 0 0 3 2 7 1 4 3 2.92
B) Pressure from competition
Pressure from competition 0 1 92 5 0 2 -5 -4 -3 -2 3 3.04
C) Perception of risk
Perception of risk 0 9 90 0 0 1 8 9 4 5 3 2.90
D) Your bank's risk tolerance
Your bank's risk tolerance 0 2 97 0 0 1 2 2 1 1 3 2.98
NA2
NetP DI
Over the past three months, how have the following factors1 affected your bank’s credit terms and conditions as
applied to new loans or credit lines to enterprises?
(in percentages, unless otherwise stated)
-- - ° +
Mean
1) The factors refer to the same sub-factors as in question 2.
2) “NA” (not applicable) does not include banks which do not have any business in or exposure to the respective lending category.
Notes: The net percentage (NetP) is defined as the difference between the sum of banks responding “--” (contributed considerably to tightening) and “-” (contributed somewhat to
tightening), and the sum of banks responding “+” (contributed somewhat to easing) and “++” (contributed considerably to easing). “°” means “contributed to keeping credit terms
and conditions basically unchanged”. The diffusion index (DI) is defined as the net percentage weighted according to the intensity of the response, giving lenders who have
answered “considerably” a weight twice as high (score of 1) as lenders having answered “somewhat” (score of 0.5). The mean of the banks’ responses is calculated using weights
from 1 to 5 for the five possible response options.
++
Overall impact on your bank's credit terms and conditions
Impact on your bank's margins on average loans
Impact on your bank's margins on riskier loans
The euro area bank lending survey - Third quarter of 2019 A5

Question 5
Decreased considerably
Decreased somewhat
Remained basically unchanged
Increased somewhat
Increased considerably
NA3
Total
Net percentage
Diffusion index
Mean
Number of banks responding
Share of rejected applications
87
100
7
4 4
3.07
135 135
3.07
7
8
Jul 19
0
3
86
10
0
1
1
3
Oct 19
Over the past three months (apart from normal seasonal fluctuations), has the share of enterprise loan
applications1 that were completely rejected
2 by your bank increased, remained unchanged or decreased (loan
volume, relative to the total volume of loan applications in that loan category)?
(in percentages, unless otherwise stated)
100
1) See Glossary for Loan application.
2) See Glossary for Loan rejection.
3) “NA” (not applicable) does not include banks which do not have any business in or exposure to the respective lending category.
Notes: The net percentage is defined as the difference between the sum of banks responding “increased considerably” and “increased somewhat”, and the sum of banks
responding “decreased somewhat” and “decreased considerably”. The diffusion index is defined as the net percentage weighted according to the intensity of the response, giving
lenders who have answered “considerably” a weight twice as high (score of 1) as lenders having answered “somewhat” (score of 0.5). The mean of the banks’ responses is
calculated using weights from 1 to 5 for the five possible response options. The number of banks responding refers to all participating banks which have business in or exposure to
the respective lending category.
0
0
The euro area bank lending survey - Third quarter of 2019 A6

Question 6
Jul 19 Oct 19 Jul 19 Oct 19 Jul 19 Oct 19 Jul 19 Oct 19 Jul 19 Oct 19
Decreased considerably 0 0 0 0 0 0 0 0 0 0
Decreased somewhat 14 11 12 9 16 15 14 12 17 13
Remained basically unchanged 67 76 70 78 73 74 76 79 66 71
Increased somewhat 15 13 12 11 11 10 10 4 12 16
Increased considerably 4 0 4 0 0 0 0 4 4 0
NA3 0 0 2 2 1 1 1 1 0 0
Total 100 100 100 100 100 100 100 100 100 100
Net percentage 6 1 4 2 -5 -5 -4 -5 0 3
Diffusion index 5 1 4 1 -2 -2 -2 -1 2 1
Mean 3.10 3.01 3.09 3.03 2.96 2.95 2.96 2.99 3.04 3.03
Number of banks responding 135 135 132 132 129 129 135 135 135 135
Overall
(in percentages, unless otherwise stated)
1) See Glossary for Demand for loans.
2) See Glossary for Credit line.
3) “NA” (not applicable) does not include banks which do not have any business in or exposure to the respective lending category.
Notes: The net percentage is defined as the difference between the sum of banks responding “increased considerably” and “increased somewhat” , and the sum of banks
responding “decreased somewhat” and “decreased considerably”. The diffusion index is defined as the net percentage weighted according to the intensity of the response, giving
lenders who have answered “considerably” a weight twice as high (score of 1) as lenders having answered “somewhat” (score of 0.5). The mean of the banks’ responses is
calculated using weights from 1 to 5 for the five possible response options. The number of banks responding refers to all participating banks which have business in or exposure to
the respective lending category.
Over the past three months (apart from normal seasonal fluctuations), how has the demand for loans1 or credit
lines2 to enterprises changed at your bank? Please refer to the financing need of enterprises independent of
whether this need will result in a loan or not.
Long-term loans
Loans to small
and medium-sized
enterprises
Loans to large
enterprises Short-term loans
The euro area bank lending survey - Third quarter of 2019 A7

Question 7
Jul 19 Oct 19 Jul 19 Oct 19 Jul 19 Oct 19
A) Financing needs/underlying drivers or
purpose of loan demand
Fixed investment 0 12 72 13 0 2 6 2 3 1 3.06 3.03
Inventories and working capital 0 11 82 6 0 1 -1 -5 -1 -2 2.98 2.96
Mergers/acquisitions and corporate restructuring 0 2 85 11 0 1 5 9 3 5 3.05 3.09
General level of interest rates 0 2 85 12 0 1 6 10 3 5 3.06 3.10
Debt refinancing/restructuring and renegotiation1 0 2 95 3 0 0 0 1 0 0 3.00 3.01
B) Use of alternative finance
Internal financing 0 5 92 0 0 2 -2 -4 -1 -2 2.98 2.96
Loans from other banks 0 4 94 0 0 2 2 -4 1 -2 3.02 2.96
Loans from non-banks 0 5 93 0 0 2 -1 -5 0 -2 2.99 2.95
Issuance/redemption of debt securities 0 3 89 0 0 8 0 -3 0 -2 3.00 2.97
Issuance/redemption of equity 0 1 89 0 0 10 -2 -1 -1 -1 2.98 2.99
-- - ° +
1) See Glossary for Debt refinancing/restructuring and renegotiation.
2) “NA” (not applicable) does not include banks which do not have any business in or exposure to the respective lending category.
Notes: The net percentage (NetP) is defined as the difference between the sum of banks responding “++” (contributed considerably to higher demand) and “+” (contributed
somewhat to higher demand), and the sum of banks responding “-” (contributed somewhat to lower demand) and “--” (contributed considerably to lower demand). “°” means
“contributed to keeping demand basically unchanged”. The diffusion index (DI) is defined as the net percentage weighted according to the intensity of the response, giving lenders
who have answered “considerably” a weight twice as high (score of 1) as lenders having answered “somewhat” (score of 0.5). The mean of the banks’ responses is calculated
using weights from 1 to 5 for the five possible response options.
(in percentages, unless otherwise stated)
Over the past three months, how have the following factors affected the overall demand for loans or credit lines to
enterprises?
++ NA2
NetP DI Mean
The euro area bank lending survey - Third quarter of 2019 A8

Question 8
Jul 19 Oct 19 Jul 19 Oct 19 Jul 19 Oct 19 Jul 19 Oct 19 Jul 19 Oct 19
Tighten considerably 0 0 0 0 0 0 0 0 0 0
Tighten somewhat 1 4 2 8 1 3 1 3 2 5
Remain basically unchanged 97 93 93 88 98 92 95 92 97 91
Ease somewhat 1 3 3 3 0 4 4 4 1 4
Ease considerably 0 0 0 0 0 0 0 0 0 0
NA1 0 0 2 2 1 1 1 1 0 0
Total 100 100 100 100 100 100 100 100 100 100
Net percentage 0 1 -1 5 1 -1 -4 -2 1 1
Diffusion index 0 0 0 3 1 0 -2 -1 0 1
Mean 3.00 2.99 3.01 2.95 2.99 3.01 3.04 3.02 2.99 2.99
Number of banks responding 135 135 132 132 129 129 135 135 135 135
1) “NA” (not applicable) does not include banks which do not have any business in or exposure to the respective lending category.
Notes: The net percentage is defined as the difference between the sum of the percentages for “tighten considerably” and “tighten somewhat”, and the sum of the percentages for
“ease somewhat” and “ease considerably”. The diffusion index is defined as the net percentage weighted according to the intensity of the response, giving lenders who have
answered “considerably” a weight twice as high (score of 1) as lenders having answered “somewhat” (score of 0.5). The mean of the banks’ responses is calculated using weights
from 1 to 5 for the five possible response options. The number of banks responding refers to all participating banks which have business in or exposure to the respective lending
category.
Loans to small
and medium-sized
enterprises
(in percentages, unless otherwise stated)
Overall Long-term loans
Please indicate how you expect your bank’s credit standards as applied to the approval of loans or credit lines to
enterprises to change over the next three months. Please note that we are asking about the change in credit
standards, rather than about their level.
Loans to large
enterprises Short-term loans
The euro area bank lending survey - Third quarter of 2019 A9

Question 9
Jul 19 Oct 19 Jul 19 Oct 19 Jul 19 Oct 19 Jul 19 Oct 19 Jul 19 Oct 19
Decrease considerably 0 0 0 0 0 0 0 0 0 0
Decrease somewhat 6 8 6 7 6 10 4 8 7 10
Remain basically unchanged 84 83 81 82 85 86 89 84 83 81
Increase somewhat 11 9 11 9 8 4 6 7 10 9
Increase considerably 0 0 0 0 0 0 0 0 0 0
NA1 0 0 2 2 1 1 1 1 0 0
Total 100 100 100 100 100 100 100 100 100 100
Net percentage 5 1 5 1 2 -6 2 -1 3 -1
Diffusion index 3 1 2 1 1 -3 1 0 1 0
Mean 3.05 3.01 3.05 3.02 3.02 2.94 3.02 2.99 3.03 2.99
Number of banks responding 135 135 132 132 129 129 135 135 135 135
1) “NA” (not applicable) does not include banks which do not have any business in or exposure to the respective lending category.
Notes: The net percentage is defined as the difference between the sum of the percentages for “increase considerably” and “increase somewhat”, and the sum of the percentages
for “decrease somewhat” and “decrease considerably”. The diffusion index is defined as the net percentage weighted according to the intensity of the response, giving lenders who
have answered “considerably” a weight twice as high (score of 1) as lenders having answered “somewhat” (score of 0.5). The mean of the banks’ responses is calculated using
weights from 1 to 5 for the five possible response options. The number of banks responding refers to all participating banks which have business in or exposure to the respective
lending category.
Long-term loans
(in percentages, unless otherwise stated)
Please indicate how you expect demand for loans or credit lines to enterprises to change at your bank over the
next three months (apart from normal seasonal fluctuations)? Please refer to the financing need of enterprises
independent of whether this need will result in a loan or not.
Short-term loansOverall
Loans to small
and medium-sized
enterprises
Loans to large
enterprises
The euro area bank lending survey - Third quarter of 2019 A10

Loans to households
Question 10
Tightened considerably
Tightened somewhat
Remained basically unchanged
Eased somewhat
Eased considerably
NA5
Total
Net percentage
Diffusion index
Mean
Number of banks responding
2
Oct 19
0
5
00
3
0
4
94
2
0
Jul 19 Oct 19
Loans for house purchase
Over the past three months, how have your bank’s credit standards1 as applied to the approval of loans
2 to
households3
changed? Please note that we are asking about the change in credit standards, rather than about
their level.
Consumer credit and other lending4
92
0
100
-2
-1
136
2
2.96
5
0
Jul 19
0
4
91
00
96
0
0
3
(in percentages, unless otherwise stated)
0
3.01
100
4
100
-1
2.96
3
136
3.02
131
1) See Glossary for Credit standards.
2) See Glossary for Loans.
3) See Glossary for Households.
4) See Glossary for Consumer credit and other lending.
5) “NA” (not applicable) does not include banks which do not have any business in or exposure to the respective lending category.
Notes: The net percentage is defined as the difference between the sum of the percentages for “tightened considerably” and “tightened somewhat”, and the sum of the
percentages for “eased somewhat” and “eased considerably”. The diffusion index is defined as the net percentage weighted according to the intensity of the response, giving
lenders who have answered “considerably” a weight twice as high (score of 1) as lenders having answered “somewhat” (score of 0.5). The mean of the banks’ responses is
calculated using weights from 1 to 5 for the five possible response options. The number of banks responding refers to all participating banks which have business in or exposure to
the respective lending category.
131
0
100
The euro area bank lending survey - Third quarter of 2019 A11

Question 11
Jul 19 Oct 19 Jul 19 Oct 19 Jul 19 Oct 19
A) Cost of funds and balance sheet constraints1
Cost of funds and balance sheet constraints 0 0 99 0 0 1 2 0 1 0 2.98 3.00
B) Pressure from competition
Competition from other banks 0 0 93 6 0 1 -8 -6 -4 -3 3.08 3.06
Competition from non-banks2 0 0 93 0 3 4 -4 -3 -3 -3 3.07 3.05
C) Perception of risk3
General economic situation and outlook 0 2 95 3 0 0 -1 -1 -1 0 3.01 3.01
Housing market prospects, including expected
house price developments4 0 1 96 3 0 0 -3 -2 -1 -1 3.03 3.02
Borrower’s creditworthiness5 0 1 94 5 0 0 -2 -4 -1 -2 3.02 3.04
D) Your bank's risk tolerance3
Your bank's risk tolerance 0 2 97 1 0 0 3 2 1 1 2.97 2.98
1) See Glossary for Cost of funds and balance sheet constraints.
2) See Glossary for Non-banks.
3) See Glossary for Perception of risk and risk tolerance.
4) See Glossary for Housing market prospects, including expected house price developments.
5) Risks related to non-performing loans may be reflected not only in the "borrower's creditworthiness", but also in the bank's "cost of funds and balance sheet constraints".
6) “NA” (not applicable) does not include banks which do not have any business in or exposure to the respective lending category.
Notes: The net percentage (NetP) is defined as the difference between the sum of banks responding “--” (contributed considerably to tightening) and “-” (contributed somewhat to
tightening), and the sum of banks responding “+” (contributed somewhat to easing) and “++” (contributed considerably to easing). “°” means “contributed to basically unchanged
credit standards”. The diffusion index (DI) is defined as the net percentage weighted according to the intensity of the response, giving lenders who have answered “considerably” a
weight twice as high (score of 1) as lenders having answered “somewhat” (score of 0.5). The mean of the banks’ responses is calculated using weights from 1 to 5 for the five
possible response options.
Over the past three months, how have the following factors affected your bank’s credit standards as applied to
the approval of loans to households for house purchase?
(in percentages, unless otherwise stated)
-- - ° NA6
NetP DI Mean
+ ++
The euro area bank lending survey - Third quarter of 2019 A12

Question 12
Jul 19 Oct 19 Jul 19 Oct 19 Jul 19 Oct 19
A) Overall terms and conditions
Overall terms and conditions 0 7 89 4 0 0 1 3 0 1 2.99 2.97
B) Margins
Your bank’s loan margin on average loans2 0 18 67 15 0 0 -6 3 -3 1 3.06 2.97
Your bank’s loan margin on riskier loans 0 16 80 2 0 2 5 14 3 7 2.94 2.86
C) Other terms and conditions
Collateral3 requirements 0 2 98 0 0 0 1 2 0 1 2.99 2.98
"Loan-to-value" ratio4 0 3 96 1 0 0 5 2 2 1 2.95 2.98
Other loan size limits 0 1 99 0 0 0 0 1 0 0 3.00 2.99
Maturity 0 1 98 1 0 0 1 0 0 0 2.99 3.00
Non-interest rate charges5 0 0 95 2 0 3 0 -2 0 -1 3.00 3.02
(in percentages, unless otherwise stated)
Over the past three months, how have your bank’s terms and conditions1 for new loans to households for house
purchase changed?
1) See Glossary for Credit terms and conditions.
2) See Glossary for Loan margin/spread over a relevant market reference rate.
3) See Glossary for Collateral.
4) See Glossary for Loan-to-value ratio.
5) See Glossary for Non-interest rate charges.
6) “NA” (not applicable) does not include banks which do not have any business in or exposure to the respective lending category.
Notes: The net percentage (NetP) is defined as the difference between the sum of banks responding “--” (tightened considerably) and “-” (tightened somewhat), and the sum of
banks responding “+” (eased somewhat) and “++” (eased considerably). “°” means “remained basically unchanged”. The diffusion index (DI) is defined as the net percentage
weighted according to the intensity of the response, giving lenders who have answered “considerably” a weight twice as high (score of 1) as lenders having answered “somewhat”
(score of 0.5). The mean of the banks’ responses is calculated using weights from 1 to 5 for the five possible response options.
NA6
NetP DI
++- ° +
Mean
--
The euro area bank lending survey - Third quarter of 2019 A13

Question 13
Jul 19 Oct 19 Jul 19 Oct 19 Jul 19 Oct 19
A) Cost of funds and balance sheet constraints
Cost of funds and balance sheet constraints 2 7 89 1 0 0 3 8 2 5 2.96 2.91
B) Pressure from competition
Pressure from competition 0 1 82 16 0 1 -15 -15 -7 -7 3.14 3.15
C) Perception of risk
Perception of risk 0 0 97 3 0 0 -2 -3 -1 -1 3.02 3.03
D) Your bank's risk tolerance
Your bank's risk tolerance 0 0 100 0 0 0 1 0 1 0 2.99 3.00
A) Cost of funds and balance sheet constraints
Cost of funds and balance sheet constraints 2 11 85 2 0 0 3 11 2 6 2.96 2.87
B) Pressure from competition
Pressure from competition 0 7 72 20 0 1 -16 -14 -7 -7 3.15 3.14
C) Perception of risk
Perception of risk 0 0 97 3 0 0 -3 -3 -1 -1 3.03 3.03
D) Your bank's risk tolerance
Your bank's risk tolerance 0 0 100 0 0 0 1 0 0 0 2.99 3.00
A) Cost of funds and balance sheet constraints
Cost of funds and balance sheet constraints 0 9 89 0 0 2 3 9 2 5 2.96 2.91
B) Pressure from competition
Pressure from competition 0 6 88 3 0 3 1 4 0 2 2.99 2.96
C) Perception of risk
Perception of risk 0 2 96 0 0 2 1 2 0 1 2.99 2.98
D) Your bank's risk tolerance
Your bank's risk tolerance 0 2 96 0 0 2 2 2 1 1 2.98 2.98
Overall impact on your bank's credit terms and conditions
Impact on your bank's margins on average loans
Impact on your bank's margins on riskier loans
+ ++°-- -
Over the past three months, how have the following factors1 affected your bank’s credit terms and conditions as
applied to new loans to households for house purchase?
(in percentages, unless otherwise stated)
NA2
NetP DI Mean
1) The factors refer to the same sub-factors as in question 11.
2) “NA” (not applicable) does not include banks which do not have any business in or exposure to the respective lending category.
Notes: The net percentage (NetP) is defined as the difference between the sum of banks responding “--” (contributed considerably to tightening) and “-” (contributed somewhat to
tightening), and the sum of banks responding “+” (contributed somewhat to easing) and “++” (contributed considerably to easing). “°” means “contributed to keeping credit terms
and conditions basically unchanged”. The diffusion index (DI) is defined as the net percentage weighted according to the intensity of the response, giving lenders who have
answered “considerably” a weight twice as high (score of 1) as lenders having answered “somewhat” (score of 0.5). The mean of the banks’ responses is calculated using weights
from 1 to 5 for the five possible response options.
The euro area bank lending survey - Third quarter of 2019 A14

Question 14
Jul 19 Oct 19 Jul 19 Oct 19 Jul 19 Oct 19
A) Cost of funds and balance sheet constraints
Cost of funds and balance sheet constraints 0 0 99 0 0 1 0 0 0 0 3.00 3.00
B) Pressure from competition
Competition from other banks 0 0 98 1 0 1 -4 -1 -2 0 3.04 3.01
Competition from non-banks 0 0 99 0 0 1 -1 0 0 0 3.01 3.00
C) Perception of risk
General economic situation and outlook 0 2 98 0 0 0 0 2 0 1 3.00 2.98
Creditworthiness of consumers1 0 3 94 4 0 0 -3 -1 -1 0 3.03 3.01
Risk on the collateral demanded 0 0 94 0 0 6 0 0 0 0 3.00 3.00
D) Your bank's risk tolerance
Your bank's risk tolerance 0 3 96 1 0 0 4 1 2 1 2.96 2.99
Mean
(in percentages, unless otherwise stated)
Over the past three months, how have the following factors affected your bank’s credit standards as applied to
the approval of consumer credit and other lending to households?
++ NA2
NetP DI
-- - ° +
1) Risks related to non-performing loans may be reflected not only in the "creditworthiness of consumers", but also in the bank's "cost of funds and balance sheet constraints".
2) “NA” (not applicable) does not include banks which do not have any business in or exposure to the respective lending category.
Notes: The net percentage (NetP) is defined as the difference between the sum of banks responding “--” (contributed considerably to tightening) and “-” (contributed somewhat to
tightening), and the sum of banks responding “+” (contributed somewhat to easing) and “++” (contributed considerably to easing). “°” means “contributed to basically unchanged
credit standards”. The diffusion index (DI) is defined as the net percentage weighted according to the intensity of the response, giving lenders who have answered “considerably” a
weight twice as high (score of 1) as lenders having answered “somewhat” (score of 0.5). The mean of the banks’ responses is calculated using weights from 1 to 5 for the five
possible response options.
The euro area bank lending survey - Third quarter of 2019 A15

Question 15
Jul 19 Oct 19 Jul 19 Oct 19 Jul 19 Oct 19
A) Overall terms and conditions
Overall terms and conditions 0 2 97 1 0 0 -2 1 -1 1 3.02 2.99
B) Margins
Your bank’s loan margin on average loans 0 6 85 9 0 0 -6 -2 -3 -1 3.06 3.02
Your bank’s loan margin on riskier loans 0 4 93 4 0 0 3 0 1 0 2.97 3.00
C) Other terms and conditions
Collateral requirements 0 2 93 0 0 5 1 2 1 1 2.99 2.98
Size of the loan 0 0 100 0 0 0 -1 0 -1 0 3.01 3.00
Maturity 0 0 99 1 0 0 0 -1 0 0 3.00 3.01
Non-interest rate charges 0 0 99 1 0 0 1 -1 0 0 2.99 3.01
1) “NA” (not applicable) does not include banks which do not have any business in or exposure to the respective lending category.
Notes: The net percentage (NetP) is defined as the difference between the sum of banks responding “--” (tightened considerably) and “-” (tightened somewhat), and the sum of
banks responding “+” (eased somewhat) and “++” (eased considerably). “°” means “remained basically unchanged”. The diffusion index (DI) is defined as the net percentage
weighted according to the intensity of the response, giving lenders who have answered “considerably” a weight twice as high (score of 1) as lenders having answered “somewhat”
(score of 0.5). The mean of the banks’ responses is calculated using weights from 1 to 5 for the five possible response options.
++
(in percentages, unless otherwise stated)
NA1
NetP DI Mean
Over the past three months, how have your bank’s terms and conditions for new consumer credit and other
lending to households changed?
-- - ° +
The euro area bank lending survey - Third quarter of 2019 A16

Question 16
Jul 19 Oct 19 Jul 19 Oct 19 Jul 19 Oct 19
A) Cost of funds and balance sheet constraints
Cost of funds and balance sheet constraints 0 3 97 0 0 0 3 3 2 2 2.97 2.97
B) Pressure from competition
Pressure from competition 0 0 95 4 0 1 -5 -4 -2 -2 3.05 3.04
C) Perception of risk
Perception of risk 0 4 93 4 0 0 -3 0 -2 0 3.03 3.00
D) Your bank's risk tolerance
Your bank's risk tolerance 0 3 97 0 0 0 1 2 0 1 2.99 2.98
A) Cost of funds and balance sheet constraints
Cost of funds and balance sheet constraints 0 3 97 0 0 0 0 3 0 2 3.00 2.97
B) Pressure from competition
Pressure from competition 0 1 91 7 0 1 -10 -6 -5 -3 3.10 3.06
C) Perception of risk
Perception of risk 0 0 96 4 0 0 -4 -4 -4 -2 3.07 3.04
D) Your bank's risk tolerance
Your bank's risk tolerance 0 1 98 0 0 0 -4 1 -2 1 3.04 2.99
A) Cost of funds and balance sheet constraints
Cost of funds and balance sheet constraints 0 1 99 0 0 0 2 1 1 0 2.98 2.99
B) Pressure from competition
Pressure from competition 0 0 95 4 0 1 1 -4 0 -2 2.99 3.04
C) Perception of risk
Perception of risk 0 1 99 0 0 0 1 1 0 1 2.99 2.99
D) Your bank's risk tolerance
Your bank's risk tolerance 0 2 98 0 0 0 0 2 0 1 3.00 2.98
Overall impact on your bank's credit terms and conditions
Impact on your bank's margins on average loans
Impact on your bank's margins on riskier loans
1) The factors refer to the same sub-factors as in question 14.
2) “NA” (not applicable) does not include banks which do not have any business in or exposure to the respective lending category.
Notes: The net percentage (NetP) is defined as the difference between the sum of banks responding “--” (contributed considerably to tightening) and “-” (contributed somewhat to
tightening), and the sum of banks responding “+” (contributed somewhat to easing) and “++” (contributed considerably to easing). “°” means “contributed to keeping credit terms
and conditions basically unchanged”. The diffusion index (DI) is defined as the net percentage weighted according to the intensity of the response, giving lenders who have
answered “considerably” a weight twice as high (score of 1) as lenders having answered “somewhat” (score of 0.5). The mean of the banks’ responses is calculated using weights
from 1 to 5 for the five possible response options.
Over the past three months, how have the following factors1 affected your bank’s credit terms and conditions as
applied to new consumer credit and other lending to households?
-- - ° + ++ NA2
(in percentages, unless otherwise stated)
MeanNetP DI
The euro area bank lending survey - Third quarter of 2019 A17

Question 17
Decreased considerably
Decreased somewhat
Remained basically unchanged
Increased somewhat
Increased considerably
NA3
Total
Net percentage
Diffusion index
Mean
Number of banks responding
3.01
136
3
3.06
136
1) See Glossary for Loan application.
2) See Glossary for Loan rejection.
3) “NA” (not applicable) does not include banks which do not have any business in or exposure to the respective lending category.
Notes:The net percentage is defined as the difference between the sum of banks responding “increased considerably” and “increased somewhat”, and the sum of banks
responding “decreased somewhat” and “decreased considerably”. The diffusion index is defined as the net percentage weighted according to the intensity of the response, giving
lenders who have answered “considerably” a weight twice as high (score of 1) as lenders having answered “somewhat” (score of 0.5). The mean of the banks’ responses is
calculated using weights from 1 to 5 for the five possible response options. The number of banks responding refers to all participating banks which have business in or exposure to
the respective lending category.
0 0
11
100
1
100
6
1
0
1
100
3
2
3.03
131
Oct 19
Loans for house purchase
2
92
0
5
0
1
100
3
2
3.03
131
Jul 19
0
1
94
3 7
Over the past three months (apart from normal seasonal fluctuations), has the share of household loan
applications1 that were completely rejected
2 by your bank increased, remained unchanged or decreased (loan
volume, relative to the total volume of loan applications in that loan category)?
(in percentages, unless otherwise stated)
4
Jul 19 Oct 19
Consumer credit and other lending
0 0
1 0
95 92
The euro area bank lending survey - Third quarter of 2019 A18

Question 18
Decreased considerably
Decreased somewhat
Remained basically unchanged
Increased somewhat
Increased considerably
NA2
Total
Net percentage
Diffusion index
Mean
Number of banks responding
0
136
Oct 19
0
4
84
11
1
0
100
8
4
3.09
136
5
86
9
0
0
100
4
2
3.04
100
1526
14
3.27
131
8
3.16
131
Jul 19
Loans for house purchase
Oct 19
0 0
Jul 19
0
Consumer credit and other lending
Over the past three months (apart from normal seasonal fluctuations), how has the demand for loans1 to
households changed at your bank? Please refer to the financing need of households independent of whether this
need will result in a loan or not.
(in percentages, unless otherwise stated)
4
67
28
1
0
8
70
23
1) See Glossary for Demand for loans.
2) “NA” (not applicable) does not include banks which do not have any business in or exposure to the respective lending category.
Notes: The net percentage is defined as the difference between the sum of banks responding “increased considerably” and “increased somewhat”, and the sum of banks
responding “decreased somewhat” and “decreased considerably”. The diffusion index is defined as the net percentage weighted according to the intensity of the response, giving
lenders who have answered “considerably” a weight twice as high (score of 1) as lenders having answered “somewhat” (score of 0.5). The mean of the banks’ responses is
calculated using weights from 1 to 5 for the five possible response options. The number of banks responding refers to all participating banks which have business in or exposure to
the respective lending category.
0
100
The euro area bank lending survey - Third quarter of 2019 A19

Question 19
Jul 19 Oct 19 Jul 19 Oct 19 Jul 19 Oct 19
A) Financing needs/underlying drivers or
purpose of loan demand
Housing market prospects, including expected
house price developments 0 2 85 13 0 0 11 11 6 6 3.11 3.11
Consumer confidence1 0 5 88 7 0 0 5 3 3 1 3.05 3.03
General level of interest rates 0 2 67 28 3 0 29 29 16 16 3.32 3.32
Debt refinancing/restructuring and renegotiation2 0 0 95 4 0 0 6 4 3 2 3.06 3.04
Regulatory and fiscal regime of housing markets 0 4 93 3 0 0 4 -2 2 -1 3.04 2.98
B) Use of alternative sources for housing
financeInternal finance of house purchase out of
savings/down payment3 0 4 91 3 0 3 -2 -1 -1 0 2.98 2.99
Loans from other banks 0 3 93 0 0 3 2 -3 1 -2 3.02 2.97
Other sources of external finance 0 0 97 0 0 3 0 0 0 0 3.00 3.00
(in percentages, unless otherwise stated)
++ NA4
NetP DI Mean
+--
1) See Glossary for Consumer confidence.
2) See Glossary for Debt refinancing/restructuring and renegotiation.
3) See Glossary for Down payment.
4) “NA” (not applicable) does not include banks which do not have any business in or exposure to the respective lending category.
Notes: The net percentage (NetP) is defined as the difference between the sum of banks responding “++” (contributed considerably to higher demand) and “+” (contributed
somewhat to higher demand), and the sum of banks responding “-” (contributed somewhat to lower demand) and “--” (contributed considerably to lower demand). “°” means
“contributed to keeping demand basically unchanged”. The diffusion index (DI) is defined as the net percentage weighted according to the intensity of the response, giving lenders
who have answered “considerably” a weight twice as high (score of 1) as lenders having answered “somewhat” (score of 0.5). The mean of the banks’ responses is calculated
using weights from 1 to 5 for the five possible response options.
Over the past three months, how have the following factors affected the demand for loans to households for
house purchase?
- °
The euro area bank lending survey - Third quarter of 2019 A20

Question 20
Jul 19 Oct 19 Jul 19 Oct 19 Jul 19 Oct 19
A) Financing needs/underlying drivers or
purpose of loan demand
Spending on durable consumer goods 0 8 82 10 0 0 5 2 3 1 3.05 3.02
Consumer confidence 0 2 84 14 0 0 6 12 3 6 3.06 3.12
General level of interest rates 0 0 82 18 0 0 8 18 4 9 3.08 3.18
Consumption expenditure financed through real-
estate guaranteed loans1 0 0 89 0 0 11 0 0 0 0 3.00 3.00
B) Use of alternative finance
Internal finance out of savings 0 1 94 2 0 3 -2 1 -1 0 2.98 3.01
Loans from other banks 0 2 95 0 0 3 -1 -2 -1 -1 2.99 2.98
Other sources of external finance 0 0 96 1 0 3 -1 0 0 0 2.99 3.00
(in percentages, unless otherwise stated)
Over the past three months, how have the following factors affected the demand for consumer credit and other
lending to households?
-- ++ NA2
NetP DI Mean
1) Consumption expenditure financed through real-estate guaranteed loans
2) “NA” (not applicable) does not include banks which do not have any business in or exposure to the respective lending category.
Notes: The net percentage (NetP) is defined as the difference between the sum of banks responding “++” (contributed considerably to higher demand) and “+” (contributed
somewhat to higher demand), and the sum of banks responding “-” (contributed somewhat to lower demand) and “--” (contributed considerably to lower demand). “°” means
“contributed to keeping demand basically unchanged”. The diffusion index (DI) is defined as the net percentage weighted according to the intensity of the response, giving lenders
who have answered “considerably” a weight twice as high (score of 1) as lenders having answered “somewhat” (score of 0.5). The mean of the banks’ responses is calculated
using weights from 1 to 5 for the five possible response options.
- ° +
The euro area bank lending survey - Third quarter of 2019 A21

Question 21
Tighten considerably
Tighten somewhat
Remain basically unchanged
Ease somewhat
Ease considerably
NA1
Total
Net percentage
Diffusion index
Mean
Number of banks responding
3.03 2.99
0
1 5
92 91
6 4
3.00 2.99
136 136
Consumer credit and other lending
0 0
0 0
100 100
-4 1
-1
Oct 19
1
131 131
Loans for house purchase
0 0
0 0
100 100
0 0
0 1
Jul 19 Oct 19
0 1
4 4
92 91
1) “NA” (not applicable) does not include banks which do not have any business in or exposure to the respective lending category.
Notes: The net percentage is defined as the difference between the sum of the percentages for “tightened considerably” and “tightened somewhat”, and the sum of the
percentages for “eased somewhat” and “eased considerably”. The diffusion index is defined as the net percentage weighted according to the intensity of the response, giving
lenders who have answered “considerably” a weight twice as high (score of 1) as lenders having answered “somewhat” (score of 0.5). The mean of the banks’ responses is
calculated using weights from 1 to 5 for the five possible response options. The number of banks responding refers to all participating banks which have business in or exposure to
the respective lending category.
Please indicate how you expect your bank’s credit standards as applied to the approval of loans to households to
change over the next three months. Please note that we are asking about the change in credit standards, rather
than about their level.
(in percentages, unless otherwise stated)
44
0
Jul 19
The euro area bank lending survey - Third quarter of 2019 A22

Question 22
Decrease considerably
Decrease somewhat
Remain basically unchanged
Increase somewhat
Increase considerably
NA1
Total
Net percentage
Diffusion index
Mean
Number of banks responding
Loans for house purchase
Jul 19 Oct 19
0 0
Jul 19 Oct 19
0 0
Consumer credit and other lending
3 3.14
136 136
3 1
84 84
14 15
0 0
0 0
100 100
11 14
5 7
100 100
6 20
3 10
3 3
131 131
9 4
76 73
15 24
0 0
0 0
Please indicate how you expect demand for loans to households to change over the next three months at your
bank (apart from normal seasonal fluctuations). Please refer to the financing need of households independent of
whether this need will result in a loan or not.
1) “NA” (not applicable) does not include banks which do not have any business in or exposure to the respective lending category.
Notes: The net percentage is defined as the difference between the sum of the percentages for “increase considerably” and “increase somewhat”, and the sum of the percentages
for “decrease somewhat” and “decrease considerably”. The diffusion index is defined as the net percentage weighted according to the intensity of the response, giving lenders who
have answered “considerably” a weight twice as high (score of 1) as lenders having answered “somewhat” (score of 0.5). The mean of the banks’ responses is calculated using
weights from 1 to 5 for the five possible response options. The number of banks responding refers to all participating banks which have business in or exposure to the respective
lending category.
(in percentages, unless otherwise stated)
The euro area bank lending survey - Third quarter of 2019 A23

Question 111
-- - ° + + + NA2
NetP Mean
Std.
dev. -- - ° + + + NA2
NetP Mean
Std.
dev.
A) Retail funding
Short-term deposits (up to one year) 0 2 92 4 0 3 -1 3.01 0.25 0 3 89 4 0 4 0 3.00 0.28
Long-term (more than one year) deposits and
other retail funding instruments 0 5 92 1 0 2 3 2.96 0.26 0 5 88 4 0 3 1 2.99 0.31
B) Inter-bank unsecured money market
Very short-term money market
(up to 1 week)0 0 91 3 0 6 -3 3.04 0.20 0 6 83 4 0 7 2 2.98 0.36
Short-term money market
(more than 1 week)0 0 91 3 0 6 -3 3.04 0.20 0 0 89 4 0 7 -3 3.04 0.22
C) Wholesale debt securities3
Short-term debt securities
(e.g. certificates of deposit or commercial paper)0 2 72 6 0 19 -4 3.05 0.33 0 6 68 7 0 19 -1 3.02 0.39
Medium to long term debt securities (incl.
covered bonds)0 3 64 24 3 7 -23 3.26 0.58 0 1 74 18 0 7 -16 3.17 0.44
D) Securitisation4
Securitisation of corporate loans 0 0 50 3 0 47 -3 3.06 0.26 0 0 49 3 0 47 -3 3.04 0.23
Securitisation of loans for house purchase 0 0 50 1 0 49 -1 3.01 0.10 0 0 45 6 0 49 -6 3.07 0.28
E) Ability to transfer credit risk off balance
sheet5
Ability to transfer credit risk off balance sheet 0 1 52 4 0 42 -3 3.04 0.26 0 0 55 3 0 42 -3 3.05 0.23
Annex 2
Results for ad hoc questions
(in percentages, unless otherwise stated)
1) Please also take into account any effect of state guarantees vis-à-vis debt securities and recapitalisation support.
2) "NA" (not applicable) includes banks for which the source of funding is not relevant.
3) Usually involves on-balance sheet funding.
4) Usually involves the sale of loans from banks’ balance sheets, i.e. off-balance sheet funding
5) Usually involves the use of credit derivatives, with the loans remaining on banks’ balance sheets.
Notes: The net percentage (NetP) is defined as the difference between the sum of the percentages of banks responding “--” (deteriorated considerably/will deteriorate
considerably) and “-” (deteriorated somewhat/will deteriorate somewhat), and the sum of banks responding “+” (eased somewhat/will ease somewhat) and “++” (eased
considerably/will ease considerably). “°” means “remained unchanged/will remain unchanged”. The mean of the banks’ responses is calculated using weights from 1 to 5 for the
five possible response options. Std. dev. denotes standard deviation. Figures may not exactly add up due to rounding.
As a result of the situation in financial markets1, has your market access changed when tapping your usual sources
of wholesale and retail funding and/or has your ability to transfer risk changed over the past three months, or are
you expecting this access/activity to change over the next three months?
Over the past three months Over the next three months
The euro area bank lending survey - Third quarter of 2019 A24

Question 130
-- - ° + + + NA1
NetP Mean
Std.
dev. -- - ° + + + NA1
NetP Mean
Std.
dev.
A) Your bank's total assets
Your bank's total assets (non-risk
weighted volume)0 1 93 2 1 3 2 3.03 0.26 0 2 92 2 1 3 2 3.02 0.28
of which:
euro area sovereign bond holdings 0 7 86 3 0 4 -5 2.95 0.34 0 9 85 2 0 4 -6 2.94 0.35
B) Your bank's cost of funds and
balance sheet situation
Your bank's overall liquidity position 0 1 89 7 0 2 7 3.07 0.30 0 2 86 7 0 6 5 3.06 0.31
Your bank's overall market financing
conditions0 2 84 13 0 1 11 3.12 0.40 0 4 72 21 0 3 18 3.18 0.50
D) Your bank's profitability
Your bank's overall profitability 1 27 67 3 0 1 -26 2.73 0.57 6 23 64 3 0 3 -26 2.69 0.67
owing to:
net interest margin2 3 34 61 2 0 1 -35 2.63 0.60 7 33 53 3 0 3 -37 2.55 0.72
capital gains/losses 1 4 83 6 0 5 1 2.99 0.41 1 4 82 6 0 7 0 2.99 0.41
E) Your bank's capital position
Your bank's capital ratio3 0 4 91 4 0 1 0 3.00 0.30 0 5 86 6 0 3 2 3.02 0.34
1) “NA” (not applicable) includes banks which do not have any business in or exposure to this category.
2) Interest income minus interest paid, relative to the amount of interest-bearing assets.
3) Defined in accordance with the regulatory requirements set out in the CRR/CRD IV, including both tier 1 capital and tier 2 capital.
Notes: The net percentage (NetP) is defined as the difference between the sum of the percentages of banks responding “--” (contributed/will contribute considerably to a decrease
or deterioration) and “-” (contributed/will contribute somewhat to a decrease or deterioration), and the sum of banks responding “+” (contributed/will contribute somewhat to an
increase or improvement) and “++” (contributed/will contribute considerably to an increase or improvement). “°” means “has had/will have basically no impact”. The mean of the
banks’ responses is calculated using weights from 1 to 5 for the five possible response options. Std. dev. denotes standard deviation.
Over the past six months, has the ECB's asset purchase programme led to a change in your bank's assets or
affected (either directly or indirectly) your bank in any of the following areas? Is it likely to have an impact here over
the next six months?
(in percentages, unless otherwise stated)
Over the past six months Over the next six months
The euro area bank lending survey - Third quarter of 2019 A25

Question 132
-- - ° + + + NA1
NetP Mean
Std.
dev.
No of
banks -- - ° + + + NA1
NetP Mean
Std.
dev.
No of
banks
A) Your bank's credit standards
For loans to enterprises 0 1 98 0 0 1 1 2.99 0 135 0 1 95 1 0 4 0 3.00 0.13 135
For loans to households for house
purchase0 0 98 1 0 1 -1 3.01 0 131 0 2 93 2 0 2 0 3.00 0.24 131
For consumer credit and other lending to
households0 0 99 0 0 1 0 3.00 0.08 136 0 0 95 3 0 3 -3 3.03 0.18 136
B) Your bank's terms and conditions
For loans to enterprises 0 2 96 1 0 1 0 3.00 0.19 135 0 3 87 6 0 4 -3 3.03 0.31 135
For loans to households for house
purchase0 0 97 2 0 1 -2 3.02 0.16 131 0 1 90 6 0 2 -5 3.05 0.29 131
For consumer credit and other lending to
households0 0 98 1 0 1 0 3.00 0.11 136 0 1 90 6 0 3 -5 3.05 0.28 136
C) Your bank's lending volume
For loans to enterprises 0 3 87 3 1 7 1 3.02 0.32 135 0 5 80 5 1 10 1 3.02 0.39 135
For loans to households for house
purchase0 1 89 4 1 6 4 3.05 0.30 131 0 2 81 9 1 8 8 3.09 0.40 131
For consumer credit and other lending to
households0 0 91 1 1 7 1 3.02 0.23 136 0 2 84 5 1 8 5 3.06 0.35 136
Over the past six months, how has the ECB's asset purchase programme affected your bank's lending policy and
lending volume? And what will be its impact on lending behaviour over the next six months?
Over the past six months Over the next six months
(in percentages, unless otherwise stated)
1) “NA” (not applicable) does not include banks which do not have any business in or exposure to the respective lending category.
Notes: The net percentage (NetP) is defined as the difference between the sum of the percentages of banks responding “--” (contributed considerably to a tightening or decrease)
and “-” (contributed somewhat to a tightening or decrease), and the sum of the percentages of banks responding “+” (contributed somewhat to an easing or increase) and “++”
(contributed considerably to an easing or increase). “°” means “had basically no impact”. The mean of the banks’ responses is calculated using weights from 1 to 5 for the five
possible response options. Std. dev. denotes standard deviation. The number of banks responding (No of banks) refers to all participating banks which have business in or
exposure to the respective lending category.
The euro area bank lending survey - Third quarter of 2019 A26

Question 133
-- - ° + + + NA2
NetP Mean
Std.
dev.
No of
banks -- - ° + + + NA2
NetP Mean
Std.
dev.
No of
banks
Impact on your bank's net interest income
Impact on your bank's net interest income3 9 66 23 1 0 0 -74 2.17 0.61 144 15 45 33 7 0 0 -54 2.31 0.84 144
Loans to enterprises
Impact on your bank's lending rates 5 38 55 1 0 1 -42 2.53 0.64 135 1 40 58 1 0 1 -39 2.60 0.56 135
Impact on your bank's loan margin4 1 24 72 2 0 1 -24 2.75 0.52 135 1 25 72 2 0 1 -24 2.75 0.52 135
Impact on your bank's non-interest rate
charges0 0 95 4 0 1 4 3.04 0.22 135 0 0 97 3 0 1 3 3.03 0.17 135
Impact on your bank's lending volume 0 1 84 12 1 2 11 3.12 0.41 135 0 4 85 11 0 1 8 3.08 0.39 135
Loans to households for house purchase
Impact on your bank's lending rates 2 37 61 1 0 0 -37 2.61 0.57 131 2 33 66 0 0 0 -34 2.64 0.55 131
Impact on your bank's loan margin4 2 21 73 5 0 0 -18 2.81 0.58 131 2 21 76 1 0 0 -21 2.77 0.53 131
Impact on your bank's non-interest rate
charges0 1 95 3 0 0 2 3.02 0.23 131 1 1 94 4 0 0 1 3.00 0.31 131
Impact on your bank's lending volume 0 1 85 14 0 0 13 3.13 0.39 131 1 3 82 14 0 0 10 3.09 0.47 131
Consumer credit and other lending to
households
Impact on your bank's lending rates 4 21 72 1 0 3 -23 2.72 0.60 136 2 22 74 0 0 3 -23 2.74 0.51 136
Impact on your bank's loan margin4 0 10 86 2 0 3 -9 2.91 0.36 136 1 9 84 3 0 3 -8 2.91 0.42 136
Impact on your bank's non-interest rate
charges0 0 95 2 0 3 2 3.02 0.15 136 1 0 94 2 0 3 1 3.00 0.26 136
Impact on your bank's lending volume 0 0 91 5 1 3 6 3.07 0.31 136 1 1 90 5 1 3 3 3.03 0.38 136
Given the ECB's negative deposit facility rate, did or will this measure, either directly or indirectly1, contribute to:
(in percentages, unless otherwise stated)
Over the next six monthsOver the past six months
1) Independent of whether your bank has excess liquidity.
2) “NA” (not applicable) does not include banks which do not have any business in or exposure to the respective lending category.
3) The net interest income is defined as the difference between the interest earned and interest paid on the outstanding amount of interest-bearing assets and liabilities by the
bank.
4) The loan margin is defined as the spread of the bank’s lending rates on new loans over a relevant market reference rate.
Notes: The net percentage (NetP) is defined as the difference between the sum of the percentages of banks responding “--” (contributed considerably to a decrease) and “-”
(contributed somewhat to a decrease), and the sum of the percentages of banks responding “+” (contributed somewhat to an increase) and “++” (contributed considerably to an
increase). “°” means “had basically no impact”. The mean of the banks’ responses is calculated using weights from 1 to 5 for the five possible response options. Std. dev. denotes
standard deviation. The number of banks (No of banks) responding (No of banks) refers to all participating banks which have business in or exposure to the respective lending
category.
The euro area bank lending survey - Third quarter of 2019 A27

© European Central Bank, 2019
Postal address 60640 Frankfurt am Main, Germany Telephone +49 69 1344 0Website www.ecb.europa.eu
All rights reserved. Reproduction for educational and non-commercial purposes is permitted provided that the source is acknowledged.
For specific terminology please refer to the ECB glossary.
PDF ISSN 1830-5989, QB-BA-19-004-EN-N HTML ISSN 1830-5989, QB-BA-19-004-EN-Q