The EurEnDel Scenarios Europe’s Energy System by 2030
69
Working document The EurEnDel Scenarios Europe’s Energy System by 2030 Daniela Velte In collaboration with Juan Pedro López de Araguas Oliver Nielsen Wolfram Jörß July 2004 Version 1.7
Transcript of The EurEnDel Scenarios Europe’s Energy System by 2030

Working document
The EurEnDel Scenarios Europe’s Energy System by 2030 Daniela Velte In collaboration with Juan Pedro López de Araguas Oliver Nielsen Wolfram Jörß July 2004 Version 1.7

Institute for Futures Studies and Technology Assessment
EurEnDel is a European Union research project
funded under the 5th RTD Framework Programme
About this document This document describes three scenarios of Europe’s possible energy futures developed within the EurEnDel project and sketches the process of the scenario development. As this document only includes very limited general information on the project itself, it should be considered as a working document. Further documentations will follow as the project proceeds and will continuously be made available through the project website: www.eurendel.net On behalf of the EurEnDel team
Timon Wehnert (IZT) Anna Oniszk (EC BREC) Augusto Ninni (IEFE) Daniela Velte (Prospektiker) Birte Holst Jørgensen (RISOE)
Contact: IZT Institute for Futures Studies and Technology Assessment Schopenhauerstr. 26 14129 Berlin Germany www.izt.de Timon Wehnert Phone: +49 30 80 30 88 13 E-Mail: [email protected]
Prospektiker European Institute for Futures Studies Leandro Kalea 3, bajo 20800 Zarautz Spain www.prospektiker.es Daniela Velte Phone: +34-943-835704 E-Mail: [email protected]

Contents
Contents....................................................................................................3
1 Introduction.......................................................................................4
2 Methodology .....................................................................................6
2.1 Morphological Analysis ...........................................................................6 2.2 Work Sequence in EurEnDel ...................................................................7 2.3 Selection of Components and Development of Hypothesis...............11 2.4 Selection of Key Drivers and Appropriate Sets of Instruments .........14
3 The EurEnDel Scenarios................................................................16
3.1 Change of Paradigm...............................................................................16 3.2 Fossil Fuel Wars .....................................................................................24 3.3 Muddling Through Across the Gas Bridge...........................................30
Annex 1. Hypotheses used in scenario process................................35
Annex 2: Results from the Delphi Survey - Times of Occurrences....................................................................................64
Annex 3: References .............................................................................66

EurEnDel – Scenarios Report, May 2004 4
1 Introduction The three qualitative scenarios of Europe’s possible Energy Futures, which are presented in this document, are based on the findings of the Europe-wide Delphi study on Energy and Social Visions - EurEnDel. These results have been checked against multiple inputs from a considerable number of related research projects1. The experts’ opinions on the 20 technology statements, which were included in the Delphi Survey, combined with the preferences for socio-economic visions of the future in the second part of the questionnaire, indicate a broad range of possible future pathways, but their fulfilment will depend on the political will inside Europe, possible pressures on the world market and other framework conditions. Thus, the purpose of displaying the results of the Delphi study in the form of scenarios is twofold:
1) To illustrate the findings of the Delphi survey by putting seemingly unrelated technology statements and their likely developments into a broader and consistent context.
2) To build a basis for further research steps within the EurEnDel project, one of which will be the indication of possible research priorities.
We understand scenarios to be a set of future configurations, which must be at the same time coherent, probable and possible. This understanding implies that the number of potential combinations can be and must be reduced, as some are self-exclusive and others are not desirable, taking into account the European Commission’s policy priorities. Another element, which marks the character of the scenarios described here, derives from the basic approach of the research project: i.e. that of discussing energy technologies within the context of social values. In view of these considerations, the following questions must be answered: 1. Are there hypotheses derived from the Delphi survey, which mutually
exclude each other? 2. Which possible future pathways are most desirable or undesirable, taking
into account the European Commission’s policy priorities, as well as the values expressed as “Social Visions” in the second part of the EurEnDel Survey?
The prior work carried out in the EurEnDel project, mainly the key messages from the Cross-Impact Analysis and the results of the Delphi Survey, determined the basic character of the scenarios, in the sense that
1 Please check bibliographical annex for references.
EurEnDel – Scenarios Report, May 2004 5
There is no business-as-usual case for the European Energy System, when looking at a longer-term horizon (2030). Major structural changes are already taking place in the system and serious upheavals are likely to occur in the coming decades. The process of change, as well as its pace, is largely dependent upon political will, but also upon external framework conditions, which cannot be completely controlled by the main actors, i.e. the European Commission and the countries and regions, which form part of the European Union. The decisive factors, which may act as motors or restraints, are related to the hydrocarbon bottleneck, the mainstreaming of ecological values throughout the European society and its institutions, and also the level of risk perception in society. From the societal point of view, the most desirable options are demand-
side related, heading towards overall demand reduction. No matter whether we strive for economic well-being and liberty of choice, ecological balance or social justice, reducing society’s dependence on energy supply is highly desirable. Next is the sustainable exploitation of renewable energy sources, but, within this field, there is no clear future pathway to be perceived at the moment.
Of course, these clear messages derived from the Expert Workshops and the European Delphi Survey only constitute one among many sources of information on energy-related issues. And the European Commission is by far not the only actor involved in setting policy priorities, nor is “Society” represented by a single interest group. What may be desirable from the overall societal perspective, may be in clear contradiction to the particular interests of some groups of actors, or may simply not be feasible under certain framework conditions. It is therefore necessary to explore possible pathways to reach these future situations, using the technique of scenario building. The main purpose of this exercise is that of indicating not policy, but research priorities, which will aid the process of transition of the future, minimizing the risk of stranded investments and avoiding major crisis situations during the transition period.

EurEnDel – Scenarios Report, May 2004 6
2 Methodology
2.1 Morphological Analysis This scenario exercise is largely based on the technique of “morphological analysis”, as developed by the French CNAM – LIPS and others2, which has been defined as follows: “Morphological analysis aims to explore possible futures in a systematic way by studying all the combinations resulting from the breakdown of a system”. The process of “breaking down” the system implies the definition of a set of “components”, which could develop into different directions. These possible developments are formulated as “hypotheses” or “configurations”. The total number of combinations represents a “morphological space”, which must then be narrowed down to several coherent sets by formulating certain conditions (“exclusions” and “preferences”). From the methodological point of view it is important that:
1. The hypotheses about possible future developments are developed independently for each component (and if possible by different persons) in order to avoid a conscious or unconscious “predetermination” of possible constellations. In the case of the EurEnDel Scenarios, it has been a group of five professionals from IZT and Prospektiker, who have been responsible for formulating the different hypotheses, using as primary input the results from the Delphi Survey. Additionally, representatives from the Spanish energy research centre CIEMAT and the technology centre Inasmet, which form part of the prospective research network OPTI, helped to develop the main hypotheses referring to future energy demand and some supply options.
2. The selection process on the basis of “exclusions” (incompatible pairs of hypotheses) and “preferences” (pairs of hypotheses, which would work well together) is crucial for the final development of the scenarios and should therefore be done during a futures workshop, preferably by professionals who have not been involved in defining the input. For this purpose, the EurEnDel project partners organized a separate meeting with all participating institutes, a representative of the related European research project VLEEM3, and the Commission’s scientific officer.
Due to time constraints and the large number of hypotheses, which had to be checked against each other, the morphological analysis was divided into three consecutive steps:
2 See, for example, http://www.cnam.fr/deg/lips/toolbox/toolbox2.html 3 VLEEM - Very Long Term Energy Environment Model; see also http://www.vleem.org/

EurEnDel – Scenarios Report, May 2004 7
1. Selection of the most probable sets of hypotheses for the six key drivers and determinants, thus defining the framework for three basic scenarios
2. Selection of the preferential set of instruments for each of the three scenarios
3. Cross-checking of all hypotheses related to the considerable number of “instruments” in order to exclude contradictions within each of the scenarios.
2.2 Work Sequence in EurEnDel The basic outline of the EurEnDel system, i.e. Europe’s energy system by 2030, and its main components were derived from the initial Cross-Impact (or Structural) Analysis, which defined the following inputs:
1. Key drivers (highly influential factors largely controlled by the actors involved)
2. Determinants (highly influential external factors, which may act as motors or restraints)
3. Instruments (also called “regulatory variables”), which can be employed in order to achieve a desired future situation
The methodological approach therefore follows a logical sequence of work, as suggested in the graphic below, although with slight modifications:

EurEnDel – Scenarios Report, May 2004 8

EurEnDel – Scenarios Report, May 2004 9
In the EurEnDel project, this work sequence has been slightly modified, since the actors’ analysis was not contemplated in the project design and the SMIC expert inquiry was substituted by a Delphi survey. Graphically, the organization of work in the EurEnDel project can be displayed as follows:
����������������Research Institutes + 9 external experts
Research Strategy Eurendel - Pre-Delphi
Delimitation
of researchscope “Askthe rightquestions ”
“Brainstorming ”: possible key factors
Input
“FuturesWorkshopSocial
Visions ”
Identification of 15 “problem fields ”
Input to Delphi
Development anddocumentation ofpossible key factors
within each “problemfield”
Research Institutes + 1external expert
Cross - impactanalysis:
identification ofdriving factors
Framework ofcomparison fornational Delphi
studies
Technologypaths andtrends
Research Institutes
��������������
������� ��������
����������������
��������������
��������������
Research Institutes
Research Institutes
������������������

EurEnDel – Scenarios Report, May 2004 10
Research Strategy Eurendel - Post-Delphi
NationalDelphis
Delphi results 1st and 2nd round
Scenario Buildingguided by Cross-Impact
Analysis 2 scenario workshops (internal
& external)
Quantitative resultstechnology statements
& visions
Qualitativeresults: experts’
comments
��������������
��������������
����������������
����������������
����������������
Scenario exercises(qualitative and
quantitative models)
������������������������
Quantitativeresults:
visions
��������������
������� ������� �������
Qualitative
analysis:Technology pushversus social pull
Recommendations regarding futureresearch priorities
LiteratureAnalysis
����������������

EurEnDel – Scenarios Report, May 2004 11
2.3 Selection of Components and Development of Hypothesis
As shown in the graphic presentation above, the main input for the development of the scenarios has been derived from the experts’ responses to the technology-oriented Delphi statements, the more than 1,600 comments posted by the participants and the additional information on technology choices made under the prism of a set of “societal visions”. Still, additional information was necessary in order to define the framework for each scenario. It has been assumed that each of the scenarios is determined by the possible evolution of the 2 key drivers and the 4 contextual variables, which act as motors and/or restraints4.:
Key factor Impact of climate concerns
“The energy market will be strongly impacted by climate concerns. Clean technologies and energy efficiency measures will be supported. Market for international trade of emission reduction units will develop. CO2 reduction units become a tradable commodity”
Key factor Political support for sustainable development
“Stricter emission and waste standards, obligation to increase share of renewables, obligation to decrease CO2 emission levels and to increase energy efficiency will be supported by strong environmental regulations Clean technologies will be supported by political decisions. Thus they will be able to stand the competition with traditional energy sources and will penetrate into the market. Regulations will also support the effective use of materials, so that Europe will improve its overall efficiency in resource use by a factor of four.”
Determinant (motors or restraints) Petroleum War
“Growing world demand for oil will surpass peak production capacities before 2030, provoking price increments and reducing the OPEC’s swing function. The leading powers will try to control the remaining resources politically and militarily, while the poorer countries, with less reaction capacity, will have to dedicate an ever larger share of their GDP to energy supplies, thus impoverishing even more. Their only short-term alternative consists in recurring to coal for power generation.”
4 More information on the prior Cross-Impact Analysis is available from the EurEnDel website:
http://www.izt.de/eurendel/

EurEnDel – Scenarios Report, May 2004 12
Determinant (motors or restraints) Supply interruption risk for gas
“Gas demand in OECD Europe is expected to double by the year 2020, due, in great part, to the “Dash for gas” in power generation. Yet, accessing the remaining gas reserves will only be possible with increased investments in exploration and exploitation. Europe’s own reserves will be largely depleted before 2030, thus exposing the continent to increased risks related to possible interruptions in the supply chain. Avoiding the risk implies important investments in pipelines, LNG facilities and storage, but part of these investments may not be carried out, as companies perceive a lack of long-term perspective in the market.”
Determinant (motors or restraints) Mainstreaming ecology on a political level
“There is a growing consensus that ecology is an important field of politics. The strengthening of ecological concerns will continue by implementing further political institutions. People do accept necessary means in favour of ecology if the burden is evenly shared (laws instead of personal austerity).”
Determinant (motors or restraints) The perception of technological risk in society
“New technologies that are labelled to be risky, encounter a strong opposition. However, the danger potential of technologies perceived by the public is different from the actual (statistical) danger. This puts a high pressure on technologies that bear the risk of big disasters (nuclear power plant, oil tankers) and on technologies, which have negative local effects (toxic pollutions, smells, etc.).” The perception of the risk potential differs very much in the individual member states and so does the further development and rate of application of those technologies.” The possible evolution of each of these drivers and determinants was sketched in sets of two or three hypotheses each, using, whenever possible, qualitative and quantitative input from related research project and scenario exercises (see list of information sources in the annex). The main references for quantitative input used for formulating the related hypotheses [European Commission, Directorate General for Energy and Transport (2003) and European Commission, Directorate-General for Research (2003)] had been recommended by the European Commission’s scientific officer.

EurEnDel – Scenarios Report, May 2004 13
Example of hypotheses used for scenario building
Key driver “Impacts of climate change concerns Hypothesis A1 Low political priority of climate concerns
Hypothesis A2. High political priority of climate concerns / long-term impact mitigation
Hypothesis A3 High political priority of climate concerns / high impact
CO2 emissions in 2030 are 14% higher than in reference year 1990 and 18% higher than in 2000 in EU 25. Different techniques of CO2 sequestration lead to an overall reduction of CO2 emissions of 2% until 2010, but large amounts of CO2 emission allowances still have to be acquired by those Member States, who have not been able to comply with their national targets.
CO2 emissions are reduced to 1990 levels by 2012. Efficiency measures are then starting to have a major effect on overall energy use and lowering the European’s economy carbon intensity. By attaching a carbon value to fossil fuel use, CO2 emissions in 2030 are 26 % lower in the EU15 and the New Member Countries
CO2 emissions are reduced to 1990 levels by 2012 and then stabilized. In this transition period, flexible mechanisms are employed as a short-term solution. Still, climate change effects are becoming more evident in some regions and are also having negative impacts on energy production and infrastructure, especially in coastal areas. Risk prevention measures are inevitable and costs derived from climate change surge.
Hypothesis A1
Low political priority ofclimate concerns
A2. High political priority ofclimate concerns / long-term impact mitigation
A3. High political priority ofclimate concerns / high
impact
B1. Low political priorityfor SustainableDevelopment
B2. High political priorityfor SustainableDevelopment
Preferences Exclusions
C1. ŅA call to Darwin Š managingthe end of the petroleum eraÓ
C2. ŅSave the WorldÓ (Newparadigm)
C3. ŅA call to armsÓ(Breaking down the system)
D1. ŅThe gas bridgeÓ D2. ŅSave the gas for future generationsÓ D3. ŅWar over gasÓ
E1. Effective institutional cooperation inenvironmental policy
E2. Lack of consensus on institutionallevel
F1. Low perception of technological riskin society
F2. High perception of technological riskin society
graph 2-1: Graphic presentation of the selection process5.
5 For lay-out reasons, the graphic does not display all exclusions and preferences determined
by the working group.

EurEnDel – Scenarios Report, May 2004 14
2.4 Selection of Key Drivers and Appropriate Sets of Instruments
The working group analysed the sets of hypotheses for each key driver and determinant one by one, defining exclusions and preferences, as illustrated graphically above The preferences and exclusions determined by the working group were introduced into a computer programme (Morphol) in order to calculate the sets of possible solutions with the highest degree of coherence. The most interesting combinations are those, which combine the highest number of preferences (indicated below in brackets). Yet, solutions Nº 1, 2 and 3 are nearly identical sets of combinations, which would not have permitted to obtain differentiated scenarios, so two “second-best” solutions, with 8 preferences each, were selected out of a total of 216 possible combinations:
1. A2 B2 C2 D2 E1 F2 (10 - Scenario 1) 2: A2 B2 C2 D1 E1 F2 (10) 3: A2 B2 C2 D2 E1 E1 (9)
4: A1 B1 C3 D3 E2 F1 (8- Scenario 2)
5: A1 B1 C3 D1 E2 F1 (8) 6: A2 B2 C1 D1 E1 F2 (8) 7: A2 B2 C2 D1 E1 F1 (8)
8: A3 B2 C1 D1 E1 F2 (8 - Scenario 3)
The same procedure was applied in order to select the most appropriate combination of instruments for each scenario. Additionally, the hypotheses referring to the instruments were checked against each other, in order to avoid incongruent combinations. For this purpose, the system had to be broken down in four subspaces: energy demand, supply options, carrier technologies and socio-economic developments. Some of the results obtained from the workshop are displayed below.

EurEnDel – Scenarios Report, May 2004 15
Energy Demand Number of possible solutions 324 After exclusions 212 With preferences 192 Solutions with highest number of preferences:
Set of Key Drivers forEach Scenario FC
car
s
Biof
uels
Frei
ght o
n ra
il
Low
-en
ergy
bu
ildin
gs
Indu
stry
en
ergy
ef
ficie
nt
No.
of
pref
eren
ces
Alph. Index I J K L M
Scenario 1 1 1 1 1 1 5
Scenario 1 1 1 1 3 1 5
Scenario 3 2 1 1 1 1 4
Scenario 3 2 1 2 1 1 4
Scenario 3 2 1 1 1 2 4
Scenario 3 2 1 2 1 2 4
Scenario 2 3 2 1 2 1 3
Scenario 2 3 2 2 2 1 3
Scenario 2 3 2 3 2 1 3
Scenario 2 3 2 1 2 2 3
Scenario 2 3 2 2 2 2 3
Scenario 2 3 2 3 2 2 3
The exclusions established for these configurations were the following: Key drivers scenario 1 Low energy buildings L2
Key drivers scenario 1 FC cars I3 Key drivers scenario 1 Freight on rail K3 Key drivers scenario 2 Low energy buildings L3

EurEnDel – Scenarios Report, May 2004 16
3 The EurEnDel Scenarios Before describing the possible future scenarios of Europe’s energy system it should be pointed out that every scenario exercise is conducted in a given context and based on the knowledge of past developments and present trends. The EurEnDel project, including the expert survey, has been carried out on the background of major political upheavals in Europe and on the international scene: the shock of two massacres of civilian people in the Western world, the ongoing invasion and occupation of Iraq and the strong popular protest against this latest war in large part of Europe. This context certainly does not favour a “business-as-usual” attitude, so that the project team put much emphasis on integrating into the analysis the longer-term, structural changes, which are also known to be taking place in the energy system. What will Europe look like in 2030? For this scenario exercise, it has been assumed that by then, the enlarged union of 25 member states will be a reality. The main environmental challenges and threats will still exercise their influence on society and politics, in spite of considerable technological progress, and the trend towards the service economy continues. It is foreseeable that Europe’s societies will be made up of a larger percentage of older people and, in many other aspects, Europe will also be different in 2030…
3.1 Change of Paradigm The first set of drivers combines those hypotheses, which are most closely related to a strong policy shift towards sustainable development in the years up to 2030: it is due to a combination of political will, technological progress, structural changes in the economy and urgent environmental pressures that Europe 25 is on the way of achieving great progress in energy efficiency. These combined pressures trigger an aggressive and self-learning move towards much lower levels of energy intensity across all processes and countries. It is mostly a universal attitude, which seeps across all layers of societies and spheres of activity, and produces a “democratic” initiative, summing up efforts by many and in many places.
Climate change concerns have lead to an important reduction of CO2 emissions and long-term consequences can thus be mitigated. By 2012, CO2 emissions had been reduced below 1990 levels. During the second decade of the century, efficiency measures started to show a major effect on overall energy use, lowering the European’s economy carbon intensity. By attaching a carbon value to fossil fuel use, CO2 emissions have shown an annual decrease of approx. 1.5% for the last two decades in the EU15 and the New Member Countries. Europe strives towards achieving “Factor 4”, using substitute resources for oil and petroleum-derived products. Import dependency can so be limited, and the drive towards substitute energy sources is strong enough to exercise a positive effect on gas consumption levels. As a result, pressures on energy demand start to ease, so that the year-count of oil reserves [on a falling demand] is increasing again and new options on the supply-side remain unexplored. Everything is on track so that, by 2050, the World will have learned to live with almost no oil for energy production.

EurEnDel – Scenarios Report, May 2004 17
International consensus on the need for improving the living conditions in the poorest countries has been growing for decades. Correctly channelled aid programs have helped to speed up electrification in many of these countries, although the differences between the per capita energy consumption between the 1st and 3rd World are still considerable. Presently, the main issues of debate in energy policy are long-term planning, re-regulation of energy markets and re-nationalization of many energy companies, as well as other strategic or high-risk industries (airways, steel…). The different administrative levels in Europe work closely together in promoting ecological values as guiding priorities in all fields of public policy. The principle of eco-efficiency is widely accepted and leads to active energy saving policies in the public and private sector. The European Commission and the national institutions have worked hand in hand to set up a legal framework, which promotes environmental excellence in companies and ecological consumption habits. Technologies that are labelled to be risky encounter strong opposition. The strong public awareness of technological risks helps the citizens’ organizations to gain greater influence on political and industrial decision makers. 3.1.1 Development of Energy Demand Growing concerns about the environmental and social impacts of unsustainable energy consumption and production, have turned energy and transport into “hot” political questions. What used to be “captive” and “passive” final consumers are now main actors in energy policies both on the demand and on the supply side, stimulating residential energy production. Most housing communities are advised by a local energy expert, who usually also lives in the same building and has participated in training courses offered by the local or regional energy agencies. Traffic reduction measures and well-functioning public transport are considered essential elements of quality of life in urban areas by a large majority of the inhabitants. It has been obvious ever since the beginning of the century that efficiency improvements in motorized vehicles would not been sufficient to cope with overall emission increases, and that the longer-term solution would require converting the European vehicle fleet to less polluting fuels. The first major changes took place in captive fleets (urban buses, fishing fleets, agricultural vehicles and similar), which now use those substitute fuels that can be produced regionally at the lowest cost. Biofuels, mixed fuels, natural gas and hydrogen are all valid options during the present transition period. Yet, in order for biofuels to reach a market share of 25% in European road transport, major efficiency improvements in the vehicle fleets had to be achieved, while, at the same time, transferring important freight volumes to railway carriers. Motorized passenger transport has increasingly been slowed down by traffic congestion problems in urban areas and pan-European transit routes, so that alternative transport modes have become more interesting for the final user. The motorized car park started to decrease from 2020 on. Increased costs of fuels derived from fossil sources have made versatile hybrid solutions attractive for industry and users of hybrid cars, while these have preferential treatment in
EurEnDel – Scenarios Report, May 2004 18
inner city areas. Versatile fuel cell vehicles now play a major role in all European countries. The political priority of transferring a major share of freight transport in Europe led to the corresponding investments in the modernization of railway networks during the first two decades of the century. The priorities set by the regulator improved the railways’ competitiveness, although major efforts by the companies were also required in order to offer the necessary service quality in terms of speed and client orientation. Interoperability of the systems was then further enhanced through common ICT-interfaces, increased vocational training for employees and by establishing freight routes of excellence between destinations, which were most severely affected by road traffic saturation. Distribution of the growing freight volumes and the transfer of containers to trucks for final delivery remained a problem until the railway networks were linked to intermodal transport centres outside the large urban areas. As a result of these combined efforts railways were again transporting 15% of freight volumes in 2020. Electricity-intensive industries, which require high-quality power (with high IT and nanotechnology components), maintain their most crucial production activities in world regions with excellent energy service conditions. Industry has been able to reduce energy input per produced unit by 50% since the beginning of the century, introducing novel and more efficient production processes. Energy efficiency also increases in the service sector and in household appliances, in compliance with Europe-wide efficiency standards, and due to the increased use of intelligent demand-side management systems with integrated response to hourly price fluctuations by heavy energy users in the service sector, such as hotels. Inefficient uses of electricity in this client segment for thermal uses and refrigeration, such as heating, hot water and air-conditioning, are increasingly substituted by solar-thermal appliances, since the solar industry has managed to set up an ample network of providers and maintenance companies, offering long-term guarantees and financing opportunities. These trends also benefit residential customers in the medium term, thus slowing down the growth of electricity demand in this sector. Green products gain important market shares, whenever they are supported by independent analysis of consumer organisations and the company, which produces and / or distributes these goods, has a credible record of environmental performance. Clear and easy labelling, which reflects the product’s environmental performance over the total life-cycle, as well as the compliance of other sustainability criteria by the producer makes it possible for the consumer to “make the right choices”. It also obliges the producers to make their production processes and the source of prime materials more transparent. Companies responsible for major accidents or continued environmental impacts can hardly survive in the market. These consumer preferences for green products and services are also evident in the energy retail sector, which is now dominated by suppliers specialized on renewable energies and community-oriented municipal companies.

EurEnDel – Scenarios Report, May 2004 19
Change of paradigm
Key Drivers Climate concerns: High political priority
/ long-term impact mitigation
Sustainable Development:
High political priority
Petroleum future:
“Save the World” (New paradigm)”
Mainstreaming ecology:Effective
institutional cooperation in environmental
policy
Gas future:“Save the gas
for future generations”
Determinants High perception of technological
riskin society
Pathways (instruments)
Transport
Energy demand
Supply
Transport & Storage
Social & technological
innovation
T1. Strong active public involvement in
energy policies
Q1. Rapid efficiency increase of the entire energy chain through
technological progress
I1. Hybrids take over
L3. Increased efficiency in all energy uses in
buildings
O1. From pipelines to LNG – until
2010
G1. Smooth, accelerated transition to renewable
energies
J1. Fuel mix: biofuels, gas and hydrogen for niche
markets
K1. Railways improve and resist
L1. Accelerated shift towards electricity use and increased energy
efficiency:
M1. High tech, electricity-fuelled
European economy and high production levels
N1. Good-bye to nuclear without extension of
useful life
N2. Nuclear revival
P1. Secure and highly efficient interconnections in Europe,
optimised distribution
H2. Hydrogen part of the energy system and produced both
locally and in large centralized facilities
R1. Growth chances for the
3rd World
S2. Green products are the
norm, not the exception
Graph 3-1: Schematic display of hypothesis from which the scenario Change of Paradigm
was constructed. Note: Grey boxes indicate hypothesis which are not included within the scenario, but which have a similar probability. These Hypothesis could substitute those hypothesis linked to by red arrows (mutually exclusive). See also comments to the Scenario; p 22

EurEnDel – Scenarios Report, May 2004 20
Development of Energy Supply Up until 2010, increasing import dependency led to heavy infrastructure investment, with special attention to more versatile LNG facilities and transport capacities. At this point, the increasing world demand and the negative perspective for the development of major new reserves turned these large-scale investments too risky and private investors started to back out, so that only the already initiated projects for connections with the CIS countries were actually carried out. Nowadays, the convergence of innovations in the field of material research, ICT, power electronics and other research fields works in benefit of a much higher level of efficiency in the entire energy chain, achieving an overall yearly improvement of 3%. Advances are especially important in renewable energies with the highest potential of efficiency improvements and cost reduction. Environmental impact studies on new materials and technologies are carried out prior to their introduction into the mass market. Unresolved safety and waste problems, together with low public acceptance led to political rejection of nuclear during the first decade of the century. Without public/state backing, private investments in new plant designs were considered too risky because of high capital costs. Existing plants have been shut down as they reached the end of their projected life span, and extension of useful life is not contemplated anymore. Development of fusion has long been discarded for cost reasons. As a result, the nuclear industry’s main focus shifted to the dismantling of power plants at the end of their useful life, while R&D efforts over the last decades have been exclusively centred on safe waste management, long-term storage technologies and on shielding existing reactors against terrorist attacks. Europe has well prepared the way towards a non-fossil-fuel based economy. All regions have thoroughly accessed the maximum potential of the different sources, taking into account the limits of sustainable growth in each sector. The basic concept for the development of new energy technologies is that of reducing or eliminating inefficient transformation processes and offering integrated, user-friendly solutions to the final customer. Wind power is, at the moment, the greatest contributor to electricity production besides large hydro. Biomass is mainly used for heating processes and some trigeneration facilities in regions with limited potential. On-shore wind farms have been fully developed, while off-shore capacity had to be planned carefully in order to avoid conflicts with other uses of the coastal zones and thus maintain options for low impact wave and ocean power plants, which are now reaching technical maturity. Incremental improvements in the solar industry, the reduction of silicon-content, as well as the development of integrated systems for buildings are now turning the solar industry into the key factor for Europe’s future energy supply. PV is close to reaching the threshold of a 5% market share in electricity production. As soon as the industry has developed a well-trained, customer-oriented supply chain, Europe will be entering a new energy era.

EurEnDel – Scenarios Report, May 2004 21
Development of Carrier Technologies and Electricity Grids From 2020 on, the European countries and companies undertake heavy investments in order to increase the transport capacity of the high-voltage international connections, after having concentrated during the first two decades on solving the bottlenecks in the distribution network and on putting the largest part of the urban networks underground. In view of siting problems for new transmission lines, the emphasis is placed on increasing the capacity of the existing infrastructure within Europe by means of new superconductive cables and on extending the modernized grid to neighbouring countries. New emission standards and large-scale R&D have paved the way for the introduction of hydrogen to the energy system, adding production and distribution facilities to the existing fossil-based infrastructure. Nowadays, hydrogen is considered a potential competitor to electricity through the use of fuel cells, especially in smaller, remote communities, although it is not yet price competitive on a large scale with traditional energy carriers. Production takes place in central power stations (wind, gas and possibly nuclear) as well as on-site (mainly wind and solar). Most of the hydrogen is produced from CO2-free sources, because its main competitive advantages are clean end use, versatility and its contribution to security of supply. Hydrogen is also an important storage medium for intermittent electricity production from renewable energy sources, such as wind and solar, and thus has allowed RES to attain high market shares of electricity production in Europe. Although security aspects related to hydrogen use have been taken care of, other environmental threats, which have so far been widely neglected, are now becoming visible, mainly due to small, but continuous leakages. It should be noted that this scenario is the one which is most likely to comply with one of the key messages obtained from the EurEnDel Delphi Survey regarding the decentralization of energy production in Europe through residential production and other distributed generation: In view of siting problems for all larger generation facilities, the electricity generation capacity of buildings is increasingly exploited. Larger commercial buildings use most of their own production, but a large share of residential production is fed into the grid. Nowadays, more than one third of Europe’s electricity production takes place in distributed generation facilities.

EurEnDel – Scenarios Report, May 2004 22
Comment to the scenario:
Alternative Pathway for Demand / Supply Options It should be noted that the “Change of Paradigm” scenario would permit to phase out nuclear production in Europe, but only under the condition that future electricity demand is also drastically reduced. Otherwise, the most likely option would be the continued use of nuclear power plants, in order to make up for reduced fossil fuel use. In methodological terms the two alternative combinations of factors are almost equally probable. Therefore an alternative “Change of Paradigm” scenario could be sketched including a “revival of nuclear energy” The table below shows this second most probable combination of demand and supply factors. The table has to be interpreted the following way: Instead of the hypothesis L3 and N1 (which are incorporated into the Change of Paradigm scenario) the hypothesis L1 and N2 could be used to draw an alternative scenario (see also Graph 3-1).
Hypothesis used in the Change of Paradigm scenario
L3. Increased efficiency in all energy uses in buildings Energy efficiency increases both in the service sector and in household appliances, in compliance with Europe-wide and national efficiency standards, but also due to the increased use of intelligent demand-side management systems with integrated response to hourly price fluctuations by heavy energy users in the service sector, such as hotels. Inefficient uses of electricity in this client segment for thermal uses and refrigeration, such as heating, hot water and air-conditioning, are increasingly substituted by solar-thermal appliances, once the solar industry has managed to set up an ample network of providers and maintenance companies, offering long-term guarantees and financing opportunities.
These trends also benefit residential customers in the medium term, thus slowing down the expected increase of electricity demand in households.
N1. Good-bye to nuclear w/o extension of useful life Unresolved safety and waste problems, together with low public acceptance lead to political rejection of nuclear during the first decade of the century.
Without public/state backing, private investments in new plant designs are too risky because of high capital costs and investors back out. Existing plants are shut down as they reach the end of their projected life span. Extension of useful life in existing plants is not contemplated.
Development of fusion is discarded for cost reasons. The nuclear industry’s main focus shifts to the dismantling of power plants at the end of their useful life, while R&D efforts are exclusively centred on safe waste management, long-term storage technologies and on shielding existing reactors against terrorist attacks.
Hypothesis for alternative scenario

EurEnDel – Scenarios Report, May 2004 23
L1. Accelerated shift towards electricity use and increased energy efficiency
N2. Nuclear revival
The reduced overall energy demand in the most advanced of the newly constructed residential buildings, which require less than 20% of the energy consumption in existing buildings, leads to the come-back of electricity also for heating purposes in the form of efficient heat pumps or exergy systems. Lone-standing, passive residential buildings can exclusively rely on this source of energy, thus eliminating the costs of network connections for gas. For larger building blocks and commercial centres, the production of electricity for own consumption and for feed-in to the back-up network is the most interesting solution.
The solution for increasing energy consumption in regions with a slow turnover rate in buildings lies in the retrofitting of existing commercial and residential buildings with versatile solar-thermal and photovoltaic systems, which reduce electricity and gas consumption for heating and hot water, while, at the same time, covering most of the additional demand derived from the increased use of air-conditioning in commercial and residential buildings. Contracting arrangements and demand-side management techniques are increasingly used in both the service and the residential sectors in order to facilitate these retrofitting processes.
Electricity use is furthermore enhanced by the increased demand for comfort among residential customers. The ageing European society claims appropriate heating and cooling appliances. The improved interface of domestic electrical appliances makes it easier for elderly people to benefit from technological progress.
Supply problems lead to a political and (reluctant) public acceptance of nuclear as a carbon free energy source. Carbon taxes and state support of investments in nuclear makes the technology competitive with acceptable return to investors and leads to a doubling of world nuclear capacity by 2030 to 650 GWe. The increased nuclear capacity helps to restrain CO2 emissions increase worldwide.
In EU-25 nuclear production slightly increases its market share with respect to 2000, thanks to the construction of new light water reactors such as EPR in those countries, which decided at the beginning of the century against the phase-out of nuclear.
Waste is now handled as once-through cycle inside the EU, and final deposit sites were been opened in all European countries with nuclear production in the second decade.
Nuclear fusion has not reached a commercial stage yet, but ITER progresses as planned, thus fusion is still considered an option for the medium term future (after 2050).
Table 3-1: Alternative supply/demand options in scenario “Change of Paradigm”
Quantitative CO2 emission classification of the “Change of Paradigm” scenario: With the CO2 reduction to 1990 levels by 2012, the Kyoto protocol is not complied with domestically, but by means of the flexible mechanisms. The CO2 reduction by 1.5% annually later on is equivalent to a 25% reduction by 2030 compared to 1990. With this setting, the „Change of Paradigm“ scenario is far more optimistic in terms of CO2 reduction than the quantitative „With Climate Policies“ reference scenario [Zeka-Paschou 2003] used in the quantitative co-assessment of the EurEnDel project (cf. [Jörß and Wehnert 2004].

EurEnDel – Scenarios Report, May 2004 24
3.2 Fossil Fuel Wars
The second combination stands for a crisis scenario, in which climate change concerns play a minor role when defining priorities for energy policies. Conflicts between the different interest groups prevail on European, as well as on national levels. Economic, social and environmental policy goals are difficult to integrate and there is a general lack of willingness among companies and citizens to bear the increasing costs of environmental protection.
There is little progress towards sustainability in Europe, due to a lack of consensus, not only on international level, but also within the European Union. In the absence of decisive measures to promote energy efficiency and alternative sources, there is a strong likelihood of armed conflicts caused by the desire to control the remaining reserves of oil and gas. The financial system is in turmoil and international trade barriers appear very soon and strong. Europe is not yet a true federal union and finds itself in a very weak position in this game. It is witnessing, disoriented, the great Chino-American war. Growing energy demand in the rapidly developing countries, primarily China, put a strain on oil and gas markets. The US maintains the grip on a large part of the available resources, using, when necessary, military pressure, while Europe concentrates its efforts on stabilizing its main supplier regions and developing strong multilateral ties. In this crisis situation, the perception of technological risk is not a prime concern in the population. Rising consumer prices in Europe make it difficult for consumers to acquire higher-priced green products. Consumer confidence in environmental labels has suffered several setbacks since the beginning of the century, especially in the South of Europe. In the past, a number of leading companies in the market intended to use the “eco-trend” for the selective marketing of products and services, which did not comply with ecological standards, and even less with sustainability criteria. European auditors finally discovered these practices, but so far it has not been possible to restore consumers’ confidence. Only products with environmental benefits that are evident to the customer or which present an economic and ecological win-win situation, for example efficient electrical applications or cars with reduced gasoline consumption, keep gaining market shares. The public considers that energy consumption and production are important issues, but concerns about security of supply and the increase of energy and transport-related household expenses have shifted the public’s focus from environmental to social and economic concerns. Energy-saving measures are highly appreciated, but final consumers feel that they have little influence on questions related to European energy policy and its environmental consequences. This perception of “lack of alternatives” is especially strong among tenant households or residents in rural areas, which see little scope of action even on local level. From the beginning of the century energy supply responded to a strongly rising demand, while the signals of depleting reserves were camouflaged by

EurEnDel – Scenarios Report, May 2004 25
conflicting interests. Because of this, the prevailing attitude until 2020 was that there was no need for urgent action neither in the fields of supply nor demand. As a result, tensions mounted unexpectedly as few tools were available to cope with the tightening supply situation. Societies and their political leaders had been caught unprepared and were unwilling to admit responsibility or to change. Now, the World is in an extremely difficult situation – moving away from solidarity while the rule of force spreads, fuelling a military rearmament. The Kyoto Agreements never got to be implemented on international level. CO2 emissions are now 14% higher than in reference year 1990 and 18% higher than in 2000. Different techniques of CO2 sequestration were introduced on a larger scale from 2015 on. But since climate issues were already low on the agenda at that time the efforts in this direction were not intensified. Despite the showing of more and more severe signs of the climate change, the strategy is to cope locally with the consequences rather than to globally address the cause. The focus of concern is energy supply. Any traditional solution or fuel has to be drawn upon, no matter its longer-term implications and 3rd World countries (and the 1st to some extent, too) look for coal development. The strategic areas for production and the pipes/terminals for the transport of hydrocarbons are of paramount importance for maintaining a minimum level of security of supply. Natural gas continues to substitute petroleum in Western Europe. Heavy investments in transport routes, LNG facilities and large underground storage facilities, located partly in the transit countries, make it possible for Europe to triple consumption rates until 2030. In order to guarantee return on investments, the European Union establishes strong political and economic ties with the CIS states, the African producer countries, as well as the transit countries. Research has concentrated on the reduction of transport costs and the future use of the infrastructure created for gas transportation, storage and distribution. Yet, political and social unrest rises, bringing to light the vulnerability of energy infrastructures.

EurEnDel – Scenarios Report, May 2004 26
Fossil fuel wars
Key Drivers Climate concerns: Low political priority
Sustainable Development:
Low political priority
Petroleum future:
“A call to arms” (Breaking down
the system)
Mainstreaming ecology:
Lack of consensus on
institutional level
Gas future:“War over gas”
Determinants Low perception of technological
riskin society
Pathways (instruments)
Transport
Energy demand
Supply
Transport & Storage
Social & technological
innovation
T2. Limited active public involvement in
energy policies
Q2. Tech progress with limited impact on
the energy system
I3.FC vehicles lack infrastructure
L2. Slow shift to increased electricity
use in buildings
O2. No alternative to gas
G2. Late, large-scale development of
renewable energies
J2. Energy crops not for transport
K1. Railways improve and resist
M2. Limited efficiency gains due to structural changes and
lower production levels
M1. High tech, electricity-fuelled
European economy and high production levels
N2. Nuclear revival
P1. Secure and highly efficient interconnections in Europe,
optimised distribution
H2. Hydrogen part of the energy system
R2. Global competition for
remaining energy reserves
S1. Green products still
confined to niche markets
H1. Slow development of hydrogen infrastructure and decentralized production
G3. Renewable energies in some countries
I2. Fuel cell boom – towards the hydrogen economy
Graph 3-2: Schematic display of hypothesis from which the scenario Fossil Fuel Wars was
constructed. Note: Grey boxes indicate hypothesis which are not included within the scenario, but which have a similar probability. These Hypothesis could substitute those hypothesis linked to by red arrows (mutually exclusive). See also comments to the Scenario; p. 29:
The main feature of this scenario – the lack of long-term planning and preparedness – is reflected in the development of energy demand and supply. Research priorities in the key technologies have not explicitly contemplated progress in energy efficiency or renewable energies, but have been much more centred on the mass production of consumer goods and on substituting costly

EurEnDel – Scenarios Report, May 2004 27
raw materials. Technological progress in regard to energy efficiency has therefore not reached the critical 2% improvement per year in the 25 countries, which now form the European Union.
Development of Energy Demand Shifts on the demand side are occurring, but mainly driven by structural change: the large energy users have transferred part of their energy-intensive production processes to non-EU countries in order to lower production costs, thus provoking an overall reduction of industrial energy demand and lower production levels. Those economic activities, which now remain in Europe, are service-oriented (logistics management, design and similar) and mainly electricity-fuelled. The trend towards the service economy continues, also shifting energy uses towards electricity, but at a rather slow pace. Nowadays, the increased importance of electricity use (and cost) in industry turns investments in electricity saving more profitable and may eventually lead to a more sustained growth of demand in most companies. The turnover rate of residential buildings (old versus new construction, including restored buildings) is increasing in Central and East European countries, where the housing stock contains a high percentage of post-war buildings, while the turn-over rate in the Southern parts decreases after the end of the construction boom experienced at the beginning of the century. Construction norms in all countries oblige to reduce the new buildings’ energy consumption by 30% as compared to the standard housing stock built before the year 2000. With a 2% p.a. substitution rate for the building stock in EU 25, about 60% of the buildings have since been adapted to the new efficiency standards, bringing along an overall reduction of 20% in energy demand related to buildings. Since most of the savings measures aimed at reducing energy demand for heating, electricity has slowly gained higher overall market shares. The sector hardest hit by supply problems and price hikes for fossil fuel is transport. Freight transport by rail is actually recovering market shares, but motorized traffic can no longer rely exclusively on fossil fuels. The potential of energy crops in Europe, which can be exploited without major environmental impacts (monoculture), is too limited and therefore does not constitute a large-scale alternative for road transport. The crucial question for Europe is the pace of development of a parallel transport infrastructure based on hydrogen. FC cars have so far not reached a market share of 20%, due to the slow development of the hydrogen infrastructure. The transitional use of natural gas has been discarded, since the necessary investments in the conversion of the car fleet, increased dependence on imported gas, as well as price increases would have rendered this solution too risky. Hydrogen is presently being produced from both fossil sources (primarily gas and to a lesser extent coal) and renewable energy sources (wind, solar, biomass), but the latter form of decentralized production dominates. Biological processes for the production of hydrogen are still in the demonstration phase. Hydrogen is not yet produced in quantities that allows for a substitution of electricity or other energy carriers, nor for large-scale use in
EurEnDel – Scenarios Report, May 2004 28
transport. Nor is hydrogen used in power generation except as backup in remote areas or consumers, for which autonomous energy solutions are crucial (i.e. hospitals). Distribution on regional scale is generally carried out by road and rail in pressurized bottles, but some local pipeline networks exist.
Development of Energy Supply The national energy systems in Europe show large differences regarding the use of renewable sources. Some of the countries still maintain a considerable share of nuclear and fossil-based power stations, supplying baseload power also to the rest of the EU Member States, while others have long ago redirected research funds to promoting the efficient use of wind, biomass and solar thermal, thus considerably reducing investment costs. Technologies based on these energy sources are now competitive for peak load and in most thermal uses, but PV is still having problems for penetrating the market in countries with insufficient public subsidies. The serious supply problems experienced over the last decades led to a political and (reluctant) public acceptance of nuclear energy. State support for investments has made the technology competitive with acceptable return to investors and led to a doubling of world nuclear capacity to 650 GWe between 2000 and 2030. In EU 25, nuclear production has slightly increased its market share with respect to 2000, thanks to the construction of new light water reactors such as EPR in those countries, which decided against the phase-out of nuclear. Waste is now handled as once-through cycle inside the EU, and final deposit sites have been in place in all European countries with nuclear production since 2020. Nuclear fusion has not reached a commercial stage yet, but ITER progresses as planned, thus fusion is still considered an option for the medium term future (after 2050).

EurEnDel – Scenarios Report, May 2004 29
Comment to the scenario: Alternative Pathway for Renewable Energy Options In this scenario, a rapid, although rather late deployment of renewable energy systems also shows a very high degree of likelihood, according to the working group, which defined the scenario components, as well as the preferential combinations. This alternative is explained in more detail below.
Hypothesis G3
Late, large scale development of renewable energy technologies Although by 2015 it had already become more than evident to the European public and its political leaders that developing all types of renewable energies at accelerated speed is crucial for Europe’s future welfare, the lack of coordinated planning in the last decade is now rendering this transition process very difficult and causing serious supply disruptions in many regions. Emergency measures such as rapid retrofitting of all large on-shore wind parks and accelerated deployment of off-shore wind parks are necessary in order to guarantee low-cost electricity supply. Biomass is used both for heating and cogeneration processes, but there are already signs that the level of energy crop production cannot be extended much further without endangering vital soil and underground water resources in the producer regions. PV is still lacking behind in price and efficiency, but the technology is having a positive impact in those municipalities, which have promoted the use of this energy in buildings since the beginning of the century. In view of the scarcity of supply, Europe turns to financing large solar-thermal power plants in the sunniest parts of the continent and in Africa, in order to substitute electricity from gas and nuclear power plants in other parts of Europe, which pose a constant threat to security.
table 3-2: Alternative pathway for renewable energy technologies in scenario “Fossil Fuel Wars”
Quantitative CO2 emission classification of the “Fossil Fuel Wars” scenario: Compliance with the Kyoto protocol is no issue under the “Fossil Fuel Wars” scenario. The envisaged growth of CO2 emissions by 14% compared to 1990 until 2030 is in line with the quantitative “no-climate-policies” baseline scenario recently published by the European Commission [Mantzos et al. 2003] that was used in the quantitative co-assessment of the EurEnDel project (cf. [Jörß and Wehnert 2004].

EurEnDel – Scenarios Report, May 2004 30
3.3 Muddling Through Across the Gas Bridge The third combination of factors also implies a major drive towards sustainability, but assumes that long-term climate change impacts cannot be avoided. The transition process is slower and natural gas plays a key role as intermediary solution, not only in power generation, but also in transport.
CO2 emissions were reduced to 1990 levels by 2012 and then stabilized. In this transition period, flexible mechanisms were employed as a short-term solution. Still, long before 2030, climate change effects had become more evident in some regions and started to have affects on energy production and infrastructure, especially in coastal areas. Risk prevention measures have become inevitable and costs derived from climate change surge. Due to the increasing environmental pressures, sustainable development has high political priority in Europe and the different levels of administration cooperate in the major effort of reorienting policy goals towards societal values, which permit to share the remaining fossil fuel resources with the poorer nations. These prime goals for international policies receive broad support in the population. Yet, the World’s response to the combined challenge of depleting reserves and climate change impact has been rather late. Market initially responded to pressure from rising oil demand by producing even more, attuning oil supply to the World’s energy-hungry economy, in a huge replica of the “classic” 20th century Western model, now extended worldwide. Then, a combination of technology, investment and broad political consensus made it possible to keep production costs within limits, so that “the global” economic and social model is not severely compromised… in the short/medium term. But the outcome remains unclear, even grim, in the longer term. And that vision is broadly shared. Because signals of an ending era appear and are read correctly by most of the humankind. This, coupled with strong evidence (market, science…) of oil cycle ending, tend to hike oil prices up, and fosters development of energy conservation and much more efficient end-uses for energy, as well as changes in productive and even ordinary life patterns. A gradual -but strong- reduction in energy intensity helps Europe to gain time for a fundamental migration towards a new life style and economic system. A wave of economic dematerialization and the extension of the useful life of oil reserves frees economic resources and time to launch en masse new sources of primary energy. Finally, the role of oil will be just that of an expensive and much needed source for chemical compounds, in a market able to pay for it. Gas plays the wild card role for an evolutionary bridging from the oil to the next [low-carbon] era. Lacking some of the oil production restrictions and being more attractive economically as a solution for ancillary investments in the mid/down-stream (electricity generation, space heating…), competition on the demand side rises fast and strong under this scenario, even more so than for oil. Increased demand not only tends to push up the gas price (more, in relative terms, than for oil), but also the risk of interruptions.

EurEnDel – Scenarios Report, May 2004 31
For Europe, setting or securing storage will be of economic importance in a highly volatile gas market, and to smooth out non-structural outages, although is not a solution on the longer term. Access to long-term contracts is a possible solution for increased security of supply.
Development of Energy Demand The development of final energy demand, both overall and as related to transport, is similar to that described in “Change of paradigm”, with major improvements in energy efficiency in all sectors. In transport, FC cars and trucks fuelled with hydrogen have the highest market share of all “alternative” fuels & engines with strong growth rates. Natural gas fuel cells have an interim role, but decline after 2030, due to climbing prices. The growing cost of transport rendered “global sourcing” uncompetitive by the middle of the second decade, so that freight volumes are now growing slower than expected.
Development of Supply Again, the nuclear option is closely associated to halting (or not) the increase in electricity demand and a slow decline of nuclear power could be envisioned. The decline is due to low public and political support and thus precarious and risky investment opportunities. The unfavourable market conditions result in low R&D and continuous safety and waste problems. Nuclear is an option for a few, dedicated countries, which have decided to increase the existing reactors’ life span to at least 60 years. Shortage of skilled people, together with declining education and training has negative implications for the safe use of nuclear energy. Fusion has not made any essential progress and perspectives for commercial use diminish. Young researchers, perceiving the lack of professional perspective, have long stopped to enter the industry, so that the medium age of the scientific workforce is exceptionally high. Independently from the developments in the fields of nuclear, Europe is on its way to a smooth and accelerated transition towards renewable energy. The process is quite similar to the one described in “Change of Paradigm”. The share of renewable energy sources is smaller, but the also supply close to 20% of the energy needed in Europe, with large off-shore wind farms being the most important renewable source for electricity production and biomass playing a major role in centralized heating systems in the Northern part of Europe. Decentralised power generation has been a growing trend over the last 30 years. Especially small gas driven co-generation facilities contribute to the large share of decentralised power generation which makes up for more than one third of Europe’s energy production.
Development of Carrier Technologies and Electricity Grids Volatile fossil fuel prices increment the large energy-users demand for energy management and storage, and energy companies increasingly offer these services in the form of integrated facility management. Energy storage is the preferred concept for individual industrial users, and forms an integral part of the booming power quality market, while in larger industry parks, the facility

EurEnDel – Scenarios Report, May 2004 32
management concepts include versatile on-site generation facilities and the reuse of energy by-products derived from industrial processes (steam and heat). The efficient combination of available on-site energy sources, in combination with on-site conversion facilities for electricity production and storage facilitates the introduction of new, electricity-fuelled production processes. By 2030 hydrogen is not yet produced in a quantity that allows for a substitution of electricity or other energy carriers, nor for large-scale use in transport. In short, Europe reacts rather late to the peaking of oil production and is forced to use larger volumes of imported gas, exposing itself to serious risks of supply interruption. Due to increasing societal pressure for adopting low-risk technologies, Europe’s institutional leaders finally accept that ecological concerns must prevail in other policy fields. But in 2030, Europe is still caught in the middle of a transition process towards a more sustainable energy system.

EurEnDel – Scenarios Report, May 2004 33
Muddling Through
Key Drivers
Climate concerns: High political priority,
high impact
Sustainable Development:
High political priority
Petroleum future:
“A call to Darwin –
managing the end of the
petroleum era”
Mainstreaming ecology:Effective
institutional cooperation in environmental
policy
Gas future:“The gas bridge”
Determinants Low perception of technological
riskin society
Pathways (instruments)
Transport
Energy demand
Supply
Transport & Storage
Social & technological
innovation
T1. Strong active public involvement in energy policies
Q1. Rapid efficiency increase of the
entire energy chain through
technological progress
I2. Fuel cell boom – towards
the hydrogen economy
L3. Increased efficiency in
all energy uses in
buildings
O1. From pipelines to LNG – until 2010
G1. Smooth, accelerated transition to renewable energies
J1. Fuel mix: biofuels, gas and hydrogen for niche
markets
K2.Railways slowly recover market shares due to cost advantages
L1. Accelerated shift towards
electricity use and increased energy
efficiency:
M1 High tech, electricity-fuelled
European economy and high production levels
N3. Slow decline of nuclear power in most MS, but extension of
useful life for existing plants
P1. Secure and highly efficient interconnections in Europe, optimised
distribution
H2. Hydrogen part of the energy system and produced
both locally and in large centralized facilities
R1. Growth chances for the
3rd World
S2. Green products are the
norm, not the exception
H1. Slow development of hydrogen infrastructure and
decentralised production
N2. Nuclear revival
graph 3-3: Schematic display of hypothesis from which the scenario Muddling Through
was constructed. Note: Grey boxes indicate hypothesis which are not included within the scenario, but which have a similar probability. These Hypothesis could substitute those hypothesis linked to by red arrows (mutually exclusive). For explanation of hypothesis see annex.

EurEnDel – Scenarios Report, May 2004 34
Quantitative CO2 emission classification of the “Muddling Through Across the Gas Bridge” scenario: As in the “Change of Paradigm” scenario, the Kyoto protocol is not complied with domestically in the “Muddling Through Across the Gas Bridge” scenario, the CO2 emissions reaching 1990 levels by 2012. With the subsequent stabilisation of CO2 emissions at 1990 levels, Europe fails to engage in further domestic emission reduction for long term climate protection. The envisaged development of CO2 emissions is relatively close to the quantitative „With Climate Policies“ reference scenario [Zeka-Paschou 2003] used in the quantitative co-assessment of the EurEnDel project (cf. [Jörß and Wehnert 2004].

EurEnDel – Scenarios Report, May 2004 35
Annex 1. Hypotheses used in scenario process Contents – Hypotheses:
Impact of climate concerns: ........................................................................... 36 Political support for sustainable development................................................ 37
Petroleum War............................................................................................... 38 Supply interruption risk for gas....................................................................... 40
Mainstreaming ecology on a political level..................................................... 42 Regulatory support for RES........................................................................... 44
Upcoming hydrogen economy ....................................................................... 46 Continuous growth in the transportation sector.............................................. 48
Shift in energy demand towards electricity consumption ............................... 51 Advances in nuclear fission ........................................................................... 54
European access to gas reserves and storage.............................................. 56 Pan-European grid service provision ............................................................. 57 Material technology........................................................................................ 58
Globalizing economy and nationalizing society: changes in geopolitical balance .......................................................................................................... 59
Consumers choice as a political statement.................................................... 60 Active public involvement in environmental issues ........................................ 61
Decentralization of the electricity grid ............................................................ 62

EurEnDel – Scenarios Report, May 2004 36
Factor –
classification: Key drivers =
Preference / exclusion criteria
Associated Delphi
Statements
Reference data Hypothesis 1
Hypothesis 2 Hypothesis 3 Open Research Questions
Impact of climate concerns:
“The energy market will be strongly impacted by climate concerns. Clean technologies and energy efficiency measures will be supported Market for international trade of emission reduction units will develop. CO2 reduction units become a tradable commodity”
ST 18 CO2 capture and sequestration from fossil fuel power plants is in practical use
Baseline CO2 emissions are lower than EEA data (-15% in 1990 and approx. -11% in 2000). Projected emissions and carbon intensity of Baseline (2.2 t CO2 / toe GIC) would permit to increase gross inland consumption of energy by more than 18% and still comply Kyoto targets. If EEA emission data is used, GIC could only grow about 11% until 2030 under Baseline assumptions in order to comply with Kyoto.
A1. Low political priority CO2 emissions in 2030 are 14% higher than in reference year 1990 and 18% higher than in 2000 in EU25. Different techniques of CO2 sequestration lead to an overall reduction of CO2 emissions of 2% until 2010, but large amounts of CO2 emission allowances still have to be acquired by those Member States, who have not been able to comply with their national targets.
A2. High political priority / long-term impact mitigation CO2 emissions are reduced to 1990 levels by 2012. Efficiency measures are then starting to have a major effect on overall energy use and lowering the European’s economy carbon intensity. By attaching a carbon value to fossil fuel use, CO2 emissions in 2030 are 26 % lower in the EU15 and the New Member Countries
A3. High political priority / high impact CO2 emissions are reduced to 1990 levels by 2012 and then stabilized. In this transition period, flexible mechanisms are employed as a short-term solution. Still, climate change effects are becoming more evident in some regions and are also having effects on energy production and infrastructure, especially in coastal areas. Risk prevention measures are inevitable and costs derived from climate change surge.

EurEnDel – Scenarios Report, May 2004 37
Factor – classification: Key
drivers = Preference / exclusion criteria
Reference data Hypothesis 1B Hypothesis 2B Open Research Questions
Political support for sustainable development “Stricter emission and waste standards, obligation to increase share of renewables, obligation to decrease CO2 emission levels and to increase energy efficiency will be supported by strong environmental regulations Clean technologies will be supported by political decisions. Thus they will be able to stand the competition with traditional energy sources and will penetrate into the market. Regulations will also support the effective use of materials, so that Europe will improve its overall efficiency in resource use by a factor of four.”
Baseline: Energy intensity will fall to about 50% in all sectors, except for transport (approx. – 33%)
B1. Low political priority Factor 4 in resource efficiency (halving demand and doubling efficiency) cannot be achieved by 2030, due to lack of political consensus within Europe and on international level
B2. High political priority Europe 25 is on the way of achieving great progress in energy efficiency, due to a combination of political will, technological progress, structural changes in the economy and urgent environmental pressures

EurEnDel – Scenarios Report, May 2004 38
Factor – classification:
Determinant Ref. data Hypothesis 1
Petroleum War “Growing world demand for oil will surpass peak production capacities before 2030, provoking price increments and reducing the OPEC’s swing function. The leading powers will try to control the remaining resources politically and militarily, while the poorer countries, with less reaction capacity, will have to dedicate an ever larger share of their GDP to energy supplies, thus impoverishing even more. Their only short-term alternative consists in recurring to coal for power generation”
Total energy import dependency increases from 49.4% in 2000 to 67.8% in 2030, but supply risk is not considered
C1. “A call to Darwin – managing the end of the petroleum era” (Evolutionary, smooth transition) Market initially responds to pressure from rising oil demand by producing even more. Oil supply is then attuned to the World’s energy-hungry economy, in a huge replica of the “classic” XX-century Western model, now extended worldwide. Then, a combination of technology, investment and broad political consensus make it possible to keep production costs within limits, so that “the only” economic and social model is not severely compromised… in the short/medium term. But the outcome remains unclear, even grim, in the longer term. And that vision is broadly shared. Because signals of an ending era appear and are read correctly by most of the human kind. This, coupled with strong evidence (market, science…) of oil cycle ending, tend to hike oil prices up, and fosters, well in advance, development of energy conservation and much more efficient end-uses for energy, as well as changes in productive and even ordinary life patterns. A gradual -but strong- reduction in energy intensity gives enough time for a fundamental migration towards a new life & economic style. A wave of economic dematerialization and the extension of the useful life of oil reserves (because of much less demand) gives enough economic resources and time to launch en masse new sources of primary energy (renewables, fusion…). Finally, the role of oil is just that of an expensive and much needed source for chemical compounds, in a market able to pay for it. It is a race, which the most balanced and foreseeing will win.

EurEnDel – Scenarios Report, May 2004 39
Factor – classification:
Determinant Hypothesis 2 Hypothesis 3
Petroleum War “Growing world demand for oil will surpass peak production capacities before 2030, provoking price increments and reducing the OPEC’s swing function. The leading powers will try to control the remaining resources politically and militarily, while the poorer countries, with less reaction capacity, will have to dedicate an ever larger share of their GDP to energy supplies, thus impoverishing even more. Their only short-term alternative consists in recurring to coal for power generation”
C2. “Save the World” (New paradigm, false scare) A combination of evidence and public concern on climate change issues, and the strong will to avoid unsustainable models, trigger an aggressive and self-learning move towards much less [than today’s] energy intensity across all processes and countries. It is mostly a universal attitude, which seeps across all layers of societies and spheres of activity, and produces some kind of “democratic” initiative, summing up efforts by many and in many places. It is a long-term and no-disturb attitude. Instrumental to this is the wave of re-regulation of energy markets and the re-nationalization of many energy companies, among others (airways, steel…). As a result, an easing on demand pressure occurs, so that the year-count of oil reserves [on a falling demand] increase by so much that new options on the supply-side remain unexplored, as they are not so much needed any soon. It will be the next generations’ problem. By then, the World has learned to live with almost no oil. In the meantime, many new ways and technologies have received attention and financial support to develop: it’s a race the wittiest will win.
C3. “A call to arms” (Breaking down the system) As in hypothesis 1 (“A call to Darwin”), supply follows a strongly rising demand, much in the same pattern. The difference here is in the mindsets: the signals are camouflaged by conflicting interests and by the own market, as well as political and financial short-termism. So, the general attitude is that nothing is really needed neither in the fields of supply nor demand. As a result, tensions mount unexpectedly and so much faster and stronger that in “A call to Darwin”, but, in practice, one big difference is that tools are not developed, so that no alternative options are available. It is a no-way–out situation for the World. It got rid time ago of any precautionary principle. Solidarity is nil, and the rule of force spreads. In an “Orwell’s 1984” situation, political and social turmoil reign, as powers and societies are caught unprepared and unwilling to admit responsibility or to change. These very signals, instead of producing a reaction in some other direction, fuel a military rearmament and diplomacy, even decency, are erased from the political agenda. Nothing may work in the short term but brute force. And there is not longer term without surviving in the short: it is jungle rule. Kyoto is long forgotten, and 3rd World countries (1st to some extent, too) look for coal development. Any traditional solution or fuel helps, no matter its longer-term implications.
The financial system is in turmoil. Armies try to make out for the deficits, as a rule. International trade barriers appear very soon and strong.
Europe is not yet a true union and finds itself in a very weak position in this game. It is living, in misery and disoriented, the great Chino-American war, while Russian and Muslim axis let fly volleys at it, taking advantage of its eclecticism and weakness.
It´s a race the strongest will win.
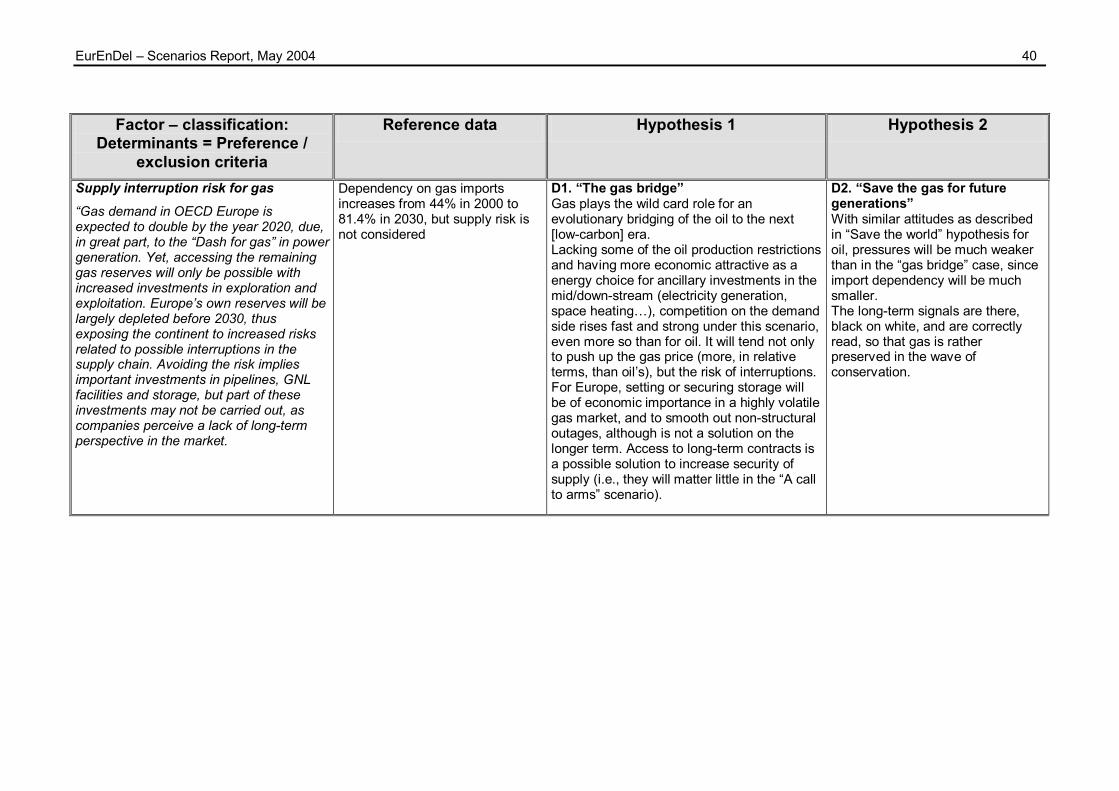
EurEnDel – Scenarios Report, May 2004 40
Factor – classification:
Determinants = Preference / exclusion criteria
Reference data Hypothesis 1 Hypothesis 2
Supply interruption risk for gas “Gas demand in OECD Europe is expected to double by the year 2020, due, in great part, to the “Dash for gas” in power generation. Yet, accessing the remaining gas reserves will only be possible with increased investments in exploration and exploitation. Europe’s own reserves will be largely depleted before 2030, thus exposing the continent to increased risks related to possible interruptions in the supply chain. Avoiding the risk implies important investments in pipelines, GNL facilities and storage, but part of these investments may not be carried out, as companies perceive a lack of long-term perspective in the market.
Dependency on gas imports increases from 44% in 2000 to 81.4% in 2030, but supply risk is not considered
D1. “The gas bridge” Gas plays the wild card role for an evolutionary bridging of the oil to the next [low-carbon] era. Lacking some of the oil production restrictions and having more economic attractive as a energy choice for ancillary investments in the mid/down-stream (electricity generation, space heating…), competition on the demand side rises fast and strong under this scenario, even more so than for oil. It will tend not only to push up the gas price (more, in relative terms, than oil’s), but the risk of interruptions. For Europe, setting or securing storage will be of economic importance in a highly volatile gas market, and to smooth out non-structural outages, although is not a solution on the longer term. Access to long-term contracts is a possible solution to increase security of supply (i.e., they will matter little in the “A call to arms” scenario).
D2. “Save the gas for future generations” With similar attitudes as described in “Save the world” hypothesis for oil, pressures will be much weaker than in the “gas bridge” case, since import dependency will be much smaller. The long-term signals are there, black on white, and are correctly read, so that gas is rather preserved in the wave of conservation.

EurEnDel – Scenarios Report, May 2004 41
Factor – classification: Determinants =
Preference / exclusion criteria Hypothesis 3 Open Research Questions
Supply interruption risk for gas “Gas demand in OECD Europe is expected to double by the year 2020, due, in great part, to the “Dash for gas” in power generation. Yet, accessing the remaining gas reserves will only be possible with increased investments in exploration and exploitation. Europe’s own reserves will be largely depleted before 2030, thus exposing the continent to increased risks related to possible interruptions in the supply chain. Avoiding the risk implies important investments in pipelines, GNL facilities and storage, but part of these investments may not be carried out, as companies perceive a lack of long-term perspective in the market.
D3. “War over gas” Under this hypothesis, gas has all the ingredients to be a fast-run movie of the oil history and its coming conflict: it mobilizes faster. A complement to the super-power deployment to control oil is seen on gas fields. So, the strategic areas for production and the pipes/terminals for its transport (not always coincident with oil) are of paramount importance. Parallel to this is the resource to unconventional warfare, political and social unrest and the rising vulnerability of the energy infrastructures. International alliances rest on security assurance and regional collaboration. Imperialism is the game once more.

EurEnDel – Scenarios Report, May 2004 42
Factor – classification:
Determinants = Preference / exclusion criteria
Hypothesis 1 Hypothesis 2 Open Research Questions
Mainstreaming ecology on a political level “There is a growing consensus that ecology is an important field of politics. The strengthening of ecological concerns will continue by implementing further political institutions. People do accept necessary means in favour of ecology if the burden is evenly shared (laws instead of personal austerity).”
E1. Effective institutional cooperation in environmental policy There is a growing consensus among all institutional levels that ecological values are guiding priorities in all fields of public policy. The principle of eco-efficiency is widely accepted and leads to active energy saving policies in the public and private sector. The European Commission and the national institutions work hand in hand to set up a legal framework, which promotes environmental excellence in companies and ecological consumption habits.
E2. Lack of consensus on institutional level Conflicts between the different interest groups prevail on European, as well as on national levels. Economic, social and environmental policy goals are difficult to integrate and there is a general lack of willingness among companies and citizens to bear the increasing costs of environmental protection.

EurEnDel – Scenarios Report, May 2004 43
Factor – classification:
Determinants = Preference / exclusion
criteria
Reference data Hypothesis 1 Hypothesis 2 Open Research Questions
The perception of technological risk in society “New technologies that are labelled to be risky, encounter a strong opposition. However, the danger potential of technologies perceived by the public is different from the actual (statistical) danger. This puts a high pressure on technologies that bear the risk of big disasters (nuclear power plant, oil tankers) and on technologies, which have negative local effects (toxic pollutions, smells, etc.). The perception of the risk potential differs very much in the individual member states and so does the further development and rate of application of those technologies.”
Risks, which individuals (wrongly or rightly) feel able to control, are more readily accepted than those, which place them in a situation of dependence. In Sweden, Finland and Germany the call for safer nuclear is three times as high as in Portugal or Spain.
F1. Low perception of technological risk The broad public is not too much worried about technological risks. Negative side effects are generally assessed vs. the benefits on an economic level.
F2. High perception of technological risk The general attitude towards new and existing technologies is very much governed by the “common sense” perception of technological risk in society. Consequently, technologies that are labelled to be risky, encounter a strong opposition. The strong public awareness of technological risks helps pressure groups to gain a big influence on political and industrial decision makers. In the focus of concern are technologies that bear the risk of big disasters (nuclear power plant, oil tankers) and on technologies, which have negative local effects (toxic pollutions, noise, smells, etc.). There is a big gap between the publicly perceived danger of technologies and the statistical danger (e.g. in casualties per year). Global and long-term issues (climate change, security of supply) get a high score on the agenda only if they can be connected to catastrophes (floods, blackouts, wars), which the media can present to the public as a personal threat.

EurEnDel – Scenarios Report, May 2004 44
Factor – classification: Instruments
(Regulating variable) Associated Delphi
Statements Reference data Hypothesis 1
ST 14 Renewable energy sources cover 25% of Europe’s total energy supply [Today it is 6%]
25% renewables of Gross Inland Consumption would mean 492 MTOE, but baseline projection for renewables is 169.6 MTOE
ST 15 Photovoltaic cells contribute with >5% of European electricity generation [Today it is 0.15%]
5% PV = 224 TWh (equivalent to about 25% of present nuclear production), substituting about 50 -100 MTOE of thermal electricity production
ST 16 Ocean technologies (e.g. tidal, currents, and wave) are in practical use
Regulatory support for RES “Strong support policy for RES will be continued” RES Investment cost “The investment costs for all renewables will drop but with different rates and in different timeframe The most significant decrease of investment costs will take place in case of emerging technologies such as biomass fuel cells or photovoltaic, the investment cost decrease will be less significant in case of technologies already well established in the market such as wind or hydro Although RES will experience significant investment, cost reduction is expected to become economically competitive with traditional energy sources after 2020.”
ST 17 Biomass for central heating and district heating systems is widely used
Biomass & waste as fuel inputs to Thermal Power Generation contribute 29.5 MTOE (5.35%)
G1. Smooth, accelerated transition to renewable energies Europe has well prepared the way towards a non-fossil-fuel based economy. All regions have thoroughly accessed the maximum potential of the different sources, taking into account the limits of sustainable growth in each sector. The basic concept for the development of new energy technologies is that of reducing or eliminating inefficient transformation processes and offering integrated, user-friendly solutions to the final customer. Wind power is at the moment, the greatest contributor to electricity production, while the use of biomass has been mainly limited to heating processes and some trigeneration facilities in regions with limited potential. On-shore wind parks have been fully developed, while off-shore capacity has to be planned carefully in order to avoid conflicts with other uses of the coastal zones and thus maintain options for low impact wave and ocean power plants, which are now reaching technical maturity. Incremental improvements in the solar industry, the reduction of silicon-content, as well as the development of integrated systems for buildings are the key improvements necessary to turn the solar industry into the key factor for Europe’s future energy supply. As soon as the industry has developed a well-trained, customer-oriented supply chain, Europe will be entering a new energy era.

EurEnDel – Scenarios Report, May 2004 45
Factor – classification: Instruments
(Regulating variable) Hypothesis 2 Hypothesis 3 Open Research
Questions Regulatory support for RES “Strong support policy for RES will be continued” RES Investment cost “The investment costs for all renewables will drop but with different rates and in different timeframe The most significant decrease of investment costs will take place in case of emerging technologies such as biomass fuel cells or photovoltaic, the investment cost decrease will be less significant in case of technologies already well established in the market such as wind or hydro Although RES will experience significant investment, cost reduction is expected to become economically competitive with traditional energy sources after 2020.”
G2. Late, large-scale development of renewable energies Although by 2015, it had already become more than evident to the European public and its political leaders that developing all types of renewable energies at accelerated speed is crucial for Europe’s future welfare, the lack of coordinated planning in the last decade is now rendering this transition process very difficult and causing serious supply disruptions in many regions. Emergency measures such as rapid retrofitting of all large on-shore wind parks and accelerated deployment of off-shore wind parks are necessary in order to guarantee low-cost electricity supply. Biomass is used both for heating and cogeneration processes, but there are already signs that the level of energy crop production cannot be extended much further without endangering vital soil and underground water resources in the producer regions. PV is still lacking behind in price and efficiency, but the technology is having a positive impact in those municipalities, which have promoted the use of this energy in buildings since the beginning of the century. In view of the scarcity of supply, Europe turns to financing large solar-thermal power plants in the sunniest parts of the continent and in Africa, in order to substitute electricity from gas and nuclear power plants in other parts of Europe.
G3 Renewable energies in some countries The national energy systems in Europe show large differences regarding the use of renewable energies. Some of the countries still maintain a considerable share of nuclear and fossil-based power stations, supplying baseload power also to the rest of the EU Member States, while others have long ago redirected research funds to promoting the efficient use of wind, biomass and solar thermal, thus considerably reducing investment costs. Technologies based on these energy sources are now competitive for peak load and in most thermal uses, but PV is still having problems for penetrating the market in countries with insufficient public subsidies.
Potential for biomass in EU 25?

EurEnDel – Scenarios Report, May 2004 46
Factor – classification: Instruments (Regulating
variable) Associated Delphi Statements Hypothesis 1
Upcoming hydrogen economy “Hydrogen storage weight and volume reductions, mass production of fuel cells, construction of the necessary infrastructure, and expanded use of portable and distributed power generation devices will sustain the momentum towards a hydrogen economy. Hydrogen will be still be produced from fossil fuels, but also from biomass and water using thermal, electric and photolytic processes. There will be a combination of central station and distributed hydrogen production facilities The hydrogen infrastructure network will evolve from the existing fossil fuel-based infrastructure and will accommodate both centralized and decentralized production facilities. Pocket-sized containers will provide hydrogen for portable telecommunications and computer equipment, small and medium hydrogen containers will be available for vehicles and on-site power systems, and industrial-sized storage devices will be available for power parks and utility-scale systems. Fuel cells will be mass-produced and will be cost-competitive and mature technologies. Advanced hydrogen-powered and reciprocating engines will be in widespread commercial use. Hydrogen will be available for all types of end-use energy demand in the economy, including transportation, power generation and portable power systems.”
ST 6a Hydrogen produced from diverse sources is used as an energy carrier constitutes a significant part of the energy system ST 6 b Hydrogen produced from renewable sources ST 19 Biological and bio-chemical production of hydrogen ST 7 Advanced energy storage technologies are widely used in renewable energy supply systems
H1. Slow development of hydrogen infrastructure and decentralized production Hydrogen is produced from both fossil sources (primarily gas and to a lesser extent coal) and RES (wind, solar, biomass), but the latter form of decentralized production dominates. Biological processes for the production of hydrogen are still in the demonstration phase.
Distribution on regional scale is carried out by road and rail in pressurized bottles and some local pipeline networks exist. Hydrogen production is not used in power generation except as backup in remote areas or clients, for which autonomous energy back-up is crucial (i.e.. hospitals). By 2030 hydrogen is not produced in a quantity that allows for a substitution of electricity or other energy carriers, nor for large-scale use in transport.

EurEnDel – Scenarios Report, May 2004 47
Factor – classification: Regulating variable Hypothesis 2 Open Research
Questions Upcoming hydrogen economy “Hydrogen storage weight and volume reductions, mass production of fuel cells, construction of the necessary infrastructure, and expanded use of portable and distributed power generation devices will sustain the momentum towards a hydrogen economy. Hydrogen will be still be produced from fossil fuels, but also from biomass and water using thermal, electric and photolytic processes. There will be a combination of central station and distributed hydrogen production facilities The hydrogen infrastructure network will evolve from the existing fossil fuel-based infrastructure and will accommodate both centralized and decentralized production facilities. Pocket-sized containers will provide hydrogen for portable telecommunications and computer equipment, small and medium hydrogen containers will be available for vehicles and on-site power systems, and industrial-sized storage devices will be available for power parks and utility-scale systems. Fuel cells will be mass-produced and will be cost-competitive and mature technologies. Advanced hydrogen-powered and reciprocating engines will be in widespread commercial use. Hydrogen will be available for all types of end-use energy demand in the economy, including transportation, power generation and portable power systems.”
H2. Hydrogen part of the energy system and produced both locally and in large centralized facilities New emission standards and large-scale R&D have paved the way for the introduction of hydrogen to the energy system, adding production and distribution facilities to the existing fossil-based infrastructure. Production takes place in central power stations (wind, gas, nuclear) as well as on-site (wind, solar, gas). Pipeline distribution exists where hydrogen is used in power generation for buildings etc.
Hydrogen is also an important storage medium for intermittent electricity production from RES, such as wind and solar, and thus has allowed RES to attain high market shares of electricity production in Europe.
By 2030, hydrogen is considered a potential competitor to electricity through the use of fuel cells, especially in smaller, remote communities or isolated grids.
Most of the hydrogen is produced from CO2-free sources, because it’s main competitive advantages are clean end use, versatility and it’s contribution to security of supply, but it is still not price competitive with traditional energy carriers, except for niche markets, such as small portable devices, remote communities and isolated grids.
The increasing use of hydrogen leads to small, but continuous leakages, which are starting to affect the environment negatively.
Environmental effects of the hydrogen cycle (leakages)

EurEnDel – Scenarios Report, May 2004 48
Factor –
classification: Instruments (Regulating
variable)
Associated Delphi
Statements
Reference data Hypothesis 1 Hypothesis 2 Hypothesis 3 Open Research Questions
Continuous growth in the transportation sector There is an overall growth of transport volume (passengers and goods). The growth and the resulting rise in energy demand are distributed unevenly: Growth in freight traffic will high, while passenger traffic will have smaller growth rates or even saturate for EU15.
ST3 Fuel cell driven cars reach a European market share of 20%
All reference documents assume that road transport (passenger and freight) as well as air traffic will increase, although decoupling from GDP growth will take place. Major changes in technologies are expected from 2020 on.
I1. Hybrids take over: Motorized passenger transport is increasingly slowed down by traffic congestion problems in urban areas and pan-European transit routes, so that alternative transport modes become more interesting for the final user. The motorized car park starts to decrease from 2020 Increased costs of fuels derived from fossil fuels make versatile hybrid solutions attractive for industry and users and have preferential treatment in inner city areas. Versatile FC play a major role by 2030.
I2. Fuel cell boom – towards the hydrogen economy FC cars and trucks fuelled with hydrogen have the highest market share of all “alternative” fuels & engines with strong growth rates. Natural gas fuel cells have an interim role but decline after 2030.
I3.FC vehicles lack infrastructure FC cars have not reached a market share of 20%, due to the slow development of the hydrogen infrastructure. The transitional use of natural gas has been discarded, since the necessary investments in the conversion of the car fleet, increased dependence on imported gas, as well as price increases would have rendered this solution too risky.

EurEnDel – Scenarios Report, May 2004 49
Factor – classification:
Regulating variable Associated
Delphi Statements
Reference data Hypothesis 1 Hypothesis 2 Open Research Questions
Continuous growth in the transportation sector There is an overall growth of transport volume (passengers and goods). The growth and the resulting rise in energy demand are distributed unevenly: Growth in freight traffic will high, while passenger traffic will have smaller growth rates or even saturate for EU15.
ST4 Bio-fuels will have a European market share of >25% in the road transport sector
Baseline assumes the following market share for biofuels in 2030: 5.1% of gasoline consumed in 2030 (2.0% in 2010) and 5.3% of diesel oil consumed in 2030 (2.4% in 2010). This market share is however dependent on overall demand increase, which is supposed to slow down after 2020. Under Baseline assumption, a 25% share of biofuels would suppose 90.9 MTOE.
J1. Fuel mix: biofuels, gas and hydrogen for niche markets Efficiency improvements in motorized vehicles are not sufficient to cope with overall emission increases, so that the process of converting the European vehicle fleet to less polluting fuels has to be taken on over the first decades of the century. The first major changes will take in captive fleets (urban buses, fishing fleets, agricultural vehicles and similar), which will use those substitute fuels, which can be produced regionally at the lowest cost. Biofuels, mixed fuels, natural gas and hydrogen are all valid options during this transition period. Yet, in order for biofuels to reach a share of 25% in European road transport by 2030, major efficiency improvements in the vehicle fleets must be achieved, while, at the same time, transferring important freight volumes to railway carriers.
J2. Energy crops not for transport The potential of energy crops in Europe, which can be exploited without major environmental impacts (monoculture), is too limited and therefore does not constitute a large-scale alternative for road transport. The market share will therefore remain far below the 25% threshold

EurEnDel – Scenarios Report, May 2004 50
Factor – classification: Instruments (Regulating
variable)
Associated Delphi
Statements
Reference data
Hypothesis 1 Hypothesis 2 Hypothesis 3 Open Research Questions
Continuous growth in the transportation sector There is an overall growth of transport volume (passengers and goods). The growth and the resulting rise in energy demand are distributed unevenly: Growth in freight traffic will high, while passenger traffic will have smaller growth rates or even saturate for EU15.
ST 5 Improved logistics based on ICT raise the railway's market share in Europe's freight transport to 15% [1990: 11%, today: 8%]
Baselines parts from different market shares, since it does not consider short sea transport. The model anticipates a 6% decrease in market share between 2000 and 2030
K1 Railways improve and resist The political priority of transferring a major share of freight transport in Europe leads to corresponding investments in the modernization of railway networks and the improvement of interoperability among the Member States and the Accession Countries. The priorities set by the regulator improve the railways’ competitiveness around 2010, although major efforts by the companies are also required in order to offer the necessary service quality in terms of speed and client orientation. Interoperability of the systems is enhanced through common ICT-interfaces, through increased vocational training for employees and by establishing freight routes of excellence between destinations, which are most severely affected by road traffic saturation. Distribution of the growing freight volumes and the transfer of containers to trucks for final delivery remains a problem until the railway networks are linked to intermodal transport centres outside the large urban areas
K2. Railways slowly recover market shares, due to cost advantages The growing cost of transport renders “global sourcing” uncompetitive by the middle of the second decade, so that freight volumes grow slower than expected. Thanks to cost advantages, railways are able to recover slowly, doubling their market share of 2000 by 2020.
K3. Railways can’t cope with freight transport increase Greater managerial skills of the privatised train operators cannot make up for insufficient investments in infrastructure or modal shift improvements. Railways keep losing market share to road and air transport. Increased reliance on these transport means obliges these industries to improve fuel efficiency largely over the next decades.

EurEnDel – Scenarios Report, May 2004 51
Factor – classification:
Instruments (Regulating variable)
Associated Delphi
Statements
Reference data Hypothesis 1
Shift in energy demand towards electricity consumption “In general, energy demand will increase due to economic growth and improved welfare. Population development in Europe will be slow and will not significantly impact future energy demand. A strong substitution towards electric power will take place over the next 20-30 years, mostly on behalf of oil and solid fuels. A number of new gadgets and electric appliances will in general tend to increase future electricity demand
ST 2 Low-energy buildings with intelligent power systems make up >50% of all new buildings in Europe
The variable and the statement refer to energy demand and the market share of electricity. The Baseline assumes that the share of electricity rises from 19.6% (2000) to 24.2% (2030) and an overall increase of final energy demand of approx. 30% with respect to 2000. Relative saturation in EU 15 households, but inefficient use in Accession states A building’s lifetime is 100 years or more. Building substitution rates in EU 15 oscillate from 0.8 to 2% p.a. in residential buildings. Data referring to residential buildings in EU 15 in 1998 indicates the following trends: Average energy consumption per dwelling (with climate correction) has been roughly stable since 1991, at between 1.75 and 1.8 toe/dwelling, but taking a longer reference period (1985 to 1997), we detect a slight decline of about 4%. (Residential) dwellings built today need 22 % less energy for space heating than those built in 1985. Compared to 1990, the resultant energy saving is 18%. Increase in electricity consumption for the big appliances is slowing down. Their average specific consumption is decreasing since 1992 at a rate of 1.5%/year Little data available on commercial premises of more than 1000 m2.
L1. Accelerated shift towards electricity use in buildings The reduced overall energy demand in the most advanced of the newly constructed residential buildings, which require less than 20% of the energy consumption in existing buildings, leads to the come-back of electricity also for heating purposes in the form of efficient heat pumps or exergy systems. Lone-standing, passive residential buildings can exclusively rely on this source of energy, thus eliminating the costs of network connections for gas. For larger building blocks and commercial centres, the production of electricity for own consumption and for feed-in to the back-up network is the most interesting solution.
The solution for increasing energy consumption in regions with a slow turnover rate in buildings lies in the retrofitting of existing commercial and residential buildings with versatile solar-thermal and photovoltaic systems, which reduce electricity and gas consumption for heating and hot water, while, at the same time, covering most of the additional demand derived from the increased use of air-conditioning in commercial and residential buildings. Contracting arrangements and demand-side management techniques are increasingly used in both the service and the residential sectors in order to facilitate these retrofitting processes.
Electricity use is furthermore enhanced by the increased demand for comfort among residential customers. The ageing European society claims appropriate heating and cooling appliances. The improved interface of domestic electrical appliances makes it easier for elderly people to benefit from technological progress.

EurEnDel – Scenarios Report, May 2004 52
Factor – classification:
Instruments (Regulating variable)
Hypothesis 2 Hypothesis 3 Open Research Questions
Shift in energy demand towards electricity consumption “In general, energy demand will increase due to economic growth and improved welfare. Population development in Europe will be slow and will not significantly impact future energy demand. A strong substitution towards electric power will take place over the next 20-30 years, mostly on behalf of oil and solid fuels. A number of new gadgets and electric appliances will in general tend to increase future electricity demand
L2. Slow shift to increased electricity use and limited efficiency gains in other energy uses The trend towards the service economy continues, also shifting energy uses towards electricity, but at a rather slow pace.
The turnover rate of residential buildings (old versus new construction, including restored buildings) increases in Central and East European countries where the housing stock contains a high percentage of post-war buildings, while the turn-over rate in the Southern parts decreases after the end of the construction boom experienced at the beginning of the century.
Construction norms in all countries oblige to reduce the new buildings’ energy consumption by 30% as compared to existing ones. Estimating a 2% p.a. substitution rate for the building stock in EU 25, about 60% of the buildings would be adapted to the new efficiency standards, bringing along an overall reduction of 20% in energy demand related to buildings. Since most of the savings measures aim at reducing energy demand for heating, electricity slowly gains higher overall market shares.
L3. Increased efficiency in all energy uses in buildings Energy efficiency increases both in the service sector and in household appliances, in compliance with Europe-wide and national efficiency standards, but also due to the increased use of intelligent demand-side management systems with integrated response to hourly price fluctuations by heavy energy users in the service sector, such as hotels. Inefficient uses of electricity in this client segment for thermal uses and refrigeration, such as heating, hot water and air-conditioning, are increasingly substituted by solar-thermal appliances, once the solar industry has managed to set up an ample network of providers and maintenance companies, offering long-term guarantees and financing opportunities.
These trends also benefit residential customers in the medium term, thus slowing down the expected increase of electricity demand in households.
Impact of Directive for newly built or renovated buildings of more than 1000 m2 is difficult to estimate. Substitution rate of the entire building stock is unclear.
Impact of large-scale technology breakthroughs such as ICT on different energy uses? What more to come in the next decades?

EurEnDel – Scenarios Report, May 2004 53
Factor –
classification: Instruments (Regulating
variable)
Associated Delphi
Statements
Reference data
Hypothesis 1 Hypothesis 2 Open Research Questions
Shift in energy demand towards electricity consumption
ST 1 Industrial energy consumption in Europe is reduced by 50% per produced unit through novel production processes
The variable and the statement refer to energy demand and the market share of electricity. Baseline establishes that energy intensity in industry declines from 181 toe/M€ (2000) to 112 toe/M€ (2000) in 2030, i.e. an average intensity gain of 1.6% pa. or an accumulated 38%.
M1. High tech, electricity-fuelled European economy and high production levels
Electricity-intensive industries, which require high-quality power (with high IT and nanotechnology components), maintain their most crucial production activities in world regions with excellent energy service conditions.
Volatile fossil fuel prices increment the large energy-users demand for energy management and storage, and energy companies increasingly offer these services in the form of integrated facility management. Energy storage is the preferred concept for individual industrial users, and forms an integral part of the booming power quality market, while in larger industry parks, the facility management concepts include versatile on-site generation facilities and the reuse of energy by-products derived from industrial processes (steam and heat). The efficient combination of available on-site energy sources, in combination with on-site conversion facilities for electricity production and storage facilitates the introduction of new, electricity-fuelled production processes, while, at the same time, reducing overall consumption of energy per produced unit by 50%.
M2. Slow shift to increased electricity use and limited efficiency gains in other energy uses due to structural changes and lower production levels The large energy user transfer part of their energy-intensive production processes to non-EU countries in order to lower production costs, thus provoking an overall reduction of industrial energy demand and lower production levels. Those economic activities, which remain in Europe, are service-oriented (logistics management, design and similar) and mainly electricity-fuelled. At the end of the period, the increased importance of electricity use (and cost) in industry turns investments in electricity saving more profitable, thus leading to a more sustained growth of demand in most companies.

EurEnDel – Scenarios Report, May 2004 54
Factor – classification: Instruments
(Regulating variable) Associated Delphi
Statements Reference data Hypothesis 1
Advances in nuclear fission “Development of safer and more efficient reactor types, such as the European pressurized water reactor, EPR, the Siemens boiling water reactor SWR-1000, and Westinghouse's AP600, Common features for the three designs are: The use of passive safety components, i.e. components which do not need external energy sources in order to function when called for, thus improving the mitigation of possible accidents Improved energy efficiency as compared to the nuclear power plants existing today Operational lifetime designed for 60 years rather than the 30-40 years common for existing plant Doubling the life time of existing nuclear plants “Extending the lifetime of existing types of nuclear power plants from the original design values of 30-40 years to 60 years or more. In the USA the first power plants have been licensed to 60 years of operation, and in Japan the possibilities for extending plant life up to 120 years are being investigated.”
ST 13 Nuclear power plants based on passive safe reactor types are in practical use* ST 12 Plasma confinement technologies for nuclear fusion are in practical use
Nuclear production declines from 921.6 TWh (covering 14.4% of gross inland consumption) to 765.5 TWh (covering 9.4% of gross inland consumption) by 2030.
N1. Good-bye to nuclear w/o extension of useful life Unresolved safety and waste problems, together with low public acceptance lead to political rejection of nuclear during the first decade of the century.
Without public/state backing, private investments in new plant designs are too risky because of high capital costs and investors back out. Existing plants are shut down as they reach the end of their projected life span. Extension of useful life in existing plants is not contemplated.
Development of fusion is discarded for cost reasons. The nuclear industry’s main focus shifts to the dismantling of power plants at the end of their useful life, while R&D efforts are exclusively centred on safe waste management, long-term storage technologies and on shielding existing reactors against terrorist attacks.

EurEnDel – Scenarios Report, May 2004 55
Factor – classification: Instruments
(Regulating variable) Hypothesis 2 Hypothesis 3 Open
Research Questions
Advances in nuclear fission “Development of safer and more efficient reactor types, such as the European pressurized water reactor, EPR, the Siemens boiling water reactor SWR-1000, and Westinghouse's AP600, Common features for the three designs are: The use of passive safety components, i.e. components which do not need external energy sources in order to function when called for, thus improving the mitigation of possible accidents Improved energy efficiency as compared to the nuclear power plants existing today Operational lifetime designed for 60 years rather than the 30-40 years common for existing plant Doubling the life time of existing nuclear plants “Extending the lifetime of existing types of nuclear power plants from the original design values of 30-40 years to 60 years or more. In the USA the first power plants have been licensed to 60 years of operation, and in Japan the possibilities for extending plant life up to 120 years are being investigated.”
N2. Nuclear revival Supply problems lead to a political and (reluctant) public acceptance of nuclear as a carbon free energy source. Carbon taxes and state support of investments in nuclear makes the technology competitive with acceptable return to investors and leads to a doubling of world nuclear capacity by 2030 to 650 GWe. The increased nuclear capacity helps to restrain CO2 emissions increase worldwide.
In EU-25 nuclear production slightly increases its market share with respect to 2000, thanks to the construction of new light water reactors such as EPR in those countries, which decided at the beginning of the century against the phase-out of nuclear
Waste is now handled as once-through cycle inside the EU, and final deposit sites were been opened in all European countries with nuclear production in the second decade.
Nuclear fusion has not reached a commercial stage yet, but ITER progresses as planned, thus fusion is still considered an option for the medium term future (after 2050).
N3. Slow decline of nuclear power in most Member States, but extension of useful life for existing plants
The decline is due to low public and political support and thus precarious and risky investment opportunities. The unfavourable market conditions result in low R&D and continuous safety and waste problems.
Nuclear is an option for a few, dedicated countries, which decide in increase the existing reactors’ life span to at least 60 years.
Fusion has not made any essential progress and perspectives for commercial use diminish. Young researchers, perceiving the lack of professional perspective, have long stopped to enter the industry, so that the medium age of the scientific workforce is exceptionally high. Shortage of skilled people, together with declining education and training has negative implications for the safe use of nuclear energy.

EurEnDel – Scenarios Report, May 2004 56
Factor –
classification: Instruments
(Regulating variable)
Associated Delphi Statements
Reference data Hypothesis 1 Hypothesis 2 Open Research Questions
European access to gas reserves and storage “Europe will realize a great effort to access remaining gas reserves in the Ex-USSR and the Gulf Region, while at the same time trying to improve security of supply by associating with East European countries which may fulfil the function of “storage service providers”
ST 8 Liquefied natural gas terminals and advanced high-pressure pipeline systems permit to multiply Europe’s gas imports by 10
Doubling of world gas production to 2030, shift to supplied from GIS (54% - in 2030) and Africa y Middle East (15%), equal to Norway. 75% of demand by pipeline from CIS, 20% by pipeline from Middle East and Africa, 5% by LNG. Gas imports will increase from 186.4 MTOE in 2000 to 512.7 MTOE in 2030 (tripling present imports). Dependency of 80%.
O1. From pipelines to LNG – until 2010 Increasing import dependency leads to heavy infrastructure investment, with special attention to more versatile LNG facilities and transport capacities until 2010. At this point, the increasing world demand and the negative perspective for the development of major new reserves turns these large-scale investments too risky and private investors start to back out. Only the already initiated projects for connections with the CIS countries are actually carried out.
O2. No alternative to gas Natural gas continues to substitute petroleum in Western Europe. Heavy investments in transport routes, LNG facilities and large underground storage facilities, located in part in the Accession States, make it possible for Europe to triple consumption rates until 2030. In order to guarantee return on investments, the Commission establishes strong political and economic ties with the CIS states, the African producer countries, as well as the transit countries and concentrates research on the reduction of transport costs and the future use of the infrastructure created for gas transportation, storage and distribution.

EurEnDel – Scenarios Report, May 2004 57
Factor –
classification: Instruments
(Regulating variable)
Associated Delphi Statements
Reference data Hypothesis 1 Hypothesis 2 Open Research Questions
Pan-European grid service provision “The increasing interconnection of the European transit networks will lead to the centralized management of the transnational infrastructure, which extends from Russia to Northern Africa. Large consumers will buy power quality services, gas storage capacities and other new energy services, but grid modernization on distribution level will be hampered by the lack of funding, especially in regions with low energy consumption and population density.”
ST 11 Large international grids allow an energy production based on regional renewables (solar thermal power from North Africa, biomass from Central Europe etc.) ST 9 Widespread use* of superconductive materials in transformers and generators
Statement 11 considered unlikely in combination with renewables. Rather late date for superconductors: 2021 – 2030 New conductor materials enable two to three times the power through existing rights-of-way. Underground cable cost competitive by 2015. No info from baseline
P1. Secure and highly efficient interconnections in Europe, optimised distribution From 2020 on, the European countries and companies undertake heavy investments in order to increase the transport capacity of the high-voltage international connections, after having concentrated during the first two decades on solving the bottlenecks in the distribution network and on putting the largest part of the urban networks underground. In view of siting problems for new transmission lines, the emphasis is placed on increasing the capacity of the existing infrastructure within Europe by means of new superconductive cables and on extending the modernized grid to neighbouring countries.
P2. Under- investment and decay of grids Long-term under-investment in the European transmission network and, more pronounced, in many local and regional distribution grids leads to serious power supply problems in regions with high seasonal demand or high import dependency. The affected cities and municipalities try to solve the problems by assuming the ownership of local grids and by reducing their dependence on the high-voltage grid.

EurEnDel – Scenarios Report, May 2004 58
Factor – classification: Instruments (Regulating
variable)
Reference data Hypothesis 1 Hypothesis 2 Open Research Questions
Material technology “New materials with improved strength and surface qualities are used to improve energy efficiency of machines, power generators etc. New catalytic qualities are employed in energy machines, combustion and waste systems improving the energy efficiency and introducing new environmental risks New signal processing qualities (on molecular and atomic levels) are used in more refined and extended optimisation and control systems in energy consumption and production” 38. Sustainable Technology “Techniques and innovations developed through eco design and sustainability principles lead to higher energy efficiency in a number of areas and to new energy technologies etc. Environmental control, account and monitoring systems are widely implemented. Energy issues are central in this.”
The "natural" technological development of energy efficiency is 1% per year, but sustainable visions assume 2 - 3.7% improvement p.a. Scenarios, which assume major changes in the energy sector, for example accelerated development of PV, assume growth rates equivalent of that of the home PC industry 1980 – 2000.
Q1. Rapid efficiency increase of the entire energy chain The convergence of innovations in the field of material research, TIC, power electronics and other research fields work in benefit of a much higher level of efficiency in the entire energy chain, achieving and overall yearly improvement of 3%. Advances are especially important in renewable energies with the highest potential of efficiency improvements and cost reduction. Environmental impact studies on new materials and technologies are carried out prior to their introduction into the mass market.
Q2. Tech progress with limited impact on the energy system Research priorities in the key technologies do no explicitly contemplate progress in energy efficiency or renewable energies, but are much more centred on the mass production of consumer goods and on substituting costly raw materials. Technological progress in regard to energy efficiency has therefore not reached the critical 2% improvement per year in the EU 25.

EurEnDel – Scenarios Report, May 2004 59
Factor – classification:
Instruments (Regulating variable) Reference data Hypothesis 1 Hypothesis 2 Open Research
Questions Globalizing economy and nationalizing society: changes in geopolitical balance “Increasing poor-rich income gap between First and Third World Countries, declining employment rate, stagnating life quality, etc., when combined with political and, sometimes, social awakening can threaten post-cold war balances. Declining tolerance and increasing revenge spirits due to perceived physical (terrorist attacks) and psychological menaces of national identities, altering existing coalitions, could interfere with geopolitical balance of power. Because of European energy import dependency (especially in oil and gas fields) and lack of monopsonistic power, every switch in international, regional and national relations (i.e. the cartelisation of gas producers, future Russia-Saudi Arabia, Russia-EU and Russia-USA relations, etc.) could engrave regional security of supply and then affect energy strategies.”
2% solution: global improvements in a number of vital areas such as economic productivity, energy efficiency, emissions reduction, agricultural yield, and water consumption at a rate of 2% or better each year over at least the next half century. A universal foundation of at least 1.000 kWh per capita per year will be needed to achieve acceptable targets of literacy, health and security and to enable sustainable global economic growth.
R1. Growth chances for the 3rd World International consensus on the need for improving the living conditions in the poorest countries has been growing for decades. Correctly channelled aid programs have helped to speed up electrification in many of these countries, although the differences between the per head energy consumption between the 1st and 3rd world are still considerable.
R2. Global competition for remaining energy reserves Growing energy demand in the rapidly developing countries, primarily China, put a strain on oil and gas markets. The US maintains the grip on a large part of the available resources, using, when necessary, military pressure, while Europe concentrate its efforts on stabilizing its main supplier regions and developing strong multilateral ties.

EurEnDel – Scenarios Report, May 2004 60
Factor – classification:
Instruments (Regulating variable)
Reference data Hypothesis 1 Hypothesis 2 Open Research Questions
Consumers choice as a political statement “Buying (or not buying) certain products makes up for an increasing part in defining ones identity. For a certain (growing) fraction of society buying socially and ecologically correct products becomes a part of expressing themselves. This perspective is supported by ecological lobby groups, which try to bundle up individual preferences into a temporal, but powerful stakeholders movement. On the supply side companies react to this trend by specific eco-marketing, leading to the “greening of companies”. In the energy market this will lead to an increasing share of green products and services. On the other hand companies have to take care not to be branded as the bad guys who get boycotted (Greenpeace: the Brent Spar activities and in return the eco-marketing efforts of Shell).”
Different national perceptions regarding the importance of price (Belgium, Greece and France and in general, lower income households), uninterrupted supplies (Finland, Netherlands) and environmental and health protection (Italy and Sweden and persons with higher education levels). About 25% of EU-15 citizens are willing to pay more for clean energy. Energy efficiency is already an important criteria when buying large electrical appliances and cars.
S1. Green products still confined to niche markets Rising consumer prices in Europe and limited income growth make it difficult for consumers to acquire higher-priced green products. Consumer confidence in environmental labels has suffered several set-backs since the beginning of the century, especially in the South of Europe. A number of leading companies in the market intended to use the “eco-trend” for the selective marketing of products and services, which did not comply with ecological standards, and even less with sustainability criteria. European auditors finally discovered these practices, but so far it has not been possible to restore consumers’ confidence. Only products with environmental benefits that are evident to the customer or which present an economic and ecological win-win situation, for example efficient electrical applications or cars with reduced gasoline consumption, keep gaining market shares.
S2. Green products are the norm, not the exception Green products gain important market shares, whenever they are supported by independent analysis of consumer organisations and the company, which produces and / or distributes these goods has a credible record of environmental performance. Clear and easy labelling, which reflects the product’s environmental performance over the total life-cycle, as well as the compliance of other sustainability criteria by the producer makes it possible for the consumer to “make the right choices”. It also obliges the producers to make their production processes and the source of prime material more transparent. Companies responsible for major accidents or continued environmental impacts can hardly survive in the market. These consumer preferences for green products and services are also evident in the energy retail sector, which is now dominated by suppliers specialized on renewable energies and community-oriented municipal companies.

EurEnDel – Scenarios Report, May 2004 61
Factor – classification:
Instruments (Regulating variable)
Reference data Hypothesis 1 Hypothesis 2 Open Research Questions
Active public involvement in environmental issues “Environmental policy will be impacted to big extent by public involvement of NGOs and wide public. This may lead to new forms of governance as the citizens gain stronger influence on decision-making, at least on local level
The European citizens are correctly, but superficially informed on the structure of energy demand, but underestimate the impact of transport on demand and overestimate the importance of nuclear for supply. Men are slightly better informed than women. Almost 90% consider climate change to be a serious problem requiring immediate action. They ask for more information on energy saving and alternative forms of energy for use at home, but the “energy saving index” varies considerably between Northern and Southern Europe. Renewable energies score better than fusion in the long-term (2050). Oil, coal and nuclear fission are not considered important in the long run. 85% are not aware of EU R&D
T1. Strong active public involvement in energy policies Growing concerns about the environmental and social impacts of unsustainable energy consumption and production, turns energy and transport into “hot” political questions. What used to be “captive” and “passive” final consumers become main actors in energy policies both on the demand and on the supply side (residential energy production). Most housing communities are advised by a local energy expert, who usually also lives in the same building and has participated in training courses offered by the local or regional energy agencies. Traffic reduction measures and well-functioning public transport are considered essential elements of quality of life in urban areas by a large majority of the inhabitants.
T2. Limited active public involvement in energy policies Energy consumption and production are considered important issues by the public, but concerns about security of supply and the increase of energy and transport-related household expenses shift the public’s focus from environmental to social and economic concerns. Energy-saving measures are highly appreciated, but final consumers feel that they have little influence on questions related to European energy policy and its environmental consequences. This perception of “lack of alternatives” is especially strong among tenant households or residents in rural areas, which see little scope of action even on local level.

EurEnDel – Scenarios Report, May 2004 62
Factor – classification: target (control variable
only)
Associated Delphi Statements
Reference data Hypothesis 1 Open Research Questions
Decentralization of the electricity grid “Technological and organizational innovations in the management of distribution grids (virtual power plants, interactive grid management) will guarantee the integration of distributed generation in the medium term. In the long run, the number of communities which become independent of the central grid will rise considerably, thus improving the quality of supply in rural and isolated regions”
ST 10 Distributed energy systems (< 10 MW) contribute with >30% to Europe's electricity supply [Today it is 14%]
Key issue, should be achieved between 2010 and 2020. Dependent upon cost-efficiency improvement and cost effectiveness. Advanced, two-way metering before 2010; high degree of decentralization by 2030
Grid 2030: “Local distribution, mini- and microgrids providing services to customers and obtaining services from generation resources anywhere on the continent”
Exploiting the buildings’ energy potential – rapid decline of demand due to increased residential production In view of siting problems for all larger generation facilities, the electricity generation capacity of buildings is increasingly exploited. Larger commercial buildings use most of their own production, but a large share of residential production is fed into the grid.


EurEnDel – Scenarios Report, May 2004 64
Annex 2: Results from the Delphi Survey - Times of Occurrences
2010 2020 2030 2040 2050 1) Novel production processes Industrial energy consumption in Europe is reduced by 50% per produced unit through novel production processes 2) Intelligent buildings Low-energy buildings with intelligent power systems make up >50% of all new buildings in Europe 3) 20 % FC cars Fuel cell driven cars reach a European market share of 20% 4) 25% Bio-fuels Bio-fuels will have a European market share of >25% in the road transport sector 5) 15% Freight on rail Improved logistics based on information and communication technologies raise the railway's market share in Europe's freight transport to 15% [1990: 11%, today: 8%]. 6) H2 (first round only)* Hydrogen used as an energy carrier constitutes s significant part of the energy sytem.
6a) H2 from diverse sources (second round only)* Hydrogen produced from diverse sources and used as an energy carrier constitutes a significant part of the energy system.
6b) H2 from RES (second round only)* Hydrogen produced solely from renewables and used as an energy carrier constitutes a significant part of the energy system.
7) Energy storage in RES Advanced energy storage technologies are widely used in renewable energy supply systems
8) LNG terminals and pipelines Liquefied Natural Gas terminals and advanced high-pressure pipeline systems permit to multiply Europe’s gas imports by 10 [EU-15 demand 1999 is 386 bcm (billion cubic meters); 40% imported]
N "Never"577 5%386 2%58 5%
575 1%378 1%52 0%
589 3%387 1%54 2%
576 21%377 15%50 26%
390 14%284 10%10 2%
591 4%
386 3%67 5%
379 10%74 19%
573 3%366 1%69 3%
429 31%297 42%16 24%
= 1st round (Experts/Knowledgeable/Familiar) = 2nd round (Experts/Knowledgeable/Familiar) = 2nd round Experts only 25% quartile mean value 75% quartile

EurEnDel – Scenarios Report, May 2004 65
2010 2020 2030 2040 2050 9) Superconductive materials Widespread use of superconductive materials in transformers and generators 10) 30% distributed energy systems Distributed energy systems (< 10 MW) contribute with >30% to Europe's electricity supply [Today it is 14%] 11) International grids Large international grids allow an energy production based on regional renewables (solarthermal power from North Africa, biomass from Central Europe etc.) 12) Plasma confinement tech Plasma confinement technologies for nuclear fusion are in practical use 13) Safe fission Nuclear power plants based on passive safe reactor types are in practical use 14) 25% RES Renewable energy sources cover 25% of Europe’s total energy supply [Today it is 6%]
15) 5% PV Photovoltaic cells contribute with >5% of European electricity generation [Today it is 0.15%] 16) Ocean tech Ocean technologies (e.g. tidal, currents, and wave) are in practical use 17) Biomass Biomass for central heating and district heating systems is widely used 18) CO2 capture and seq. CO2 capture and sequestration from fossil fuel power plants is in practical use
19) H2 from bio (second round only)* Biological or bio-chemical production of hydrogen are in practical use
N "Never"376 5%276 2%16 2%
588 7%376 4%99 2%
554 19%363 16%55 14%
333 23%231 22%9 5%
353 20%263 19%28 5%
616 5%402 4%142 9%
569 13%376 9%61 16%
465 10%308 6%20 3%
589 9%384 5%95 7%
503 11%345 12%50 7%
278 6%20 3%
graph 0-1: Mean value of Time of Occurrence of Delphi statements for first and second round answers, including answers of “experts only” for the second round. Left hand side of the bar indicates 25% quartile and right hand side 75% quartile. *(Statement 6 was split into statement 6A and 6b in the second round, statement 19 was newly introduced in the 2nd round)

EurEnDel – Scenarios Report, May 2004 66
Annex 3: References
Sources Used as Input to Scenario-Building: AEA Technology “Options for a Low Carbon Future. Annex A. Development of
Energy Scenarios”. Document included among the UK White Paper (2003) “Our energy future - creating a low carbon economy” (Calculations performed using the MARKAL model) Available at: http://www.dti.gov.uk/energy/whitepaper/index.shtml
Amtsblatt der Europäischen Gemeinschaften (2002) “Richtline 2002/9 des Europäischen Parlaments und des Rates vom 16. Dezember 2002 über die Gesamteffizienz von Gebäuden”
Birnbaum, K. U.; Linßen, J.; Walbeck, M. (2002) “Synoptische Analyse vorliegender Studien in Bezug auf den Trend bzw. die Reduktionspotenziale von CO2-Emissionen im Verkehr” Forschungszentrum Jülich, Programmgruppe Systemforschung und Technologische Entwicklung (STE). Studie im Auftrag von: Deutscher Bundestag (Enquete-Kommission "Nachhaltige Energieversorgung unter den Bedingungen der Globalisierung und der Liberalisierung")
Bonduelle, Antoine. DETENTE, (2003), “Wind vs Nuclear 2003. A report commissioned by Greenpeace France- Summary”
Boye Olesen, Gunnar “National and European Sustainable Energy Visions 2050”. International Network for Sustainable Energy http://www.inforse.dk/europe/Vision2050.htm
Cabinet Office (2001), Energy Systems in 2050. Report to 2nd Advisory Group. Meeting of PIU Energy Review: 25 September 2001. Available at: http://www.cabinet-office.gov.uk/innovation/2001/energy/2050.pdf
Donald A. Hanson, Argonne National Laboratory; Irving Mintzer, Global Business Network; John A. “Skip” Laitner, EPA Office of Atmospheric Programs; J. Amber Leonard, Global Business Network (2004) “Engines of Growth: Energy Challenges, Opportunities, and Uncertainties in the 21st Century” (Elaborated using the AMIGA All-Modular Industry Growth Assessment model)
DTI Department of Trade and Industry (2002), “Foresight Futures 2020. Revised Scenarios and Guidance” Available at: http://www.foresight.gov.uk/servlet/Controller/ver=850/userid=2/DTI_FF_web.pdf

EurEnDel – Scenarios Report, May 2004 67
EEA European Environmental Agency (2003) “Europe’s environment: the third assessment”. Available at: http://reports.eea.eu.int/environmental_assessment_report_2003_10/en
EEA European Environmental Agency (2003) “Greenhouse gas emission trends and projections in Europe 2003”. Available at: http://reports.eea.eu.int/report_2002_1205_091750/en/Issue_33_www.pdf
EEA European Environmental Agency “Indicator Fact Sheet Signals 2001 – Chapter Households YIR01HH06 Household energy consumption”. (Data based on the following publications: ENERDATA/Odyssee (1999): Energy efficiency in the European Union 1990-1998. Annual report to SAVE.
http://193.54.191.189/SiteOdyssee/rapfra.pdf and OECD, 1999: Towards more Sustainable Household Consumption Patterns – Indicators to Measure Progress OECD ENV/EPOC/SE(98)2/Final) Available at http://themes.eea.eu.int/Sectors_and_activities/households/indicators/energy/hh06households.pdf Data based on the following publications: ENERDATA/Odyssee (1999): Energy efficiency in the European Union 1990-1998. Annual report to SAVE. http://193.54.191.189/SiteOdyssee/rapfra.pdf and
OECD, 1999: Towards more Sustainable Household Consumption Patterns – Indicators to Measure Progress OECD ENV/EPOC/SE(98)2/Final
EEA European Environmental Agency “Indicator Fact Sheet Signals 2001 – Chapter Households YIR01HH08 Penetration of environmentally friendly products”. Available at: http://themes.eea.eu.int/Sectors_and_activities/households/indicators/eco_label/hh08eco_products.pdf
EEA European Environmental Agency “Indicator Fact Sheet YIR99CC1 Total EU CO2 emissions”. Available at http://themes.eea.eu.int/Environmental_issues/climate/indicators/Kyoto_Protocol_targets/yir99cc5.pdf
EPRI (2003) “Electricity Technology Roadmap 2003. Summary and Synthesis. Power Delivery and Markets” Available at: http://www.epri.com/destinations/general/2002roadmap.asp
Eriksson, E. Anders “External scenarios for Nordic H2 Energy Foresight”. Nordic H2 Energy Foresight. Available at: http://www.h2foresight.info/H2%20scenario%20report.pdf
European Commission “Building Overview: Market Overviews and Trends”. Available at: http://europa.eu.int/comm/energy_transport/atlas/htmlu/bomarover.html
European Commission, Directorate-General for Research (2003), World Energy, Technology and Climate Policy Outlook 2030 WETO Available at www.world-nuclear.org/policy/weto_final_report.pdf

EurEnDel – Scenarios Report, May 2004 68
European Commission, Information and Communication Unit, Directorate-General for Research (2002) “Eurobarometer. Energy: Issues, Options and Technologies. Science and Society. (Report produced by The European Opinion Research Group (EORG) Available at: http://europa.eu.int/comm/public_opinion/archives/ebs/ebs_169.pdf
Greenpeace / EPIA (2001) “Solar Generation. Solar Electricity for over 1 Billion People and 2 Million Jobs by 2020. Summary”
Hudspith, Bob Director, Engineering and Society Program “Risk Perception and Risk Acceptance: Implications for Nuclear Energy
Wolfram Jörß, Timon Wehnert: „Quantitative co-assessment of the EurEnDel Delphi results“, 2004, accessible at http://www.izt.de/eurendel/survey_results/index.html
Kaufmann, Ivonne; Meier, Ruedi; Ott, Walter (2001) “Luftverkehr - eine wachsende Herausforderung für die Umwelt Fakten und Trends für die Schweiz Materialienband M25, NFP 41 econcept AG, Zürich
Lowex Newsletter 6/2002 “Low Exergy Systems in Existing Buildings– Lowexx”. Available at http://www.lowex.net/english/inside/material.html
Mark H. Hayes & David G. Victor (2003) “Factors that Explain Investment in Cross-Border Natural Gas Transport Infrastructures: A Research Protocol for Historical Case Studies. Working Paper #8 Available at: http://pesd.stanford.edu/research/natgas.html
Mantzos et al. (2003): European Energy and Transport Trends to 2030; ISBN 92-894-4444-4, published by the European Commission, Directorate General for Energy and Transport (2003); Available at: http://europa.eu.int/comm/dgs/energy_transport/figures/trends_2030/index_en.htm
MIT Massachusetts Institute of Technology (2003) “The Future of Nuclear Power. An Interdisciplinary MIT Study”
PIU Working Paper (2001): Environmental Risks and Costs Available at; http://www.number-10.gov.uk/output/page4250.asp
Raskin, Paul et al. (2002) “Great Transition The Promise And Lure Of The Times Ahead. A report of the Global Scenario Group”, Stockholm Environment Institute – Boston
Scenarios for AERONET Workshop (2001). Working Document from CONSAVE 2050 - Constrained Scenarios on Aviation and Emissions Available at www.dlr.de/VL/consave/Annex6-Scenarios.pdf

EurEnDel – Scenarios Report, May 2004 69
Solar Catalyst Group (2003) “Solar Opportunity Assessment Report“ Available at http://www.cleanedge.com/reports-soar.php
SPRU Science and Technology Policy Research / CSERGE Centre for Social and Economic Research on the Global Environment / CRU Climatic Research Unit / PSI Policy Studies Institute (1999) “Socio-Economic Futures Scenarios for Climate Impact Assessment” Available at: http://www.sussex.ac.uk/spru/environment/research/scenarios.html
United States Department of Energy (2002) “National Hydrogen Energy Roadmap”. Available at: http://www.eere.energy.gov/hydrogenandfuelcells/ pdfs/national_h2_roadmap.pdf
United States Department of Energy, Office of Electric Transmission and Distribution (2003) “Grid 2030. A National Vision for Electricity’s Second 100 Years” http://www.climatevision.gov/sectors/electricpower/pdfs/electric_vision.pdf
Van der Pligt, Joop (2001) “Risk Perception and Nuclear Energy”. Paper presented to ILK Symposium “Opportunities and Risks of Nuclear Power“
Warren, Andrew (ACE) “Towards common energy standards for buildings across Europe” Energy World March 2002 Number 297 Pages 8 – 10.
World Business Council for Sustainable Development (2000) “The Wizard of US. Sustainable Scenarios Project”
Zeka-Paschou, M.: Data file containing the aggregated results of the “With Climate Policies” scenario used in the CAFÉ baseline stakeholder consultation; accessible at http://forum.europa.eu.int/Public/irc/env/cafe_baseline/library?l=/baseline_data/summary_tables&vm=detailed&sb=Title