
The Establishment-Size Wage Premium: Evidence from...
32
IZA DP No. 1569 The Establishment-Size Wage Premium: Evidence from European Countries Thierry Lallemand Robert Plasman François Rycx DISCUSSION PAPER SERIES Forschungsinstitut zur Zukunft der Arbeit Institute for the Study of Labor April 2005
Transcript of The Establishment-Size Wage Premium: Evidence from...

IZA DP No. 1569
The Establishment-Size Wage Premium:Evidence from European Countries
Thierry LallemandRobert PlasmanFrançois Rycx
DI
SC
US
SI
ON
PA
PE
R S
ER
IE
S
Forschungsinstitutzur Zukunft der ArbeitInstitute for the Studyof Labor
April 2005

The Establishment-Size Wage Premium:
Evidence from European Countries
Thierry Lallemand Free University of Brussels, DULBEA
and Centre de Comptabilité, Planning et Contrôle
Robert Plasman Free University of Brussels and DULBEA
François Rycx
Free University of Brussels, DULBEA and IZA Bonn
Discussion Paper No. 1569 April 2005
IZA
P.O. Box 7240 53072 Bonn
Germany
Phone: +49-228-3894-0 Fax: +49-228-3894-180
Email: [email protected]
Any opinions expressed here are those of the author(s) and not those of the institute. Research disseminated by IZA may include views on policy, but the institute itself takes no institutional policy positions. The Institute for the Study of Labor (IZA) in Bonn is a local and virtual international research center and a place of communication between science, politics and business. IZA is an independent nonprofit company supported by Deutsche Post World Net. The center is associated with the University of Bonn and offers a stimulating research environment through its research networks, research support, and visitors and doctoral programs. IZA engages in (i) original and internationally competitive research in all fields of labor economics, (ii) development of policy concepts, and (iii) dissemination of research results and concepts to the interested public. IZA Discussion Papers often represent preliminary work and are circulated to encourage discussion. Citation of such a paper should account for its provisional character. A revised version may be available directly from the author.

IZA Discussion Paper No. 1569 April 2005
ABSTRACT
The Establishment-Size Wage Premium: Evidence from European Countries∗
This study examines the magnitude and determinants of the establishment-size wage premium in five European countries using a unique harmonised matched employer-employee data set. Findings show the existence of a significant positive wage premium in all countries, even when controlling for labour quality, working conditions, monitoring, sectoral and regional effects, bargaining institutions, job stability, and concentration of skilled workers. In cross-national perspective, results support the existence of an inverse relationship between the size wage gap and the degree of corporatism. Final results indicate that the size wage premium is generally larger in the manufacturing sector and for blue-collar workers. JEL Classification: J31 Keywords: establishment-size and wages, matched employer-employee data, Europe Corresponding author: François Rycx Université Libre de Bruxelles CP 140 − Av. F.D. Roosevelt 50 B-1050 Brussels Belgium E-mail: [email protected]
∗ This paper is produced as part of a Targeted Socio-Economic Research (TSER) project on Pay Inequalities and Economic Performance (PIEP) financed by the European Commission (Contract nr. HPSE-CT-1999-00040). The data used in this study come from the 1995 European Structure of Earnings Survey. Due to confidentiality issues, this data set is only available for members of the PIEP research project (http://cep.lse.ac.uk/piep/).
1
I. INTRODUCTION
The existence of a positive effect of employer size on workers’ wages is well documented in
the economic literature (Oi and Idson, 1999a). Yet, there is little consensus about the
particular reason why large employers pay higher wages (Winter-Ebmer and Zweimüller,
1999). Traditional explanations suggest that large employers: i) hire more qualified workers,
ii) compensate workers for bad working conditions, iii) have more market power and share
their excess profits with their workers, iv) avoid or mimic unionisation, and v) substitute high
monitoring costs with wage premia. Empirical papers offer only partial evidence for these
traditional arguments (e.g. Brown and Medoff, 1989; Main and Reilly, 1993; Morissette,
1993; Idson and Feaster, 1990; Schmidt and Zimmerman, 1991). As a result, alternative
hypotheses have been recently developed. Oi and Idson (1999b), for instance, suggest that
workers are more productive in large firms and therefore ask for higher wages. Other
explanations emphasize that large firms match more-skilled workers together (Kremer and
Maskin, 1996; Troske, 1999) and create internal labour markets in order to increase the
stability of their workforce (Idson, 1996). Be that as it may, the reason why large firms pay
higher wages remains a complex and unresolved puzzle.
Another issue is whether the magnitude and determinants of the employer-size wage
premium vary across the industrialised countries. Due to the scarcity of harmonised data
linking businesses and workers at the micro level in different countries, very little is known
on this subject. As far as we know, the contributions of Albaek et al. (1998) and Teulings and
Hartog (1998) provide the only cross-country evidence on the employer-size wage gap.
Albaek et al. (1998) focused on the Scandinavian countries using comparable data from
registers and surveys. Their results suggest that the plant-size elasticity in Scandinavian
countries is of the same order of magnitude than in other countries with totally different wage
bargaining institutions, such as the US. In contrast, using similar individual surveys from
seven countries, Teulings and Hartog (1998) show the existence of an inverse relationship
between the employer-size wage premium and the degree of corporatism.1 Unfortunately, in
1. The concept of corporatism, borrowed from political science resembles the level of centralisation of collective
bargaining as well as the degree of coordination between the social partners. However, as this concept has not
been defined in one single way, there are differences in opinion as to the relative position of the industrialised
countries on the scale of corporatism (see the discussion in e.g. OECD (1997, 2004)). The Scandinavian
countries and Austria are nevertheless always in the category of strongly corporatist countries, whereas the US
and Canada are invariably at the bottom of the ranking.

2
both studies, results do not refer to the same year in all countries. Moreover, the use of self-
reported information for some countries and data from registers for others may be misleading.
The aim of the present paper is to extend this literature by examining the magnitude and
sources of the establishment-size wage premium in five European countries, i.e. Belgium,
Denmark, Ireland, Italy, and Spain. To do so, we use a unique harmonised matched employer-
employee data set, i.e. the 1995 European Structure of Earnings Survey (ESES). Although
matched employer-employee data sets are now available for a number of individual countries,
to the best of our knowledge, the ESES provides the only multi-country data set with matched
employer-employee data. This survey contains detailed information, reported by the
management of the establishments, both on the individual workers (e.g. gross hourly wages,
bonuses, age, education, tenure, sex, occupation) and the employers’ characteristics (e.g.
sector of activity, region, level of wage bargaining, size of the establishment). The size of the
establishment is measured by the exact number of employees. Hence, it overcomes the
potential measurement errors present in studies where the categorized employer-size data are
converted into a continuous measure of establishment size (Albaek et al., 1998). The ESES
enables us to explore key explanations of the size wage gap, including the labour quality
hypothesis, the theory of compensating wage differentials, the role of monitoring and
institutions, size differences in job stability, and the hypothesis of a higher concentration of
skilled workers in large establishments. It also allows us to examine, like Bayard and Troske
(1999) and Villemez and Bridges (1988) for the US, if the magnitude of the size wage gap
varies across industrial sectors and occupations. Finally, it gives us the opportunity to re-
examine the relationship between the employer-size wage premium and collective bargaining
characteristics.
The remainder of this paper is organised as follows. Section II reviews the literature
(both theoretical and empirical) dealing with the effects of employer size on workers’ wages.
Sections III and IV present respectively the data and the empirical results. The last section
concludes.
II. BACKGROUND
1. Theory
Differences in both human and physical capital investments between employers of different
sizes are at the basis of various explanations for the size wage premium. According to

3
Hamermesh (1980), large employers hire higher-quality workers due to their greater capital
intensity and the capital-skill complementarity. Economies of scale and other financial
advantages (e.g. lower interest rates) are often mentioned to explain why large employers
might invest more in both human and physical capital. The point is that large employers can
spread the fixed costs of their investments across more output and workers. Therefore, it
would be relatively less costly for them to adopt advanced technologies, which in turn require
more skilled labour. Black et al. (1999) developed a model where the size wage gap is
explained by a training size differential. They argue that cost advantages allow large
employers to implement stronger formal and informal training systems, which are essential
for an efficient use of advanced technologies. A complementary argument to explain why
large organizations might employ more high-skilled workers has been developed by Troske
(1999). Starting from the hypothesis of Kremer and Maskin (1996)2, the author argues that if
there are fixed costs associated with employing high-skilled workers, large employers should
have advantages in matching them together.
Compensating wage differentials may also account for the employer-size wage
premium. According to the standard competitive model of the labour market, where the
equilibrium wage is determined through marginal productivity, two individuals with identical
productive characteristics necessarily receive the same wages. However, compensating
differences may occur between similar individuals placed in different working conditions.
Indeed, the disutility undergone by one individual following the performance of a task in an
unfavourable situation may lead to wage compensation. For a long time, working conditions
were considered to be worse within large organizations. Large employers were suspected to
offer inter alia a more impersonal work atmosphere (Lester, 1967), to decrease the freedom of
action and scheduling (Masters, 1969), and to generate longer commuting (Scherer, 1976).
This perspective has been challenged by Oi and Idson (1999b). The authors argue that large
firms typically offer jobs with better working conditions (e.g. cleaner and safer workplaces,
generous time-off benefits, and superior fringe benefits). Moreover, they suggest for the US
that observable working conditions are better within large firms and therefore can not
contribute to the firm-size wage premium.
Job stability may also explain the existence of an employer-size wage premium.
Doeringer and Piore (1971) emphasized that internal labour markets facilitate the evaluation
of the worker’s performance and generate higher returns to human capital investments. The
2. Following Kremer and Maskin (1996), employers prefer to match workers of similar skills together.

4
point is that the internal mobility of workers tends to reduce the job turnover within junior
workers and to decrease the incentives for senior workers not to share their knowledge with
new workers (Criscuolo, 2000). Lower job turnover means in general lower adjustment and
monitoring costs. Therefore, it can be argued that internal job mobility is beneficial for an
employer. The same is true for the workers since it increases job stability. To put it
differently, it improves career prospects and reduces the threat of unemployment. Let us also
notice that the stability of the workforce is expected to be higher within large organizations
because the latter provide more intensive training programs (Black et al., 1999; Idson, 1996;
Winter-Ebmer, 2001) and face a lower risk of bankruptcy (Idson, 1996).
Another possible explanation for the elasticity between size and wages is that large
employers have a greater ability-to-pay. The argument is that the latter are more likely to
operate in imperfect competitive markets (Albaek et al., 1998). Therefore, large employers
can accumulate more monopoly rents that they may share with their workers (Slichter, 1950;
Weiss, 1966; Mellow, 1982). Rent-sharing may arise for several reasons including collective
wage bargaining or the employer’s willingness to avoid unionisation.3 Let us also notice that,
according to Brown et al. (1990) and Voos (1983), large organizations are more likely to be
the target of union drives or to replicate union behaviour.
Efficiency wage models provide a complementary explanation for the employer-size
wage premium. The point is that in general the latter face higher monitoring costs. To reduce,
these costs they may pay efficiency wages, i.e. wages that are above the market clearing level
for a given quality of labour (Eaton and White, 1983). Indeed, efficiency wages attract
workers with better skills and reduce shirking. In the Shapiro and Stiglitz’s model (1984), the
level of ‘no shirk wage’ or efficiency wage is negatively correlated with the detection rate.
Since the detection rate is supposed to be lower within large organizations, efficiency wages
are expected to increase with employer size.4
3. However, rent-sharing may also appear in the absence of trade unions. See the discussion in e.g. Blanchflower
et al. (1996), Nickell (1999), and Rycx and Tojerow (2004).
4. See also the discussion in e.g. Barron et al. (1987), Garen (1985), Lucas (1978), and Oi (1983). An alternative
version of the efficiency wage model, based on the employers’ difficulty to infer workers’ ability, has been
developed by Weiss and Landau (1984).
5
2. Previous Results
In their seminal paper, Brown and Medoff (1989) examine the magnitude and causes of the
firm-size wage premium in the US. Their results show that ceteris paribus working for a large
firm (i.e. a firm that is double the size of another) provides a wage premium of between 1.5
and 3.8 per cent. However, they provide little evidence for traditional explanations including
the labour quality hypothesis or size differences in working conditions.5 The study of Idson
and Feaster (1990) relative to the US is the first to address the potential selectivity problem,
i.e. the non random sorting of workers across employers of different sizes. To do so, they
apply the two-step estimation procedure developed by Heckman (1976, 1979) and Lee (1978).
Their findings, based on a discrete measure of firm size (5 categories), show that controlling
for selection effects increases the magnitude of the size wage gap.
The paper of Schmidt and Zimmerman (1991) supports the existence of a significant
firm-size wage premium in West-Germany. Moreover, their results indicate that the
magnitude and significance of this premium is not reduced by the addition of many control
variables, including tenure, innovative activities of firms, industry dummies, demographic
variables, and work characteristics. Main and Reilly (1993) focus on the UK using a discrete
measure of the establishment size (3 categories). Moreover, they try to correct for the
potential selection bias by adopting the same methodology as in Idson and Feaster (1990).
Their results show the existence of a wage gap of around 18 per cent between large and small
establishments. They also indicate that traditional explanations do not much account for the
size wage premium. Furthermore, in contrast to Idson and Feaster (1990), they do not support
the hypothesis of a non random assignment of workers across different size classes. The size
wage differential within Italian firms has been investigated by Brunello and Colussi (1998).
Using a discrete measure of firm size (6 categories) and controlling for a potential selectivity
bias, the authors find that the wage differential between small and large firms is not
significantly different from zero. In other words, their results suggest that any wage premium
is due to differences in the observed characteristics and selection effects.
The study of Albaek et al. (1998) is particularly interesting because it is the first to use a
continuous measure of the establishment size (i.e. the exact number of employees per
establishment) and to compare the size wage elasticity across Scandinavian countries. The
authors find large plant-size effects even after controlling for individual and job
5 Morissette (1993) finds similar results for Canada.
6
characteristics as well as for selection effects. They also suggest that the plant-size elasticity
in the Scandinavian countries is of the same order of magnitude than in other countries with
completely different wage bargaining institutions, such as the US. From a technical point of
view, the authors stress the difficulty of findings good instruments to control for potential
selection effects. Yet, they conclude that the sorting of workers, at the very least, is not very
important for the explanation of the size wage premium in the Scandinavian countries.
More recent explanations of the size wage premium have been tested for the US by
Bayard and Troske (1999). The authors use a continuous measure of the firm/establishment
size and include supply-side variables directly in their wage regression. Their results show
comparable, significant and positive establishment-size wage premia across industries (i.e.
manufacturing, retail trade and services). Moreover, according to the theory of Oi and Idson
(1999b), their findings suggest that productivity differences between workers in large and
small firms account for half of the firm-size wage premium in the manufacturing and service
industries. However, their results do not sustain the hypothesis, developed by Kremer and
Maskin (1996) and Troske (1999), that large firms match more-skilled workers together.
To get a better understanding of the employer-size wage differential, a number of recent
studies rely on panel data techniques. Abowd et al. (1999) use a large matched worker-firm
panel data set for France and find that individual heterogeneity rather than firm heterogeneity
accounts for most of the wage gap between size categories. To do so, they isolate fixed
individual and fixed firm effects from workers moving between employers.6 Ferrer and Lluis
(2004) examine the returns to unmeasured skills in Canada considering the non random
assignment of workers into firms of different sizes. They apply GMM techniques to
longitudinal data for the period 1993-98. Their findings, based on a discrete measure of firm
size (3 categories), show that moves are equally distributed across firms of different sizes.
They also suggest that moving to a larger firm generally increases the average wage, while
joining a smaller firm may not lead to a wage cut.7 Finally, they indicate that unmeasured
skills (e.g. initiative, ambition) are not significantly better rewarded within large firms. The
6. An objection that can be raised against fixed effects estimates is that they assume that the workers’ mobility is
exogenous. If this is not the case, fixed effect estimates are inconsistent (Criscuolo, 2000). Another potential
problem with fixed effect estimates is that they rely on the hypothesis that unobserved abilities are equally
rewarded across firms of different sizes. 7 Using German panel data, Gerlach and Hübler (1998) find that: i) workers moving to smaller firms retain part
of their initial size wage premium, and ii) workers moving to larger firms may have to accept wages below the
average pay of incumbents with similar characteristics.

7
authors attribute this finding to higher monitoring costs within large firms. A similar result
has been obtained for Portugal by Silva (2004). Using longitudinal employer-employee data,
covering the period 1993-98, the latter finds that observed skills generate higher returns in
larger firms while unmeasured abilities are better rewarded in smaller firms.
III. THE DATA The present study is based on the 1995 European Structure of Earnings Survey, gathered by
Eurostat. This harmonised survey, covering five European countries (i.e. Belgium, Denmark,
Ireland, Italy, and Spain), contains a wealth of information, provided by the management of
the establishments, both on the individual workers (e.g. gross hourly wages, bonuses, age,
education, tenure, sex, occupation) and the employers’ characteristics (e.g. sector of activity,
size of the establishment, level of wage bargaining). Interestingly, the establishment size is
measured by the exact number of employees. Hence, it overcomes the potential measurement
errors present in studies where the categorized employer-size data are converted into a
continuous measure of establishment size (Albaek et al., 1998). The ESES is representative of
all establishments employing at least ten workers and whose economic activities fall within
sections C to K of the Nace Rev. 1 nomenclature8, except for Ireland where sectors F, I and K
are not covered. The number of observations in our sample ranges from 36,491 in Ireland to
546,273 in Denmark.
The means and standard deviations of key variables, broken down by establishment size,
are given in the Appendix. We note a significant difference between the mean characteristics
of workers employed in small and large establishments. The point is that on average
individuals employed in large establishments earn higher wages, are more educated, have less
potential experience, and more years of seniority. Large establishment moreover tend to be
over-represented in the manufacturing sector, to employ less blue-collar workers (except in
Denmark), and to pay bonuses for overtime, shift work, night work and/or weekend work to a
larger fraction of their workforce.
8. It thus covers the following sectors: i) mining and quarrying (C), ii) manufacturing (D), iii) electricity, gas and
water supply (E), iv) construction (F), v) wholesale and retail trade, repair of motor vehicles, motorcycles and
personal and household goods (G), vi) hotels and restaurants (H), vii) transport, storage and communication
(I), viii) financial intermediation (J), and ix) real estate, renting and business activities (K).

8
IV. EMPIRICAL RESULTS
1. General Analysis
In the remainder of this paper, we analyse the magnitude and sources of the establishment-
size wage premium in the Belgian, Danish, Irish, Italian and Spanish private sector,
respectively. Our empirical strategy is based on the estimation of a standard Mincer (1974)
wage equation. To put it differently, we regress the log of individual gross hourly wages
(including bonuses) on the log of the establishment size (i.e. the exact number of workers
within the establishment) and insert step by step control variables in order to test the validity
of various theoretical explanations. Regressions have been estimated by OLS with White
(1980) heteroscedasticity-consistent standard errors. Moreover, to rule out the bias in the
estimated standard errors stemming from the use of aggregated establishment variables in an
individual wage equation, we applied the correction for common variance components within
groups as suggested by Greenwald (1983) and Moulton (1990).9
[Take in Table 1]
As a starting point, we estimated the elasticity between wages and establishment size
controlling for basic individual characteristics, i.e. standard human capital variables, a dummy
for the sex of the individual, and 19 occupational dummies. Human capital variables include 5
indicators showing the highest level of education; prior potential experience, its square and its
cube; and seniority within the current establishment, and its square. The results of this
specification, reported in row 1 of Table 1, show the existence of a positive and significant
effect of the establishment size on workers’ wages. Indeed, they suggest that, on average, a
doubling of the establishment size increases earnings by around 7 per cent in Spain, 5 per cent
in Belgium, Ireland and Italy, and 1 per cent in Denmark.
Of course, it could be argued that the positive correlation between wages and
establishment size is due to differences by size in the establishment’s economic and financial
control, sectoral affiliation, or regional location. To investigate whether the establishment-size
wage premium is reflective of industry wage differentials, sectoral dummies at the Nace two-
9. Therefore, we applied the “cluster” option in Stata. See StataCorp (1999), pp. 178-9 for an extended
description of the estimation procedure.

9
digit level have been included in our wage regression.10 The results of this specification are
presented in row 2 of Table 1. As expected, we find that sectors have a significant impact on
the size wage elasticity. Indeed, the coefficient of establishment size drops by 0.015 in
Belgium, around 0.007 in Ireland, Italy and Spain, and 0.003 in Denmark. However, it
remains significant at the 1 per cent level in all countries. Next, we added to our wage
regression dummies for the region where the establishment is located and dummies for the
establishment’s economic and financial control.11 Results of this new regression, reported in
row 3 of Table 1, show that the establishment-size wage effect remains almost unchanged
when controlling for these variables, except in Spain where the size wage elasticity falls from
0.062 to 0.056.
The level of collective wage bargaining is another factor that may account for the
establishment-size wage premium. Collective bargaining occurs at different levels in
European countries: the national, the sectoral, and/or the local (firm or establishment) level.
Various empirical studies12 suggest that workers covered by a local collective agreement (CA)
earn ceteris paribus more than their opposite numbers who are solely covered by national
and/or sectoral CAs. Therefore, if local CAs are more frequently signed within large
employers, we may expect the magnitude of the establishment-size wage premium to fall
when controlling for the level of wage bargaining. Results, reported in row 4 of Table 1,
confirm this expectation for Belgium and Spain. Indeed, the coefficient of establishment size
drops from 0.035 to 0.032 in Belgium and from 0.056 to 0.052 in Spain, after the inclusion of
several dummies for the level of wage bargaining.13 Yet, the inclusion of information on CAs
does almost not change the size wage effect in Denmark, Ireland and Italy.14
10. The number of sectoral dummies is equal to 33 in Ireland and 41 in Belgium, Denmark, Italy and Spain. For
evidence on the existence of inter-industry wage differential in European countries see e.g. Kahn (1998),
Gannon et al. (2004), and Teulings and Hartog (1998).
11. The number of regional dummies is equal to 2 in Belgium, 0 in Denmark and Ireland, 10 in Italy, and 6 in
Spain. The number of dummies for the establishment’s economic and financial control is equal to 3 in
Belgium, 1 in Denmark, 2 in Ireland, 0 in Italy, and 3 in Spain.
12. See e.g. Barth et al. (1994), Hartog et al. (1997), and Rycx (2003).
13. For Belgium and Denmark, we add 2 dummies, i.e. for establishments covered by: i) an enterprise CA, and
ii) other pay-setting arrangements. For Ireland, we add 1 dummy, i.e. for establishments covered by an
enterprise CA. For Italy, we add 3 dummies, i.e. for establishments covered by: i) an enterprise CA, ii) an
establishment CA, and iii) other pay-setting arrangements. For Spain, we add 4 dummies, i.e. for
establishments covered by: i) an above-enterprise CA (provincial/regional level or within sectors at the
provincial/regional level), ii) an enterprise CA, iii) an establishment CA, and iv) other pay-setting

10
Another possible explanation for the size wage gap is that large employers have to
compensate workers for unattractive working conditions. To test this hypothesis, the
following variables have been added to our model: i) 3 dummies for the type of contract, ii)
the number of paid hours, iii) a dummy for paid overtime hours, and iv) a dummy showing
whether the individual is paid a bonus for shift work, night-time and/or weekend work.15
After controlling for working conditions, we find that the magnitude of the size wage
elasticity decreases in all countries but on a variable scale (see row 5 of Table 1). While the
contribution of working conditions to the observed size wage gap seems to be limited in
Belgium and Ireland, it appears to be fairly important in Denmark, Italy and Spain. Yet, the
size wage gap remains positive and significant in all countries (except in Denmark).
According to efficiency wage theories, large employers may substitute high monitoring
costs with wage premia. To test the validity of this hypothesis, a dummy variable showing
whether the individual supervises the work of his co-workers has been added to our model.16
Results in row 6 of Table 1 show that the inclusion of this variable does almost not affect the
estimated size wage differentials.17
All in all, we find that a doubling of the establishment size increases earnings by 0.5 per
cent in Denmark, 3.2 per cent in Belgium, 3.5 per cent in Italy, 4.1 per cent in Ireland, and 4.5
per cent in Spain. Hence, results suggest that a substantial part of the size wage premia
remains unexplained after controlling for a large set of workers’ and employers’ characteristic
(except in Denmark).
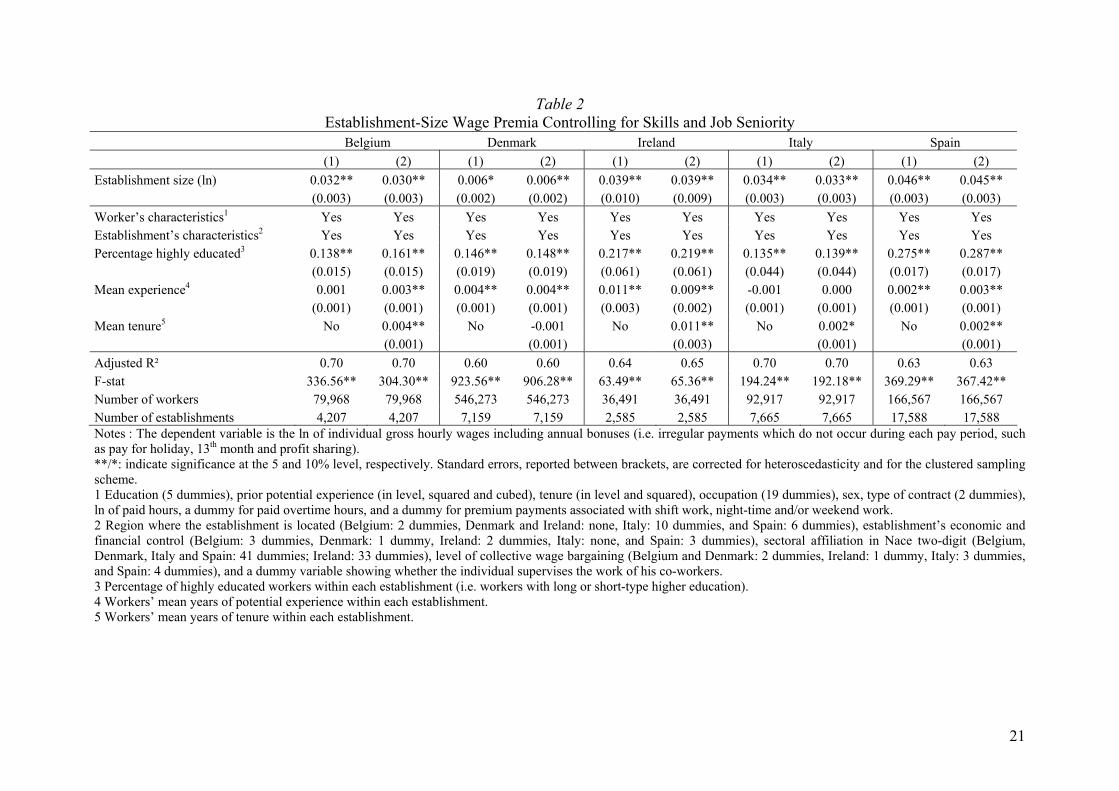
[Take in Table 2]
In order to get some additional insight into the nature of these unexplained size wage
premia, two alternative explanations have been examined. The first explanation, developed by
arrangements. In all countries, the left out reference group is composed of establishments solely covered by
national and/or sectoral CAs.
14. In Ireland and Italy, this result may be explained by the fact that the level of wage bargaining has no
significant impact on workers’ wages (Results of the wage regressions are available upon request). In
Denmark, it is due to the fact that the level of wage bargaining is almost not influenced by the size of the
establishment (see Appendix 1).
15. Notice that the inclusion of regional and sectoral dummies already captures part of the diversity in working
conditions.
16. Unfortunately, this variable is not available for Spain.
17. However, notice that the establishment-size wage premium in Denmark becomes again significant.
11
Troske (1999), is that large firms match high skilled workers together. To test this hypothesis,
we controlled for the percentage of highly educated individuals within each establishment (i.e.
workers with long and short-type higher education) and for the workers’ mean years of
potential experience within each establishment. Columns (1) of Table 2 present the results of
this new specification for each country. Findings indicate that workers within establishments
employing more educated individuals earn significantly higher wages. They also show, for
most countries, that the mean experience level within the establishment has a positive impact
on workers’ wages. In addition, we find that the coefficient of the establishment size remains
almost the same in all countries when controlling for education and experience at the
establishment level. Hence, the hypothesis of a higher concentration of skilled workers in
large establishments does not seem to provide a valid explanation for the elasticity between
size and wages. A similar result has been found for the US by Bayard and Troske (1999).
Another hypothesis for the size wage gap is that jobs are more stable within large firms
(Black et al., 1999; Idson, 1996; Winter-Ebmer, 2001). To test this hypothesis, we included
information on the workers’ mean years of tenure within each establishment. Results, reported
in columns (2) of Table 2, show that workers within establishments promoting job stability
earn higher wages (except in Denmark). Moreover, we find that controlling for tenure at the
establishment level almost not affects the estimated size wage premia. Thus, it appears that
size differences in job stability do not significantly contribute to the size wage gap.
[Take in Table 3]
Preceding results emphasize that the magnitude of the size wage elasticity fluctuates
considerably across countries. Indeed, controlling for many observable characteristics, we
find that the elasticity ranges between 0.045 in Spain and 0.006 in Denmark. In seeking to
explain the diversity of these effects, we examined their correlation with collective bargaining
characteristics, i.e. the degree of centralisation, the degree of coordination, the trade union
coverage rate, and the trade union density.18 Results, reported in Table 3, show the existence
18. The degree of centralisation refers strictly to the principal level at which bargaining occurs (establishment,
firm, industry or national). In contrast, the degree of coordination among the social partners refers to the
ability of trade unions and employers’ organisations to coordinate their decisions both horizontally (within a
given bargaining level) and vertically (between different bargaining levels). Coordination might be ‘overt’
or ‘covert’. Overt or direct coordination refers to the explicit pursuit of economy-wide coordination goals by
the principal bargaining agents (i.e. peak associations of business and labour, possibly joined by the

12
of a significant and negative relationship between the size wage elasticity and three collective
bargaining characteristics, i.e. the degree of centralisation, the degree of coordination, and the
trade union density. To put it differently, results suggest that the establishment size has a
stronger impact on workers’ wages in less corporatist countries. Hence, they fit in nicely with
earlier findings reported by Teulings and Hartog (1998).
2. Sensitivity Analysis
So far, the relationship between establishment size and workers’ wages has been analysed for
the whole economy. In this section, we examine whether this relationship differs across
occupations (i.e. white- and blue-collar workers) and industrial sectors (i.e. the manufacturing
and service industries).
[Take in Table 4]
After controlling for many observable characteristics, we find in all countries a positive
and significant establishment-size wage premium for both white- and blue-collar workers (see
Table 4). However, the size wage gap appears to be significantly larger for blue-collar
workers in Belgium, Denmark and Ireland (see row 1 of Table 6). A plausible explanation for
this finding is provided by Villemez and Bridges (1988). The authors argue that the size of the
establishment should be more salient for blue-collar workers because (as suggested by
Granovetter, 1984) workers below the middle-management level often live out their careers in
single establishments. In contrast, the earnings of white-collar workers should be more
sensitive to the size of the firm because larger firms offer more possibilities of inter-
establishment movement and lines of advancements.
[Take in Table 5]
[Take in Table 6]
government agencies in tripartite arrangements). In contrast, covert or indirect coordination is achieved
through the internal governance of the associations and/or through the pace-setting role of bargaining in key
sectors (for a more detailed discussion see e.g. OECD (1997, 2004)).

13
Finally, results in Table 5 show the existence of a positive and significant size wage
premium in both the manufacturing and service sectors.19 However, in all countries the
premium appears to be significantly larger in the manufacturing sector (see row 2 of Table 6).
This result suggests that establishment-level characteristics which differ significantly across
sectors, such as the capital-labour ratio or the computer usage, may account for the
establishment-size wage premium. Yet, caution is required because Bayard and Troske (1999)
end up with a different conclusion for the US. Using matched employer-employee data, the
authors find that the establishment-size wage premium is strikingly similar across industries.
A possible explanation for these conflicting results is that the study of Bayard and Troske
(1999) contains a larger number of control variables.
V. CONCLUSION
In this paper we examined the magnitude and sources of the establishment-size wage
premium in five European countries, i.e. Belgium, Denmark, Ireland, Italy, and Spain. To do
so, we used a unique harmonised matched employer-employee data set, i.e. the 1995
European Structure of Earnings Survey. This survey contains detailed information, reported
by the management of the establishments, both on the individual workers (e.g. gross hourly
wages, bonuses, age, education, tenure, sex, occupation) and the employers’ characteristics
(e.g. sector of activity, region, level of wage bargaining, size of the establishment). The size
of the establishment is measured by the exact number of employees. Hence, it overcomes the
potential measurement errors present in studies where the categorized employer-size data are
converted into a continuous measure of establishment size (Albaek et al., 1998).
To our knowledge, this paper is the first to provide evidence on the scale and
determinants of the establishment-size wage premia across European countries on the basis of
harmonised matched employer-employee data. It is also one of the few, with Albaek et al.
(1998) and Teulings and Hartog (1998), to analyse if the elasticity between establishment size
and wages depends upon collective bargaining institutions. Finally, it adds to the existing
literature by examining whether the size wage gap fluctuates across industrial sectors and
occupations within European countries. Empirical findings, reported in this paper, show the
existence of positive and significant establishment-size wage premia in all countries, even
when controlling for human capital variables, occupations and gender. These premia derive 19. Except in Ireland where the coefficient of establishment size is not significant in the service sector.

14
partly from sectoral effects (in all countries), size differences in working conditions (in Spain,
Denmark, and Italy), regional effects (in Spain), and size differences in levels of wage
bargaining (in Belgium and Spain). In contrast, size differences in job stability and in the
concentration of skilled workers do not seem to account for these premia. Another important
result is that the magnitude of the elasticity between establishment-size and workers’ wages
fluctuates considerably across countries. Findings suggest that, on average, a doubling of the
establishment size increases earnings by 0.6 per cent in Denmark, 3.0 per cent in Belgium, 3.3
per cent in Italy, 3.9 per cent in Ireland, and 4.5 per cent in Spain. In seeking to explain the
diversity of these effects, we examined their correlation with collective bargaining
characteristics. Results show the existence of a significant and negative relationship between
the size wage elasticity and three collective bargaining characteristics, i.e. the degree of
centralisation, the degree of coordination, and the trade union density. To put it differently,
findings suggest that the size of the establishment has a stronger impact on workers’ wages in
less corporatist countries. Hence, they fit in nicely with earlier results reported by Teulings
and Hartog (1998). Finally, we found for most countries that the magnitude of the size wage
premium is significantly larger in the manufacturing sector and for blue-collar workers.
Unfortunately, we were not able to correct for the potential non random sorting process
of workers across firms of different sizes. The point is that the ESES contains no information
on supply-side variables that are generally used to account for selection effects in a cross-
section (e.g. the marital status, the household composition).20 This might be an important
limitation. However, it should not be overestimated because cross-sectional studies using
linear instruments found no or only partial evidence for the existence of a selection bias (e.g.
Albaek et al., 1998; Main and Reilly, 1993). Besides, it is not clear whether linear instruments
used in the literature to control for the selection bias are valid. Nevertheless, papers relying on
panel data methods and using non-linear instruments obtained results in favour of a non
random assignment of workers (e.g. Ferrer and Lluis, 2004; Silva, 2004). Be that as it may,
the endogeneity of establishment-size remains an empirical question for many European
countries and should be addressed in future work. It would also be interesting to rely on
20. However, we tried to correct for the non random assignment of workers with several instruments (e.g.
dummies for sectoral affiliation interacted with blue-collar status, dummies for education levels interacted
with sex, mean of blue-collar workers per establishment, and mean of women per establishment). Using
2SLS, we obtained for most countries larger establishment-size wage effects. However, Sargan’s (1964)
over-identification test showed systematically that our instruments were not valid. Therefore, we have
chosen not to report our 2SLS estimates.
15
European matched employer-employee panel data so as to investigate if the unobserved skills
of workers are differently rewarded in establishments of different sizes.
REFERENCES
Abowd, John M., Francis Kramarz, and David N. Margolis (1999). High Wage Workers and
High Wage Firms, Econometrica. 67: 251-334.
Albaek, Karsten, Mahmood Arai, Rita Asplund, Erling. Barth and Erik Madsen (1998).
Measuring Wage Effects of Plant Size, Labour Economics. 5: 425-48.
Barron, John M., Dan A. Black, Mark A. Loewenstein (1987). Employer Size: The
Implications for Search, Training, Capital Investment, Starting Wages, and Wage
Growth, Journal of Labor Economics. 5: 76-88.
Barth, Erling, Robin Naylor and Oddbjørn Raaum (1994). Does Union Density Matter ?,
Working Paper, Institute for Social Research, Oslo, Norway.
Bayard, Kimberly and Kenneth R. Troske (1999). Examining the Employer-size Wage
Premium in the Manufacturing, Retail Trade, and Service Industries Using Employer-
employee Matched Data, American Economic Review. 89: 99-103.
Black, Dan A., Brett J. Noel and Zheng Wang (1999). On-the-job Training, Establishment
Size, and Firm Size: Evidence for Economies of Scale in the Production of Human
Capital, Southern Economic Journal. 66: 82-100.
Blanchflower, David G., Andrew J. Oswald and Peter Sanfey (1996). Wages, Profits and
Rent-sharing, Quarterly Journal of Economics. 111: 227-51.
Brown, Charles and James L. Medoff (1989). The Employer Size Wage Effect, Journal of
Political Economy. 97: 1029-57.
Brown, Charles, James Hamilton and James L. Medoff (1990). Employers Large and Small.
Cambridge (Mass.): Harvard University Press.
Brunello, Giorgio and Aldo Colussi (1998). The Employer Size-wage Effect: Evidence from
Italy, Labour Economics. 5: 217-30.
Criscuolo, Chiara (2000). Employer Size-wage Effect: A Critical Review and an Econometric
Analysis, Universita degli Studi di Siena, Dipartimento Di Economia Politica, Working
Paper 277.
Doeringer, Peter B. and Michael J. Piore (1971). Internal Labour Markets and Manpower
Analysis. D.C. Heath: Lexington.
16
Eaton, Curtis B. and William D. White (1983). The Economy of High Wages: An Agency
Problem, Economica. 50: 175-81.
European Industrial Relations Observatory (2002). Industrial Relations in the EU Member
States and Candidate Countries, Working Paper, European Foundation for the
Improvement of Living and Working Conditions.
Ferrer, Ana and Stéphanie Lluis (2004). Should Workers Care About Firm Size ?, University
of Minnesota, Industrial Relations Center, HRRI Working Paper 0204.
Gannon, Brenda, Robert Plasman, François Rycx and Ilan Tojerow (2004). Inter-industry
Wage Differentials and the Gender Wage Gap: Evidence from European Countries,
PiEP Working Paper, London School of Economics.
Garen, John E. (1985). Worker Heterogeneity, Job Screening, and Firm Size, Journal of
Political Economy. 93: 715-39.
Gerlach, Knut and Olaf Hübler (1998). Firm Size and Wages in Germany – Trends and
Impacts of Mobility, Empirica. 25: 245-61.
Granovetter, Mark S. (1984). Small Is Bountiful: Labor Markets and Establishment Size,
American Sociological Review. 40: 323-34.
Greenwald, Bruce (1983). A General Analysis of Bias in the Estimated Standard Errors of
Least Square Coefficients, Journal of Econometrics. 22: 323-38.
Hamermesh, Daniel S. (1980). Commentary, in: John. J. Siegfried (eds.), The Economics of
Firm Size, Market Structure, and Social Performance, Washington: Federal Trade
Commission.
Hartog, Joop, Edwin Leuven and Coen Teulings (1997). Wages and the Bargaining Regime in
a Corporatist Setting: The Netherlands, Discussion Paper No. 1706, CEPR, London.
Heckman, James J. (1976). The Common Structure of Statistical Models of Truncation,
Sample Selection and Limited Dependent Variables and a Simple Estimator for Such
Models, Annals of Economic and Social Measurement. 5: 475-92.
Heckman, James J. (1979). Sample Selection Bias as a Specification Error, Econometrica. 47:
153-62.
Idson, Todd L. and Daniel J. Feaster (1990). A Selectivity Model with Employer Size Wage
Differentials, Journal of Labor Economics. 8: 99-122.
Idson, Todd L. (1996). Employer Size and Labor Turnover, in: Solomon W. Polatchek (eds.),
Research in Labor Economics, Vol. 15, Greenwich, CT: JAI Press: 273-304.
Kahn, Lawrence M. (1998). Collective Bargaining and Interindustry Wage Structure:
International Evidence, Economica. 65: 507-34.

17
Kremer, Michael and Eric Maskin (1996). Segregation by Skill and the Rise in Inequality,
National Bureau of Economic Research, Working Paper 5718, Cambridge (MA).
Lee, Lung-Fei (1978). Unionism and Wage Rates: A Simultaneous Equations Model with
Quantitative and Limited Dependent Variables, International Economic Review. 19:
415-33.
Lester, Richard A. (1967). Pay Differentials by Size of Establishment, Industrial Relations. 7:
57-67.
Lucas, Robert E. (1978). On the Size Distribution of Business Firms, Bell Journal of
Economics. 9: 508-23.
Masters, Stanley H. (1969). Wages and Plant Size: An Interindustry Analysis, Review of
Economics and Statistics. 51: 341-45.
Main, Brian G.M. and Barry Reilly (1993). The Employer Size-wage Gap: Evidence for
Britain, Economica. 60: 125-42.
Mellow, Weisley (1982). Employer Size and Wages, Review of Economics and Statistics. 64:
495-501.
Mincer, Jacob (1974). Schooling, Experience and Earnings. New York: Columbia University
Press.
Morissette, René (1993). Canadian Jobs and Firm Size: Do Smaller Firms Pay Less ?,
Canadian Journal of Economics. 26: 159-74.
Moulton, Brent R. (1990). An Illustration of a Pitfall in Estimating the Effects of Aggregate
Variables on Micro Units, Review of Economics and Statistics. 72: 334-8.
Nickell, Stephen (1999). Product Markets and Labour Markets, Labour Economics. 6: 1-20.
Nickell, Stephen and Richard Layard (1999). Labor Market Institutions and Economic
Performance, in: Orley C. Ashenfelter and David Card (eds.), Handbook of Labor
Economics, Vol. 3, Amsterdam: North Holland: 3029-84.
OECD (1997). Employment Outlook. OECD: Paris.
OECD (2004). Employment Outlook. OECD: Paris.
Oi, Walter Y. (1983). The Fixed Costs of Specialized Labor, in: Jack E. Triplett (eds.), The
Measurement of Labor Cost, Chicago: University of Chicago Press.
Oi, Walter Y. and Todd L. Idson (1999a). Firm Size and Wages, in: Orley C. Ashenfelter and
David Card (eds.), Handbook of Labor Economics, Vol. 3, Amsterdam: North Holland:
2166-214.

18
Oi, Walter Y. and Todd L. Idson (1999b). Workers Are More Productive in Large Firms,
American Economic Review, Papers and Proceedings. 89: 104-8.
Rycx, François and Ilan Tojerow (2004). Rent Sharing and the Gender Wage Gap in Belgium,
International Journal of Manpower. 25: 279-99.
Sargan, John Denis (1964). Wages and Prices in the United Kindom: A Study in Econometric
Methodology, in: P.E. Hart, G. Mills and J.K. Whitaker (eds.), Econometric Analysis for
National Economic Planning, Butterworths, London.
Scherer, F.M. (1976). Industrial Structure, Scale Economies and Worker Alienation, in: R.T.
Masson and P.D. Qualls (eds.), Essays on Industrial Organization in Honour of Joe S.
Bain, Cambridge (Mass.): Ballinger.
Schmidt, Christoph M. and Klaus F. Zimmerman (1991). Work Characteristics, Firm Size and
Wages, Review of Economics and Statistics. 73: 705-10.
Shapiro, Carl and Joseph E. Stiglitz (1984). Equilibrium Unemployment as a Worker
Discipline Device, American Economic Review. 74: 433-44.
Silva, João C.C. (2004). Estimating the Employer Size-wage Premium in a Panel Data Model
with Comparative Advantage and Non-random Selection, Universidade do Minho, NIPE
Working Paper.
Slichter, Sumner H. (1950). Notes on the Structure of Wages, Review of Economics and
Statistics. 32: 80-91.
StataCorp (1999). Stata Statistical Software: Release 6.0, College Station Texas: Stata
Corporation.
Teulings, Coen and Joop Hartog (1998). Coporatism or Competition? Labour Contracts,
Institutions and Wage Structures in International Comparison. Cambridge: Cambridge
University Press.
Traxler, Franz, Sabine Blaschke and Bernhard Kittel (2001). National Labour Relations in
Internationalized Markets. A Comparative Study of Institutions, Change and
Performance. Oxford: Oxford University Press.
Troske, Kenneth R. (1999). Evidence on the Employer-size Wage Premium from Worker-
Establishment Matched Data, Review of Economics and Statistics. 81: 1-12.
Villemez, Wayne J. and William P. Bridges (1988). When Bigger is Better: Differences in the
Individual-level Effect of Firm and Establishment Size, American Sociological Review.
53: 237-55.
Voos, Paula B. (1983). Union Organizing: Costs and Benefits, Industrial and Labor Relations
Review. 36: 576-91.
19
Weiss, Leonard W. (1966). Concentration and Labor Earnings, American Economic Review.
56: 96-117.
Weiss, Andrew and Henry J. Landau (1984). Wages, Hiring Standards, and Firm Size,
Journal of Labor Economics. 2: 477-99.
White, Halbert (1980). A Heteroscedasticity-consistent Covariance Matrix Estimator and a
Direct Test for Heteroscedasticity, Econometrica. 48: 817-30.
Winter-Ebmer, Rudolf (2001). Firm Size, Earnings, and Displacement Risks, Economic
Inquiry. 39: 474-86.
Winter-Ebmer, Rudolf and Josef Zweimüller (1999). Firm-size Differentials in Switzerland:
Evidence from Job-changers, American Economic Review, Papers and Proceedings. 89:
89-93.

20
Table 1 Establishment-Size Wage Premia, Coefficients for Ln(Establishment Size),
With Different Control Variables Belgium Denmark Ireland Italy Spain Basic variables1 0.051** 0.012** 0.049** 0.047** 0.068** (0.003) (0.005) (0.011) (0.003) (0.004) Industry2 0.036** 0.009** 0.042** 0.041** 0.062** (0.003) (0.002) (0.009) (0.003) (0.003) Region and/or financial control3 0.035** 0.009** 0.042** 0.039** 0.056** (0.003) (0.002) (0.009) (0.003) (0.003) Collective agreement4 0.032** 0.010** 0.041** 0.039** 0.052** (0.003) (0.002) (0.009) (0.003) (0.003) Working conditions5 0.030** 0.004 0.040** 0.035** 0.045** (0.003) (0.003) (0.010) (0.003) (0.003) Monitoring6 0.032** 0.005* 0.041** 0.035** − (0.003) (0.003) (0.01) (0.003) Adjusted R² 0.69 0.59 0.64 0.70 0.63 F-stat 262.04** 909.22** 65.94** 197.82** 358.83** Number of workers 79,968 546,273 36,491 92,917 166,567 Number of establishments 4,207 7,159 2,585 7,665 17,588 Notes : The dependent variable is the ln of individual gross hourly wages including annual bonuses (i.e. irregular payments which do not occur during each pay period, such as pay for holiday, 13th month and profit sharing). **/*: indicate significance at the 5 and 10% level, respectively. Standard errors, reported between brackets, are corrected for heteroscedasticity and for the clustered sampling scheme. The values of the adjusted R² and F statistic derive from wage regressions including all control variables. 1 Basic variables: education (5 dummies), prior potential experience (in level, squared and cubed), tenure (in level and squared), occupation (19 dummies), and sex. 2 Sectoral affiliation in Nace two-digit: Belgium, Denmark, Italy, and Spain (41 dummies), and Ireland (33 dummies). 3 Region where the establishment is located: Belgium (2 dummies), Denmark and Ireland (none), Italy (10 dummies), and Spain (6 dummies). Economic and financial control: Belgium (3 dummies), Denmark (1 dummy), Ireland (2 dummies), Italy (none), and Spain (3 dummies). 4 Level of collective wage bargaining: Belgium and Denmark (2 dummies), Ireland (1 dummy), Italy (3 dummies), and Spain (4 dummies). 5 Working conditions: type of contract (2 dummies), ln of paid hours, a dummy for paid overtime hours, and a dummy for premium payments associated with shift work, night-time and/or weekend work. 6 Dummy variable showing whether the individual supervises the work of his co-workers.
21
Table 2 Establishment-Size Wage Premia Controlling for Skills and Job Seniority
Belgium Denmark Ireland Italy Spain (1) (2) (1) (2) (1) (2) (1) (2) (1) (2) Establishment size (ln) 0.032** 0.030** 0.006* 0.006** 0.039** 0.039** 0.034** 0.033** 0.046** 0.045** (0.003) (0.003) (0.002) (0.002) (0.010) (0.009) (0.003) (0.003) (0.003) (0.003) Worker’s characteristics1 Yes Yes Yes Yes Yes Yes Yes Yes Yes Yes Establishment’s characteristics2 Yes Yes Yes Yes Yes Yes Yes Yes Yes Yes Percentage highly educated3 0.138** 0.161** 0.146** 0.148** 0.217** 0.219** 0.135** 0.139** 0.275** 0.287** (0.015) (0.015) (0.019) (0.019) (0.061) (0.061) (0.044) (0.044) (0.017) (0.017) Mean experience4 0.001 0.003** 0.004** 0.004** 0.011** 0.009** -0.001 0.000 0.002** 0.003** (0.001) (0.001) (0.001) (0.001) (0.003) (0.002) (0.001) (0.001) (0.001) (0.001) Mean tenure5 No 0.004** No -0.001 No 0.011** No 0.002* No 0.002** (0.001) (0.001) (0.003) (0.001) (0.001) Adjusted R² 0.70 0.70 0.60 0.60 0.64 0.65 0.70 0.70 0.63 0.63 F-stat 336.56** 304.30** 923.56** 906.28** 63.49** 65.36** 194.24** 192.18** 369.29** 367.42** Number of workers 79,968 79,968 546,273 546,273 36,491 36,491 92,917 92,917 166,567 166,567 Number of establishments 4,207 4,207 7,159 7,159 2,585 2,585 7,665 7,665 17,588 17,588 Notes : The dependent variable is the ln of individual gross hourly wages including annual bonuses (i.e. irregular payments which do not occur during each pay period, such as pay for holiday, 13th month and profit sharing). **/*: indicate significance at the 5 and 10% level, respectively. Standard errors, reported between brackets, are corrected for heteroscedasticity and for the clustered sampling scheme. 1 Education (5 dummies), prior potential experience (in level, squared and cubed), tenure (in level and squared), occupation (19 dummies), sex, type of contract (2 dummies), ln of paid hours, a dummy for paid overtime hours, and a dummy for premium payments associated with shift work, night-time and/or weekend work. 2 Region where the establishment is located (Belgium: 2 dummies, Denmark and Ireland: none, Italy: 10 dummies, and Spain: 6 dummies), establishment’s economic and financial control (Belgium: 3 dummies, Denmark: 1 dummy, Ireland: 2 dummies, Italy: none, and Spain: 3 dummies), sectoral affiliation in Nace two-digit (Belgium, Denmark, Italy and Spain: 41 dummies; Ireland: 33 dummies), level of collective wage bargaining (Belgium and Denmark: 2 dummies, Ireland: 1 dummy, Italy: 3 dummies, and Spain: 4 dummies), and a dummy variable showing whether the individual supervises the work of his co-workers. 3 Percentage of highly educated workers within each establishment (i.e. workers with long or short-type higher education). 4 Workers’ mean years of potential experience within each establishment. 5 Workers’ mean years of tenure within each establishment.

22
Table 3 Correlation Between the Establishment-Size Wage Premia
and Collective Bargaining Characteristics
Year
Establishment size wage premium1
Degree of centralisation2
Degree of coordination3
Union coverage
rate4 Union
density5
Belgium 1995 0.030 10 2 0.96 0.51 Denmark 1995 0.006 14 3 0.69 0.71 Ireland 1995 0.039 6 1 0.66 0.50 Italy 1995 0.033 5 2 0.90 0.39 Spain 1995 0.045 7 2 0.83 0.11 Correlation between establishment-size wage premia and collective bargaining characteristics: -0.86* -0.78° 0.27 -0.84*
Notes: **/*/°: indicate significance at the 5, 10 and 15% level, respectively. 1 Coefficient of establishment size controlling for worker’s and establishment’s characteristics, workforce skills, and job seniority (see Columns (2) of Table 2). 2 Nickell and Layard (1999). The scale ranges between 1 and 17. A large value is associated with a highly centralised country. 3 Nickell and Layard (1999). Average of union and employer coordination. 1, 2 and 3 stand for low, intermediate and high coordination, respectively. 4 EIRO (2002) and Traxler et al. (2001). 5 Nickell and Layard (1999).

23
Table 4 Establishment-Size Wage Premia Across Occupations
Belgium Denmark Ireland Italy Spain Blue White Blue White Blue White Blue White Blue White Establishment size (ln) 0.039** 0.025** 0.012** 0.003* 0.085** 0.020* 0.034** 0.034** 0.040** 0.047** (0.004) (0.003) (0.003) (0.002) (0.008) (0.010) (0.003) (0.004) (0.003) (0.004) Worker’s characteristics1 Yes Yes Yes Yes Yes Yes Yes Yes Yes Yes Establishment’s characteristics2 Yes Yes Yes Yes Yes Yes Yes Yes Yes Yes Percentage highly educated3 Yes Yes Yes Yes Yes Yes Yes Yes Yes Yes Mean experience4 Yes Yes Yes Yes Yes Yes Yes Yes Yes Yes Mean tenure5 Yes Yes Yes Yes Yes Yes Yes Yes Yes Yes Adjusted R² 0.49 0.71 0.57 0.63 0.59 0.69 0.60 0.70 0.58 0.63 F-stat 36.98** 323.68** 374.74** 1,156.56** 50.40** 80.02** 111.98** 184.26** 260.15** 265.98** Number of employees 29,849 50,119 257,418 288,855 18,513 17,978 54,047 38,870 95,545 71,022 Number of establishments 2,950 3,744 6,195 6,553 2,223 2,349 6,257 6,628 15,132 14,544
Notes : The dependent variable is the ln of individual gross hourly wages including annual bonuses (i.e. irregular payments which do not occur during each pay period, such as pay for holiday, 13th month and profit sharing). Blue-collar workers are workers registered within ISCO codes 71 to 93. **/*: indicate significance at the 5 and 10% level, respectively. Standard errors, reported between brackets, are corrected for heteroscedasticity and for the clustered sampling scheme. 1 Education (5 dummies), prior potential experience (in level, squared and cubed), tenure (in level and squared), occupation (19 dummies), sex, type of contract (2 dummies), ln of paid hours, a dummy for paid overtime hours, and a dummy for premium payments associated with shift work, night-time and/or weekend work. 2 Region where the establishment is located (Belgium: 2 dummies, Denmark and Ireland: none, Italy: 10 dummies, and Spain: 6 dummies), establishment’s economic and financial control (Belgium: 3 dummies, Denmark: 1 dummy, Ireland: 2 dummies, Italy: none, and Spain: 3 dummies), sectoral affiliation in Nace two-digit (Belgium, Denmark, Italy and Spain: 41 dummies; Ireland: 33 dummies), level of collective wage bargaining (Belgium and Denmark: 2 dummies, Ireland: 1 dummy, Italy: 3 dummies, and Spain: 4 dummies), and a dummy variable showing whether the individual supervises the work of his co-workers. 3 Percentage of highly educated workers within each establishment (i.e. workers with long or short-type higher education). 4 Workers’ mean years of potential experience within each establishment. 5 Workers’ mean years of tenure within each establishment.

24
Table 5
Establishment-Size Wage Premia Across Industries
Belgium Denmark Ireland Italy Spain Manuf. Services Manuf. Services Manuf. Services Manuf. Services Manuf. Services Establishment size (ln) 0.041** 0.021** 0.012** 0.004* 0.086** 0.001 0.041** 0.030** 0.055** 0.039** (0.004) (0.004) (0.004) (0.002) (0.008) (0.013) (0.004) (0.004) (0.004) (0.004) Worker’s characteristics1 Yes Yes Yes Yes Yes Yes Yes Yes Yes Yes Establishment’s characteristics2 Yes Yes Yes Yes Yes Yes Yes Yes Yes Yes Percentage highly educated3 Yes Yes Yes Yes Yes Yes Yes Yes Yes Yes Mean experience4 Yes Yes Yes Yes Yes Yes Yes Yes Yes Yes Mean tenure5 Yes Yes Yes Yes Yes Yes Yes Yes Yes Yes Adjusted R² 0.71 0.71 0.57 0.63 0.63 0.70 0.64 0.75 0.62 0.65 F-stat 209.63** 277.09** 527.42** 1,004.21** 43.70** 36.82** 137.95** 105.61** 341.81** 214.17** Number of employees 42,266 37,702 251,023 295,250 23,052 13,439 66,618 26,299 106,719 59,848 Number of establishments 2,025 2,182 2,974 4,185 1,816 769 5,242 2,423 11,555 6,033
Notes : The dependent variable is the ln of individual gross hourly wages including annual bonuses (i.e. irregular payments which do not occur during each pay period, such as pay for holiday, 13th month and profit sharing). **/*: indicate significance at the 5 and 10% level, respectively. Standard errors, reported between brackets, are corrected for heteroscedasticity and for the clustered sampling scheme. 1 Education (5 dummies), prior potential experience (in level, squared and cubed), tenure (in level and squared), occupation (19 dummies), sex, type of contract (2 dummies), ln of paid hours, a dummy for paid overtime hours, and a dummy for premium payments associated with shift work, night-time and/or weekend work. 2 Region where the establishment is located (Belgium: 2 dummies, Denmark and Ireland: none, Italy: 10 dummies, and Spain: 6 dummies), establishment’s economic and financial control (Belgium: 3 dummies, Denmark: 1 dummy, Ireland: 2 dummies, Italy: none, and Spain: 3 dummies), sectoral affiliation in Nace two-digit (Belgium, Denmark, Italy and Spain: 41 dummies; Ireland: 33 dummies), level of collective wage bargaining (Belgium and Denmark: 2 dummies, Ireland: 1 dummy, Italy: 3 dummies, and Spain: 4 dummies), and a dummy variable showing whether the individual supervises the work of his co-workers. 3 Percentage of highly educated workers within each establishment (i.e. workers with long or short-type higher education). 4 Workers’ mean years of potential experience within each establishment. 5 Workers’ mean years of tenure within each establishment.

25
Table 6 t-Tests for the Equality of Regression Coefficients
Associated to Establishment Size Belgium Denmark Ireland Italy Spain (1) Blue vs. white-collar workers 0.015** 0.008** 0.065** 0 -0.007 (2.96) (2.20) (5.02) 0 (-1.40) (2) Manufacturing vs. services 0.020** 0.008* 0.084** 0.008° 0.016** (3.85) (1.71) (5.45) (1.45) (2.81) Notes: t-statistics of the differences in the coefficients of establishment size are reported between brackets. **/*/°: indicate significance at the 5, 10 and 15% level, respectively.

26
APPENDIX
Table A1 Means and Standard Deviations of Selected Variables
Belgium Denmark Ireland
Overall Sample
Small Establ.1
Large Establ.2
Overall Sample
Small Establ.1
Large Establ.2
Overall Sample
Small Establ.1
Large Establ.2
Gross hourly wage (in EUR) Includes overtime paid, premiums for shift work, night work and/or weekend work and bonuses (i.e. irregular payments which do not occur during each pay period, such as pay for holiday, 13th month, profit sharing, etc.).
14.04 (7.37)
12.54 (6.8)
15.57 (7.6)
18.90 (10.8)
18.52 (10.7)
19.27 (10.8)
11.51 (9.2)
9.56 (8.2)
12.67 (9.6)
Education : No degree or primary 12.3 11.97 12.48 9.17 8.31 10.01 6.26 7.68 5.40 Lower secondary 22.5 21.67 23.39 21.22 20.12 22.30 22.26 24.42 20.99 Upper secondary (General/Techn/Artistic/Prof) 40.6 42.91 38.34 53.15 56.55 49.83 50.47 51.39 49.93 Higher non-university, short type 14.6 14.67 14.54 5.41 5.54 5.28 13.62 10.55 15.44 University and non-univ. higher educ., long type 9.4 8.20 10.72 6.77 5.90 7.62 6.19 4.95 6.93 Post-graduate 0.6 0.58 0.53 4.28 3.58 4.96 1.20 1.01 1.31
Prior potential experience (years) Experience (potentially) accumulated on the labour market before the last job.
9.6 (8.3)
10.76 (8.8)
8.41 (7.5)
13.3 (10.5)
13.59 (10.7)
13.02 (10.3)
7.41 (8.3)
8.25 (8.8)
6.92 (7.96)
Seniority in the establishment (years)
10.4 (9.5)
8.44 (8.7)
12.42 (9.8)
6.21 (7.7)
5.79 (7.3)
6.62 (8.1)
9.23 (8.86)
7.89 (7.9)
10.03 (9.2)
Blue-collar workers3 38.67 39.66 37.99 46.19 42.37 49.92 47.23 52.77 43.94 Female 29.18 31.64 26.65 33.23 32.45 34.00 40.28 37.09 42.19 Overtime paid (yes) 8.11 6.28 9.99 25.43 18.08 32.61 33.14 29.68 35.19 Bonuses for shift work, night work and/or weekend work (yes) 16.93 8.40 25.71 28.08 19.97 35.98 − − −
Type of contract: Unlimited-term employment contract Limited-term employment contract Apprentice/trainee contract or other contract
96.73 2.62 0.65
97.56 1.97 0.47
95.86 3.30 0.84
93.49 1.79 4.72
92.64 1.46 5.90
94.32 2.12 3.56
93.75 4.20 2.05
93.99 3.43 2.88
93.79 4.66 1.55
Supervises the work of other workers (yes) 16.34 16.47 16.20 11.21 13.49 8.97 9.25 9.27 9.23 Size of the establishment (number of workers)
671.71 (1,528.2)
51.94 (38.45)
1,309.49 (1,983.6)
1,346.21 (3,519.7)
54.87 (38.4)
2,610.09 (4,613.2)
1,631.1 (2,986.1)
68.83 (37.49)
2,556.5 (3,449.1)

27
Sector : Other mining and quarrying 0.24 0.37 0.12 0.15 0.23 0.08 1.56 0.47 2.22 Manufacturing 41.75 29.97 53.89 40.55 29.90 50.98 55.63 55.84 52.72 Electricity, gas, steam and hot water supply 1.80 0.16 3.51 0.96 0.73 1.19 4.37 1.33 6.20 Construction 5.15 8.38 1.84 7.83 9.39 6.29 − − − Wholesale and retail trade; repair of motor vehicles, motorcycles and personal and household goods
16.40 23.75 8.75 21.01 29.75 12.46 18.83 26.02 16.35
Hotels and restaurants 1.53 2.64 0.38 1.44 2.01 0.87 8.42 15.15 4.44 Transport, storage and communication 8.60 11.36 5.75 5.18 5.75 4.61 − − − Financial intermediation 11.88 7.56 16.34 10.23 10.32 10.14 11.80 1.19 18.07 Real estate, renting and business activities 12.65 15.81 9.42 12.65 11.92 13.38 − − −
Level of wage bargaining : National and/sectoral CA 45.0 59.7 28.8 76.6 72.5 79.6 60.9 52.9 65.7 Above-enterprise CA − − − − − − − − − Enterprise CA 41.0 22.0 60.6 8.4 7.4 9.4 39.1 47.1 34.3 Establishment CA − − − − − − − − − Other pay-setting arrangements 14.0 18.3 9.6 15.0 20.1 10.0 − − −
Number of employees 79,968 41,547 38,421 546,273 228,321 317,952 36,491 23,061 13,430 Number of establishments 4,207 3,075 1,132 7,159 6,529 630 2,592 2,219 373
Notes: Standard deviations are reported between brackets. Descriptive statistics refer to the weighted sample. 1 Number of workers in the establishment ≥ 10 and < 150. 2 Number of workers in the establishment ≥ 150. 3 Blue-collar workers are workers registered within ISCO codes 71 to 93.

28
Table A1 (Cont.) Means and Standard Deviations of Selected Variables
Italy Spain
Overall Sample
Small Establ.1
Large Establ.2
Overall Sample
Small Establ.1
Large Establ.2
Gross hourly wage (in EUR) Includes overtime paid, premiums for shift work, night work and/or weekend work and bonuses (i.e. irregular payments which do not occur during each pay period, such as pay for holiday, 13th month, profit sharing, etc.).
17.88 (9.6)
15.73 (8.0)
22.06 (10.9)
8.65 (6.1)
7.39 (5.4)
10.7 (6.6)
Education : No degree or primary 14.91 15.37 14.07 31.05 34.01 25.40 Lower secondary 47.47 51.21 40.20 30.33 33.66 24.85 Upper secondary (General/Techn/Artistic/Prof) 33.12 30.78 37.65 18.99 15.67 24.87 Higher non-university, short type 0.35 0.23 0.57 8.46 6.73 11.51 University and non-univ. higher educ., long type 4.12 2.40 7.45 11.09 9.86 13.28 Post-graduate 0.03 0.01 0.06 0.08 0.07 0.09
Prior potential experience (years) Experience (potentially) accumulated on the labour market before the last job.
11.85 (9.7)
12.54 (10.3)
10.51 (8.2)
12.82 (9.7)
14.26 (10.2)
10.29 (7.9)
Seniority in the establishment (years)
10.09 (8.8)
8.31 (7.7)
13.55 (9.7)
10.53 (9.9)
8.53 (9.02)
14.06 (10.4)
Blue-collar workers3 53.93 57.59 46.81 52.97 56.22 47.28 Female 29.80 32.86 23.87 24.63 23.89 25.94 Overtime paid (yes) 38.29 36.97 40.85 9.29 6.88 13.05 Bonuses for shift work, night work and/or weekend work (yes)
20.06 13.76 32.30 14.13 7.02 26.70
Type of contract: Unlimited-term employment contract Limited-term employment contract Apprentice/trainee contract or other contract
93.8 2.55 3.65
92.96 2.55 4.49
95.43 2.55 2.02
73.06 26.2 0.74
66.81 32.05 1.14
84.13 15.83 0.04
Supervises the work of other workers (yes) 13.46 11.91 16.47 − − − Size of the establishment (number of workers)
1,438.1 (7,199.3)
41.97 (34.8)
4,147.8 (11,886)
725.93 (2,314)
43.22 (34.9)
1,934.6 (3,542.1)
Sector : Other mining and quarrying 0.45 0.50 0.36 0.39 0.52 0.16

29
Manufacturing 50.56 51.54 48.68 38.79 37.33 41.47 Electricity, gas, steam and hot water supply 1.91 0.83 4.02 1.40 0.34 3.28 Construction 5.36 7.03 2.12 12.15 16.49 4.47 Wholesale and retail trade; repair of motor vehicles, motorcycles and personal and household goods
8.72 11.46 3.29 19.08 21.74 14.22
Hotels and restaurants 3.00 4.04 0.97 5.59 6.93 3.23 Transport, storage and communication 16.11 9.57 28.90 8.30 5.60 13.09 Financial intermediation 5.24 5.02 5.68 7.58 3.67 14.51 Real estate, renting and business activities 8.65 10.01 5.98 6.72 7.38 5.57
Level of wage bargaining : National and/sectoral CA 75.7 83.6 60.2 33.7 35.0 31.2 Above-enterprise CA − − − 38.0 49.1 18.5 Enterprise CA 19.6 12.2 34.2 23.3 11.6 43.9 Establishment CA 0.8 0.2 1.9 2.4 1.7 3.7 Other pay-setting arrangements 3.9 4.0 3.7 2.6 2.6 2.7
Number of employees 92,917 57,145 35,772 166,567 113,835 52,732 Number of establishments 7,665 5,065 2,040 17,588 15,116 2,472 Notes: Standard deviations are reported between brackets. Descriptive statistics refer to the weighted sample. 1 Number of workers in the establishment ≥ 10 and < 150. 2 Number of workers in the establishment ≥ 150. 3 Blue-collar workers are workers registered within ISCO codes 71 to 93.