The “equilibrium” distribution of grain size fractions and its implications for cross-shore...
19
Marine Geology 135 (1996) 15-33 The “equilibrium” distribution of grain size fractions and its implications for cross-shore sediment transport: a conceptual model Jorge GuillCn a, Piet Hoekstra b a Instituto de Ciencias de1 Mar, C.S.I. C., Paseo Joan de Borbd, sjn. 08039 Barcelona, Spain b Netherlands Centre for Coastal Research, Institute for Marine and Atmospheric Research Utrecht, Utrecht University, P. 0. Box 80.115, 3508 TC Utrecht, The Netherlands Received 14 July 1995; revision 20 June 1996; accepted 20 June 1996 Abstract The relative distribution of individual grain size fractions across the cross-shore coastal profile of Terschelling (North Sea) displays a constant shape when “average” conditions are considered. The shape of the distribution curve depends on the hydrodynamic processes acting in the littoral zone and, if the curve is contemplated in a normalized, relative form, it can be considered as a permanent feature of the nearshore zone. The normalized curve is an “equilibrium distribution curve” and it can be used in the prediction of the cross-shore redistribution of sediments when the textural distribution of the supplied sediment is known. Sediment may be imported into the active profile by either natural or man-induced processes such as e.g. nourishments. The application of the conceptual model in the prediction of the sediment redistribution from the shoreface nourishment carried out in front of the Island of Terschelling indicates a predominant sediment transport from the nourished area towards the shoreline (58%) and a subordinate cross-shore transport in an offshore direction (17%). About 25% of the supplied sediment remains in the nourished area. Comparison of these results with the volumetric estimations of the sediment transport based on the morphological evolution shows a good agreement and suggests that the method gives reliable results. The method may become a simple, additional and useful tool in predicting the behaviour and dispersion of naturally or artificially imported volumes of sediment. The conceptual model is a typical black-box model and it cannot replace the existing and future generations of generic coastal morphodynamic models or process-related models such as 2DV coastal profile models. In addition the application of this model is definitely limited to coastal environments that satisfy certain hydrodynamic and geological conditions that are related to e.g. a longshore uniformity in processes and the lack of influence of sedimentary outcrops. Keywords: nearshore; cross-shore sediment distribution; size fractions; predictive model 0025-3227/96/$15.00 0 1996 Elsevier Science B.V. All rights reserved PIZ SOO25-3227(96)00051-S
-
Upload
jorge-guillen -
Category
Documents
-
view
219 -
download
7
Transcript of The “equilibrium” distribution of grain size fractions and its implications for cross-shore...
Marine Geology 135 (1996) 15-33
The “equilibrium” distribution of grain size fractions and its implications for cross-shore sediment transport: a conceptual
model
Jorge GuillCn a, Piet Hoekstra b
a Instituto de Ciencias de1 Mar, C.S.I. C., Paseo Joan de Borbd, sjn. 08039 Barcelona, Spain b Netherlands Centre for Coastal Research, Institute for Marine and Atmospheric Research Utrecht, Utrecht University,
P. 0. Box 80.115, 3508 TC Utrecht, The Netherlands
Received 14 July 1995; revision 20 June 1996; accepted 20 June 1996
Abstract
The relative distribution of individual grain size fractions across the cross-shore coastal profile of Terschelling (North Sea) displays a constant shape when “average” conditions are considered. The shape of the distribution curve depends on the hydrodynamic processes acting in the littoral zone and, if the curve is contemplated in a normalized, relative form, it can be considered as a permanent feature of the nearshore zone. The normalized curve is an “equilibrium distribution curve” and it can be used in the prediction of the cross-shore redistribution of sediments when the textural distribution of the supplied sediment is known. Sediment may be imported into the active profile by either natural or man-induced processes such as e.g. nourishments.
The application of the conceptual model in the prediction of the sediment redistribution from the shoreface nourishment carried out in front of the Island of Terschelling indicates a predominant sediment transport from the nourished area towards the shoreline (58%) and a subordinate cross-shore transport in an offshore direction (17%). About 25% of the supplied sediment remains in the nourished area. Comparison of these results with the volumetric estimations of the sediment transport based on the morphological evolution shows a good agreement and suggests that the method gives reliable results. The method may become a simple, additional and useful tool in predicting the behaviour and dispersion of naturally or artificially imported volumes of sediment.
The conceptual model is a typical black-box model and it cannot replace the existing and future generations of generic coastal morphodynamic models or process-related models such as 2DV coastal profile models. In addition the application of this model is definitely limited to coastal environments that satisfy certain hydrodynamic and geological conditions that are related to e.g. a longshore uniformity in processes and the lack of influence of sedimentary outcrops.
Keywords: nearshore; cross-shore sediment distribution; size fractions; predictive model
0025-3227/96/$15.00 0 1996 Elsevier Science B.V. All rights reserved
PIZ SOO25-3227(96)00051-S
J. G&II&, P. HoekstraJMarine Geology 135 (1996) 15-33 16
1. Illtroduction
The equilibrium profile concept purports to show that the shape of the littoral profile can be acceptably described as a power function of the distance from the shoreline (Bruun, 1954). This power is derived from the concept of equilibrium energy dissipation and it is depending on the sediment grain size (Dean, 1977; Moore, 1982). Recently, it has been shown that the littoral profile is not always well described when a constant parameter is applied, and it has been suggested to take into account the varying grain size across the profile (Larson, 1991).
The cross-shore sediment distribution in the littoral zone commonly shows a fining trend off- shore when mean values of the grain size distribu- tion are considered (Niedoroda et al., 1985). This pattern is mainly caused by a shoreward increase of energy of wave and current-driven sediment transport processes. The gradient of the grain size distribution is related to interactions between the different transport processes in the profile as well as the grain sizes available in the littoral zone. However, if a littoral profile is affected by artificial nourishment or sediment is supplied by natural processes with a different grain size in comparison to the original deposits, a new grain size distribu- tion has to be established.
Clearly, it would be very interesting to deduce a textural parameter which is characteristic for the profile under steady hydrodynamic conditions and independent of the changes in grain size of the sediment supplied. The distribution of such a parameter could be used in the prediction of the sediment behaviour and dispersion over the littoral profile in response to new inputs of sediment from natural or man-induced processes. In this investi- gation the shape of the distribution curve of indivi- dual grain size fractions across the profile is considered to be such an appropriate and charac- teristic parameter, which is independent of the availability of the fraction in the sediment. The model presented here is based on the assump- tions that:
- when a time-averaged (> 1 year) grain size fraction distribution is estimated, it is considered to represent a time-average response of wave and
current climate. It is a “finger-print” of the system, and
- if new inputs of sediment are introduced into the active profile, the distribution of the grain size fractions is modified, but the transport processes will tend to redistribute the imported sediment in order to establish again the characteristic distribution.
The practical application of this approach requires that certain environmental conditions have to be fulfilled. The following conditions are of fundamental importance:
- the redistribution of sediments is essentially taking place in a cross-shore direction which directly implies a longshore uniformity in hydrody- namic and sediment transport processes which is the case for a long, straight and uniform coast with an arbitrary cross-shore profile;
- each grain size fraction is represented by a typical shape of the distribution curve across the profile and this distribution is not affected by the presence of sedimentary outcrops with strongly deviating lithological characteristics in the active profile;
- in case the sediment is artificially imported in the coastal zone due to dumping or nourishing, the distribution in grain size fractions of the nour- ished material may deviate from the original depos- its but should be in line with the natural range of grain size fractions present in the nearshore zone. Newly imported coarse deposits e.g. will be less mobile, rather inactive in response to local hydro- dynamic processes and may therefore start acting as a kind of pavement.
- the artificial or natural supply of sediment should not considerably modify the morphological behaviour of the nearshore zone. Therefore the amount of sediment supplied should be relatively small in comparison to the amount of sediment involved in nearshore morphodynamics. Significant changes in the nearshore morphology may result in the establishment of a different set of nearshore processes. However, this would vio- late the assumption that the equilibrium distribu- tion of grain size fractions is basically a response to the more or less steady character of these coastal processes on the time scale considered.
It must be emphasized that the newly imported sediment can change the percentage of volumetric
.J. Guillth, P. HoekstrajMarine Geology 135 (1996) 15-33 11
amount of the textural fractions in relation to the total sediment (and change the mean size of the sediment), but the processes responsible for the higher amount of a grain size fraction in one point of the profile than in another will remain steady and consequently the shape of the distribution curve of each grain size fraction across the profile should be the same. In this study, this conceptual model is investigated and applied for a real field situation on the shoreface of the island of Terschelling (The Netherlands).
2. Study area
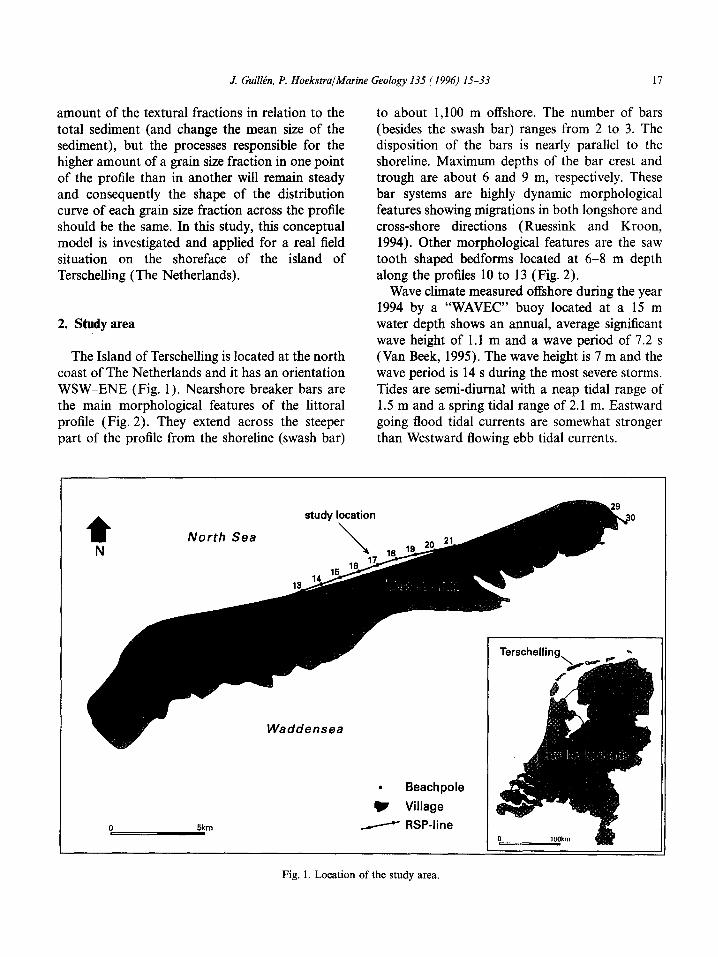
The Island of Terschelling is located at the north coast of The Netherlands and it has an orientation WSW-ENE (Fig. 1). Nearshore breaker bars are the main morphological features of the littoral profile (Fig. 2). They extend across the steeper part of the profile from the shoreline (swash bar)
to about 1,100 m offshore. The number of bars (besides the swash bar) ranges from 2 to 3. The disposition of the bars is nearly parallel to the shoreline. Maximum depths of the bar crest and trough are about 6 and 9 m, respectively. These bar systems are highly dynamic morphological features showing migrations in both longshore and cross-shore directions (Ruessink and Goon, 1994). Other morphological features are the saw tooth shaped bedforms located at 6-8 m depth along the profiles 10 to 13 (Fig. 2).
Wave climate measured offshore during the year 1994 by a “WAVEC” buoy located at a 15 m water depth shows an annual, average significant wave height of 1.1 m and a wave period of 7.2 s (Van Beek, 1995). The wave height is 7 m and the wave period is 14 s during the most severe storms. Tides are semi-diurnal with a neap tidal range of 1.5 m and a spring tidal range of 2.1 m. Eastward going flood tidal currents are somewhat stronger than-Westward flowing ebb tidal currents.
North Sea
study location
\
Waddensea
5km
. Beachpole
t Village
/ RSP-line 0 IWicm
Fig. 1. Location of the study area.

J. Guilh, P. Hoekstmlhiarine Geology 135 (1996) IS-33
Fig. 2. Bathymetric chart of Terschelling and position of analyzed profiles (contours in metres).
The central part of the Terschelling coast shows an erosional trend of about l-5 m/year during the 1982-1991 period (Noordstra, 1992). The retreat of the shoreline extends approximately from km- section 14 to section 20 and it is more intensive near km 17. The shoreline erosion corresponds to an average, annual loss of sediment of about 110,000 m3 (NOURTEC, 1994). In order to combat shoreline erosion for the next 10 years, it was decided to nourish the shoreface of Terschelling with sand. The sand was dumped in the depth interval between 5 and 7 m, filling up the trough between the middle and outer breaker bars and over a distance of 4.4 km along the coast (Hoekstra et al., 1994). The nourishment was implemented in the period April-October 1993 (Fig. 3).
detail in previous studies (Biegel, 1994; Kroon et al., 1995). A review of the most recent results (NOURTEC, 1996) leads to the following conclusions:
(1) the amount of sediment supplied on the shoreface of Terschelling is about 2.1 million m3,
(2) about 0.6 million m3 of nourished sand is transported onshore and towards a higher position in the profile during the period October 1993-September 1994 (Table l),
(3) about 0.1 million m3 of the nourished sand is transported in an alongshore direction eastward during the period October 1993-June 1994.
3. Methods
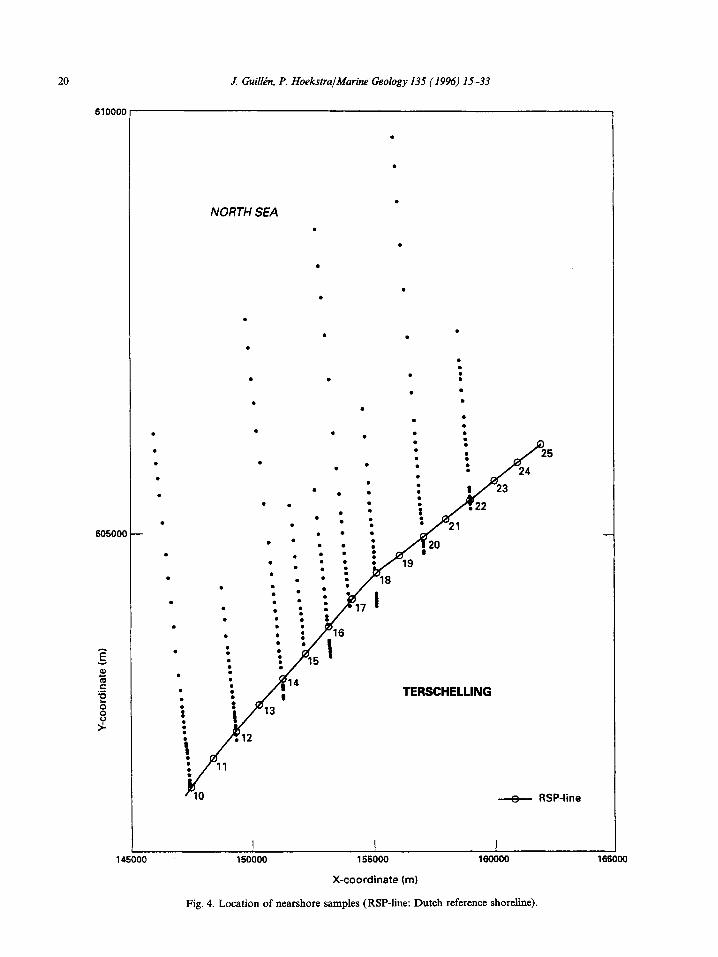
After the nourishment (November 1993), the Sediment sampling was carried out from the outer bar and trough system has become part of dunefoot up to 15 m water depth in March and a more shallow and relatively flat area. In April November 1993 - just prior to and after the 1994, the nourished area tends to be deeper again nourishment - and in April and October 1994 and a new trough is developing almost at the same (Fig. 4). In the nearshore zone, samples were taken location as the previous one (Fig. 3). The volumet- by a survey vessel using a van Veen grab collecting ric development of the nourishment is analyzed in the surface material (up to 3-5 cm depth). Sample
m NAP

J. Guilkk, P. HoekstralMarine Geology 135 (1996) IS-33 19
PROFILE 16
-6
-10 -500 0 500 1000 1500 2000 2
DISTANCE FROM SHORELINE (m)
.- T-O - T-l - T-3 (
Fig. 3. Example of the morphological evolution of the littoral profile during the study period (T-O: March 1993; T-l: November 1993; T-3: October 1994).
Table 1 Volumetric changes (in million m3) in the nourished zone and surrounding areas during the period May 1993 till September 1994 (data from NOURTEC, 1996)
East West Landward Seaward Nourishment Total
May ‘93 to November ‘93
-0.093 +0.416 +0.268 - 0.057 +2.101 +2.635
November ‘93 to April ‘94
-0.045 -0.148 + 0.493 + 0.057 -0.516 -0.159
April ‘94 to September ‘94
-0.158 + 0.005 + 0.484 -0.175 -0.053 +0.103
Total
-0.296 +0.273 + 1.245 -0.175 + 1.532 + 2.579
stations were determined by applying differential GPS or a SYLEDIS navigation system. Additionally, beach samples were taken by hand and their position were determined by standard topographic methods. The profiles 10, 12, 14, 16, 18, 20 and 22 were sampled systematically at the same points in all the campaigns. Samples in profiles 15 and 17 and deeper samples in profiles 10, 14 and 20 were taken during the April and October 1994 campaigns. Finally, a total of 30 samples from the sand source area were also analyzed. These latter samples were obtained by
using a Reineck box-corer in March 1993 and they represent a sediment mixture of the upper 9 to 20 cm of surface material. Cores taken previously suggest that these surface deposits are representa- tive for the borrowed material. The sediment grain size analysis was carried out by settling tube in the laboratory of Delft Hydraulics. The grain size distribution was calculated for all the fractions corresponding to sizes from 100 to 500 pm in steps of 25 l.un. As a next step, the distribution of grain size fractions was computed at equidistant points across the profile (100 m), allowing the comparison
20 J. Guillh, P. HoekstrajMarine Geology 135 (19%) 15-33
61OOOl
605001
.
. . .
.
.
.
.
.
.
.
.
.
i
.
.
.
i
8 .
.
NORTH SEA .
.
.
. l
.
.
.
.
.
.
.
.
l .
.
. .
l .
.
. .
. . . .
. l
l . .
. : l .
l . . .
. l .
.
.
.
.
.
. l
.
.
. :
. .
.
.
. .
.
TERSCHELLING
,* RSP-line
X-coordinate (ml
Fig. 4. Location of nearshore samples (RSP-line: Dutch reference shoreline).

J. Guilh, P. HoekstralMarine Geology 135 (1996) 15-33 21
between all the proties in a coherent way. The main subject of this paper is to study the average conditions in the sediment distribution. For this reason, average profiles were calculated for each campaign using all the profiles (profiles 10 to 22).
4. Sediment distribution
4.1. Median grain size (DJ
The sediment distribution shows a fhring trend in an offshore direction from the shoreline till 6 m water depth. From this point up to 10 m depth, the sediment size remains constant and, finally, coarser sediment is observed towards deeper water (Fig. 5). Based on the morphology and the sedi- ment distribution three zones can be defined on the shoreface of Terschelling: (1) the shallowest and high-mobility zone (from the shoreline up to 6 m water depth) shows a strong sediment fining gradient offshore (10 pm/100 m) and includes the most active bar systems (inner and middle bars), (2) the intermediate zone (6 to 10 m depth) displays a flat profile and a constant grain size, and (3) the deepest or low-mobility zone (deeper
than 10 m) is characterized by a change in the slope of the profile and a coarsening in the sedi- ment grain size.
The area affected by the nourishment is located at 500-900 m from the shoreline, in the shallowest and high-mobility zone of the shoreface profile. The nourished sediment is coarser - about 25 urn - than the original deposits (Table 2). The area directly affected by the nourishment is well delimited between the March 1993 (T-O) and
Table 2 Comparison between the median grain size and the abundance of grain size fractions in the sediment from the borrow area, the average of the profile (- 200 to 1200 m from the shoreline) and the zone afhected directly by the nourishment (500-900 m from the shoreline) (data before the nourishment, March 1993)
Borrow Average profile Nourished area
Median (urn) 196 183 171
100-150 (%) 4 9 10 150-200 50 52 65 200-250 29 24 18 250-300 8 9 5 300-350 5 4 1 >350 3 1 0
1401 I I I -16 -12 , -6 I I -4
I 0
DEPTH (m)
Fig. 5. Cross-shore distribution of the median (L&J of the sediment using all the samples taken for the study.

22 J. Guillh, P. HoekstraJMarine Geology 135 (1996) 15-33
November 1993 (T- 1) campaigns because the sedi- ment becomes coarser (17-57 pm) immediately after the nourishment (Fig. 6). Subsequently, grain size differences between T-l and T-2 (April 1994) campaigns indicate a strong fining of the sediment (up to 36 urn) in the nourished area as well as around it (Fig. 6). Finally, the sediment fining continues during the T-2 and T-3 (October 1994) campaigns, mainly in the shallowest part of the profile.
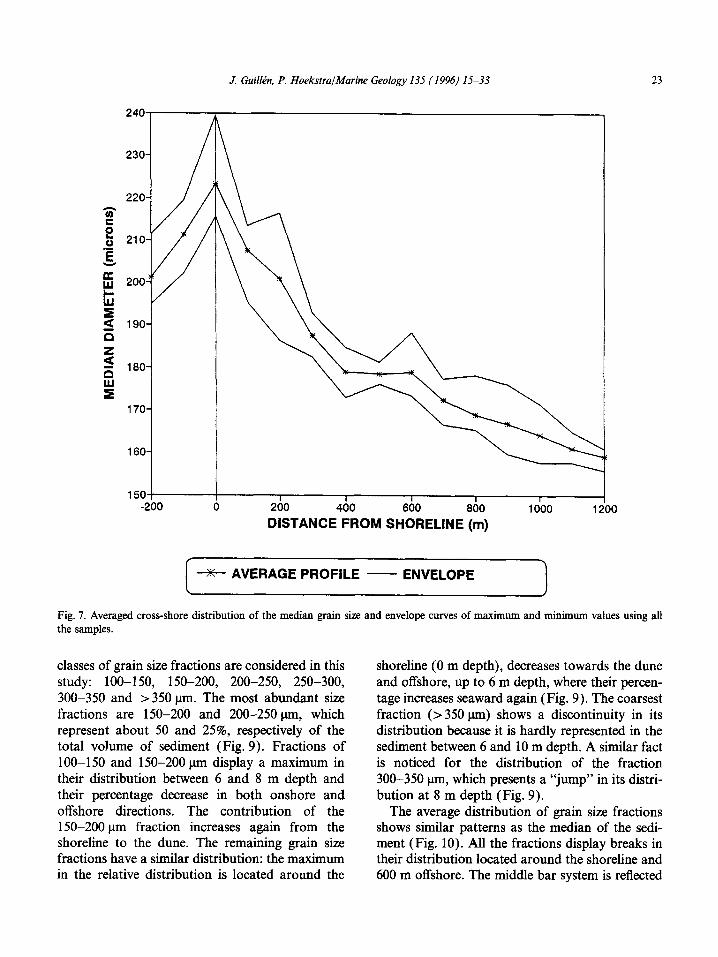
The distribution of the averaged median grain size and its envelopes reveal that the cross-shore pattern of the grain size distribution appears to have a steady character over a period of 19 months
(Fig. 7). The same conclusion can be reached after comparing the average or “master” sample distri- bution for the successive campaigns (Fig. 8). Fig. 8 shows that the distribution for the T-2 campaign is very close to the original one (T-O). Thus, seasonal effects in the grain size are almost neglectables.
4.2. The “equilibrium” distribution of grain size fractions
The sediment is composed of different grain size fractions and each fraction has a particular distri- bution across the littoral profile. Six different
240.
230.
220.
Q
5
2 210.
s
E 200,
I 5 190,
n
5
E 180,
kf
170
160
150 -:
I’
!O(
d 1
I I I I I
200 400 600 800 1000 1
DISTANCE FROM SHORELINE (m)
+ T-O -M- T-l It T-2 -E?- T-3
Fig. 6. Comparison between the average cross-shore grain size distribution in each campaign using all the sampled profiles (T-O: March 1993; T-l: November 1993; T-2: April 1994; T-3: October 1994).
230-
2 E 180-
ii 170-
160
J. Guilh, P. Hoekstra/Marine Geology 135 (1996) 15-33
I I I I I
200 400 600 800 1000 1:
DISTANCE FROM SHORELINE (m)
23
I +I+ AVERAGE PROFILE - ENVELOPE I
Fig. 7. Averaged cross-shore distribution of the median grain size and envelope curves of maximum and minimum values using all the samples.
classes of grain size fractions are considered in this study: 100-150, 150-200, 200-250, 250-300, 300-350 and > 350 urn. The most abundant size fractions are 150-200 and 200-250 pm, which represent about 50 and 25%, respectively of the total volume of sediment (Fig. 9). Fractions of 100-l 50 and 150-200 pm display a maximum in their distribution between 6 and 8 m depth and their percentage decrease in both onshore and offshore directions. The contribution of the 150-200 urn fraction increases again from the shoreline to the dune. The remaining grain size fractions have a similar distribution: the maximum in the relative distribution is located around the
shoreline (0 m depth), decreases towards the dune and offshore, up to 6 m depth, where their percen- tage increases seaward again (Fig. 9). The coarsest fraction (> 350 um) shows a discontinuity in its distribution because it is hardly represented in the sediment between 6 and 10 m depth. A similar fact is noticed for the distribution of the fraction 300-350 unr, which presents a “jump” in its distri- bution at 8 m depth (Fig. 9).
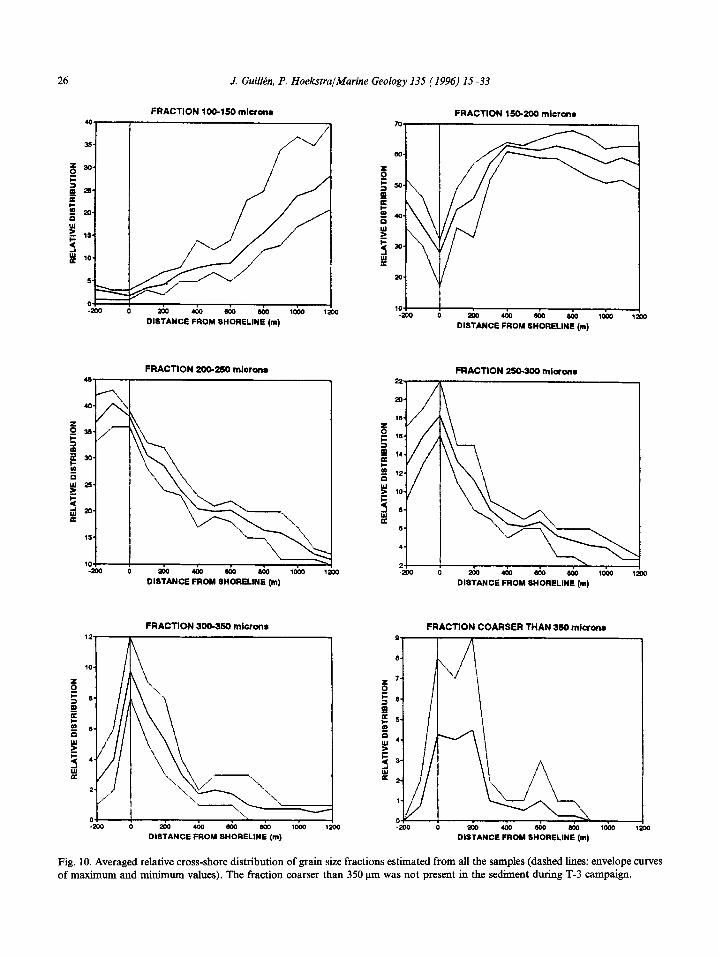
The average distribution of grain size fractions shows similar patterns as the median of the sedi- ment (Fig. 10). All the fractions display breaks in their distribution located around the shoreline and 600 m offshore. The middle bar system is reflected

24 J. Guillch, P. HoekstralMarine Geology 135 (19%) 15-33
60 ,
GRAIN SIZE FRACTION (microns)
1 - T-0 * T-1 ---w-- T-2 ------ T-3 1
Fig. 8. Comparison between the average grain size distribution curve in each campaign (T-O: March 1993; T-l: November 1993; T-2: April 1994; T-3: October 1994).
in coarser fractions (> 200 pm) as peaks in their distribution, whereas the fraction of 150-200 urn is less abundant at this point. The finest fraction ( 100-l 50 pm) shows a continuously increasing dis- tribution from the shoreline into an offshore direc- tion and the gradient becomes steeper at 600 m from the shoreline (Fig. 10).
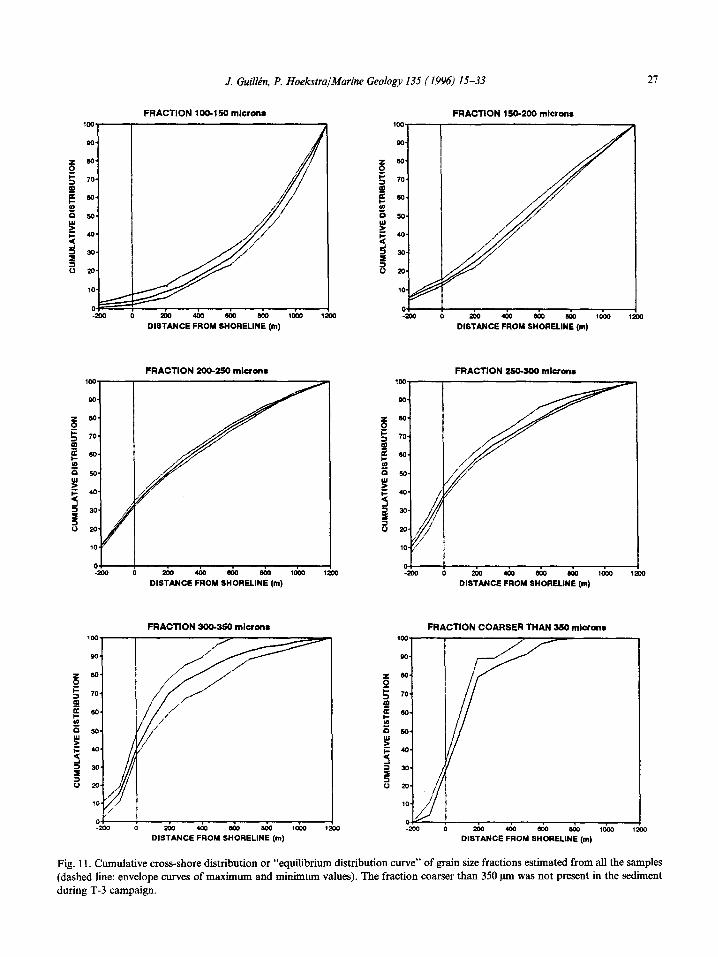
The characteristic cross-shore distribution of grain size fractions for Terschelling and the shape of the cumulative distribution curve are shown in Figs. 10 and 11 respectively. Fig. 11 indicates the percentage in volume of each grain size fraction present in each point of the cross-shore profile or the “equilibrium distribution curve” of this frac- tion. The average distribution estimated from the mean values of each campaign and the envelope curves of maximum and minimum values are very similar. The variability in the distribution, caused by seasonal changes and by the nourishment, is only small for most of the fractions. Strong differ- ences are only observed in the coarsest fractions (>300 cun>, because their distribution is highly
affected by small changes in the abundance due to the fact that they represent less than 4% of the total amount of sediment. The present data set suggests that the relative distribution of each grain size fraction is a more or less permanent, steady and characteristic feature of the littoral zone of Terschelling, when a time-averaged (1.5 years) distribution is considered. The seasonal variability in hydrodynamic conditions and the impact of the nourishment do not significantly alter this distribu- tion. The relative distribution of grain size frac- tions in a cross-shore direction is expected to be proper and well-defined “finger print” of the coastal sedimentary system in response to “average” or prevailing hydrodynamic conditions.
5. Estimation of the cross-shore sediment transport
5.1. General application
The first step in the application of the conceptual model is to define the characteristic cross-shore

J. Guilh. P. HoekstralMarine Geology 135 (1996) 15-33
FRACTION 100-150 microns FRACTION 150-200 microns
DEPTH (m) DEPtli (m)
FRACTION 200-250 microns t I
-12 -8 -4 0
DEPTH (m)
FRACTION 300-350 microns 20
'Lx
x
16
1
-is -12 -6
DEPTH (m)
FRACTION 250400 microns 35 t
x 30 I
DEPTH (m)
FRACTION 2350 microns
DEPTH (m)
Fig. 9. Relative cross-shore distribution of grain size fractions estimated from all the samples.
.I Guillh, P. HoekstrafMarine Geology 135 (1996) 15-33
FRACTION 100-150 mlcrono
-zw 0 soa 4oc 500 5ol woo vao DISTANCE FROM SHORELINE (m)
FRACTION ZOO-2SO microns 45, I
-200 0 200 ux) 500 503 Iwo la0
DISTANCE FROM SHORELINE (m)
FRACTION 300450 mlcratw
DISTANCE FROM SHORELINE (m)
FRACTION 150-200 micron8
wo 5m mm jaw DISTANCE FROM SHORELINE (m)
FRACTION 2SO-300 microns
DISTANCE FROM SHORELINE (m)
FRACTION COARSER WAN 350 microns 0
I A
-m 0 ax, ‘cc mo 500 Iwo 1
DISTANCE FROM SHORELINE (m)
Fig. 10. Averaged relative cross-shore distribution of grain size fractions estimated from all the samples (dashed lines: envelope curves of maximum and minimum values). The fraction coarser than 350 pm was not present in the sediment during T-3 campaign
J. Guillth, P. HoekstrajMarine Geology 135 (1996) 15-33
FRACTION 100-150 microns
DISTANCE FROM SHORELINE (m)
FRACTION 2DD45D microns
200 400 MO MO Iwo
DISTANCE FROM SHORELINE (m)
FRACTION 3DD-350 microns
Pi -m 0 ax, 403 @Jo MO lca 1
DISTANCE FROM SHORELINE (in)
FRACTION 15D-200 microns
DISENCE :OM Sl&LlN?(m)
loo+ 1
0 I
-200 0 200 400 SC4 so0 low
DISTANCE FROM SHORELINE (m)
FRACTION COARSER THAN 350 microns
200 400 MO Iyx) low I
DISTANCE FROM SHORELINE (m)
lo
0
x)
Fig. 11. Cumulative cross-shore distribution or “equilibrium distribution curve” of grain size fractions estimated from all the samples (dashed line: envelope curves of maximum and minimum values). The fraction coarser than 350 pm was not present in the sediment during T-3 campaign.

28 J. G&&n, P. HoekstralMarine Geology 135 (1996) 15-33
distribution of each grain size fraction, considering time-averaged conditions. For the application of the method a (morphological) closure depth of the profile on the time scale considered - about 19 months - has to be defined in order to calculate the relative distribution of the grain size fractions.
In the second phase, for each grain size fraction a new distribution curve is computed based on the relative distribution of these fractions across the profile. The new curve shows the percentage (P) of the considered fraction (i) in each point of the littoral profile (d) relative to the total presence of this fraction. Therefore this approach is actually based on a probability concept. If a new sediment is supplied to the profile, each grain size fraction will tend to disperse across the profile in the way shown by this “equilibrium distribution curve” (PJ. If the volume of sediment supplied to the profile (I’) and the percentage in volume of its grain size fractions (Ai) are all known, it is theoreti- cally possible to calculate the volume of sediment which will be transported from the source area towards all the different points in the profile in order to re-establish the equilibrium distribution. The volume of sediment of a grain size i trans- ported to a point d of the profile is:
S&d) = P(i,d) . (V. Ai)
where (V* Ai) is the volume of the fraction i that has been supplied.
The total volume of sediment transported (TV) at each point of the profile (d) is given by the total sum of the volumes of each individual grain size fraction in this point (TV(d) = &(i,d)). The transport direction for each grain size fraction depends on the location of the source area in the profile (d,) with respect to the considered point (d). If d, > d or d, < d an onshore or offshore sediment transport direction respectively will be predicted. If ds=d, then the cross-shore transport will be nil and the sediment will remain in the source area.
5.2. Application to Tersehelling
The median grain size of the sediment and the grain size fractions show a break in their cross- shore distribution at approximately 6 m depth
across the shoreface of Terschelling. This depth is considered to be the closure depth of the profile because it corresponds to the seaward limit of the shallowest and high-mobility part of the littoral profile during the study period. For practical purposes, it is assumed that the active profile extends from -200 to 1200 m from the shoreline.
&(i,d) was computed at equidistant points of 100 m across the profile. The re-distribution (or dispersion) across the profile of the sediment sup- plied is calculated by adding at each cross-shore interval the sediment volume (in percentage from the total) of the different grain size fractions (TV(d) =C&(i,d)). The result is a curve that shows the theoretical distribution across the profile of a sediment whose grain size distribution is the same as the nourished sediment (Fig. 12A). This theoretical re-distribution curve is independent of the total amount of sediment supplied and it gives the relative deposition in each point of the profile from the total amount of sediment supplied. For instance, the application of the model suggests that in the cross-shore interval between the shore- line and a point located 100 m offshore, about 8% of the total amount of nourished sediment will be deposited (Fig. 12B).
The result shown in Fig. 12A indicates that the re-distribution across the protie of sediment with the actual considered textural characteristics is rather homogeneous. In detail, some variability can be observed across the profile: the amount of sediment deposited is slightly higher near the shoreline and approximately at positions of the bar crests (200,600 and 1100 m from the shoreline) than in the surrounding areas (Fig. 12B). Therefore, the amount of sediment transported in an onshore or offshore direction is mainly depen- dent on the area in the profile where the sediment is supplied. For Terschelling, most of the sediment was placed between 500 and 900 m from the shoreline. Based on the general dispersion patterns described by the results of Fig. 12, the following prediction can be made:
- 58% of the sediment supplied will be trans- ported in an onshore direction,
- 25% will remain in the nourished area (500-900 m from the shoreline),

J. Guilh, P. HoekstraJMarine Geology 135 (1996) 15-33 29
00
lOO,-
p
80-
3 E K &
60-
p’
% F
2
40-
I I i I I I
0 200 400 600 800 1000 1
DISTANCE FROM SHORELINE (m)
B
0
X X
X X X
X
x X
x
x
0
X
X
I I I 1
200 400 600 800 1000 1
DISTANCE FROM SHORELINE (m)
Fig. 12. Prediction of the cross-shore dispersion of the sediment supplied in the littoral profile of Terschelling. (A) Theoretical cumulative curve. (B) Detail of the theoretical cross-shore dispersion of the supplied sediment.
30 J. GuiUn, P. Hoekstralhiarine Geology 135 (1996) 15-33
- 17% will be transported in an offshore direction.
The amount of nourished sediment has been estimated from the morphological evolution and it appears to be 2.100,OOO m3 (NOURTEC, 1996). Applying the conceptual model for Terschelling and using the above figures, the following “gross” sediment transport rates are determined:
- About 1.2 million m3 of sediment will tend to be transported from the nourished zone in an onshore direction,
- About 0.5 million m3 will remain in the nourished zone,
- About 0.36 million m3 will be transported from the nourished zone in an offshore direction.
6. Discussion
In the conceptual model presented in this study, it is assumed that the distribution of the grain size fractions is representative for some specific mean hydrodynamic conditions. However, the nourish- ment can change the hydrodynamics of the area and, consequently, the typical distribution of the grain size fractions may also change. This fact implies that the method is only useful when the profile configuration tends to return to the original one. From the equilibrium profile concept it is clear that if the mean grain size of the profile doesn’t change significantly, the shape of the litto- ral profile after the nourishment will tend to be the same as the original. If the average grain size distribution of the profile is taken into account, the change of the mean or D,O of the sediment will be very small in most of the situations because the volume of sediment imported is relatively small in comparison to the volume of sediment in the active zone of the profile and, usually, differences between the original and supplied sediment are only small. Based on these arguments it seems to be a fair idea to assume that the transport processes after the nourishment are comparable to those for the pre-nourishment conditions. This assumption is probably valid for most field conditions. Moreover, the evolution of the morphology and the sediment grain size in Terschelling show that the profile returns to the original configuration in
a short period of time after implementation of the nourishment (Figs. 3 and 6). Immediately after the nourishment was completed, the morphology and the sediment distribution had changed dramat- ically: the middle bar, trough and outer bar had become part of a shallow and relatively flat area and the sediment was clearly coarser than the original deposits. Six months after the nourish- ment, the former trough starts to re-appear and the grain size distribution across the profile is nearly the same as the original one. No significant effects of the nourishment are observed in the median grain size.
The volumetric computations based on the mor- phological evolution for the littoral zone of Terschelling during the study period indicate a significant onshore sediment transport from the nourished area (Biegel, 1994; NOURTEC, 1996). From the morphological analysis it is clear that 1.2 million m3 of sediment is deposited in the part of littoral profile located landward of the nourished zone, although the sediment lost in the nourished area is only 0.6 million m3 (Table 1). The inter- pretation of the volumetric changes is complex, however, it must be noticed that the prediction of the volume of sediment transported in an onshore direction as deduced from the grain size data model ( 1.2 million m”) and from the morphological measurements (> 0.6 million m3) show a compara- ble result, indicating that the sediment distribution across the nearshore profile is approaching the “equilibrium” distribution again and that most of the required, onshore directed sediment transport as predicted by the conceptual model, has already been realized in the first year after the nourishment. Moreover, the textural changes observed in the distal part of the profile after the nourishment can also be explained by the sediment transport in an offshore direction predicted from the grain size transport model.
Several previous studies have addressed the interpretation of the amount of sediment lost after a nourishment from the grain size data (Swart, 1991). In most of these studies it is assumed that the sediment grain size of the littoral zone will return to the original distribution after a certain period of time (Krumbein and James, 1965). This assumption can only be accepted when the amount

J. GuillPn, P. HoekstrajMarine Geology 135 (1996) 15-33 31
of newly imported sediment is small in comparison to the volume of native sediment (e.g. in case of a beach nourishment) but it cannot be applied when a permanent change in grain size from the source area of the sediment takes place.
The consideration of the grain size fractions distribution as a permanent characteristic feature of the littoral zone under steady hydrodynamic conditions can be inferred from the investigations of Liu and Zarillo (1993), where the distribution curve of each fraction is explained using hydrody- namic and geological criteria. However, this char- acteristic distribution will also be modified if the grain size of the imported sediment changes (Liu and Zarillo, 1993).
The “equilibrium distribution curve” for each grain size fraction defined in this study is indepen- dent of the amount and textural characteristics of the sediment available in the littoral zone. This characteristic or equilibrium distribution of grain size fractions represents the time-integrated response to hydrodynamic and sediment transport processes affecting the sediment and it may be considered as a more or less permanent feature on a temporal scale of years. It must be emphasized that many questions about the assumptions and application of the conceptual model still need a further clarification: e.g. the exact meaning of “time-averaged” conditions, the influence of the geological substratum or the importance of the seasonal variability of the sediment. These ques- tions are in essence similar to the ones in the application of the equilibrium profile concept, as the estimation of a closure depth for the profile (Pilkey et al., 1993). The shape of the cumulative curves defined for the coastal zone of Terschelling suggest that the profile considered (-200 to 1200 m from the shoreline) probably does not com- pletely include the “active zone” of the littoral profile: the tails of the distribution should be nearly flat near the boundaries of the active zone, indicat- ing a transitional area with low variability in grain size. However, the finest fractions (100-200 urn) show strong gradients in the distal offshore part of the profile (Fig. 11). Meanwhile, the coarsest fractions display steep slopes near the landward boundary. Nevertheless, these boundary condi- tions correspond to the most active zone of the
profile, as was defined in the zonation of the littoral zone of Terschelling, and net cross-shore sediment exchange can be considered of subordi- nate importance on the temporal scale considered.
The conceptual model presented here is typically based on a black box approach and can therefore be considered as a behaviour-related model. These types of models basically use a black-box approach with a certain input, resulting in an expected output without specifying the underlying physics in much detail. The model does not show how the system changes but simply identifies the conditions required to stablish a new equilibrium.
The behaviour-related models though cannot replace the existing generic cross-shore sediment transport models which are normally classified as process-related models. This type of model is based on a detailed description of the elementary physics of the fluid and sediment particle motions. Cross- shore sediment transport models will always be an essential tool in explaining the cross-shore directed sediment fluxes in terms of modes, magnitudes and directions. In addition, they also give a far better impression of the morphodynamic developments in the nearshore zone.
However, the existing and future generations of cross-shore sediment transport models can benefit from the present results and developments. Instead of making computations with uniform sediment, as expressed by a certain median grain size (&), it is far more realistic to make computations for combinations of separate grain size fractions. In theory it should be possible to include these effects in sediment transport models. The field data set of Terschelling clearly shows that there is no uniform behaviour of sediment and that selective sediment transport processes may be operating in the near- shore zone resulting in a differential behaviour of sediment.
Further evaluation of the conceptual model is essential, both with respect to the theoretical aspects and the application in different coastal zones, in order to determine the potential value and validity of the approach. The method is easy to apply and inexpensive and results obtained from the shoreface of Terschelling are encouraging. If the conceptual model can be applied in a reliable way and with a sufficient degree of success, a new
32 J. Guillh, P. HoekstralMarine Geology 135 (1996) 15-33
interesting perspective in the study of sediments in the coastal zone comes in view:
- If in a coastal area the concept of the “equilibrium distribution of grain size fractions” can be applied - taking into account the specific conditions which are required - the characteristic distribution of grain size fractions is a permanent, steady and characteristic feature of the littoral zone on a time-scale of months or years. It is independent of the relative volume of the fraction in the sediment and the characteristics of the source area. The shape of this curve may be considered as a “finger-print” of the coastal system, reflecting the natural response of the coastal system to local hydrodynamic conditions. It could be used as a parameter differentiating between coastal conditions in various geographi- cal regions.
- The proposed behaviour-related or empirical model gives a quantitative prediction of the behavi- our of the sediment after either artificial nourish- ment and berm dispersal or in case of natural processes. It enables a first prediction of the cross- shore sediment distribution for changing sediment sources and a definition of the active zone for each grain size fraction. The model adds a new approach to the existing methods for the evaluation of specially shoreface nourishment. Most of the pres- ently existing methods are based on the Hallermeier’s equation (Hands and Allison, 199 1) . In addition, the method can probably also be applied in relation to natural processes. This may e.g. be the case if a cross-shore redistribution of sediment takes place in the recovery phase after a storm event with dune erosion. The dune erosion will lead to a considerable input of relatively fine- grained deposits in the high-energetic surf zone environment and this sediment has to be redistrib- uted afterwards.
- The concept of the “equilibrium distribution of grain size fractions” can be applied in process- related transport models based on detailed hydro- dynamic processes. The use of individual grain size fractions would provide more accurate results than the use of the median of the sediment, which results in a less realistic simulation of the selective transport processes operating in the nearshore zone.
7. Concluding remarks
A predictive model for the cross-shore dispersion of sediment based on the grain size distribution is presented. The model assumes that the distribution across the profile of each grain size fraction shows a steady and characteristic curve with a distinct shape when average conditions are considered. The shape of this curve (equivalent to a “equilib- rium distribution” curve) is independent of the availability of each grain size fraction in the littoral zone and it is only affected by hydrodynamic conditions. Considering the distribution curve in a normalized, relative form, it can be used in the definition of the “active” zone for each grain size fraction and in the prediction of the dispersion of sediment supplied from an external source. The dispersion process described by the model is in fact a diffusion process with a distribution of sediment in both an onshore and offshore direc- tion. The differential behaviour of grain size frac- tions also clearly implies the presence of selective transport processes, operating in the nearshore zone.
The application of this model for the shoreface nourishment of Terschelling gives encouraging results. The prediction of the sediment re-distribution in Terschelling shows that the sup- plied sediment should be nearly homogeneously dispersed across the active profile and, conse- quently, the rates of transport in an onshore or offshore direction are mainly dependent of the location of the disposal site in the profile. For the Terschelling case, the prediction of the cross-shore transport is the following: 58% of the sediment will be transported in an onshore direction and 17% in an offshore direction, whereas 25% of the sediment will remain in the nourished area. These results are congruent with the observed morpho- logical changes until March 1995 - about of 18 months after the nourishment - and the sediment transport estimates based on the morphological analysis for Terschelling. It suggests that the model can be a very useful tool for designing beach and shoreface nourishments and can also be applied to predict the behaviour and dispersion of sediment imported into the shoreface due to natural processes.
J. Guill~n, P. HoekstralMarine Geology 135 (1996) 15-33 33
Acknowledgements
This investigation is part of the project NOURTEC: Innovative Nourishment Techniques Evaluation, funded jointly by the Ministry of Transport, Public Works and Water Management in the Netherlands and by the Commission of the European Communities, Directorate General for Science, Research and Development under the Marine Science and Technology programme con- tract no. MAS2-CT93-0049. We would like to thank M.J.F. Stive for reviewing of the preliminary manuscript. The task of the first author was sup- ported by a post-dot grant from the Ministerio de Educacibn y Ciencia of Spain.
References
Biegel, E.J., 1994. Morphological development of a shoreface nourishment, Terschelling, The Netherlands. NOURTEC report, RIKZ, The Hague, 28 pp.
Bruun, P., 1954. Coast Erosion and the Development of Beach Profiles. Technical Memorandum, 44. U.S. Army Corps of Engineers, Beach Erosion Board, Washington, DC, 82 pp.
Dean, R.G., 1977. Equilibrium beach profiles: U.S. Atlantic and Gulf coasts. Department of Civil Engineering, Technical Report 12, University of Delaware, Newark, DE, 45 pp.
Hands E.B. and Allison, M.C., 1991. Mound migration in deeper water and methods of categorizing active and stable depths. In: Proceedings Coastal Sediments ‘91. ASCE, New York, pp. 1985-1999.
Hoekstra, P., Houwman, K.T., Kroon, A., Van Vessem, P. and Ruessink, B.G., 1994. The NOURTEC experiment of Terschelling: process-oriented monitoring of a shoreface nourishment (1993-1996). In: Coastal Dynamics ‘94. ASCE, New York, pp. 402416.
Kroon, A., Hoekstra, P., Houwman, K.T. and Ruessink, B.G.,
1995. Morphological monitoring of a shoreface nourish- ment. NOURTEC, experiment at Terschelling, The Nether- lands. In: Int. Conf. Coastal Engineering, Proceedings ICCE ‘94, Kobe. ASCE, New York, pp. 222222236.
Krumbein, W.C. and James, W.R., 1965. A lognormal size dis- tribution model for estimating stability of beach fill material. Coastal Engineering Research Center, US Army Eng. Waterw. Exp. Station, Vicksburg, MS, TM-16.
Larson, M., 1991. Equilibrium profile of a beach with varying grain size. Coastal Sediments ‘91. ASCE, New York, pp. 905-919.
Liu, J.T. and Zarillo, G.A., 1993. Simulation of grain-size abun- dances on a barred upper shoreface. Mar. Geol., 109: 237-251.
Moore, B., 1982. Beach profile evolution in response to changes in water level and wave height. MSc. Thesis, University of Delaware, Newark, DE, 164 pp.
Niedoroda, A.W., Swift, D.J.P. and Hokins, TX, 1985. The Shoreface. In: R.A. Davis (Editor), Coastal Sedimentary Environments. Springer-Verlag, New York, pp. 533-624.
Noordstra, P., 1992. Kustsuppletie Terschelling 1993. Rapport ANW 92.20, Rijkswaterstaat, Directie Friesland (in Dutch).
NOURTEC, 1994. NOURTEC: Scientific and Technical Pro- gress Report. June 1993-June 1994. MAST Programme MAS2-CT93-0049, RIKZ, The Hague, 74 pp.
NOURTEC, 1996. NOURTEC: Scientific and Technical Pro- gress Report. June 1994-June 1995. MAST Programme MAS2-CT93-0049, RIKZ, The Hague, in press.
Pilkey, O.H., Young, R.S., Riggs, S.R., Sam Smith, A.W., Huiyan Wu and Pilkey, W.D., 1993. The concept of shore- face profile of equilibrium: a critical review. J. Coastal Res., 9( 1): 255-278.
Ruessink, B.G. and Kroon, A., 1994. The autonomous behavi- our of a multiple bar system in the nearshore zone of Terschelling, The Netherlands: 196551993. Mar. Geol., 121: 187-197.
Swart, D.H., 1991. Beach nourishment and particle size effects. Coastal Eng., 16: 61-81.
Van Beek, L.P.H., 1995. Wave climate of Terschelling. A statisti- cal analysis for the NOURTEC project. Institute for Marine and Atmospheric Research, University of Utrecht, Report R95-10, 48 pp.