Chapter 4 Risks Exist in Government’s Oversight of Crown ...

The Environmental Risks and Oversight of Enhanced Oil Recovery in the United StatesAn overview of Class II well trends and regulations in EPA’s Underground Injection Control Program
August 2017
Prepared for Clean Water Action by: Matthew Geraci • Syed Jehangeer Ali • Courtney Romolt • Regina Rossmann

About the AuthorsThis report was authored by Matthew Geraci, Syed Jehangeer Ali, Courtney Romolt, and Regina Rossmann and presented to Clean Water Action/Clean Water Fund. The authors are students of the Energy, Resources and Environment Department’s International Energy and Environment Practicum at the Johns Hopkins School of Advanced International Studies.
AcknowledgementsThe authors would like to thank the following individuals and organizations for offering expertise and guidance critical for the completion of this report:
Bruce Baizel Energy Program Director, Earthworks
William J. L. Bates Geologist, Office of Groundwater & Drinking Water: Prevention Branch, U.S. EPA
Dr. Stephen Cummings ARPAe Researcher, University of Pittsburgh Swanson School of Engineering
Guido DeHoratiis (ret.) Associate Deputy Asst. Secretary Office of Oil and Natural Gas U.S. Department of Energy
Fernando De Leon (ret.) Engineering Supervisor of Underground Injection Control Texas Railroad Commission
Michael Godec Vice President and Treasurer, Advanced Resources International, Inc.
Phillip Goetze UIC Manager, Engineering Bureau, Oil Conservation Division New Mexico Energy, Minerals and Natural Resources Department
John A. Harju Vice President for Strategic Partnerships University of North Dakota Energy & Environmental Research Center
Bruce Kobelski Geologist, Office of Groundwater & Drinking Water: Prevention Branch, U.S. EPA
Dr. Yusuke Kuwayama Fellow and VALUABLES Consortium Director for Socioeconomic Studies, Resources for the Future
Briana Mordick Senior Scientist, Natural Resources Defense Council
John Veil President, Veil Environmental, LLC
Nathan Wiser Environmental Scientist, U.S. EPA, Region 8 Office of Enforcement, Compliance and Environmental Justice, Safe Drinking Water Act Enforcement Unit
Dan Zegart Freelance Investigative Journalist Climate Investigations Center
We would also like to extend a special thanks to the following individuals at the Johns Hopkins SAIS Energy, Resources and the Environment Program, for providing consistent guidance, technical support, and assistance throughout the entire course of our work:
Shonda Hurt Jaime Warren
Dr. Jonathan Haskett Dr. Wil Kohl
Dr. Jonas Nahm
Clean Water Action requests that you provide appropriate credit on all reprinted materials.

Table of ContentsAbout the Authors .....................................................................................................................................................2Acknowledgements ...................................................................................................................................................2Terms and Abbreviations .........................................................................................................................................4Executive Summary ..................................................................................................................................................51. Introduction ...........................................................................................................................................................7
1.1 Scope of Research and Methodology ...............................................................................................................71.2 The Safe Drinking Water Act and Underground Injection Control Program ...................................................71.3 Injection Well Classes ........................................................................................................................................71.4 The Safe Drinking Water Act and State Primacy ...............................................................................................81.5 Phases of Oil Recovery ......................................................................................................................................81.6 Pathways of Groundwater Contamination for Class II Well Activity ..............................................................10
2. EOR Technology Trends and Environmental Risks .......................................................................................112.1 EOR Technology Trends ...................................................................................................................................112.2 Summary of Environmental Risks of Class II Injection Methods ..................................................................122.3 Potential Impacts on Water Quality ...............................................................................................................132.4 Impacts of Class II Activities on Water Quantity ............................................................................................14
3. Secondary Oil Recovery (Waterflooding) ......................................................................................................153.1 Secondary Oil Recovery and Produced Water ................................................................................................153.2 Environmental Impacts of Waterflooding ......................................................................................................16
4. CO2–EOR................................................................................................................................................................194.1 Overview of CO2–EOR Techniques ..................................................................................................................194.2 Environmental Impacts of Miscible CO2 Injection ..........................................................................................214.3 Application of Carbon Capture and Sequestration with CO2-EOR ................................................................214.4 Carbon Capture and Storage and Climate Effects of CO2-EOR .....................................................................224.5 Future Prospects of CO2-EOR: Residual Oil Zone ...........................................................................................23
5. Thermal EOR .........................................................................................................................................................245.1 Overview of Thermal EOR Techniques and Trends ........................................................................................245.2 Environmental Impacts of Thermal Enhanced Recovery (Cyclic Steam Injection) .......................................25
6. EOR Technology and Environmental Impact Data Gaps...............................................................................266.1 Communication and Terminology ..................................................................................................................266.2 Data Collection and Transparency .................................................................................................................266.3 The Need for Further Research into Environmental Effects ..........................................................................27
7. Regulatory Oversight of Enhanced Oil Recovery ...........................................................................................287.1 EPA Minimum Standards ..................................................................................................................................297.2 New Mexico .......................................................................................................................................................307.3 Texas .................................................................................................................................................................347.4 California ..........................................................................................................................................................387.5 North Dakota .................................................................................................................................................... 417.6 Colorado ..........................................................................................................................................................427.7 Ohio ...................................................................................................................................................................44

Terms and AbbreviationsARI Advanced Resources International, Inc.AOR Area of reviewB/D Barrels of crude oil per dayCCS Carbon Capture & SequestrationCCUS Carbon Capture, Utilization & SequestrationDOGGR California Division of Oil, Gas, and Geothermal ResourcesEPA United States Environmental Protection AgencyEOR Enhanced Oil RecoveryEROI (ERoEI) Energy Return on Investment (Energy Return on Energy Invested)GHG Greenhouse GasOCD Oil Conservation DivisionOOIP Original Oil in PlaceMIT Mechanical Integrity TestP&A Plugging and abandonmentROZ Residual oil zoneSDWA Safe Drinking Water ActTDS Total Dissolved SolidsUSDW Underground Sources of Drinking WaterUIC Underground Injection ControlWAG Water-Alternating-Gas injection technology
8. Summary of Regulatory Issues and Policy Recommendations ..................................................................478.1 Issues with EPA’s Minimum Standards for UIC Regulation ............................................................................478.2 Issues with EPA’s Oversight of States’ UIC Programs ....................................................................................478.3 Issues in States with Primacy Over UIC ..........................................................................................................488.4 Related Issues Pertaining to Broader Regulation of Oil and Gas Industry ....................................................50
9. Policy Recommendations ..................................................................................................................................519.1 EPA should: .......................................................................................................................................................519.2 States should: ...................................................................................................................................................52
10. Conclusion ..........................................................................................................................................................53Notes ..........................................................................................................................................................................54Appendix: Federal and State Regulations ...........................................................................................................58
Federal Class II Regulations ...................................................................................................................................58Texas Class II Regulations ......................................................................................................................................59California Class II Regulations ................................................................................................................................60North Dakota Class II Regulations .........................................................................................................................61Oklahoma Class II Regulations...............................................................................................................................62

5
The Environmental Risks and Oversight of Enhanced Oil Recovery in the United States
The Environmental Risks and Oversight of Enhanced Oil Recovery in the United StatesAn overview of Class II well trends and regulations in EPA’s Underground Injection Control Program
Executive SummaryEnhanced oil recovery (EOR) involves the injection of fluids and/or gases underground to improve the flow of oil and gas to the surface. There are over 145,000 active and idle Class II EOR injection wells, more than half of which are in California and Texas. It is the most common oil recovery practice in the United States, accounting for an estimated 60% of total U.S. crude oil production.
This report provides an overview of the major technol-ogies, environmental impacts, and regulatory schemes associated with enhanced oil recovery and provides recommendations for improving the protection of underground sources of drinking water.
Despite its prevalence, EOR technologies and the dangers they pose to the environment are largely unknown to the public. EOR presents real threats to drinking water, yet oversight of these practices has lagged. The regulations on EOR activities are decades old and fall short of providing sufficient safeguards for groundwater. State and federal regulators tasked with implementing these outdated rules lack the proper funding and staffing levels for adequate oversight, and significant data and monitoring gaps impede their ability to detect problems. The lack of even a uniform definition of EOR and related technologies means that data is often unreliable and incomplete.
The U.S. Environmental Protection Agency regulates EOR under the Safe Drinking Water Act (SDWA) Under-ground Injection Control (UIC) Program. Established in 1980, the UIC program is a necessary part of oil and gas regulation in the United States. EOR activities are regulated under the UIC Class II Program because they involve the injection of fluids into the subsurface to increase oil production.
The UIC program plays a critical role in protecting drinking water resources, yet receives little public attention and outside scrutiny. However, digging beneath the surface reveals numerous regulatory problems with both federal and state UIC programs. Furthermore, a general lack of reporting of incidents may mask the severity of the UIC program’s underlying issues.
Other hydrocarbon recovery activities, such as hydraulic fracturing and offshore drilling, have received far more media and public attention. Enhanced oil recovery, on the other hand, has enjoyed relative anonymity, which has in part resulted in no substantial review of its regulatory oversight since the 1980s.
EPA’s oversight of state UIC programs is underfunded and understaffed. EPA does not collect comprehensive and comparable data on EOR on a national level. The agency is unable to adequately conduct sufficient oversight of EOR. Federal regulations that set the minimum standards for injection wells have not been updated in decades and fail to provide adequate safeguards.
Data collection and management at the state level is neither satisfactory nor uniform, inhibiting proper oversight. Additionally, states prepare little information about EOR for a public audience, and state regulatory websites vary in both content and quality. State regulatory agencies are often not equipped with sufficient staffing or budgetary resources to cope with daily responsibilities that have been increasing since UIC’s inception. Much like the federal minimum standards, state UIC regulations, in many cases, are out of date and inadequate.

6
The Environmental Risks and Oversight of Enhanced Oil Recovery in the United States
Based on these findings, we make policy recommendations in the following areas:
Recommendations for EPA: • Launch an independent study of EOR’s environmental threats, data gaps, regulations and oversight. • Update the UIC Class II regulations and minimum standards. • Establish a definition of enhanced oil recovery and associated technologies. • Improve data collection and dissemination for Class II activity. • Take a more active role in oversight of state primacy UIC programs, including regular audits. • Work with Congress to increase the UIC budget and address staffing constraints.
Recommendations for states: • Update state regulations and oversight for Class II wells to ensure compliance with EPA minimum
standards, and improve transparency and monitoring requirements. • Invest in improved data management and publication. • Increase funding for agencies with Class II UIC primacy. • Improve management of idle, plugged and abandoned, and orphaned wells.
Chevron Well 20, where a thermal enhanced oil recovery blowout at the Midway-Sunset Oil Field, Kern County, California occurred. In June 2011, a Chevron construction supervisor died when a known surface expression from a steam injection operation expanded into a sinkhole, expelling steam, oil and wastewater to the surface.
7
The Environmental Risks and Oversight of Enhanced Oil Recovery in the United States
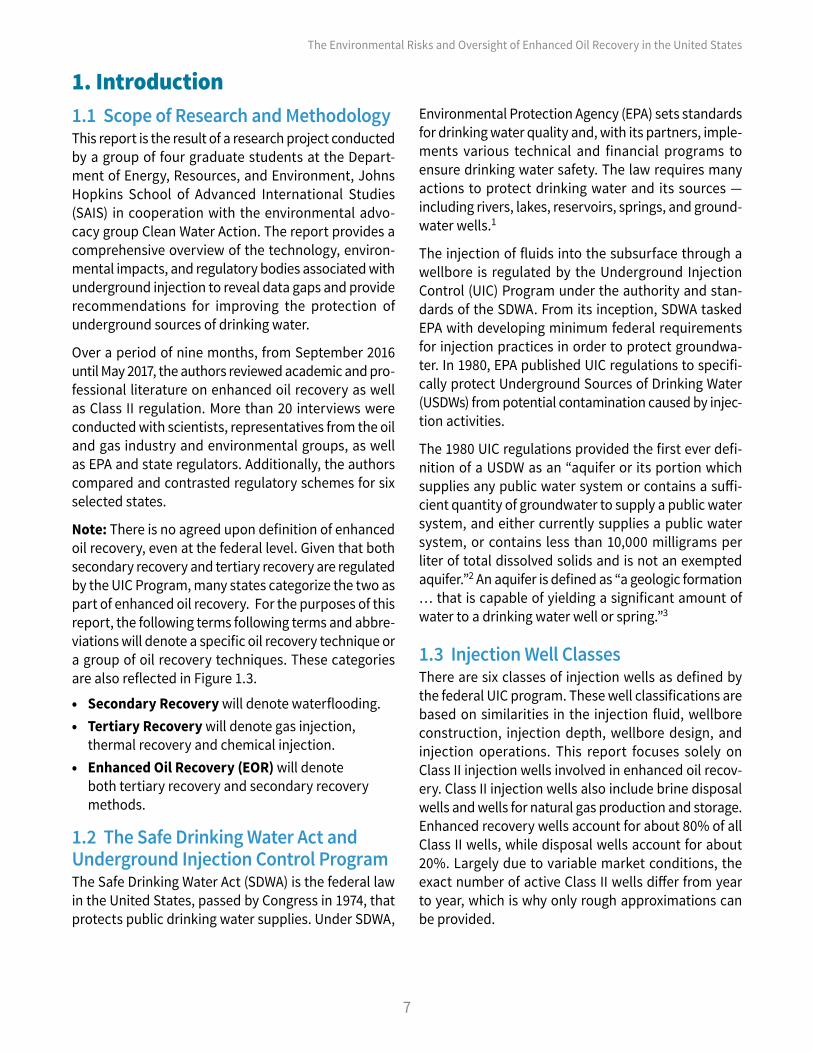
1. Introduction1.1 Scope of Research and MethodologyThis report is the result of a research project conducted by a group of four graduate students at the Depart-ment of Energy, Resources, and Environment, Johns Hopkins School of Advanced International Studies (SAIS) in cooperation with the environmental advo-cacy group Clean Water Action. The report provides a comprehensive overview of the technology, environ-mental impacts, and regulatory bodies associated with underground injection to reveal data gaps and provide recommendations for improving the protection of underground sources of drinking water.
Over a period of nine months, from September 2016 until May 2017, the authors reviewed academic and pro-fessional literature on enhanced oil recovery as well as Class II regulation. More than 20 interviews were conducted with scientists, representatives from the oil and gas industry and environmental groups, as well as EPA and state regulators. Additionally, the authors compared and contrasted regulatory schemes for six selected states.
Note: There is no agreed upon definition of enhanced oil recovery, even at the federal level. Given that both secondary recovery and tertiary recovery are regulated by the UIC Program, many states categorize the two as part of enhanced oil recovery. For the purposes of this report, the following terms following terms and abbre-viations will denote a specific oil recovery technique or a group of oil recovery techniques. These categories are also reflected in Figure 1.3.
• Secondary Recovery will denote waterflooding. • Tertiary Recovery will denote gas injection,
thermal recovery and chemical injection. • Enhanced Oil Recovery (EOR) will denote
both tertiary recovery and secondary recovery methods.
1.2 The Safe Drinking Water Act and Underground Injection Control ProgramThe Safe Drinking Water Act (SDWA) is the federal law in the United States, passed by Congress in 1974, that protects public drinking water supplies. Under SDWA,
Environmental Protection Agency (EPA) sets standards for drinking water quality and, with its partners, imple-ments various technical and financial programs to ensure drinking water safety. The law requires many actions to protect drinking water and its sources — including rivers, lakes, reservoirs, springs, and ground-water wells.1
The injection of fluids into the subsurface through a wellbore is regulated by the Underground Injection Control (UIC) Program under the authority and stan-dards of the SDWA. From its inception, SDWA tasked EPA with developing minimum federal requirements for injection practices in order to protect groundwa-ter. In 1980, EPA published UIC regulations to specifi-cally protect Underground Sources of Drinking Water (USDWs) from potential contamination caused by injec-tion activities.
The 1980 UIC regulations provided the first ever defi-nition of a USDW as an “aquifer or its portion which supplies any public water system or contains a suffi-cient quantity of groundwater to supply a public water system, and either currently supplies a public water system, or contains less than 10,000 milligrams per liter of total dissolved solids and is not an exempted aquifer.”2 An aquifer is defined as “a geologic formation … that is capable of yielding a significant amount of water to a drinking water well or spring.”3
1.3 Injection Well ClassesThere are six classes of injection wells as defined by the federal UIC program. These well classifications are based on similarities in the injection fluid, wellbore construction, injection depth, wellbore design, and injection operations. This report focuses solely on Class II injection wells involved in enhanced oil recov-ery. Class II injection wells also include brine disposal wells and wells for natural gas production and storage. Enhanced recovery wells account for about 80% of all Class II wells, while disposal wells account for about 20%. Largely due to variable market conditions, the exact number of active Class II wells differ from year to year, which is why only rough approximations can be provided.

8
The Environmental Risks and Oversight of Enhanced Oil Recovery in the United States
1.4 The Safe Drinking Water Act and State PrimacyAlthough the SDWA gives the authority for regulating underground injection to EPA, Sections 1422 and 1425 establish procedures for states to apply for primary enforcement authority (primacy) over underground injection wells. Section 1422 requires primacy appli-cants meet EPA’s minimum requirements for UIC pro-grams. EPA may grant primacy for all or part of the UIC program. This means that in some jurisdictions, primary enforcement authority for certain well classes may be shared with EPA.4 As a result of primacy, regulation of Class II wells, regulation of Class II wells and enhanced oil recovery varies substantially from state to state.5
The procedure to obtain primacy for Class II wells, described in Section 1425 of the SDWA, differs from the procedure to obtain primacy for all other well classes outlined in Section 1422. This was the outcome of suc-cessful lobbying by the oil and gas industry in 1980. Section 1425 pertains only to applications for primacy for underground injection related to oil and natural gas. Section 1425 primacy applicants must demon-strate that their standards are effective in preventing endangerment of USDWs; they are not required to meet federal minimum standards. The majority of Class II primacy programs are Section 1425 programs.
1.5 Phases of Oil Recovery There are three main separate development and pro-duction techniques for recovering crude oil from Class II oil wells: primary, secondary, and tertiary recovery. For primary recovery, the natural pressure of an oil reservoir combined with pumps is enough to bring the oil to the surface. However, this initial pressure usually only lasts long enough to sweep about 10% of a reser-voir’s original oil in place (OOIP). Subsequently, sec-ondary recovery techniques, such as produced water injection (waterflooding), displace oil and drive it to a production wellbore, leading to recovery of 20%–40% of OOIP. Given that not even half of OOIP can be recov-ered by primary and secondary techniques combined, tertiary recovery techniques were developed. With current technologies, tertiary recovery has the poten-tial to produce roughly 30%–60% of a reservoir’s OOIP.6
Both secondary recovery and tertiary recovery are regulated under the UIC Class II Program because they involve the injection of fluids into the subsurface to increase oil production. Together, these phases of oil recovery accounted for at least 90% of onshore U.S. crude oil production in 2005.7
Well Class Function Well InventoryClass I Injection of hazardous industrial and municipal wastes 800Class II Injection of fluids related to oil and gas production 184,095 Class III Solution mining (e.g. salt, uranium) 18,500 (165 sites)
Class IV Shallow disposal of hazardous waste — only used for remediation activities < 32 sites
Class V Shallow injection of nonhazardous fluids > 650,000Class VI Geologic sequestration of carbon dioxide 6 final permits
Source: United States Environmental Protection Agency, 2016.
Table 1.1: UIC Well Classes
Source: Bernardo Llamas, Benito Navarre, Fernando Vega, Elias Rodriguez, Luis F. Mazadiego, Ángel Cámara and Pedro Otero (2016). Greenhouse Gas Emissions – Carbon Capture, Storage and Utilisation, Greenhouse Gases, Dr. Bernardo Llamas (Ed.), InTech, DOI: 10.5772/63154
Figure 1.2: Schematic of EOR Operation
Figure 1.1: Location of Class II Primacy States

9
The Environmental Risks and Oversight of Enhanced Oil Recovery in the United States
Box 1. Injection Well Completion Equipment Basics
Component Overview of Basic Well Components
Well A well is comprised of two basic elements: a wellbore and mechanical comple5on equipment. Injec5on wells inject fluids into geologic forma5ons. Produc5on wells recover hydrocarbons from the subsurface.
Wellhead The structure installed above the surface of an oil or gas well. The wellhead manages the pressure and flow rate of injected fluids.
Wellbore The hole that remains throughout a geologic forma5on aAer a well is drilled.
Cement
Material used to support and seal the well casing to the rock forma5ons exposed in the borehole. Cement also protects the casing from corrosion and prevents movement of injectate up the borehole. The composi5on of the cement may vary based on the well type and purpose; cement may contain latex, mineral blends, or epoxy.
Casing
Piping material placed inside a drilled hole to prevent the hole from collapsing. Two types of casing include (1) surface casing, the outermost casing that extends from the surface to the base of the lowermost USDW, and (2) long-‐string casing, which extends from the surface to or through the injec5on zone.
Annulus The space between the casing and the borehole, tubing, or other casing.
Tubing
A small-‐diameter pipe installed inside the casing of a well. Tubing conducts injected fluid from the wellhead at the surface to the injec5on zone and protects the long-‐string casing of a well from corrosion or damage by the injected fluids.
Packer A mechanical device that seals the outside of the tubing to the inside of the long-‐string casing, isola5ng an annular space.
Confining Zone
A geologic forma5on, group of forma5ons, or part of a forma5on stra5graphically overlying the injec5on zone(s) that acts as a barrier to fluid movement.
InjecCon Zone
A geologic forma5on, group of forma5ons, or part of a forma5on that is of sufficient areal extent, thickness, porosity, and permeability to receive the injectate.
Image Source: United States Government Accountability Office. Drinking water: EPA program to protect underground sources from injection of fluids associated with oil and gas production needs improvement (GAO-14-555). June, 2014. Retrieved from http://www.gao.gov/products/GAO-14-555Well Component Definition Sources: American Petroleum Institute, 2007, Background Report, “Summary of Carbon Dioxide Enhanced Oil Recovery (CO2 EOR) Injection Well Technology,” 1220 L Street NW, Washington, DC.US Environmental Protection Agency, Geologic Sequestration of Carbon Dioxide: Underground Injection Control (UIC) Program Class VI Well Plugging, Post-Injection Site Care, and Site Closure Guidance (December 2016)
Figure 1.3: Phases of Oil Recovery and Associated Processes.
Primary Recovery
Tertiary Recovery
Secondary Recovery
Waterflooding Gas Injection Thermal Recovery
Chemical Injection
Oil Recovery Processes
10
The Environmental Risks and Oversight of Enhanced Oil Recovery in the United States
Tertiary recovery falls into three major categories: gas injection, thermal recovery, and chemical injection. Gas injection uses gases such as natural gas, nitrogen, or carbon dioxide that mix with and/or displace the hydrocarbons in a reservoir. Carbon dioxide is used most often for gas injection, as it dissolves in the oil, lowering the oil’s viscosity and improving flow rate. Thermal EOR involves the injection of steam or hot air to lower the viscosity of heavy oil, improving the oil’s ability to flow through a reservoir. Chemical injection utilizes long-chained molecules, known as polymers, to increase the effectiveness of waterflooding, and sur-factants to reduce surface tension that can prevent oil droplets from moving through a reservoir.8
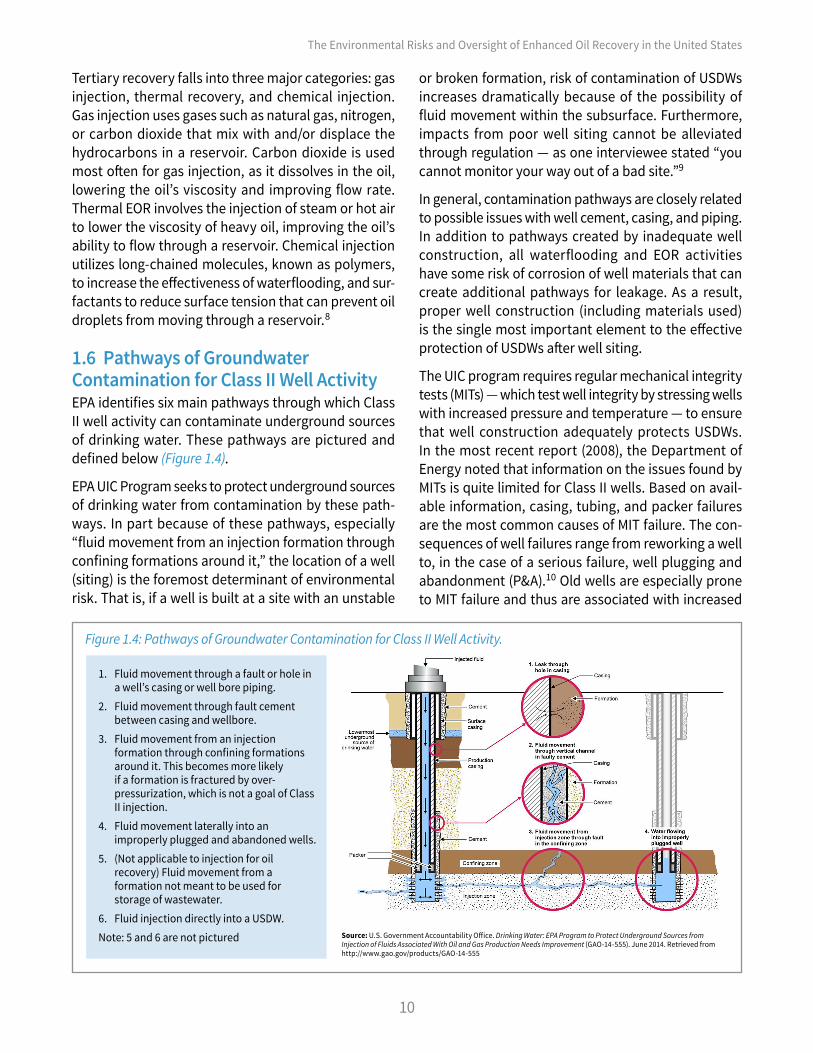
1.6 Pathways of Groundwater Contamination for Class II Well ActivityEPA identifies six main pathways through which Class II well activity can contaminate underground sources of drinking water. These pathways are pictured and defined below (Figure 1.4).
EPA UIC Program seeks to protect underground sources of drinking water from contamination by these path-ways. In part because of these pathways, especially “fluid movement from an injection formation through confining formations around it,” the location of a well (siting) is the foremost determinant of environmental risk. That is, if a well is built at a site with an unstable
or broken formation, risk of contamination of USDWs increases dramatically because of the possibility of fluid movement within the subsurface. Furthermore, impacts from poor well siting cannot be alleviated through regulation — as one interviewee stated “you cannot monitor your way out of a bad site.”9
In general, contamination pathways are closely related to possible issues with well cement, casing, and piping. In addition to pathways created by inadequate well construction, all waterflooding and EOR activities have some risk of corrosion of well materials that can create additional pathways for leakage. As a result, proper well construction (including materials used) is the single most important element to the effective protection of USDWs after well siting.
The UIC program requires regular mechanical integrity tests (MITs) — which test well integrity by stressing wells with increased pressure and temperature — to ensure that well construction adequately protects USDWs. In the most recent report (2008), the Department of Energy noted that information on the issues found by MITs is quite limited for Class II wells. Based on avail-able information, casing, tubing, and packer failures are the most common causes of MIT failure. The con-sequences of well failures range from reworking a well to, in the case of a serious failure, well plugging and abandonment (P&A).10 Old wells are especially prone to MIT failure and thus are associated with increased
Figure 1.4: Pathways of Groundwater Contamination for Class II Well Activity.
Source: U.S. Government Accountability Office. Drinking Water: EPA Program to Protect Underground Sources from Injection of Fluids Associated With Oil and Gas Production Needs Improvement (GAO-14-555). June 2014. Retrieved from http://www.gao.gov/products/GAO-14-555
1. Fluid movement through a fault or hole in a well’s casing or well bore piping.
2. Fluid movement through fault cement between casing and wellbore.
3. Fluid movement from an injection formation through confining formations around it. This becomes more likely if a formation is fractured by over-pressurization, which is not a goal of Class II injection.
4. Fluid movement laterally into an improperly plugged and abandoned wells.
5. (Not applicable to injection for oil recovery) Fluid movement from a formation not meant to be used for storage of wastewater.
6. Fluid injection directly into a USDW.Note: 5 and 6 are not pictured

11
The Environmental Risks and Oversight of Enhanced Oil Recovery in the United States
contamination risk due to deterioration of materials and outdated construction techniques. In some cases old wells may pre-date state or federal regulations by several decades — unless they are revis-ited and receive proper maintenance, their groundwater contamination risk remains relatively high.
In addition, it is incredibly difficult to know what is happening in the subsur-face during injection. Although advanced monitoring technologies exist, they are expensive, and most well operators use data on fluid flows in and out of wells to determine if there is a leak or issue in the reservoir or well itself. As a result, in many cases, according to one interviewee “it is easier to monitor what is going on in outer space than what’s going on in an oil well.”11 Furthermore, computer mod-eling of fluid movement is insufficient to estimate what is occurring underground.
Note: In addition to the described under-ground contamination pathways, the potential also exists for contamination of USDWs via surface spills that percolate down to aquifers.12 This pathway of con-tamination is not directly related to injec-tion activity and is not directly regulated under the UIC Program.
2. EOR Technology Trends and Environmental Risks2.1 EOR Technology TrendsAs of 2016, there were 145,707 EOR injection wells and 38,169 disposal wells.13 Relevant statistical technology trends for waterflooding could not be obtained. Please see Section 6, EOR Technology and Environmental Impact Data Gaps, for additional information.
According to the U.S. Energy Information Administra-tion, the U.S. produced about 8,764,000 barrels of crude oil per day (b/d) in 2014.14 There were 199 ter-tiary recovery projects in the U.S. producing 778,048 barrels of oil per day, constituting nearly 9% of daily U.S. crude oil production.15 Gas injection totaled 134 projects, accounting for 471,030 b/d of production,
compared with its 1992 numbers of 89 projects and a production of 298,020 b/d. Gas injection made up just over 60% of total tertiary production in the U.S. in 2014. 2014 also continued the decline in the use of thermal EOR. In 1992 there were 133 active projects with 460,691 b/d, but as of 2014, there were 62 active projects producing 307,018 b/d. Thermal EOR made up just fewer than 40% of total U.S. tertiary production.
As indicated by Figure 2.1, steam injection and miscible CO2 injection, the most widely utilized thermal EOR and gas injection EOR techniques, have parallel trends with total thermal and CO2-EOR. Based on the Oil & Gas Jour-nal’s EOR/Heavy Oil Survey 2014, Advanced Resources
Figure 1.5: A Note on Reservoir Geology and Well DepthThe diverse geology of the United States results in great heterogeneity of well compositions and depths even within recovery techniques. Consequently, one cannot completely generalize risks for all production locations or practices. Well geology affects the contaminants that can be mobilized by injection as well as the byproducts generated by reactions between injectants and producing formations. This said, there are risk trends that certain practices share because those practices are often only appropriate for certain formation types (e.g., thermal injection is appropriate for viscous, heavy oil, which only occurs in some areas).
Furthermore, while some argue that injection for oil recovery occurs much deeper than USDWs and so the risk of contamination is quite small, for some locations this is simply untrue. Some oil and gas formations are indeed thousands of feet below the surface, and many aquifers are hundreds of feet deep, but deep aquifers and shallow oil exist as well. For example, the shallowest waterflooding wells in Texas are 80 to 100 feet deep and the deepest are around 6,000 feet. In New Mexico, However, it is difficult to find information on exact depths of injection and production wells in comparison to overlying aquifers.

12
The Environmental Risks and Oversight of Enhanced Oil Recovery in the United States
International Inc. (ARI) predicted that the number of CO2-EOR projects will increase to 147 by 2020 with a production of 638,000 b/d, while thermal EOR will continue its downward trend. Because chemical EOR has continuously made up less than 1% of total U.S. tertiary production, it was excluded for this report.16 However, if ARI were to revise their future projections, EOR’s growth rate would likely be somewhat lower due to the consistently low price of oil.17
2.2 Summary of Environmental Risks of Class II Injection Methods Although there are a variety of EOR technologies, some elements are common to all Class II injection methods. These processes include use of a recovery fluid (such as water or CO2), a system to inject recovery fluids, surface processing, and a need to dispose of waste materials. As a result, some environmental risks are shared by all EOR methods.18 Well construction, injec-
Class II ACTIVITY
Construction Injection Operations
Production Operations
Waste Disposal (Solid and Brine)
Secondary Impacts (Chemical Manufacturing,
Refining, etc.)
Type of Pollution:Air X X X XNoise X X X XSurface X X X X XGroundwater X X X
Resource:Land use X XWater X X
Table 2.1: Potential Impacts of Class II Activity
Figure 2.1: Active U.S. EOR Projects and Production for CO2 and Steam Injection

13
The Environmental Risks and Oversight of Enhanced Oil Recovery in the United States
tion operations (injection of fluids into the subsurface), production operations (recovery of oil), waste disposal, and secondary impacts resulting from chemical manu-facturing and refining related to oil recovery have the potential to cause multiple types of pollution and aversely affect land and water resources. The potential of these main Class II activities as pollutants for air, noise, the surface, and groundwater as well as their possible impacts on land use and water supply are illustrated in Table 2.1. It is worth highlighting that only injection operations are regulated by the UIC program — even air and noise pollution caused by injection are not regulated under UIC. However, the noted potential effects of Class II activity remain regardless of which regulatory program oversees them.
All EOR techniques have some risk of blowouts that can result in leakage and/or “surface expressions” (surface disruption and seepage of oil/steam/fluid to the surface due to oil and gas recovery) at recovery sites. A blowout is the uncontrolled release of oil or natural gas from an oil well into the atmosphere or underground forma-tion, and, depending on scale and location, can result in air, noise, surface, and/or groundwater pollution. As a result, blowout prevention equipment is required by federal EPA UIC regulations.
2.3 Potential Impacts on Water Quality Migration of injection fluids into USDWs through path-ways described is problematic due to the potentially harmful substances these fluids may contain. In the case of a subsurface leak, a contaminant could move with production fluids out of a producing formation, and, in certain cases, into a water source. There are two main reasons that injection fluids and produced water may contain contaminants:
1. Pre-injection — the recovery fluid may already contain what could be considered a contaminant. Injectants sometimes already contain harmful com-
pounds like hydrogen sulfide (H2S), which would be considered contaminants if mixed with drinking water. In addition, injectants such as produced water for waterflooding (discussed below) may include chemi-cal additives such as “corrosion and scale inhibitors, emulsion breakers, coagulants, and solvents” that help increase production in addition to naturally occurring contaminants.19 Disclosure of the chemicals included in injectants is not currently required by federal or state UIC regulations.
2. Post-injection — reactions with rock, water, and oil underground introduce new compounds into the fluid that will be recovered with oil. Although oil does not mix with water, dissolution of other con-taminants present in oil reservoirs in injected fluids can occur during recovery. Reactions of injectants with water and rocks within formations can also generate compounds that could potentially damage drinking water. These reactions are more likely to occur when the injectate is incompatible with formation fluids.
Produced water, also referred to as brine or saltwater, is found in the same reservoir formations as oil and gas.20 Produced water can exist naturally in the forma-tion holding it without human intervention or it can be water that was injected into the formation for oil and gas recovery purposes. Because produced water is injected in virtually all EOR techniques, its quality is rel-evant to every EOR operation to varying degrees. Pro-duced water can contain both pre- and post- injection contaminants due to its reuse in oil recovery processes. The main components and contaminants associated with produced water are salt content, oil and grease, inorganic and organic toxic compounds, and naturally occurring radioactive material.
Recovery activity can also indirectly affect water quality of saline aquifers. If groundwater from saline aquifers is continuously utilized as an injectant for
Produced Water Components Details
Salt Content Also known as salinity, conductivity, or total dissolved solids (TDS)
Oil and Grease Not just one type of chemical, can involve different organic compounds that may be found with oil
Inorganic and Organic Toxic Compounds These are chemical additives used to improve drilling and production operations. Or they seeped into the produced water from the formation
Naturally Occurring Radioactive Material Seeps into produced water from some formations
Table 2.2: Produced Water Components

14
The Environmental Risks and Oversight of Enhanced Oil Recovery in the United States
waterflooding or steam injection, remaining water in the aquifer can become saltier.21 Aquifers that serve as sources of water for oil recovery have been exempted from protection under UIC regulation, and thus should not be a current or potential USDW. However, aquifers have been improperly exempted in the past. This could mean that the quality of some aquifers that could act as drinking water sources is impaired by water removal for oil recovery (please see Section 7.4 for more infor-mation on the example of improper aquifer exemptions in California). This could affect future water resources by reducing the quality of aquifers that, with develop-ing technologies, may otherwise be viable as drinking water sources.
2.4 Impacts of Class II Activities on Water Quantity Waterflooding, CO2-EOR, and thermal injection tech-niques all use significantly more water than primary recovery. In the past, most EOR operations used fresh water as a primary injectant.22 While the majority of the water used in secondary and tertiary recovery in modern operations is produced water from earlier
stages of production, some operations use fresh water as a “last resort.”23 In Texas, around 3% of companies use fresh water for their waterflooding operations.24 In cases where fresh water is used, the operator injecting must have commercial rights to that water.25
The volume of water produced by enhanced recovery poses a significant management challenge. While most produced water is recycled through reinjection, some is disposed in disposal wells or treated for agriculture use, domestic or municipal uses, and even environmental
Figure 2.2: Water Injection by Recovery Technology14
12
10
8
6
4
2
0Primary
RecoverySecondary
waterfloodingSteam
injectionCO2
injection
Inje
ctio
n w
ater
(gal
wat
er p
er g
al cr
ude)
Box 2. Aquifer Exemptions
Sources: US EPA. Aquifer Exemptions. 2017. Excel file. Web. 1 April 2017. Retrieved from https://www.epa.gov/uic/aquifer-exemption-data. Noël, John. Aquifer Exemptions: A first-ever look at the regulatory process that writes off drinking water resources for oil, gas and uranium profits. Clean Water Action. Jan. 2015. Web
The UIC Program includes criteria for exempting an aquifer from being protected by the SDWA. However, after the initial 1980 UIC regulations were published, the American Petroleum Institute (API) filed a lawsuit against the EPA because they felt that the criterion for exempting aquifers was too stringent.
In 1982, the EPA reached a settlement with API, publishing their revised regulations to the USDW definition and Aquifer Exemption criteria which have remained unchanged up to this day.
The depth of exempted aquifers can range from several hundred to over 10,000 feet deep. However, most depths occur somewhere between 1,000 and 9,000 feet deep. About 95% of aquifer exemptions are for Class II wells. As of 2017, there are 3,145 aquifer exemptions for Class II wells.
Criteria for Exempted Aquifers | 40 CFR § 146.4
An aquifer may be exempted if:a. It does not currently serve as a source of drinking water, and b. It cannot now and will not in the future serve as a source of drinking water because:
(1) It is mineral, hydrocarbon or geothermal energy producing, or can be demonstrated by a permit applicant as part of a permit application for a Class II or III operation to contain minerals or hydrocarbons that considering their quantity and location are expected to be commercially producible. (2) It is situated at a depth or location which makes recovery of water for drinking water purposes economically or technologically impractical; (3) It is so contaminated that it would be economically or technologically impractical to render that water fit got human consumption; or (4) It is located over a Class III well mining area subject to subsidence or catastrophic collapse; or
c. The total dissolved solids content of the ground water is more than 3,000 and less than 10,000 mg/l and it is not reasonably expected to supply a public water system
d. The areal extent of an aquifer exemption for a Class II enhanced oil recovery or enhanced gas recovery well may be expanded for the exclusive purpose of Class VI injection for geologic sequestration under §144.7(d) of this chapter if it meets the following criteria:
(1) It does not currently serve as a source of drinking water; and (2) The total dissolved solids content of the ground water is more than 3,000 mg/l and less than 10,000 mg/l; and (3) It is not reasonably expected to supply a public water system.
Class II Aquifer Exemptions as of 2017
2007
1012
126
Class II Aquifer Exemp2ons as of 2017
Class II Recovery Wells
Class II Disposal Wells
Class II (Unspecified)

15
The Environmental Risks and Oversight of Enhanced Oil Recovery in the United States
restoration.26 For all of these methods of disposal or reuse, some degree of treatment is required. The water may also require transportation before treatment, which increases the opportunities for surface spills.27
There is disagreement about which type of injection activity poses the most risk to groundwater and the
environment overall. Certain injection technologies are associated with increased risks in some respects. For example, all secondary and tertiary recovery tech-niques have risks related to corrosion, but for CO2-EOR this risk is magnified greatly due to a reaction between CO2 and water.
3. Secondary Oil Recovery (Waterflooding) 3.1 Secondary Oil Recovery and Produced WaterSecondary recovery, commonly referred to as water-flooding, is an older oil recovery technique. The prac-tice is thought to have begun in the Bradford Oil Field in Pennsylvania in the 1890s, and became much more commonplace in the 1920s after it was officially legal-ized.28 It is crucial to note first that some do not dif-ferentiate waterflooding from enhanced oil recovery, which led to difficulties in data interpretation and con-versations with interviewees. Although waterflooding
Box 3. Class II Wells and Induced Seismicity Oil and gas extraction-related activities have recently been gaining national attention due to associated increases in earthquakes throughout the US. Contrary to popular belief, though, hydraulic fracturing is not causing most of the recent induced seismicity. Instead, Class II injection for wastewater disposal is the primary cause of recent increases in earthquakes in much of the country. This is especially true in states like Oklahoma, which has become the “small earthquake capital of the US.”
Injection for EOR has less potential to induce seismicity than disposal and fracking because pressure is maintained due to the release of oil in production wells. However, disposal of excess produced water, some of which comes from EOR, into Class II disposal wells means that EOR is at least indirectly connected to increases in induced seismicity in the US.Sources: US EPA. Minimizing and Managing Potential Impacts of Injection Induced Seismicity from Class II Disposal Wells: Practical Approaches. 2015. Office of the Secretary of Energy & Environment. “Earthquakes in Oklahoma.” 2017. https://earthquakes.ok.gov/faqs/
StateTotal Produced Water
Volume Brought to Surface (bbl/year)
Produced Water Volume for Enhanced Recovery Injection
(bbl/year)Percentage of Produced Water Used for Enhanced Recovery
California 3,074,584,714 1,489,785,432 46%
Colorado 358,389,447 123,854,742 31.5%
New Mexico 775,930,303 318,160,348 50%
North Dakota 291,147,202 52,484,071 18%
Ohio 5,541,502 604,693 4%
Oklahoma 2,325,152,584 1,098,311,922 47%
Texas 7,435,659,156 3,717,829,578 48%Source: Veil, John. “U.S. Produced Water Volumes and Management Practices in 2012.” Groundwater Protection Council, 2015.
Table 3.1: Produced Water Management for Selected States
Figure 3.1: 2012 U.S. Produced Water Management
16
The Environmental Risks and Oversight of Enhanced Oil Recovery in the United States
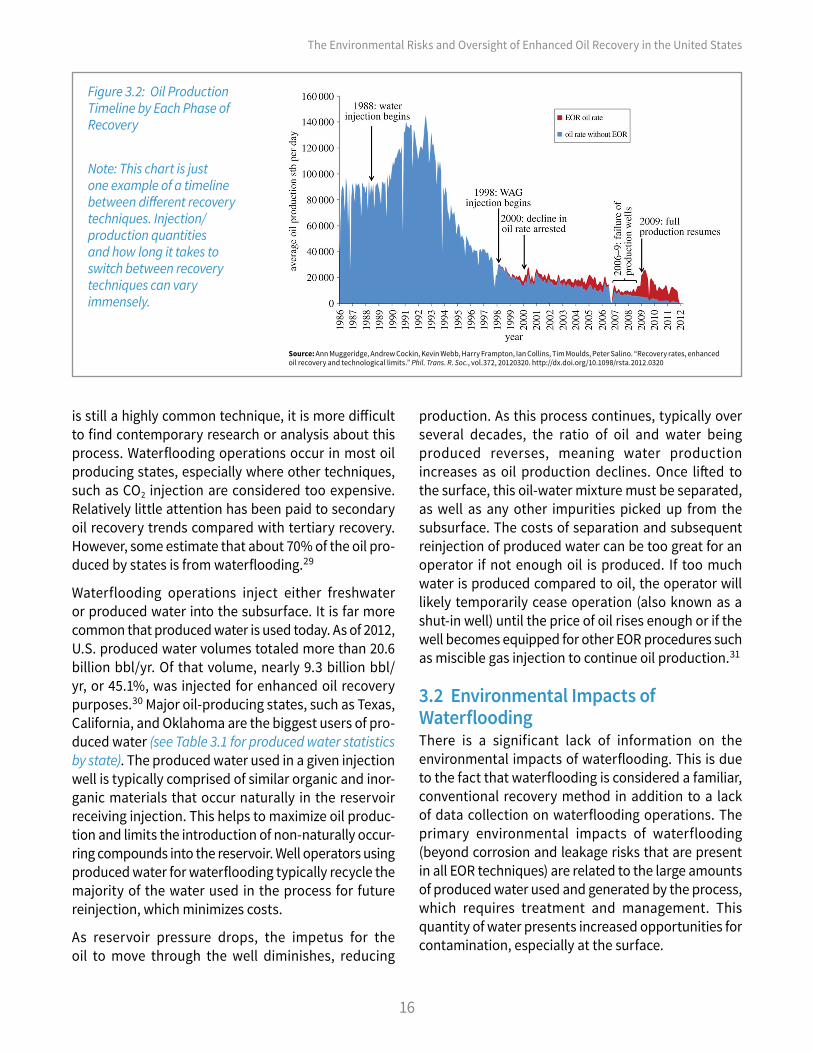
is still a highly common technique, it is more difficult to find contemporary research or analysis about this process. Waterflooding operations occur in most oil producing states, especially where other techniques, such as CO2 injection are considered too expensive. Relatively little attention has been paid to secondary oil recovery trends compared with tertiary recovery. However, some estimate that about 70% of the oil pro-duced by states is from waterflooding.29
Waterflooding operations inject either freshwater or produced water into the subsurface. It is far more common that produced water is used today. As of 2012, U.S. produced water volumes totaled more than 20.6 billion bbl/yr. Of that volume, nearly 9.3 billion bbl/yr, or 45.1%, was injected for enhanced oil recovery purposes.30 Major oil-producing states, such as Texas, California, and Oklahoma are the biggest users of pro-duced water (see Table 3.1 for produced water statistics by state). The produced water used in a given injection well is typically comprised of similar organic and inor-ganic materials that occur naturally in the reservoir receiving injection. This helps to maximize oil produc-tion and limits the introduction of non-naturally occur-ring compounds into the reservoir. Well operators using produced water for waterflooding typically recycle the majority of the water used in the process for future reinjection, which minimizes costs.
As reservoir pressure drops, the impetus for the oil to move through the well diminishes, reducing
production. As this process continues, typically over several decades, the ratio of oil and water being produced reverses, meaning water production increases as oil production declines. Once lifted to the surface, this oil-water mixture must be separated, as well as any other impurities picked up from the subsurface. The costs of separation and subsequent reinjection of produced water can be too great for an operator if not enough oil is produced. If too much water is produced compared to oil, the operator will likely temporarily cease operation (also known as a shut-in well) until the price of oil rises enough or if the well becomes equipped for other EOR procedures such as miscible gas injection to continue oil production.31
3.2 Environmental Impacts of WaterfloodingThere is a significant lack of information on the environmental impacts of waterflooding. This is due to the fact that waterflooding is considered a familiar, conventional recovery method in addition to a lack of data collection on waterflooding operations. The primary environmental impacts of waterflooding (beyond corrosion and leakage risks that are present in all EOR techniques) are related to the large amounts of produced water used and generated by the process, which requires treatment and management. This quantity of water presents increased opportunities for contamination, especially at the surface.
Figure 3.2: Oil Production Timeline by Each Phase of Recovery
Note: This chart is just one example of a timeline between different recovery techniques. Injection/production quantities and how long it takes to switch between recovery techniques can vary immensely.
Source: Ann Muggeridge, Andrew Cockin, Kevin Webb, Harry Frampton, Ian Collins, Tim Moulds, Peter Salino. “Recovery rates, enhanced oil recovery and technological limits.” Phil. Trans. R. Soc., vol.372, 20120320. http://dx.doi.org/10.1098/rsta.2012.0320
17
The Environmental Risks and Oversight of Enhanced Oil Recovery in the United States
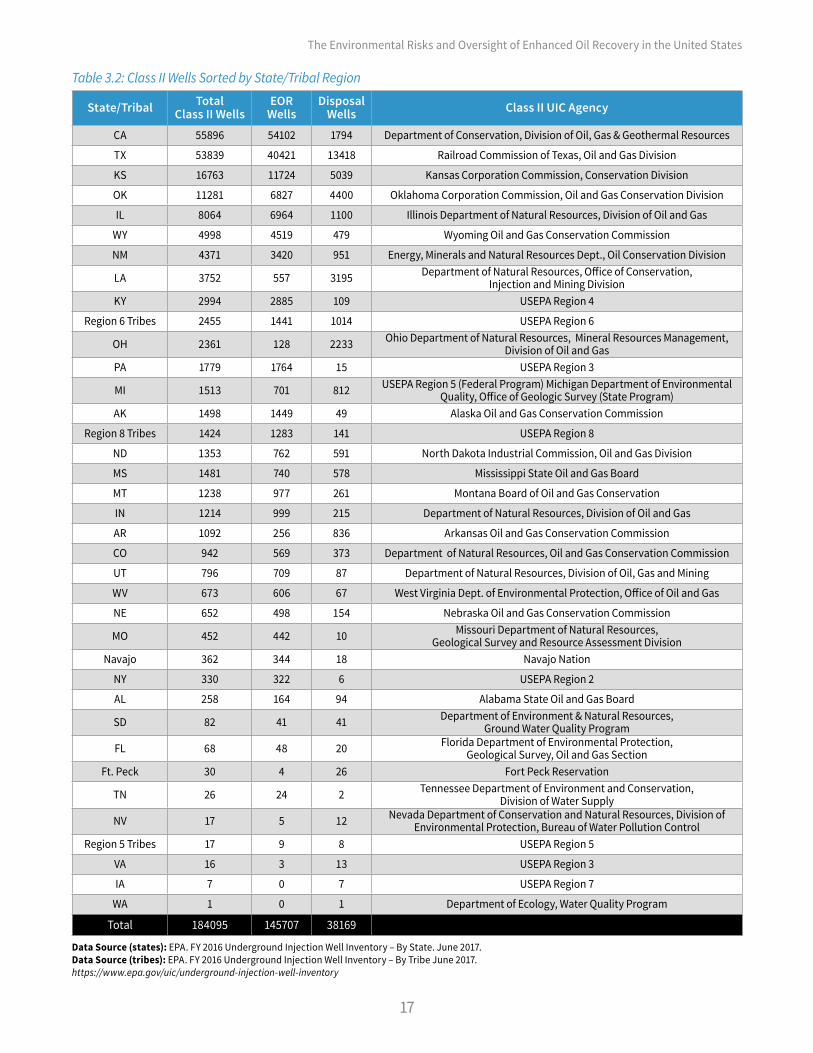
State/Tribal Total Class II Wells
EOR Wells
Disposal Wells Class II UIC Agency
CA 55896 54102 1794 Department of Conservation, Division of Oil, Gas & Geothermal Resources
TX 53839 40421 13418 Railroad Commission of Texas, Oil and Gas Division
KS 16763 11724 5039 Kansas Corporation Commission, Conservation Division
OK 11281 6827 4400 Oklahoma Corporation Commission, Oil and Gas Conservation Division
IL 8064 6964 1100 Illinois Department of Natural Resources, Division of Oil and Gas
WY 4998 4519 479 Wyoming Oil and Gas Conservation Commission
NM 4371 3420 951 Energy, Minerals and Natural Resources Dept., Oil Conservation Division
LA 3752 557 3195 Department of Natural Resources, Office of Conservation, Injection and Mining Division
KY 2994 2885 109 USEPA Region 4
Region 6 Tribes 2455 1441 1014 USEPA Region 6
OH 2361 128 2233 Ohio Department of Natural Resources, Mineral Resources Management, Division of Oil and Gas
PA 1779 1764 15 USEPA Region 3
MI 1513 701 812 USEPA Region 5 (Federal Program) Michigan Department of Environmental Quality, Office of Geologic Survey (State Program)
AK 1498 1449 49 Alaska Oil and Gas Conservation Commission
Region 8 Tribes 1424 1283 141 USEPA Region 8
ND 1353 762 591 North Dakota Industrial Commission, Oil and Gas Division
MS 1481 740 578 Mississippi State Oil and Gas Board
MT 1238 977 261 Montana Board of Oil and Gas Conservation
IN 1214 999 215 Department of Natural Resources, Division of Oil and Gas
AR 1092 256 836 Arkansas Oil and Gas Conservation Commission
CO 942 569 373 Department of Natural Resources, Oil and Gas Conservation Commission
UT 796 709 87 Department of Natural Resources, Division of Oil, Gas and Mining
WV 673 606 67 West Virginia Dept. of Environmental Protection, Office of Oil and Gas
NE 652 498 154 Nebraska Oil and Gas Conservation Commission
MO 452 442 10 Missouri Department of Natural Resources, Geological Survey and Resource Assessment Division
Navajo 362 344 18 Navajo Nation
NY 330 322 6 USEPA Region 2
AL 258 164 94 Alabama State Oil and Gas Board
SD 82 41 41 Department of Environment & Natural Resources, Ground Water Quality Program
FL 68 48 20 Florida Department of Environmental Protection, Geological Survey, Oil and Gas Section
Ft. Peck 30 4 26 Fort Peck Reservation
TN 26 24 2 Tennessee Department of Environment and Conservation, Division of Water Supply
NV 17 5 12 Nevada Department of Conservation and Natural Resources, Division of Environmental Protection, Bureau of Water Pollution Control
Region 5 Tribes 17 9 8 USEPA Region 5
VA 16 3 13 USEPA Region 3
IA 7 0 7 USEPA Region 7
WA 1 0 1 Department of Ecology, Water Quality Program
Total 184095 145707 38169
Table 3.2: Class II Wells Sorted by State/Tribal Region
Data Source (states): EPA. FY 2016 Underground Injection Well Inventory – By State. June 2017.Data Source (tribes): EPA. FY 2016 Underground Injection Well Inventory – By Tribe June 2017.https://www.epa.gov/uic/underground-injection-well-inventory
18
The Environmental Risks and Oversight of Enhanced Oil Recovery in the United States
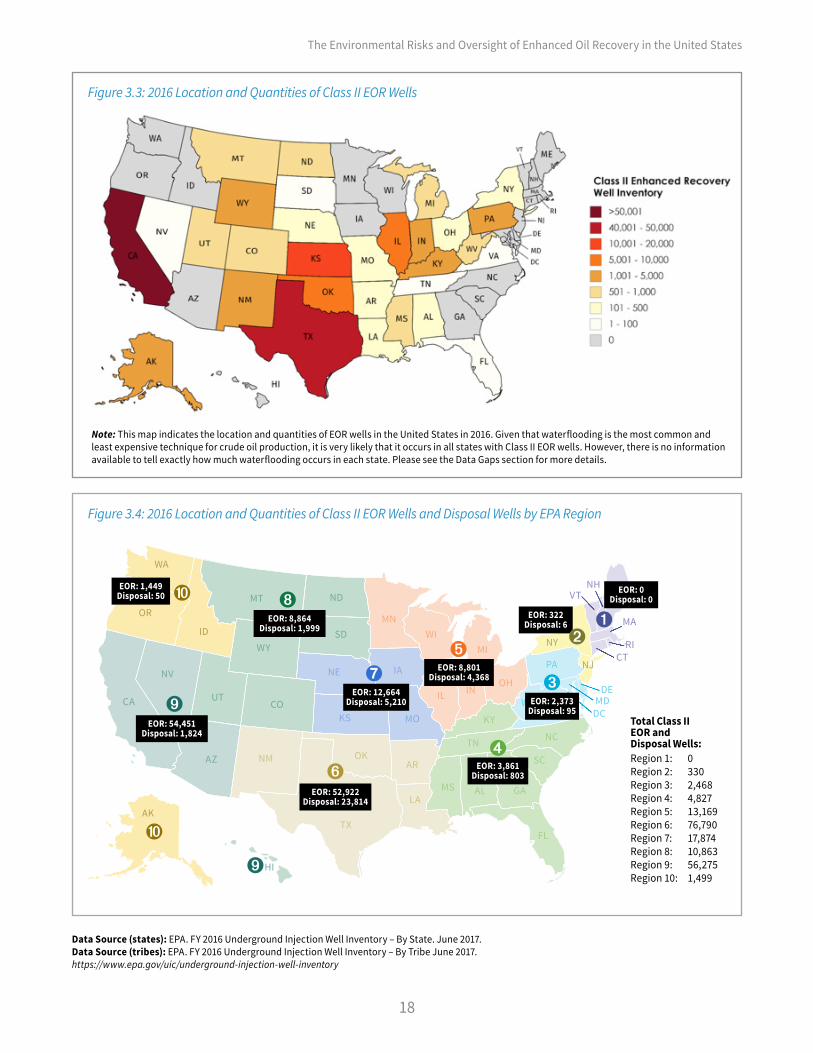
Note: This map indicates the location and quantities of EOR wells in the United States in 2016. Given that waterflooding is the most common and least expensive technique for crude oil production, it is very likely that it occurs in all states with Class II EOR wells. However, there is no information available to tell exactly how much waterflooding occurs in each state. Please see the Data Gaps section for more details.
Figure 3.3: 2016 Location and Quantities of Class II EOR Wells
CA
WA
OR
ID
MT ND
SDWY
UTCO
NE
MOKS
IA
NM
LA
OK
TX
AR
MNWI
IL IN
MI
OH
KY
AL
TN
GA
SC
NC
MS
FL
WV
PA
VA
DEMD
DC
NY
NHVT ME
MA
RICT
NV
AZ
NJ
AK
HI
EOR: 1,449 Disposal: 50
EOR: 54,451Disposal: 1,824
EOR: 8,864Disposal: 1,999
EOR: 52,922Disposal: 23,814
EOR: 12,664Disposal: 5,210
EOR: 8,801Disposal: 4,368
EOR: 3,861Disposal: 803
EOR: 2,373Disposal: 95
EOR: 322Disposal: 6
EOR: 0Disposal: 0➓
➒
➑
➐
➏
➎
➍
➌
➋➊
➓
➒
Figure 3.4: 2016 Location and Quantities of Class II EOR Wells and Disposal Wells by EPA Region
Total Class II EOR and Disposal Wells:Region 1: 0Region 2: 330Region 3: 2,468Region 4: 4,827Region 5: 13,169Region 6: 76,790Region 7: 17,874Region 8: 10,863Region 9: 56,275Region 10: 1,499
Data Source (states): EPA. FY 2016 Underground Injection Well Inventory – By State. June 2017.Data Source (tribes): EPA. FY 2016 Underground Injection Well Inventory – By Tribe June 2017.https://www.epa.gov/uic/underground-injection-well-inventory

19
The Environmental Risks and Oversight of Enhanced Oil Recovery in the United States
Currently, there are few options to safely manage non-recycled produced water other than Class II disposal wells. Surface storage is even less safe, and treatment for other uses is often too expensive. This magnifies the importance of the UIC program — for most U.S. oil fields, disposal in Class II injection wells is the least expensive option for management of excess produced water available at this time.32
There are multiple examples of sinkhole formation connected to waterflooding activities. In the Permian Basin of western Texas, two large sinkholes formed in June 1980 and May 2002 near the communities of Wink and Kermit. These “Wink Sinks” were 110 meters and 137 meters across at their formation, respectively, and have grown since then. The sinkholes were caused by salt dissolution and collapse as a result
of water movement through water wells supplying waterflooding operations.33 This salt dissolution in this particular area apparently resulted from or was accelerated by these waterflooding activities.34
These sinkholes are an indirect impact on the physical environment linked to waterflooding.
In addition to the negative impacts of water usage related to waterflooding, there is at least one example of waterflooding practices resulting in transforma-tion of a previously saline aquifer into a USDW. In New York, fresh water injection for waterflooding actually improved the water quality of a formation to the point that it could be used as a source of drinking water.35 Although this scenario is uncommon, it demonstrates the importance of water quality monitoring in injection operations.
4. CO2–EOR4.1 Overview of CO2–EOR TechniquesOil is left behind in a reservoir after waterflooding because the injected fluid did not contact it or the capillary forces that exist between oil, water and the porous rock in the contacted areas trapped it in place. CO2-EOR is one of several techniques that can be utilized to sweep a larger percentage of original oil in place once both primary and secondary recovery have concluded. When CO2 surpasses a temperature of 87.9°F and pres-sure of 1070.6 psia (pounds per square inch absolute), it becomes a supercritical phase with a density close to that of a liquid. Despite retaining a low viscosity (thick-
ness), supercritical CO2 is miscible with oil and is used for CO2-EOR.36
There are several CO2 flood/injection designs: • Continuous CO2 injection • Continuous CO2 injection followed with water • Conventional water-alternating-gas (WAG)
followed with water • Tapered WAG (TWAG) • WAG followed with gas
In order for an operator to select the right injection design for a given well, numerous variables are taken
Figure 3.5: Wink Sink 2, Texas, 2011. Source: Bureau of Economic Geology

20
The Environmental Risks and Oversight of Enhanced Oil Recovery in the United States
into account such as reservoir (permeability, tempera-ture, pressure, depth) and market conditions. Some-times, reservoir conditions may be such that miscibil-ity with oil is reduced, meaning that CO2 will not form a single phase (reservoir pressure is below minimum miscibility pressure). However, immiscible CO2 injec-tion for EOR is still considered to be a viable option in some cases. WAG was developed to reduce the volume of gas needed to maintain reservoir pressure and also to reduce the likelihood that gas will finger or channel through the oil. However, even though vertical sweep efficiency improves, early gas breakthroughs can occur with this technique, reducing macroscopic sweep effi-ciency.37 WAG is typically the most successful (in terms of recovery) enhanced oil recovery technique in use today.38 Although some of the injected CO2 does stay underground and is presumably sequestered, when the oil mixture reaches the surface, the some CO2 comes back up and must be separated from the oil. Often, the CO2 that is separated is reused for further injection.
Continuous CO2 injection refers to the continuous injec-tion of a predetermined volume of CO2 without the use of other fluids. Continuous CO2 injection followed with water is the same as the previous process, except chase water is injected following the injection of the full CO2 slug (a slug is a collection of gas bubbles moving through liquid) volume. Conventional WAG followed with water refers to the injection of a predetermined
volume of CO2, which alternates with equal volumes of water. This method is most suitable for reservoirs with contrasts in permeability among various layers. Tapered WAG is similar in design to conventional WAG, but has a gradual reduction in the injected CO2 volume relative to injected water volumes. Tapered WAG is the most widely used technique today because it improves the efficiency of the flood. This prevents early break-through of CO2, meaning that less CO2 is swept with the oil, reducing the need to recycle it. WAG followed with gas is similar to a conventional WAG process followed by a chase of an inexpensive gas (e.g. nitrogen) after the full CO2 slug volume has depleted.39
Source: Lindley, Joe. Miscible Recovery. U.S. Department of Energy National Energy Technology Laboratory. 2001. Retrieved from: https://www.netl.doe.gov/research/oil-and-gas/enhanced-oil-recovery/eor-process-drawings
Figure 4.2: CO2-EOR Injection Designs
Figure 4.1: Water Alternating Gas Diagram
21
The Environmental Risks and Oversight of Enhanced Oil Recovery in the United States
4.2 Environmental Impacts of Miscible CO2 InjectionWhen supercritical CO2 reacts with water within oil-producing formations, carbonic acid (H2CO3) is produced, which lowers pH in the formation and creates a corrosive environment.40,41 Because of this, CO2 injection is associated with a high risk of degradation/corrosion of equipment, which amplifies risks of subsurface issues like leaks and blowouts by allowing pressuring to become unregulated.42 Blowouts can create further leakage pathways to groundwater through well structures.
The corrosion caused by CO2 injection makes proper well construction even more critical for environmental protection. Piping, cement, and other well materials must be resistant to corrosion and degradation to suf-ficiently protect USDWs. Some materials are inherently resistant to corrosion (e.g. stainless steel), while others like cement can be treated with substances such as anti-bacterial fluids to slow degradation. Stainless steel piping should always be used in CO2 injection projects to reduce corrosion-related leaks; a standard steel pipe in a CO2 well would only last one or two years before experiencing degradation.43 Tuber, packer, and casing leaks are especially common in older wells undergo-ing CO2-EOR, which may not have been updated with proper materials like stainless steel.44
In addition, the acidic (low pH) environment created with CO2 injection techniques can cause the mobilization and dissolution of certain trace elements and compounds, which impacts these substances’ ability to move in the subsurface.45, 46 Contaminants that may be mobilized due to CO2 injection include metals and elements like barium, calcium, chromium, strontium, and iron,47 but these vary by location — injection into a formation that
does not contain any barium cannot mobilize barium.
Hydrogen sulfide (H2S), a highly toxic gas, may be present in CO2 before injection and would be a serious contaminant in the case of a leak. H2S also causes additional corrosion of equipment and producing formations. This “sour CO2” is not typically used in EOR projects, especially in reservoirs with sweet oil, but may be used in sour oil reservoirs. H2S actually improves the recovery factor for these projects by lowering the minimum miscibility pressure of petroleum.48
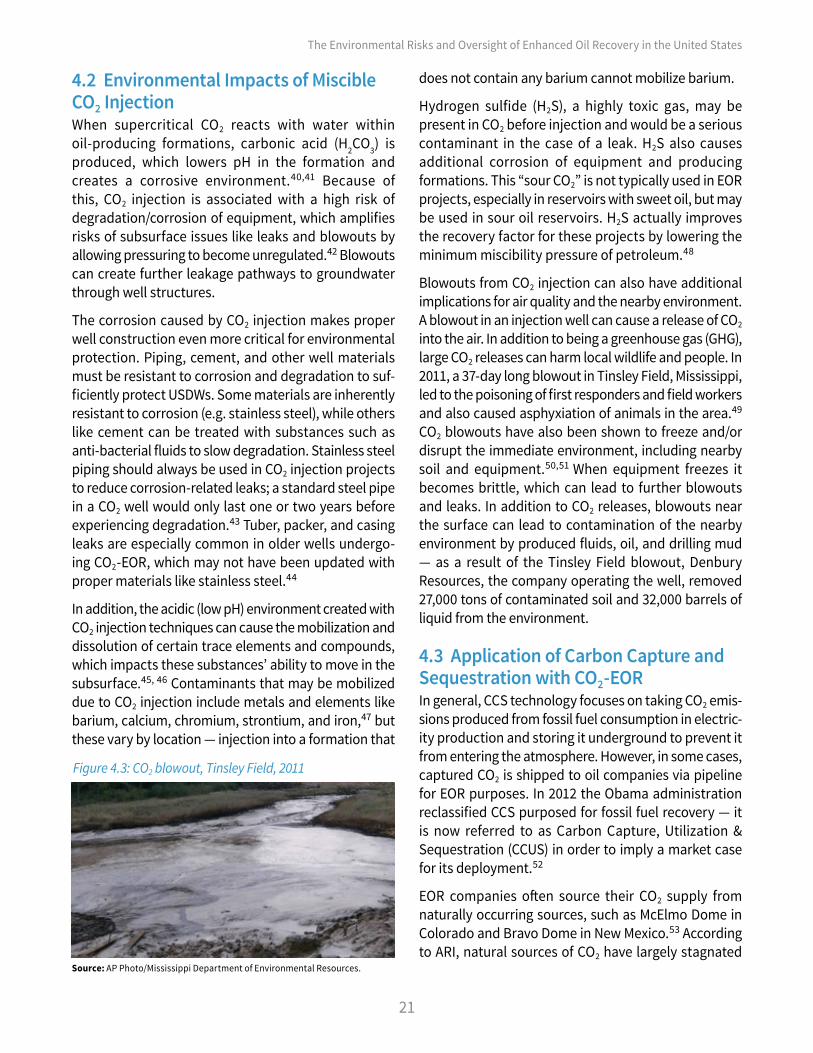
Blowouts from CO2 injection can also have additional implications for air quality and the nearby environment. A blowout in an injection well can cause a release of CO2 into the air. In addition to being a greenhouse gas (GHG), large CO2 releases can harm local wildlife and people. In 2011, a 37-day long blowout in Tinsley Field, Mississippi, led to the poisoning of first responders and field workers and also caused asphyxiation of animals in the area.49 CO2 blowouts have also been shown to freeze and/or disrupt the immediate environment, including nearby soil and equipment.50,51 When equipment freezes it becomes brittle, which can lead to further blowouts and leaks. In addition to CO2 releases, blowouts near the surface can lead to contamination of the nearby environment by produced fluids, oil, and drilling mud — as a result of the Tinsley Field blowout, Denbury Resources, the company operating the well, removed 27,000 tons of contaminated soil and 32,000 barrels of liquid from the environment.
4.3 Application of Carbon Capture and Sequestration with CO2-EORIn general, CCS technology focuses on taking CO2 emis-sions produced from fossil fuel consumption in electric-ity production and storing it underground to prevent it from entering the atmosphere. However, in some cases, captured CO2 is shipped to oil companies via pipeline for EOR purposes. In 2012 the Obama administration reclassified CCS purposed for fossil fuel recovery — it is now referred to as Carbon Capture, Utilization & Sequestration (CCUS) in order to imply a market case for its deployment.52
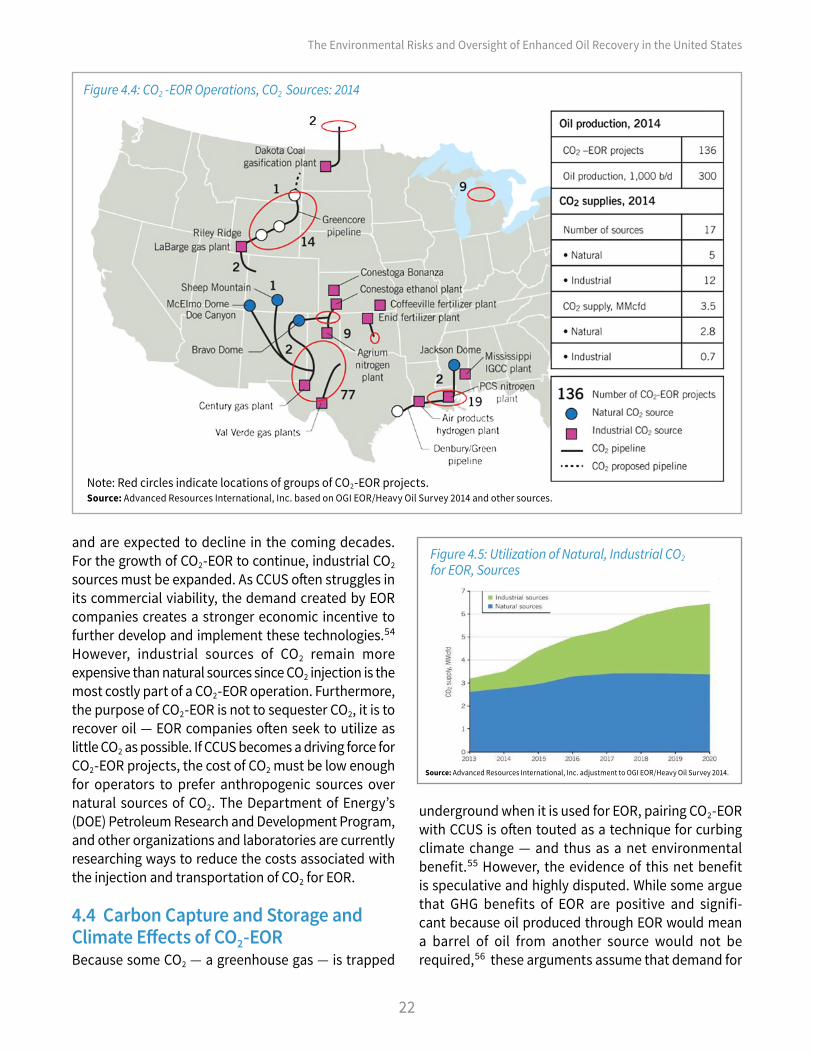
EOR companies often source their CO2 supply from naturally occurring sources, such as McElmo Dome in Colorado and Bravo Dome in New Mexico.53 According to ARI, natural sources of CO2 have largely stagnated
Source: AP Photo/Mississippi Department of Environmental Resources.
Figure 4.3: CO2 blowout, Tinsley Field, 2011
22
The Environmental Risks and Oversight of Enhanced Oil Recovery in the United States
and are expected to decline in the coming decades. For the growth of CO2-EOR to continue, industrial CO2 sources must be expanded. As CCUS often struggles in its commercial viability, the demand created by EOR companies creates a stronger economic incentive to further develop and implement these technologies.54
However, industrial sources of CO2 remain more expensive than natural sources since CO2 injection is the most costly part of a CO2-EOR operation. Furthermore, the purpose of CO2-EOR is not to sequester CO2, it is to recover oil — EOR companies often seek to utilize as little CO2 as possible. If CCUS becomes a driving force for CO2-EOR projects, the cost of CO2 must be low enough for operators to prefer anthropogenic sources over natural sources of CO2. The Department of Energy’s (DOE) Petroleum Research and Development Program, and other organizations and laboratories are currently researching ways to reduce the costs associated with the injection and transportation of CO2 for EOR.
4.4 Carbon Capture and Storage and Climate Effects of CO2-EOR Because some CO2 — a greenhouse gas — is trapped
underground when it is used for EOR, pairing CO2-EOR with CCUS is often touted as a technique for curbing climate change — and thus as a net environmental benefit.55 However, the evidence of this net benefit is speculative and highly disputed. While some argue that GHG benefits of EOR are positive and signifi-cant because oil produced through EOR would mean a barrel of oil from another source would not be required,56 these arguments assume that demand for
Note: Red circles indicate locations of groups of CO2-EOR projects. Source: Advanced Resources International, Inc. based on OGI EOR/Heavy Oil Survey 2014 and other sources.
Figure 4.5: Utilization of Natural, Industrial CO2 for EOR, Sources
Figure 4.4: CO2 -EOR Operations, CO2 Sources: 2014
Source: Advanced Resources International, Inc. adjustment to OGI EOR/Heavy Oil Survey 2014.

23
The Environmental Risks and Oversight of Enhanced Oil Recovery in the United States
oil was such that both barrels were not burned. This would, of course, double the oil used, lowering and possibly erasing the net benefit of carbon storage. Given the enormous variability in subsurface condi-tions, the extent the CO2 actually stays in the desired formation without any migration is unclear. Moreover, some estimates suggest that climate benefits do not exist for CCS- CO2-EOR at all. One paper suggested that for each ton of CO2 injected, 2.7 tons of CO2 are eventu-ally emitted when burning recovered oil.57
4.5 Future Prospects of CO2-EOR: Residual Oil ZoneResidual oil zones (ROZs) are regions of immobile oil found beneath the traditional oil recovery zones asso-ciated with EOR and waterflooding.58 OGJ reported that according to 2006 DOE estimates, oil recovered from ROZs could provide up to 100 billion bbl of the 1.124 trillion bbl of technically recoverable oil in place in U.S. reservoirs. ARI estimates that approximately 135 billion barrels of oil exist in the ROZs of 12 counties in west Texas.59 If even 30% of these resources could be technically recoverable, it would exceed the current total Permian Basin oilfield production (31 billion barrels).
Given the vast potential of ROZs, DOE has funded several projects in order to gain a better understand-ing of how to recover these untapped resources in the most economically beneficial way. In order to access ROZ reserves in pilot projects, CO2-EOR techniques have been utilized. There are currently about 15 ROZ projects underway in seven fields, all of which are in the San Andres formation in the Permian Basin.60 However, a major drawback of oil recovery in ROZs is that far more produced water is brought to the surface than in a standard CO2-EOR project. Given the current challenges in produced water management, this is a major economic, environmental and technical hurdle.61 Further development of technology aimed at improving ROZ recovery is also limited by a severe lack of publicly available geologic and reservoir characterization data about ROZs, as well as comprehensive field studies of CO2-EOR projects in ROZs.62
Source: Dehoratiis, Guido. United States Department of Energy. Personal Interview, 28 Sept. 2016
Figure 4.6: Residual Oil Zone
Box 4. Carbon Capture, Utilization and Storage Act (S. 3179) & the 45Q Tax Credit
Image Source: World Resources Institute. Carbon Capture & Sequestration Flow Chart. Digital image. World Resources Institute. N.p., n.d. Web. 8 Apr. 2017. <http://www.wri.org/resources/charts-graphs/carbon-capture-sequestration-flow-chart>.
The bill modifies the credit to allow certain new industrial facilities to increase the separate credit amounts that apply to captured CO2 by allowing the credit to be transferred from the entity that owns and uses the capture equipment to the entity that disposes of or uses the CO2.
The proposed 45Q tax credit is an upgradation of Carbon Capture, Utilization and Storage Act (S.3179) CCUS.
The 45Q provision currently awards a credit of:1. $10 per ton of stored industrial carbon dioxide used in
enhanced oil recovery (EOR) projects, and 2. $20 per ton for carbon dioxide stored underground in deep
rock reservoirs.
However, the October 2016 proposal of the bi-partisan bill was to increase credit values over a 10 year escalation period to:1. $35 per ton for stored industrial carbon dioxide used in EOR2. $35 per ton for CO2 in non EOR applications (CO2 utilization)3. $50 per ton for for carbon dioxide stored underground in
deep rock reservoirs or geological storage.

24
The Environmental Risks and Oversight of Enhanced Oil Recovery in the United States
5. Thermal EOR5.1 Overview of Thermal EOR Techniques and TrendsThermal EOR is the principal technique for recovering heavy and viscous crude oil (averaging a density of 920 kg/m3 or 9.9°API) by increasing reservoir temperature. Raising the temperature reduces the viscosity of the heavy crude, which improves fluidity and mobility within the reservoir and can even sweep portions of the reservoir not contacted by injected fluid. Thermal recovery varies from water being essential to the process (steam injection), to being unneeded (in-situ combustion).63 According to California’s Division of Oil, Gas, and Geothermal Resources (DOGGR), steam injection is currently the most utilized thermal EOR technique in the U.S., while in-situ combustion is considered outdated. However, all thermal EOR techniques are very energy intensive when compared to CO2-EOR and waterflooding.
There are two principal steam injection techniques: steamflooding and cyclic steam injection (CSI). Steam-flooding requires both an injection well and a produc-tion well, while in CSI, a single well acts as both the injection well and production well. The other key differ-entiating factor between the two is that steamflooding requires far more steam than CSI, which can drive up costs.64 According to DOGGR, cyclic steam injection is considered best practice in California, where the over-whelming majority of thermal EOR takes place in the U.S.65 Typically, in order to create the steam needed for this technique, a fuel such as natural gas is burned. However, solar panels are used in two relatively new thermal EOR fields in California to produce steam.
Cyclic steam injection, also referred to as cyclic steam stimulation or “Huff ’n’ Puff,” involves the periodic
injection of steam that heats a reservoir near the wellbore.66 CSI has three stages of recovery: injection, soaking, and production. During the injection (huff) phase, steam at a temperature between 200–300°C is injected into the well for several days or weeks. Once enough steam has been injected, the soaking stage begins, in which the well is shut down to let the steam soak for a few days. During this stage, the steam raises the reservoir temperature, reducing oil viscosity roughly between 28% and 42%.67 Finally, during the production stage, the well is reopened and the oil is swept (recovered) through a natural flow and artificial lift. “Artificial lift” is meant to imply a pump or any other means that isn’t due to underground pressure forcing the oil up the well. Once the reservoir temperature declines, the oil flow rate decreases, and the process is repeated.
Cyclic steam injection has a relatively low recovery factor when compared with steamflooding because it covers a smaller area from using only one well and is also less effective after its first few cycles. Due to this limitation, CO2 injection or steam flooding are occasionally used as a follow-up recovery process once an operator determines that cyclic steam injection is no longer producing enough oil. However, steamflooding is the most common technique because the initial capital costs are often lower. New pilot techniques, such as Top-Injection Bottom-Production, are being developed to increase sweep efficiency by eliminating the need for a soaking period. Also, researchers are currently exploring ways of introducing cyclic steam injection to hydraulic fracturing processes, allowing for a more efficient placement of injected steam that heats a larger volume of a reservoir.68
Volumes of injected water, by different EOR activities (in barrels)YEAR Cyclic Steam Steamflood Waterflood Water Disposal TOTAL
2015* (Preliminary) 194,463,578 448,204,126 918,563,155 1,565,245,330 3,126,476,189
2014 (Actual) 185,092,249 429,707,162 907,188,040 1,458,680,424 2,980,667,875
Source: California Department of Conservation’s Division of Oil, Gas, & Geothermal Resources. 2015 Report of California Oil and Gas Production Statistics. April 2015. Web.
Table 5.1: 2015 California Produced Water Injection Statistics

25
The Environmental Risks and Oversight of Enhanced Oil Recovery in the United States
5.2 Environmental Impacts of Thermal Enhanced Recovery (Cyclic Steam Injection)Thermal EOR requires large amounts of energy to gen-erate the steam used for injection. This, coupled with the fact that cyclic steam injection has a relatively low recovery factor, means that thermal enhanced recov-ery has the lowest energy returned on energy invested (ERoEI) of the three categories of technology discussed in this report.69 This may be thermal recovery’s great-est environmental impact — a large amount of energy is spent, and a large amount of fuel is burned, to produce and refine a relatively small amount of additional oil. While solar power is being used in some thermal opera-tions to reduce the fossil fuel usage in steam production, energy use remains high for the technique.70 Because of the energy expended for steam injection, California’s oil fields produce some of the most carbon-intensive crude oil in the world.71
Like other injection recovery methods, thermal enhanced oil recovery also carries some risk of corrosion and degradation that can cause well failure and lead to leakages and blowouts. Surface expressions resulting from blowouts in thermal injection can take the form of pools of scalding water and oil, in addition to sinkholes and “geysers” of oil, water, and rocks.72 Because some formations may contain more acidic compounds than others, risk of corrosion varies more by well site for this production type than CO2 injection.73 For example, injec-tion in some areas may be more likely to result in pro-duction of H2S than others. The frequency of blowouts by steam injection is determined mainly by initial well defects from the construction phase of the well. In addi-tion, the high temperatures needed for steam injection
put additional stress on wells, which means that wells should be constructed to resist temperature-related degradation.74 Thus, a well’s mechanical completion equipment must be selected with siting in mind; con-struction remains the most important factor in leakage and blowout prevention for thermal enhanced recovery.
A tragic example of thermal EOR’s potential for safety issues as well as surface pollution from blowouts can be seen in an accident at California’s oldest oil field. In June 2011, a Chevron construction supervisor died when a known surface expression from a steam injec-tion operation expanded into a sinkhole at the Midway-Sunset Oil Field, Kern County, California. The worker slipped feet first into the hole, and other workers could not react in time to save him from falling.75 Due to shallowness of the oil reservoir, the structure of the formation where the well was located, and steam injection “over formation fracture gradient” into the reservoir, “surface expressions had been occurring at the area “since the late 1990s, shortly after steam injection began.”76 Chevron Well 20, where the accident occurred, had been abandoned by Chevron three times by 2008 due to the high intensity of thermal activity at nearby surface expressions. However, other compa-nies continued steam injection operations around the well.77 After the accident, steam, oil, and water were expelled from the sinkhole, which grew into a crater over time. According to Deborah Gordon, a chemi-cal engineer and director of the Energy and Climate Program at the Carnegie Endowment for International Peace, although Midway-Sunset Field is the oldest oil field in California, it is “hugely complex” and “exem-plifies all that we don’t really know and understand” about oil recovery.78
Figure 5.1: Fluid flow from Chevron Well 20 surface expression, August 17, 2011. Source: DOGGR.

26
The Environmental Risks and Oversight of Enhanced Oil Recovery in the United States
6. EOR Technology and Environmental Impact Data Gaps6.1 Communication and TerminologyAlthough EPA defines some basic terminology in its UIC Program regulations, such as aquifer and USDW, a definition of enhanced oil recovery is not included.79 This has led states to define enhanced oil recovery in numerous ways, which creates the potential for data misinterpretation on a national scale. This increases the difficulty to obtain comprehensive statistical data for EOR production in the U.S. as it is unclear whether sources consider waterflooding to be part of EOR. For example, some use the term, improved oil recovery (IOR) to describe both secondary recovery and enhanced oil recovery together.
In order to address this confusion in the oil industry, the Society of Petroleum Engineers (SPE) provided recommendations to establish a “mutually acceptable definition of the terms Enhanced Oil Recovery (EOR) and Improved Oil Recovery (IOR).” They believe that IOR should encompass both secondary recovery and EOR techniques, and EOR should only refer to thermal,
gas injection (miscible/immiscible), and chemical injection.80 Regardless of whether EPA adopts SPE’s specific proposal, “effective communication requires a definition of terms,” so it is imperative that EPA pro-vides precise definitions for the oil recovery practices it regulates.81 Since both secondary and tertiary recovery are regulated by UIC, EPA should classify both recovery technologies as being part of EOR in order to minimize confusion.
6.2 Data Collection and Transparency In part due to a lack of consensus on terminology, there are severe data gaps related to data collection and availability. The main issue at hand is that it is very likely that much of the data exists but there is no federal regulation or economic incentive for oil produc-ers to provide this data to the state bodies that would aggregate it and release it to the public. According to an Argonne National Laboratory study, “among the tech-nologies, EOR is … well-documented for its production
Figure 6.1: SPE Proposal for Term Definitions
Source: Stosur, George, Roger Hite, Norman Carnahan and Karl Miller. The Alphabet Soup of IOR, EOR and AOR: Effective Communication Requires a Definition of Terms. Society of Petroleum Engineers Inc., 2003.

27
The Environmental Risks and Oversight of Enhanced Oil Recovery in the United States
share, while primary and secondary data are scarce.”82 This study obtained the majority of its statistical pro-duction information from an Oil & Gas Journal article from 2006 and an EIA 2007 report; however, this EIA report is no longer publicly available. This piecemeal data aggregation can be seen in Table 3.1, where it is used to estimate oil production from all three phases of oil recovery.
In order to have a full understanding of national trends surrounding EOR and waterflooding, data transparency is critical. Even data on tertiary recovery, which the Argonne study says is relatively “well-documented,” is difficult to find and is not usually available from state or federal sources — “statistics on [tertiary recovery] activity go unreported and have to be collected from open literature.”83 EPA does not require states to submit basic data on production techniques, such as a breakdown of each EOR technology’s annual produc-tion, for public consumption.
Since no federal government database, such as the U.S. Energy Information Administration, aggregates production data by recovery type, it was impossible to provide an adequate comparison of national and state injection and production trends by the oil recov-ery techniques explored. Although many estimate that about 70% of onshore crude oil produced by states is from waterflooding, the authors were unable to provide any recent data that could provide an accu-rate depiction of secondary recovery trends compared with tertiary recovery trends. This means that well over half of total U.S. crude oil production remains inad-equately documented or is unavailable to the public.
It is highly recommended that this changes so we can have a better understanding of oil recovery trends in the U.S. Furthermore, Oil & Gas Journal should not only continue their biannual EOR surveys, but they should also include waterflooding to more comprehensively capture EOR data.
6.3 The Need for Further Research into Environmental EffectsThe most recent comprehensive EPA survey on the environmental effects of EOR (tertiary recovery only) was published in 1981 at the inception of the UIC program. The survey, Potential Environmental Prob-lems of Enhanced Oil and Gas Recovery Techniques, noted that “the unavailability of many critical data pre-cludes any firm conclusions about the risk of enhanced oil recovery operations in the areas of groundwater seepage, health risks of chemicals, secondary impacts from chemicals, secondary impacts from chemical supply and manufacture, and degradation products.” There has been no update of this report.
The report noted a “critical need” for further research in these areas:84
• Persistence of injected chemicals over time and movement of these chemicals in freshwater aquifers
• Baseline data on groundwater quality where injected waters leave oil reservoirs
• Site-specific risk analysis • Toxicology of chemicals used in enhanced
recovery
Recovery TechnologyOil Productiona by
Recovery technology (thousand bbl/d)
Total Recovery Technology Share
Onshore Recovery by Technology
(thousand bbl/d)Onsore Recovery Technology Share
Primary 1940 37%b 228c 7%
Secondary (waterflooding) 2589 50%d 2589 75%
Tertiary (EOR) 649e 13% 649 19%
TOTAL 5178 100% 3466 100%
a Total onshore and offshore production (EIA 2007, EIA 2008) b Primary recovery – total recovery – (secondary + EOR) c Assumes all offshore wells are primary recovery d EIA 2007 e O&GJ 2006
Table 6.1: Estimated Oil Production by Recovery Technology, 2005

28
The Environmental Risks and Oversight of Enhanced Oil Recovery in the United States
While site-specific modeling and risk analysis is required for most EOR operations under the UIC program, baseline data and general monitoring for groundwater quality is not. This is because of the UIC Program’s preventative design, which is supposed to preclude any environmental issues such as ground-
water contamination. However, this is problematic because there are common sources of environmental impacts like blowouts and leaks that warrant further monitoring of the subsurface. Additionally, as far as can be determined, there has never been an EPA report on the environmental effects of waterflooding.
7. Regulatory Oversight of Enhanced Oil RecoveryStates are the major drivers of regulatory oversight; they implement the majority of UIC programs and have the most resources to do so.85 However, regulatory practices, funding and staffing vary significantly from one state to another. A small portion of state UIC budgets come from categorical grants from EPA. The budgets of UIC programs are mostly funded by the states themselves. The consensus among interviewees was that Class II regulations are carried out best by state level regulators, not EPA, because states possess the geographical, technical, and historical expertise. Given that current funding levels for the EPA’s UIC program are already insufficient for the basic duties required for overseeing state programs, turning over primary oversight duties to EPA would require a significant increase in funding levels. As such, for the foreseeable future, it is likely that states will remain as the primary regulators of EOR in most states, with EPA directly implementing a limited number of programs in some states and tribal lands as wells as providing oversight and some funding for state programs. Given that EOR gained momentum in the early 20th century, prior to the formation of EPA, more regulatory expertise lies within older oil producing states such as California, Wyoming, New Mexico, Texas, and Kansas.
The following section provides insights into regulatory practices in selected states, comparing and contrasting: California, Texas, New Mexico, North Dakota, Ohio, Colorado. The information provided is based on research of regulations and interviews with experts and state regulators. The issues illustrated here represent common prac-tices and challenges for EOR regulation in the U.S. We also summarize the cross-cutting issues amongst regulatory agencies at federal and state level, and give policy recommendations on how to improve the protection of USDWs from possible contamination from injection activity.
This section evaluates EPA’s minimum standards and selected states’ regulations pertaining to EOR activities. It seeks to answer the following questions, as broken down into three categories of regulatory activity:
1. Underground Injection Control Program regulations: ▶ Are EOR activities defined in state and federal regulations? ▶ When did states receive primacy for Class II injection wells? ▶ Are operators required to disclose chemicals injected during EOR? ▶ What is the minimum radius for Area of Review (AOR)? ▶ What is the frequency and procedure of Mechanical Integrity Testing (MIT)? ▶ What are the provisions for public participation in the permitting process? ▶ Do regulations include groundwater monitoring for contamination?
2. UIC Oversight activities: ▶ When was the last audit conducted by EPA or/and third-parties? ▶ Is the UIC program reviewed by the regulatory body periodically? ▶ Do state regulators face budgetary constraints?

29
The Environmental Risks and Oversight of Enhanced Oil Recovery in the United States
3. Other issues that impact EOR oversight: ▶ What is the process of aquifer exemptions, and where is it applicable? ▶ What are the requirements for groundwater monitoring in states? ▶ What is the data management system? ▶ How is the data made accessible for public? ▶ What are the regulation are adopted to have financial assurance, especially for small operators? ▶ What are the state regulations for orphaned/abandoned/idle wells?
7.1 EPA Minimum StandardsThis section evaluates EPA’s minimum standards for the regulation of injection. EPA directly oversees the Class II program for states, territories and tribes without primacy (see Figure 1.1). This means that EPA regional offices must directly regulate 7,609 Class II wells, 5,571 of which are for EOR. States that have primacy over their own UIC programs are required to meet the protections provided by these federal standards:
Definition of EOR activities ▶ EPA does not define enhanced oil recovery in 40 CFR § 146.
Primacy ▶ SDWA Sections 1422 and 1425 establish procedures for states to apply for primary enforcement
authority, or primacy, over underground injection wells. ▶ The procedure to obtain primacy for Class II wells (described in Section 1425 of the SDWA) pertains
only to underground injection related to oil and natural gas. It differs from the procedure to obtain primacy for all other well classes outlined in Section 1422. Primacy applicants must demonstrate that their standards are effective in preventing endangerment of USDWs. As long as federal minimum standards are met, states can oversee their individual programs in a manner that works best for the state. By contrast, Section 1422 requires states to mirror EPA minimum requirements. Therefore, the standards of different programs are very inconsistent and decisions on what is considered effective were made arbitrarily in some states with a long history of oil and gas.
Box 5. Mechanical Integrity TestingImplementing MIT requirements is an important responsibility of state regulatory agencies. According to 40 CFR § 146.8, an injection well has mechanical integrity (MI) if there is no significant leak in the casing, tubing, or packer (internal MI) and no significant fluid movement into an underground source of drinking water (USDW) through vertical channels adjacent to the wellbore (external MI). All UIC Class II (and Class I) injection wells must pass MI requirements prior to operation and must conduct MITs at least every 5 years throughout operation. MITs are usually witnessed by field inspectors employed by the state under the UIC program. MITs can detect leaking wellbore annuli, which can be pathways for CO2 migration into unplanned zones. The most common MIT problems for Class II injection wells reportedly are related to casing.
There is huge variation among states’ MIT requirements. Some states, e.g. Illinois, Kansas, and Ohio, explicitly require both internal and external MIT for all Class II wells. Texas and Oklahoma provide the most comprehensive and thorough regulations including detailed step-by-step instructions for conducting pressure tests. Texas and New Mexico regulations do not mention external MIT/fluid migration tests, and require only a pressure test to demonstrate internal MI. State requirements also vary regarding MIT type and witness rate by field inspectors. For example, Texas requires a 500 psi stabilized MIT for 30 minutes with a 25% witness rate, Oklahoma requires a 200 psi MIT, allowing up to 10% drop but has a 95% witness rate.Source: Interviews & Jonathan Koplos, Bruce Kopelski, Anhar Karimjee, and Chi Ho Sham, “UIC Program Mechanical Integrity Testing: Lessons for Carbon Capture and Storage?” DOE/NETL, MAY 8–11, 2006 CCS Conference Paper #139.

30
The Environmental Risks and Oversight of Enhanced Oil Recovery in the United States
Chemical disclosure ▶ EPA’s UIC minimum standards do not require operators to disclose the chemicals injected for EOR.
Yet, under 40 CFR § 146.24, the proposed operating data to be considered when issuing a permit includes the source and an appropriate analysis of the chemical and physical characteristics of the injection fluid.
Minimum radius for area of review ▶ EPA requires a radius of ¼ of a mile as the radial area of review.
Mechanical Integrity Testing ▶ Under 40 CFR § 146.23, a demonstration of mechanical integrity pursuant to § 146.8 must be
conducted at least once every five years during the life of the injection well.
Public participation with permitting ▶ Permit applications are generally published by public notice and there is a 30 day public comment
period. Anyone can, by written notice, petition the issuance of a permit for the operator of a well. In this case, a hearing will be held.
Groundwater monitoring ▶ EPA’s class II program does not require monitoring of groundwater quality for contamination.86
▶ Under 40 CFR § 146.23, operators are only required to monitor the injection pressure, flow rate, and cumulative volume at minimum monthly for enhanced recovery operations, but daily during the injection phase of cyclic steam operations.
Staffing, training, and expertise in the UIC programs under EPA’s responsibility ▶ EPA runs 10 Regional offices,* out of which UIC Program oversight is conducted both for the states and
territories under EPA’s direct responsibility and for states with primacy for Class II wells.
7.2 New MexicoDefinition of EOR activities
▶ Enhanced oil recovery is defined in the New Mexico Administrative Code, Chapter 19.15.2: “enhanced oil recovery project” means “the use or the expanded use of a process for the displacement of oil from an oil well or division-designated pool other than a primary recovery process, including but not limited to the use of a pressure maintenance process; a water flooding process; an immiscible, miscible, chemical, thermal or biological process; or any other related process.”
Primacy ▶ The Engineering Bureau of the Oil Conservation Division (OCD) oversees the regulation of Class II
enhanced oil recovery and disposal wells.† ▶ New Mexico was amongst the first states to receive primacy for its UIC Class II program in March 1982.
To comply with EPA’s minimum standards, New Mexico changed the review process for obtaining a well drilling permit, and established a formal hearing process and a testing cycle.87
*To view an overview of EPA Regional Offices, visit https://www.epa.gov/aboutepa#pane-4†Additionally, the Environmental Bureau of the NMOCD is responsible for Class I (Non-hazardous) wells and the Class III brine recovery wells. Classes I, III, IV and V which are not associated with oil and gas activities are regulated by the New Mexico Environment Department, Groundwater Quality Bureau.
NEW MEXICOYear obtained Class II primacy 1982Regulatory agency (Class II) Oil Conservation Division (OCD)Number of EOR wells 3,420Number of UIC Class II staff 4 full-timeNumber of field inspectors 24
Main regulatory issues/highlights– P&A of old wells – Data management – Financial assurance
31
The Environmental Risks and Oversight of Enhanced Oil Recovery in the United States
▶ The bulk of EOR well permits were issued in New Mexico in the 1960s and 1970s prior to the creation of the UIC program.88 Most wells were already drilled when EPA established minimum standards for siting, and the new siting standards could not be applied to the existing wells. Through periodic Mechanical Integrity Testing, the old wells were grandfathered in, and the new standards for casing, cementing, and mechanical integrity were applied to all wells across New Mexico.
Chemical disclosure/testing ▶ An extensive characterization of the chemicals injected into Class II wells is not required, since Class II
wells are exempted from detailed analysis. ▶ Operators disclose the chemicals used for an EOR project as part of the C-108 application and the plan
of development. Since compatibility of injection fluids is critical to reservoir conditions and future success, operators tend to provide extensive analysis of water to be used in the EOR project, including polymers or new sources for use as make-up water.
▶ So far, no polymer injection projects have occurred in New Mexico. Currently, EOR projects are more centered on water alternating gas / huff and puff operations that use existing reservoir waters and gas for increasing the movement of remaining hydrocarbons.
Minimum radius for area of review ▶ New Mexico has always used a radius of ½ mile as the
radial area of review which is double EPA’s minimum of ¼ mile.
Mechanical Integrity Testing ▶ MIT can, but does not have to, be witnessed by UIC
inspectors. ▶ The workload of the UIC inspectors is immense. For
instance, over a period of one year (Sep 2015 – Sep 2016), OCD inspectors conducted 5,335 inspections of EOR wells. Of these EOR inspections, 3,801 involved MITs of which 3,116 were witnessed.89 Of the 3,801 MIT-related inspections mentioned above, inspectors reported 699 failures primarily due to tubing issues, and 149 failures of two-part tests (Bradenhead test and MIT for tubing annulus).*
▶ In a typical day, inspectors can perform 4 to 5 MITs, including inspecting the equipment, the wellhead shape, and the casing pressure.90
▶ For MITs not witnessed by the inspectors, the state agency relies heavily on data submitted by the operators. The OCD typically rejects graphs it considers unreliable or improperly scaled; for example, when a 500 PSI test is depicted on a 10,000 PSI chart, or when the ink disappears halfway through the graph.
▶ In case of a well failure or remedial work, an inspector revisits the well to witness the follow-up tests.
*It should be noted that due to conflicting categories offered by EPA’s Form 7520, it is possible that field inspectors do not put the correct identification on the reported failure.
Box 6. Siting and Area of ReviewInjection well siting is critical, especially in states with large numbers of old, abandoned, and plugged injection wells.
This concerns primarily the Area of Review (AOR) which is per EPA minimum a ¼ mile search for unplugged or inadequately plugged wells that might serve as a conduit for injected fluids to contaminate groundwater or “water out” other producing formations. If an unplugged well exists within the AOR, the applicant will have to re-enter and plug the well before being allowed to inject.
Some states such as New Mexico have adopted a minimum radius for Area of Review of ½ mile. Others such as Texas have a procedure to increase the Area of Review for areas where experience has shown that a larger area is needed.

32
The Environmental Risks and Oversight of Enhanced Oil Recovery in the United States
▶ OCD cooperates with Bureau of Land Management (BLM, under the U.S. Department of the Interior) for MIT inspections. In the event that all UIC inspectors are preoccupied with other cases, but an operator has scheduled a MIT, BLM inspectors are qualified to witness the MIT in their stead.
Public participation with permitting ▶ EOR projects require the submission of a development plan to the mineral owner (BLM and/or NMSLO
and/or private mineral owner) and to OCD to be considered through a hearing, the case to establish the EOR project and the associated injection authority.
▶ 19.15.4 NMAC — Adjudication — statutory unitization (which includes EOR projects) requires the application be provided to operators/mineral interest owners/mineral estate owners directly impacted by the proposed unit formation and associated activities. A majority of the individual notices goes to adjacent properties depending on the scale and type of EOR unit. Along with this notice, the Division posts the application on its website and the applicant will provide a published notice in a local newspaper of general circulation.
▶ Since these oil and gas activities are conducted in portions of the state where the economy is based on resource development, most objections involve issues of ownership or terms of the unit agreement.
▶ Only when SandRidge proposed development near Rio Rancho/Sandoval County (exploratory well in a non-productive area of the state — as well as previously in Mora County and Santa Fe County) was there any significant interest in the permitting process. This subsided as local rulemaking was initiated/approved (county ordinances on traffic/site safety/planning/water use/disposal/etc.) or as the drilling applications were withdrawn by the operator as the price of oil dropped.91
Groundwater monitoring ▶ Groundwater monitoring falls under the authority of the New Mexico Environment Department.
Therefore, operators do not have to monitor groundwater in the area around the injection.
UIC oversight activities ▶ There are currently 4,370 active injection wells, of which 3,420 are EOR wells (including waterflooding)
in New Mexico. Most of them are located in the southwest of the state and are less than 4,500 feet deep; about 50% are less than 2000 feet deep.
▶ Due to low oil prices, which limit interest in new EOR ventures, New Mexico only issued 12 new EOR permits during the period from October 2015 to September 2016.
EPA and third-party audits ▶ The UIC Program of New Mexico has not been subject to an in-depth review by EPA or a third-party in
recent years. ▶ EPA did provide a written review of the NMOCD performance in 2016, which identified the “typical”
problems of resources and time allotment; however, no programmatic or enforcement issues were found. ▶ The most recent interaction with EPA included the reexamination of oil and gas activities and
associated groundwater aquifers (Underground Sources of Drinking Water) for the determination of possible Exempted Aquifer status for certain portions.*
▶ The main correspondence between EPA and New Mexico’s UIC Program is through phone calls and annual reports.
*The revisiting of Exempted Aquifers was motivated indirectly by the drinking water problems that occurred in Flint, Michigan. Several NGOs requested EPA to inventory the Exempted Aquifers of the UIC program since it is part of the Safe Drinking Water Act and there were concerns that other drinking water issues might be occurring under this program.

33
The Environmental Risks and Oversight of Enhanced Oil Recovery in the United States
Staffing, training, and expertise in the UIC program ▶ The Engineering Bureau includes a Bureau Chief and three full-time employees (petroleum engineers,
geologists, and environmental engineers). There are six full-time employees (inspectors) in each of the four districts who check all well classes in the field, witness Mechanical Integrity Tests (MIT), deal with environmental releases, and conduct inspections of the well heads.
▶ The lack of documentation and the reliance on the individual expertise of each inspector creates problems when institutional knowledge is lost. Many OCD field investigators have worked for more than 20 to 30 years and will retire soon. When these inspectors leave their jobs, their working knowledge often disappears with them, especially in the absence of a mentoring program and exit interviews.
Budget constraints ▶ At present, about a quarter of New Mexico’s UIC regulatory staff is paid through budget support from
EPA, and the rest of the program’s funding comes from the State of New Mexico’s General Fund. New Mexico does not charge permit fees or penalties to support its budgetary needs.
Data management ▶ Similar to other states, New Mexico is struggling with the transition from paper forms to electronic
means of data collection and storage. ▶ New Mexico is currently using three electronic databases, the Risk-Based Data Management System
(RBDMS), E-permitting, and the OCD Web Map Application.* Running two parallel databases (RBDMS and E-permitting) requires a constant balancing act of data management. Many routine regulatory activities are managed through the OCD Online system. The application for Permit to Drill, Re-enter, Deepen, Plugback or Add a Zone has to be filed electronically using the E-permitting portal of OCD Online, the same applies for the operator’s monthly reports.†
▶ Inspectors enter data into RBDMS to report back to the program office in Santa Fe which uses the database to compile the information necessary to complete EPA’s Form 7520. The C-103 (filed by the operator), the inspection summary sheet (filed by the Division) and the MIT graph are completed in paper, scanned and saved as PDFs.
Public accessibility of data, public participation in regulatory oversight ▶ A variety of data is publicly available from the website. For example, users can download the GIS
data for New Mexico, visit an Oil and Gas Map (OCD Online)‡, and download over 4 million documents, including well files, hearing orders and case files.
Financial assurance and small operators ▶ Small and medium-sized companies pose a higher liability due to their relatively limited resources
especially in periods of depressed commodity prices. In contrast, larger operators have more capital, advanced technological equipment, and more personnel to detect and resolve environmental problems. Often, the bankruptcy of small companies creates problems, as the financial assurance bond that is reserved for plugging the operators’ wells is often seen as an asset that can be liquidated in the bankruptcy process.
▶ There is currently no formal rule stipulating that operators who performed poorly in the past should be denied permits. Yet, inspectors have an internal record of historic issues with certain operators, so operators perceived as a higher liability are treated with more scrutiny than others and are inspected more frequently by the compliance branch.
*The OCD Web Map Application is available at http://www.emnrd.state.nm.us/OCD/ocdgis.html†The E-permitting portal of OCD Online is available at http://www.emnrd.state.nm.us/OCD/forms.html‡To access OCD online, use http://www.emnrd.state.nm.us/OCD/ocdgis.html

34
The Environmental Risks and Oversight of Enhanced Oil Recovery in the United States
7.3 TexasDefinitions of EOR activities
▶ Title 16 TAC § 3.50.4 defines EOR as the “use of any process for the displacement of oil from the reservoir other than primary recovery and includes the use of an immiscible, miscible, chemical, thermal, or biological process. This term does not include pressure maintenance or water disposal projects.”
Primacy ▶ The Texas Railroad Commission (RRC) obtained primacy for Class II wells in 1982.*† ▶ Environmental advocates have pointed out that the issue of exempted aquifers was not properly
addressed during the primacy transfer process. Texas has never reviewed any aquifer exemption applications, which is surprising for a state with so many injection wells.92 During the primacy transfer process, RRC stated it would provide maps and information for all productive fields in order to get aquifer exemptions for enhanced recovery activities from EPA, yet this never happened. RRC is currently reviewing its inventory of Class II wells to check whether injection into USDWs is occurring.
▶ Similar to New Mexico, the bulk of EOR well permits were issued in Texas before EPA’s UIC Program came into being. The earliest wells were drilled in 1911, although RRC did not receive legislative authority for overseeing drilling permits until 1919. These early wells are shallow wells ranging from 300 to 400 feet. The first EOR well in Texas was permitted in 1936, more than 40 years before EPA established the UIC Program. Proper records do not exist for many of these old wells, which makes it hard to prove that they have been properly plugged.
▶ Also like New Mexico, the peak of EOR drilling in Texas pre-dates EPA’s establishment of the UIC Program and the granting of primacy in 1982. Therefore, the more stringent rules for siting, cementing and casing were not applied to many EOR wells in Texas. This means that wells that had what was considered adequate surface casing at the time they were drilled are no longer appropriate under today’s standards. RRC later permitted these substandard wells, but required a higher level of MIT frequency, grandfathering these wells into the UIC Program.
▶ Texas has an enormous amount of UIC wells. There are over 50,000 Class II injection wells in Texas, out of which around 11% are disposal wells, another 12% are disposal wells into productive formations and 75% are active injection wells for enhanced oil and gas recovery, including water flooding. The shallowest EOR wells in Texas are only 80 to 100 feet deep, the deepest are around 6,000 feet.
Chemical disclosure ▶ For Class II injection wells associated with Enhanced Oil Recovery (EOR), the permit applicant must
provide a list of fluids (including gases) to be injected. However, once the permit is obtained, no regular reporting of injected fluids is required.
*RRC also regulates Class V geothermal return and in situ coal combustion wells, and Class III brine mining wells. In 1985, the 69th Texas Legislature enacted legislation that transferred jurisdiction over Class III brine mining wells from the Texas Water Commission, now the Texas Commission on Environmental Quality, to RRC. In 2004, RRC obtained EPA’s approval and codification to revise the portion of RRC’s UIC program governing Class III brine mining wells.
† The Texas Commission on Environmental Quality regulates well classes I, IV and V as well as all other Class III wells, including solution mining of sulfur, salts or uranium, for injecting liquid wastes and other substances. For more information, see TCEQ’s website. TCEQ also obtained primacy in 1982 (40 CFR 147.2200).
TEXASYear obtained Class II primacy 1982Regulatory agency (Class II) Texas Railroad Commission (RRC)Number of EOR wells 40,421Number of UIC Class II staff 15Number of field inspectors ~180
Main regulatory issues/highlights– P&A of old wells – Data management – Small, Inexperienced operators– Aquifer exemptions

35
The Environmental Risks and Oversight of Enhanced Oil Recovery in the United States
▶ By contrast, a listing of chemicals used in hydraulic fracturing of wells must be disclosed on FracFocus.org in accordance with 16 Tex. Admin. Code §3.29, relating to Hydraulic Fracturing Chemical Disclosure Requirements.
Minimum radius for Area of Review ▶ According to 16 TAC § 3.46, the area of review is ¼ of a mile, which corresponds to the federal minimum. ▶ RRC has a procedure to increase the area of review. Some areas in Texas, where experience has shown
that a larger area is needed, use an area of review of ½ of a mile.
Mechanical Integrity Testing ▶ The default practice is to conduct MITs every five years, except for old substandard wells, which are
tested annually. ▶ Over the years, RRC has significantly improved its coverage of MITs. In 1988, around only 8% of MITs
were witnessed by field inspectors, that share rose to 25% by 2011.93 ▶ RRC field inspectors’ responsibilities are not limited to Class II wells. They also inspect pipelines,
producing wells, tank batteries, oil spills, offshore drilling platforms, hydrogen sulfide gas facilities, abandoned oil wells, historic pollution sites, and follow-up with contaminated water well complaints.
▶ As described for other states, field inspectors have exceptionally busy schedules; some of them are responsible for up to 10 counties each. In the event of an emergency, the inspectors must immediately change their daily schedule. Given that some inspectors are in charge of thousands of wells, this can easily happen multiple times a week.94 The number of inspections one staff member performs varies with the territory. In Archer County, for example, an inspector can review 10 leases in a day with one or two wells per lease. In other areas, such as Midland County, well density is higher and inspectors can spend up to a week on one lease with several hundreds of wells.
▶ The failure rate on MITs is about 7–8%, most of which are due to tubing, packer, and casing leaks. One common issue is that operators can move the packer above the area of the leak, which will then lead to a successful test despite the problem not having truly been resolved.
▶ In case of a failed MIT, the well has to be repaired and subsequently retested or the well must be plugged. RRC has had instances of operators trying to falsify MIT reports; in those cases, they get referred to legal enforcement. Whenever RRC finds an MIT report suspicious, it is labeled in the database as a “chart anomaly,” which then requires a witnessed retest.
Public participation in permitting ▶ The permit procedure includes an administrative, technical, and managerial review. In some cases,
these reviews are followed by a hearing (if a protest was filed against the permit) and a public meeting of the Commission. Around 52,000 Class II wells are currently permitted in Texas, while many more have been plugged or have had permits cancelled over the years. RRC permits between 2,000 and 4,000 Class II wells annually.
▶ According to 16 TAC § 3.46 c, protests from an affected person or local government must be made to the commission within 15 days of the public notice of the application, followed by a public hearing. The Commission can also determine that a hearing is in the public interest.
▶ 16 TAC § 3.46 c stipulates that notice of a hearing must be sent to all affected persons, local governments, or other persons, who express an interest, in writing, in the application.
Financial assurance regulation ▶ According to 16 TAC § 3.78, a deposit must be filed in an amount equal to the sum of $2.00 for each foot
of total well depth for each well operated, excluding any well bore included in a well-specific plugging

36
The Environmental Risks and Oversight of Enhanced Oil Recovery in the United States
insurance policy. The base amounts are $25,000 for a person operating 10 or fewer wells or performs other operations, $50,000 for a person with more than 10 but fewer than 100 wells, and $250,000 for a person with 100 or more wells. Additional financial security requirements apply for bay wells and offshore wells.
Groundwater monitoring ▶ Groundwater monitoring is generally not required for injection wells associated with EOR. ▶ In contrast, groundwater monitoring is required for Class III brine mining wells and certain types of
surface impoundments.
UIC oversight activities
EPA audits ▶ From 1996 to 2002, the Texas UIC program for Class I, III, IV and V injection wells underwent a major
review, but Class II regulations did not.* ▶ Texas was also one of the eight states that the Government Accountability Office (GAO) selected as a
sample for the analysis of oversight and data management in UIC programs in 2014 and 2016.
Project/annual reviews. Does the state do annual UIC project reviews? ▶ In addition to the yearly review of RRC’s program with EPA, as a Texas state agency, RRC is required to
evaluate its programs on a quarterly and annual basis against a set of performance measures. The UIC program is part of this evaluation. The Commission also has an internal auditor, who performed an audit of the UIC program in 2013.
Staffing/training/expertise in the UIC programs ▶ RRC employs 15 staff that oversee Class II regulation. Additionally, RRC has about 180 field inspectors. ▶ All Texas state agencies are currently under a hiring freeze and positions have been left vacant.
Therefore, the UIC program staff is currently facing an increasing workload with decreasing human resources.
▶ RRC’s IT division suffers from understaffing, which makes it hard to keep up with data entry, let alone improving the database. For example, changes to the database that the UIC Program had asked for in 1995 were finally implemented over a decade later, in 2008.
Budget constraints ▶ EPA’s financial contribution to the regulation of underground injection in Texas has been shrinking over
the years.95 ▶ Currently, approximately 25% of RCC’s UIC program is funded by federal grant, with 75% coming from
the state. ▶ RRC charges fees for permit issuance — a permit for injection into non-producing formations costs $100
per wellbore. A permit for injection into producing formations is $500 per wellbore. Additionally, every exception request costs an additional $375.
Other issues that impact EOR oversight:
Data management ▶ Due to the huge number of wells and the long history of oil recovery in Texas, data management is
an enormous challenge. While historically regulatory filings were made in paper format, the first
*In 1996, the Environmental Defense Fund (and later the Oil and Chemical Association of Workers) filed a petition for partial withdrawal of program approval for the Texas UIC program for Class I, III, IV, and V injection wells. The issues reviewed included inadequate enforcement authority due to audit privilege and takings laws, inadequate public participation in enforcement activities and permitting decisions, and inadequate opportunities for judicial review of permit decisions made by TNRCC. The program review took six years, until 2002.

37
The Environmental Risks and Oversight of Enhanced Oil Recovery in the United States
computerized tracking started in the 1960’s. In 1980, RRC created a UIC database, which covered all wells under RRCs jurisdiction (Class II wells, Class III brine mining wells, and liquid and gas storage wells), but this database is no longer in use. Most data is now entered into a mainframe (COBOL) EBCDIC database.*
▶ Still, different offices use different methodologies. For example, while administrative violations are handled out of the headquarters in Austin, each department tracks them differently, using mainframe databases, department databases, or excel spreadsheets.
Public accessibility of data ▶ While all data is generally made public, RRC charges a fee for accessing it, which covers the
administrative costs of extracting the information. The database can be purchased for $140. The data is designed for regulatory needs, and it is in a mainframe EBCDIC fixed-length format.† The well database does not lend itself to aggregation very well. It enables viewers to look up individual wells, but it is challenging, for example, to find exactly how many EOR wells exist in a particular area.
▶ RRC’s website includes significantly more information than the websites of New Mexico or California. A Public GIS Viewer allows anyone to view the wells, pipelines, as well as information on the lease IDs and surveys on a digital map.‡ The website also includes a section on complaints, which clearly outlines RRC’s responsibilities versus those of the Texas Commission on Environmental Quality, and a link to the contact information of the Oil and Gas District Offices.§ The frequently asked questions include answers on “Water Use in Association with Oil and Gas Activities”.¶ This is not surprising given the acute concerns about water scarcity in Texas.
▶ As “amateurs”, some people pick up an oil field as a retirement plan and simply copy the practices of other operators without fully understanding proper operational procedures themselves. Combined with a lack of understanding of the geology and the reservoir, this poses a huge liability to state regulators. In addition, small operators often lack the financial capacity to ensure proper well plugging or cleanup of significant spills.
Financial insurance and small operators ▶ Texas regulators in interviews also reported issues with small companies with less sophisticated
operations. While the top 20 operators produce approximately 75% of the oil and gas and have big leases with hundreds of wells, small operators may possess as little as one or two wells. Reportedly, whenever the oil price goes up to over USD 100 per barrel, increasing numbers of people become interested in investing in the industry and purchasing leases. Since relatively older, shallow, and more worn-out wells are cheaper to invest in, small operators often acquire less modern wells. As outlined in Section II, in Pathways of Groundwater Contamination for Class II Well Activity, these wells are more prone to environmental risks.
▶ As “amateurs”, some people pick up an oil field as a retirement plan and simply copy the practices of other operators without fully understanding proper operational procedures themselves. Combined with a lack of understanding of the geology and the reservoir, this poses a huge liability to state regulators. In addition, small operators often lack the financial capacity to ensure proper well plugging or cleanup of significant spills.
*EBCDIC: Extended Binary Coded Decimal Interchange Code; COBOL: Common Business Oriented Language† The RRC website has online data at:www.rrc.texas.gov‡To access the public GIS Viewer, visit the following website http://wwwgisp.rrc.texas.gov/GISViewer2/§ The RRC website’s complaints section is available at http://www.rrc.texas.gov/oil-gas/complaints/¶ The RRC website’s FAQ can be found here http://www.rrc.texas.gov/about-us/resource-center/faqs/oil-gas-faqs/faq-water-use-in-association-with-oil-and-gas-activities/

38
The Environmental Risks and Oversight of Enhanced Oil Recovery in the United States
7.4 CaliforniaDefinitions of EOR activities
▶ The state of California defines UIC activities under Enhanced Oil Recovery (EOR) activities, in its California Statutes and Regulations for Conservation of Oil, Gas, & Geothermal Resources, (PRC10) clause § 1761 “Underground injection project” or “subsurface injection or disposal project” means sustained or continual injection into one or more wells over an extended period to add fluid to a zone or the purpose of enhanced oil recovery, disposal, or storage. Examples of underground injection projects include waterflood injection, steamflood injection, cyclic steam injection, injection disposal, and gas storage projects.96
Primacy ▶ California’s UIC Program is administrated by the Department of Conservation: Division of Oil, Gas, and
Geothermal Resources (DOGGR). DOGGR supervises the drilling, operation, maintenance, and plugging and abandonment of onshore and offshore oil, gas, and geothermal wells. DOGGR covers the program in all six districts of California. According to DOGGR’s Underground Injection Control Program Report On Permitting and Program Assessment, there were over 54,000 EOR injection wells in California as of 2015. Roughly 96% of California’s Class II injection wells are for EOR.97 California obtained primacy in 1983, however, its program is currently under review by EPA and is updating its regulations.
Minimum radius for Area of Review ▶ The current minimum area of review (AOR) is ¼ mile. However, the PRC 10 discussion draft updates98
have proposed increasing the minimum to 1500 feet, which is slightly more than a quarter-mile.
Mechanical Integrity Test ▶ Under PRC 10 § 25159.17. (b) (a) DOGGR99 should make inspections at least once annually of all facilities
with injection wells into which hazardous waste is discharged. The owner of the well is required to tabulate the monitoring data recovered monthly. DOGGR is required to review the data specified in quarterly reports to ensure that all injection wells into which hazardous waste is discharged comply with the regulatory requirements. Under PRC 10 § 1784.1, a UIC inspector is not required to witness the Mechanical Integrity Test (MIT), but may choose to witness the MIT.100
▶ Under PRC 10 § 25159.17. (b) DOGGR requires complete mechanical integrity testing of the wellbore at least once a year and require pressure tests at least once every six months. Also under PRC 10 § 1745.10. operation are to be witnessed by a DOGGR inspector include tests for location and hardness of plugs placed across oil or gas zones open to the well.
Groundwater monitoring ▶ Although groundwater quality monitoring near injection well operations is not required, some useful
data is recorded. • Under PRC 10 § 3227 operators of oil and gas wells in the state are required to file quarterly reports
on all water produced, injected, and used within oil fields. Reports are to be filed with the DOGGR by the last day of each month, following the quarterly reporting period.101
CALIFORNIAYear obtained Class II primacy 1983
Regulatory agency (Class II)Department of Conservation: Division of Oil, Gas, and Geothermal Resources (DOGGR)
Number of EOR wells 54,102Number of UIC Class II staff ~52Number of field inspectors info unavailable
Main regulatory issues/highlights
– Aquifer exemptions – Chemical disclosure – P&A of old wells– Currently revising UIC Class II regulations

39
The Environmental Risks and Oversight of Enhanced Oil Recovery in the United States
▶ Under California’s Code of Regulations Chapter 4 § 1724.7. Project Data Requirements,102 the proposed amendment states, “If groundwater monitoring is a component of the underground injection project, then documentation shall be provided of the results of the consultation with the State Water Resources Control Board or Regional Water Quality Control Board.”
UIC oversight activities: ▶ In 2011, EPA commissioned a third-party audit of the state’s UIC Class II program.103 The audit made
recommendations to improve California’s Class II program, including recommendations regarding the program’s definition of underground sources of drinking water, area of review calculations, well construction practices, inspection and enforcement practices, and staff qualifications.104
▶ In November 2012, DOGGR developed an action plan to address each of the recommendations from EPA’s audit. To address a number of recommendations necessitating regulatory updates, DOGGR committed to update its Class II program regulations beginning in 2013.105
▶ In response to an EPA inquiry initiated in 2012, California reviewed program records to ensure that injection wells the state authorized aligned with EPA-approved aquifer exemptions.* While reviewing, DOGGR discovered that it authorized operators to inject into non-exempt aquifers, and EPA determined that the program was not in compliance with state and EPA requirements.106
▶ In July 2014, EPA Region 9 determined that the UIC Class II program managed by DOGGR did not comply with state and EPA requirements. In a series of letters from July 2014 through July 2015, EPA Region 9 and DOGGR reached agreement on a plan to improve California’s UIC Class II program.107
*If certain conditions are met, aquifers can be exempted from protection under the Safe Drinking Water Act. Well operators may request an exemption for specific aquifer, and if EPA approves, operators may inject fluids into the aquifer.
Box 7. Regulatory differences between Class II and Class VI Wells
Class II – Oil and Gas Related Injection WellsDisposal wells are issued permits. The owners or operators of the wells must meet all applicable requirements, including:• strict construction,• conversion standards, and• regular testing and inspection.Under Section 1425 states must demonstrate that their existing standards are effective in preventing endangerment of USDWs. These programs must include requirements for:• Permitting• Inspections• Monitoring• Record-keeping • Reporting
Class VI – Wells used for Geologic Sequestration of CO2EPA developed specific criteria for Class VI wells:• Extensive site characterization requirements,• Injection well construction requirements Injection well
operation requirements,• Comprehensive monitoring requirements that
address all aspects of well integrity, CO2 injection and storage, and ground water quality during the injection operation and the post-injection site care period,
• Financial responsibility requirements assuring the availability of funds for the life of the project, and
• Reporting and recordkeeping requirements.The Class VI rule builds on existing UIC program requirements, with extensive tailored requirements that address CO2 injection for long-term storage to ensure that wells used for geologic sequestration are appropriately:• Sited • Constructed • Tested• Monitored • Funded and closed
Source: EPA. Environmental Protection Agency, 06 Oct. 2016. Web. 12 Apr. 2017. <https://www.epa.gov/uic/class-vi-wells-used-geologic-sequestration-co2>.

40
The Environmental Risks and Oversight of Enhanced Oil Recovery in the United States
▶ Since July 2014, DOGGR, California’s State Water Resources Control Board, and EPA have been working together to systematically address a number of important deficiencies in the UIC program, including permitting injection into nonexempt aquifers.* In letters between California (DOGGR and the Water Resources Control Board) and EPA, the three-agency group agreed to a plan for DOGGR to shut down wells permitted to inject into nonexempt aquifers and improve and modernize its UIC practices.108
▶ In 2016, DOGGR began a process to revise its Class II regulations. As of the publishing of this report, two pre-rulemaking discussion drafts had been published.
▶ Annual Review: DOGGR plans to conduct individual project reviews designed to find missing data, identify UIC compliance issues, and compare existing project approvals with current conditions in the field.† Under this the operators are required to provide missing data, and the state will reevaluate the project based on all relevant regulations, mandates, and policies, including demonstration of zonal isolation of injected fluids. Projects will be reapproved, modified, or canceled as appropriate. The Division plans to conduct separate reviews in each Division district and plans to complete the review by October 2018.109
Staffing/training/expertise in the UIC programs ▶ In October 2015, DOGGR issued the first report from its Monitoring and Compliance Unit, which
was created in 2011.‡ The report identified a number of program deficiencies, including insufficient staffing to address increasing regulatory workload and significant remedial programmatic work; poor recordkeeping on mostly paper forms and a lack of modern data tools and systems; outdated regulations that in some cases do not address the modern oil and gas extraction environment; inconsistent and understaffed program leadership; insufficient breadth and depth of technical talent; insufficient coordination among district and state offices; and lack of consistent, regular, high-quality technical training.
Other issues that impact EOR oversight
▶ DOGGR is updating its data management systems for production and injection wells to improve regulatory compliance and effectiveness, transparency, and support of all stakeholders. Finishing every component of the UIC improvement plan submitted to EPA could take 3 to 4 years.110
Orphaned/abandoned/idle wells ▶ Under PRC 10 § 1714, written approval of the supervisor is required to plug and abandon a well.
Pursuant to § 1722.8. (c). (3) the supervisor needs to annually review the amount of a life-of-well bond and, if needed, establish a new bond amount to ensure proper plugging and abandonment of the well, and the financing of spill response and incident cleanup.
▶ According to PRC 10 § 3206.1. (a) By June 1, 2018, the Division should review, evaluate, and update its regulations pertaining to idle wells.
* The Board consults with the Division on injection well permits.† A project under the DOGGR’s class II program consists of many wells, sometimes as many as 200 wells, in an injection production system. A project includes both injection and production wells. The project proposal includes evaluation of the geology of the area to be subject to injection and production operations. It also must include review of the construction of neighboring wells and the ability of the geologic structures to contain injection fluid within the intended injection zone.‡In 2011, the Division created the Monitoring and Compliance Unit to evaluate program compliance with state and EPA requirements. The Monitoring and Compliance Unit was tasked with evaluating and reporting on the strengths and challenges of the state’s program in meeting the statutory and regulatory standards on which the program is based, including state statutes and regulations and California’s memorandum of agreement with EPA detailing how the state would manage its program to comply with the Safe Drinking Water Act.

41
The Environmental Risks and Oversight of Enhanced Oil Recovery in the United States
7.5 North DakotaUIC/EOR laws and regulations:
▶ The North Dakota State Regulations handbook, 43-02-03-01. defines Enhanced Recovery, in its State Regulation- General rules and regulations sections, as increased recovery from a pool achieved by artificial means or by the application of energy extrinsic to the pool.111
Primacy ▶ In North Dakota, the Department of Mineral Resources (DMR) has primacy over Class II and Class III
wells.112 The state received primacy in 1983. The UIC Office conducts the day-to-day tasks to implement the UIC program, as well as coordinating with EPA Region 8’s office. UIC-related tasks include: • writing Commission orders, authorizing injection wells • review of permit applications and permitting of injection wells • processing of completion reports, injection reports, mechanical integrity test reports, workover
reports, coordinating with field staff to witness mechanical integrity tests, collaborating with field staff, and sending out letters concerning wells that have had a UIC rule violation.113
▶ Based on its experience with CO2 injection, North Dakota has also applied for primacy for Class-VI wells. North Dakota has a trust fund for management of long-term liability for CO2 storage and disposal; which experts believe unique to North Dakota.114 Currently, North Dakota is the only state which has applied for primacy of Class VI wells.
▶ According to GAO Report (February 2016)115 there are 1349 Class II wells in North Dakota. ▶ Section NDCC 43-02-03-27 requires the state regulations, requires chemical disclosure treating,116
however, it is left up to the discretion of the commission’s director to ask for testing. ▶ The minimum radius for Area of Review (AOR) for North Dakota as specified by the state regulations is
¼ of a mile. ▶ According to GAO Report (Feb 2016),117 100% of Mechanical Integrity Tests (MIT) were witnessed by a
UIC staff member.
Public participation in permitting ▶ Under NDCC 43-02-05-04, a permit is granted only after it has been notified and public hearing is
conducted.
Groundwater monitoring ▶ Under NDCC 43-02-05-03, underground injection that causes or allows movement of fluid into an
underground source of drinking water is prohibited, unless the underground source of drinking water is an exempted aquifer.
▶ Under NDCC 42-02-05-12, there is no specific requirement for operators to routinely monitor groundwater quality. However, on a monthly basis, operators are required to report “the volume and nature, i.e., produced water, makeup water, etc., of the fluid injected, the injection pressure, and such other information as the commission may require. • In North Dakota, the Department of Health monitors the groundwater.118 However, this does not
occur as a result of UIC regulations.
NORTH DAKOTAYear obtained Class II primacy 1983
Regulatory agency (Class II) Department of Mineral Resources (DMR)
Number of EOR wells 762Number of UIC Class II staff 75Number of field inspectors info unavailable
Main regulatory issues/highlights – Financial assurance – Class VI primacy
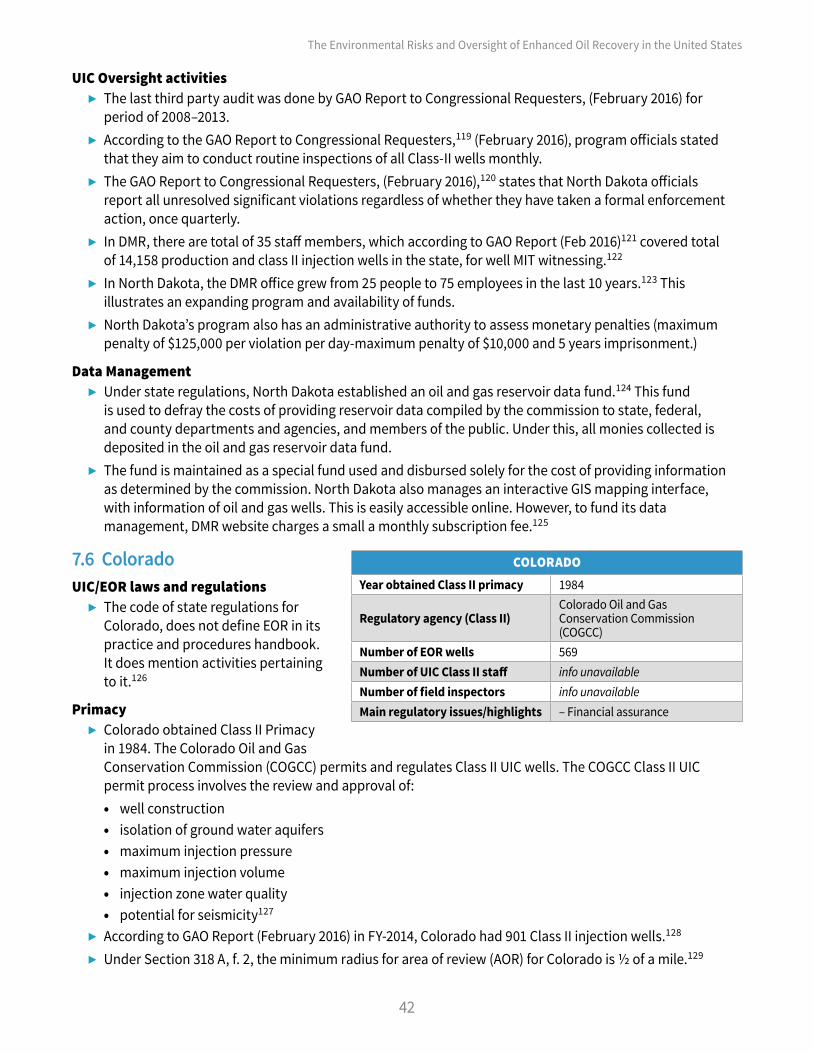
42
The Environmental Risks and Oversight of Enhanced Oil Recovery in the United States
UIC Oversight activities ▶ The last third party audit was done by GAO Report to Congressional Requesters, (February 2016) for
period of 2008–2013. ▶ According to the GAO Report to Congressional Requesters,119 (February 2016), program officials stated
that they aim to conduct routine inspections of all Class-II wells monthly. ▶ The GAO Report to Congressional Requesters, (February 2016),120 states that North Dakota officials
report all unresolved significant violations regardless of whether they have taken a formal enforcement action, once quarterly.
▶ In DMR, there are total of 35 staff members, which according to GAO Report (Feb 2016)121 covered total of 14,158 production and class II injection wells in the state, for well MIT witnessing.122
▶ In North Dakota, the DMR office grew from 25 people to 75 employees in the last 10 years.123 This illustrates an expanding program and availability of funds.
▶ North Dakota’s program also has an administrative authority to assess monetary penalties (maximum penalty of $125,000 per violation per day-maximum penalty of $10,000 and 5 years imprisonment.)
Data Management ▶ Under state regulations, North Dakota established an oil and gas reservoir data fund.124 This fund
is used to defray the costs of providing reservoir data compiled by the commission to state, federal, and county departments and agencies, and members of the public. Under this, all monies collected is deposited in the oil and gas reservoir data fund.
▶ The fund is maintained as a special fund used and disbursed solely for the cost of providing information as determined by the commission. North Dakota also manages an interactive GIS mapping interface, with information of oil and gas wells. This is easily accessible online. However, to fund its data management, DMR website charges a small a monthly subscription fee.125
7.6 Colorado UIC/EOR laws and regulations
▶ The code of state regulations for Colorado, does not define EOR in its practice and procedures handbook. It does mention activities pertaining to it.126
Primacy ▶ Colorado obtained Class II Primacy
in 1984. The Colorado Oil and Gas Conservation Commission (COGCC) permits and regulates Class II UIC wells. The COGCC Class II UIC permit process involves the review and approval of: • well construction • isolation of ground water aquifers • maximum injection pressure • maximum injection volume • injection zone water quality • potential for seismicity127
▶ According to GAO Report (February 2016) in FY-2014, Colorado had 901 Class II injection wells.128 ▶ Under Section 318 A, f. 2, the minimum radius for area of review (AOR) for Colorado is ½ of a mile.129
COLORADOYear obtained Class II primacy 1984
Regulatory agency (Class II)Colorado Oil and Gas Conservation Commission (COGCC)
Number of EOR wells 569Number of UIC Class II staff info unavailableNumber of field inspectors info unavailableMain regulatory issues/highlights – Financial assurance
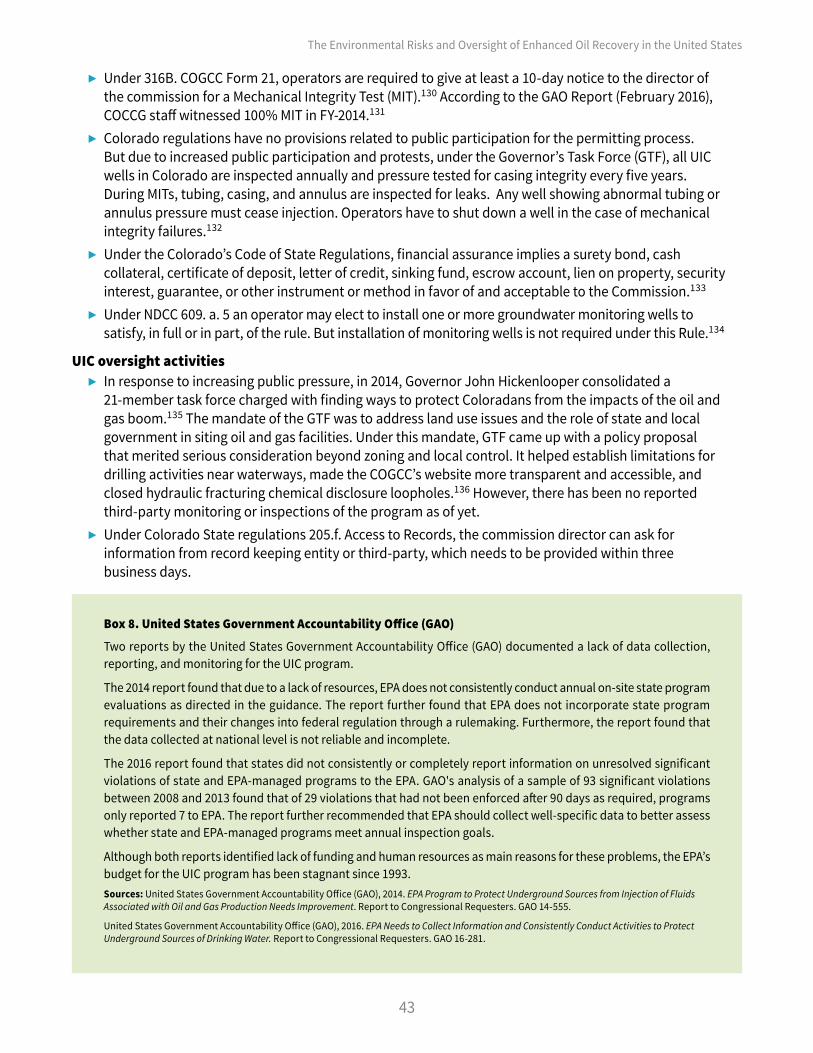
43
The Environmental Risks and Oversight of Enhanced Oil Recovery in the United States
▶ Under 316B. COGCC Form 21, operators are required to give at least a 10-day notice to the director of the commission for a Mechanical Integrity Test (MIT).130 According to the GAO Report (February 2016), COCCG staff witnessed 100% MIT in FY-2014.131
▶ Colorado regulations have no provisions related to public participation for the permitting process. But due to increased public participation and protests, under the Governor’s Task Force (GTF), all UIC wells in Colorado are inspected annually and pressure tested for casing integrity every five years. During MITs, tubing, casing, and annulus are inspected for leaks. Any well showing abnormal tubing or annulus pressure must cease injection. Operators have to shut down a well in the case of mechanical integrity failures.132
▶ Under the Colorado’s Code of State Regulations, financial assurance implies a surety bond, cash collateral, certificate of deposit, letter of credit, sinking fund, escrow account, lien on property, security interest, guarantee, or other instrument or method in favor of and acceptable to the Commission.133
▶ Under NDCC 609. a. 5 an operator may elect to install one or more groundwater monitoring wells to satisfy, in full or in part, of the rule. But installation of monitoring wells is not required under this Rule.134
UIC oversight activities ▶ In response to increasing public pressure, in 2014, Governor John Hickenlooper consolidated a
21-member task force charged with finding ways to protect Coloradans from the impacts of the oil and gas boom.135 The mandate of the GTF was to address land use issues and the role of state and local government in siting oil and gas facilities. Under this mandate, GTF came up with a policy proposal that merited serious consideration beyond zoning and local control. It helped establish limitations for drilling activities near waterways, made the COGCC’s website more transparent and accessible, and closed hydraulic fracturing chemical disclosure loopholes.136 However, there has been no reported third-party monitoring or inspections of the program as of yet.
▶ Under Colorado State regulations 205.f. Access to Records, the commission director can ask for information from record keeping entity or third-party, which needs to be provided within three business days.
Box 8. United States Government Accountability Office (GAO)Two reports by the United States Government Accountability Office (GAO) documented a lack of data collection, reporting, and monitoring for the UIC program.
The 2014 report found that due to a lack of resources, EPA does not consistently conduct annual on-site state program evaluations as directed in the guidance. The report further found that EPA does not incorporate state program requirements and their changes into federal regulation through a rulemaking. Furthermore, the report found that the data collected at national level is not reliable and incomplete.
The 2016 report found that states did not consistently or completely report information on unresolved significant violations of state and EPA-managed programs to the EPA. GAO's analysis of a sample of 93 significant violations between 2008 and 2013 found that of 29 violations that had not been enforced after 90 days as required, programs only reported 7 to EPA. The report further recommended that EPA should collect well-specific data to better assess whether state and EPA-managed programs meet annual inspection goals.
Although both reports identified lack of funding and human resources as main reasons for these problems, the EPA’s budget for the UIC program has been stagnant since 1993.Sources: United States Government Accountability Office (GAO), 2014. EPA Program to Protect Underground Sources from Injection of Fluids Associated with Oil and Gas Production Needs Improvement. Report to Congressional Requesters. GAO 14-555.
United States Government Accountability Office (GAO), 2016. EPA Needs to Collect Information and Consistently Conduct Activities to Protect Underground Sources of Drinking Water. Report to Congressional Requesters. GAO 16-281.

44
The Environmental Risks and Oversight of Enhanced Oil Recovery in the United States
▶ Colorado State regulations have no provision for annual review of its UIC program. However, under section 906, 9. F, to ensure compliance with permit conditions, the facility permit is subject to an annual review. To facilitate this review, the operator has to submit an annual report summarizing operations, including the types and volumes of waste handled at the facility.137
Other issues that impact EOR oversight ▶ Public participation spurred Colorado’s government and COGCC to begin more extensively publishing
data on their injection activities. Subsequently, a multi-stakeholder engagement forum was formed, which also published permit violations by industry, complaints, etc., on COGCC’s website. Colorado’s online platform is spearheading in an exemplary way; as the data is also available online in an interactive format, and GIS mapping format.
▶ Under Section 304 of Colorado State Regulations, the financial assurance requirements prior to drilling or assuming the operations for a well an operator shall provide financial assurance in accordance with the 700 Series rules. When an operator's existing wells are not in compliance with the 700 Series, the Director may withhold action on an Application for Permit-to-Drill, Form 2, or Oil and Gas Location Assessment, Form 2A, until a hearing on the permit application is held by the Commission.
▶ According to GAO Report (February 2016),138 the state of Colorado can give an administrative penalty of maximum penalty of $15,000 per violation per day. With a maximum penalty of $5,000, 6 months’ imprisonment, or both.139
7.7 OhioDefinition of EOR activities
▶ Ohio defines EOR in Revised Code 1509.21: “secondary or additional recovery operations, including any underground injection of fluids or carbon dioxide for the secondary or tertiary recovery of oil or natural gas.”
Primacy ▶ In Ohio, the Department of Natural Resources Division of Oil and Gas Resource Management (DOGRM)
has regulatory authority over Class II and Class III wells. ▶ Shortly after horizontal drilling began in Ohio, state laws and UIC regulations were updated through
Senate Bill 165 in 2010. The legislation modernized well construction language, increased regulatory fees, expanded reporting requirements, and dedicated funding to the orphan well program.140 The increase in UIC revenue allowed DOGMR to increase its staff. Currently, four staff members in the office and four senior inspectors in the field dedicate all of their time to Class II regulation.
▶ All current Class II permits for enhanced oil recovery were issued after the Ohio Division of Oil and Gas obtained primacy in 1983. Ohio did not grandfather EOR wells in the 1983 rules. If the existing EOR wells didn’t meet the new constructions standards, they were shut down and plugged.141 Most Class II EOR wells have been operational for more than 10 years, only one or two new permits are issued each year. DOGRM does not issue area permits, every well needs an individual permit. A review by a team of experts from GWPC concluded that “the permitting process implemented by DOGRM provides appropriate protection for USDWs”.142
▶ About 90% of problems with Class II wells in Ohio are associated with surface operations, therefore the agency is currently updating rules and standards to ensure that facilities are held to more modern standards.143
OHIOYear obtained Class II primacy 1983
Regulatory agency (Class II)Department of Natural Resources, Division of Oil and Gas Resource Management (DOGRM)
Number of EOR wells 128Number of UIC Class II staff 4 full-timeNumber of field inspectors 4
Main regulatory issues/highlights – Regulatory update in 2012 – Development of RDBMS
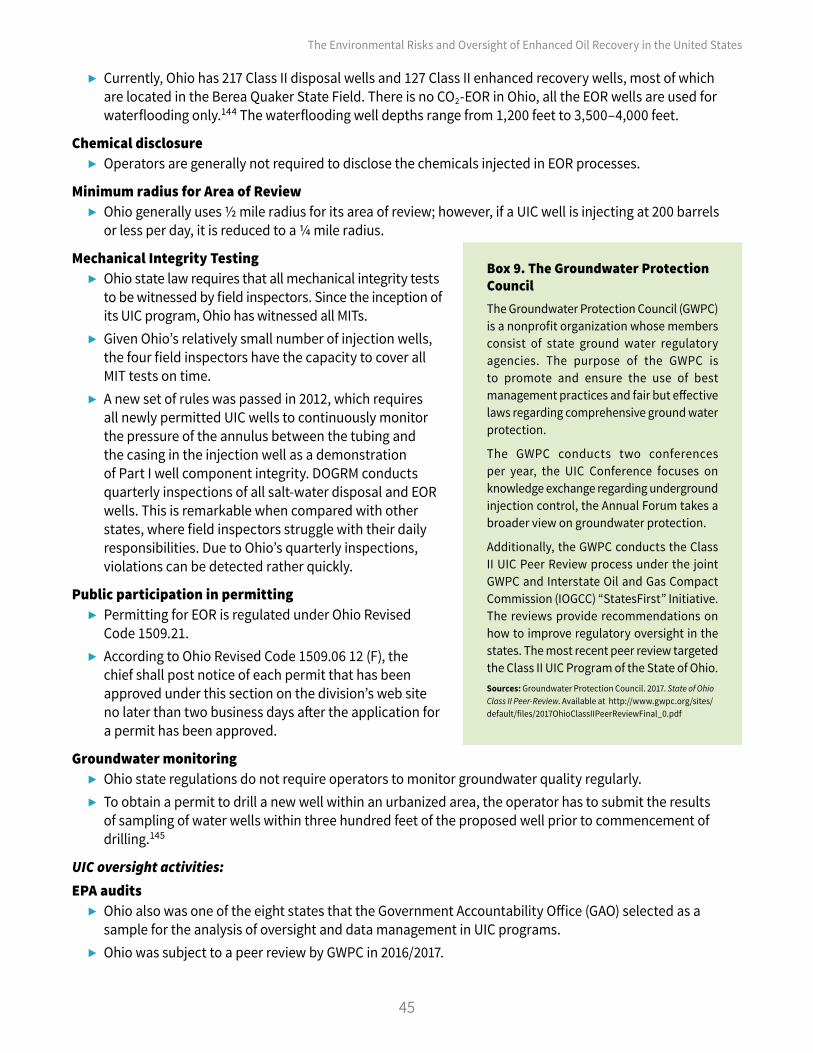
45
The Environmental Risks and Oversight of Enhanced Oil Recovery in the United States
▶ Currently, Ohio has 217 Class II disposal wells and 127 Class II enhanced recovery wells, most of which are located in the Berea Quaker State Field. There is no CO2-EOR in Ohio, all the EOR wells are used for waterflooding only.144 The waterflooding well depths range from 1,200 feet to 3,500–4,000 feet.
Chemical disclosure ▶ Operators are generally not required to disclose the chemicals injected in EOR processes.
Minimum radius for Area of Review ▶ Ohio generally uses ½ mile radius for its area of review; however, if a UIC well is injecting at 200 barrels
or less per day, it is reduced to a ¼ mile radius.
Mechanical Integrity Testing ▶ Ohio state law requires that all mechanical integrity tests
to be witnessed by field inspectors. Since the inception of its UIC program, Ohio has witnessed all MITs.
▶ Given Ohio’s relatively small number of injection wells, the four field inspectors have the capacity to cover all MIT tests on time.
▶ A new set of rules was passed in 2012, which requires all newly permitted UIC wells to continuously monitor the pressure of the annulus between the tubing and the casing in the injection well as a demonstration of Part I well component integrity. DOGRM conducts quarterly inspections of all salt-water disposal and EOR wells. This is remarkable when compared with other states, where field inspectors struggle with their daily responsibilities. Due to Ohio’s quarterly inspections, violations can be detected rather quickly.
Public participation in permitting ▶ Permitting for EOR is regulated under Ohio Revised
Code 1509.21. ▶ According to Ohio Revised Code 1509.06 12 (F), the
chief shall post notice of each permit that has been approved under this section on the division’s web site no later than two business days after the application for a permit has been approved.
Groundwater monitoring ▶ Ohio state regulations do not require operators to monitor groundwater quality regularly. ▶ To obtain a permit to drill a new well within an urbanized area, the operator has to submit the results
of sampling of water wells within three hundred feet of the proposed well prior to commencement of drilling.145
UIC oversight activities:
EPA audits ▶ Ohio also was one of the eight states that the Government Accountability Office (GAO) selected as a
sample for the analysis of oversight and data management in UIC programs. ▶ Ohio was subject to a peer review by GWPC in 2016/2017.
Box 9. The Groundwater Protection CouncilThe Groundwater Protection Council (GWPC) is a nonprofit organization whose members consist of state ground water regulatory agencies. The purpose of the GWPC is to promote and ensure the use of best management practices and fair but effective laws regarding comprehensive ground water protection.
The GWPC conducts two conferences per year, the UIC Conference focuses on knowledge exchange regarding underground injection control, the Annual Forum takes a broader view on groundwater protection.
Additionally, the GWPC conducts the Class II UIC Peer Review process under the joint GWPC and Interstate Oil and Gas Compact Commission (IOGCC) “StatesFirst” Initiative. The reviews provide recommendations on how to improve regulatory oversight in the states. The most recent peer review targeted the Class II UIC Program of the State of Ohio.Sources: Groundwater Protection Council. 2017. State of Ohio Class II Peer-Review. Available at http://www.gwpc.org/sites/default/files/2017OhioClassIIPeerReviewFinal_0.pdf

46
The Environmental Risks and Oversight of Enhanced Oil Recovery in the United States
Project/annual reviews. Does the state do annual UIC project reviews? ▶ No information could be obtained on annual UIC project reviews in Ohio.
Staffing/training/expertise in the UIC programs ▶ DOGRM’s UIC program is carried out by four staff members supported by four field inspectors who are
assigned to the different regions within Ohio.
Budget constraints ▶ For the past 10 years, Ohio has received about $150,000 per year from the federal government. In 2015,
the State of Ohio contributed $953,000 in state funds, so the overall funding for the UIC program was approximately $1,100,000. The majority of the Class II program funding comes from a brine disposal fee (5 cents/barrel, 20 cents/barrel for fluids that originate outside the state), which generated about $3.2 million in 2015.146 Ohio has a high number of Class II wells for the disposal of produced water from oil and gas production. The majority of them are located close to the border to Pennsylvania, whose Class II program is directly implemented by EPA. As it is easier for oil companies to obtain Class II well permits in Ohio from the Ohio Department of Natural Resources than to apply for a permit in Pennsylvania via EPA, many oil companies dispose their brine water in Ohio. This is a relatively recent development: Ohio’s brine volumes increased from 8.1 million barrels in 2010 to 12.6 million barrels in 2012 and 14 million barrels in 2013; with around 60% originating from neighboring states.147 Additionally, the DOGRM obtains fees through a severance tax on produced oil and gas, and permit fees ($1,000 per saltwater disposal well).
Other issues that impact EOR oversight:
Data management ▶ Ohio uses the RBDMS data management system, and was involved in developing it over the last 20
years. Through RBDMS, UIC data is fully integrated with oil and gas data. Data stored includes owner registration, applications, financial assurance, insurance, permitting, inspections, well construction, testing, logs, enforcement and compliance.148
Public accessibility of data ▶ Ohio has intense public interest in production permitting and UIC programs. DOGRM receives public
complaints frequently and has developed routine procedures to handle them. Most of the website content is in response to public records requests and individual callers. Therefore, the website is updated regularly. Ohio’s public website features an interactive map, the Oil and Gas Well Locator,* which shows all oil and gas wells in Ohio.
Financial insurance and small operators ▶ Ohio law provides for a variety of financial assurance requirements. For example, in addition to bonds,
all operators are required to have liability insurance for property damage of $1–5 million depending on the well location and well design. The GWPC review team suggested that DOGRM consider substantially increasing required blanket bond amounts in order to assure that bond amounts are sufficient to meet state program needs.149
*The interactive map of Ohio’s oil and gas resources is available at http://oilandgas.ohiodnr.gov/well-information/oil-gas-well-locator

47
The Environmental Risks and Oversight of Enhanced Oil Recovery in the United States
8. Summary of Regulatory Issues and Policy Recommendations8.1 Issues with EPA’s Minimum Standards for UIC RegulationEPA’s class II program does not require routine monitoring of groundwater for contamination nor do most of the states reviewed. Although there are few known instances of contamination from the injec-tion of fluids into class II wells, EPA has noted that the absence of known contamination is not necessarily proof that contamination has not occurred.150 There-fore, given the lack of data on groundwater contami-nation and the difficulty of monitoring movement of injected fluids underground, we cannot conclude that no cases of underground contamination related to enhanced oil recovery occur.
EPA’s minimum standards do not require the dis-closure of chemicals injected through EOR. While in some states such as New Mexico, operators do provide information on the added chemicals during the permit-ting process, EPA does not require states to do so.
EPA’s Class II regulations do not regulate the quality of the water injected through EOR. EPA’s minimum standards assume that the regulations ensure proper confinement of the injection and thus make any water quality testing of the injected water unnecessary. Therefore, data on the quality of pro-duced and re-injected water is hard to find and often does not exist. While operators routinely monitor the quantities of injected water, the quality is not of concern. Yet, in cases that regulations are not followed according to standards, leakage of low quality water will create problems. As mentioned in Part 2.3, page 13, produced water can contain both naturally occur-ring contaminants and chemical additives that could potentially impact drinking water quality.
8.2 Issues with EPA’s Oversight of States’ UIC Programs Many interviewees from state regulatory agencies prefer state primacy over direct regulation by EPA. In many cases, state regulatory agencies have histori-cally regulated injection before the existence of EPA. Therefore, state regulatory personnel and agencies had already gained experience in effective regulation before EPA adopted the minimum criteria. Further-
more, being located in close proximity to where injec-tion takes place makes it easier for state level regula-tors to monitor injection activity.
EPA has the legal authority to withdraw primacy over a program in the case of serious non-compli-ance, but it clearly prefers to give primacy to the states. Given that EPA’s UIC Program faces budgetary and staffing constraints, it prefers states to shoulder the bulk of the financial responsibility for Class II over-sight. As mentioned, the budget support from EPA’s UIC grant makes up a small percentage for most state regu-latory budgets. As the above comparison has shown, many states often go beyond the minimum regulations in order to ensure the level of environmental safety they regard as appropriate. Yet, this situation leaves EPA with limited leverage over state regulatory agen-cies. The grant fund withdrawal is no real threat, and it has never been withheld from a state before.*
Audits are a means of EPA’s federal oversight. Every year, states provide EPA with reports on the status of the program. EPA provides comments and recom-mendations, taking into account experiences from other states. In addition to these annual exchanges, according to EPA interviewees, more comprehensive audits of state programs should be conducted at least every 5 years in each state, yet EPA does not have a fixed schedule for these audits. For instance, the most recent audits in Texas (1995–2002) and California (2012–present) revealed many areas where these states did not conform to EPA standards. Interestingly, public pressure has a significant influence on where and when audits are conducted.
In its attempt to improve regulatory oversight of UIC programs, EPA more frequently issues guid-ance documents instead of updating regulations. In contrast to EPA regulations, guidance documents are non-binding in nature, and contain best practices and recommendations for consideration by the industry and state regulatory agencies. EPA hopes that states will eventually incorporate the guidance into their own state-level regulations. However, this process can take years and rarely happens in practice. As a result, there
*EPA withdrew primacy from the state of Illinois once, and a second time Illinois voluntarily handed authority back to EPA, yet re-took it some years later.

48
The Environmental Risks and Oversight of Enhanced Oil Recovery in the United States
have been no major changes to federal UIC regulations since API sued EPA to make their aquifer exemption cri-teria less stringent. Even finalizing guidance documents is a difficult task for EPA staff, as different stakehold-ers pursue their interests and attempt to influence the outcome. For example, it took EPA four years to publish the latest guidance on induced seismicity.151 EPA is cur-rently reviewing all 84 guidance documents pertaining to UIC that need to be updated, but this process will likely take several years to complete.
EPA does not collect comprehensive and compa-rable data on EOR on a national level. While states have programs that help them organize well data, EPA lacks a national system that connects to all of them. The GAO report in 2014 noted that although EPA collects large amounts of data on Class II wells, the data “are not sufficiently complete or comparable for reporting to Congress, the public, or other groups interested in the nationwide program.”152 For example, reviews of the 7520 forms, which field inspectors use to document MIT results, highlight that EPA has very limited MIT performance data. EPA still has not fully implemented the national UIC database, though efforts to launch it date back to 2007. The same GAO report argued that until EPA requires and collects well-specific data on inspections from both state and EPA-managed programs, it is impossible to assess whether the pro-grams are meeting their annual inspection goals to protect USDWs. Another example is data on plugging & abandonment. In a memorandum on “Guidance for Financial Assurance for Federally-Administered UIC Programs,” issued in 1985, EPA stated that EPA Regional Offices should collect information on plugging compliance. Yet, until April 2017, P&A well data had not been aggregated at the national level.153
EPA is underfunded and understaffed and unable to sufficiently implement the oversight of UIC. All EPA interviewees from regional offices and headquarters office emphasized staff and budget constraints. In Region 8, three individuals are covering six states and 27 tribal nations. In terms of budget constraints, travel costs are prohibitive to on-site review visits by EPA Regional staff to state regulatory agencies.154 This can have serious consequences, as demonstrated by the case of exempted aquifers in California (see page 36). The report noted that “if EPA had conducted oversight activities, such as annual
on-site program evaluations, EPA Region 9 may have discovered that California’s Class II program did not comply with state and EPA requirements before 2014.”155 The lack of human resources also delays rule-making. For example, Michigan waited for a year and a half until EPA finally commented on the primacy application for the state’s UIC Class II program in 2017. Similarly, North Dakota applied for Class VI primacy in 2014 and only received it from EPA in spring 2017.
8.3 Issues in States with Primacy Over UICData collection and data management is not suf-ficient or uniform and inhibits proper oversight. States use different methods for data collection and data management. Many state regulatory agencies struggle with the transition from paper-based man-agement to electronic data management.156 With the transition to an electronic system a necessity, there is a window of opportunity to introduce a shared data man-agement system. States are often reluctant to make the transition from already established data management systems to different and more complicated systems. Yet, the long-term benefits of having a uniform system across the country outweigh the short-term costs of this transition (e.g. training staff in how to use the new platform). Solutions such as the GWPC’s Risk-Based Data Management System (RBDMS) exist, but are not uniformly utilized by state regulatory agencies.
Very little information about EOR techniques such as waterflooding and Class II injection prepared for a public audience. Since secondary recovery (waterflooding) is over a century old, this problem is largely a matter of history. In many states, data was not collected and published for decades. Some states started doing it on paper, but only in the last decade has there been any concerted effort to make data pub-licly available.
State regulatory websites vary immensely in content and quality. Some states such as Colorado, Ohio, North Dakota, and California, regularly update their websites and encourage public engagement on online forums (e.g. Information Dashboards, Online Complaint Mechanisms). Other state websites pres-ently contain limited information and need to be updated. We found that states with more active and
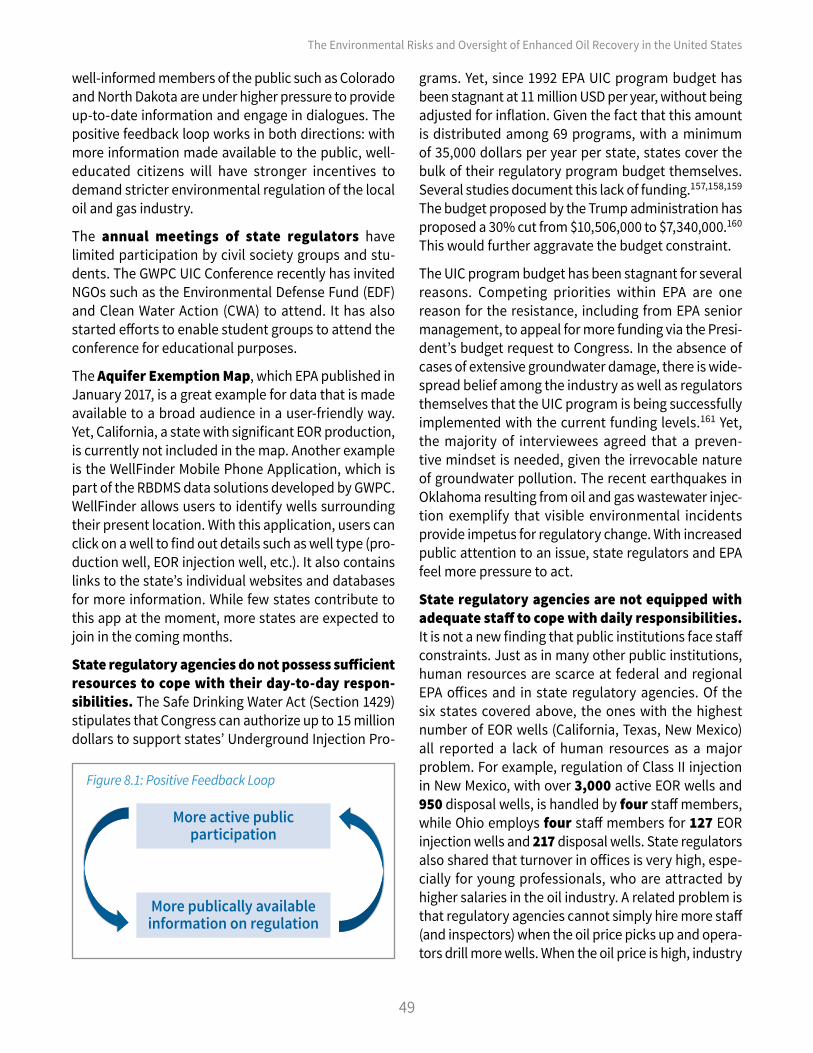
49
The Environmental Risks and Oversight of Enhanced Oil Recovery in the United States
well-informed members of the public such as Colorado and North Dakota are under higher pressure to provide up-to-date information and engage in dialogues. The positive feedback loop works in both directions: with more information made available to the public, well-educated citizens will have stronger incentives to demand stricter environmental regulation of the local oil and gas industry.
The annual meetings of state regulators have limited participation by civil society groups and stu-dents. The GWPC UIC Conference recently has invited NGOs such as the Environmental Defense Fund (EDF) and Clean Water Action (CWA) to attend. It has also started efforts to enable student groups to attend the conference for educational purposes.
The Aquifer Exemption Map, which EPA published in January 2017, is a great example for data that is made available to a broad audience in a user-friendly way. Yet, California, a state with significant EOR production, is currently not included in the map. Another example is the WellFinder Mobile Phone Application, which is part of the RBDMS data solutions developed by GWPC. WellFinder allows users to identify wells surrounding their present location. With this application, users can click on a well to find out details such as well type (pro-duction well, EOR injection well, etc.). It also contains links to the state’s individual websites and databases for more information. While few states contribute to this app at the moment, more states are expected to join in the coming months.
State regulatory agencies do not possess sufficient resources to cope with their day-to-day respon-sibilities. The Safe Drinking Water Act (Section 1429) stipulates that Congress can authorize up to 15 million dollars to support states’ Underground Injection Pro-
grams. Yet, since 1992 EPA UIC program budget has been stagnant at 11 million USD per year, without being adjusted for inflation. Given the fact that this amount is distributed among 69 programs, with a minimum of 35,000 dollars per year per state, states cover the bulk of their regulatory program budget themselves. Several studies document this lack of funding.157,158,159 The budget proposed by the Trump administration has proposed a 30% cut from $10,506,000 to $7,340,000.160 This would further aggravate the budget constraint.
The UIC program budget has been stagnant for several reasons. Competing priorities within EPA are one reason for the resistance, including from EPA senior management, to appeal for more funding via the Presi-dent’s budget request to Congress. In the absence of cases of extensive groundwater damage, there is wide-spread belief among the industry as well as regulators themselves that the UIC program is being successfully implemented with the current funding levels.161 Yet, the majority of interviewees agreed that a preven-tive mindset is needed, given the irrevocable nature of groundwater pollution. The recent earthquakes in Oklahoma resulting from oil and gas wastewater injec-tion exemplify that visible environmental incidents provide impetus for regulatory change. With increased public attention to an issue, state regulators and EPA feel more pressure to act.
State regulatory agencies are not equipped with adequate staff to cope with daily responsibilities. It is not a new finding that public institutions face staff constraints. Just as in many other public institutions, human resources are scarce at federal and regional EPA offices and in state regulatory agencies. Of the six states covered above, the ones with the highest number of EOR wells (California, Texas, New Mexico) all reported a lack of human resources as a major problem. For example, regulation of Class II injection in New Mexico, with over 3,000 active EOR wells and 950 disposal wells, is handled by four staff members, while Ohio employs four staff members for 127 EOR injection wells and 217 disposal wells. State regulators also shared that turnover in offices is very high, espe-cially for young professionals, who are attracted by higher salaries in the oil industry. A related problem is that regulatory agencies cannot simply hire more staff (and inspectors) when the oil price picks up and opera-tors drill more wells. When the oil price is high, industry
Figure 8.1: Positive Feedback Loop
More active public participation
More publically available information on regulation

50
The Environmental Risks and Oversight of Enhanced Oil Recovery in the United States
hires more qualified people, making it harder for the state agencies to find personnel. In turn, it is more dif-ficult for public institutions than for private companies to downsize staff when the oil price goes down again. Therefore, the existing staff often must cope with the extra burden to get over the peak in well drilling activ-ity without hiring new people. Similarly, states with explosions in new oil recovery activity, end up per-mitting wells without proper field inspection. This is alarming since permits for Class II wells are issued for the lifetime of the well and are rarely revoked. Conse-quently, a lot of regulatory work remains incomplete. California’s recent audit has shown that regulatory work is far behind schedule even in states where there is significant public pressure to act quickly.
Institutional knowledge not retained from depart-ing/retiring staff members. This is a common issue across federal and state level regulation of oil and gas. Many regulatory agencies have several staff members who joined in the 1970s and 1980s and are now reach-ing retirement age. In state-level regulatory agencies, the positions of retiring or otherwise leaving staff often remain vacant, so the work ends up on the shoulders of already overloaded colleagues. Certainly, when an inspector in the field who was keeping track of over 2,000 wells leaves the agency, a substantial amount of knowledge leaves with them. Additionally, the industry offers higher salaries than a state regulatory agency, therefore young staff members, attracted by the oppor-tunities in the private sector, often leave the regulatory agency after a short period of time. Combined with inadequate data management, the increased turnover contributes to loss of institutional knowledge.
8.4 Related Issues Pertaining to Broader Regulation of Oil and Gas IndustryMany wells are temporarily abandoned, idle, or left unplugged, and states deal with those wells differently. As described above, in many states such as New Mexico and Texas, the majority of wells were drilled before EPA UIC program set minimum standards in 1981. As a result, some wells had already been aban-doned before the state regulations were revised to fit EPA’s minimum standards. A memorandum by EPA on plugging & abandonment” took a very pragmatic
approach to the problem of who should provide infor-mation on plugging compliance history: “Currently, if no records exist, then it is assumed that the operator has a good history.”162 Out of at least 3.5 million oil and gas wells drilled in the U.S., less than 825,000 are cur-rently in use. A 2016 analysis conducted by Resources for the Future (RFF) revealed that about 12 percent of the inactive wells in 13 states with significant oil and gas production have not been decommissioned, meaning that wells were not properly sealed (“abandoned”) and/or surface production facilities were not removed.163 The same report emphasized the existing data gaps regarding the number of inactive wells and their charac-teristics (e.g. quality of construction, legal well owner).
Since P&A costs cannot be recouped, operators seek to minimize these expenses.164 Therefore, it is an impor-tant duty of regulators to ensure that operators comply with P&A regulations. Some states such as Pennsylva-nia, Kansas, and Colorado have programs in place to locate and document orphaned wells. Furthermore, in states with a high density of wells such as Texas, idle or abandoned wells have to be plugged (or re-drilled and cemented to comply with present regulations) when they fall into the area of review of another newly constructed well. California regularly publicizes infor-mation on the recently plugged well on their website.
The financial assurances required for operators are often insufficient to cover the costs of decommis-sioning an inactive well. As stated in Box 10, financial assurance is not a part of EPA’s federal regulations, but only mentioned in guidance from 1984. As part of the permitting process, most states require operators to prove that they have sufficient financial bonds to cover P&A costs. The required amount of the financial bond varies substantially. This is not surprising, since plugging costs depend on well depth, well location and well type. Most states use a reclamation fund to pay for plugging of wells when the operator’s funds do not suffice. The issue of financial responsibility is especially pertinent when small operators go bankrupt. The financial bond is often seen as an asset that can be liquefied during the insolvency process. However, operators sometimes escape P&A costs by filing for bankruptcy. The easier it is for operators to apply for temporary abandonment, the more likely a well becomes idle.

51
The Environmental Risks and Oversight of Enhanced Oil Recovery in the United States
9. Policy RecommendationsBased on our analysis, we recommend that Congress, EPA, and States take actions to address the gaps in the regulation of EOR in the United States. The following is not a comprehensive list of possible improvements but rather a starting point to better ensure the protection of USDWs from contamination related to the underground injection associated with oil and gas production.
9.1 EPA should:Update minimum standards of Class II regulation • Establish a clear definition of enhanced oil recovery and its different technologies (e.g. thermal EOR, water-
flooding, miscible gas injection, etc.), as well as adopt specific requirements for each of the technologies. • Reevaluate the effectiveness of the ¼ mile minimum and consider a larger radius, which is used by some
states with significant EOR activity. • Include requirements for the disclosure of chemicals used in underground injection and routine
groundwater quality monitoring of aquifers. • Approve and incorporate state program requirements and changes into federal regulations through a
rulemaking.
Address data gaps and improve oversight of state UIC programs • Commit to following up on filling the data gaps mentioned in the 1981 study (see section 6.2), specifically
on the health risks from chemicals used in EOR, persistence of injected chemicals over time, transport mechanisms out of reservoirs, and movements of chemicals in fresh-water aquifers. Furthermore, EPA should officially incorporate secondary recovery as a part of EOR in this study.
• Expedite implementation of the national UIC database which will allow EPA to assess whether UIC programs are meeting their annual inspection goals to protect USDWs, and to report UIC results at a national level in a complete and comparable fashion.
• Improve collection of well-specific inspection data from state and EPA-managed programs. • Conduct annual on-site evaluations of state programs in a manner of in-depth inspections rather than
informal conversations over the phone, e.g. including a review of permitting and inspection files. • Conduct systematic in-depth reviews of state programs at least every five years.
Address budget and staff constraints • Increase staffing in Regional Offices as well as in headquarter office, to ensure that human resources do
not prevent proper oversight of states with primacy.
Box 10. Financial responsibility for plugging and abandonment (P&A)Financial assurance is one example where EPA decided to use guidance, rather than prescribe regulation.
When a well is no longer used for production or injection, operators can either apply for ‘temporary abandonment status’ or the well has to be decommissioned. Decommissioning includes plugging the well permanently and removing all production facilities on the surface.
For Class II, financial responsibilities are only addressed in a guidance document issued in 1984, which provides non-binding recommendations on financial instruments. This leaves states with the task to ensure that plugging and abandonment is paid for by the operator. As described above, states often take over the financial burden of plugging wells when the operator does not possess the financial resources.
52
The Environmental Risks and Oversight of Enhanced Oil Recovery in the United States
• Request that Congress significantly increase EPA’s budget support for state UIC Programs. • Accelerate the development of online training material to mitigate loss of institutional knowledge.
9.2 States should:Improve state regulations and oversight for Class II wells • Review existing regulations for compliance with EPA’s minimum standards and guidances. • Adopt regulation requiring operators to disclose the chemicals injected for purpose of EOR and to require
groundwater monitoring. • Conduct annual reviews of all injection projects in order to ensure compliance with regulations.
Improve data management • Devote more attention and resources to the transition from paper-based to electronic data management
systems, following the examples of Ohio and North Dakota. • Make greater use of shared data management systems such as RBDMS and Drilling Info. • Conduct groundwater mapping to better understand the water quality of USDWs and aquifers near oil
and gas fields. • Encourage participation of civil society groups and students in events such as the Groundwater
Protection Council’s UIC Conference in order to build greater public participation and understanding. • Include state specific information on aquifer exemptions and a link to EPA’s Aquifer Exemption Map on
states’ website to improve public availability of information. • Update their websites to make more data publicly available and encourage public participation. • Publicize annual aggregated production data separated by recovery method, including primary recovery,
waterflooding, CO2-EOR, thermal EOR, etc.
Increase financial and human resources of oversight agencies and prioritize knowledge transfer • Pass legislation to raise permit issuance fees and severances (following the example of Ohio). • Hire more personnel and ensure vacant positions are filled as soon as possible. • Initiate mentoring programs from senior/retiring staff members to new staff members. • Make exit interviews mandatory for better knowledge transfer to new employees.
Improve management of temporarily abandoned wells, unplugged, and orphaned wells • Review financial assurance regulations, making use of existing research (e.g. RFF, 2016) on how various
factors affect the costs of plugging. • Adopt more stringent regulations for temporarily abandoned wells, and for marking decommissioned wells. • Conduct systematic reviews of temporarily abandoned, idle, plugged, and unplugged wells. • Cooperate to address the issue of orphaned and idle wells, e.g. facilitated by GWPC. • Publicize acute and chronic leakage data for active and inactive wells, followed by actions taken to fix the
problem by the operator.

53
The Environmental Risks and Oversight of Enhanced Oil Recovery in the United States
10. ConclusionGiven that secondary and tertiary oil recovery account for at least 60% of U.S. crude oil production,165 the UIC Program plays a vital role in ensuring the protection of USDWs from contamination from EOR injection activity. Yet, EOR has enjoyed relative anonymity, and its federal regulatory framework has not been reviewed since its inception in the 1980s.
This report highlights numerous regulatory issues. These issues include problems with the transition from paper-based data to electronic data management systems, poor website management, limited informa-tion available to the public, no mechanisms to retain institutional knowledge, and outdated regulations. Many of these problems are rooted in budget con-straints and serious understaffing, which are especially problematic in states with significant EOR activity such as California, Texas, and New Mexico. As a result, many state regulatory agencies struggle to cope with their daily responsibilities.
There is plenty of room for improvement. Some states such as Ohio, North Dakota, and Colorado have in recent years updated their regulations and signifi-cantly increased the budget and staff dedicated to regulatory oversight. In Colorado and North Dakota, state regulators reported that they felt compelled to act because of active public participation.* Meanwhile, other states are struggling with an increased workload combined with static or even decreasing budget and staff levels.166 Since oil and gas revenues make up a significant portion of many state budgets, regulators face power imbalances and resistance from the oil and gas industry against more stringent regulation.
This report finds that in many states, EOR activ-ity (and UIC Class II injection in general) is currently under-regulated. There are many data gaps at the state and federal level, and EPA, facing budget and staff constraints, leaves regulatory oversight up to the states without conducting regular in-depth audits. This
*See section on Colorado, State Regulations for for Governor’s Task Force on Oil and Gas in Colorado.
report identifies serious environmental risks to USDWs associated with the injection of water and miscible gas into the subsurface related to corrosion, acidifica-tion, leakage, and blowouts. EPA and state regulators do not adequately address these risks. For example, EPA and most state UIC programs we covered do not require groundwater monitoring for contamination. In many cases, operators also do not have to disclose the chemicals injected for EOR.
Recent political trends have increased uncertainty about the future of environmental protection in the U.S. The budget proposed by the Trump administration calls for a cut in UIC Program funding by $3,166,000 down to $7,340,000. This development is alarming, because it sets a precedent against preventive regulation of the oil and gas industry. If state regulatory agencies are ill-equipped to carry out their daily routine activities, they cannot prevent contamination effectively, espe-cially as the number of EOR wells has grown to more than 145,000 as of 2016. With less oversight, especially monitoring and inspection, the environmental risks for USDWs are likely to increase substantially. Furthermore, the policies adopted by the Trump administration will likely strengthen the position of the oil and gas industry. Many interviewees expect federal and state administra-tions to lower the barriers for operators to obtain injec-tion permits.
Interviewees pointed out that there has been no major incidence of contamination, therefore, it is hard to make an economic justification for more stringent regulatory oversight. Yet, due to the lack of data and the difficulty of underground monitoring, we cannot exclude the possibility that contamination and leakage do occur and are not being detected or reported. The recent earthquakes in Oklahoma, resulting from injec-tion of oil and gas wastewater for disposal, exemplify that visible environmental incidents can provide impetus for regulatory change. Yet, the question is, should the nation have to wait for catastrophic incidents of groundwater contamination in order to strengthen regulatory oversight?
54
The Environmental Risks and Oversight of Enhanced Oil Recovery in the United States
1 United States. Cong. Senate. Safety of Public Water Systems (Safe Drinking Water Act). 93rd Cong. S. 433.Washington: GPO, 1974. US Environmental Protection Agency.2 40 CFR §144.3.3 40 CFR §146.3.4 40 CFR §142.5 Noël, John. The Chilling Effect of Oil and Gas Money on Democracy. Environmental Policy and Oversight Influenced by Polluter Interests. Clean Water Action, Apr. 2016. Web.6 United States Department of Energy Office of Fossil Energy. Enhanced Oil Recovery. Retrieved from https://www.energy.gov/fe/science-innovation/oil-gas-research/
enhanced-oil-recovery7 Wu, May, and Yiwen Chiu. Consumptive Water Use in the Production of Ethanol and Petroleum Gasoline - 2011 Update. Argonne National Laboratory, 2011.8 United States Department of Energy Office of Fossil Energy. Ibid.9 Harju, John. Energy & Environmental Research Center. Personal Interview. 17 Feb. 2017.10 Koplos, Jonathan, Bruce Kobleski, Anhar Karimjee, and Chi Ho Sham. UIC Program Mechanical Integrity Testing: Lessons for Carbon Capture and Storage? Department of
Energy/National Energy Technology Laboratory, 2008. 11 Cummings, Stephen. University of Pittsburgh - Swanson School of Engineering. Personal Interview. 23 Jan. 2017.12 Sarathi, Partha S., and David K. Olsen. Practical Aspects of Steam Injection Processes: A Handbook for Independent Operators. National Institute for Petroleum and Energy
Research, 1992. Print.13 EPA. FY 2016 Underground Injection Well Inventory – By State. June 2017.14 U.S. Energy Information Administration. Crude Oil Production. Retrieved from https://www.eia.gov/dnav/pet/pet_crd_crpdn_adc_mbblpd_a.htm15 Kuuskraa, Vello and Matthew Wallace. “CO2-EOR set for growth as new CO2 supplies emerge.” Oil & Gas Journal, vol. 112, 2014, pp. 92-105.16 Kuuskraa, Vello and Matthew Wallace. Ibid.17 Godec, Michael. Advanced Resources International, Inc. Personal Interview. 8 Nov. 201618 US EPA. Potential Environmental Problems of Enhanced Oil and Gas Recovery Techniques (EPA-600/S2-81-149). September, 1981. Note - this report concerns effects of tertiary
recovery, however, all tertiary recovery processes discussed are also relevant to secondary waterflooding.19 Veil, John. “U.S. Produced Water Volumes and Management Practices in 2012.” Groundwater Protection Council, 2015.20 Veil, John. Ibid.21 Kuwayama, Yusuke. Resources for the Future. Personal Interview. 10 Nov. 2017.22 US EPA. Potential Environmental Problems of Enhanced Oil and Gas Recovery Techniques (EPA-600/S2-81-149). September, 1981.23 De Leon, Fernando. Personal Interview. 16 March. 2017.24 De Leon, Fernando, Ibid. 25 De Leon, Fernando, Ibid.26 Renner, Rob. “Water Research Foundation Update.” Groundwater Protection Council Underground Injection Control Conference, 22 February 2017, Radisson Hotel & Suites,
Austin, TX.27 Harju, John. Energy & Environmental Research Center. Personal Interview. 17 Feb. 2017.28 Pennsylvania Department of Environmental Protection. (2009). Injection Wells for Disposal and Enhanced Recovery. Retrieved from: http://energy.wilkes.edu/PDFFiles/
Issues/Injection%20Wells%20for%20Disposal%20and%20Enhanced%20Recovery.pdf 29 Godec, Michael. Advanced Resources International, Inc. Personal Interview. 8 Nov. 201630 Veil, John. “Introduction to GWPC’s Produced Water Initiative.” Groundwater Protection Council’s 2017 UIC Conference, 22 Feb. 2017, Radisson Hotel, Austin, TX.31 De Leon, Fernando. ALL Consulting. Personal Interview. 16 March 201732 Veil, John. Veil Environmental, LLC. Personal Interview. 30 Jan. 2017.33 Paine, Jeffrey. “Wink Sink.” Bureau of Economic Geology, 2013. Web.34 Powers, Dennis W. “Evaporites, Casing Requirements, Water-floods, and Out-of-formation Waters: Potential for Sinkhole Developments.” Proceedings of the Solution
Mining Research Institute Fall Meeting Technical Session, San Antonio, TX. 2000.35 Anonymous interview.36 Verma, Mahendra. Fundamentals of carbon dioxide-enhanced oil recovery (CO2-EOR)- A supporting document of the assessment methodology for hydrocarbon recovery
using CO2-EOR associated with carbon sequestration: U.S. Geological Survey Open-File Report 2015-1071, 2015. http://dx.doi.org/10.3133/ofr20151071.37 Muggeridge, Ann, Andrew Cockin, Kevin Webb, Harry Frampton, Ian Collins, Tim Moulds, and Peter Salino. “Recovery rates, enhanced oil recovery and technological limits.”
2014. Phil. Trans. R. Soc, vol. 372, 20120320. http://dx.doi.org/10.1098/rsta.2012.032038 Muggeridge, Ann, Andrew Cockin, Kevin Webb, Harry Frampton, Ian Collins, Tim Moulds, and Peter Salino. Ibid.39 Verma, Mahendra. Ibid.40 Skinner, Les. “CO2 Blow-outs: An Emerging Problem.” World Oil, Vol. 224, Issue 1, 2003, pp. 38-42.41 Mordick, Briana. Natural Resources Defense Council. Personal Interview. 10 January 2017.42 Zegart, Dan. Climate Investigations. Personal Interview. 10 Feb. 2017.43 De Leon, Fernando. ALL Consulting. Personal Interview. 16 March 2017.44 De Leon, Fernando. Ibid.45 Terzi, Katerina, Christos A .Aggelopoulos, Ioannis Bountax, and Christos D. Tsakiroglou. “Effects of Carbon Dioxide on the Mobilization of Metals from Aquifers.”
Environmental Science & Technology, vol. 48, 2014, pp. 4386-4394.46 Trautz, Robert C., J.D. Pugh., Charuleka Varadharajan, Liange Zheng, Marco Bianchi, Peter S. Nico, Nicolas F. Spycher, Dennis L., Newell, Richard A. Esposito, Yuxin
Wu, Baptiste Dafflon, Susan S. Hubbard, and Jens T. Birkholzer. “Effect of Dissolved CO2 on a Shallow Groundwater System: A Controlled Release Field Experiment.” Environmental Science & Technology, vol. 47, 2012, pp.298-305.
47 Terzi, Katerina, Christos A .Aggelopoulos, Ioannis Bountax, and Christos D. Tsakiroglou. Ibid. 48 Harju, John. Energy & Environmental Research Center. Personal Interview. 17 Feb. 2017.49 Zegart, Dan. Ibid.
Notes
55
The Environmental Risks and Oversight of Enhanced Oil Recovery in the United States
50 Zegart, Dan. Ibid.51 Wimmer, Bracken T., Ivan G. Krapac, et al. “Applying monitoring, verification, and accounting techniques to a real-world, enhanced oil recovery operation CO2 leak.” Energy
Procedia, vol. 4, 2011, pp. 3330-3337.52 McConnell, Charles. U.S. Dept. of Energy. May, 2012. Adding “Utilization” to Carbon Capture and Storage. Web. Retrieved from https://energy.gov/articles/adding-utilization-
carbon-capture-and-storage53 Kuuskraa, Vello Wallace, Matthew. Ibid.54 National Energy Technology Laboratory. Carbon dioxide enhanced oil recovery: Untapped domestic energy supply and long term carbon storage solution. March, 2010.
Retrieved from https://www.netl.doe.gov/file%20library/research/oil-gas/CO2_EOR_Primer.pdf55 Rich, Wong, Adam Goehner, and Matt McCulloch; Net Greenhouse Gas Impact of Storing CO2 through Enhanced Oil Recovery (EOR) – An analysis of on-site and downstream GHG
emissions from CO2-EOR crude oil production in Western Canada. Report prepared for the integrated CO2 Network. Alberta: The Pembina Institute, 2013.56 Rich, Wong, Adam Goehner, and Matt McCulloch. Ibid.57 Banks, Brian and Mark Bigland-Pritchard. SaskPower’s Carbon Capture Project – What Risks? What Rewards? Canadian Center for Policy Alternatives, 2015.58 Petzet, Alan. “DOE sees vast energy resource in residual oil zones.” Oil & Gas Journal. July, 2012. Web.59 Trentham, Robert, Stephen Melzer, Vello Kuuskraa,and George Koperna. Case studies of the ROZ CO2 flood and the combined ROZ/MPZ CO2 flood at the Goldsmith Landreth
Unit, Ector County, Texas. Using “Next Generation” CO2 EOR technologies to optimize the residual oil zone CO2 flood. National Energy Technology Laboratory, 2015.60 Dehoratiis, Guido. United States Department of Energy. Personal Interview. 28 Sept. 2016.61 Godec, Michael. Advanced Resources International, Inc. Personal Interview. 8 Nov. 201662 Trentham, Robert. Melzer, Stephen. Kuuskraa, Vello. Koperna, George. Ibid.63 Kovscek, A.R. “Emerging challenges and potential futures for thermally enhanced oil recovery.” Journal of Petroleum Science and Engineering, Vol. 98-99, 2012, pp. 130-143.
http://dx.doi.org/10.1016/j.petrol.2012.08.00464 Lake, Larry, Raymond Schmidt and Paul Venuto. “A niche for enhanced oil recovery in the 1990s.” Oilfield Review, Vol. 4, 1992, pp. 55-61.65 Liedtke, Nicholas and Simeon Okorike. California Division of Oil, Gas, and Geothermal Resources. Personal Interview. 15 Nov. 201666 Johannes Alvarez and Sungyun Han. “Current overview of cyclic steam injection process.” Journal of Petroleum Science and Engineering, Vol. 2, 2013.67 Johannes Alvarez and Sungyun Han. Ibid.68 Johannes Alvarez and Sungyun Han. Ibid.69 Brandt, Adam R., Yuchi Sun, Sharad Bharadwaj, David Livingston, Eugene Tan, and Deborah Gordon. “Energy Return on Energy Investment (EROI) for Forty Global Oilfields
Using a Detailed Engineering-Based Model of Oil Production.” PLoS One, 2015, 10(12): e0144141. 70 Kovscek, A. R. “Emerging challenges and potential futures for thermally enhanced oil recovery.” Journal of Petroleum Science and Engineering, Vol. 98-99, 2012, pp. 130-143.
http://dx.doi.org/10.1016/j.petrol.2012.08.00471 Darby, Megan. “Dirtier than tar sands: California's crude oil secret.” 2016. Climate Home. http://www.climatechangenews.com/2016/12/21/dirtier-than-tar-sands-
californias-crude-oil-secret/72 Cart, Julie. “What happened to California regulators’ vows to make steam injections safer?” Los Angeles Times. 2015.73 Mordick, Briana. Natural Resources Defense Council. Personal Interview. 10 January 2017.74 Jordan, Preston and J. William Carey. “Steam blowouts in California Oil and Gas District 4: Comparison of the roles of initial defects versus well aging and implications for
well blowouts in geologic carbon storage projects.” International Journal of Greenhouse Gas Control. Vol. 51, 2016, pp. 36-47.75 Department of Conservation, Division of Oil, Gas, and Geothermal Resources. Report of Occurrences, The Chevron Fatality Accident June 21, 2011 and Area Surface Expression
Activity, Pre and Post Accident. May 2012.76 Department of Conservation, Division of Oil, Gas, and Geothermal Resources. Ibid.77 Cart, Julie. “What happened to California regulators’ vows to make steam injections safer?” Los Angeles Times. 2015.78 “California’s riskiest oil fields examined in new reports.” Central Valley Business Times. 2017.79 40 CFR § 144.3 Definitions.80 Stosur, George, Roger Hite, Norman Carnahan and Karl Miller. The Alphabet Soup of IOR, EOR and AOR: Effective Communication Requires a Definition of Terms. Society of
Petroleum Engineers Inc., 2003.81 Stosur et al. Ibid.82 Wu, May, and Yiwen Chiu. Consumptive Water Use in the Production of Ethanol and Petroleum Gasoline – 2011 Update. Argonne National Laboratory, 2011.83 Sandrea, Rafael, and Darshil Dharod. “Approach screens reservoir candidates for EOR.” Oil & Gas Journal, April 4, 2016.84 US EPA. Potential Environmental Problems of Enhanced Oil and Gas Recovery Techniques (EPA-600/S2-81-149). September 1981.85 David A. December 12, 2016, [Phone]86 United States Government Accountability Office (GAO), 2014. EPA Program to Protect Underground Sources from Injection of Fluids Associated with Oil and Gas Production
Needs Improvement. Report to Congressional Requesters. GAO 14-555. Page 21.87 40 CFR 147.1600 - State-administered program - Class II wells. See https://www.law.cornell.edu/cfr/text/40/147.1600 88 We would like to thank Phillip Goetze, State of New Mexico, Oil Conservation Division, Engineering Bureau, for providing much information for this section in an interview.89 Goetze, Phillip. State of New Mexico, Oil Conservation Division, Engineering Bureau. Phone Interview. 17 Mar. 2017.90 Goetze, Phillip. State of New Mexico, Oil Conservation Division, Engineering Bureau. Phone Interview. 17 Mar. 2017.91 Goetze, Phillip. State of New Mexico, Oil Conservation Division, Engineering Bureau. E-Mail.92 John Noël (2016) “Texas Aquifer Exemptions: Ignoring Federal Law to Fast Track Oil & Gas Drilling” Clean Water Action/Clean Water Fund. Available at
http://www.cleanwateraction.org/publications/texas-aquifer-exemptions 93 De Leon, Fernando. Texas Railroad Commission, retired. Personal Interview. 16 March. 2017.94 De Leon, Fernando. Texas Railroad Commission, retired. Personal Interview. 16 March. 2017.95 United States Government Accountability Office (GAO), 2014. EPA Program to Protect Underground Sources from Injection of Fluids Associated with Oil and Gas Production
Needs Improvement. Report to Congressional Requesters. GAO 14-555. Page 1996 “Ftp.consrv.ca.gov/pub/oil/ - FTP Browser.” Filewatcher File Search. N.p., n.d. Web. 15 Apr. 2017. <http://www.filewatcher.com/b/ftp/ftp.consrv.ca.gov/pub/oil-0.html>.97 California Division of Oil, Gas, and Geothermal Resources, Underground Injection Control Program Report on Permitting and Program Assessment: Reporting Period of

56
The Environmental Risks and Oversight of Enhanced Oil Recovery in the United States
October 1, 2015 - March 31, 2016 (Sacramento, CA: 2016).98 California, State Of. “Underground Injection Control (UIC) News and Information.” Department of Conservation. N.p., n.d. Web. 15 Apr. 2017. <http://www.conservation.
ca.gov/dog/general_information/Pages/UndergroundinjectionControl(UIC).aspx>.99 California Status and Regulations for Conservation of Oil, Gas, and Geothermal resources, PRC.10, p. 189100 Ibid., Pg 177101 Ibid., Pg 65102 Updated UIC Regulations- Pre RuleMaking, UPDATED UNDERGROUND INJECTION CONTROL REGULATIONS PRE-RULEMAKING DISCUSSION DRAFT (n.d.): n. pag. UPDATED
UNDERGROUND INJECTION CONTROL REGULATIONS PRE-RULEMAKING DISCUSSION DRAFT. Web. 3 May 2017103 Horsely Witten Group for EPA Region 9, California Class II Underground Injection Control Program Review (June 2011). 104 Office, United States Government Accountability. DRINKING WATER EPA Needs to Collect Information and Consistently Conduct Activities to Protect Underground Sources
of Drinking Water (n.d.): n. pag. Web. 16 Apr. 2017105 California Division of Oil, Gas, and Geothermal Resources, Underground Injection Control Action Plan: Response to the U.S. EPA June 2011 Review of California’s UIC
Program (Sacramento, CA: November 2012)106 Ibid., 10107 Office, United States Government Accountability. DRINKING WATER EPA Needs to Collect Information and Consistently Conduct Activities to Protect Underground Sources
of Drinking Water108 California Division of Oil, Gas, and Geothermal Resources, Underground Injection Control Program Report on Permitting and Program Assessment: Reporting Period of
Calendar Years 2011-2014. 109 Office, United States Government Accountability. DRINKING WATER EPA Needs to Collect Information and Consistently Conduct Activities to Protect Underground Sources
of Drinking Water110 Nicolas, Mike. Proc. of 2017 UIC CONFERENCE, Austin.111 North Dakota Rules and Regulations for Oil and Gas: Rule Book. Atlanta, Ga. (2 M.L. King, Jr., Dr., S.E., Atlanta 30334): Board, 1985. Web. 14 Apr. 2017112 Department of Mineral Resources. N.p., n.d. Web. 09 Apr. 2017. <https://www.dmr.nd.gov/oilgas/>.113 "Underground Injection Control Program Frequently Asked Questions." Underground Injection Control Program Frequently Asked Questions. N.p., n.d. Web. 08 Apr. 2017.114 Harju J. February 17, 2017 [Phone]115 United States Government Accountability Office (GAO), 2016. EPA Needs to Collect Information and Consistently Conduct Activities to Protect Underground Sources of Drinking
Water. Report to Congressional Requesters. GAO 16-281.116 North Dakota Statutes and Regulations117 United States Government Accountability Office (GAO), 2016. Ibid.118 North Dakota Geographic Targeting System for Groundwater Monitoring. N.p., n.d. Web. 16 Apr. 2017. <https://www.ndhealth.gov/wq/gw/pubs/GWT.HTM>.119 United States Government Accountability Office (GAO), 2016. EPA Needs to Collect Information and Consistently Conduct Activities to Protect Underground Sources of Drinking
Water. Report to Congressional Requesters. GAO 16-281.120 Ibid., Pg 22121 Ibid., Pg 52122 Ibid., Pg 52123 United States Government Accountability Office (GAO), 2016. Ibid.124 North Dakota Rules and Regulations for Oil and Gas: Rule Book. Atlanta, Ga. (2 M.L. King, Jr., Dr., S.E., Atlanta 30334): Board, 1985. Web. 14 Apr. 2017125 Ibid.126 State of Colorado, General Rules and Regulations, https://www.sos.state.co.us/CCR/GenerateRulePdf.127 "COGCC About Us." COGCC About Us. N.p., n.d. Web. 07 Apr. 2017.128 United States Government Accountability Office (GAO), 2016. EPA Needs to Collect Information and Consistently Conduct Activities to Protect Underground Sources of Drinking
Water. Report to Congressional Requesters. GAO 16-281129 State of Colorado, General Rules and Regulations, Pg 78130 Ibid.131 United States Government Accountability Office (GAO), 2016. Ibid.132 Ved, and S. ENGINEERING UNIT CLASS II UNDERGROUND INJECTION CONTROL WELLS (n.d.): n. pag. Web. 15 Apr. 2017. 133 State of Colorado, General Rules and Regulations, Pg 2134 Ibid., Pg 154135 United States Government Accountability Office (GAO), 2016. Ibid.136 Ibid.137 State of Colorado, General Rules and Regulations, Pg 180138 United States Government Accountability Office (GAO), 2016. Ibid.139 Ibid.140 Groundwater Protection Council “State of Ohio Class II UIC Program Peer Review.” January 2017. Available at http://www.gwpc.org/resources/publications Page 20.141 Groundwater Protection Council “State of Ohio Class II UIC Program Peer Review.” January 2017. Available at http://www.gwpc.org/resources/publications Page 33.142 Groundwater Protection Council “State of Ohio Class II UIC Program Peer Review.” January 2017. Available at http://www.gwpc.org/resources/publications Page 15.143 Adgate, Andrew. Ohio Department of Natural Resources, Division of Oil and Gas. Phone interview. 9 Mar. 2017.”144 Groundwater Protection Council “State of Ohio Class II UIC Program Peer Review.” January 2017. Available at http://www.gwpc.org/resources/publications145 Ohio Revised Code Title 15 Chapter 1509.06146 Adgate, Andrew. Ohio Department of Natural Resources, Division of Oil and Gas. Phone interview. 9 Mar. 2017.147 Groundwater Protection Council “State of Ohio Class II UIC Program Peer Review” January 2017. Available at http://www.gwpc.org/resources/publications Page 27.148 Groundwater Protection Council “State of Ohio Class II UIC Program Peer Review” January 2017. Available at http://www.gwpc.org/resources/publications149 Groundwater Protection Council “State of Ohio Class II UIC Program Peer Review” January 2017. Available at http://www.gwpc.org/resources/publications

57
The Environmental Risks and Oversight of Enhanced Oil Recovery in the United States
150 United States Government Accountability Office (GAO), 2014. EPA Program to Protect Underground Sources from Injection of Fluids Associated with Oil and Gas Production Needs Improvement. Report to Congressional Requesters. GAO 14-555. Pg 21.
151 EPA (2015) “Minimizing and Managing Potential of Injection-Induced Seismicity from Class II Disposal: Practical approaches” prepared by the UIC National Technical Working Group. Available at https://www.epa.gov/sites/production/files/2015-08/documents/induced-seismicity-201502.pdf
152 United States Government Accountability Office (GAO), 2014. EPA Program to Protect Underground Sources from Injection of Fluids Associated with Oil and Gas Production Needs Improvement. Report to Congressional Requesters. GAO 14-555. Page 45.
153 Jacqueline Ho, Alan Krupnick, Katrina McLaughlin, Clayton Munnings, and Jhih-Shyang Shih, 2016. “Plugging the Gaps in Inactive Well Policy” RFF Report, Washington, DC: Resources for the Future.
154 We would like to thank Nathan Wiser, Cindy Beeler and Douglas Minter, EPA Region 8, for providing much information for this section in an interview on 3 March, 2017.155 United States Government Accountability Office (GAO), 2016. EPA Needs to Collect Information and Consistently Conduct Activities to Protect Underground Sources of Drinking
Water. Report to Congressional Requesters. GAO 16-281 Page 28.156 Groundwater Protection Council (2014) State Oil and Gas regulations designed to protect water resources. Available at http://www.gwpc.org/state-oil-gas-regulations-
designed-protect-water-resources-2014-edition157 Groundwater Protection Council (2014) State Oil and Gas regulations designed to protect water resources. Available at http://www.gwpc.org/state-oil-gas-regulations-
designed-protect-water-resources-2014-edition 158 United States Government Accountability Office (GAO), 2014. EPA Program to Protect Underground Sources from Injection of Fluids Associated with Oil and Gas Production
Needs Improvement. Report to Congressional Requesters. GAO 14-555.159 United States Government Accountability Office (GAO), 2016. EPA Needs to Collect Information and Consistently Conduct Activities to Protect Underground Sources of Drinking
Water. Report to Congressional Requesters. GAO 16-281.160 Office of President of United States, “ FY-2018 President’s Budget: Major Policy and Final Resource Decisions” Memo to EPA, Washington DC, March 21, 2017.161 Groundwater Protection Council (2014) State Oil and Gas regulations designed to protect water resources. Available at http://www.gwpc.org/state-oil-gas-regulations-
designed-protect-water-resources-2014-edition 162 EPA Underground Injection Control Branch Guidance #39 “Guidance for Financial Assurance for Federally-Administered UIC Programs” May 29, 1985163 Jacqueline Ho, Alan Krupnick, Katrina McLaughlin, Clayton Munnings, and Jhih-Shyang Shih, 2016. “Plugging the Gaps in Inactive Well Policy” RFF Report, Washington, DC:
Resources for the Future.164 Barclay, I., J. Pellenbarg, F. Tettero, J. Pfeiffer, H. Slater, T. Staal, D. Stiles, G. Tilling & C. Whitney (2002) “The Beginning of the End: A Review of Abandonment and
Decommissioning Practices” Oilfield Review, Winter 2001/2002165 Wu, May, and Yiwen Chiu. Consumptive Water Use in the Production of Ethanol and Petroleum Gasoline – 2011 Update. Argonne National Laboratory, 2011.166 United States Government Accountability Office (GAO), 2016. EPA Needs to Collect Information and Consistently Conduct Activities to Protect Underground Sources of Drinking
Water. Report to Congressional Requesters. GAO 16-281.

58
The Environmental Risks and Oversight of Enhanced Oil Recovery in the United States
Appendix: Federal and State RegulationsNote on use of federal and state regulation tables: We have provided the following tables to give a surface-level overview of federal and state regulations and their locations in the relevant codes and statutes. For the sake of simplicity, numerous entries under “Description of Regulation” in each table may be altered or abbreviated from the regulation itself. For the full text, see the listed corresponding “Regulation,” which can be found on federal and state websites or a web search.
Federal Class II RegulationsCategory Regulation Description of Regulation
DEFINITIONSClass II Well 40 CFR § 146.5(b). Wells that inject fluids for EOR, natural gas or disposal.
SITING
Siting Requirements 40 CFR § 146.22(a).All new Class II wells shall be sited so that they inject into formations separated from USDWs by a confining zone without faults or fractures within the area of review.
Area of Review 40 CFR § 146.6.Determined by calculating the zone of endangering influence or determining the fixed radius (¼ mile minimum). AOR can be smaller than a ¼ mile if the zone of endangering influence calculation determines it to be so.
MECHANICAL INTEGRITY
Casing Requirements 40 CFR § 146.22(b)(1).
Class II wells shall be cased and cemented to prevent movement of fluids into or between USDWs. Casing and cement must be designed for the well’s life expectancy.
CementingRequirements
40 CFR § 146.22(b)(1). Same as above.
40 CFR § 146.8(c)(2). Cementing records must demonstrate the presence of adequate cement to prevent significant fluid migration.
BlowoutPrevention
40 CFR § 144.55 Well operators must develop a corrective action plan.
40 CFR § 144.7.To determine adequacy of corrective plan, several criteria must be accounted for, such as geology, injection operation history, nature and volume of injected fluid, etc.
P&A 40 CFR § 146.10(a). Well shall be plugged with cement in a manner which will not allow fluid movement into or between USDWs.
Injectate ChemicalDisclosure N/A N/A
BONDING
Bonding Terms 40 CFR § 144.52(7)(i).The permittee and transferor of a permit must demonstrate financial responsibility and resources to close, plug, and abandon the underground injection operation.
Abandoned Well Fund N/A N/A
PERMITTING
Financial Assurance 40 CFR 144.52(7)(ii).The permittee must prove financial responsibility to the Director by the submission of a surety bond or other adequate assurance, such as a financial statement.
INSPECTIONFrequency 42 U.S.C. § 300h(b)(1). States applying for primacy shall include inspection requirements.
Who Inspects 42 U.S.C. § 300h(b)(1). Same as abovePRODUCED WATER
Quality Monitoring N/A N/A
Quantity Injected 40 CFR § 146.23(c).Injection pressure, flow rate, and cumulative volume must be monitored and reported monthly for EOR operations and daily during the injection phase of cyclic steam operations.

59
The Environmental Risks and Oversight of Enhanced Oil Recovery in the United States
Texas Class II RegulationsCategory Regulation Description of Regulation
DEFINITIONS
Class II WellTexas Water Code 27.002 Defines “injection wells” and "disposal wells.”
16 TAC 3.50.4 Defines “enhanced recovery wells.”SITING
Siting Requirements 16 TAC § 3.46 a Permits may be issued when the injection will not endanger oil, gas, or geothermal resources or cause the pollution of freshwater strata.
Area of Review 16 TAC § 3.9.7 C, 16 TAC § 3.46 e
Follows the federal minimum fixed radius of a ¼ mile AOR. Under specific conditions, AOR can be varied.
MECHANICAL INTEGRITY
Casing Requirements
16 TAC § 3.13.4 All cemented casing shall be hydrostatically pressure-tested steel casing
16 TAC § 3.46 Injection wells shall be equipped with tubing set on a mechanical packer. Regulation includes packer height requirements.
CementingRequirements 16 TAC § 3.13 Contains specific cementing requirements for all wells spudded after 1
January 2014.
BlowoutPrevention
16 TAC § 3.13.6Well control equipment includes installation of a blowout preventer system or control head and drill pipe safety valve. All control equipment shall be consistent with API Standard 53.
16 TAC § 3.13.6 xBlowout prevention equipment shall be tested upon installation, after disconnection or repair, at least every 21 days. When requested, the district director shall be notified before the commencement of a test.
P&A
16 TAC § 3.14Contains specific plugging regulations. Also, the operator shall complete and file in the district office a duly verified plugging record, including a cementing report, within 30 days after plugging.
16 TAC § 3.14 dOutlines plugging requirements for different well types. All cementing operations during plugging need direct supervision of the operator or his authorized representative.
Injectate ChemicalDisclosure N/A N/A
BONDING
Bonding Terms16 TAC § 3.14 The operator is responsible for plugging the well.
16 TAC § 3.14 The entity listed as operator on operator designation form is presumed to be responsible for physical operation, control, and properly plugging the well.
Abandoned Well Fund
Texas Nat. Res. Code, §81.067
Created “Oil and Gas Regulation and Cleanup Fund.”
PERMITTING
Financial Assurance 16 TAC § 3.78 Specifies amounts of deposits that must be filed as individual performance bond, letter of credit, or cash.
INSPECTION
Frequency 16 TAC § 3.46 j Each injection well shall be tested for mechanical integrity at least once every five years, and after every workover of the well.
Who Inspects 16 TAC § 3.46 j The operator shall notify the appropriate district office at least 48 hours prior to the testing.
PRODUCED WATER
Quality Monitoring 16 TAC § 3.46 1 The applicant shall file the freshwater injection data form if fresh water is to be injected into the productive reservoir.
Quantity Injected
16 TAC § 3.48Operator must submit a production graph illustrating both increased production and volumes of water or other substances used in the secondary or tertiary recovery project that have been injected on the lease or unit since project initiation.
16 TAC § 3.50To apply for an EOR tax incentive, operators must submit production and injection graphs showing volumes of water or other substances injected since initiation of project. The annual report must file data on monthly volume of injected fluid(s).

60
The Environmental Risks and Oversight of Enhanced Oil Recovery in the United States
California Class II RegulationsCategory Regulation Description of Regulation
DEFINITIONS
Class II Well CA Pub Res Code § 3130(a).
Has the same meaning as set forth by Federal EPA.
SITING
Siting Requirements14 CCR § 1724.7(a). Each injection project must include an engineering study.14 CCR § 1724.7(b). Each injection project must include a geologic study.14 CCR § 1724.7(c). Each injection project must include an injection plan.
Area of Review 40 CFR § 146.6. DOGGR follows the federal minimum fixed radius of a ¼ mile AOR boundary centered from the wellbore.
MECHANICAL INTEGRITY
Casing Requirements
14 CCR § 1722.2. Each well must have casing that provides anchorage for blowout prevention equipment and seals off fluid migration into oil, gas, and freshwater sources.
14 CCR § 1722.3.Provides specific requirements regarding the maximum depth different types of casing can be cemented into place. DOGGR can request pressure testing of casing.
CementingRequirements 14 CCR § 1722.4.
Separate cementing requirements exist for different casing types. Cement must fill the annular space at least 100 feet above the base of the freshwater zone. DOGGR can request testing of the cementing operation.
BlowoutPrevention 14 CCR § 1722.5. Refers to DOGGR’s No. MO 7 “Blowout Prevention in California” to be used as
a guide to establish required blowout prevention equipment.
P&A
14 CCR § 1723. Provides general terms and equipment requirements.
14 CCR § 1724.7(a)(4).An engineering study must show that casing diagrams in P&A wells will not adversely affect the project or cause damage to life, health, property, or natural resources.
Injectate ChemicalDisclosure N/A N/A
BONDING
Bonding TermsCA Pub Res Code § 3204. Bond costs for operators running fewer than 20 wells.CA Pub Res Code § 3205. Bond costs for operators running 20 or more wells.
Abandoned Well Fund CA Pub Res Code § 3206.
The Hazardous and Idle-Deserted Well Abatement Fund deposits fees collected from owners operating a well that currently does not produce oil or gas. These fees are used to mitigate potential hazards caused by P&A operations.
PERMITTING
Financial Assurance 14 CCR § 1722.1Anyone who acquires the right to operate a well must file an indemnity or cash bond to cover the obligations covered under the previous operator’s bond.
INSPECTIONFrequency 14 CCR § 1724.4(a). All well safety devices shall be tested every 6 months.
Who Inspects 14 CCR § 1724.4(b). DOGGR must be notified before tests are made, as an inspector may witness these tests.
PRODUCED WATER
Quality Monitoring 14 CCR § 1724.7(a)(3). Reservoir fluid data for each injection zone, which includes water quality, must be submitted.
Quantity Injected CA Pub Res Code § 3227.At the end of each month, well owners must submit: the source, volume, and number of days it took to reach said volume of water produced from each well.

61
The Environmental Risks and Oversight of Enhanced Oil Recovery in the United States
North Dakota Class II RegulationsCategory Regulation Description of Regulation
DEFINITIONSClass II Well NDCC 38-08-4 (2) Same meaning as set forth by Federal EPA.
SITING
Siting Requirements NDCC 38-08-04(2) All wells must be sited so that they inject into a formation which has confining zones that are free of known open faults or fractures with AOR.
Area of Review NDCC 43-02-05-01 Encompassing a fixed radius of not less than ¼ of a mile.MECHANICAL INTEGRITY
Casing Requirements
NDCC 43-02-03-19.5All pit water must be removed prior to reclamation. Drilling waste should be encapsulated in the pit and covered with at least four feet [1.22 meters] of backfill and topsoil and surface sloped.
NDCC 43-02-03-19.5(4) Prior to reclaiming the pit, the operator or agent files a sundry notice (form 4) with the director & obtain approval of a pit reclamation plan.
CementingRequirements NDCC 43-02-03-21
Separate cementing requirements exist for different casing types: cement must fill the annular space at least 50 feet above the base of the freshwater zone.
BlowoutPrevention NDCC 43-02-03-23 Refers to DOGGR’s No. MO 7 “Blowout Prevention in California” to be used as
a guide to establish required blowout prevention equipment.
P&ANDCC 38-08.1-05 General terms and equipment requirements.
NDCC 38-08.1-06 This is used as data fund, to keep operate and maintain the data dashboards online.
Injectate ChemicalDisclosure N/A N/A
BONDING
Bonding Terms
NDCC 38-08-04-11. Cash bond fund for plugging of abandoned wells and reclamation of abandonment
NDCC 38-08-04 d(1)The amount is determined by the commission but such amount doesn't exceed an amount equal to an annual return of two percent of the cash bond deposit.
Abandoned Well Fund NDCC 38-08.1-06 If the guidelines are not complied with a legal action can be taken against the
industry with cortical and civil penalties.PERMITTING
Financial Assurance NDCC 38-08-04.8 If the commissions bear any expense for the provision of permitting, re-plugging, etc. The commission is reimbursed by the owner/industry.
INSPECTIONFrequency NDCC 38-08-04.7. The commission has the right to inspect the well anytime they want too.
Who Inspects NDCC 38-08-04.4. The commission, its agents, employees, or/and contractors have the right to enter any land for inspection.
PRODUCED WATER
Quality Monitoring NDCC 43-02-03-47 Reservoir fluid data for each injection zone, which includes water quality, must be submitted monthly and certificate of clearance is awarded to them.
Quantity Injected NDCC 43-02-03-47At the end of each month, well owners must submit the source, volume, and number of days it took to reach said volume of water produced from each well.

62
The Environmental Risks and Oversight of Enhanced Oil Recovery in the United States
Oklahoma Class II RegulationsCategory Regulation Description of Regulation
DEFINITIONS
Class II Well 252 OAC § 652-1-3(b)Title 40 CFR Parts 124 (Subpart A), 144, 145, 146, 147, 148 are all incorporated in their entirety as they apply to the UIC Program (excluding Class VI regulations).
SITINGSiting Requirements 252 OAC§ 652-1-3(b) 40 CFR incorporation. Siting requirements match EPA’s.
Area of Review
252 OAC § 652-1-3(b) 40 CFR incorporation – Title 40 CFR 146.6 (area of review) is incorporated in its entirety.
165 OAC § 10-5-2(e) Any newly drilled or newly converted injection or disposal well which is within (1/2) mile of any public water supply well shall not be approved without notice and hearing.
MECHANICAL INTEGRITY
Casing Requirements
165 OAC § 10-3-4(c)Includes minimum surface, intermediate, and production casing requirements for enhanced recovery injection and penalty for noncompliance (fine up to $5,000). Steel casing required.
165 OAC § 10-3-4(c) Includes minimum surface, intermediate, and production cementing requirements for enhanced recovery injection.
CementingRequirements 165 OAC § 10-3-4(h) Minimum wellhead equipment for drilling wells.
BlowoutPrevention 165 OAC § 10-11-6 Minimum plugging procedures for wells drilled or used for disposal or
enhanced recovery injection. P&A NDCC 38-08.1-05 General terms and equipment requirements.
Injectate ChemicalDisclosure N/A N/A
BONDING
Bonding Terms165 OAC § 10-11-3 Duty to plug and abandon. Establishes liability of owners/operators.165 OAC § 10-5-10 Transfer of authority to inject.
Abandoned Well Fund
17 OS § 180-10 Establishes a fund in the State Treasury to be designated as the “Corporation Commission Plugging Fund.”
68 OS § 1101Prior to July 1, 2021 an excise tax of 0.095% of the value of each barrel of oil produced in Oklahoma is levied. Beginning on July 1, 2021, the tax will be 0.085% the value of a barrel.
68 OS § 1103Prior to July 1, 2021, 10.526% of monies raised from the oil excise fund will go to the Plugging Fund. 10.5555% of the natural gas excise tax will also go to the Plugging Fund.
PERMITTING
Financial Assurance 52 OS § 318-1 Requires establishment of financial ability to comply with plugging, closure of surface impoundments, etc.
INSPECTION
Frequency 165 OAC § 10-5-6 Mandatory MIT test required before commencement of operation. MI must be demonstrated at least once every five years after this.
Who Inspects 165 OAC § 10-5-6Initial MIT shall be witnessed by an authorized representative of the Conservation Division (CD). Subsequent tests must be witnessed by CD or well operator must submit documentation of the test to the CD within 30 days after the test.
PRODUCED WATERQuality Monitoring N/A N/A
Quantity Injected 165 OAC § 10-5-7(c)(3)(A) On a monthly basis, operator of each enhanced recovery injection well shall monitor and record injection rate for a well.
Clean Water Action — www.CleanWaterAction.orgClean Water Action is a national 501(c)(4) environmental organization with nearly one million members nationwide. Since our founding during the campaign to pass the landmark Clean Water Act in 1972, Clean Water Action has worked to win strong health and environmental protections by bringing issue expertise, solution-oriented thinking and people power to the table.
Clean Water Fund — www.CleanWaterFund.orgClean Water Fund is a national 501(c)(3) research and education organization that has been promoting the public interest since 1978. Clean Water Fund supports protection of natural resources, with an emphasis on water quality and quantity issues. Clean Water Fund’s organizing has empowered citizen leaders, organizations and coalitions to improve conditions in hundreds of communities, and to strengthen policies at all levels of government.
1444 Eye Street NW, #400, Washington DC 20005-6538 | 202.895.0420 | www.cleanwater.org
CLEAN WATER ACTION | CLEAN WATER FUND
Summer 2017