The environmental opportunity cost of using renewable ...
12
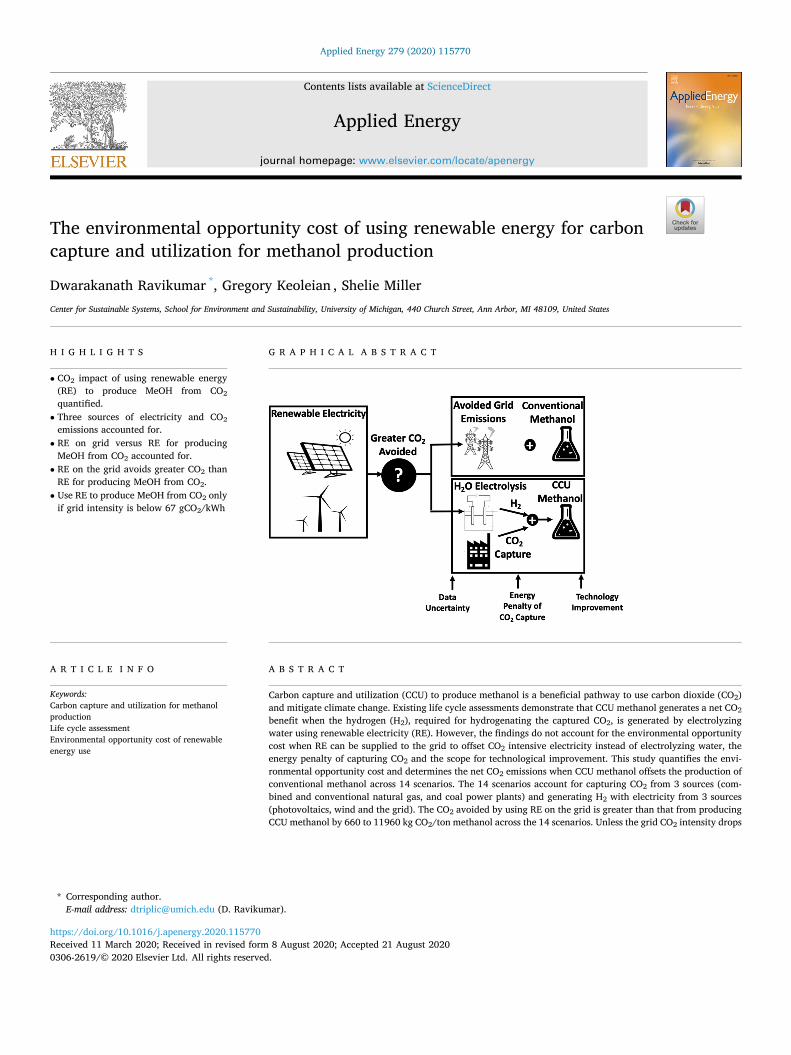
Applied Energy 279 (2020) 115770 0306-2619/© 2020 Elsevier Ltd. All rights reserved. The environmental opportunity cost of using renewable energy for carbon capture and utilization for methanol production Dwarakanath Ravikumar * , Gregory Keoleian , Shelie Miller Center for Sustainable Systems, School for Environment and Sustainability, University of Michigan, 440 Church Street, Ann Arbor, MI 48109, United States HIGHLIGHTS G R A P H I C A L ABSTRACT • CO 2 impact of using renewable energy (RE) to produce MeOH from CO 2 quantified. • Three sources of electricity and CO 2 emissions accounted for. • RE on grid versus RE for producing MeOH from CO 2 accounted for. • RE on the grid avoids greater CO 2 than RE for producing MeOH from CO 2 . • Use RE to produce MeOH from CO 2 only if grid intensity is below 67 gCO 2 /kWh A R T I C L E INFO Keywords: Carbon capture and utilization for methanol production Life cycle assessment Environmental opportunity cost of renewable energy use ABSTRACT Carbon capture and utilization (CCU) to produce methanol is a beneficial pathway to use carbon dioxide (CO 2 ) and mitigate climate change. Existing life cycle assessments demonstrate that CCU methanol generates a net CO 2 benefit when the hydrogen (H 2 ), required for hydrogenating the captured CO 2 , is generated by electrolyzing water using renewable electricity (RE). However, the findings do not account for the environmental opportunity cost when RE can be supplied to the grid to offset CO 2 intensive electricity instead of electrolyzing water, the energy penalty of capturing CO 2 and the scope for technological improvement. This study quantifies the envi- ronmental opportunity cost and determines the net CO 2 emissions when CCU methanol offsets the production of conventional methanol across 14 scenarios. The 14 scenarios account for capturing CO 2 from 3 sources (com- bined and conventional natural gas, and coal power plants) and generating H 2 with electricity from 3 sources (photovoltaics, wind and the grid). The CO 2 avoided by using RE on the grid is greater than that from producing CCU methanol by 660 to 11960 kg CO 2 /ton methanol across the 14 scenarios. Unless the grid CO 2 intensity drops * Corresponding author. E-mail address: [email protected] (D. Ravikumar). Contents lists available at ScienceDirect Applied Energy journal homepage: www.elsevier.com/locate/apenergy https://doi.org/10.1016/j.apenergy.2020.115770 Received 11 March 2020; Received in revised form 8 August 2020; Accepted 21 August 2020
Transcript of The environmental opportunity cost of using renewable ...
Applied Energy 279 (2020) 115770
0306-2619/© 2020 Elsevier Ltd. All rights reserved.
The environmental opportunity cost of using renewable energy for carbon capture and utilization for methanol production
Dwarakanath Ravikumar *, Gregory Keoleian , Shelie Miller Center for Sustainable Systems, School for Environment and Sustainability, University of Michigan, 440 Church Street, Ann Arbor, MI 48109, United States
H I G H L I G H T S G R A P H I C A L A B S T R A C T
• CO2 impact of using renewable energy (RE) to produce MeOH from CO2 quantified.
• Three sources of electricity and CO2 emissions accounted for.
• RE on grid versus RE for producing MeOH from CO2 accounted for.
• RE on the grid avoids greater CO2 than RE for producing MeOH from CO2.
• Use RE to produce MeOH from CO2 only if grid intensity is below 67 gCO2/kWh
A R T I C L E I N F O
Keywords: Carbon capture and utilization for methanol production Life cycle assessment Environmental opportunity cost of renewable energy use
A B S T R A C T
Carbon capture and utilization (CCU) to produce methanol is a beneficial pathway to use carbon dioxide (CO2) and mitigate climate change. Existing life cycle assessments demonstrate that CCU methanol generates a net CO2 benefit when the hydrogen (H2), required for hydrogenating the captured CO2, is generated by electrolyzing water using renewable electricity (RE). However, the findings do not account for the environmental opportunity cost when RE can be supplied to the grid to offset CO2 intensive electricity instead of electrolyzing water, the energy penalty of capturing CO2 and the scope for technological improvement. This study quantifies the envi-ronmental opportunity cost and determines the net CO2 emissions when CCU methanol offsets the production of conventional methanol across 14 scenarios. The 14 scenarios account for capturing CO2 from 3 sources (com-bined and conventional natural gas, and coal power plants) and generating H2 with electricity from 3 sources (photovoltaics, wind and the grid). The CO2 avoided by using RE on the grid is greater than that from producing CCU methanol by 660 to 11960 kg CO2/ton methanol across the 14 scenarios. Unless the grid CO2 intensity drops
* Corresponding author. E-mail address: [email protected] (D. Ravikumar).
Contents lists available at ScienceDirect
Applied Energy
journal homepage: www.elsevier.com/locate/apenergy
https://doi.org/10.1016/j.apenergy.2020.115770 Received 11 March 2020; Received in revised form 8 August 2020; Accepted 21 August 2020

Applied Energy 279 (2020) 115770
2
below 67 g CO2/kWh, it is environmentally preferable to supply RE to the grid than for use in CCU methanol production. At the thermodynamic limit of CCU methanol production, the grid CO2 intensity should be lower than 82 g CO2/kWh, which is unlikely in the US before 2050.
1. Introduction
The rapid growth in global carbon-dioxide (CO2) emissions and the corresponding increase in the atmospheric CO2 concentration poses a significant climate risk. Limiting temperature rise to the recommended threshold of 1.5 ◦C1 and minimizing climate-change impacts requires a 45% reduction in global CO2 emissions from 2010 levels by 2030 and net zero levels by around 2050 [1]. Emerging studies propose carbon cap-ture and utilization (CCU) as an environmentally promising CO2 miti-gation pathway by capturing the CO2 from waste streams and producing economically valuable products from the captured CO2 [2].
A recent study shows that CCU has the potential to prevent 7.15 gigatons of CO2 emissions globally and generate products with a po-tential market value of 837 billion US dollars by 2030 [3]. Among the products for utilizing captured CO2, methanol is an attractive option as it is a vital feedstock for the chemical industry and an important source of transportation fuel. The potential environmental benefits have moti-vated policy measures in US, the European Union (EU) and China to incentivize the blending of methanol (3–85% by volume) in traditional fossil-fuel based transportation fuels [4]. The global production of methanol has increased by 10% annually from 45 million tons in 2008 to 96 million tons in 2016 [5]. Estimates show that production of methanol from captured CO2 has the potential to utilize 50 million tons of CO2 by 2030 [3]. CO2 utilization from methanol production is expected to in-crease by 8% annually [6]. Beyond capturing and utilizing CO2 emis-sions, methanol produced from captured CO2 offers the additional environmental benefit of preventing CO2 emissions by displacing con-ventional methanol, which is produced from natural gas through steam reformation [7,8].
Given the potential economic and environmental opportunities, fa-cilities dedicated to produce methanol from captured CO2 have been established in Iceland and Japan [8,9] producing 4000 and 100 tons per year, respectively [10,11]. A survey shows that the “Chemical Inter-mediate” cluster, which is one of the six major product clusters for CO2 utilization and includes methanol, has the highest number commercial developers [3]. With significant economic potential [12,13], there is a critical need to prospectively resolve environmental hotspots and identify environmental preferable pathways to further expand the scale of producing methanol from captured CO2.
Life cycle assessment (LCA), the comprehensive analytical frame-work to evaluate the environmental impact of products and technology systems, has been applied to investigate various environmental aspects of producing methanol from captured CO2 [14]. Methanol production from captured CO2 requires two crucial feedstock production processes - the capture of CO2 and the generation of H2. The methanol is produced by hydrogenating the feedstock of captured CO2. LCA studies have shown that methanol produced from captured CO2 generates a net CO2 benefit by offsetting conventional methanol produced from natural gas and utilizing a feedstock of captured CO2 [14], although this benefit can only be realized when renewable electricity (RE) is used for hydrogen generation via electrolysis [11,15–17]. Hydrogen generation through electrolysis of water is an energetic hotspot [11] and the use of RE can decrease the environmental burden of electrolysis [8,16,18]. A recent review concluded that CCU methanol production using wind electricity has a lower CO2 footprint than conventional methanol [19]. Despite the consensus, existing studies do not account for the following key factors which, when combined, can impact the net life cycle CO2 benefit of replacing conventional methanol with CCU methanol.
(i) Environmental opportunity cost: The environmental feasibility of producing methanol from captured CO2 is predicated upon utilizing low carbon RE for the generation of H2. However, the use of RE for H2 generation forgoes the opportunity to supply RE to the grid and, thereby, avoid CO2 emissions by offsetting elec-tricity generated from fossil sources. The potential CO2 emissions that can be avoided by offsetting CO2-intensive fossil-fuel elec-tricity on the grid is hereafter referred to as the environmental opportunity cost (EOC) of using RE to produce methanol from captured CO2. The EOC is variable as it depends on the CO2 in-tensity of the grid electricity offset by the RE, which varies by the source from which the grid electricity is generated (e.g. coal, natural gas, wind). As a result, CCU methanol production may generate a net increase in CO2 emissions in scenarios where RE can instead prevent a greater amount of CO2 emissions when it is supplied to the grid.
(ii) Energy penalty (Elecp): Elecp represents the decrease in the electricity output of the power plant [20–22] as the capture of CO2, which is required for CCU methanol production, requires heat and electricity [23]. If the power plant from which CO2 is captured is operating at maximum energy capacity, then the energy penalty is compensated by an external source (hereafter referred to as “external compensation”). In this scenario, elec-tricity is generated without carbon capture in the external power plant. Alternately, if the power plant from which CO2 is captured is operating below maximum energy capacity, then the energy penalty is compensated by the same plant (hereafter referred to as “internal compensation”). In this scenario, the analysis should account for the carbon capture when electricity is generated internally in the power to compensate for the energy penalty.
(iii) Technology improvement: The decrease in material and energy inventory requirements, which accompanies technological and process improvements, decreases the life cycle CO2 emissions of CCU methanol production.
(iv) Data uncertainty: There is a lack of standardized data on the life cycle energy and material inventory required to produce CCU methanol at a commercial scale. As a result, the uncertainty in the inventory data [24,25] and the variability in assumptions used across studies introduces significant uncertainty in the value of the life cycle CO2 determined for CCU methanol production [19,26].
To account for the above factors, we determine the net life cycle CO2 impact from CCU methanol, which accounts for the post-combustion CO2 capture from power plants, H2 generation, methanol production, the CO2 avoided by offsetting conventional methanol, the EOC of the RE used and the energy penalty of carbon. We determine the threshold value of the grid CO2 intensity at which RE use for CCU methanol pro-duction generates a greater benefit than the supply of RE to the grid. To account for technological improvements, we determine the net CO2 emissions and the threshold value for CCU methanol production under the current technological condition and at the thermodynamic limit, wherein the material and energy requirements are assumed to be the theoretical minimum. We determine the life cycle CO2 impact of CCU methanol based on material and energy inventory collected from 58 studies [11,15–18,27–69] and conduct an uncertainty analysis to determine the impact of data uncertainty on the results.
D. Ravikumar et al.

Applied Energy 279 (2020) 115770
3
2. Methods
2.1. CCU methanol production - key processes and inventory requirement
The key processes for CCU methanol production are – capture and compression of CO2, generation of H2 through electrolysis of water, compression and transportation of CO2 and H2, and the hydrogenation of CO2 to produce methanol.
MEA based post-combustion CO2capture: We assume that CO2 is captured using a post-capture monoethanolamine (MEA) based system as it has a high (⩾90%) carbon capture efficiency [27,28,70], is capable of capturing CO2 from dilute concentrations [71], can be retrofitted to existing power plants, is the most commercially mature technology [72,73] and is more widely deployed than pre-combustion and oxy-fuel systems [70]. We consider CO2 capture from power plants as it accounts for 28% of the overall CO2 emissions in the U.S [74] and is therefore a good candidate for carbon capture. For a detailed explanation of the physical principles of the capture of CO2 using MEA, the reader can refer Rao and Rubin [28] and van der Giesen et al. [31]. The inventory re-quirements for capture and compression of CO2 was collected from 21 studies [27–47] (section S3 SI) and is summarized in Fig. 1.
H2generation: Over 95% of the global hydrogen is produced from fossil fuels [75] and research and development efforts are currently investigating alternate renewable energy pathways, which are less car-bon intensive [76]. We consider H2 production through the electrolysis of water using RE sources (wind and photovoltaics) as it accounts for 4% of the globally produced H2 [75] and is currently the only commercially viable, environmentally benign alternative to H2 produced from fossil fuels [18]. We assume that the electrolysis is conducted in an alkaline electrolysis cell as it is the most widely deployed water electrolysis technology [48,65,66,77]. The inventory required for H2 generation from water electrolysis was collected from 22 studies (section S4 in the SI) [11,16–18,30,48–64] and is summarized in Fig. 1.
The inventory requirements for photovoltaic (PV) electricity required for electrolysis of water is based on a profile for a 570 kWp utility-scale plant and includes the modules, balance of systems, inver-tors, and transformers. Wind electricity is based on a profile for a 4.5 MW wind turbine. Further details are provided in section S9 in the SI.
CO2and H2transportation: We model the transportation of CO2 and H2 based on pipelines, which are widely used [78–80] and economically
preferable to alternatives [70,81,82]. CO2 is compressed to a pressure of 110 bar (greater than the critical pressure of 73.8 MPa [83,84]) to ensure the transportation is in a super-critical state and avoid a two- phase flow [29,84]. H2 is assumed to be compressed to 110 bar, which ensures transportation in a liquefied state and is consistent with values reported in literature in the range of 69–100 bar [18,85,86]. The transportation distance for H2 and CO2 is assumed to be 200 km and the pressure drop from transportation of H2 and CO2 is 0.12 [85] and 0.1 bar/km [29], respectively. Therefore, we assume that there is no recompression of H2 or CO2 as the pressure after 200 km of trans-portation is 85 and 86 bar, which is higher than 80 bar required for hydrogenation of CO2 to produce CCU methanol [15,30,67]. Further details on the inventory required for CO2 and H2 compression and pipelines are presented in S5, S6, S7 and S8 in the SI.
Methanol production from hydrogenating CO2: CCU methanol is produced through the catalytic hydrogenation of captured CO2. In the presence of catalysts (Cu/ZnO/Al2O3), CO2 reacts with H2 to form methanol at a pressure of 50–100 bar, a temperature of 210–270 ◦C and the H2:CO2 molar ratio of 3:1 [11,15,18,65,87]. The methanol that is produced is separated from water and residual gases and purified through distillation [11]. Detailed descriptions of the chemical and the physical principles and the reaction mechanism for methanol generation from hydrogenation of CO2 are available in the literature [11,65]. We determined the inventory required for methanol generation from hy-drogenation of CO2 from 15 studies [11,15–18,30,49,50,62,64–69]. The inventory requirements are summarized in Fig. 1 and further detailed in section S2 in the SI.
2.2. System boundary
The system boundary to determine the net CO2 impact of CCU methanol is depicted in Fig. 2 and includes two functionally equivalent systems – (i) CCU methanol production (upper dashed box) and elec-tricity generation with carbon capture and (ii) conventional methanol production from natural gas (lower dashed box) and electricity gener-ation without CO2 capture.
The processes contributing to the overall CO2 emissions from CCU methanol systems includes the capture, compression and transportation of CO2, generation, compression and transportation of H2, hydrogena-tion of CO2 to produce methanol, and the CO2 that is not captured when
Fig. 1. Inventory requirement for CCU methanol production. Further details in sections S2 to S8 in the SI.
D. Ravikumar et al.

Applied Energy 279 (2020) 115770
4
electricity is generated (typically 10% for MEA-based capture process). The energy penalty and the CO2 flows for external and internal
compensation are depicted in red and green, respectively.
2.3. Functional unit
To enable a functionally equivalent comparison between the CCU and conventional methanol system, this study uses a functional unit of 1 ton of methanol and Elecp kWh of electricity, which has a mean value of 927 kWh (SI Table S15). This helps quantify the CO2 impact when 1 ton
of CCU methanol offsets 1 ton of conventional methanol produced from natural gas. In the CCU methanol system, Elecp is the electricity gener-ated to compensate for the energy penalty which is incurred when CO2 required to produce 1 ton of CCU methanol is captured from a power plant. Correspondingly, in the conventional methanol system, we ac-count for an equal magnitude of electricity (Elecwithout_cap), which is generated without CO2 capture from a fossil fuel power plant.
2.4. Determining the life cycle CO2 impact from the inventory requirement
We use the LCA software package SimaPro [88] to determine the life cycle CO2 impact of the inventory required for the key processes described in the above mentioned sections. In SimaPro, we use the global warming mid-point impact category in the TRACI [89] impact assessment method to determine the CO2 impact from the inventory requirements (explained in the sections below).
CO2Emissions from CCU Methanol (CO2_CCU_MeOH): CO2_C-CU_MeOH is determined from Eq. (1)
CO2emissions from CCU methanol production (CO2_CCU_-MeOH_Gen): CO2_CCU_MeOH_Gen is determined from the life cycle inventory required to produce 1 ton of CCU methanol through the hy-drogenation of captured CO2 (Table S2 SI). In SimaPro, the inventory is characterized for global warming impact in the TRACI [89] impact assessment method. CO2_CCU_MeOH_Gen is determined to be 20.2 kg CO2/ton CCU methanol (Section S2 SI).
CO2emissions from capture, compression and transportation of CO2(CO2_CCT): CO2_CCT is determined from the life cycle inventory
Fig. 2. System boundary to determine the net CO2 emissions when methanol is produced through carbon capture and utilization (CCU). The upper dashed box depicts the processes and CO2 emissions for CCU methanol production. The energy penalty from CO2 capture (Elecp) can either be compensated from an external source (in red) or internally (in green). The energy and material requirements for CCU methanol production are presented in Fig. 1 and Sections S2, S3, and S4 of the SI. The lower dashed box depicts the processes and CO2 emissions for a functionally equivalent system consisting of conventional methanol production and electricity generation without CO2 capture. Elecwe, which was used for CCU methanol production, is instead supplied to the grid in the lower box and results in the EOC. Units: Electricity flows in kWh/ton methanol, CO2 flows in kg/ton methanol.
CO2 CCU MeOH = CO2 CCU MeOH Gen+CO2 CCT+CO2 H2GCT+CO2 Not Cap+CO2 Infra+CO2 Elecp (1)
D. Ravikumar et al.

Applied Energy 279 (2020) 115770
5
required to capture, compress and transport the CO2 feedstock required to produce 1 ton of CCU methanol (Section S3 SI). In SimaPro, the life cycle inventory is characterized for the global warming impact in the TRACI [89] impact assessment method. CO2_CCT is determined to be 51, 70 and 122 kg/ton CCU methanol when CO2 is captured from a com-bined cycle natural gas, natural gas and coal plant, respectively (Section S3 SI).
CO2emissions from generation, compression and transportation of H2(CO2_H2GCT): CO2_H2GCT is determined from the life cycle in-ventory required to capture, compress and transport the H2 feedstock required to produce 1 ton of CCU methanol (Section S4 SI). In SimaPro, the inventory is characterized for the global warming impact in the TRACI [89] impact assessment method. CO2_H2GCT has a value of 6940, 691 and 383 kg/ton CCU methanol when grid, PV and wind electricity is used to electrolyze water, respectively (Section S4 SI).
CO2not captured (CO2_Not_Cap): Typically 90% of the CO2 emis-sions from the power plant is captured by the post-combustion MEA system [27,28,70] and this corresponds to the CO2 feedstock required to produce 1 ton of CCU methanol. The remaining 10% of CO2 (CO2_N-ot_Cap), which is not captured, is included as a part of the overall CO2 emissions from the CCU methanol production system. CO2_Not_Cap has a value of 162 kg/ton CCU methanol (Section S16 SI).
CO2emissions from infrastructure requirements (CO2_Infra): The infrastructure includes the pipelines for CO2 and H2 transportation [29,85], and the compressors for CO2 and H2. CO2_Infra is determined in SimaPro to be equal to 4.1 kg CO2/ton methanol (section S17 SI).
CO2emissions from the energy penalty (CO2_Elecp): When Elecp is compensated externally, we follow the LCA standards proposed by the National Energy Technology Laboratory (NETL) [90] to determine CO2_Elecp. The standards recommend that the electricity penalty of CO2 capture is compensated by an external electricity source, which is representative of the average grid-mix of the region [90]. As the analysis is conducted for the US, the energy penalty (Elecp) will be compensated by an external electricity source with a CO2 intensity of 499 g/kWh, which is representative of the US national average grid mix in 2020 [90]. For external compensation, Elecp is 927 kWh/ton methanol (Table S13 SI) and the CO2 emissions from generating Elecp (CO2_Elecp) is 463 kg CO2/ton methanol (Table S12 SI).
When Elecp is compensated internally, only 10% of the CO2 from generating Elecp is emitted as the power plant operates with carbon capture. For internal compensation, the values for Elecp is the same as in external compensation. CO2_Elecp is 43, 62 and 111 kg CO2/ton meth-anol when the energy penalty is incurred in a combined cycle natural gas, natural gas and coal plant, respectively (Table S12 SI).
CO2emissions in the Conventional Methanol Pathway (CO2_Conv_MeOH): CO2_Conv_MeOH is determined from Eq. (2)
CO2emissions from conventional methanol generation (CO2_Conv_MeOH_Gen): The conventional pathway of producing methanol from natural gas is commercially established and mature [91,92]. The life cycle inventory dataset representing the industrial scale production of conventional methanol, which is used to determine CO2_Conv_MeOH_Gen, is obtained from the SimaPro database (Table S11 SI). By characterizing the SimaPro dataset for the global warming impact category, CO2_Conv_MeOH_Gen is determined to be 555 kg/ton methanol (Section S10 SI) [93].
CO2emissions from electricity generation without CO2capture (CO2_Elecwithout_cap): In the conventional methanol system,
Elecwithout_cap is produced along with 1 ton of methanol. Elecwithout_cap facilitates a consistent comparison as an equal magnitude of electricity (Elecp i.e. the energy penalty) is accounted for as an output along with 1 ton of methanol in the CCU methanol pathway. CO2_Elecwithout_cap has a value of 426, 621 and 1158 kg CO2/ton methanol when Elecwithout_cap is generated from combined cycle natural gas, natural gas and coal power plants, respectively (Section S14 of the SI).
Environmental opportunity cost (CO2_Opp_Cost): By convention, the EOC is subtracted as it represents the CO2 avoided when RE, which was used to generate hydrogen required for producing 1 ton of CCU methanol (Elecwe), is instead supplied to the grid to offset fossil-fuel electricity. CO2_Opp_Cost is quantified as the product of Elecwe and the difference between the CO2 intensity of the grid (CO2_Elecgrid) and RE source (CO2_Elecwe).
CO2 Opp Cost = Elecwe ×(
CO2 Elecgrid − CO2 Elecwe
)(3)
CO2_Opp_Cost is 6240 and 6540 kg CO2/ton methanol when PV and wind electricity is used for electrolysis of water, respectively (Section S15 SI).
2.5. Net CO2 emissions from CCU methanol
The net CO2 emissions from CCU methanol production (net_CO2_E-mission) is the difference between the CO2 emissions from CCU meth-anol production (CO2_CCU_MeOH from Eq. (1)) and the CO2 emissions from conventional methanol production (CO2_Conv_MeOH from Eq. (2)), which is offset by the CCU methanol
net CO2 Emission = CO2 CCU MeOH − CO2 Conv MeOH (4)
If net_CO2_Emission is negative, then the CO2 avoided by using RE for CCU methanol production is greater than the CO2 avoided by supplying RE to the grid. Conversely, if net_CO2_Emission is positive then sup-plying RE to the grid avoids a greater amount of CO2 offset than when used for CCU methanol production.
For example, consider a scenario where producing 1 ton of CCU methanol using RE emits 1010 kg CO2 (Scenario 6 Fig. 3). A functionally equivalent alternative to CCU methanol production is the production of 1 ton of conventional methanol with emissions of 1170 kg CO2 and the supply of RE to the grid to produce an offset of 6240 kg CO2. In this scenario, the net CO2 emitted is 6180 kg/ton methanol (i.e. 1010- (1170–6240)). The positive value shows that the CO2 benefit from supplying RE to the grid is greater than use of RE for CCU methanol production by 6180 kg. This is despite CCU methanol offsetting more carbon-intensive conventional methanol.
2.6. Scenario analysis to explore the variation in the net CO2 emissions from CCU methanol
The net CO2 emissions from CCU methanol is impacted by the source from which CO2 is captured, the source of electricity used to electrolyze water, and the source used to compensate for the energy penalty of CO2 capture. For example, the CO2 emissions from electricity without CO2 capture in the conventional methanol pathway (CO2_Elecwithout_cap in lower dashed box in Fig. 2) will be higher when CO2 is captured from a coal than a combined cycle natural gas plant as coal electricity is more CO2 intensive than a combined cycle plant. Similarly, the CO2 emissions from water electrolysis will depend when grid electricity, photovoltaics (PV) or wind is used as each electricity source has a different life cycle
CO2 Conv MeOH = CO2 Conv MeOH Gen+CO2 ElecWithout Cap − CO2 Opp Cost (2)
D. Ravikumar et al.

Applied Energy 279 (2020) 115770
6
CO2 footprint. Furthermore, the net CO2 emissions will change depending on whether the energy penalty is compensated externally or internally.
We perform a scenario analysis to determine the sensitivity of the net CO2 emissions from CCU methanol to the above-mentioned parameters. We explore 14 scenarios (Table 1) based on
(i) Three sources from which CO2 is captured –Fossil fuel power plants are favorable candidates for CO2 capture as the electricity sector accounts 34% of the total greenhouse gas emissions in the USA and coal and natural gas plants account for 98% percent of the CO2 emissions from the electricity sector [94]. We consider a coal power plant, a conventional natural gas power plant or a combined cycle natural gas power plant for carbon capture.
(ii) Three sources of electricity - the grid, wind and PV - for water electrolysis and hydrogenation of CO2. We consider wind as it is the largest RE source in the USA and has a low GHG footprint [95] and, therefore, reduce the CO2 burden of electrolyzing water. We
include PV as it is the fastest growing source of RE along with wind [96] and has shown a 72% reduction in the cost of elec-tricity generation at a utility scale from 2010 [97], which makes it economically attractive for water electrolysis. We consider two grid-based scenarios to compare the net CO2 emissions when CCU methanol is produced using renewable and grid electricity.
(iii) Two sources for compensating for the energy penalty – we explore scenarios where the energy penalty is compensated externally or internally.
The net CO2 emissions is determined using Eq. (4) for each of the 14 scenarios.
2.7. Net CO2 emissions from CCU methanol at thermodynamic limit and minimal environmental opportunity cost
The net CO2 emissions from CCU methanol can be minimized by decreasing the CO2 emissions from CCU methanol production and the
Fig. 3. Contributors to the net CO2 emissions from CCU and conventional methanol production when grid (scenarios 1 to 2) and PV electricity (scenarios 3 to 8) is used for water electrolysis. The positive values represent CO2 emissions and negative values represent avoided CO2 emissions. Tabulated values present the net CO2 emitted when 1 ton of CCU methanol offsets 1 ton of conventional methanol and the EOC of PV electricity is accounted and not accounted for. Circled numbers represent the scenarios in Table 1. *RE is not used in scenarios 1 and 2 as CCU methanol is produced using grid electricity. As a result, the EOC is zero in scenarios 1 and 2.
D. Ravikumar et al.
Applied Energy 279 (2020) 115770
7
EOC of using renewable energy for water electrolysis (Eq. (4)). To determine the minimum possible CO2 emissions, we quantify the net_-CO2_Emission when CCU methanol is produced at the thermodynamic limit and the EOC of using RE to produce CCU methanol is zero.
Thermodynamic limit of CCU methanol production: The ther-modynamic limit of CO2 capture, water electrolysis, CO2 and H2 compression and hydrogenation of CO2, which are the key processes for producing CCU methanol, are presented in Table 2.
This analysis models CO2 capture at the thermodynamic limit through the minimum work required to separate CO2. The minimum work to separate CO2 at 90% efficiency at a concentration of 12% in flue gas is 43.8 kWh/ton CO2 [101,102].
Technical improvements for the water electrolysis can be achieved through efficiency improvements in wind and solar PV systems and the electrolysis process to produce hydrogen. We model the thermodynamic limit by assuming the crystalline Si PV module operates at the Shockley- Queisser limit of 30% [98], which is the maximum possible efficiency of crystalline Si modules, and the wind turbine operates at the maximum possible Betz limit of 59% [99]. The minimum energy required to generate H2 through water electrolysis is 39.4 kWh/kg H2 [100].
We assume isothermal compression under ideal conditions to determine the energy required to compress CO2 and H2 to 110 bar at the thermodynamic limit, which is 66.5 and 1,455 kWh/ton of CO2 and H2, respectively (SI Section S12). This analysis assumes that the capture of CO2 and the generation of H2 occurs at the site where methanol is produced through the hydrogenation of the captured CO2. As a result, at the thermodynamic limit, we assume that there is no pipeline infra-structure required to transport CO2 and H2 to the site of CCU methanol production.
At the thermodynamic limit, the CO2 and H2 required to hydrogenate CO2 and produce methanol is determined from the stoichiometry of the reaction. Therefore, to produce 1 ton of CCU methanol, 1.37 tons and 0.187 tons of CO2 and H2 are required [18]. As the reaction is exothermic [18], we assume no energy is required under ideal ther-modynamic conditions.
Minimizing the environmental opportunity cost: The EOC of using RE for CCU methanol decreases if the CO2 intensity of the grid decreases (CO2_Elecgrid in Eq. (3)) and the resulting CO2 emissions offset by RE on the grid decreases. This analysis determines the threshold value of the CO2 intensity of the grid electricity (CO2_Grid_ Thresh) at which the EOC of utilizing RE for CCU methanol is zero. At this threshold value, the CO2 avoided by using RE to produce CCU methanol is equal to the CO2 avoided by supplying RE to the grid.
Therefore, when CO2_Elecgrid equals CO2_Grid_Thresh
CO2 CCU MeOH − CO2 Conv MeOH = CO2 Opp Cost (5)
If the grid CO2 intensity exceeds the threshold, then it is environmen-tally favorable to supply the RE to the grid. Alternately, if the grid CO2 intensity is lower than the threshold, it is environmentally favorable to utilize the RE for CCU methanol production.
3. Results and discussion
3.1. Net CO2 emissions from CCU methanol production – contribution analysis
When the EOC is not accounted for, the net CO2 emissions is the difference between the positive values of emissions from CCU and conventional methanol production. For example, when 1 ton of CCU methanol offsets 1 ton of conventional methanol in scenario 6, the net CO2 emitted is − 160 kg (inset table Fig. 3). The negative value indicates that CCU methanol offsetting conventional methanol avoids the emis-sion of 160 kg of CO2. When the EOC is not considered, the CO2 emis-sions from CCU methanol production is greater or comparable to conventional methanol production in 6 out of the 14 scenarios (sce-narios 1, 2, 3, 4 and 5 in and scenario 9 in Figure S1 in SI). This is pri-marily due to the CO2 emissions from hydrogen generation (CO2_H2GCT) and the energy penalty of carbon capture (CO2_Elecp).
The inset table in Fig. 3 also presents the net CO2 emissions when the EOC is accounted for. For example, in scenario 6 there is an opportunity to reduce net emissions by 6080 kg by supplying RE to the grid rather than manufacturing CCU methanol, which accounts for the difference between the CO2 emitted from producing CCU methanol (+1010 kg) and
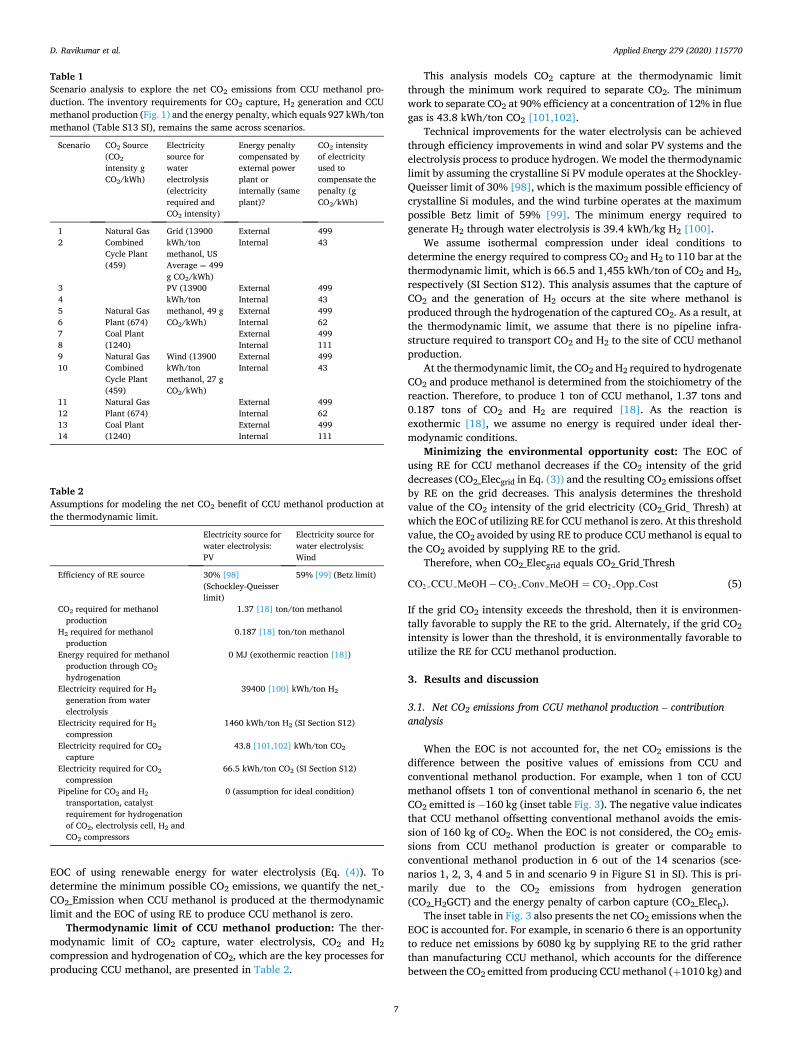
Table 1 Scenario analysis to explore the net CO2 emissions from CCU methanol pro-duction. The inventory requirements for CO2 capture, H2 generation and CCU methanol production (Fig. 1) and the energy penalty, which equals 927 kWh/ton methanol (Table S13 SI), remains the same across scenarios.
Scenario CO2 Source (CO2
intensity g CO2/kWh)
Electricity source for water electrolysis (electricity required and CO2 intensity)
Energy penalty compensated by external power plant or internally (same plant)?
CO2 intensity of electricity used to compensate the penalty (g CO2/kWh)
1 Natural Gas Combined Cycle Plant (459)
Grid (13900 kWh/ton methanol, US Average = 499 g CO2/kWh)
External 499 2 Internal 43
3 PV (13900 kWh/ton methanol, 49 g CO2/kWh)
External 499 4 Internal 43 5 Natural Gas
Plant (674) External 499
6 Internal 62 7 Coal Plant
(1240) External 499
8 Internal 111 9 Natural Gas
Combined Cycle Plant (459)
Wind (13900 kWh/ton methanol, 27 g CO2/kWh)
External 499 10 Internal 43
11 Natural Gas Plant (674)
External 499 12 Internal 62 13 Coal Plant
(1240) External 499
14 Internal 111
Table 2 Assumptions for modeling the net CO2 benefit of CCU methanol production at the thermodynamic limit.
Electricity source for water electrolysis: PV
Electricity source for water electrolysis: Wind
Efficiency of RE source 30% [98] (Schockley-Queisser limit)
59% [99] (Betz limit)
CO2 required for methanol production
1.37 [18] ton/ton methanol
H2 required for methanol production
0.187 [18] ton/ton methanol
Energy required for methanol production through CO2
hydrogenation
0 MJ (exothermic reaction [18])
Electricity required for H2
generation from water electrolysis
39400 [100] kWh/ton H2
Electricity required for H2
compression 1460 kWh/ton H2 (SI Section S12)
Electricity required for CO2
capture 43.8 [101,102] kWh/ton CO2
Electricity required for CO2
compression 66.5 kWh/ton CO2 (SI Section S12)
Pipeline for CO2 and H2
transportation, catalyst requirement for hydrogenation of CO2, electrolysis cell, H2 and CO2 compressors
0 (assumption for ideal condition)
D. Ravikumar et al.

Applied Energy 279 (2020) 115770
8
the CO2 emitted from producing conventional methanol (+1170 kg) and the EOC (-6240 kg). Despite being less carbon-intensive than conven-tional methanol production, CCU methanol production forgoes an op-portunity to avoid a greater amount of CO2 by supplying RE to the grid in the remaining 8 scenarios (scenarios 6 to 8 in Fig. 3 and scenarios 10 to 14 in Figure S1 in SI).
The results demonstrate the importance of including the EOC and the energy penalty of CO2 capture when determining the net CO2 impact of CCU methanol, which is not accounted for in existing literature [8,11,15,17]. It is important to note that the EOC is determined based on the average CO2 intensity of the US grid (CO2_Elecgrid = 499 g CO2/kWh in Eq. (3)). Fig. 5 explores the sensitivity of the EOC to the grid CO2 intensity. As a result, we determine if it is better to use RE for CCU methanol production or on the grid at different CO2 footprints of grid electricity.
Scenarios 1 and 2 show that when grid electricity is used, the CO2 footprint of CCU methanol is around 7 times that of conventional methanol, which is primarily due to the CO2 emissions from H2 gener-ation. A 7 time increase in the CO2 footprint is in contrast to a previous study by Perez-Fortes et al. [15] which reported that CCU methanol is less CO2 intensive than conventional methanol. However, the system boundary used in Perez-Fortes et al. did not account for the CO2 impact of CO2 capture and H2 generation. A subsequent expansion in the system boundary to account for CO2 impact of CO2 capture and H2 generation
makes the CO2 impact of CCU and conventional methanol obtained from Perez-Fortes et al. similar to that reported in this study (SI Section S18). The change in results of Perez-Fortes et al. study with an expansion of the system boundary further emphasizes the need to account for the broader life cycle CO2 emissions from the upstream processes of CO2 capture and H2 generation when quantifying the net CO2 impact of CCU methanol.
The results do not change based on the downstream application in which CCU methanol is used as CCU methanol will essentially be off-setting conventional methanol. For example, consider a scenario where CCU methanol can potentially offset conventional methanol which is being used as transportation fuel. The CO2 trade-off between the two types of methanol is quantified by the “Env opp cost accounted” row in the inset table in Fig. 3, which clearly shows that replacing conventional with CCU methanol in the transportation fuel will produce a net increase in CO2 emission (e.g. 6080 kg CO2/ton methanol in scenario 6 in Fig. 3). Alternately, conventional methanol will have a lower CO2 burden than CCU methanol in any downstream application when the EOC of RE use is accounted for.
The EOC assumes that RE used for CCU methanol production results is supplied to the grid. However, a certain portion of the generated RE is curtailed and not supplied to the grid [103–105]. In this scenario, using the curtailed RE to produce CCU methanol will not incur an EOC. For example, in scenario 6 in Fig. 3, CCU methanol offsetting conventional
Fig. 4. Solid bars represent CO2 emissions from CCU methanol production when grid (scenarios 1 to 2) and PV electricity (scenarios 3 to 8) is used for water electrolysis. Dashed bars represent CO2 impact of producing conventional methanol and supplying PV electricity to the grid. Tabulated values present the range of the net CO2 emitted when 1 ton of CCU methanol offsets 1 ton of conventional methanol and the EOC of PV electricity is accounted for. The circled numbers correspond to the scenarios in Table 1. Positive values represent CO2 emissions and negative values represent avoided CO2 emissions. *RE is not used in scenarios 1 and 2 as CCU methanol is produced using grid electricity. As a result, the EOC is zero in scenarios 1 and 2.
D. Ravikumar et al.

Applied Energy 279 (2020) 115770
9
methanol avoids 160 kg of CO2 but incurs an EOC of 6080 kg CO2. Therefore, CCU methanol production is environmentally preferable to conventional methanol only when there is a 97% or greater reduction in the EOC (6080 to 160 kg CO2). Alternately, CCU methanol will have a lower CO2 impact than conventional methanol if a minimum of 97% of the overall RE used for CCU methanol production is curtailed electricity. However, such high curtailment rates are very unlikely as curtailment rates have been reducing and are around 1 to 15% in the U.S [103–105].
The values in the inset table in Fig. 3 demonstrate that the net CO2 emitted is lower when CO2 is captured from coal plants than combined cycle or conventional natural gas plants. This is because CCU methanol production offsets electricity that is generated without CO2 capture (CO2_Elecwithout_cap in Figs. 2 and 3). Offsetting coal electricity without CO2 capture prevents an emission of 1240 g CO2/kWh, which is greater than 459 or 674 g CO2/kWh of emissions prevented by offsetting com-bined cycle or conventional natural gas electricity without CO2 capture, respectively (SI Section S9). The results provide the rationale to maxi-mize the net CO2 benefit of CCU methanol by ranking power plants for CO2 capture based by fuel type. The highest priority for CO2 capture should be assigned to coal plants followed by conventional and com-bined cycle plants.
The CO2 burdens of the energy penalty of CO2 capture, the methanol production from CO2 and H2, and the infrastructure requirements (H2 and CO2 air compressors, H2 and CO2 pipeline, water electrolysis cell) are negligible.
3.2. Net CO2 emissions from CCU methanol production – uncertainty analysis
The values in the inset table in Fig. 4 represent the upper and lower
bound of the difference between the CO2 emissions from CCU and conventional methanol. The variation is due to the uncertainty in the life cycle inventory requirements for CCU methanol production, the source from which CO2 is captured and the choice of the electricity source used for compensating for the energy penalty. Despite this uncertainty, the positive values of the upper and lower bounds show that when the EOC is accounted for, the CO2 avoided by supplying PV electricity to the grid is greater than the CO2 avoided from producing CCU methanol by +700 to +11960 kg/ton methanol (inset table in Fig. 4). Similarly, when wind electricity is used, the results are +660 to +11525 kg CO2/ton methanol (SI Section S11).
3.3. Environmental opportunity cost and net CO2 emissions from CCU methanol at the thermodynamic limit
By quantifying the EOC, the results in Fig. 5 determines if the CO2 avoided by using RE to produce CCU methanol is greater than the sup-plying RE to the grid for varying CO2 intensities of the grid electricity (y- axis). The results are bounded between the baseline and the thermo-dynamic limit of CCU methanol production, which are represented on the left and right extreme of the x-axis, respectively. In the green region, the CO2 avoided by using RE for CCU methanol production is greater than the CO2 avoided by supplying RE to the grid (i.e. EOC is negative). In the brown region, the CO2 avoided by supplying RE to the grid is greater than the CO2 avoided by using RE for CCU methanol production (i.e. EOC is positive). To contextualize the results, we include the current and projected (2050) grid CO2 intensities of the eight North American Electric Reliability Corporation (NERC) reliability regions in plots (a) and plot (b), respectively.
At the threshold grid CO2 intensity value of 67 g CO2/kWh, the CO2
Fig. 5. (a) The y-axis represents the grid CO2 intensity and the x-axis simulates technology improvement in the CCU methanol from the current baseline state (left extreme) to the thermodynamic limit (right extreme). It is environmentally preferable to use PV/wind electricity to produce CCU methanol in the green region and supply PV/wind electricity to the grid in the brown region. The horizontal dashed white lines represent the CO2 intensities of the eight NERC reliability regions in 2020 (b) Plot (b) is similar to plot (a) with the only difference being the dashed white lines, which represent the projected CO2 intensities of the eight NERC reliability regions in 2050. RF - Reliability First, MRO - Midwest Reliability Organization, SPP – Southwest Power Pool, SERC – SERC Reliability Corporation, FRCC – Florida Reliability Coordinating Council, TRE – Texas Reliability Entity, WECC – Western Electricity Coordination Council, NPCC – Northeast Power Coordinating Council.
D. Ravikumar et al.

Applied Energy 279 (2020) 115770
10
avoided by using RE for CCU methanol production equals the CO2 avoided by supplying RE to the grid (Eq. (5)). The CO2 intensity of the current US average grid and the eight NERC reliability regions are in the brown region of the graph (Fig. 5 (a)) and higher than 67 g CO2/kWh. Therefore, it is environmentally preferable to supply RE to the grid than use RE for CCU methanol production for the current grid condition in the US. Based on the projected CO2 intensity values of the grid in 2050 (Fig. 5 (b)), the results show that supplying RE to the grid will most likely continue to be environmentally preferable to using RE to produce CCU methanol.
More importantly, the results show that even if the CCU methanol production reaches thermodynamic limits (extreme right on x-axis), supplying RE to the US grid will continue to be the environmentally preferable in 2020 and 2050. This is because current and projected values for the CO2 intensity of the US average grid mix and the NERC reliability regions are in the brown region and are higher than the threshold values of 82 g CO2/kWh. The thermodynamic analysis shows that despite maximum possible improvements in the water electrolysis process, the EOC will continue to be the dominant factor in determining if RE should be used for CCU methanol production or be supplied to the grid.
4. Conclusion
This work quantifies the life cycle CO2 impact of offsetting the pro-duction of conventional methanol with CCU methanol across 14 sce-narios, which account for the (i) environmental opportunity cost of supplying RE to the grid (ii) two alternatives to compensate for the energy penalty of capturing CO2 – internal and external (iii) three sources for the captured CO2 – coal, natural gas and combined cycle natural gas plants and (iv) three sources of electricity – the grid, PV and wind. The LCA includes the key processes for CCU methanol production – capture of CO2 using post-combustion capture MEA systems, compression and transportation of CO2, generation of H2 through water electrolysis, compression and transportation of H2. Furthermore, the analysis accounts for the uncertainty in the material and energy in-ventory required to produce CCU methanol.
CCU methanol has a higher or a comparable CO2 footprint than conventional methanol in 6 out of the 14 scenarios primarily due to the CO2 emissions from H2 generation and compensating for the energy penalty of carbon capture. In the remaining 8 scenarios, the CO2 emis-sions from producing CCU methanol is lower than conventional meth-anol. Despite the uncertainty in the data, the findings show that the CO2 benefit from supplying RE to the grid is greater than utilizing RE for CCU methanol production across the 14 scenarios. Unless the CO2 intensity of the grid mix is lower than 67 g CO2/kWh, utilizing RE on the electricity grid will produce a greater CO2 benefit than in CCU methanol produc-tion. Similarly, the grid CO2 intensity should be lower than 82 g CO2/ kWh when the CCU methanol production system operates at thermo-dynamic limits, which is unlikely in the US before 2050. The results demonstrate the need to account for the broader systems-level CO2 impacts when transitioning to large-scale CCU pathways such as methanol.
CRediT authorship contribution statement
Dwarakanath Ravikumar: Conceptualization, Methodology, Soft-ware, Validation, Formal analysis, Data curation, Writing - original draft, Writing - review & editing. Gregory Keoleian: Conceptualization, Validation, Resources, Visualization, Writing - review & editing. Shelie Miller: Conceptualization, Validation, Resources, Visualization, Writing - review & editing.
Declaration of Competing Interest
The authors declare that they have no known competing financial
interests or personal relationships that could have appeared to influence the work reported in this paper.
Acknowledgement
The authors thank Dr. Volker Sick from the University of Michigan and Timothy J. Skone from the National Energy Technology Laboratory (NETL) for feedback, which improved the quality of the manuscript. This work was supported by the Global CO2 Initiative at the University of Michigan and the Blue Sky Program of the College of Engineering at the University of Michigan.
Appendix A. Supplementary material
Supplementary data associated with this article can be found, in the online version, at https://doi.org/10.1016/j.apenergy.2020.115770.
References
[1] Masson-Delmotte V, Zhai P, Portner H.-O, Roberts D, Skea J, Shukla PR, et al. Summary for Policymakers. In: Global Warming of 1.5C. An IPCC Special Report on the impacts of global warming of 1.5C above pre-industrial levels and related global greenhouse gas emission pathways, in the context of strengthening the global response to the threat of climate change, sustainable development, and efforts to eradicate poverty; 2018.
[2] Al-Mamoori A, Krishnamurthy A, Rownaghi AA, Rezaei F. Carbon capture and utilization update. Energy Technol 2017;5(6):834–49.
[3] The Global CO2 Initiative. Global Roadmap for Implementing CO2 Utilization. htt ps://assets.ctfassets.net/xg0gv1arhdr3/27vQZEvrxaQiQEAsGyoSQu/44ee 0b72ceb9231ec53ed180cb759614/CO2U_ICEF_Roadmap_FINAL_2016_12_07. pdf.
[4] International Energy Agency - Advanced Motor Fuels Program, Methanol. https://www.iea-amf.org/content/fuel_information/methanol#legislation.
[5] Dalena F, Senatore A, Marino A, Gordano A, Basile M, Basile A. Methanol production and applications: an overview. Methanol 2018:3–28.
[6] Mac Dowell N, Fennell PS, Shah N, Maitland GC. The role of CO2 capture and utilization in mitigating climate change. Nat Clim Change 2017;7(4):243–9.
[7] Ott JGV, Pontzen F, Fiedler E, Grossmann G, Kersebohm DB, Weiss G, et al. Methanol. Ullmann’s Encyclopedia of Industrial Chemistry; 2012.
[8] Jarvis SM, Samsatli S. Technologies and infrastructures underpinning future CO 2 value chains: A comprehensive review and comparative analysis. Renew Sustain Energy Rev 2018;85:46–68.
[9] Quadrelli EA, Centi G, Duplan JL, Perathoner S. Carbon dioxide recycling: emerging large-scale technologies with industrial potential. ChemSusChem 2011; 4(9):1194–215.
[10] National Academies of Sciences Engineering and Medicine, Gaseous Carbon Waste Streams Utilization: Status and Research Needs; 2019.
[11] Van-Dal ES, Bouallou C. Design and simulation of a methanol production plant from CO2 hydrogenation. J Clean Prod 2013;57:38–45.
[12] Gonzalez-Aparicio I, Kapetaki Z, Tzimas E. Wind energy and carbon dioxide utilisation as an alternative business model for energy producers: A case study in Spain. Appl Energy 2018;222:216–27.
[13] Bos MJ, Kersten SRA, Brilman DWF. Wind power to methanol: Renewable methanol production using electricity, electrolysis of water and CO2 air capture. Appl Energy 2020;264.
[14] Thonemann N, Pizzol M. Consequential life cycle assessment of carbon capture and utilization technologies within the chemical industry. Energy Environ Sci 2019;12(7):2253–63.
[15] Perez-Fortes M, Schoneberger JC, Boulamanti A, Tzimas E. Methanol synthesis using captured CO2 as raw material: Techno-economic and environmental assessment. Appl Energy 2016;161:718–32.
[16] Van-Dal ES, Bouallou C. CO2 abatement through a methanol production process. Chem Eng Trans 2012;29.
[17] Hoppe W, Thonemann N, Bringezu S. Life cycle assessment of carbon dioxide- based production of methane and methanol and derived polymers. J Ind Ecol 2018;22(2):327–40.
[18] Kauw M. Recycling of CO2, the perfect biofuel? University of Groningen; 2012. [19] Thonemann MAN. Environmental impacts of CO2-based chemical production: A
systematic literature review and meta-analysis. Appl Energy 2020;263. [20] Harkin T, Hoadley A, Hooper B. Reducing the energy penalty of CO2 capture and
compression using pinch analysis. J Clean Prod 2010;18(9):857–66. [21] House KZ, Harvey CF, Aziz MJ, Schrag DP. The energy penalty of post-
combustion CO2 capture & storage and its implications for retrofitting the U.S. installed base. Energy Environ Sci 2009;2:(2).
[22] Jenni KE, Baker ED, Nemet GF. Expert elicitations of energy penalties for carbon capture technologies. Int J Greenhouse Gas Control 2013;12:136–45.
[23] Supekar SD, Skerlos SJ. Reassessing the efficiency penalty from carbon capture in coal-fired power plants. Environ Sci Technol 2015;49(20):12576–84.
[24] Ravikumar D, Seager TP, Cucurachi S, Prado V, Mutel C. Novel method of sensitivity analysis improves the prioritization of research in anticipatory life
D. Ravikumar et al.

Applied Energy 279 (2020) 115770
11
cycle assessment of emerging technologies. Environ Sci Technol 2018;52(11): 6534–43.
[25] Bergerson JA, Brandt A, Cresko J, Carbajales-Dale M, MacLean HL, Matthews HS, et al. Life cycle assessment of emerging technologies: Evaluation techniques at different stages of market and technical maturity. J Ind Ecol 2019.
[26] Sick V, Armstrong K, Cooney G, Cremonese L, Eggleston A, Faber G, et al. The need for and path to harmonized life cycle assessment and techno-economic assessment for carbon dioxide capture and utilization. Energy Technol 2019. 1901034.
[27] Koornneef J, van Keulen T, Faaij A, Turkenburg W. Life cycle assessment of a pulverized coal power plant with post-combustion capture, transport and storage of CO2. Int J Greenhouse Gas Control 2008;2(4):448–67.
[28] Rao AB, Rubin ES. A technical, economic, and environmental assessment of amine-based CO2 capture technology for power plant greenhouse gas control. Environ Sci Technol 2002;36(20):4467–75.
[29] Singh B, Strømman AH, Hertwich E. Life cycle assessment of natural gas combined cycle power plant with post-combustion carbon capture, transport and storage. Int J Greenhouse Gas Control 2011;5(3):457–66.
[30] Bellotti D, Rivarolo M, Magistri L, Massardo AF. Feasibility study of methanol production plant from hydrogen and captured carbon dioxide. J CO2 Utilization 2017;21:132–8.
[31] van der Giesen C, Meinrenken CJ, Kleijn R, Sprecher B, Lackner KS, Kramer GJ. A life cycle assessment case study of coal-fired electricity generation with humidity swing direct air capture of CO2 versus MEA-based postcombustion capture. Environ Sci Technol 2017;51(2):1024–34.
[32] Koiwanit J, Piewkhaow L, Zhou Q, Manuilova A, Chan CW, Wilson M, et al. A life cycle assessment study of a Canadian post-combustion carbon dioxide capture process system. Int J Life Cycle Assess 2013;19(2):357–69.
[33] Boot-Handford ME, Abanades JC, Anthony EJ, Blunt MJ, Brandani S, Mac Dowell N, et al. Carbon capture and storage update. Energy Environ Sci 2014;7 (1):130–89.
[34] Metz B, Ogunlade D, De Coninck H, editors. Carbon dioxide capture and storage: special report of the intergovernmental panel on climate change. Cambridge University Press; 2005.
[35] National Energy Technology Laboratory, Carbon Dioxide Capture from Existing Coal-Fired Power Plants; 2007.
[36] Farla JC, Chris A. Hendriks, Blok, Kornelis carbon dioxide recovery from industrial processes. Clim Change 1995;29:439–61.
[37] Singh B, Strømman AH, Hertwich EG. Comparative life cycle environmental assessment of CCS technologies. Int J Greenhouse Gas Control 2011;5(4):911–21.
[38] Socolow RDM, Aines R, Blackstock J, Bolland O, Kaarsberg T, Lewis N, et al. Direct air capture of CO2 with chemicals: a technology assessment for the APS panel on public affairs. Am Phys Soc 2011.
[39] Schreiber A, Zapp P, Kuckshinrichs W. Environmental assessment of German electricity generation from coal-fired power plants with amine-based carbon capture. Int J Life Cycle Assess 2009;14(6):547–59.
[40] Singh B, Strømman AH, Hertwich EG. Environmental damage assessment of carbon capture and storage. J Ind Ecol 2012;16(3):407–19.
[41] IEA Greenhouse Gas R&D Programme. Improvement in Power Generation with Post-Combustion Capture of CO2; 2004.
[42] Volkart K, Bauer C, Boulet C. Life cycle assessment of carbon capture and storage in power generation and industry in Europe. Int J Greenhouse Gas Control 2013; 16:91–106.
[43] Pehnt M, Henkel J. Life cycle assessment of carbon dioxide capture and storage from lignite power plants. Int J Greenhouse Gas Control 2009;3(1):49–66.
[44] Fadeyi S, Arafat HA, Abu-Zahra MRM. Life cycle assessment of natural gas combined cycle integrated with CO2 post combustion capture using chemical solvent. Int J Greenhouse Gas Control 2013;19:441–52.
[45] Khoo HH, Tan RBH. Life cycle investigation of CO2 recovery and sequestration. Environ Sci Technol 2006;40(12):4016–24.
[46] Korre A, Nie Z, Durucan S. Life cycle modelling of fossil fuel power generation with post-combustion CO2 capture. Int J Greenhouse Gas Control 2010;4(2): 289–300.
[47] von der Assen N, Muller LJ, Steingrube A, Voll P, Bardow A. Selecting CO2 sources for CO2 utilization by environmental-merit-order curves. Environ Sci Technol 2016;50(3):1093–101.
[48] Ursua A, Gandia LM, Sanchis P. Hydrogen production from water electrolysis: current status and future trends. Proc IEEE 2012;100(2):410–26.
[49] Anicic B, Trop P, Goricanec D. Comparison between two methods of methanol production from carbon dioxide. Energy 2014;77:279–89.
[50] Sakamoto Y, Zhou W. Energy analysis of a CO2 recycling system. Int J Energy Res 2000;24(6):549–59.
[51] Maack M. Generation of the energy carrier HYDROGEN-In context with electricity buffering generation through fuel cells. http://www.needs-project.org/RS1a /RS1a%20D8.2%20Final%20report%20on%20hydrogen.pdf.
[52] Reiter G, Lindorfer J. Global warming potential of hydrogen and methane production from renewable electricity via power-to-gas technology. Int J Life Cycle Assess 2015;20(4):477–89.
[53] Aresta MCA, Dibenedetto A, Narracci M. Life Cycle Assessment (LCA) applied to the synthesis of methanol. comparison of the use of syngas with the use of CO2 and dihydrogen produced from renewables. In: Environmental challenges and greenhouse gas control for fossil fuel utilization in the 21st century; 2011, p 331–47.
[54] Dufour J, Serrano DP, Galvez JL, Gonzalez A, Soria E, Fierro JLG. Life cycle assessment of alternatives for hydrogen production from renewable and fossil sources. Int J Hydrogen Energy 2012;37(2):1173–83.
[55] Lombardi LCE, Corti A. Life cycle assessment of different hypotheses of hydrogen production for vehicle fuel cells fuelling. Int J Energy Environ Eng 2011;2(3): 63–78.
[56] Wulf C, Kaltschmitt M. Life cycle assessment of hydrogen supply chain with special attention on hydrogen refuelling stations. Int J Hydrogen Energy 2012;37 (21):16711–21.
[57] Koj JC, Schreiber A, Zapp P, Marcuello P. Life cycle assessment of improved high pressure alkaline electrolysis. Energy Procedia 2015;75:2871–7.
[58] Cetinkaya E, Dincer I, Naterer GF. Life cycle assessment of various hydrogen production methods. Int J Hydrogen Energy 2012;37(3):2071–80.
[59] Lee J-Y, An S, Cha K, Hur T. Life cycle environmental and economic analyses of a hydrogen station with wind energy. Int J Hydrogen Energy 2010;35(6):2213–25.
[60] Mori M, Jensterle M, Mrzljak T, Drobnic B. Life-cycle assessment of a hydrogen- based uninterruptible power supply system using renewable energy. Int J Life Cycle Assess 2014;19(11):1810–22.
[61] Valente A, Iribarren D, Dufour J, Spazzafumo G. Life-cycle performance of hydrogen as an energy management solution in hydropower plants: A case study in Central Italy. Int J Hydrogen Energy 2015;40(46):16660–72.
[62] The Global CO2 Initiative, Methanol Worked Examples for the TEA and LCA Guidelines for CO2 Utilization. https://hdl.handle.net/2027.42/147467.
[63] National Renewable Energy Laboratory, Technology Brief?: Analysis of Current- Day Commercial Electrolyzers. U.S. Department of Energy Office; 2004.
[64] Abanades JC, Rubin ES, Mazzotti M, Herzog HJ. On the climate change mitigation potential of CO2 conversion to fuels. Energy Environ Sci 2017;10(12):2491–9.
[65] Atsonios K, Panopoulos KD, Kakaras E. Investigation of technical and economic aspects for methanol production through CO 2 hydrogenation. Int J Hydrogen Energy 2016;41(4):2202–14.
[66] Kourkoumpas DS, Papadimou E, Atsonios K, Karellas S, Grammelis P, Kakaras E. Implementation of the Power to Methanol concept by using CO2 from lignite power plants: Techno-economic investigation. Int J Hydrogen Energy 2016;41 (38):16674–87.
[67] Szima S, Cormos C-C. Improving methanol synthesis from carbon-free H2 and captured CO2: A techno-economic and environmental evaluation. J CO2 Utilization 2018;24:555–63.
[68] Matzen M, Alhajji M, Demirel Y. Chemical storage of wind energy by renewable methanol production: Feasibility analysis using a multi-criteria decision matrix. Energy 2015;93:343–53.
[69] van der Ham LG, van den Berg H, Benneker A, Simmelink G, Timmer J, van Weerden S. Hydrogenation of carbon dioxide for methanol production. Chem Eng 2012;29.
[70] Leung DYC, Caramanna G, Maroto-Valer MM. An overview of current status of carbon dioxide capture and storage technologies. Renew Sustain Energy Rev 2014;39:426–43.
[71] Abu-Zahra MRM, Schneiders LHJ, Niederer JPM, Feron PHM, Versteeg GF. CO2 capture from power plants: part I. A parametric study of the technical performance based on monoethanolamine. Int J Greenhouse Gas Control 2007;1 (1):37–46.
[72] Lockwood T. A compararitive review of next-generation carbon capture technologies for coal-fired power plant. Energy Procedia 2017;114:2658–70.
[73] Luis P. Use of monoethanolamine (MEA) for CO2 capture in a global scenario: Consequences and alternatives. Desalination 2016;380:93–9.
[74] United States Environmental Protection Agency, Sources of Greenhouse Gas Emissions. https://www.epa.gov/ghgemissions/sources-greenhouse-gas-emission s.
[75] Bhandari R, Trudewind CA, Zapp P. Life cycle assessment of hydrogen production via electrolysis – a review. J Cleaner Prod 2014;85:151–63.
[76] Office of Energy Efficiency and Renewable Energy Hydrogen Production Pathways. https://www.energy.gov/eere/fuelcells/hydrogen-production-path ways.
[77] Schmidt O, Gambhir A, Staffell I, Hawkes A, Nelson J, Few S. Future cost and performance of water electrolysis: An expert elicitation study. Int J Hydrogen Energy 2017;42(52):30470–92.
[78] Heddle G, Herzog H, Klett M. The economics of CO2 storage. Massachusetts Institute of Technology, Laboratory for Energy and the Environment; 2003.
[79] Metz B, Davidson O, de Coninck HC, Loos M, Meye LA, editors. IPCC, 2005: IPCC Special Report on Carbon Dioxide Capture and Storage. Prepared by Working Group III of the Intergovernmental Panel on Climate Change. Cambridge, United Kingdom and NewYork, NY, USA: Cambridge University Press; 2013.
[80] Peletiri S, Rahmanian N, Mujtaba I. CO2 pipeline design: a review. Energies 2018; 11(9).
[81] Skovholt O. CO2 transportation system. Energy Convers Manage 1993;34(9–11): 1095–103.
[82] Gao L, Fang M, Li H, Hetland J. Cost analysis of CO2 transportation: Case study in China. Energy Procedia 2011;4:5974–81.
[83] Gusca J, Blumberga D. Simplified dynamic life cycle assessment model of CO2 compression, transportation and injection phase within carbon capture and storage. Energy Procedia 2011;4:2526–32.
[84] McCoy ST. The economics of CO2 transport by pipeline and storage in saline aquifers and oil reservoirs. Carnegie Mellon University; 2009.
[85] Wulf C, Reuß M, Grube T, Zapp P, Robinius M, Hake J-F, et al. Life Cycle Assessment of hydrogen transport and distribution options. J Cleaner Prod 2018; 199:431–43.
[86] Ramsden TRM, Diakov V, Laffen M, Timbario TA. Hydrogen pathways: updated cost, well-to-wheels energy use, and emissions for the current technology status of 10 hydrogen production, delivery, and distribution scenarios. National Renewable Energy Lab.(NREL); 2013.
D. Ravikumar et al.

Applied Energy 279 (2020) 115770
12
[87] Toyir J, Miloua R, Elkadri NE, Nawdali M, Toufik H, Miloua F, et al. Sustainable process for the production of methanol from CO2 and H2 using Cu/ZnO-based multicomponent catalyst. Phys Procedia 2009;2(3):1075–9.
[88] Consultants P. SimaPro version 8.0.3.14 http://www.pre-sustainability.co m/simapro.
[89] Bare J. TRACI 2.0: the tool for the reduction and assessment of chemical and other environmental impacts 2.0. Clean Technol Environ Policy 2011;13(5): 687–96.
[90] Skone TJ, Mutchek M, Krynock M, Cooney G, Pegallapati A, Rai S, et al. Carbon dioxide utilization life cycle analysis guidance for the U.S. carbon use and reuse program. National Energy Technology Laboratory; 2019.
[91] Sheldon D. Methanol production-a technical history. Johnson Matthey Technol Rev 2017;61(3):172–82.
[92] Ott JGV, Pontzen F, Fiedler E, Grossmann G, Kersebohm DB, Weiss G, et al. Methanol. Ullmann’s Encyclopedia Industrial Chemistry; 2000.
[93] Althaus H-JCM, Hischier R, Jungbluth N, Osses M, Primas A. Life cycle inventories of chemicals. Ecoinvent Report No. 8, v2.0. EMPA Dübendorf, Swiss Centre for Life Cycle Inventories, Dübendorf, CH, from www.ecoinvent.org; 2007.
[94] U.S. Energy Information Administration Energy and the Environment Explained: Where Greenhouse Gases Come From https://www.eia.gov/energyexplained/in dex.php?page=environment_where_ghg_come_from.
[95] National Renewable Energy Laboratory (NREL) Life Cycle Greenhouse Gas Emissions from Electricity Generation https://www.nrel.gov/docs/fy13osti/ 57187.pdf.
[96] U.S. Energy Information Administration EIA forecasts renewables will be fastest growing source of electricity generation https://www.eia.gov/todayinenergy/det ail.php?id=38053.
[97] U.S. Office of Energy Efficiency and Renewable Energy SunShot 2030. https:// www.energy.gov/eere/solar/sunshot-2030.
[98] Shockley W, Queisser HJ. Detailed balance limit of efficiency of p-n junction solar cells. J Appl Phys 1961;32(3):510–9.
[99] van Kuik GAM. The Lanchester–Betz–Joukowsky limit. Wind Energy 2007;10(3): 289–91.
[100] Merrill MD. Water electrolysis at the thermodynamic limit. Florida State University; 2007.
[101] Rochedo PRR, Szklo A. Designing learning curves for carbon capture based on chemical absorption according to the minimum work of separation. Appl Energy 2013;108:383–91.
[102] Socolow R, Desmond M, Aines R, Blackstock J, Bolland O, Kaarsberg T, et al. Direct air capture of CO 2 with chemicals: a technology assessment for the APS panel on public affairs. Am Phys Soc 2011.
[103] NREL. Reducing Wind Curtailment through Transmission Expansion in a Wind Vision Future; 2015.
[104] NREL. Wind and Solar Energy Curtailment: Experience and Practices in the United States; 2014.
[105] California Independent System Operator (CAISO) Managing oversupply. http://www.caiso.com/informed/Pages/ManagingOversupply.aspx.
D. Ravikumar et al.