THE ENVIRONMENTAL IMPACT OF DECENTRALISED GENERATION IN AN
19
WP EN2006-009 THE ENVIRONMENTAL IMPACT OF DECENTRALISED GENERATION IN AN OVERALL SYSTEM CONTEXT Dries Haeseldonckx William D’haeseleer TME WORKING PAPER - Energy and Environment Last update: June 08 An electronic version of the paper may be downloaded from the TME website: http://www.mech.kuleuven.be/tme/research/ KULeuven Energy Institute TME Branch
Transcript of THE ENVIRONMENTAL IMPACT OF DECENTRALISED GENERATION IN AN
WP EN2006-009
THE ENVIRONMENTAL IMPACT OF DECENTRALISED GENERATION IN AN OVERALL
SYSTEM CONTEXT
Dries Haeseldonckx William D’haeseleer
TME WORKING PAPER - Energy and Environment Last update: June 08
An electronic version of the paper may be downloaded from the TME website:
http://www.mech.kuleuven.be/tme/research/
KULeuven Energy Institute
TME Branch
1
THE ENVIRONMENTAL IMPACT OF DECENTRALISED GENERATION IN AN OVERALL SYSTEM CONTEXT
Dries Haeseldonckx William D’haeseleer1
University of Leuven – Division of Energy Conversion
K.U. Leuven, Belgium ABSTRACT Decentralised-generation technologies are very likely to play an important role in our future energy supply. The operational behaviour of several decentralised-generation technologies, as well as their interacton with the central power system, are being discussed and reviewed. The outcome of this analysis is then used to make correct judgements on the global environmental performance of the concept of embedded generation. In order to assess the environmental impact of a massive installation of decentralised-generation units, simulations are being performed using the code PROMIX, a very accurate model of the generation units presently existing (and anticipating those planned in the future) in Belgium. Finally, the simulation results are being discussed and some important conclusions about the environmental impact of decentralised generation can be drawn. 1. INTRODUCTION Power systems were originally developed in the form of local generation supplying local demand. The individual systems were being built and operated by independent companies. During the early years of development, this proved quite sufficient. However, it was soon recognised that an integrated system, planned and operated by a specific organisation, was needed to create an efficient system that was both reasonably secure and economic. This led to centrally located generation plants feeding the demand via transmission (high and very high voltage) and distribution (medium to low voltage). However, over the last few years, a number of influences have combined to lead to a profound change in the electricity system. The first one is the aim to reduce emissions, as agreed in Kyoto. Improving efficiency of electricity production using the same energy source, or changing to energy sources with a low or very low emission, will alter the type of production units, often including a substantial part of so-called “embedded” or “decentralised” production. The second influence stems from the ongoing process of liberalisation of the European energy market. The unbundled energy sector is now gaining experience with competition in electricity generation, supply and retail, while transport and distribution remain so-called natural monopolies. With free access to these transport and distribution networks and suitable energy wheeling conditions, new players will appear in the competitive market, further supporting the already existing trend towards more decentralised power generation, induced by the increasing integration of renewable energy sources and the introduction of biomass and natural-gas based combined heat and power. A more in-depth definition of the concept of decentralised generation can be found in [1]. The aim of this paper is to make correct judgements on the global environmental performance of the concept of embedded generation. Towards this end, it is necessary to consider the influence of the embedded-generation approach on, and the interaction with, the remaining central electricity-generation system. To a large extent, communities opting for the decentralised appraoch may receive 1 Corresponding author; E-mail: [email protected] ; tel.: +32-16-32-25-10; fax: +32-16-32-29-85.
2
the bulk of their electric power from local sources. However, in most cases, it may be expected that the communities will want to remain connected to the distribution grid that is fed by the central power system. This means that in those cases the central system acts as the back up for the decentralised configuration. A crucial aspect in this regard will be whether the envisaged type of decentralised generation will make investments in (new and usually highly-performing) central-generation capacity superfluous. The analysis in this paper partly relies on existing studies concerning the massive introduction of decentralised-generation technologies (i.e. small-scale cogeneration and wind turbines [2, 3]) and is completed with some new elements (i.e. biomass and photovoltaics). In order to assess the environmental impact of the massive installation of decentralised-generation units, simulations will be performed using the code PROMIX [4], a very accurate model of the generation units presently existing (and anticipating those planned in the future) in Belgium. Belgium has an interesting generation mix, existing of nuclear, coal and gas. Onto the existing input of the code, the embedded generation will be superimposed, and the centralised investments adjusted accordingly. Simulations are performed at the horizon of 2012. 2. GENERAL ISSUES ON DISTRIBUTED GENERATION Six different decentralised technologies are being considered in this study: residential and tertiary cogeneration facilities, biomass installations, wind turbines, photovoltaic units and hydropower installations. When assessing the impact of the massive introduction of these technologies with the system code PROMIX, two aspects are of the utmost importance, being the hourly generation profiles of those technologies, acting as an input for PROMIX, and the capacity credit of each technology. 2.1 Decentralised input profiles for PROMIX Each decentralised-generation input profile for PROMIX consists of 8,760 consecutive values, representing the electric energy generated during every hour of the year relative to the hourly maximum amount of electric energy that can be generated by the technology that is considered. As far as renewable technologies are concerned (wind, solar and hydropower), this profile is solely determined by the non-controllable renewable energy sources. For combined heat and power applications, the input profile is the outcome of a Combined Heat and Power (CHP)2 simulation programme as described in [5].
RESIDENTIAL AND TERTIARY COGENERATION In this study, the operational behaviour of a cogeneration facility, as well in the residential as in the tertiary3 sector, is assumed to be dictated by the hourly heat-demand profile. These heat-demand data have been measured and can be found in [6]. Furthermore, the following assumptions have been made: • For each situation (different heat-demand profile), the size of the cogeneration facility is
determined by means of the largest-rectangle method [7].
2 The words cogeneration and Combined Heat and Power (CHP) are used as synonyms. 3 In fact, the correct designation is ‘service and commercial’ sector but, for simplicity reasons, this is referred to as the ‘tertiary’ sector in this paper.
3
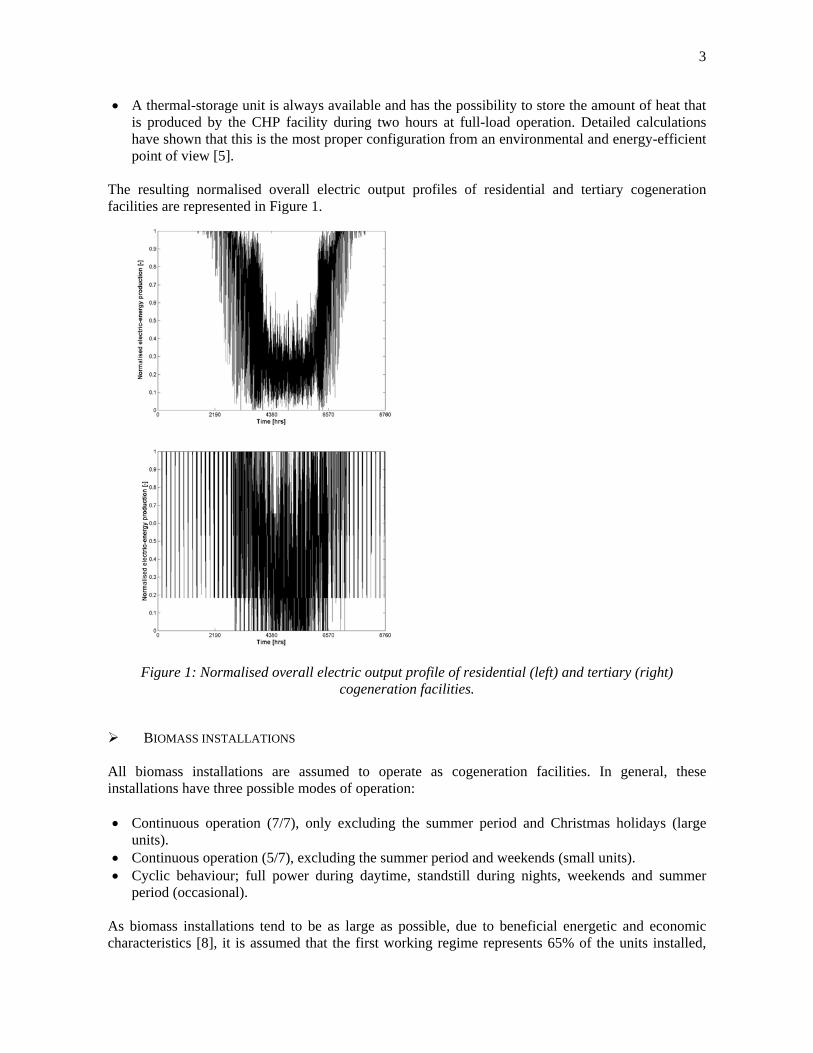
• A thermal-storage unit is always available and has the possibility to store the amount of heat that is produced by the CHP facility during two hours at full-load operation. Detailed calculations have shown that this is the most proper configuration from an environmental and energy-efficient point of view [5].
The resulting normalised overall electric output profiles of residential and tertiary cogeneration facilities are represented in Figure 1.
Figure 1: Normalised overall electric output profile of residential (left) and tertiary (right)
cogeneration facilities.
BIOMASS INSTALLATIONS All biomass installations are assumed to operate as cogeneration facilities. In general, these installations have three possible modes of operation: • Continuous operation (7/7), only excluding the summer period and Christmas holidays (large
units). • Continuous operation (5/7), excluding the summer period and weekends (small units). • Cyclic behaviour; full power during daytime, standstill during nights, weekends and summer
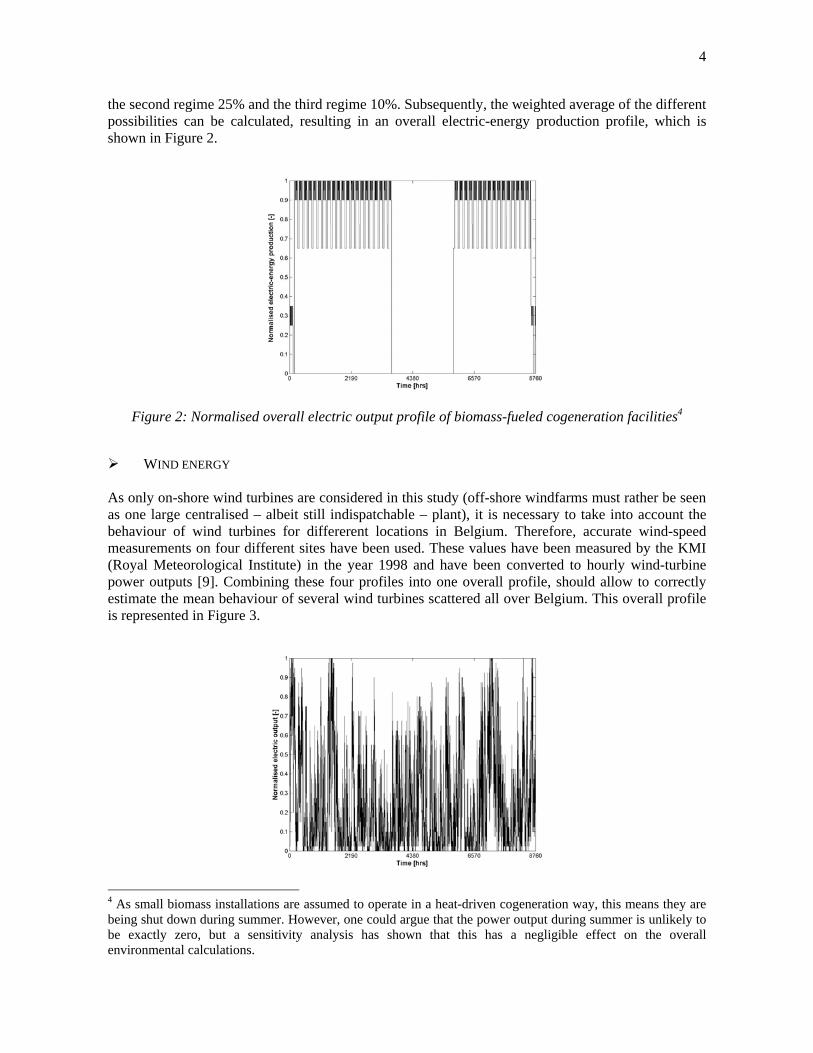
period (occasional). As biomass installations tend to be as large as possible, due to beneficial energetic and economic characteristics [8], it is assumed that the first working regime represents 65% of the units installed,
4
the second regime 25% and the third regime 10%. Subsequently, the weighted average of the different possibilities can be calculated, resulting in an overall electric-energy production profile, which is shown in Figure 2.
Figure 2: Normalised overall electric output profile of biomass-fueled cogeneration facilities4
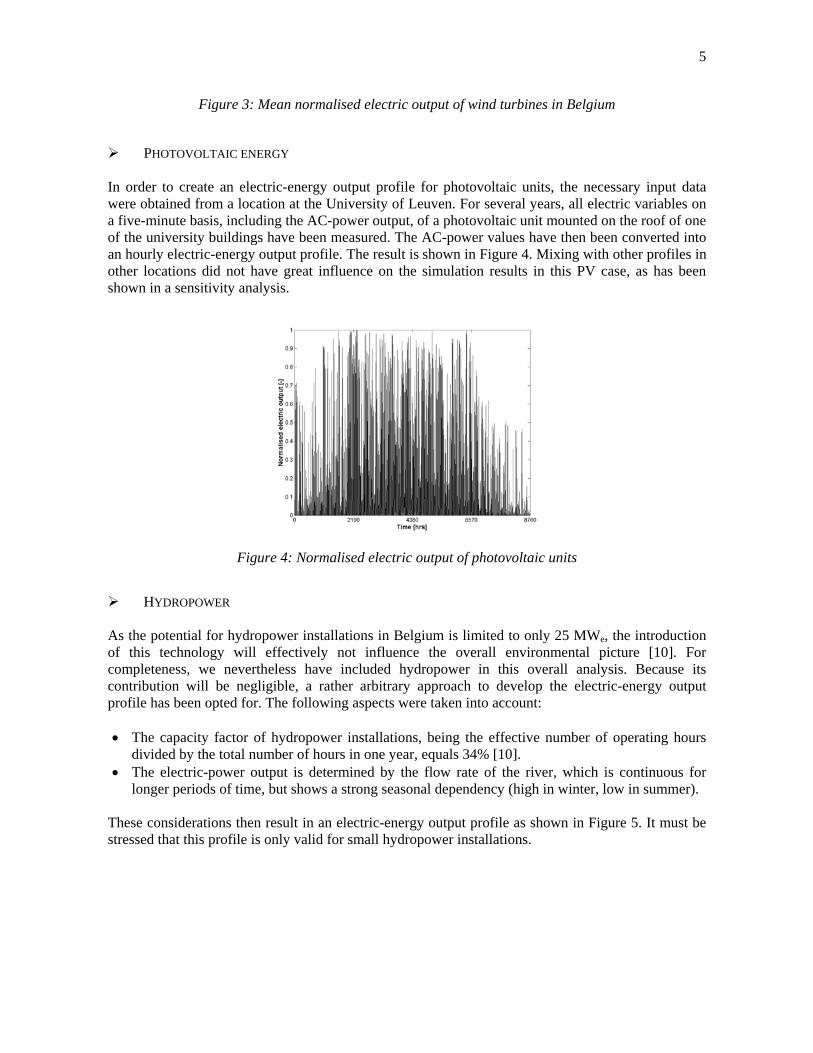
WIND ENERGY As only on-shore wind turbines are considered in this study (off-shore windfarms must rather be seen as one large centralised – albeit still indispatchable – plant), it is necessary to take into account the behaviour of wind turbines for differerent locations in Belgium. Therefore, accurate wind-speed measurements on four different sites have been used. These values have been measured by the KMI (Royal Meteorological Institute) in the year 1998 and have been converted to hourly wind-turbine power outputs [9]. Combining these four profiles into one overall profile, should allow to correctly estimate the mean behaviour of several wind turbines scattered all over Belgium. This overall profile is represented in Figure 3.
4 As small biomass installations are assumed to operate in a heat-driven cogeneration way, this means they are being shut down during summer. However, one could argue that the power output during summer is unlikely to be exactly zero, but a sensitivity analysis has shown that this has a negligible effect on the overall environmental calculations.
5
Figure 3: Mean normalised electric output of wind turbines in Belgium
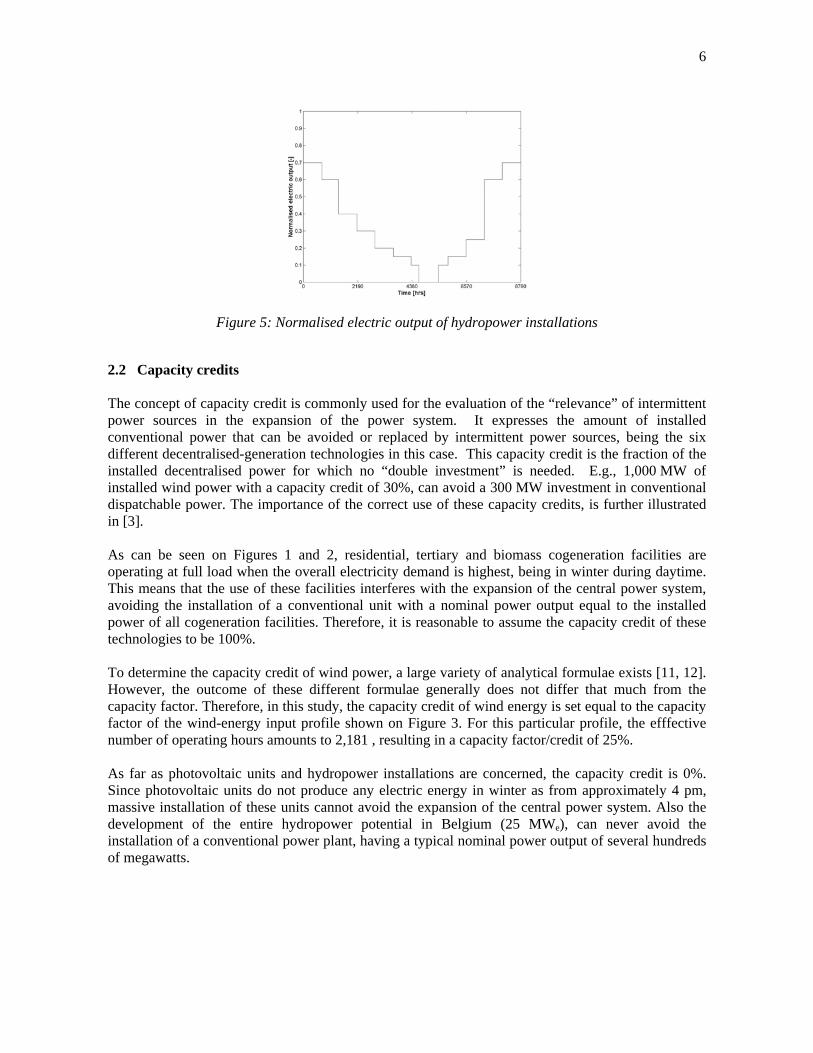
PHOTOVOLTAIC ENERGY In order to create an electric-energy output profile for photovoltaic units, the necessary input data were obtained from a location at the University of Leuven. For several years, all electric variables on a five-minute basis, including the AC-power output, of a photovoltaic unit mounted on the roof of one of the university buildings have been measured. The AC-power values have then been converted into an hourly electric-energy output profile. The result is shown in Figure 4. Mixing with other profiles in other locations did not have great influence on the simulation results in this PV case, as has been shown in a sensitivity analysis.
Figure 4: Normalised electric output of photovoltaic units
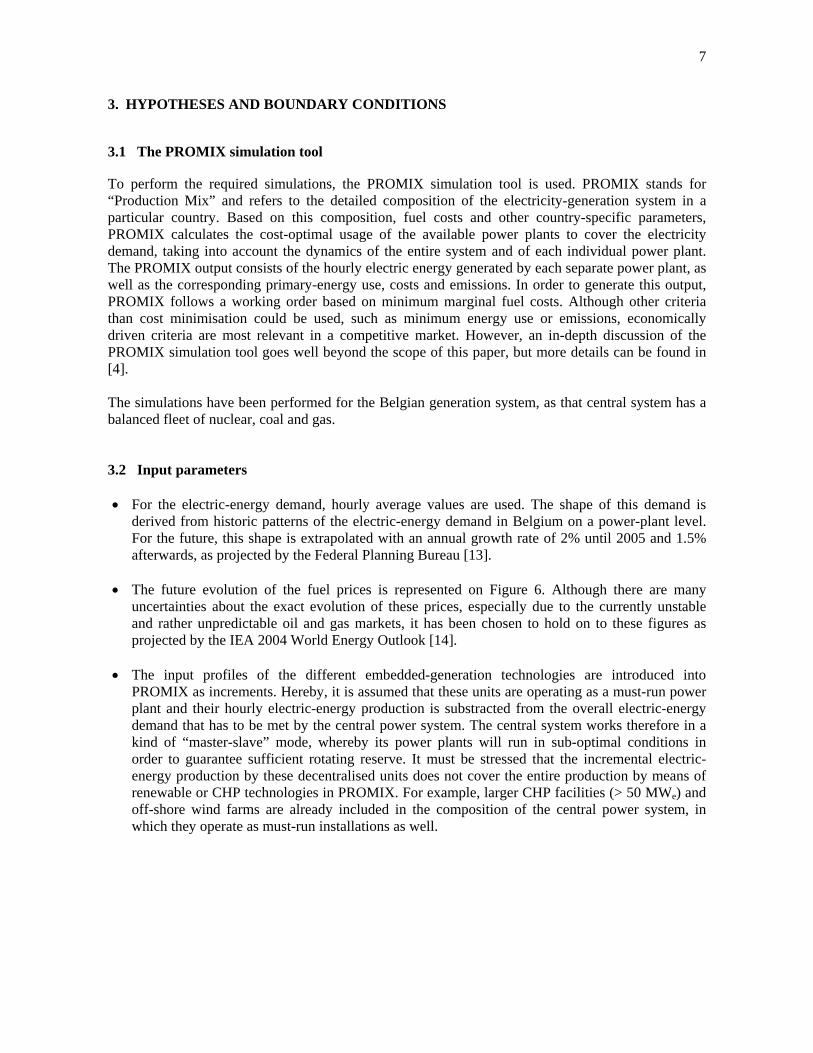
HYDROPOWER As the potential for hydropower installations in Belgium is limited to only 25 MWe, the introduction of this technology will effectively not influence the overall environmental picture [10]. For completeness, we nevertheless have included hydropower in this overall analysis. Because its contribution will be negligible, a rather arbitrary approach to develop the electric-energy output profile has been opted for. The following aspects were taken into account: • The capacity factor of hydropower installations, being the effective number of operating hours
divided by the total number of hours in one year, equals 34% [10]. • The electric-power output is determined by the flow rate of the river, which is continuous for
longer periods of time, but shows a strong seasonal dependency (high in winter, low in summer). These considerations then result in an electric-energy output profile as shown in Figure 5. It must be stressed that this profile is only valid for small hydropower installations.
6
Figure 5: Normalised electric output of hydropower installations
2.2 Capacity credits The concept of capacity credit is commonly used for the evaluation of the “relevance” of intermittent power sources in the expansion of the power system. It expresses the amount of installed conventional power that can be avoided or replaced by intermittent power sources, being the six different decentralised-generation technologies in this case. This capacity credit is the fraction of the installed decentralised power for which no “double investment” is needed. E.g., 1,000 MW of installed wind power with a capacity credit of 30%, can avoid a 300 MW investment in conventional dispatchable power. The importance of the correct use of these capacity credits, is further illustrated in [3]. As can be seen on Figures 1 and 2, residential, tertiary and biomass cogeneration facilities are operating at full load when the overall electricity demand is highest, being in winter during daytime. This means that the use of these facilities interferes with the expansion of the central power system, avoiding the installation of a conventional unit with a nominal power output equal to the installed power of all cogeneration facilities. Therefore, it is reasonable to assume the capacity credit of these technologies to be 100%. To determine the capacity credit of wind power, a large variety of analytical formulae exists [11, 12]. However, the outcome of these different formulae generally does not differ that much from the capacity factor. Therefore, in this study, the capacity credit of wind energy is set equal to the capacity factor of the wind-energy input profile shown on Figure 3. For this particular profile, the efffective number of operating hours amounts to 2,181 , resulting in a capacity factor/credit of 25%. As far as photovoltaic units and hydropower installations are concerned, the capacity credit is 0%. Since photovoltaic units do not produce any electric energy in winter as from approximately 4 pm, massive installation of these units cannot avoid the expansion of the central power system. Also the development of the entire hydropower potential in Belgium (25 MWe), can never avoid the installation of a conventional power plant, having a typical nominal power output of several hundreds of megawatts.
7
3. HYPOTHESES AND BOUNDARY CONDITIONS 3.1 The PROMIX simulation tool To perform the required simulations, the PROMIX simulation tool is used. PROMIX stands for “Production Mix” and refers to the detailed composition of the electricity-generation system in a particular country. Based on this composition, fuel costs and other country-specific parameters, PROMIX calculates the cost-optimal usage of the available power plants to cover the electricity demand, taking into account the dynamics of the entire system and of each individual power plant. The PROMIX output consists of the hourly electric energy generated by each separate power plant, as well as the corresponding primary-energy use, costs and emissions. In order to generate this output, PROMIX follows a working order based on minimum marginal fuel costs. Although other criteria than cost minimisation could be used, such as minimum energy use or emissions, economically driven criteria are most relevant in a competitive market. However, an in-depth discussion of the PROMIX simulation tool goes well beyond the scope of this paper, but more details can be found in [4]. The simulations have been performed for the Belgian generation system, as that central system has a balanced fleet of nuclear, coal and gas. 3.2 Input parameters • For the electric-energy demand, hourly average values are used. The shape of this demand is
derived from historic patterns of the electric-energy demand in Belgium on a power-plant level. For the future, this shape is extrapolated with an annual growth rate of 2% until 2005 and 1.5% afterwards, as projected by the Federal Planning Bureau [13].
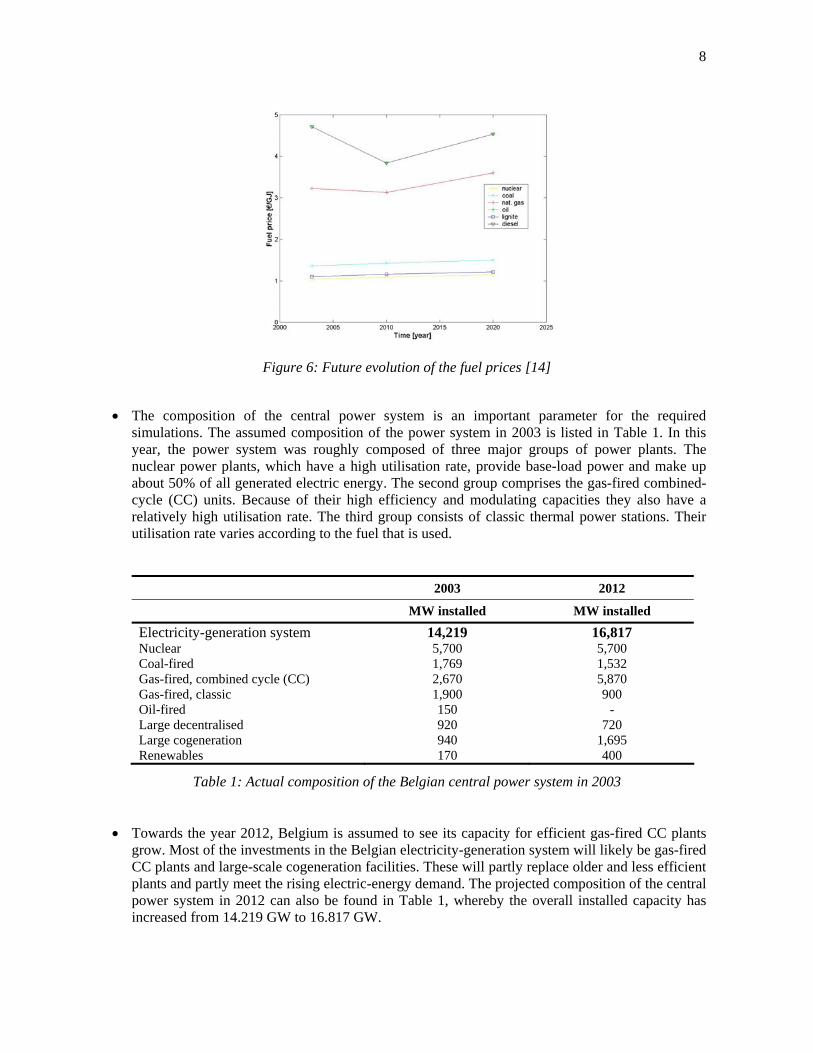
• The future evolution of the fuel prices is represented on Figure 6. Although there are many
uncertainties about the exact evolution of these prices, especially due to the currently unstable and rather unpredictable oil and gas markets, it has been chosen to hold on to these figures as projected by the IEA 2004 World Energy Outlook [14].
• The input profiles of the different embedded-generation technologies are introduced into
PROMIX as increments. Hereby, it is assumed that these units are operating as a must-run power plant and their hourly electric-energy production is substracted from the overall electric-energy demand that has to be met by the central power system. The central system works therefore in a kind of “master-slave” mode, whereby its power plants will run in sub-optimal conditions in order to guarantee sufficient rotating reserve. It must be stressed that the incremental electric-energy production by these decentralised units does not cover the entire production by means of renewable or CHP technologies in PROMIX. For example, larger CHP facilities (> 50 MWe) and off-shore wind farms are already included in the composition of the central power system, in which they operate as must-run installations as well.
8
Figure 6: Future evolution of the fuel prices [14]
• The composition of the central power system is an important parameter for the required
simulations. The assumed composition of the power system in 2003 is listed in Table 1. In this year, the power system was roughly composed of three major groups of power plants. The nuclear power plants, which have a high utilisation rate, provide base-load power and make up about 50% of all generated electric energy. The second group comprises the gas-fired combined-cycle (CC) units. Because of their high efficiency and modulating capacities they also have a relatively high utilisation rate. The third group consists of classic thermal power stations. Their utilisation rate varies according to the fuel that is used.
2003 2012 MW installed MW installed
Electricity-generation system 14,219 16,817 Nuclear 5,700 5,700 Coal-fired 1,769 1,532 Gas-fired, combined cycle (CC) 2,670 5,870 Gas-fired, classic 1,900 900 Oil-fired 150 - Large decentralised 920 720 Large cogeneration 940 1,695 Renewables 170 400
Table 1: Actual composition of the Belgian central power system in 2003 • Towards the year 2012, Belgium is assumed to see its capacity for efficient gas-fired CC plants
grow. Most of the investments in the Belgian electricity-generation system will likely be gas-fired CC plants and large-scale cogeneration facilities. These will partly replace older and less efficient plants and partly meet the rising electric-energy demand. The projected composition of the central power system in 2012 can also be found in Table 1, whereby the overall installed capacity has increased from 14.219 GW to 16.817 GW.
9
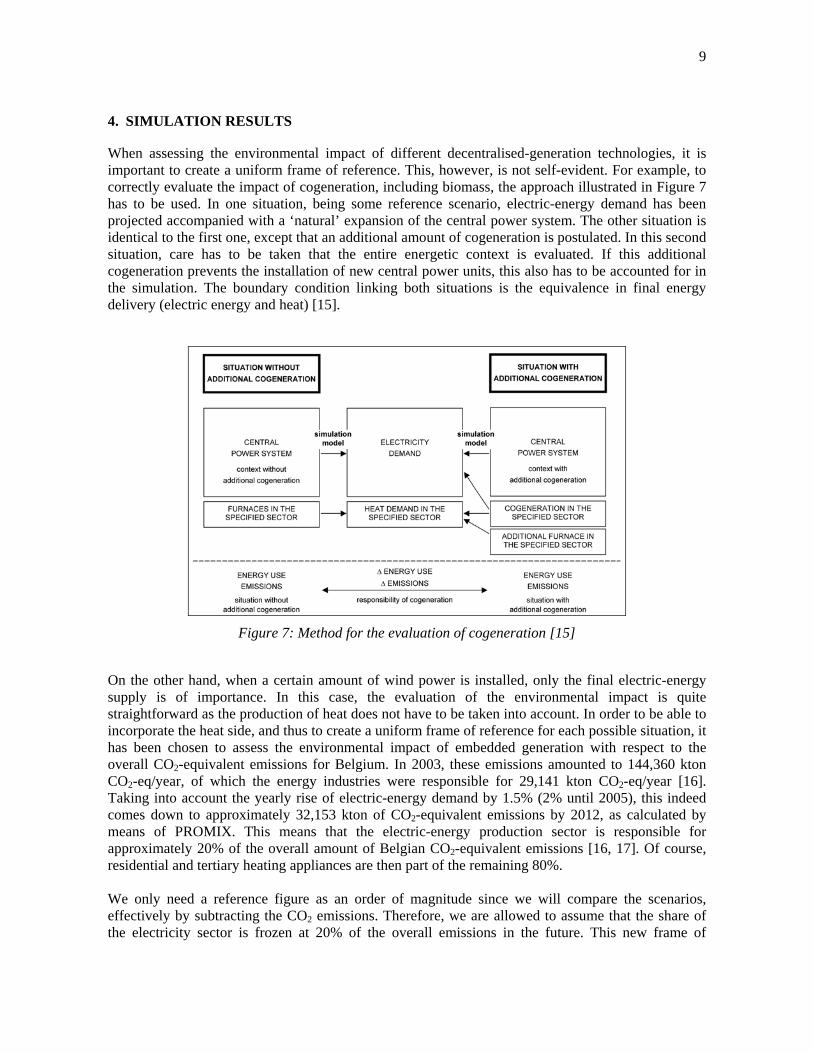
4. SIMULATION RESULTS When assessing the environmental impact of different decentralised-generation technologies, it is important to create a uniform frame of reference. This, however, is not self-evident. For example, to correctly evaluate the impact of cogeneration, including biomass, the approach illustrated in Figure 7 has to be used. In one situation, being some reference scenario, electric-energy demand has been projected accompanied with a ‘natural’ expansion of the central power system. The other situation is identical to the first one, except that an additional amount of cogeneration is postulated. In this second situation, care has to be taken that the entire energetic context is evaluated. If this additional cogeneration prevents the installation of new central power units, this also has to be accounted for in the simulation. The boundary condition linking both situations is the equivalence in final energy delivery (electric energy and heat) [15].
Figure 7: Method for the evaluation of cogeneration [15]
On the other hand, when a certain amount of wind power is installed, only the final electric-energy supply is of importance. In this case, the evaluation of the environmental impact is quite straightforward as the production of heat does not have to be taken into account. In order to be able to incorporate the heat side, and thus to create a uniform frame of reference for each possible situation, it has been chosen to assess the environmental impact of embedded generation with respect to the overall CO2-equivalent emissions for Belgium. In 2003, these emissions amounted to 144,360 kton CO2-eq/year, of which the energy industries were responsible for 29,141 kton CO2-eq/year [16]. Taking into account the yearly rise of electric-energy demand by 1.5% (2% until 2005), this indeed comes down to approximately 32,153 kton of CO2-equivalent emissions by 2012, as calculated by means of PROMIX. This means that the electric-energy production sector is responsible for approximately 20% of the overall amount of Belgian CO2-equivalent emissions [16, 17]. Of course, residential and tertiary heating appliances are then part of the remaining 80%. We only need a reference figure as an order of magnitude since we will compare the scenarios, effectively by subtracting the CO2 emissions. Therefore, we are allowed to assume that the share of the electricity sector is frozen at 20% of the overall emissions in the future. This new frame of
10
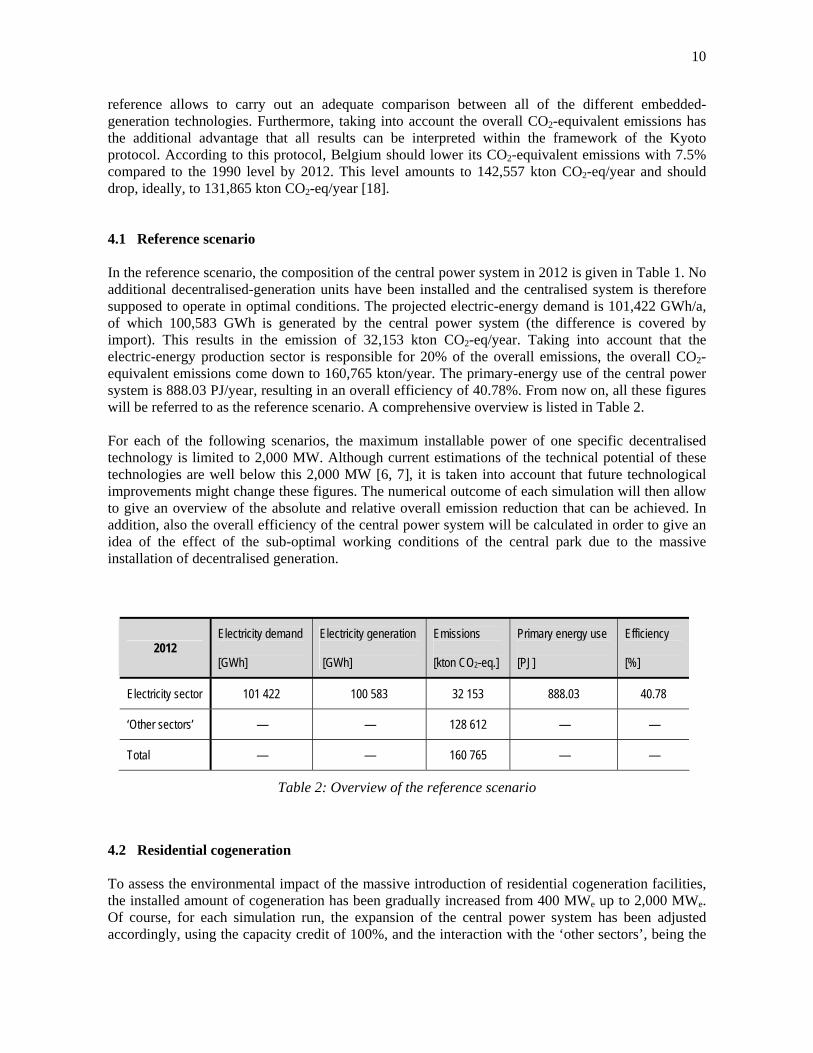
reference allows to carry out an adequate comparison between all of the different embedded-generation technologies. Furthermore, taking into account the overall CO2-equivalent emissions has the additional advantage that all results can be interpreted within the framework of the Kyoto protocol. According to this protocol, Belgium should lower its CO2-equivalent emissions with 7.5% compared to the 1990 level by 2012. This level amounts to 142,557 kton CO2-eq/year and should drop, ideally, to 131,865 kton CO2-eq/year [18]. 4.1 Reference scenario In the reference scenario, the composition of the central power system in 2012 is given in Table 1. No additional decentralised-generation units have been installed and the centralised system is therefore supposed to operate in optimal conditions. The projected electric-energy demand is 101,422 GWh/a, of which 100,583 GWh is generated by the central power system (the difference is covered by import). This results in the emission of 32,153 kton CO2-eq/year. Taking into account that the electric-energy production sector is responsible for 20% of the overall emissions, the overall CO2-equivalent emissions come down to 160,765 kton/year. The primary-energy use of the central power system is 888.03 PJ/year, resulting in an overall efficiency of 40.78%. From now on, all these figures will be referred to as the reference scenario. A comprehensive overview is listed in Table 2. For each of the following scenarios, the maximum installable power of one specific decentralised technology is limited to 2,000 MW. Although current estimations of the technical potential of these technologies are well below this 2,000 MW [6, 7], it is taken into account that future technological improvements might change these figures. The numerical outcome of each simulation will then allow to give an overview of the absolute and relative overall emission reduction that can be achieved. In addition, also the overall efficiency of the central power system will be calculated in order to give an idea of the effect of the sub-optimal working conditions of the central park due to the massive installation of decentralised generation.
2012 Electricity demand [GWh]
Electricity generation [GWh]
Emissions [kton CO2-eq.]
Primary energy use [PJ]
Efficiency [%]
Electricity sector 101 422 100 583 32 153 888.03 40.78
‘Other sectors’ — — 128 612 — —
Total — — 160 765 — —
Table 2: Overview of the reference scenario 4.2 Residential cogeneration To assess the environmental impact of the massive introduction of residential cogeneration facilities, the installed amount of cogeneration has been gradually increased from 400 MWe up to 2,000 MWe. Of course, for each simulation run, the expansion of the central power system has been adjusted accordingly, using the capacity credit of 100%, and the interaction with the ‘other sectors’, being the
11
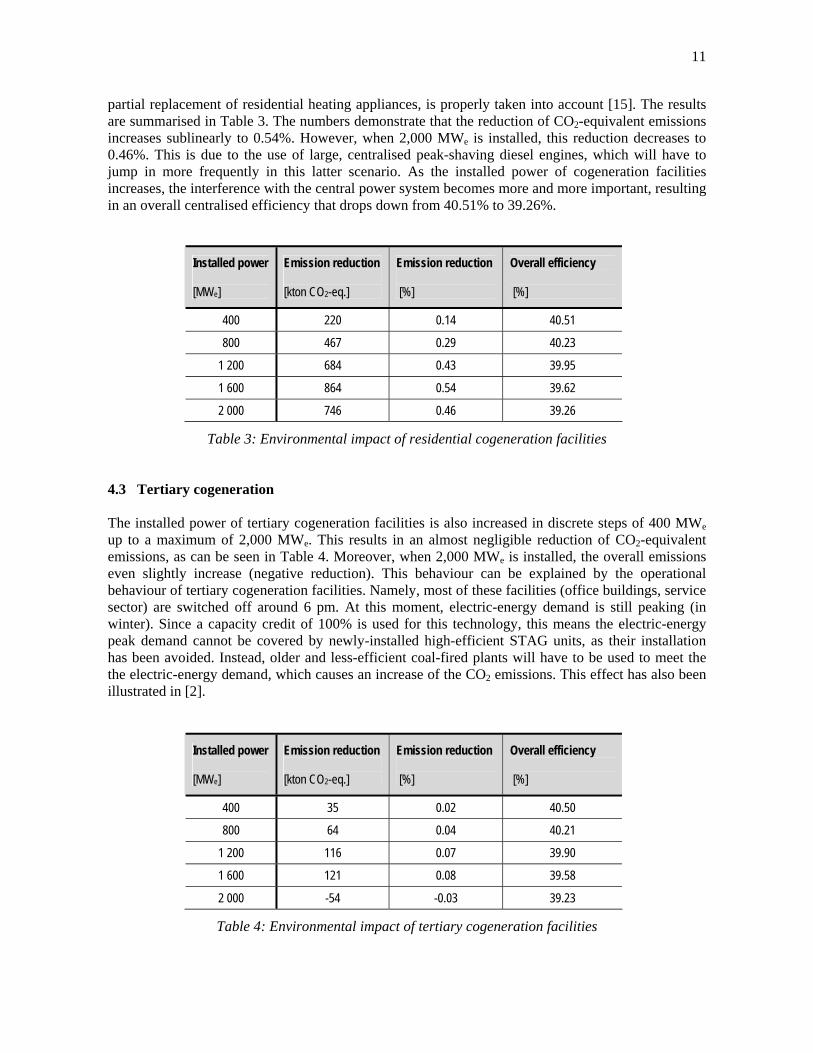
partial replacement of residential heating appliances, is properly taken into account [15]. The results are summarised in Table 3. The numbers demonstrate that the reduction of CO2-equivalent emissions increases sublinearly to 0.54%. However, when 2,000 MWe is installed, this reduction decreases to 0.46%. This is due to the use of large, centralised peak-shaving diesel engines, which will have to jump in more frequently in this latter scenario. As the installed power of cogeneration facilities increases, the interference with the central power system becomes more and more important, resulting in an overall centralised efficiency that drops down from 40.51% to 39.26%.
Installed power [MWe]
Emission reduction [kton CO2-eq.]
Emission reduction [%]
Overall efficiency [%]
400 220 0.14 40.51
800 467 0.29 40.23
1 200 684 0.43 39.95
1 600 864 0.54 39.62
2 000 746 0.46 39.26
Table 3: Environmental impact of residential cogeneration facilities 4.3 Tertiary cogeneration The installed power of tertiary cogeneration facilities is also increased in discrete steps of 400 MWe up to a maximum of 2,000 MWe. This results in an almost negligible reduction of CO2-equivalent emissions, as can be seen in Table 4. Moreover, when 2,000 MWe is installed, the overall emissions even slightly increase (negative reduction). This behaviour can be explained by the operational behaviour of tertiary cogeneration facilities. Namely, most of these facilities (office buildings, service sector) are switched off around 6 pm. At this moment, electric-energy demand is still peaking (in winter). Since a capacity credit of 100% is used for this technology, this means the electric-energy peak demand cannot be covered by newly-installed high-efficient STAG units, as their installation has been avoided. Instead, older and less-efficient coal-fired plants will have to be used to meet the the electric-energy demand, which causes an increase of the CO2 emissions. This effect has also been illustrated in [2].
Installed power [MWe]
Emission reduction [kton CO2-eq.]
Emission reduction [%]
Overall efficiency [%]
400 35 0.02 40.50
800 64 0.04 40.21
1 200 116 0.07 39.90
1 600 121 0.08 39.58
2 000 -54 -0.03 39.23
Table 4: Environmental impact of tertiary cogeneration facilities
12
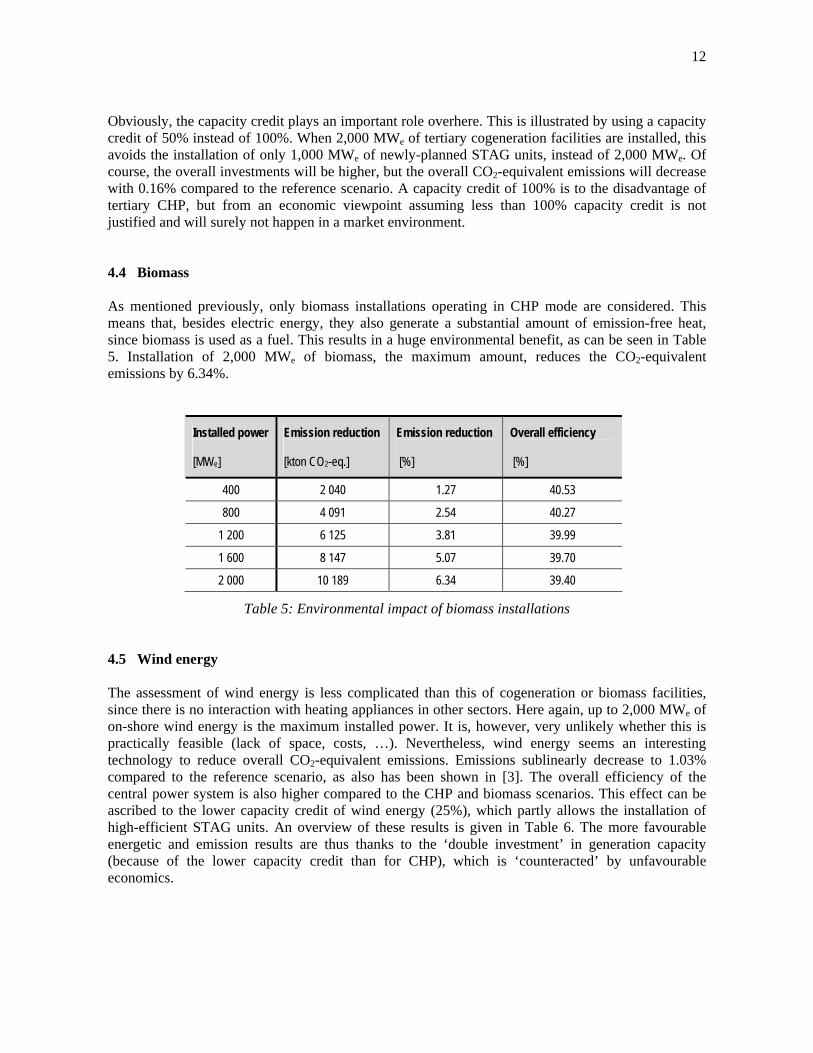
Obviously, the capacity credit plays an important role overhere. This is illustrated by using a capacity credit of 50% instead of 100%. When 2,000 MWe of tertiary cogeneration facilities are installed, this avoids the installation of only 1,000 MWe of newly-planned STAG units, instead of 2,000 MWe. Of course, the overall investments will be higher, but the overall CO2-equivalent emissions will decrease with 0.16% compared to the reference scenario. A capacity credit of 100% is to the disadvantage of tertiary CHP, but from an economic viewpoint assuming less than 100% capacity credit is not justified and will surely not happen in a market environment. 4.4 Biomass As mentioned previously, only biomass installations operating in CHP mode are considered. This means that, besides electric energy, they also generate a substantial amount of emission-free heat, since biomass is used as a fuel. This results in a huge environmental benefit, as can be seen in Table 5. Installation of 2,000 MWe of biomass, the maximum amount, reduces the CO2-equivalent emissions by 6.34%.
Installed power [MWe]
Emission reduction [kton CO2-eq.]
Emission reduction [%]
Overall efficiency [%]
400 2 040 1.27 40.53
800 4 091 2.54 40.27
1 200 6 125 3.81 39.99
1 600 8 147 5.07 39.70
2 000 10 189 6.34 39.40
Table 5: Environmental impact of biomass installations 4.5 Wind energy The assessment of wind energy is less complicated than this of cogeneration or biomass facilities, since there is no interaction with heating appliances in other sectors. Here again, up to 2,000 MWe of on-shore wind energy is the maximum installed power. It is, however, very unlikely whether this is practically feasible (lack of space, costs, …). Nevertheless, wind energy seems an interesting technology to reduce overall CO2-equivalent emissions. Emissions sublinearly decrease to 1.03% compared to the reference scenario, as also has been shown in [3]. The overall efficiency of the central power system is also higher compared to the CHP and biomass scenarios. This effect can be ascribed to the lower capacity credit of wind energy (25%), which partly allows the installation of high-efficient STAG units. An overview of these results is given in Table 6. The more favourable energetic and emission results are thus thanks to the ‘double investment’ in generation capacity (because of the lower capacity credit than for CHP), which is ‘counteracted’ by unfavourable economics.
13
Installed power [MWe]
Emission reduction [kton CO2-eq.]
Emission reduction [%]
Overall efficiency [%]
400 328 0.20 40.68
800 658 0.41 40.58
1 200 1 011 0.63 40.49
1 600 1 347 0.84 40.39
2 000 1 656 1.03 40.30
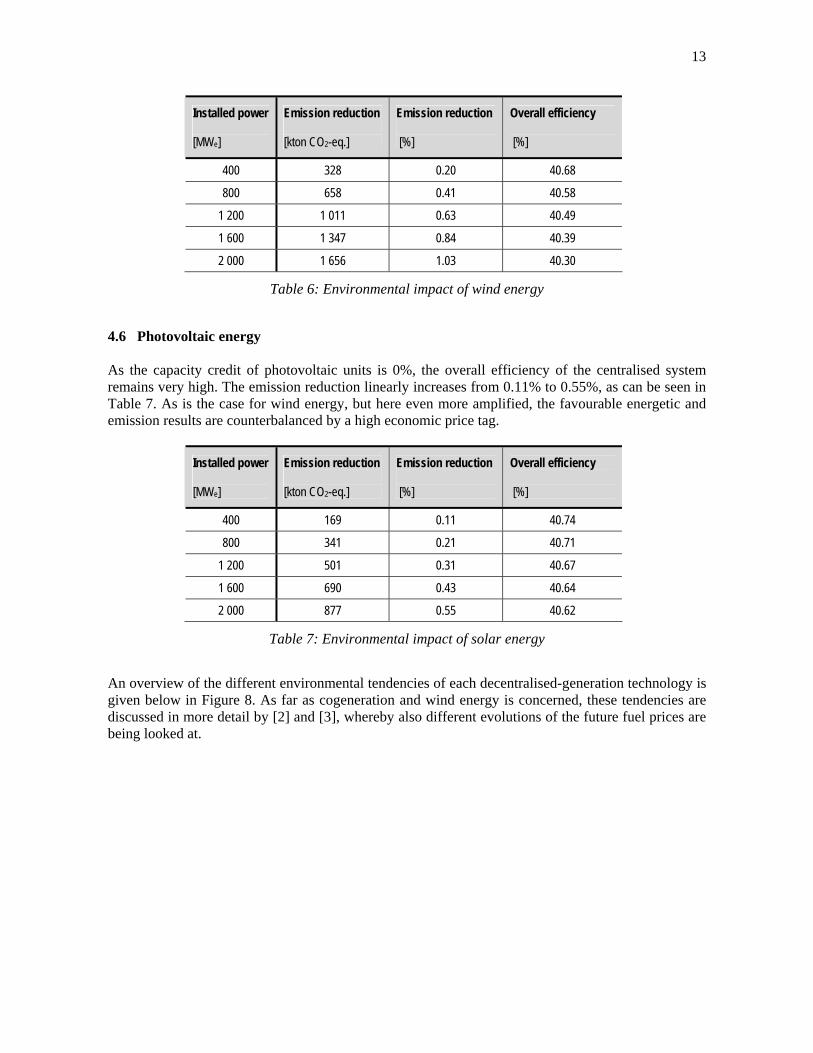
Table 6: Environmental impact of wind energy 4.6 Photovoltaic energy As the capacity credit of photovoltaic units is 0%, the overall efficiency of the centralised system remains very high. The emission reduction linearly increases from 0.11% to 0.55%, as can be seen in Table 7. As is the case for wind energy, but here even more amplified, the favourable energetic and emission results are counterbalanced by a high economic price tag.
Installed power [MWe]
Emission reduction [kton CO2-eq.]
Emission reduction [%]
Overall efficiency [%]
400 169 0.11 40.74
800 341 0.21 40.71
1 200 501 0.31 40.67
1 600 690 0.43 40.64
2 000 877 0.55 40.62
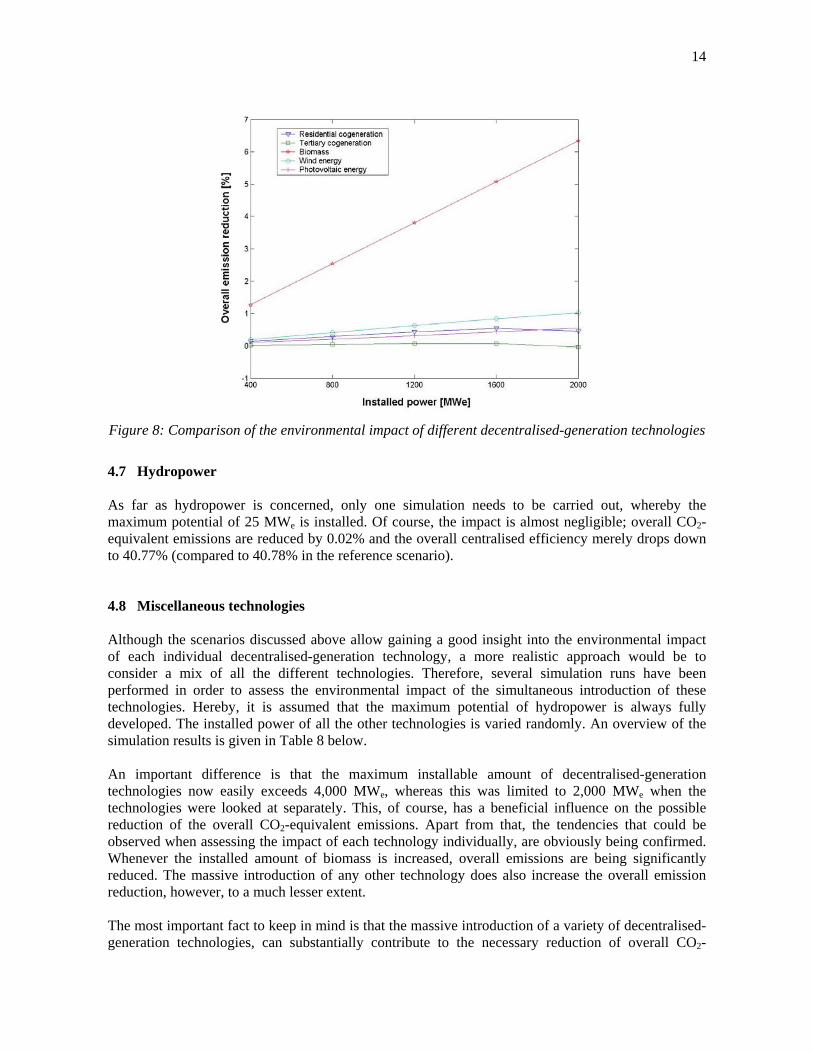
Table 7: Environmental impact of solar energy An overview of the different environmental tendencies of each decentralised-generation technology is given below in Figure 8. As far as cogeneration and wind energy is concerned, these tendencies are discussed in more detail by [2] and [3], whereby also different evolutions of the future fuel prices are being looked at.
14
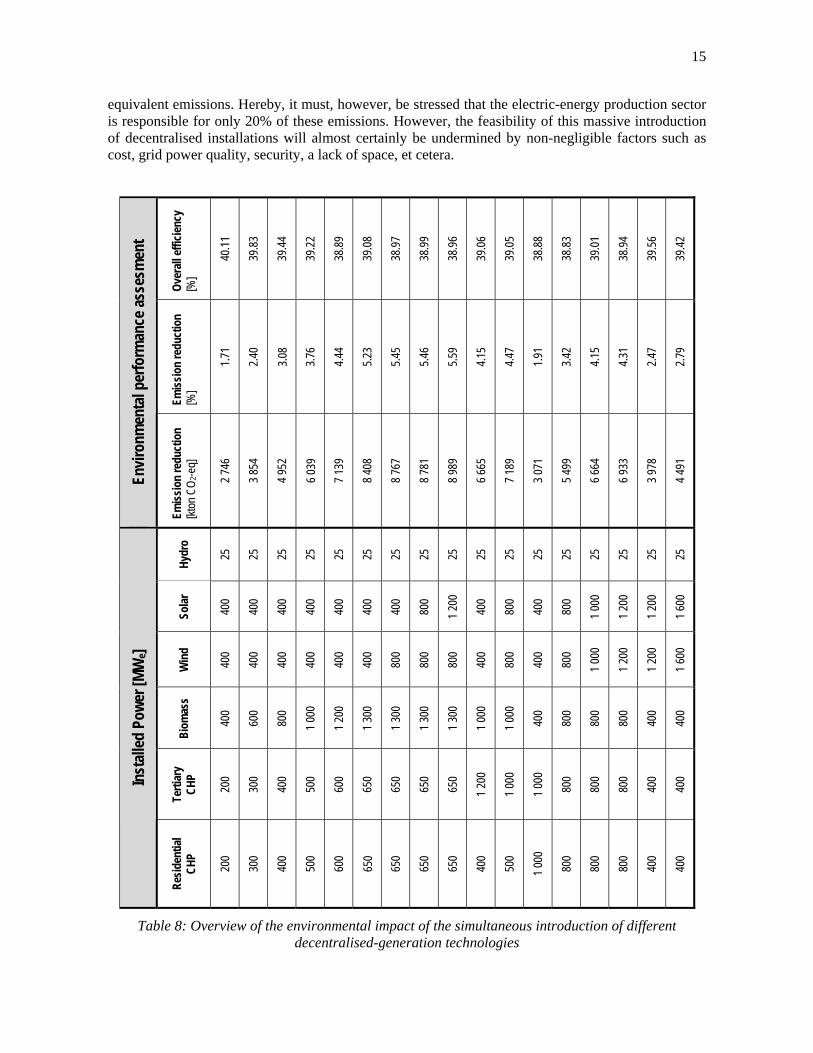
Figure 8: Comparison of the environmental impact of different decentralised-generation technologies 4.7 Hydropower As far as hydropower is concerned, only one simulation needs to be carried out, whereby the maximum potential of 25 MWe is installed. Of course, the impact is almost negligible; overall CO2-equivalent emissions are reduced by 0.02% and the overall centralised efficiency merely drops down to 40.77% (compared to 40.78% in the reference scenario). 4.8 Miscellaneous technologies Although the scenarios discussed above allow gaining a good insight into the environmental impact of each individual decentralised-generation technology, a more realistic approach would be to consider a mix of all the different technologies. Therefore, several simulation runs have been performed in order to assess the environmental impact of the simultaneous introduction of these technologies. Hereby, it is assumed that the maximum potential of hydropower is always fully developed. The installed power of all the other technologies is varied randomly. An overview of the simulation results is given in Table 8 below. An important difference is that the maximum installable amount of decentralised-generation technologies now easily exceeds 4,000 MWe, whereas this was limited to 2,000 MWe when the technologies were looked at separately. This, of course, has a beneficial influence on the possible reduction of the overall CO2-equivalent emissions. Apart from that, the tendencies that could be observed when assessing the impact of each technology individually, are obviously being confirmed. Whenever the installed amount of biomass is increased, overall emissions are being significantly reduced. The massive introduction of any other technology does also increase the overall emission reduction, however, to a much lesser extent. The most important fact to keep in mind is that the massive introduction of a variety of decentralised-generation technologies, can substantially contribute to the necessary reduction of overall CO2-
15
equivalent emissions. Hereby, it must, however, be stressed that the electric-energy production sector is responsible for only 20% of these emissions. However, the feasibility of this massive introduction of decentralised installations will almost certainly be undermined by non-negligible factors such as cost, grid power quality, security, a lack of space, et cetera.
Over
all ef
ficien
cy
[%]
40.11
39.83
39.44
39.22
38.89
39.08
38.97
38.99
38.96
39.06
39.05
38.88
38.83
39.01
38.94
39.56
39.42
Emiss
ion
redu
ctio
n [%
]
1.71
2.40
3.08
3.76
4.44
5.23
5.45
5.46
5.59
4.15
4.47
1.91
3.42
4.15
4.31
2.47
2.79
Envir
onm
enta
l per
form
ance
asse
smen
t
Emiss
ion
redu
ctio
n [kt
on C
O 2-e
q]
2 746
3 854
4 952
6 039
7 139
8 408
8 767
8 781
8 989
6 665
7 189
3 071
5 499
6 664
6 933
3 978
4 491
Hydr
o
25
25
25
25
25
25
25
25
25
25
25
25
25
25
25
25
25
Solar
400
400
400
400
400
400
400
800
1 200
400
800
400
800
1 000
1 200
1 200
1 600
Win
d
400
400
400
400
400
400
800
800
800
400
800
400
800
1 000
1 200
1 200
1 600
Biom
ass
400
600
800
1 000
1 200
1 300
1 300
1 300
1 300
1 000
1 000
400
800
800
800
400
400
Terti
ary
CHP
200
300
400
500
600
650
650
650
650
1 200
1 000
1 000
800
800
800
400
400 In
stall
ed P
ower
[MW
e]
Resid
entia
l CH
P
200
300
400
500
600
650
650
650
650
400
500
1 000
800
800
800
400
400
Table 8: Overview of the environmental impact of the simultaneous introduction of different decentralised-generation technologies
16
4.9 Nuclear phase-out scenarios With respect to the actual situation in Belgium, also a nuclear phase-out scenario (artificially assumed to occur somewhat before 2012) has been considered. First, a new base scenario is calculated whereby the 5.7 GW of nuclear power plants have been replaced with 2.5 GW of coal-fired power plants and 3.2 GW of natural-gas combined-cycle power plants by 2012 (otherwise, the dependency on one of both fuels becomes too important). Compared to this base scenario, the installation of decentralised-generation technologies results in a much larger absolute emission reduction than in the scenarios without a nuclear phase-out. As far as the impact of each individual technology is concerned, the same tendencies as above could be observed. However, compared to the reference scenario with nuclear power plants, even the scenario with the most beneficial outcome, being the installation of 2,000 MWe of biomass installations operating in CHP mode, results in an increase of the overall emissions by more than 11%. Taking into account this substantial increase and given that the installation of 2,000 MWe of whatever decentralised technology is probably an overestimation of the technically feasible potential, it is clear that a nuclear phase-out will always result in a drastic increase of the overall CO2-equivalent emissions, whatever measures on the supply side are taken. 5. CONCLUSIONS The energy supply in 2012 has been chosen as the reference scenario. The introduction of decentralised-generation technologies into this energetic landscape, whereby the installation of newly-planned central units is possibly being avoided, is then evaluated for numerous different scenarios. Hereby, the interaction with the central power system has been used to determine the maximum installable amount of embedded generation. This theoretical maximum, however, is probably an overestimation of the real energetic or economic potential. Nevertheless, simulation results have shown very clear tendencies which will be valid in any situation. The installation of residential and tertiary cogeneration facilities has little effect on the overall CO2-equivalent emissions. This is mainly due to their capacity credit of 100%, by which the installation of high-efficient combined-cycle units is being avoided. As far as wind turbines and photovoltaic units are concerned, overall emissions can be reduced significantly when up to 2,000 MWe is being installed. However, it remains to be seen whether this will be technically and economically feasible. Finally, biomass installations, operated in CHP mode, can contribute to the necessary emission reduction to a large extent. Even the installation of 400 MWe of these units leads up to better environmental conditions than could be achieved by the theoretically maximum installation of any other technology. Unfortunately, the massive installation of biomass facilities requires a sufficient amount of resources, which is far from evident in Belgium. Finally, it can be concluded that the simultaneous, massive introduction of different decentralised-generation technologies can significantly contribute to the necessary reduction of CO2-equivalent emissions. An overall reduction of up to 4% seems a technically feasible scenario. However, in this paper, grid integration and extra costs (because of e.g. zero capacity credit and balancing/back-up costs) have not been considered. It has also been shown that the planned nuclear phase-out in Belgium will inevitably lead to a large increase of emissions in the electricity sector, if only supply-side measures are considered. In addition, demand-side measures will need to be implemented if CO2 emissions are to be limited.

17
ACKNOWLEDGEMENTS The authors are grateful to the Flemish ‘Instituut voor de aanmoediging van Innovatie door Wetenschap en Technologie’ (IWT) for granting a GBOU research project, entitled “Embedded generation: a global approach to energy balance and grid power quality and security”, to support this research. REFERENCES [1] Pepermans G., Driesen J., Haeseldonckx D., Belmans R., D’haeseleer W., ‘Distributed
generation: definition, benefits and issues’, Energy Policy, Vol. 33, pp. 787-798, 2005.
[2] Voorspools K., D’haeseleer W., ‘The impact of the implementation of cogeneration in a given energetic context’, IEEE Transactions on Energy Conversion, Vol. 18, No. 1, pp. 135-141, 2003.
[3] Voorspools K., D’haeseleer W., ‘Impact assessment of using wind power’, Solar Energy, Accepted for publication, In press.
[4] Voorspools K., D’haeseleer W., ‘The influence of the instantaneous fuel mix for electricity generation on the corresponding emissions’, Energy, Vol. 25, pp. 1119-1138, 2000.
[5] Haeseldonckx D., Peeters L., Helsen L., D’haeseleer W., ‘The impact of thermal storage on the operational behaviour of residential CHP facilities and the overall CO2 emissions’, Renewable and Sustainable Energy Reviews, Accepted for publication, In press.
[6] Martens A, Dufait N., ‘Energetisch potentieel warmtekrachtkoppeling in België’ (Energetic potential for combined heat and power in Belgium), VITO-rapport, nr. REG.RV9703, Mol, March 1997. (In Dutch)
[7] AMPERE report, http://mineco.fgov.be/energy/ampere_commission/Rapport_nl.htm, October 2000, Chapter D.4 (author W. D’haeseleer; in Dutch).
[8] Novak-Zdravkovic A., De Ruyck J., ‘Embedded generation: A global approach to energy balance and grid power quality and security’, GBOU project, Subtask 1.5 – Biomass, VUB report, Brussels, 2002.
[9] Voets P., D’haeseleer W., Belmans R., ‘Systeemgedrag’, Rapport HERN-REG project, EI/EDV/HERN-(REG)/16.00/FIN, ‘Kleinschalige aanwending van hernieuwbare bronnen in Vlaanderen en wetenschappelijke ondersteuning van een beleid voor rationeel energiegebruik (op distributieniveau)’, K.U.Leuven Energie-Instituut. Leuven, 2001. (In Dutch)
[10] AMPERE report, http://mineco.fgov.be/energy/ampere_commission/Rapport_nl.htm, October 2000, Chapter F.1 (author E. Dick).
[11] Voorspools K., D’haeseleer W., ‘Critical evaluation of methods for wind-power appraisal’, Renewable and Sustainable Energy Reviews, Accepted for publication, In press.
[12] Voorspools K., D’haeseleer W., ‘An analytical formula for the capacity credit of wind power’, Renewable Energy, Vol. 31, pp. 45-54, 2006.
[13] Gusbin D., Hoornaert B., ‘Energievooruitzichten voor België tegen 2030’, Federaal Planbureau, January 2004. (In Dutch)
[14] International Energy Agency (IEA), World Energy Outlook 2004, 2004.

18
[15] Voorspools K., D’ haeseleer W., ‘The evaluation of small cogeneration for residential heating’, International Journal of Energy Research, Vol. 26, pp. 1175-1190, 2002.
[16] http://www.klimaat.be/inventemis/inventaris8.html , Common Reporting Format, CRF-standaard 2003 Belgium, 2005.
[17] Bollen A, Van Humbeeck P., ‘Klimaatverandering & klimaatbeleid: Een leidraad’, Academia Press, 2002. (In Dutch)
[18] http://www.klimaat.be/inventemis/inventaris8.html , Common Reporting Format, CRF-standaard 1990 Belgium, 2005.