
The Environmental Effects of Demand Side ... - odr.chalmers.se
46
Department of Electrical Engineering Division of Electric Power Engineering CHALMERS UNIVERSITY OF TECHNOLOGY Master’s thesis EENX30 Gothenburg, Sweden 2021 The Environmental Effects of Demand Side Management and Storage Technology Evaluating their Effects on the CO 2 -emissions Stemming from a Building’s Energy Use Master’s Thesis in the Master’s Programme Sustainable Energy Systems DANIEL HOZOURI
Transcript of The Environmental Effects of Demand Side ... - odr.chalmers.se

Department of Electrical Engineering Division of Electric Power Engineering CHALMERS UNIVERSITY OF TECHNOLOGY
Master’s thesis EENX30
Gothenburg, Sweden 2021
The Environmental Effects of Demand Side Management and Storage Technology
Evaluating their Effects on the CO2-emissions Stemming from a Building’s Energy Use
Master’s Thesis in the Master’s Programme Sustainable Energy Systems
DANIEL HOZOURI


MASTER’S THESIS EENX30
The Environmental Effects of Demand Side Management and Storage Technology
Evaluating their effect on the CO2-emissions stemming from a building’s energy use
Master’s thesis in the master’s program Sustainable Energy Systems
DANIEL HOZOURI
Department of Electrical Engineering
Division of Electric Power Engineering
CHALMERS UNIVERSITY OF TECHNOLOGY
Gothenburg, Sweden 2021
The Environmental Effect of Demand-Side Management and Storage Technology
Evaluating their effect on the CO2-emissions stemming from a building’s energy use
Master’s thesis in the Master’s Programme Sustainable Energy Systems
DANIEL HOZOURI
© DANIEL HOZOURI, 2021
Examensarbete EENX30
Institutionen för elektroteknik,
Chalmers tekniska högskola, 2021
Department of Electrical Engineering
Division of Electric Power Engineering
Chalmers University of Technology
412 96 Gothenburg
Sweden
Telephone: 031-772 10 00
Chalmers Reproservice / Department of Electrical Engineering
Göteborg, Sweden 2021

CHALMERS, Electrical Engineering, Master’s thesis EENX30 1
CHALMERS, Electrical Engineering, Master’s thesis EENX30 2
The Environmental Effect of Demand-Side Management and Storage Technology
Evaluating their effect on the CO2-emissions stemming from a building’s energy use
Master of Science Thesis in the Master’s Programme Sustainable Energy Systems
DANIEL HOZOURI
Department of Electrical Engineering
Division of Electric Power Engineering
Chalmers University of Technology
ABSTRACT
In the fight against climate change, our electricity systems are undergoing a continuous
transition from fossil-based to renewable energy. However, the intermittent and unpredictable
nature of renewable energy sources results in disruption between supply and demand,
necessitating changing energy use patterns to be able to fully take advantage of the
environmental benefits of renewable energy. This can be done through Demand-Side
Management, which seeks to reduce the environmental impact of a building’s energy use by
changing its energy-use profile to take advantage of hours with high levels of renewable
energy. Battery electric storage is another strategy that can increase the extent to which
electricity use can be moved from high- to low-emission hours. Many studies reviewed by the
author evaluate the economic sustainability of Demand-Side Management and battery electric
storage. This study examines the environmental sustainability of Demand-Side Management
and battery electric storage, implemented both solely and combined, in an 8890 m2-sized
office building in Sweden. A physical model developed in Microsoft Excel implements the
two strategies to move electricity use from high- to low-emission hours, using hourly data on
carbon dioxide emissions from electricity production in Sweden. Their effects are also
evaluated in the case of available solar cells on the building. The results are presented in
terms of reduced amount of carbon dioxide emissions in a year. The problem of batteries, in
contrast to Demand-Side Management, is the environmental impact their production and
transportation have. Therefore, the results are also presented in terms of emission payback
time, defined as the number of years to compensate for the battery’s life-cycle emissions. The
results show that implementing battery storage and Demand-Side Management have proven
emission reductions. The shortest emission payback time when implementing only BES is
achieved by the 400 kWh battery when no solar cells are available. The shortest emission
payback time when implementing Demand-Side Management in conjunction with battery
electric storage is achieved by the 200 kWh battery when there are 320 m2 of solar cells. The
highest emission reduction in absolute terms is achieved by implementing the 400 kWh
battery with Demand-Side Management when there are no available solar cells. It is thus
concluded that both strategies are environmentally sustainable, and that a battery constitutes a
worthwhile investment from an environmental perspective when implemented both with and
without Demand-Side Management.
Keywords: DSM, battery, storage, HVAC, indoor, quality, heat, pump, solar.

CHALMERS, Electrical Engineering, Master’s thesis EENX30 3
CHALMERS, Electrical Engineering, Master’s thesis EENX30 4
CONTENTS
ABSTRACT 2
CONTENTS 4
PREFACE 6
NOTATIONS 7
1 INTRODUCTION 9
1.1 Purpose 10
1.2 Scope and limitations 10
1.3 Thesis structure 11
2 METHOD 12
2.1 Literature search 12
2.2 The case 12
2.3 JSP technical modelling 13
2.4 Analysis of results 13
3 REFERENCE BUILDING 14
3.1 Energy use 14
3.2 HVAC-system 14
4 LITERATURE REVIEW 16
4.1 Electricity production 16 4.1.1 Sweden’s electricity system 16 4.1.2 Quantifying emissions 17 4.1.3 Emission peaks 18
4.2 Demand-Side Management 18
4.3 Energy Storage 19
4.4 Local Electricity Production 19
4.5 Heating and cooling of ventilation air 20
4.6 Indoor environmental quality 21
4.7 Heat pumps 22
5 MODELLING 23
5.1 Cooling of ventilation air 23 5.1.1 The governing heat transfer equation 23 5.1.2 Cooling power reductions 25
5.2 Heating of ventilation air 26 5.2.1 Heating power reductions 27
5.3 The fan 27 5.3.1 Effects of cooling and heating reductions 27
CHALMERS, Electrical Engineering, Master’s thesis EENX30 5
5.3.2 Fan power reductions 27
5.4 Radiators 28 5.4.1 Radiator power reductions 28
5.5 Battery Electric Storage 28
5.6 Solar cells 29
6 RESULTS 31
6.1 Emission reductions 31
6.2 Life-cycle emission analysis 32
7 DISCUSSION 34
7.1 Marginal versus Average Emissions factor 34
7.2 Demand-Side Management & Battery Storage 34
7.3 Solar photovoltaics 36
7.4 Life cycle-emissions of the battery 37
7.5 Further considerations 38
8 CONCLUSION 39
BIBLIOGRAPHY 40

CHALMERS, Electrical Engineering, Master’s thesis EENX30 6
Preface In the name of God - the Most Compassionate, Most Merciful. All praise is for God – Lord of
all worlds.
This Master’s thesis is the final part of the Master’s programme Sustainable Energy Systems.
I want to thank my examiner, Ola Carlson, and my supervisors, Andreas Karlsson and
Abderisak Adam, for their continuous support and useful advice they have given me while
conducting this thesis. I want to thank Bengt Dahlgren for allowing me to conduct my
Master’s thesis for them. It has been a fulfilling experience in which I have gained plenty of
useful knowledge. Lastly, I want to thank my opponents for their feedback and useful
insights.

CHALMERS, Electrical Engineering, Master’s thesis EENX30 7
NOTATIONS
AEF – Average Emissions Factor
BES – Battery Electric Storage
CAV – Constant Air Volume
COP – Coefficient of Performance
DSM – Demand Side Management
FED – Fossil-free Energy District
FTX - Exhaust and supply air ventilation with heat recovery
HVAC – Heating, Ventilation and Air-Conditioning
JSP – Johanneberg Science Park
MEF – Marginal Emissions Factor
PMV – Predicted Mean Value
PPD - Predicted Percentage of Dissatisfied
Solar PV – Solar Photovoltaic
SWEA – Swedish Work Environment Authority
VAV – Variable Air Volume

CHALMERS, Electrical Engineering, Master’s thesis EENX30 8

CHALMERS, Electrical Engineering, Master’s thesis EENX30 9
1 INTRODUCTION
The increasingly urgent problem of climate change calls for drastic changes in our energy
systems. Energy sector is a significant contributor to carbon footprint. Hence, the electricity
system has the potential to make a significant contribution to mitigating the environmental
harm of pollution by reducing the production of fossil fuel-based electricity (Gelazanskas &
Gamage, 2014). Having understood the gravity of this problem, many nations have set out to
de-carbonise their electricity systems by including more renewably produced energy (Péan, et
al., 2019). Thus, our electricity systems are now undergoing a significant shift; fossil-fueled,
centralised generation is being replaced with renewable, distributed generation. Because
renewable energy sources are entirely dependent on weather conditions (Strbac, 2008), they
have unpredictable generation profiles, which results in mismatches between supply and
demand (Péan, et al., 2019). Consequently, electricity surpluses occur in certain hours,
necessitating the curtailment of renewable electricity plants, and electricity deficits occur in
other hours, requiring the constant availability of peak power plants (Péan, et al., 2019).
Ultimately, a lower utilisation of generation capacity ensues. In other words, more renewable
energy in our system requires more backup generation to account for the fluctuations in
generation. To enable higher short-term peaks and variations in the electricity system,
distribution infrastructure hence needs to be maintained or upgraded (Péan, et al., 2019),
which is a costly task for society (U.S. Department of Energy, 2012).
The modern electric power system that we are moving towards is called Smart grid. The term
Smart grid can be defined as: “increased use, both more efficient and by providing new
services, of electric power systems, both existing and future, by utilising new components,
technologies and strategies.” (Ehnberg, 2020). Smart grid encompasses the entire electric
power system: from electricity supply, through transmission and distribution, to electricity
use. It is important to note that among major economic sectors, the building sector scores the
highest in terms of energy consumption (Fotouhi & Steen, 2019). This points to a significant
potential in working on the energy systems in buildings - located on the electricity use side of
Smart grid - for de-carbonising our energy systems. For this purpose, Demand-Side
Management (DSM) is useful, as it is a strategy that enacts the philosophy of Smart Grid on
buildings. DSM is an inexpensive measure, which makes it highly useful considering the
capital-intensive nature of electricity system infrastructure (Albadi & El-Saadany, 2007).
Measures to increase the energy efficiency in buildings have traditionally been to reduce
energy demand and not to reduce power demand (Hellström, et al., 2019). The strategy for
balancing between supply and demand in the electricity system has focused on constantly
producing the demanded electricity whenever the demand occurs. A DSM strategy, on the
contrary, changes the time of electricity consumption. Loads are shifted from on-peak to off-
peak electricity tariff hours (Lizana, et al., 2018), which is essential from an environmental
perspective due to fossil-fuel production plants often being used for providing peak power
demand (Haegermark & Edenhofer, 2019). DSM can be implemented in conjunction with
storage technology, such as battery electric storage, to increase the possibility of moving
energy use from on-peak to off-peak hours. However, contrary to DSM, storage technology,
such as battery electric storage, has life-cycle emissions. For storage technology to be
considered an environmentally sustainable investment, the emission reductions it achieves
must be higher than its life-cycle emissions.
In many urban areas, there are capacity problems, meaning that capacity can at times be
insufficient for providing peak power (Rydberg & Karlsson, 2019). DSM and storage
technology have the potential to solve this by cutting down electricity demand peaks. This
leads to avoiding the construction of an under-utilised grid infrastructure in terms of
generation capacity and distribution and transmission networks (Logenthiran & Srinivasan,
2012). DSM and storage technology are needed in Sweden especially (where this thesis is
conducted) due to high demand peaks during freezing winter days. These peaks account for
CHALMERS, Electrical Engineering, Master’s thesis EENX30 10
only about a percentage of the total energy demand, but still cause high costs for resident
owners (Haegermark & Edenhofer, 2019). A more efficient electricity system, towards which
DSM and storage technology can contribute, implies a more efficient use of the produced
electricity. This in turn implies a reduced amount of assets needed to fulfil demand, the result
of which is reduced need for fossil fuel combustion. DSM and storage technology also have
benefits for the building owner who implements them, by reducing the required amount of
electricity that needs to be purchased from the grid in peak hours, which reduces electricity
bills and the environmental effect that the building has through its energy use.
Because the building sector is such a major sector in terms of energy consumption, changing
the demand profile of buildings is a significant potential contributor to the energy system’s
de-carbonisation, which reduces the need for future investments in generation and energy
networks (Fotouhi & Steen, 2019). Thus, implementing DSM and battery electric storage in
an office building has significant potential to contribute to de-carbonising the energy system.
With its goal of reducing carbon dioxide emissions of an office building’s energy use through
DSM and storage technology, this thesis provides knowledge on the environmental effect of
DSM and storage technology, as well as offers prescriptive advice on how to implement them
to attain higher sustainability. This, in turn, contributes to solving the global problem of
climate change.
1.1 Purpose
The purpose of this thesis is to evaluate the environmental sustainability of DSM and battery
storage technology. It seeks to fulfil this purpose by quantifying the amount of carbon dioxide
reductions from a building’s operational energy that are achievable by implementing DSM
and battery electric storage. Their effect will also be evaluated when implemented in a
building with installed solar photovoltaic cells. The goal is to investigate the environmental
benefits of DSM and battery electric storage in a realistic context. To obtain realistic results, a
Sweden-based office building called Johanneberg Science Park (JSP) is used as a reference
building. The hypothesis is that DSM and battery electric storage can reduce carbon dioxide
emissions in peak hours of energy demand, thereby making the energy profile of a building
more environmentally sustainable. This effect is expected to be particularly notable with the
availability of solar cells.
1.2 Scope and limitations
This study does not address residential buildings, and by extension, does not address DSM
implemented on appliances typical for residential buildings, such as dishwashers, washing
machines, and television sets.
The energy consumption and ventilation airflow data, provided by Bengt Dahlgren, is specific
to JSP, hence representing the climate of the building’s geographical location (i.e.
Gothenburg, Sweden). Also, the data containing carbon dioxide emissions, provided by
Electricity Map (2021), stands for the state of the electricity system in Sweden in the year
2020. Because both JSP’s data and the electricity data are geographically specific, the thesis
results are not automatically transferrable to other locations with different climate conditions
and different electricity production mixes.
This study aims to generally evaluate the sustainability of the strategies on a building’s energy
use by using JSP only as a reference building, not to make energy-efficiency improvements
on JSP. As will be clarified in chapter 3: REFERENCE BUILDING, JSP is not in need of
energy efficiency improvements. The study will address solely changes to the manner of
energy use as relating to time, and does not seek to reduce the total energy use per se. The
CHALMERS, Electrical Engineering, Master’s thesis EENX30 11
kitchen is not considered in this study because the energy consumption of cooking and related
activities is a highly complex task.
Finally, this study does not address the economic viability of DSM and storage technology,
but only their environmental sustainability by quantifying carbon dioxide emission
reductions.
1.3 Thesis structure
This thesis first introduces the project in chapter 1, and goes into the method implemented in
chapter 2. The third chapter deals with the reference building used in the project. The thesis
then delves into the literature review in chapter 4. After this, the modelling is explained in
chapter 5. The modelling results are presented in chapter 6, with a discussion immediately
following in chapter 7. Finally, the thesis ends with a conclusion in chapter 8.

CHALMERS, Electrical Engineering, Master’s thesis EENX30 12
2 METHOD
Scientific studies are of different variants: explorative, descriptive, explanatory, and
normative studies (Paulsson, 2020). This study fits into the description of a normative study.
A normative study takes on a problem about which prior knowledge exists, allowing a
forward-looking perspective to give action-oriented advice. The reason for this study being
normative is, firstly, that there already exists knowledge about DSM and battery storage,
implemented in different contexts. Secondly, the purpose of this thesis is to analyse and
compare the two strategies (DSM and battery storage) and their combination in their effects
on carbon dioxide emissions, and therefrom offer advice on how to implement them to
achieve the highest environmental sustainability. These are the two reasons for this being a
normative study.
The study centres around a physical model of the HVAC system of JSP. A physical model is
necessary to quantify the possibilities - or lack thereof - in reducing carbon dioxide emissions
by implementing the two mentioned strategies. Nevertheless, physical modelling in software
such as IDA Indoor Climate Energy (ICE) will not be performed. Instead, a simpler model
will be designed in Microsoft Excel, which entails that the model will include approximations
and will hence be a coarse-grained estimation of the system. The energy consumption and the
ventilation airflow data on JSP used in the model stems from IDA ICE simulations performed
by Bengt Dahlgren, which provides substantial reliability to the model’s accuracy.
2.1 Literature search
The goal of the literature search was to understand the developmental stage of the two
strategies and the current state of the research literature. Paulsson (2020) states that in
formulating a problem to study in a thesis, it is essential to investigate if there is present
knowledge about the studied problem, if there is a gap in this knowledge, and whether
conducting a thesis can work to reduce the size of this knowledge gap. DSM and battery
storage are well-known in the research community and have been implemented in different
contexts. However, no study was found that analysed these two strategies and their
combination implemented on a building and compared the effect that the availability of solar
cells has on their potential. Moreover, most previous studies seem to have focused on the
economic viability of the implementation of the strategies and not on their environmental
sustainability (which this thesis focuses on). Hence, a knowledge gap in the environmental
performance of the strategies exists – a gap this thesis seeks to fill.
Another goal of the literature review was to understand the limits set and the possibilities
created for implementing the strategies by factors relating to the electricity system, emission
peaks, and indoor environmental quality. Understanding these factors is crucial in both the
design of the model (in setting constraints) as well as in the analysis of the results and the
conclusions drawn from them.
The literature review consisted of research articles found through Google Scholar. Some of
the keywords used were: ‘DSM’, ‘battery’, ‘storage’, ‘heat’, ‘pump’ and ‘solar’. These
articles gave an understanding of the current state of the two strategies. Furthermore, the
literature review also included relevant websites of energy companies and government
agencies that provided important information on the electricity system, HVAC, and indoor
environmental quality, etc.
2.2 The case
This Master’s thesis is conducted at Bengt Dahlgren. Bengt Dahlgren is a consulting firm in
civil engineering offering services in installation, fire & risk, building & real estate, and
CHALMERS, Electrical Engineering, Master’s thesis EENX30 13
energy & environment. Making energy use more efficient and offering sustainable solutions
tailored for each client is always a goal in Bengt Dahlgren’s work. The firm has an interest in
evaluating the possibilities of reducing carbon dioxide emissions by implementing the two
strategies since this would – if significant reductions are proven possible - provide further
evidence of the sustainability of their work and strengthen their overarching goal of providing
sustainable solutions to their clients.
This study uses the building Johanneberg Science Park (JSP) located at the Chalmers campus
in Johanneberg, Gothenburg, as a reference building. JSP represents a typical modern energy-
efficient commercial building, which makes it suitable for this study.
2.3 JSP technical modelling
Bengt Dahlgren provided technical descriptions on JSP. Bengt Dahlgren also provided HVAC
energy consumption and ventilation airflow data obtained from IDA ICE simulations, used in
the modelling in this thesis.
Thereafter, the transfer of heat in the heat exchanger was expressed in the form of an
equation. This equation is the sole physical equation that needs to be modelled in this project.
The third task was to design the model in Microsoft Excel. The JSP data provided by Bengt
Dahlgren and the average carbon dioxide emissions from the electricity production in each
hour (Electricity Map, 2021) were inserted. Three parts of the HVAC system are controlled in
the DSM strategy: cooling of ventilation air, heating of ventilation air, and radiators. For each
of these parts, a calculation of what peak reductions are realistically possible with acceptable
effects on the indoor climate was calculated without simulating the indoor climate in a
complex software. The ensuing carbon dioxide reductions from these power reductions were
also calculated. It was assumed that all heating (both for ventilation air and for radiators) and
all cooling is provided by the underground heat pump of JSP.
The electricity data has an hourly resolution, considered adequate in the context of production
peaks. In working with demand response for the purpose of modelling frequency response, a
resolution of milliseconds is necessary (Nyholm, 2015), which does not apply to this thesis.
The fourth task was to add battery electric storage and the local solar PV electricity
generation (which are not in reality included in the building complex of JSP) in the model.
2.4 Analysis of results
The results of the strategies and their combination were analysed. From this, conclusions were
drawn as to which strategy/strategies proved the most successful from an environmental
perspective, thus fulfilling the thesis’s prescriptive aim. Besides, the design of the model and
the assumptions therein were analysed. This allowed for further advice to be given regarding
potential improvements to this study that can be made in future studies.
CHALMERS, Electrical Engineering, Master’s thesis EENX30 14
3 REFERENCE BUILDING
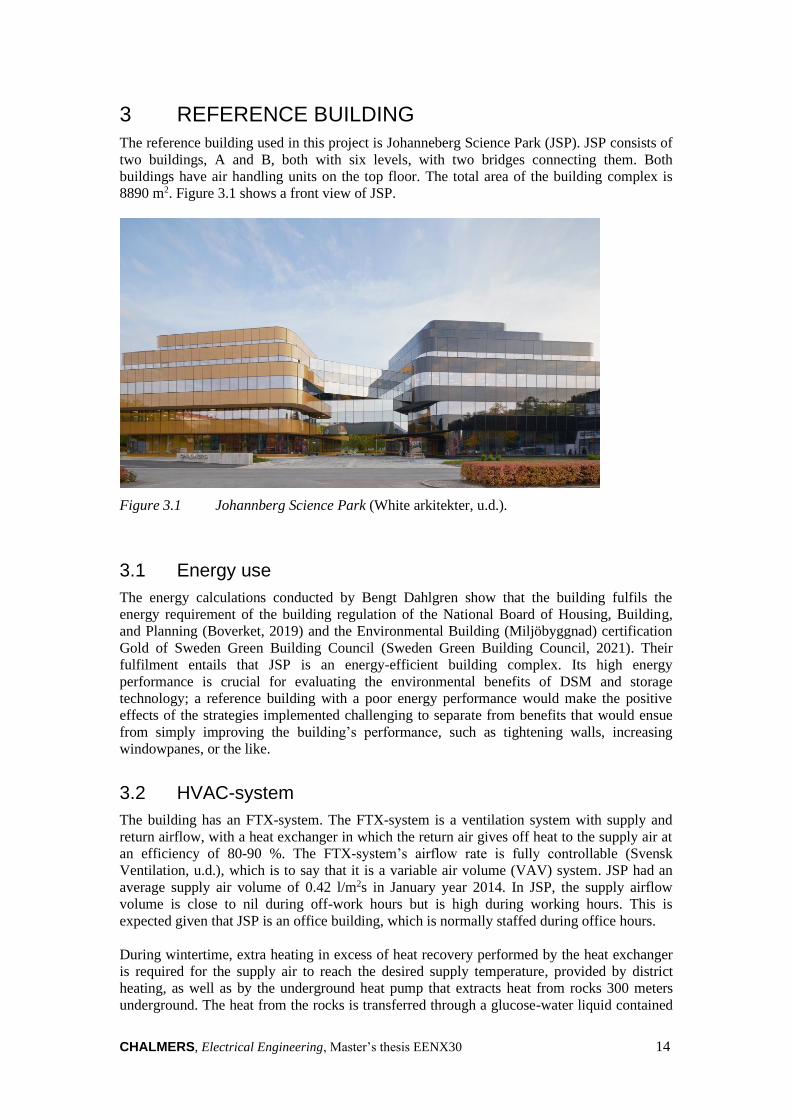
The reference building used in this project is Johanneberg Science Park (JSP). JSP consists of
two buildings, A and B, both with six levels, with two bridges connecting them. Both
buildings have air handling units on the top floor. The total area of the building complex is
8890 m2. Figure 3.1 shows a front view of JSP.
Figure 3.1 Johannberg Science Park (White arkitekter, u.d.).
3.1 Energy use
The energy calculations conducted by Bengt Dahlgren show that the building fulfils the
energy requirement of the building regulation of the National Board of Housing, Building,
and Planning (Boverket, 2019) and the Environmental Building (Miljöbyggnad) certification
Gold of Sweden Green Building Council (Sweden Green Building Council, 2021). Their
fulfilment entails that JSP is an energy-efficient building complex. Its high energy
performance is crucial for evaluating the environmental benefits of DSM and storage
technology; a reference building with a poor energy performance would make the positive
effects of the strategies implemented challenging to separate from benefits that would ensue
from simply improving the building’s performance, such as tightening walls, increasing
windowpanes, or the like.
3.2 HVAC-system
The building has an FTX-system. The FTX-system is a ventilation system with supply and
return airflow, with a heat exchanger in which the return air gives off heat to the supply air at
an efficiency of 80-90 %. The FTX-system’s airflow rate is fully controllable (Svensk
Ventilation, u.d.), which is to say that it is a variable air volume (VAV) system. JSP had an
average supply air volume of 0.42 l/m2s in January year 2014. In JSP, the supply airflow
volume is close to nil during off-work hours but is high during working hours. This is
expected given that JSP is an office building, which is normally staffed during office hours.
During wintertime, extra heating in excess of heat recovery performed by the heat exchanger
is required for the supply air to reach the desired supply temperature, provided by district
heating, as well as by the underground heat pump that extracts heat from rocks 300 meters
underground. The heat from the rocks is transferred through a glucose-water liquid contained

CHALMERS, Electrical Engineering, Master’s thesis EENX30 15
in hoses located in proximity to the rocks. Due to these rocks being located so far below the
ground, they are less affected by outdoor temperatures, which vary significantly in Sweden.
The rocks hold closer to a steady temperature than the outside air and can therefore operate as
a sort of thermal storage. The temperature changes so slowly that the heat it extracts from the
building’s air for cooling purposes in summer is partly available on cooler winter days when
heating of the building is needed.
Cooling demands – which are high in JSP due to it being an office building - are provided by
way of the underground heat pump cooling ventilation supply airflow. Note that there is no
district cooling; the sole source of cooling is the underground heat pump. The COP of the heat
pump, defined as the amount of heat that is provided per amount of electricity it consumes, is
3.5. District heating also provides heat for radiators and for domestic hot water production.
When there are cooling demands, waste heat produced by the heat pump is added to the
district heat to be used for radiators and domestic hot water production. However, due to the
added complexity in heating of JSP being provided by both the underground heat pump and
district heating, it is in the modelling in this thesis assumed that underground heat is the only
source of heat, hence eliminating district heat from the analysis completely.
CHALMERS, Electrical Engineering, Master’s thesis EENX30 16
4 LITERATURE REVIEW
The literature review presents contemporary knowledge relevant to conducting this thesis,
spanning from electricity production to heat pumps. The knowledge obtained in the literature
review is used in the modelling, as well as in the analysis of the results, hence forming a
necessary foundation of this thesis.
4.1 Electricity production
The topic of electricity production is central in this thesis. The potential of DSM and energy
storage in mitigating the environmental impact from the use of energy is based on the
observation that the different production sources of electricity have different effects on the
environment in terms of carbon dioxide emissions. Hence, the issue of electricity production
and its ensuing emissions is principal in this project.
4.1.1 Sweden’s electricity system
Various energy sources can be used to generate electricity. In Sweden, the two most
significant production forms are hydropower and nuclear power, accounting for 80 % of the
total amount of electricity generated (Holmström, 2020). This is the reason for the low-carbon
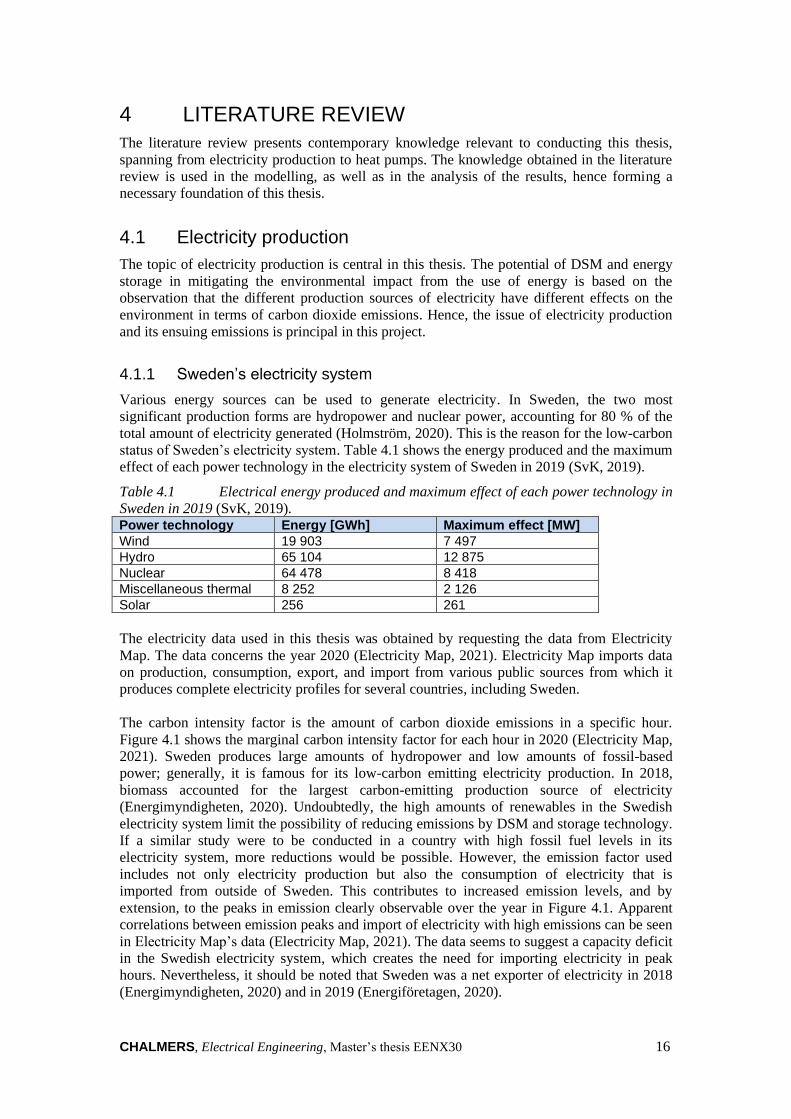
status of Sweden’s electricity system. Table 4.1 shows the energy produced and the maximum
effect of each power technology in the electricity system of Sweden in 2019 (SvK, 2019).
Table 4.1 Electrical energy produced and maximum effect of each power technology in
Sweden in 2019 (SvK, 2019). Power technology Energy [GWh] Maximum effect [MW]
Wind 19 903 7 497
Hydro 65 104 12 875
Nuclear 64 478 8 418
Miscellaneous thermal 8 252 2 126
Solar 256 261
The electricity data used in this thesis was obtained by requesting the data from Electricity
Map. The data concerns the year 2020 (Electricity Map, 2021). Electricity Map imports data
on production, consumption, export, and import from various public sources from which it
produces complete electricity profiles for several countries, including Sweden.
The carbon intensity factor is the amount of carbon dioxide emissions in a specific hour.
Figure 4.1 shows the marginal carbon intensity factor for each hour in 2020 (Electricity Map,
2021). Sweden produces large amounts of hydropower and low amounts of fossil-based
power; generally, it is famous for its low-carbon emitting electricity production. In 2018,
biomass accounted for the largest carbon-emitting production source of electricity
(Energimyndigheten, 2020). Undoubtedly, the high amounts of renewables in the Swedish
electricity system limit the possibility of reducing emissions by DSM and storage technology.
If a similar study were to be conducted in a country with high fossil fuel levels in its
electricity system, more reductions would be possible. However, the emission factor used
includes not only electricity production but also the consumption of electricity that is
imported from outside of Sweden. This contributes to increased emission levels, and by
extension, to the peaks in emission clearly observable over the year in Figure 4.1. Apparent
correlations between emission peaks and import of electricity with high emissions can be seen
in Electricity Map’s data (Electricity Map, 2021). The data seems to suggest a capacity deficit
in the Swedish electricity system, which creates the need for importing electricity in peak
hours. Nevertheless, it should be noted that Sweden was a net exporter of electricity in 2018
(Energimyndigheten, 2020) and in 2019 (Energiföretagen, 2020).

CHALMERS, Electrical Engineering, Master’s thesis EENX30 17
Figure 4.1 Marginal carbon intensity factor [kg/MW] for each hour of 2020 (Electricity
Map, 2021).
The observable peaks - though they are not extremely large in magnitude (due to low amounts
of fossil-based power production in Sweden) - are what is attempted to be avoided by the
model.
4.1.2 Quantifying emissions
An increase in electricity consumption at a particular time does not mean an equal increase in
production by all power plants in the electricity system. At all times, the least expensive
combination of power plants available is used to produce the electricity demanded. When
electricity demand is increased, it is the most inexpensive power plant with available capacity
(i.e. the marginal power plant) that is used to supply the increased demand (Corradi, 2019).
Power plants’ production costs often reflect their emissions, which means that the marginal
power plant is the least emission-heavy plant with available capacity.
There are two indicators for quantifying emissions from electricity production: the average
emission factor (AEF) and the marginal emission factor (MEF). The AEF considers the
average emission of all the plants in operation, including the marginal power plant (Corradi,
2019). The AEF accounts for the whole system’s emissions and not only the marginal power
plant’s emissions. As the whole electricity system and not only the marginal power plant
affects the surrounding environment with its emissions, the AEF is considered to account for
the long-term effect of demand changes (Listgarten, 2019). The MEF, conversely, only
accounts for the marginal plant. This means that an increase in emissions from an increase in
electricity production is equal to the marginal plant’s emissions only. Thus, the MEF
communicates the carbon offset resulting from a decrease or an increase in electricity use
(Corradi, 2019). Since it is only the marginal power plant (and not all the operating plants in
the system) that increases its production capacity as a result of an increase in electricity
demand, the MEF is considered to account for the short-term effect of demand changes. For
this reason, the MEF is more suitable than the AEF for load-shifting decisions (Listgarten,
2019).
CHALMERS, Electrical Engineering, Master’s thesis EENX30 18
4.1.3 Emission peaks
Peak electricity demand is when electricity demand is at its highest (Advanced Energy, 2018).
In this thesis, the peak demands are defined according to the emissions that the electricity
system emits and not the cost of electricity, which is an alternative way of defining them.
Peak demand can occur in the span of a couple of minutes, an hour, a day, or even longer than
that; it comes down to the context in which the term is discussed. The electricity data used in
this thesis is on an hourly basis. Therefore, peaks spanning over periods shorter than an hour
are not discussed (as periods shorter than an hour are not covered by the data) – only peaks
that are an hour or longer are included in the scope of this thesis. Still, within this, peak
demands vary in their duration – some are only an hour, others perhaps days. To tackle this
complexity, a simplification is made by defining two ‘levels’ of peak which are two
thresholds for performing power reductions – one of them for more severe reductions, and the
other for more moderate reductions. This will be expanded on in chapter 5: Modelling. By
such a model design, it is expected that peaks longer than an hour will be at least partly
eliminated, with ensuing emission savings.
4.2 Demand-Side Management
Demand-Side Management (DSM) is a strategy that focuses on the end-user side of the
energy system. DSM seeks to adapt the energy demand profile to the energy production
profile. It can accomplish this by load-shifting or peak shaving (Péan, et al., 2019). Load-
shifting means moving energy use to off-peak hours, and peak shaving means reducing
energy use in peak hours (Next Kraftwerke, u.d.). DSM can also be used for allowing
something called a “joint-optimisation between energy systems” by Rydberg & Karlsson
(2019), where multiple energy carriers are available for use. In such a context, the less
emission-heavy or cost-heavy energy carrier available to the user at each point in time can be
used.
The purpose of DSM for a user can be to reduce energy costs, reduce their environmental
impact from their energy use, and reduce their installed power capacity (which is
accomplished by reduced peaks not requiring as high a maximum power capacity). DSM
financially benefits the end-user who implements it, firstly, by financial incentives that are
occasionally provided to the user by the government. Secondly, if DSM is implemented in a
building to maximise the use of the building’s locally generated power (solar, for example),
the user benefits financially by a reduced amount of electricity needed to be purchased from
the grid.
From an energy system perspective, DSM can increase the use of renewable energy sources in
the system, with the goal of reducing the environmental strain that is particularly significant
in peak hours, resulting from the production, distribution, and use of energy. During peak
hours, transmission networks are highly congested, which can result in using power plants
that are not the most inexpensive alternative, ultimately increasing the price of electricity
(U.S. Department of Energy, 2012) – a price increase that would not take place were the
system not constrained by capacity. A solution to the congestion problem is upgrading the
electric infrastructure, with high ensuing costs (U.S. Department of Energy, 2012). In
addition, upgrading the electric infrastructure brings with it environmental harm, e.g. in the
form of carbon dioxide emissions. More innovative solutions include DSM (and storage
technology) (U.S. Department of Energy, 2012). The benefit of DSM in this context lies in its
potential to partly eliminate the demand peaks that cause the system strain, which entails that
it helps to avoid fossil-based production units that need to be utilised in peak hours.
It is important to note that DSM causes a certain deviation in the indoor climate. Thus, when
implementing DSM, it is important to evaluate this deviation in order to perform power
reduction and load-shifting to the extent that it produces changes in the indoor climate that are

CHALMERS, Electrical Engineering, Master’s thesis EENX30 19
within an acceptable range. Still, it is implied that a certain deviation within this acceptable
range is tolerated for the purpose of reducing power peaks.
4.3 Energy Storage
Storage technology accumulates energy of different forms, such as mechanical, thermal, or
chemical energy, in different quantities. In this thesis, battery electric storage is used. A
battery is a device that converts chemical energy, which it stores, to electrical energy. A
battery has a positive terminal, the cathode, and a negative terminal, the anode. They are
separated by an electrolyte that permits the passage of electrons from the anode to the cathode
(Schumm, 2021). This flow of electrons is what makes up electric power.
Electrical energy must be used immediately following its production; large amounts of
electrical energy cannot be stored for later use easily without the use of storage technology
(ASHRAE, 2019), such as batteries or other thermal storing techniques. Only controlling the
power consumption of appliances, such as HVAC components, in a DSM strategy only offers
a limited impact on the load profile. The issue of storage technology is thus clearly relevant in
this context. Implementing storage technology provides a higher potential for avoiding
demand peaks by not being as limited by the factor of time. Without storage technology, the
load that can be reduced is limited by time, while storage technology overcomes this by
storing energy for later use. Hence, storage technology shifts loads by providing for part of
(or the whole of) the building’s energy demand at a point in time with stored electricity,
thereby reducing the load (in terms of grid-purchased electricity), which creates a need for
charging the battery in another point in time with grid-purchased (or solar, for example)
electricity. It can thus be said that load-shifting is implemented in this thesis through charging
and discharging the battery, but not by HVAC loads being reduced in some hours to be
increased in other hours, which is what is commonly understood as load-shifting.
Besides allowing low-emission electricity to replace high-emission electricity in peak hours,
storage increases the extent to which solar cells can be utilized. Using energy storage allows
for taking advantage of more of the solar power generated than merely using the solar power
to power the building’s appliances whenever the weather is sunny. Renewable sources of
energy, such as solar power, usually have distributed and unpredictable generation profiles,
which storage technology partly overcomes, hence increasing the environmental benefit of
locally produced solar power.
The constraints in the case of having access to battery storage are, first, the amount of energy
the battery can store. Second is its charging and discharging capacity, which constitute
constraints due to peaks being limited by time. Hence, a larger battery (in terms of energy,
charging, and discharging capacity) is expected to provide greater potential for moving loads
from on-peak to off-peak hours. Nevertheless, the environmental impact stemming from the
production of the battery increases with its size. This necessitates a long-term analysis
comparing its production emissions with the emissions the battery can save during its lifetime
when used in a building. Such an analysis is conducted in subchapter 6.2: Life-cycle emission
analysis.
4.4 Local Electricity Production
A prosumer of energy is both a producer and a consumer of energy. This means that
prosumers both generate their own electricity (e.g. from solar photovoltaics) as well as
purchase electricity from the grid (The Energy Department, 2017). Becoming a prosumer is
commonly done today by installing solar cells. Solar cells are obtaining a pivotal role in
households turning to local generation. They are now considered an attractive investment for
households with the purpose of reducing their purchase of electricity from the grid and
CHALMERS, Electrical Engineering, Master’s thesis EENX30 20
thereby reduce their electricity bill (Hafiz, et al., 2019). The popularity of solar PVs results
from the falling cost of solar cells and subsidy schemes to promote their use (Nyholm, et al.,
2016).
The intermittent nature of solar power results in a partial mismatch between its generation
profile and the building’s demand profile. This reduces the value of using solar photovoltaics
without electricity storage (Hafiz, et al., 2019). For this reason, energy storage technology is
considered a useful alternative alongside solar panels to overcome the asynchronous
relationship between the supply of solar power and energy demand. Storage can increase the
utilisation factor (defined as the ratio of the time that a piece of equipment is used to the total
time that it could be in use (Parmar, 2011)) of the solar cells and thereby reduce the purchase
of electricity from the grid.
In Sweden, electricity produced from solar photovoltaics accounts for only 0.06% of the total
electricity consumed. The most common method for improving its performance is using
batteries (Zhang, et al., 2016). Because of the falling prices of Li-ion batteries (IEA, 2020),
they are now considered an economically viable solution (Nilsson, 2017). Also, because of
the modular nature of both solar cells and batteries, they are well suited for distributed use
(Nyholm, et al., 2016).
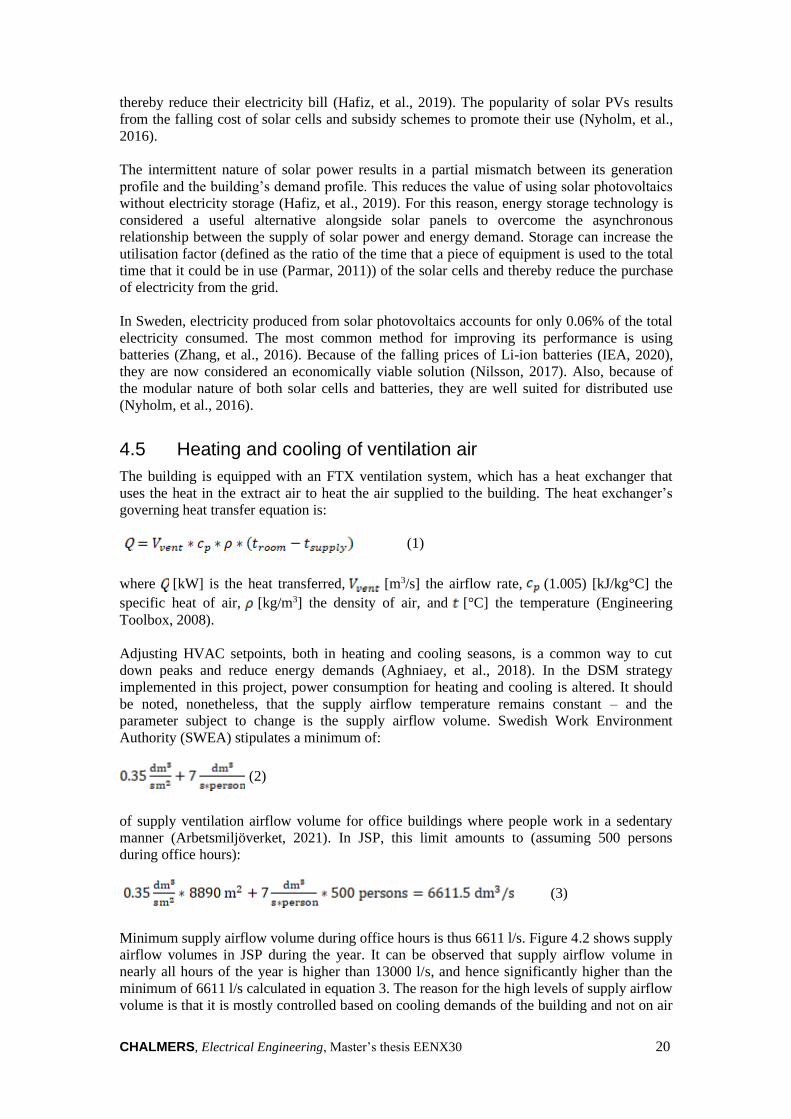
4.5 Heating and cooling of ventilation air
The building is equipped with an FTX ventilation system, which has a heat exchanger that
uses the heat in the extract air to heat the air supplied to the building. The heat exchanger’s
governing heat transfer equation is:
(1)
where [kW] is the heat transferred, [m3/s] the airflow rate, (1.005) [kJ/kg°C] the
specific heat of air, [kg/m3] the density of air, and [°C] the temperature (Engineering
Toolbox, 2008).
Adjusting HVAC setpoints, both in heating and cooling seasons, is a common way to cut
down peaks and reduce energy demands (Aghniaey, et al., 2018). In the DSM strategy
implemented in this project, power consumption for heating and cooling is altered. It should
be noted, nonetheless, that the supply airflow temperature remains constant – and the
parameter subject to change is the supply airflow volume. Swedish Work Environment
Authority (SWEA) stipulates a minimum of:
(2)
of supply ventilation airflow volume for office buildings where people work in a sedentary
manner (Arbetsmiljöverket, 2021). In JSP, this limit amounts to (assuming 500 persons
during office hours):
(3)
Minimum supply airflow volume during office hours is thus 6611 l/s. Figure 4.2 shows supply
airflow volumes in JSP during the year. It can be observed that supply airflow volume in
nearly all hours of the year is higher than 13000 l/s, and hence significantly higher than the
minimum of 6611 l/s calculated in equation 3. The reason for the high levels of supply airflow
volume is that it is mostly controlled based on cooling demands of the building and not on air

CHALMERS, Electrical Engineering, Master’s thesis EENX30 21
quality, except for a few hours with a high number of occupants. In other words, most of the
time, a lower supply airflow volume would be possible were it only constrained by indoor air
quality, but since cooling requirements of JSP are high, high amounts of supply airflow
volumes are required. Therefore, the supply airflow volume is not a limiting factor in the
DSM strategy implemented in the model.
Figure 4.2 Supply airflow volume [l/s] during the year.
A reduced supply airflow volume results in energy savings in two ways: the fan moves
smaller amounts of air, and the heat pump heats or cools smaller amounts of air. These two
types of energy reductions are used to achieve CO2 reductions in this project.
4.6 Indoor environmental quality
Indoor environmental quality relates to the quality of a building’s indoor environment. It is
based on four factors: acoustic comfort, visual comfort, thermal comfort, and air quality (Teli,
2020). This thesis focuses exclusively on the factors relating to thermal comfort and air
quality.
High air quality means the absence of pollution that is undesirable or dangerous to inhale.
There are different pollutants with differing effects. For each pollutant, there is an upper limit
that the air can contain to be considered acceptable in terms of air quality. Research
constantly reveals new undesirable substances, as well as knowledge on the previously known
pollutants with ensuing changes in the limits and recommendation levels (Teli, 2020). One of
the goals of the HVAC system is to remove harmful pollutants. The demands set on air
quality, in addition to the amount of internal generation of pollutants, determine the size of
the required supply airflow volume (Teli, 2020).
Carbon dioxide is generally used as an indicator of air quality since it indicates the number of
contaminants produced by humans in the building in question, although it is not hazardous.
Hence, when controlling the ventilation system for energy saving purposes or managing the
building’s power consumption, the amount of carbon dioxide that the indoor air contains is
vital to consider. Still, the issue of air quality is more complex than merely the amount of
carbon dioxide in the air, but it also includes subjective factors perceived differently among
different people. Accordingly, there is a minimum airflow volume allowed for different types
of rooms and activities that can be used as benchmarks for achieving satisfactory air quality
(Karlsson, 2008). The benchmark used in this thesis is the one stipulated by SWEA (2021),
calculated for JSP in equation 3 in subchapter 4.5: Heating and cooling of ventilation air.

CHALMERS, Electrical Engineering, Master’s thesis EENX30 22
Thermal comfort is “the condition of mind which expresses satisfaction with the thermal
environment” (ASHRAE, 2010). The two significant heat transfer processes that affect
thermal climate are, first, convection, which occurs by the supply of air through ventilation.
Second is radiation, which occurs using radiators, through solar radiation, and through cold
surfaces such as windows (Karlsson, 2008). In chapter 5: MODELLING, it is seen that both
these processes (convection and radiation) are used in controlling the HVAC system in the
DSM strategy implemented in this project. Besides these, psychological and physiological
factors affect each individual’s experience of thermal comfort. It is for this reason difficult to
satisfy all people in a space (ASHRAE, 2010).
SWEA (Swedish Work Environment Authority) recommends an operative temperature
between 21-25 °C for sedentary work in office buildings. Operative temperature is the
average value of the air temperature and the temperature of the surrounding surfaces. The
recommended range (21-25 °C) should be satisfactory for 90% of the normal population.
Moreover, they recommend air temperatures between 20-24°C (up to 26°C during summer)
for offices and schools (Arbetsmiljöverket, 2021).
4.7 Heat pumps
Heat pumps are devices that use electricity to move heat from a cool space to a warm space.
That is, they move heat from the cold outside air to heat the inside air when used for heating,
and move heat from the indoor air to the warm outdoor air when used for cooling (Department
of Energy, u.d.). A heat pump can extract heat from the room, ventilation air, ground,
groundwater, or lake waters (Energimyndigheten, 2015). The performance of heat pumps is
expressed in terms of their Coefficient of Performance (COP), defined as the amount of useful
heat provided by the pump divided by the amount of electric heat consumed by it. Therefore,
the higher the COP, the more efficient a heat pump is (Industrial Heat Pumps, u.d.).

CHALMERS, Electrical Engineering, Master’s thesis EENX30 23
5 MODELLING
The parts of the HVAC system that are included in the model is ventilation (including both
cooling and heating) and radiation. These are modelled separately. The data used for
modelling them is the energy and ventilation airflow data obtained from IDA ICE simulations
performed by Bengt Dahlgren. For cooling of ventilation air, a physical equation expressing
the effect of supply airflow volume on indoor temperature is used. For heating of ventilation
air and for radiative heating, only relative reductions of their power consumptions are
performed, without a physical equation taking into account their effect on indoor temperature.
Power reductions performed (by all strategies) are multiplied by the marginal emissions factor
of the hour in which they are performed to obtain carbon dioxide reductions.
Battery electric storage and Demand-Side Management are modelled separately to investigate
their individual effects and in combined form to discover possible synergy effects. The model
is designed to discourage electricity use in high-emission hours and encourage it in low-
emission hours. So, the model performs a power reduction in a particular hour if the
emissions in that hour are higher than a certain threshold.
The electricity data used concerns the year 2020, which is a leap year and therefore has 366
days, whereas the energy and ventilation airflow data on JSP, as well as the solar data, stem
from IDA simulations performed the year 2000, which is not a leap year and therefore has
365 days. For the electricity data and the JSP and solar data to match, the JSP (and solar) data
on 28 February is re-used on 29 February, which is the day that is missing in the JSP (and
solar) data.
In this thesis, both peak shaving and load-shifting are considered convenient emission
reduction strategies. However, since the building is not modelled in IDA ICE or some other
energy simulation software, the exact effect of reducing or shifting a load on the thermal
climate of the building is not known. This limits the possibilities for load-shifting, as load-
shifting is a complex task involving shifting energy use from one point in time to another,
necessitating information on indoor climate responses in order to be executed properly. Peak
shaving, on the other hand, is less complex in that it only reduces power consumption. For
this reason, the sole DSM strategy used in this thesis is peak shaving. Even though load
shifting is not used in the sense implied here (i.e. by shifting the building’s energy loads in
time), it is used in another sense, explicated in subchapter 4.3: Energy Storage.
The indoor climate constraints stipulated by SWEA (Arbetsmiljöverket, 2021) restrict the
flexibility in controlling the HVAC system, and thereby the potential environmental benefit of
DSM. If energy reductions were performed without adhering to such regulations, no indoor
environmental quality aspect would constitute a limiting factor, thus allowing higher
reductions than those achieved in this study.
5.1 Cooling of ventilation air
5.1.1 The governing heat transfer equation
The data from the IDA ICE simulation contains the amount of power (in terms of heat) that
the cooling battery consumes every hour for cooling the supply airflow. This power is
translated to electrical power by dividing by the COP of the heat pump: 3.5. The supply
airflow temperature is assumed to be unchanged. Therefore, the changeable factor is the
supply airflow volume. In the physical modelling expounded in this subchapter, the indoor
temperature change expected to follow from a reduction in supply airflow is obtained. A
standard case of a room temperature of 21°C and a supply airflow temperature of 16 °C can
be assumed. The governing equation for the heating that the ventilation air provides to the
building is:
CHALMERS, Electrical Engineering, Master’s thesis EENX30 24
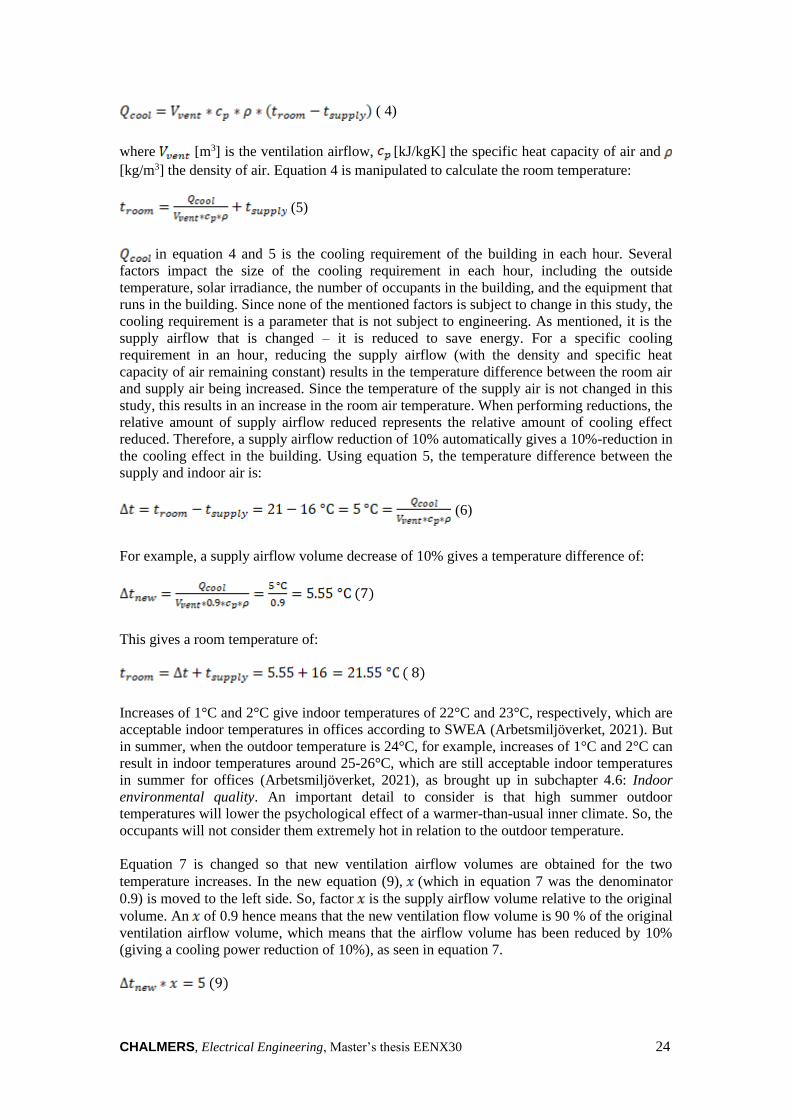
( 4)
where [m3] is the ventilation airflow, [kJ/kgK] the specific heat capacity of air and
[kg/m3] the density of air. Equation 4 is manipulated to calculate the room temperature:
(5)
in equation 4 and 5 is the cooling requirement of the building in each hour. Several
factors impact the size of the cooling requirement in each hour, including the outside
temperature, solar irradiance, the number of occupants in the building, and the equipment that
runs in the building. Since none of the mentioned factors is subject to change in this study, the
cooling requirement is a parameter that is not subject to engineering. As mentioned, it is the
supply airflow that is changed – it is reduced to save energy. For a specific cooling
requirement in an hour, reducing the supply airflow (with the density and specific heat
capacity of air remaining constant) results in the temperature difference between the room air
and supply air being increased. Since the temperature of the supply air is not changed in this
study, this results in an increase in the room air temperature. When performing reductions, the
relative amount of supply airflow reduced represents the relative amount of cooling effect
reduced. Therefore, a supply airflow reduction of 10% automatically gives a 10%-reduction in
the cooling effect in the building. Using equation 5, the temperature difference between the
supply and indoor air is:
(6)
For example, a supply airflow volume decrease of 10% gives a temperature difference of:
(7)
This gives a room temperature of:
( 8)
Increases of 1°C and 2°C give indoor temperatures of 22°C and 23°C, respectively, which are
acceptable indoor temperatures in offices according to SWEA (Arbetsmiljöverket, 2021). But
in summer, when the outdoor temperature is 24°C, for example, increases of 1°C and 2°C can
result in indoor temperatures around 25-26°C, which are still acceptable indoor temperatures
in summer for offices (Arbetsmiljöverket, 2021), as brought up in subchapter 4.6: Indoor
environmental quality. An important detail to consider is that high summer outdoor
temperatures will lower the psychological effect of a warmer-than-usual inner climate. So, the
occupants will not consider them extremely hot in relation to the outdoor temperature.
Equation 7 is changed so that new ventilation airflow volumes are obtained for the two
temperature increases. In the new equation (9), (which in equation 7 was the denominator
0.9) is moved to the left side. So, factor is the supply airflow volume relative to the original
volume. An of 0.9 hence means that the new ventilation flow volume is 90 % of the original
ventilation airflow volume, which means that the airflow volume has been reduced by 10%
(giving a cooling power reduction of 10%), as seen in equation 7.
(9)

CHALMERS, Electrical Engineering, Master’s thesis EENX30 25
Entering a temperature difference of 6 °C (resulting from an increase of 1°C) gives:
(10)
Entering a temperature difference of 7°C (resulting from an increase of 2°C) gives:
(11)
Thus, the factors to be used for increases of 1°C and 2°C, respectively, have been obtained.
As seen in Equations 10 and 11, allowing a higher temperature increase reduces the
ventilation airflow volume to a greater extent. This is thus an example of peak shaving, as the
peak power is reduced by a certain amount. The concept of peak shaving is explained in
subchapter 4.2: Demand-Side Management.
5.1.2 Cooling power reductions
Hours in which electricity consumption for cooling is high, in which carbon dioxide
emissions are simultaneously high, are essential hours for power reductions. Figure 5.1 shows
the electric power consumed by the cooling battery.
Figure 5.1 Electric power consumption for cooling ventilation air in the air-handling
unit.
Two levels of power reductions are performed: 2/7 parts of the supply airflow volume are
reduced for a temperature increase of 2°C, and 1/6 parts are reduced for a temperature
increase of 1°C. Both reductions have a requirement that the cooling battery electric power
consumption must be over 286 W. The purpose of this requirement is to make the model
realistic, as in reality, power reductions would not be performed when power consumption is
low, which in this case is chosen to be interpreted as under 286 W. For the larger reduction
(2/7), the requirement is that the marginal emission factor is over 330 gCO2/kWh, and for the
smaller reduction (1/6), it must be over 240 gCO2/kWh. The purpose of the larger reduction
implemented above 330 gCO2/kWh is to capture the most intense power peaks, and the
purpose of the smaller reduction implemented above 240 gCO2/kWh is to capture the less
intense peaks.
CHALMERS, Electrical Engineering, Master’s thesis EENX30 26
5.2 Heating of ventilation air
In winter, heating is needed, provided by the use of the underground heat pump. As
mentioned, only the underground heat pump is included in the model for heating of
ventilation air, excluding the district heating from the analysis.
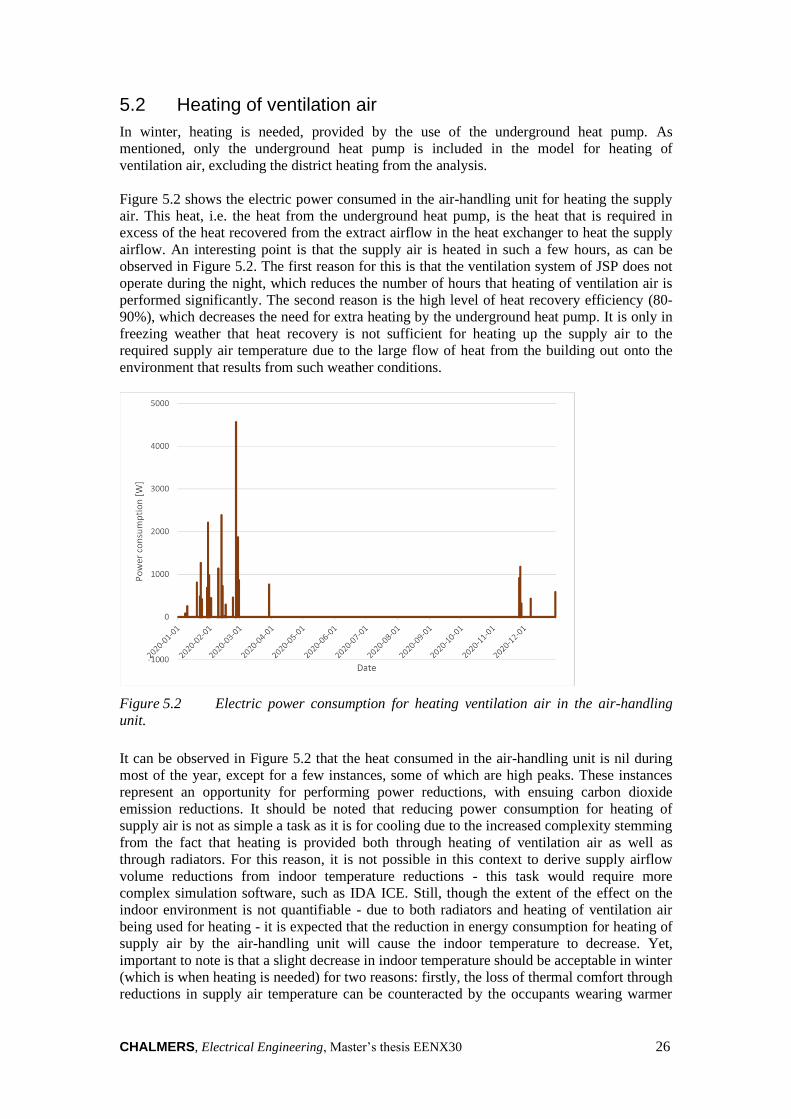
Figure 5.2 shows the electric power consumed in the air-handling unit for heating the supply
air. This heat, i.e. the heat from the underground heat pump, is the heat that is required in
excess of the heat recovered from the extract airflow in the heat exchanger to heat the supply
airflow. An interesting point is that the supply air is heated in such a few hours, as can be
observed in Figure 5.2. The first reason for this is that the ventilation system of JSP does not
operate during the night, which reduces the number of hours that heating of ventilation air is
performed significantly. The second reason is the high level of heat recovery efficiency (80-
90%), which decreases the need for extra heating by the underground heat pump. It is only in
freezing weather that heat recovery is not sufficient for heating up the supply air to the
required supply air temperature due to the large flow of heat from the building out onto the
environment that results from such weather conditions.
Figure 5.2 Electric power consumption for heating ventilation air in the air-handling
unit.
It can be observed in Figure 5.2 that the heat consumed in the air-handling unit is nil during
most of the year, except for a few instances, some of which are high peaks. These instances
represent an opportunity for performing power reductions, with ensuing carbon dioxide
emission reductions. It should be noted that reducing power consumption for heating of
supply air is not as simple a task as it is for cooling due to the increased complexity stemming
from the fact that heating is provided both through heating of ventilation air as well as
through radiators. For this reason, it is not possible in this context to derive supply airflow
volume reductions from indoor temperature reductions - this task would require more
complex simulation software, such as IDA ICE. Still, though the extent of the effect on the
indoor environment is not quantifiable - due to both radiators and heating of ventilation air
being used for heating - it is expected that the reduction in energy consumption for heating of
supply air by the air-handling unit will cause the indoor temperature to decrease. Yet,
important to note is that a slight decrease in indoor temperature should be acceptable in winter
(which is when heating is needed) for two reasons: firstly, the loss of thermal comfort through
reductions in supply air temperature can be counteracted by the occupants wearing warmer

CHALMERS, Electrical Engineering, Master’s thesis EENX30 27
clothes and, secondly, radiators perform radiative heating which can work to counteract
cooler supply air temperature.
5.2.1 Heating power reductions
In contrast to the case of cooling, only one level of power reduction is performed in the case
of heating. The requirement for heating power to be reduced is that the heating battery
consumes more than 286 W of electric power in that hour. Furthermore, the model only
performs heating power reductions when no cooling power reductions are performed - in
order to avoid conflicting power reductions. The emission threshold here is 240 gCO2/kWh,
which is the same as for the smaller reduction in the cooling case. A 10% reduction of the
supply airflow volume is implemented in the case of heating.
5.3 The fan
5.3.1 Effects of cooling and heating reductions
Due to power reductions in the case of cooling and heating of ventilation airflow are
performed through reducing airflow volume, the fan’s power consumption in the ventilation
system is reduced. The electricity consumption of the fan is expressed as:
( 12)
where [Pa] is the pressure difference across the fan and is the fan efficiency. The
pressure difference across the fan can be expressed as:
( 13)
where is a coefficient. So, the pressure difference is dependent on the airflow in square.
Entering (13) into (12) gives:
( 14)
where is a constant including the fan efficiency and the fan coefficient . The IDA ICE
data on the supply and return airflow volumes, and the fan’s power consumption, are used to
obtain constant in equation 14 for every hour. This gives an estimated of 3.74. This
constant can be used to obtain the decreases in power consumption that ensue from
reductions in supply airflow volume .
5.3.2 Fan power reductions
Besides reducing heating and cooling power consumption, reductions of the fan power are
performed with the requirement that no heating or cooling power reduction is performed in
that hour. A higher reduction of 10% of the ventilation airflow volume is performed over a
marginal emission factor of 330 gCO2-eq./kWh, and a lower reduction of 5% over 240 gCO2-
eq./kWh. Because the power consumption of the fan is cubically dependent on the ventilation
airflow volume (as seen in equation 14), these two reductions give supply airflow volume
reductions that are obtained by multiplying the original airflow volumes with the multipliers
obtained in equation 15 and 16:
(15)

CHALMERS, Electrical Engineering, Master’s thesis EENX30 28
(16)
5.4 Radiators
Radiators are devices for heating (or cooling) by the movement of hot (or cold) water
throughout a building structure, operating by the physical phenomenon of radiation.
The power consumption of the radiators after conversion to electrical power is shown in
Figure 5.3. As can be seen, their power consumption is generally high over the year, with the
highest consumption during winter.
Figure 5.3 Electric power consumption of radiators.
Therefore, it is of interest to perform power reductions on the radiators, and in that way, take
advantage of the significant peak shaving and load shifting potential that they offer.
It is clearly observable in the IDA ICE data that the radiators have higher power consumption
during the night- and morning hours, which are hours in which the weather is cooler.
Furthermore, in some hours, radiative heating by the radiators and ventilation air cooling
coincide. This is because cooling of the indoor air is needed to stop the building’s thermal
loads from raising the temperature to an unacceptable level. Radiative heating, however, is
needed for compensating for the radiative cooling effect that windows, which are plenty and
large in JSP, have on the occupants situated close to them.
5.4.1 Radiator power reductions
The requirement for performing power reductions for the radiators is that their electric power
consumption is at least 286 W.
5.5 Battery Electric Storage
A real-life battery is used in this project as a reference battery. Its specifications are as
follows:
• Maximum storage capacity: 200 kWh,
• Maximum charging capacity: 70 kW

CHALMERS, Electrical Engineering, Master’s thesis EENX30 29
• Maximum discharging capacity: 115 kW.
• Minimum storage amount: 20 kWh (to not damage the battery’s health)
• Loss ratio for charging: 5%
• Loss ratio for discharging: 5%
The model implements charging when the marginal emission factor is below 210 gCO2-
eq/kWh, and discharging when it is above 255 gCO2-eq/kWh.
For further analysis, a battery double this size will also be modelled. In that model, all the
specifications (including storage capacity, charging capacity, etc.) are doubled, except the loss
ratios that remain at 5 %.
5.6 Solar cells
The electricity the solar cells generate is used to provide for the building’s operational energy,
thereby reducing the amount of electricity consumed from the grid. The purpose of including
solar cells in this project is to investigate whether their use allows a higher usage of the
battery by creating the possibility to charge it with zero-emission electricity in sunny hours. It
is hypothesised that the battery can achieve higher carbon dioxide reductions with the
availability of solar cells than without. By solar cells providing power in the sunny hours in
noon and afternoon, there is the possibility of reducing the afternoon peak. So, the benefit of
solar PVs lies both in reducing the amount of electricity purchased from the grid and in
reducing electricity peaks. The potential for emission reduction is especially significant in
peak hours when electricity production causes large amounts of carbon dioxide emissions.
The second purpose of solar cells in this project is to investigate whether DSM has a larger
emission reduction potential with solar cells available. In implementing DSM with a battery,
it is expected that even higher increases in carbon dioxide reductions are achievable with solar
cells than without. This is because carbon dioxide reductions occur in two ways: by solar
power replacing power purchased from the grid through battery charging and discharging, as
well as by reducing the use of emission-heavy electricity purchased from the grid through
DSM (in hours with less solar production). Hence, the benefit of both DSM and BES are
taken advantage of in this combination. Nevertheless, it is important to note, as observed in
the results of Nyholm (2015), that it is expected that the emission reduction potential of DSM
is less in days with more sunlight compared to days with less sunlight. This is because a larger
share of the power used on sunny days is not purchased from the grid but is instead locally,
carbon-neutrally produced, leaving less emission-heavy electricity for the DSM strategy to
replace. Still, this effect is not expected to significantly reduce the achievable reductions in
this combination since the battery is able to replace grid-purchased electricity with stored
solar power.
The solar PVs provide electricity for the whole building complex, including both HVAC-
related energy and operational energy. Though the operational energy of JSP is not part of the
scope of this study, for the instalment of solar cells they are necessary for knowing how much
electricity is available for storage. This available amount is equal to the amount of solar
power generated minus the operational energy and energy used in the HVAC system. For this
purpose, SVEBY’s (2013) standard for operational energy consumption of office buildings is
used: 28 kWh/m2 during office hours. The operational energy of JSP per year is calculated in
equation 17.
(17)
Equation 18 gives the operational energy per working hour. The number of days in a year,
365, is multiplied by 5/7 to include 5 working days per week, and from this 30 days are

CHALMERS, Electrical Engineering, Master’s thesis EENX30 30
subtracted to account for one year’s vacation. The number of working days, calculated inside
the paranthesis, is then multiplied by 10 hours to account for 10 working hours per working
day.
(18)

CHALMERS, Electrical Engineering, Master’s thesis EENX30 31
6 RESULTS
This chapter first presents the results of DSM and BES and their combination in absolute and
relative numbers. It then goes on to present the emissions of each strategy with BES in
relation to the life-cycle emissions of the battery. All results presented concern reductions
achieved in one year.
6.1 Emission reductions
Figure 6.1 shows the emission reductions of the strategies in kg of carbon dioxide equivalent.
17752
10459
17752
5033
2744
3473
5033
2744
2389
1900
2161
3682
2379
5905
3647 4
869 6
189
3562
N O S O L A R ( 2 0 0 K W H )
7 2 0 M2 ( 2 0 0 K W H )
3 2 0 M2 ( 2 0 0 K W H )
N O S O L A R ( 4 0 0 K W H )
7 2 0 M2 ( 4 0 0 K W H )
Em
issio
ns [kg
co
2-E
Q.]
Only solar DSM BES DSM & BES
Figure 6.1 Emission reductions in absolute numbers.
Figure 6.2 shows the relative reductions of the strategies. The reductions of the DSM strategy
is given relative to the emissions of the system without any strategy implemented. It is the
same case for BES. However, for the DSM & BES, it is given relative to the emissions
achieved by the DSM strategy to show the effect of adding battery storage in the case of
already having implemented DSM. In the cases with solar cells, the reductions by any strategy
(DSM, BES, or DSM & BES) with a given size of solar panel is given relative to the
emissions of the building when assuming that size of solar panel. For example, the reductions
achieved by BES when there are 720 m2 of solar cells are given relative to the emissions by
the building when assuming 720 m2 of solar cells. The emissions by the building when
assuming 720 m2 of solar cells is equal to its original emissions (without solar cells) minus the
reductions that the 720 m2 solar panel achieves.

CHALMERS, Electrical Engineering, Master’s thesis EENX30 32
Figure 6.2 Emission reductions in relative numbers.
6.2 Life-cycle emission analysis
Investing in a battery costs, both financially and environmentally. This study focuses
exclusively on the environmental part of sustainability. In Figure 6.3, the life-cycle emissions
of investing in a battery are put in relation to the emission reductions achieved by the
strategies to further the environmental analysis of DSM and battery electric storage. It is
assumed in the life-cycle analysis that the lifetime of the battery is 15 years and that the
emission savings achieved are the same every year. The life-cycle impact of the battery based
on an average European electricity mix is 65 kg CO2/kWh. The life-cycle impact in this
context considers only the extraction of resources to production – not the use of the battery
(Ros, 2021). For a 200 kWh battery, that is 13000 kg CO2. For a 400 kWh battery, it is 26000
kg CO2. Dividing the life-cycle impact of the battery by the emission reduction achieved by
using the battery over a year gives how many years it would take to compensate for its
emissions, i.e. the emission payback time. This calculation is performed for each strategy, and
the results are shown in Figure 6.3.

CHALMERS, Electrical Engineering, Master’s thesis EENX30 33
Figure 6.3 Emission payback time.
CHALMERS, Electrical Engineering, Master’s thesis EENX30 34
7 DISCUSSION
The cases vary in the amount of solar cells and in battery size. They have been compared in
their quantified emission reductions, which allows for making concrete comparisons.
However, because the assumptions made in the model and the interpretation of the results
cannot be claimed to be absolute truths, they require more advanced discussion. This chapter
seeks to address these issues, thus making the findings of the thesis more understandable and
applicable in a practical context. This, in turn, contributes to fulfilling its prescriptive aim.
7.1 Marginal versus Average Emissions factor
As brought up in subchapter 4.1.2: Quantifying emissions, the marginal emissions factor is
considered representative of short-term demand changes and is therefore suitable for load-
shifting decisions (Listgarten, 2019). It is observable in the electricity data that the marginal
emissions are higher, and fluctuate more heavily than the average emissions. This indicates
that the reductions achieved by using MEF are higher than what would be achieved if AEF
were used. Even though using MEF is justifiable for the purpose it is used for in this thesis,
i.e. for performing demand changes, the choice of MEF over AEF is not obvious. Using AEF
could also be argued for, even though it is to be used for load-shifting, by pointing out that
when replacing grid-purchased electricity with solar power, it is the emissions of the
electricity mix at that moment that is replaced. In making this argument, it is possible to liken
the electricity emissions to the electricity price, which represents the production mix at that
specific moment. Since reducing grid-purchased electricity at a specific moment means
avoiding the electricity cost that represents the whole production mix, such a replacement also
means to replace the average emissions of the production mix at that moment. For this reason,
the higher emissions achieved due to the choice of MEF over AEF could be seen as a possible
shortcoming, giving exaggerated carbon dioxide reductions. Still, it could be argued that
choosing AEF over MEF would constitute a shortcoming by pointing out that it does not
represent the short-term effect of demand changes, as expounded on in subchapter 4.1.2:
Quantifying emissions. The discussion on this matter suggests, as is well known, that
choosing what type of emission factor to choose for quantifying emissions is not a simple task
– it is a task involving complexities. The important thing is to consider the context in which
the emission factor is to be utilised when arguing for the chosen type of emission factor,
which has been done in this thesis.
7.2 Demand-Side Management & Battery Storage
The results show that without solar cells, DSM gives around double the amount of emissions
of BES (see Figure 6.1), which might be considered a surprising result; battery storage is
generally expected to contribute to greater savings than merely performing power reductions.
The first reason for this result is that all the reductions by the battery are achieved by using
battery-stored electricity, which is exclusively electricity that has been purchased from the
grid. Hence, the only profit (emission-wise) is the difference in emission between the charged
and the discharged electricity. The DSM strategy, on the other hand, does not have this
limiting factor; it only concerns itself with reducing power consumption in high-emission
hours. The second reason lies in the battery losses (5 %) when charging and discharging. For
the battery to provide CO2 reductions, there has to be a difference between the emission
factors of the charged electricity and the discharged electricity large enough so as to offset the
charging and discharging battery losses. Except for bringing pure losses in charging and
discharging hours, the battery losses ratio limits the possible hours that the battery can charge
and discharge in, further limiting the battery’s reduction potential. In the DSM strategy,
conversely, all power reductions give pure profit (emission-wise). Even when assuming that
the same peaks are shaved by the BES as by the DSM, and to the same extent, the DSM
would still achieve significantly larger emission reductions because of the emission ‘penalty’
CHALMERS, Electrical Engineering, Master’s thesis EENX30 35
that the BES has to pay for charging the battery with grid-purchased electricity, and because
of the charging and discharging loss ratio, leaving less for profit. For the BES to give more
reductions than the DSM, it would have to provide for significantly more of the electricity
demand than is reduced by the DSM in order to compensate for the emission it pays to charge
electricity and the loss ratio. The third reason lies in the emission thresholds of DSM and
BES. For DSM, the high level of power reductions is implemented when the emission is
higher than 330 g CO2/kWh, and the low level of power reductions is implemented when it is
higher than 240 g CO2/kWh. But the battery is only charged when the emissions are less than
210 g CO2/kWh, which occurs in much fewer hours than it is higher than 240 g CO2/kWh
(which is the limit of the low level of power reductions). This gives the DSM a higher
emission reduction potential than BES, which gives it a greater opportunity to take advantage
of differences in electricity emission. In other words, the emission limit of the battery is so
restrictive so that it cannot take advantage of differences in emission factors.
A battery double the size of the original one is modelled in order to investigate the system’s
sensitivity to the size of the battery. It is seen in Figure 6.1 that the 400 kWh battery gives
3682 kg CO2-eq. of reductions, which is significantly higher than the 2389 kg CO2-eq that the
200 kWh battery gives. This finding suggests that the size of the battery is a limiting factor in
its achievable emission reductions. A larger battery can store more energy, which can provide
for more of the electricity demand of the reference building. Hence the resulting increases in
the reductions by BES with a doubled battery size. This result is in line with the above
reasoning that the battery has to provide for significantly more of the electricity demand than
the DSM reduces in order to compensate for its emission penalty and the loss ratio; it is here
seen that a larger battery, allowing more electricity storage, increases the extent to which the
peaks are reduced in BES, but still not sufficiently to reach the reductions of DSM: 5033 kg
CO2-eq.
It can be observed in Figure 6.2 that without solar cells, DSM & BES achieve 17.5 %
emission reductions. But with the 400 kWh battery, DSM & BES achieves 18.3 % emission
reductions. An interesting point here is that the increased emission reductions by the 400 kWh
battery compared to the 200 kWh battery when implementing DSM & BES, i.e. 18.3 %
versus 17.5 %, is smaller than the increase observed when only implementing BES, i.e. 9.5 %
versus 6.2 %. In other words, a larger effect of the battery size is seen when implementing
only battery storage than when implementing DSM & BES. This is due to the model having
the possibility to implement DSM in hours when the battery is not able to because of its
smaller capacity in the 200 kWh case. In other words, DSM takes on a greater role in the case
when the battery capacity is smaller. For this reason, when the strategies are implemented
together, they are not as affected by the battery size. The same pattern is observed in the
absolute numbers, shown in Figure 6.1.
The reductions achieved by the model of this study are limited by its design, as the model
implements power reductions and/or energy storage for each hour based on each hour’s data,
starting from the first hour of the year. That is to say that it implements the strategies on each
hour as a disengaged unit, which limits its optimising potential. If, instead, the model were an
artificially intelligent model, it can be imagined that it would ingest the data of all hours and
therefrom extract a solution that is optimal as seen to the whole year. It would then choose the
most optimal hours to perform power reductions and charge and discharge in. Such a model
would be expected to give higher reductions. It is due to the simplicity of the model that arises
from designing it in Microsoft Excel that such an optimisation has not been possible. For such
an advanced optimisation, more advanced software would be necessary. On the other hand, it
would be necessary for such an artificially intelligent model to have access to weather
forecasts to base its optimizations on. Hence, when implemented in reality, it would not
necessarily give higher reductions than a simpler model such as that of this thesis. It should be
noted that the model in this thesis uses energy consumption and ventilation airflow data from
a previous year, which facilitates its optimization task. This creates uncertainty regarding how

CHALMERS, Electrical Engineering, Master’s thesis EENX30 36
realistic the results obtained from this thesis are, as in reality, it is more difficult to perform
power reductions when future outside weather is not known beforehand.
A second factor impacting the results relates to the implementation of power reductions. For
cooling of ventilation air, two temperature increases are implemented, which are included in
acceptable ranges as relating to indoor thermal climate - see subchapter 4.6: Indoor
environmental quality. Heating of ventilation air and radiators, however, have been assigned
relative reductions that are assumed to be reasonable. So, all power reductions performed in
the DSM strategy have magnitudes that are expected to be acceptable. Thus, the idea in the
DSM strategy in this project is to perform power reductions that are acceptable for the
occupants and not exceeding that. The problem is that the number of hours that power
reductions, i.e. peak shaving, are performed in, and their extent, are limited by indoor
environmental factors – e.g. temperature increases of 1°C and 2°C in the case of cooling.
Were load shifting instead implemented, where power consumption would be increased in a
few hours before or after those in which reductions are performed, the negative effect that the
power reductions have on the indoor environment would be compensated for, at least partly.
This would allow for more optimisation of the load profile as the flexibility would be
increased; a power reduction already performed by this model could by such a model be
increased in magnitude as it would be compensated for partly in another hour. In this model
of this study, on the other hand, load-shifting is not performed, at least not in a short-term
perspective, which means the power reductions’ indoor environmental effect is not
compensated for, which in turn limits its emission reduction potential.
7.3 Solar photovoltaics
With the ongoing trend of solar PV instalments on both residential and commercial buildings,
it is reasonable to assume the availability of solar cells on the roofs of the reference building.
The inclusion of solar PVs in the analysis is important in that the effects of BES and DSM can
be evaluated both on the reference building as it is in reality – i.e. without solar cells - as well
as with available solar power. In such a way, more guidance concerning the implementation
of DSM and BES can potentially be provided.
Figure 6.1 shows that DSM can perform more power reductions with 320 m2 than with 720 m2
of solar cells. The reason for this result is that the model implements power reductions of
electricity used by the building that is only purchased from the grid and not what is generated
by the solar cells, since performing power reductions on solar power does not give emission
reductions. Thus, the larger solar panel area providing for more of the energy demand of the
reference building limits the potential hours that the model can perform power reductions in.
The battery is charged in few hours over the year by solar power. This is the case both when
implementing BES and BES & DSM. The reason behind this is that the generated solar power
is less than the demanded power of the reference building in almost every hour, leaving little
for storage. Hence, the size of the solar panel is a limiting factor for the extent to which the
battery can charge zero-emission power. Based on this, it is expected that having a
significantly larger solar panel would give more power for charging the battery. But, the size
of the solar panel in the original case (720 m2) is not increased because it is based on an
estimation of the size of the roofs of the reference building. For this reason, no analysis of a
larger solar panel is conducted – since the roof of the reference building is not estimated to be
able to carry a larger panel. Besides the original size, only a smaller size of 320 m2 is
modelled. Having two different area sizes (320 m2 and 720 m2) of solar cells fulfils the
purpose of discovering the potential sensitivity of the system regarding the amount of solar
power generated.
The results in Figure 6.1 show that with 320 m2 of solar cells, more reductions are achieved
by the battery than with 720 m2, which is a counterintuitive result. The explanation for this

CHALMERS, Electrical Engineering, Master’s thesis EENX30 37
finding is that with more solar power available, there are more hours in which the energy
demand of the reference building is completely provided for by solar power. This means that
there are fewer hours in which grid-purchased electricity emissions need to be replaced. The
consequence of this is that the model does not need to discharge the battery in as many hours
as it does with the smaller solar panel size. Less discharging of the battery also limits its
potential to charge low-emission power. The ultimate result is a lower usage of the battery
with the larger solar panel size.
The results in Figure 6.2 show that BES gives higher relative reductions with 720 m2 than
with 320 m2 of solar cells: 9.0 % versus 7.6 %. The reason behind this lies in the higher
reductions that the 720 m2-sized panel (without any strategy) achieve than the 320 m2. This
makes the emissions of the building with 720 m2 of solar cells lower than with 320 m2, which
makes the reductions by the battery in the 720 m2 case relatively higher, though it is lower in
absolute terms.
DSM & BES gives approximately the same amount of reductions with 320 m2 as with 720 m2
of solar cells in relative terms, as seen in Figure 6.2. But it is seen in Figure 6.1 that in
absolute terms, DSM & BES gives significantly higher reductions with 320 m2 of solar cells
than 720 m2. This large difference in absolute terms can be explained by the fact that the
energy demand is provided for by solar power in fewer hours in the case of 320 m2 than in the
case of 720 m2 of solar cells, leaving more hours for the DSM to work with. In other words,
DSM has less potential for emission reductions in the 720 m2-case because the model only
implements power reductions of the electricity used by the building that is purchased from the
grid and not what is generated by the solar PVs. So, in the case of implementing DSM &
BES, the reduced amount of hours that solar power provides for the energy demand of the
building with the smaller solar panel size increases the potential both of using the battery-
stored electricity, as well as performing power reductions. However, in relative terms, they
are close to equal because the emission of the building is lower with 720 m2 of solar cells.
7.4 Life cycle-emissions of the battery
It takes 10.9 years to compensate for the emissions by a 200-kWh battery without solar cells
on the reference building, but 29.8 years when implementing storage in conjunction with
DSM – see Figure 6.3. This finding is somewhat confounding if not explained, as
implementing both storage and DSM logically should give higher reductions than only BES.
To understand this finding, it is important to consider that the emission reductions by DSM &
BES that the emission payback time is derived from is calculated in relation to the emission
reductions of DSM. This is done by subtracting the emissions of DSM from the emissions of
DSM & BES, for the purpose of stating the reductions of DSM & BES achievable in excess
of the reductions already achievable by only implementing DSM. So, the significantly longer
emission payback time when implementing DSM & BES is because it is calculated based on
what the battery can achieve in excess of what the DSM has already achieved, leaving little
for the battery to work with.
With the assumption of 720 m2 of solar cells on the reference building, it takes 13.7 years for
the battery to compensate for its emissions and 28.8 years when implementing storage in
conjunction with DSM, as seen in Figure 6.3. For BES, there is a notable difference in
emission payback time when assuming 720 m2 of solar cells versus not on the reference
building: 13.7 versus 10.9 years. This result is not surprising considering that the absolute
amount of emissions of the building is lower for 720 m2 of solar cells than without solar cells.
The emissions of BES used to calculate the emission payback time with solar cells is
calculated as the reductions achieved by the battery in excess of those of the solar cells, as
discussed in subchapter 7.3: Solar Photovoltaics. This gives less potential for the battery to
discharge, and by extension to charge, electricity, which results in less emission reductions,
which in turn results in longer emission payback times.

CHALMERS, Electrical Engineering, Master’s thesis EENX30 38
Figure 6.3 shows that it takes 7.1 years to compensate for the emissions of the battery when
implementing a 400 kWh-sized battery without solar cells and 22,5 years when implementing
BES & DSM. These are both shorter than those for a 200 kWh battery in the original case.
This signifies that the battery size is a limiting factor to the achievable reductions by both
BES and DSM & BES.
Figure 6.3 shows that implementing the 400 kWh battery without DSM gives a longer
emission payback time when there are 720 m2 of solar cells than without, similar to what is
observed with the 200 kWh battery. But, implementing the 400 kWh battery with DSM gives
a significantly longer emission payback time with 720 m2 of solar cells than without. This is
in contrast to the 200 kWh case, where the emission payback time is approximately the same
with and without solar cells when implementing DSM & BES. The reason for this result is the
doubled amount of emissions that result from a double-sized battery, which the DSM & BES
is not able to compensate for because of the solar cells reducing both the potential of the DSM
strategy to perform power reductions as well as the potential of the battery to discharge
electricity.
7.5 Further considerations
In this study, district heating is completely excluded from the analysis, though it in reality is
part of the energy system of the reference building. This simplification was made due to the
limited amount of time for performing the thesis, though the author understands that it makes
the study less representational of reality. Including district heating in the analysis would have
a direct effect as it would be part of the DSM strategy. An additional energy alternative would
give the possibility to switch between energy carriers, allowing something called a “joint-
optimisation between energy systems” (Rydberg & Karlsson, 2019). Undoubtedly, this would
widen the scope of possibility as relating to emission reduction, especially since district heat,
like electricity, varies in its carbon dioxide emissions on an hour-to-hour basis. Performing a
similar future study like this with district heating included (if the building of such a study uses
it) would mean taking the results of this study, which justifies the investment in a battery and
the implementation of DSM, even closer to reality.
The modelling in this project is conducted in Microsoft Excel, which is considered a simple
tool in the context of building energy calculations. Besides for simplifying purposes, Excel
was chosen due to the energy consumption and ventilation airflow data on the reference
building already originating from IDA ICE, which makes the data reliable. Even though the
data stems from IDA ICE, the downside of only modelling the building in Excel and not in a
more complex software is that the effect of power reductions on the indoor climate of the
reference building is not considered. This makes it impossible to know if more or less power
reductions would be possible in reality. It could be the case that more reductions are possible
in reality but not detectable in the simple Excel model, or that the effects that the reductions
have on the indoor climate are exaggerated. It could also be the case that their effects are
understated. Hence, the model is not completely realistic.
Another aspect worth considering in this study is that it considers an office building
specifically. If it instead were an industrial building, the results would presumably be
different. Industrial buildings typically have intense peak demands, which makes for greater
emission reduction potential.
When it comes to the electricity system, more renewable, zero-emission energy is
incorporated every year, not least in Sweden. This reduces the possibilities for emission
reduction, as less emission-heavy will be left to work with. This is important to consider in
future studies.
CHALMERS, Electrical Engineering, Master’s thesis EENX30 39
8 CONCLUSION
This study was undertaken to assess the environmental sustainability of DSM and battery
electric storage. This has been accomplished by modelling the HVAC system and
implementing power reductions and charging and discharging based on varying carbon
dioxide emissions in the Swedish electricity system. In this way, emission reductions and
emission payback times for the different cases have been obtained, which can be used to
prescribe the most environmentally viable alternative in the geographic and functional context
of the reference building.
With the assumption of the reference building having no solar cells, implementing DSM gives
significant emission reductions, as does implementing battery storage, though the reductions
of DSM are double those of the battery. Hence, both strategies are recommendable in the case
of the reference building having no solar cells. With the availability of solar cells, the two
strategies are also recommendable based on proven emission reductions. Implementing DSM
in conjunction with BES gives significant emission reductions both when there are no solar
cells as well as when there are. In relative numbers, they achieve the highest emission
reductions with the larger solar panel size.
Implementing DSM in conjunction with BES gives the shortest payback time when there are
320 m2 of solar cells on the reference building. When it comes to battery size, investing in a
battery of 400 kWh gives even higher emission reductions than a 200 kWh battery. What
strengthens the case of the 400 kWh battery even further is that it has the shortest emission
payback time when implemented without DSM. However, it is implementing the 400 kWh
battery in conjunction with DSM that gives the highest emission reductions in absolute terms.
This thesis proves that both battery electric storage, as well as Demand-Side Management,
can reduce carbon dioxide emissions from an office building’s energy use, and can therefore
be called environmentally sustainable. The prescriptive aim of the study is hence fulfilled by
the recommendation that battery electric storage and DSM are both viable strategies for office
buildings and that especially for the reference building used in this study – and for any office
building similar in size - battery electric storage of 400 kWh should be used in conjunction
with the implementation of DSM.
The mitigation of environmentally dangerous gases cannot be realised without the transition
to renewable energy, and the transition to renewable energy cannot be realised without the
adaption of energy consumption patterns to the intermittent and variable supply of renewable
energy. Adapting users’ energy consumption as relating to time by storage and DSM creates
the potential to fully take advantage of the high supply of renewable energy in Sweden, and
by extension, allows for the continuous transition from a fossil-based to a renewable
electricity system. Hence, the two strategies – DSM and battery electric storage - constitute
important assets for fighting the global problem of climate change.

CHALMERS, Electrical Engineering, Master’s thesis EENX30 40
BIBLIOGRAPHY
Advanced Energy, 2018. www.advancedenergy.org. [Online]
Available at: https://www.advancedenergy.org/2018/03/13/why-is-peak-demand-a-concern-
for-utilities/
[Accessed 29 03 2021].
Aghniaey, S. et al., 2018. Optimizing thermal comfort considerations with electrical demand
response program implementation. Building Serivices Engineering Research & Technology,
39(2), pp. 219-231.
Albadi, M. H. & El-Saadany, E. F., 2007. Demand Response in Electricity Markets: An
Overview. IEEE Power Engineering Society General Meeting, pp. 1-5.
Arbetsmiljöverket, 2021. www.av.se. [Online]
Available at: https://www.av.se/inomhusmiljo/luft-och-ventilation/allmanventilation/
[Accessed 18 03 2021].
Arbetsmiljöverket, 2021. www.av.se. [Online]
Available at: https://www.av.se/inomhusmiljo/temperatur-och-klimat/
[Accessed 21 04 2021].
ASHRAE, 2010. ANSI/ASHRAE Standard 55- Thermal Environmental Conditions for Human
Occupancy. s.l.:s.n.
ASHRAE, 2019. High-Performance Buildings Simplified - Designing, Constructing, and
Operating Sustainable Commercial Buildings. s.l.:American Society of Heating, Refrigerating
and Air-Conditioning Engineers, Inc. (ASHRAE).
Boverket, 2019. www.boverket.se. [Online]
Available at: https://www.boverket.se/en/start/building-in-sweden/swedish-market/laws-and-
regulations/national-regulations/building-regulations/
[Accessed 01 04 2021].
Corradi, O., 2019. www.tmrow.com. [Online]
Available at: https://www.tmrow.com/blog/marginal-emissions-what-they-are-and-when-to-
use-them/
[Accessed 09 02 2021].
Department of Energy, n.d. www.energy.gov. [Online]
Available at: https://www.energy.gov/energysaver/heat-and-cool/heat-pump-systems
[Accessed 02 02 2021].
Ehnberg, J., 2020. L15-16 Smart grids. Gothenburg: Chalmers University of Technology.
Electricity Map, 2021. www.electricitymap.org. [Online]
Available at: https://www.electricitymap.org/map
[Accessed 15 03 2021].
Energiföretagen, 2020. energiforetagen.se. [Online]
Available at: https://www.energiforetagen.se/pressrum/pressmeddelanden/2019/elstatistik-for-
2019-storsta-nettoexporten-nagonsin/
[Accessed 30 04 2021].
Energimyndigheten, 2015. www.energimyndigheten.se. [Online]
Available at: https://www.energimyndigheten.se/en/sustainability/households/heating-your-
home/heat-pump/
[Accessed 12 03 2021].
Energimyndigheten, 2020. Energiläget 2020, Stockholm: s.n.
CHALMERS, Electrical Engineering, Master’s thesis EENX30 41
Energimyndigheten, 2020. Scenarier över Sveriges energisystem , s.l.: s.n.
Engineering Toolbox, 2008. www.engineeringtoolbox.com. [Online]
Available at: https://www.engineeringtoolbox.com/air-heating-systems-d_1136.html
[Accessed 19 02 2021].
Fotouhi, A. & Steen, D., 2019. Innovative energy management system for smart buildings and
grid interactions, s.l.: s.n.
Gelazanskas, L. & Gamage, K. A., 2014. Demand side management in smart grid: A review
and proposals for future direction. Sustainable Cities and Society, pp. 22-30.
Haegermark, M. & Edenhofer, V., 2019. Effektreducering i lokalfastigheter - förstudie om
erfarenheter och intresse av olika metoder för att minska effekttoppar, s.l.: BELOK.
Hafiz, F., de Queiroz, A. R., Fajri, P. & Husain, I., 2019. Energy management and optimal
storage sizing for a shared community: A multi-stage stochastic programming approach.
Applied Energy, pp. 42-54.
Hellström, C., Karlsson, J. & Rundqvist, M., 2019. Effektreduceringsmetoder, s.l.: BeBo.
Holmström, C., 2020. www.ekonomifakta.se. [Online]
Available at: https://www.ekonomifakta.se/fakta/energi/energibalans-i-sverige/elproduktion/
[Accessed 09 02 2021].
IEA, 2020. www.iea.org. [Online]
Available at: https://www.iea.org/data-and-statistics/charts/evolution-of-li-ion-battery-price-
1995-2019
[Accessed 28 January 2021].
Industrial Heat Pumps, n.d. industrialheatpumps.nl. [Online]
Available at: https://industrialheatpumps.nl/en/how_it_works/cop_heat_pump/
[Accessed 25 02 2021].
Karlsson, A., 2008. Ventilation system design: a fluid dynamical study with focus on demand-
control ventilation. Gothenburg: Chalmers.
Listgarten, S., 2019. paloaltoonline.com. [Online]
Available at: https://www.paloaltoonline.com/blogs/p/2019/09/29/marginal-emissions-what-
they-are-and-when-to-use-them
[Accessed 26 04 2021].
Lizana, J., Friedrich, D., Renaldi, R. & Chacartegui, R., 2018. Energy flexible building
through smart demand-side management and latent heat storage. Applied Energy, 230(2018),
pp. 471-485.
Logenthiran, T. & Srinivasan, D., 2012. Demand Side Management in Smart Grid Using
Heuristic Optimization. IEEE Transactions on smart grid, 3(3).
Next Kraftwerke, n.d. www.next-kraftwerke.com. [Online]
Available at: https://www.next-kraftwerke.com/knowledge/what-is-peak-shaving
[Accessed 15 03 2021].
Nilsson, A., 2017. Energilagring i byggnader - En litteraturstudie om batterilagring,
vätgaslagring och en utredning om möjligheter till energilagring av förnyelsebar energi, s.l.:
s.n.
Nyholm, E., 2015. Demand response and distributed solar generation in the Swedish
residential sector, Gothenburg: Chalmers University of Technology.
CHALMERS, Electrical Engineering, Master’s thesis EENX30 42
Nyholm, E., Goop, J., Odenberger, M. & Johnsson, F., 2016. Solar photovoltaic-battery
systems in Swedish households- Self-consumption and self-sufficiency. Applied Energy, pp.
148-159.
Parmar, J., 2011. https://electrical-engineering-portal.com. [Online]
Available at: https://electrical-engineering-portal.com/demand-factor-diversity-factor-
utilization-factor-load-factor
[Accessed 29 03 2021].
Paulsson, U., 2020. Examensarbete - Att skriva uppdragsbaserade uppsatser och rapporter.
Lund: Studentlitteratur.
Péan, T. Q., Salom, J. & Costa-Castelló, R., 2019. Review of control strategies for improving
the energy flexibility provided by heat pump systems in buildings. Journal of Process
Control, pp. 35-49.
Ros, A., 2021. - , s.l.: s.n.
Rydberg, S. & Karlsson, A., 2019. FED - Technical Final Report, Gothenburg: s.n.
Rydberg, S. & Karlsson, A., 2019. FED Technical Final Report, Gothenburg: s.n.
Schumm, B., 2021. www.britannica.com. [Online]
Available at: https://www.britannica.com/technology/battery-electronics
[Accessed 29 03 2021].
Strbac, G., 2008. Demand side management: Benefits and challenges. Energy Policy, pp.
4419-4426.
SVEBY , 2013. Brukarindata kontor, Stockholm: s.n.
Svensk Ventilation, n.d. www.svenskventilation.se. [Online]
Available at: https://www.svenskventilation.se/ventilation/olika-satt-att-ventilera/ftx-
varmeatervinning/
[Accessed 03 03 2021].
SvK, 2019. Sveriges Produktion, Förbrukning och Import/Export, s.l.: SvK.
Sweden Green Building Council, 2021. www.sgbc.se. [Online]
Available at: https://www.sgbc.se/certifiering/miljobyggnad/
[Accessed 01 04 2021].
Teli, D., 2020. Support material for: Indoor Environmental Quality, s.l.: s.n.
The Energy Department, 2017. www.energy.gov. [Online]
Available at: https://www.energy.gov/eere/articles/consumer-vs-prosumer-whats-difference
[Accessed 29 03 2021].
U.S. Department of Energy, 2012. Dynamic Line Rate Report to Congress , s.l.: s.n.
White arkitekter, n.d. whitearkitekter.com. [Online]
Available at: https://whitearkitekter.com/project/johanneberg-science-park/
[Accessed 20 04 2021].
Zhang, Y., Lundblad, A., Campana, P. E. & Yan, J., 2016. Employing Battery Storage to
Increase Photovoltaic Self-sufficiency in a Residential Building of Sweden. Energy Procedia,
pp. 455-461.