Advancing the Future of Energy Advancing the Future of Energy

1PLC Roadmap 2021 - 2024
THE ENERGY WHICH CREATES THE FUTURE
Roadmap 2021 - 2024
PLC Roadmap 2021 - 2024
INDEX
Introduction
Key points
FY2020 Results - Highlights
Back up
Market and strategy
Renewables global marketPLC current mission and future goalsConsolidated growth scenarioGuidelines per entity
3PLC Roadmap 2021 - 2024
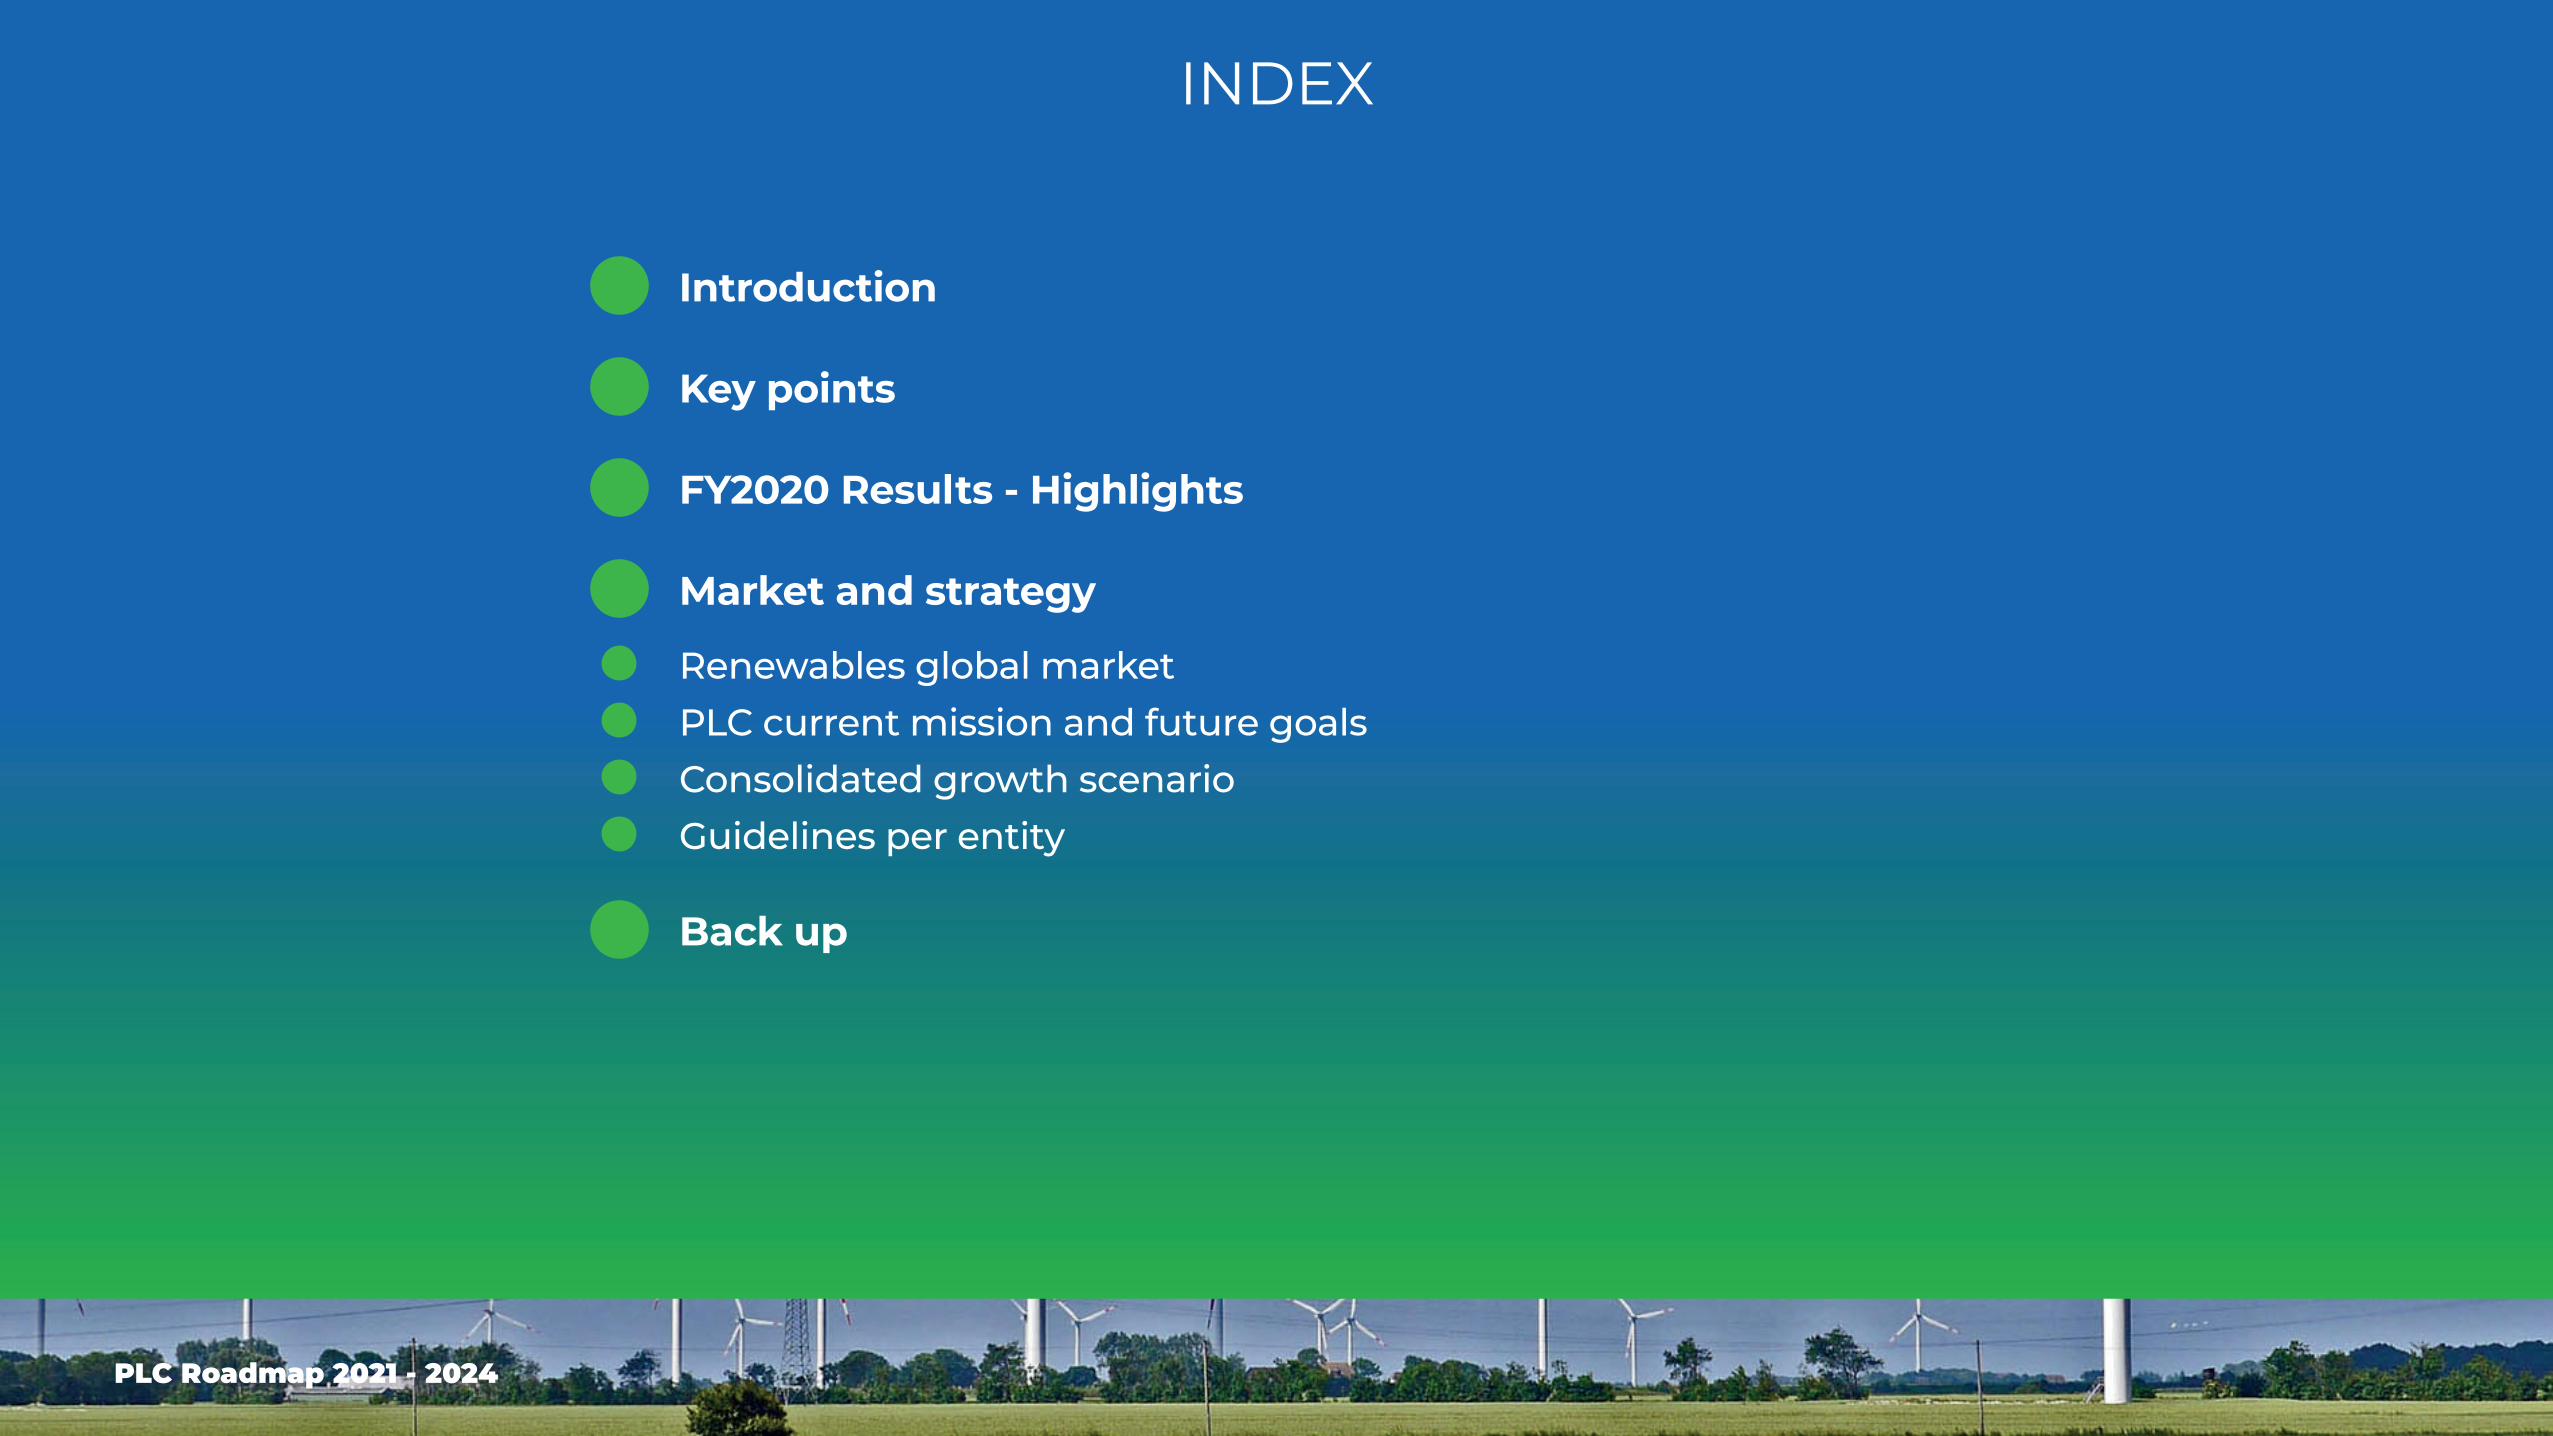
THE SPEAKERS
Cecilia Mastelli, CFOCFO of PLC since 2016Previous experience in INDI (as Director of Financial Reporting and Consolidation) and EY (Audit Manager)Degree in Economics
Luciano Garofano, Head of M&AMember of the Board of Directors since 2016, he holds the position of Head of M&APreviously Tad Metals, Enertad, AlerionDegree in Business and Economics
Michele Scoppio, CEOCEO of PLC since 2018, joined the PLC group in 2014 as PLC System Chief Operating Officer19 years of experience in the renewable energy sector. He managed the design, implementation, financing and construction of 1000 MW (over 25 plants)
Electrical engineer
Previously: Renexia, Toto Costruzioni, Iberdrola, Alerion, EOS Windenergy
4PLC Roadmap 2021 - 2024
INTRODUCTION
Considering the current macroeconomic context and in a very difficult year as 2020 was, the results of the PLC group should be considered more than positive; in fact, we brilliantly overcame all the obstacles and uncertainties along our wayIn such context we wanted to announce the Industrial Plan which represents a fundamental step in our growth and transformation process. The intent is to provide our shareholders with greater visibility and transparency onthe long-term objectives, so that the sustainable development strategy can be fully understood and implemented. This is for us a fundamental step in the transition process we are experiencing; not only ecological and energetic, but also digital.In the «road map» to 2024 we wanted to set ambitious targets thanks to which we expect an increase in volumes, EBITDA and comprehensive income.
Michele Scoppio CEO at PLC SpA

5PLC Roadmap 2021 - 2024
1. PROJECT DEVELOPMENT 2. CONSTRUCTION OF THE PLANTS3. ENERGY PRODUCTION AND PLANT MAINTENANCE4. ENERGY DISTRIBUTION
THE RENEWABLE ENERGY VALUE CHAIN CAN BE DIVIDED INTO:
PLC, through its subsidiaries, is active in the first three phases of the value chain.
PROJECT DEVELOPMENT CONSTRUCTION
ENERGY PRODUCTION
O&M
ENERGY DISTRIBUTION
• DESIGN OF THE PLANT• AUTHORIZATION• FINANCING• PUBLIC AUCTION
• ENGINEERING• PROCUREMENT• CONSTRUCTION
SYSTEM-BOT SYSTEM-EPC
SERVICE
BUSINESS MODEL – RENEWABLE ENERGY VALUE CHAIN

6PLC Roadmap 2021 - 2024
PLC CURRENT MISSION AND FUTURE GOALS
FUTURE GOALS: becoming a key European player thanks to a strengthened financial strategy
CURRENT MISSION: acting as an integrated Independent Service Provider for renewable energy
PLC entities offer a complete range of
services and construction for electrical infrastructure and renewable plants (focusing on wind and PV), in Italy.
Thanks to the acquisition of Monsson in 2018/2019,
the Group enlarged its geographical presence and reinforced the services offer and know-how regarding wind plants (blades services, installation).
The Group widened its offer in 2020 through
the acquisition of Schmack, active in services and construction for biogas plants.
Group optimization to take full advantage of synergies from the integration of Monsson and Schmack.
Consolidating commercial and business development Group structure to enhance its presence in Europe.
Strengthening financial strategy to foster organic growth, and allow some external growth operations.
Sources: PLC Group, Project team analysis

7PLC Roadmap 2021 - 2024
PLC INTERNATIONAL FOOTPRINT
Sources: PLC, Project team analysis
Among the European markets which are growing, 15 countries are the most interesting in terms of growth, risk and right-to-win for PLC Group
PLC Group is already present in many of them:•FRANCE•GERMANY• ITALY•NORWAY•POLAND•ROMANIA•SWEDEN•GREECE
… while should enter in different others:• Austria• Belgium• Denmark• Finland• Netherlands• Spain• Switzerland• UK
MARKETS WHERE PLC GROUP ALREADY OPERATES
NEW MARKETS
8PLC Roadmap 2021 - 2024
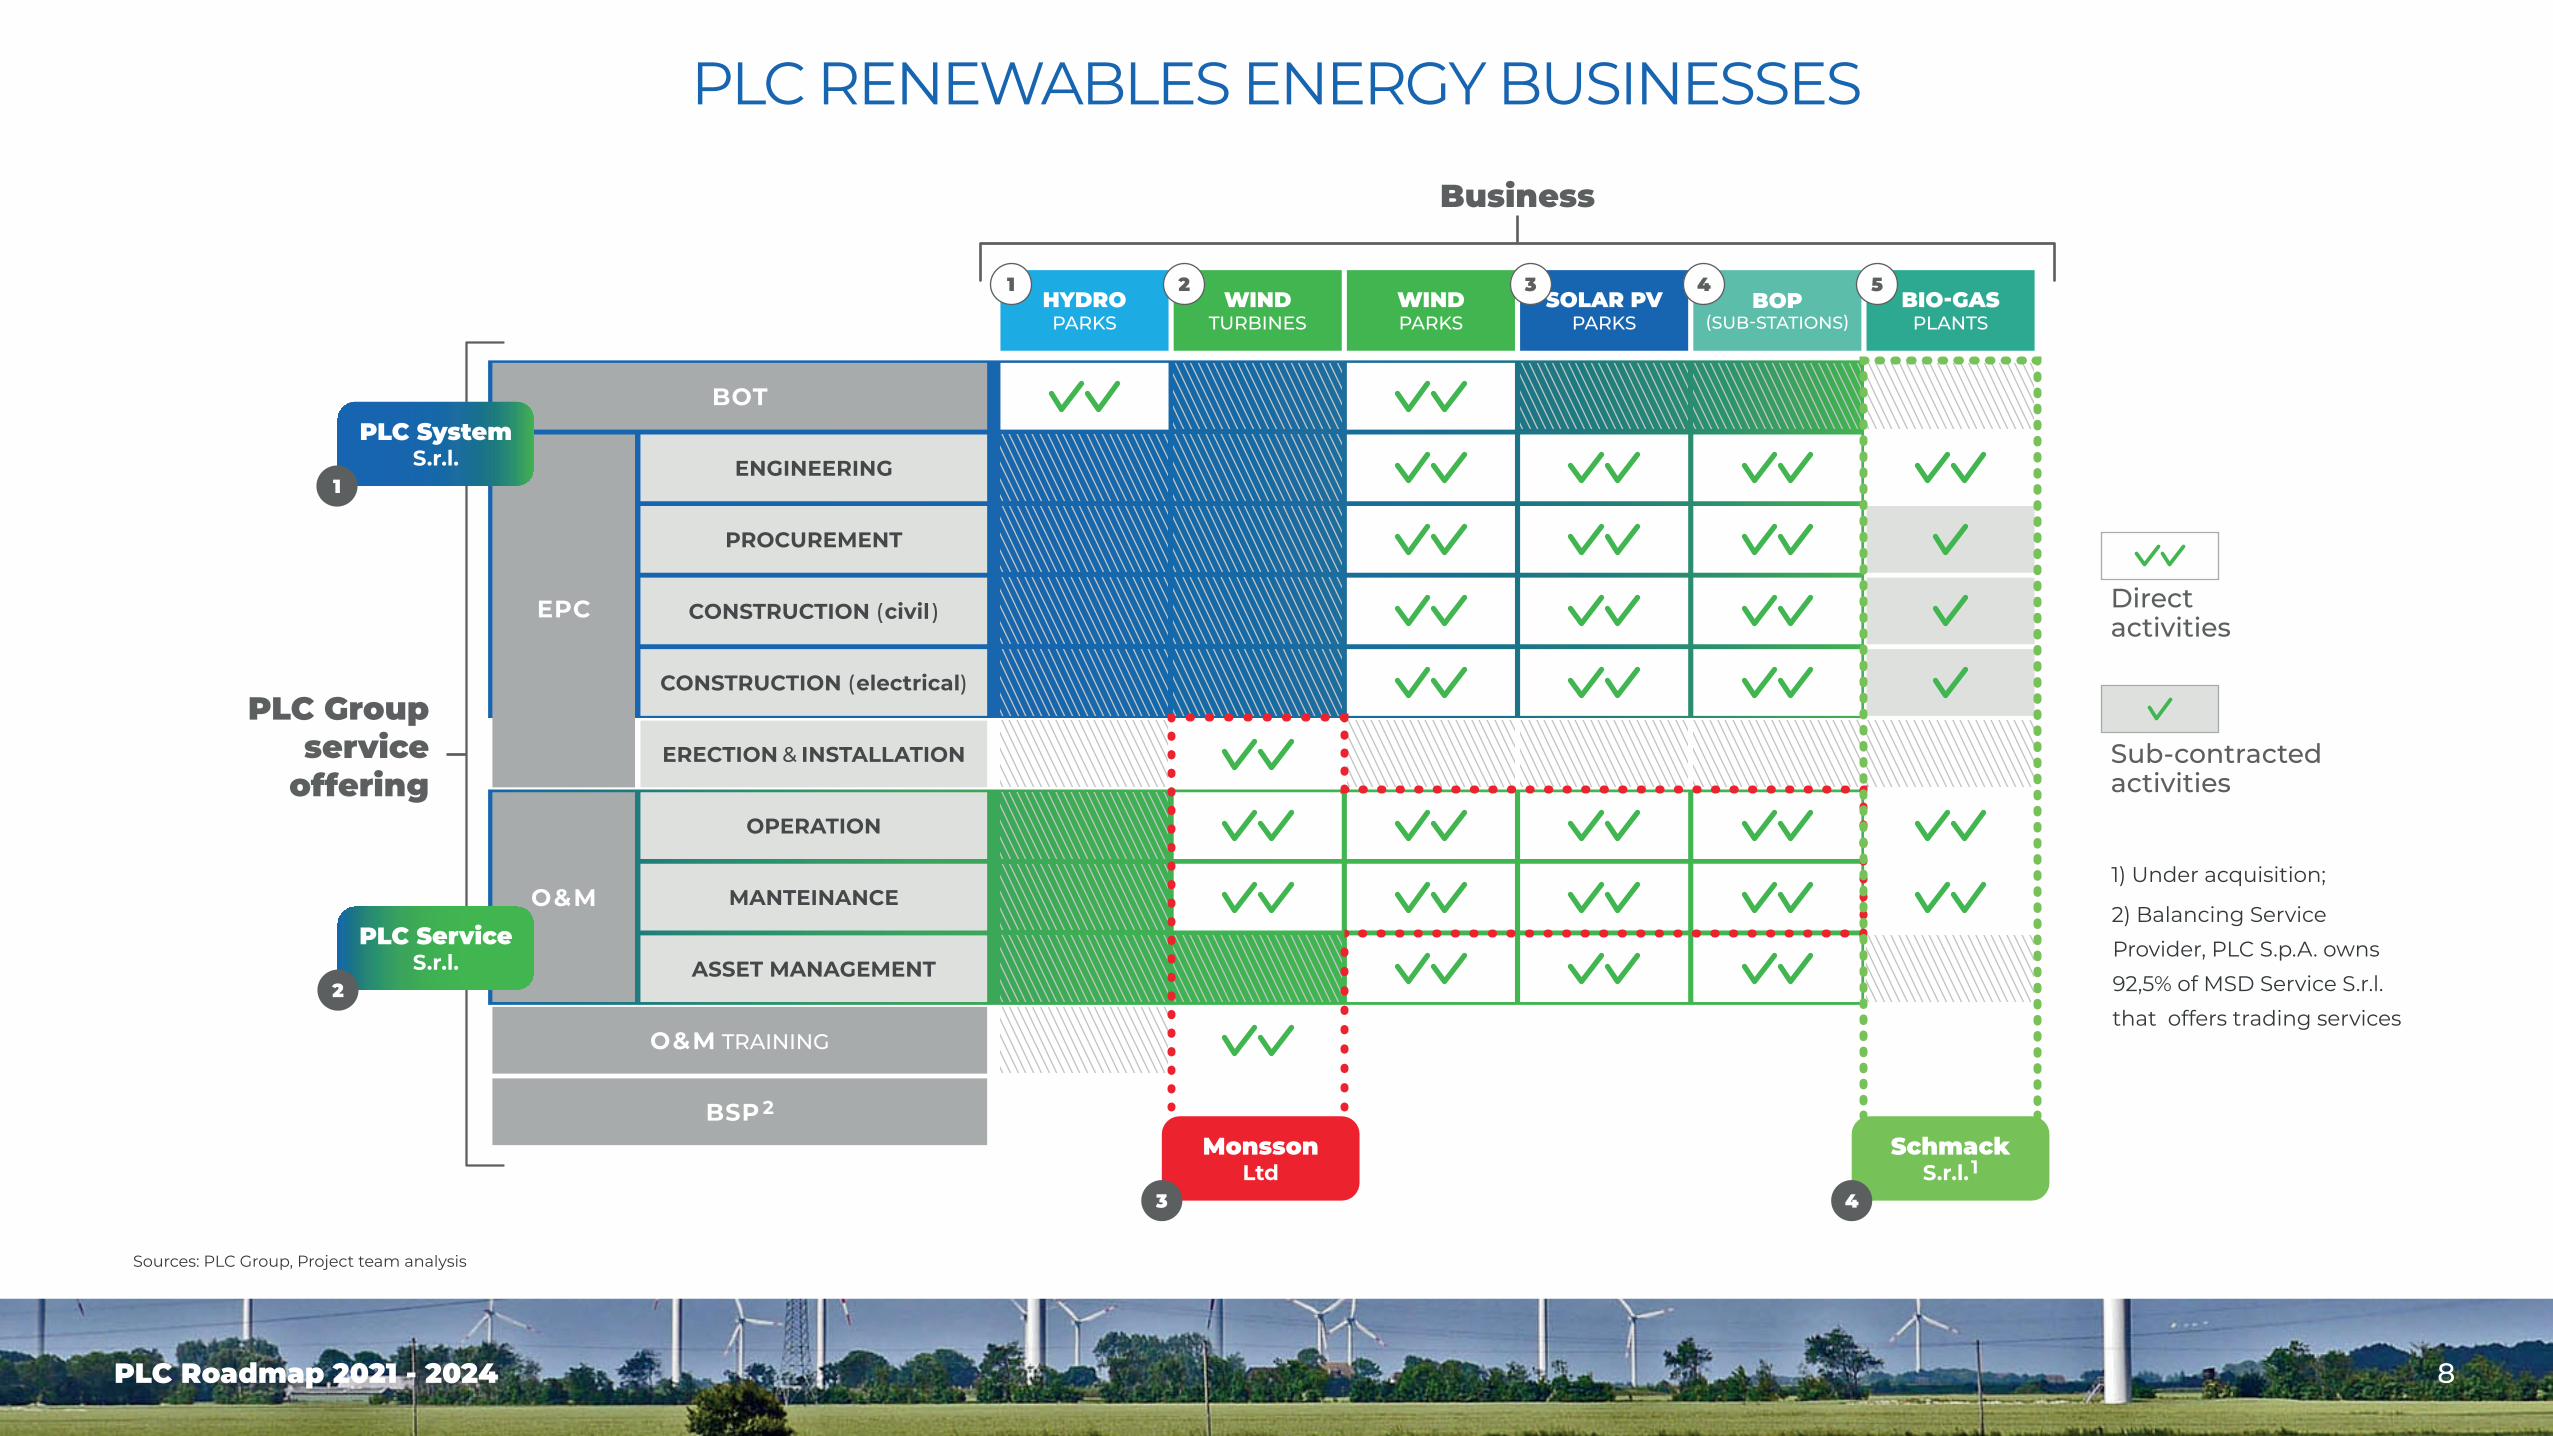
Directactivities
Sub-contractedactivities
HYDROPARKS
Business
PLC Groupservice
offering
WINDTURBINES
WINDPARKS
SOLAR PVPARKS
BOP(SUB-STATIONS)
BIO-GASPLANTS
ENGINEERING
CONSTRUCTION (electrical)
ERECTION & INSTALLATION
OPERATION
MANTEINANCE
ASSET MANAGEMENT
CONSTRUCTION (civil )
BOT
EPC
O&M
O&M TRAINING
BSP 2
PROCUREMENT
PLC ServiceS.r.l.
MonssonLtd
SchmackS.r.l. 1
2
3
1 2 4 53
4
PLC SystemS.r.l.
1
PLC RENEWABLES ENERGY BUSINESSES
Sources: PLC Group, Project team analysis
1) Under acquisition;
2) Balancing Service Provider, PLC S.p.A. owns 92,5% of MSD Service S.r.l. that offers trading services
PLC Roadmap 2021 - 2024
KEY POINTS
KEY POINTS
10PLC Roadmap 2021 - 2024
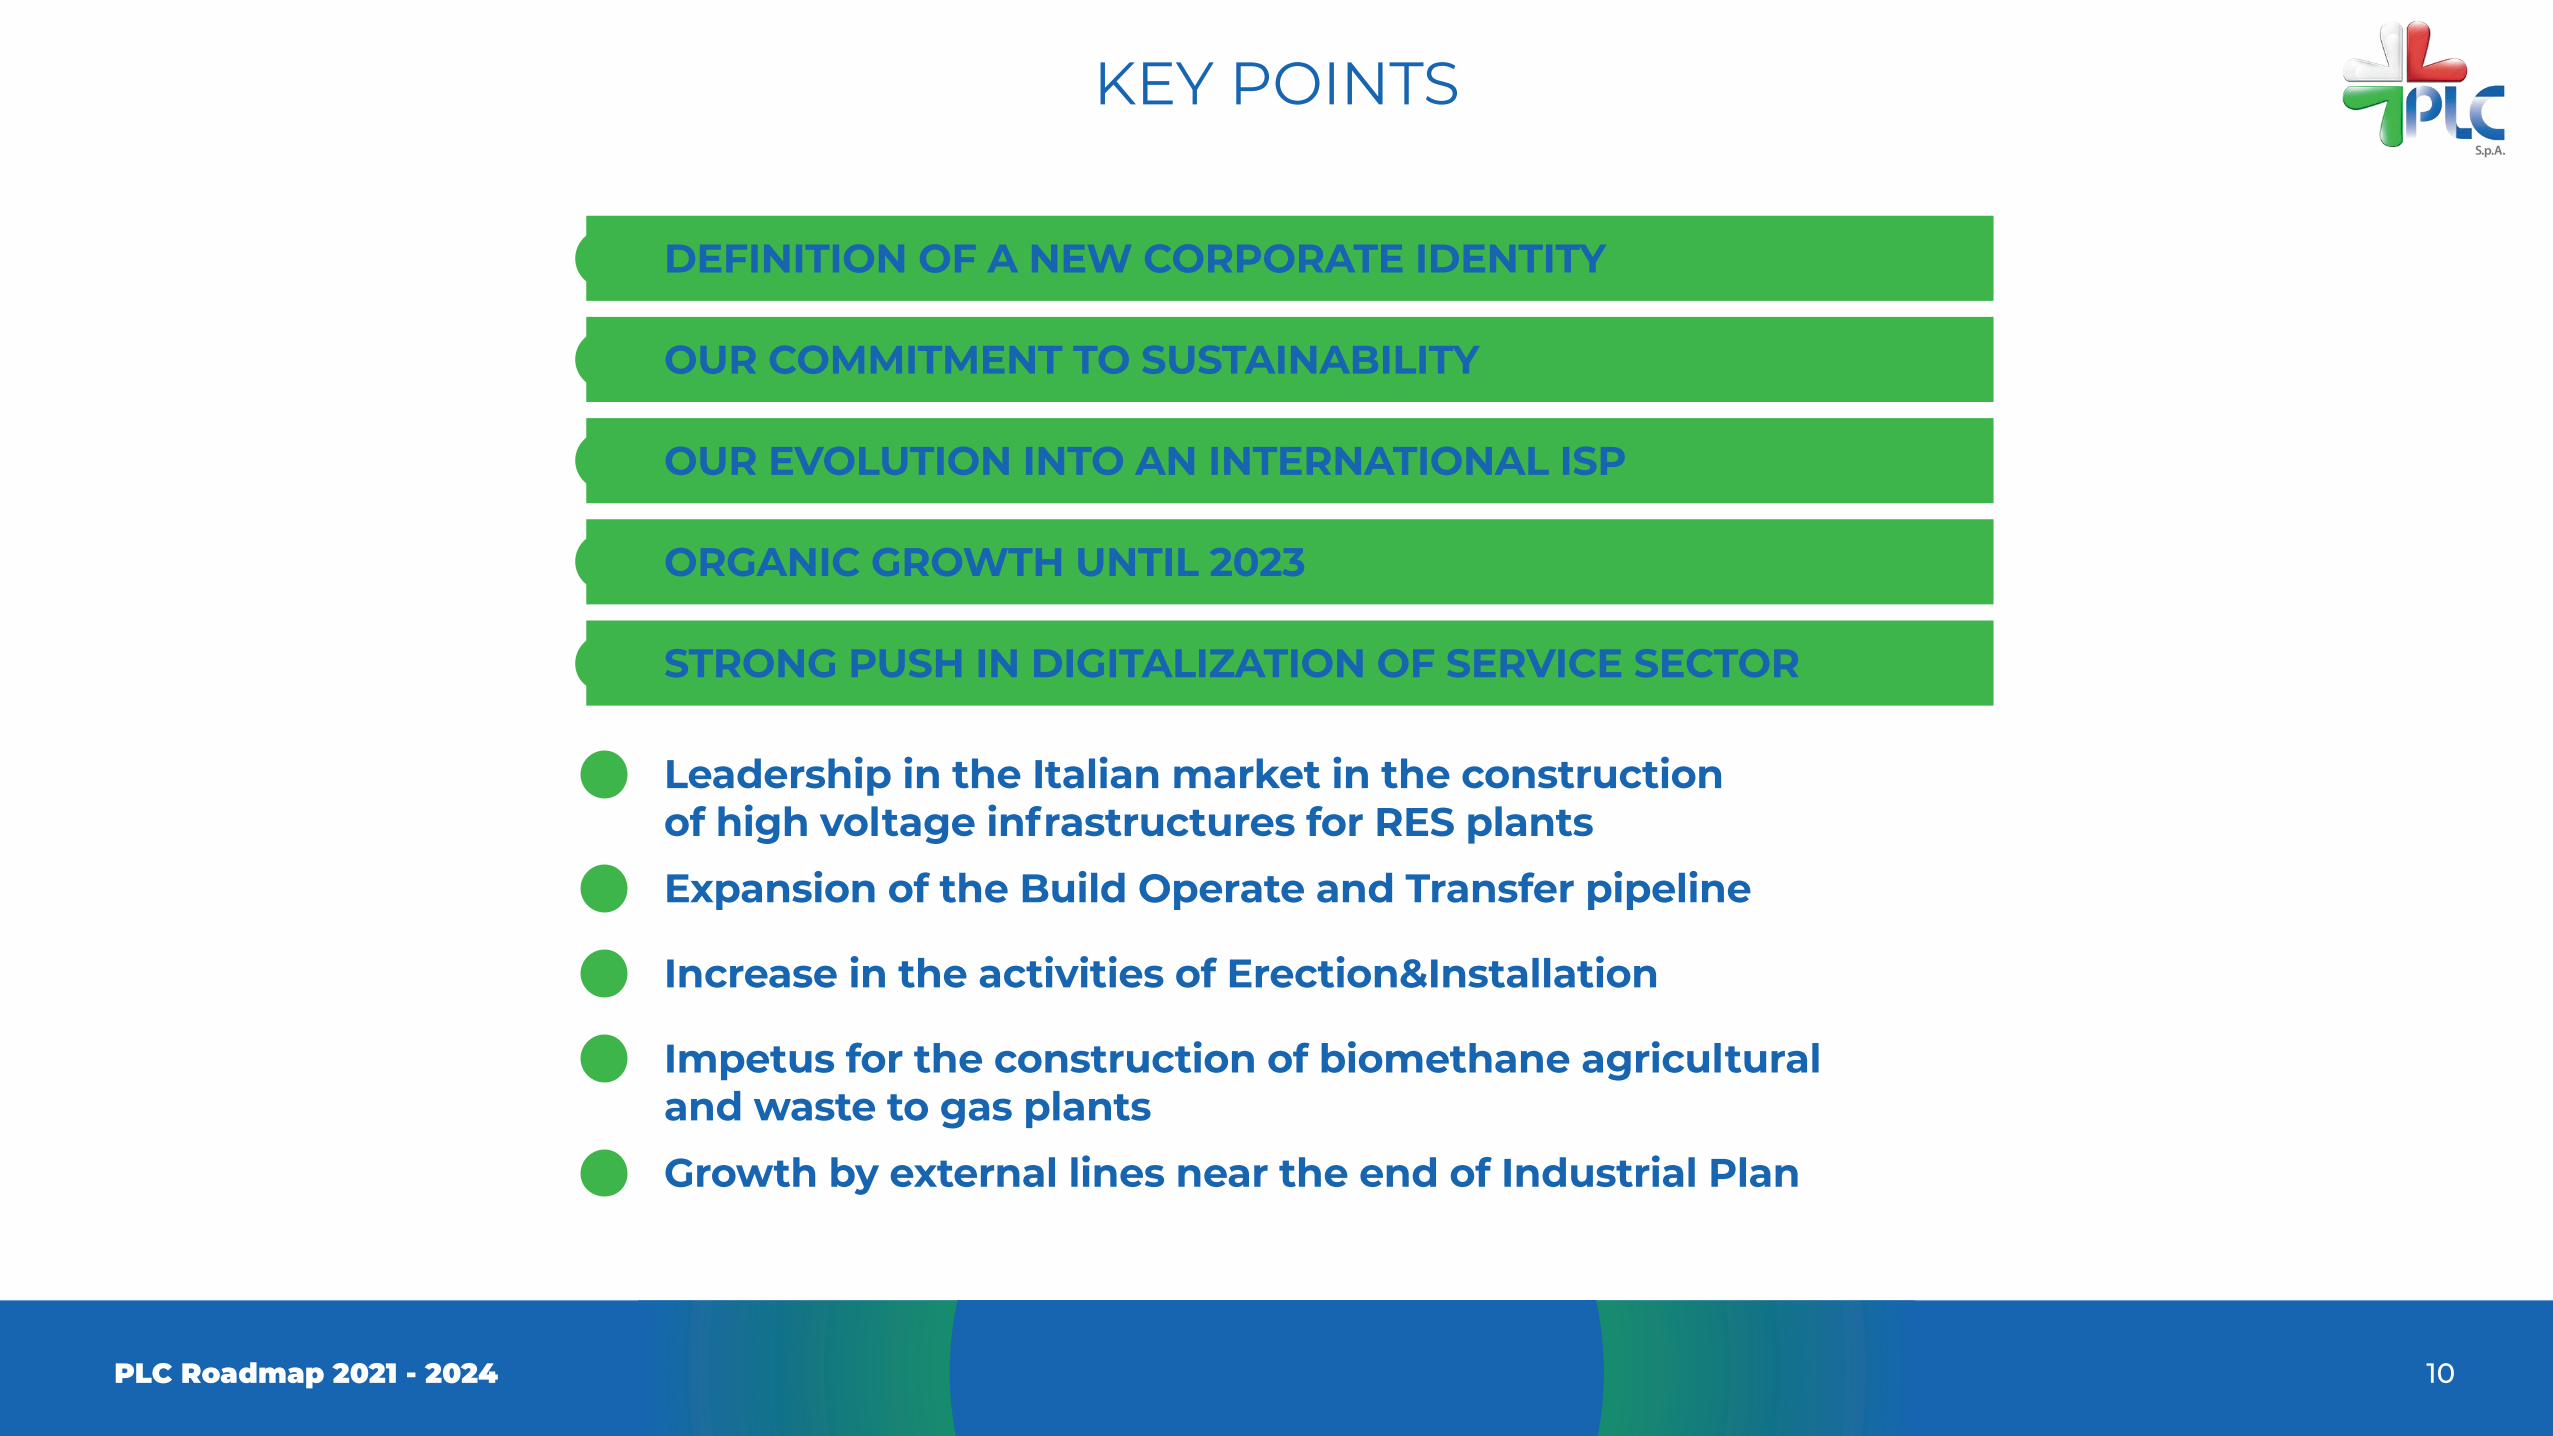
DEFINITION OF A NEW CORPORATE IDENTITY
OUR COMMITMENT TO SUSTAINABILITY
OUR EVOLUTION INTO AN INTERNATIONAL ISP
ORGANIC GROWTH UNTIL 2023
STRONG PUSH IN DIGITALIZATION OF SERVICE SECTOR
Leadership in the Italian market in the construction of high voltage infrastructures for RES plants
Impetus for the construction of biomethane agricultural and waste to gas plants
Expansion of the Build Operate and Transfer pipeline
Increase in the activities of Erection&Installation
Growth by external lines near the end of Industrial Plan

11PLC Roadmap 2021 - 2024
DefinitionofanewCorporateIdentityKEY POINTS
CAUTION
INNOVATION
COMPETENCE
When different business organizations come to-gether, the creation of a new entity is completed by embracing a common and shared corporate identity. In our case, all of the individual companies involved relinquished the coordinated image that used to dif-ferentiate them to take on a new one, representing in a more effective way the nature and the goals of the new Group.Several entities, which were once individual compa-nies, are now divisions of the same corporation. Each of their visual identities is therefore reflected in a fa-mily brand, a common root representing the whole. Besides, there is an additional element which identi-fies each division by its specific expertise.The name which was selected for the Group launches the new entity in the next era of the energy scena-rio, with a reference to what has become the unavoi-
dable shift from fossil energy sources to renewables. The rounded and bladed lines, which are used to draw the brand logo, bring to mind the shape of lea-ves, instantly recalling the concept of nature and its protection. The prevailing colour – green – typically identifies the scope of activity of the Group within ‘green’ operations.

12PLC Roadmap 2021 - 2024
OurcommitmenttosustainabilityKEY POINTS
SATISFYING OUR NEEDS AND THOSE OF OUR SHAREHOLDERS WITHOUT COMPROMISING THE ABILITY OF FUTURE GENERATIONS TO MEET THEIR NEEDS HAS ALWAYS BEEN OUR CORE VALUE.
FOR THE FIRST TIME THIS YEAR WE WILL ISSUE OUR SUSTAINABILITY REPORT TO GIVE A CLEAR MESSAGE TO OUR COMMUNITY.
Higher quality trainingGender equality
Industry and innovation
Dignified jobs and economic growth
Action for climateLife on earth
Partnership by objectives
Peace, justice and strong institutions
People skill enhancing
Sustainable thinking
Capacity building: increase in training hours
Certification of all operating companies ISO 14000 and ISO 45000
Human capital involvement: power of diversity, increase gender equality
Technological development: revolution 4.0
OUR TARGETS OUR CORE SUSTAINABLE DEVELOPMENT GOALS
Partnership
Peace
Prosperity
SUSTEINABLEDEVELOPMENT
People
Planet
PLC Roadmap 2021 - 2024
FY 2020 RESULTS - HIGHLIGHTS
14PLC Roadmap 2021 - 2024
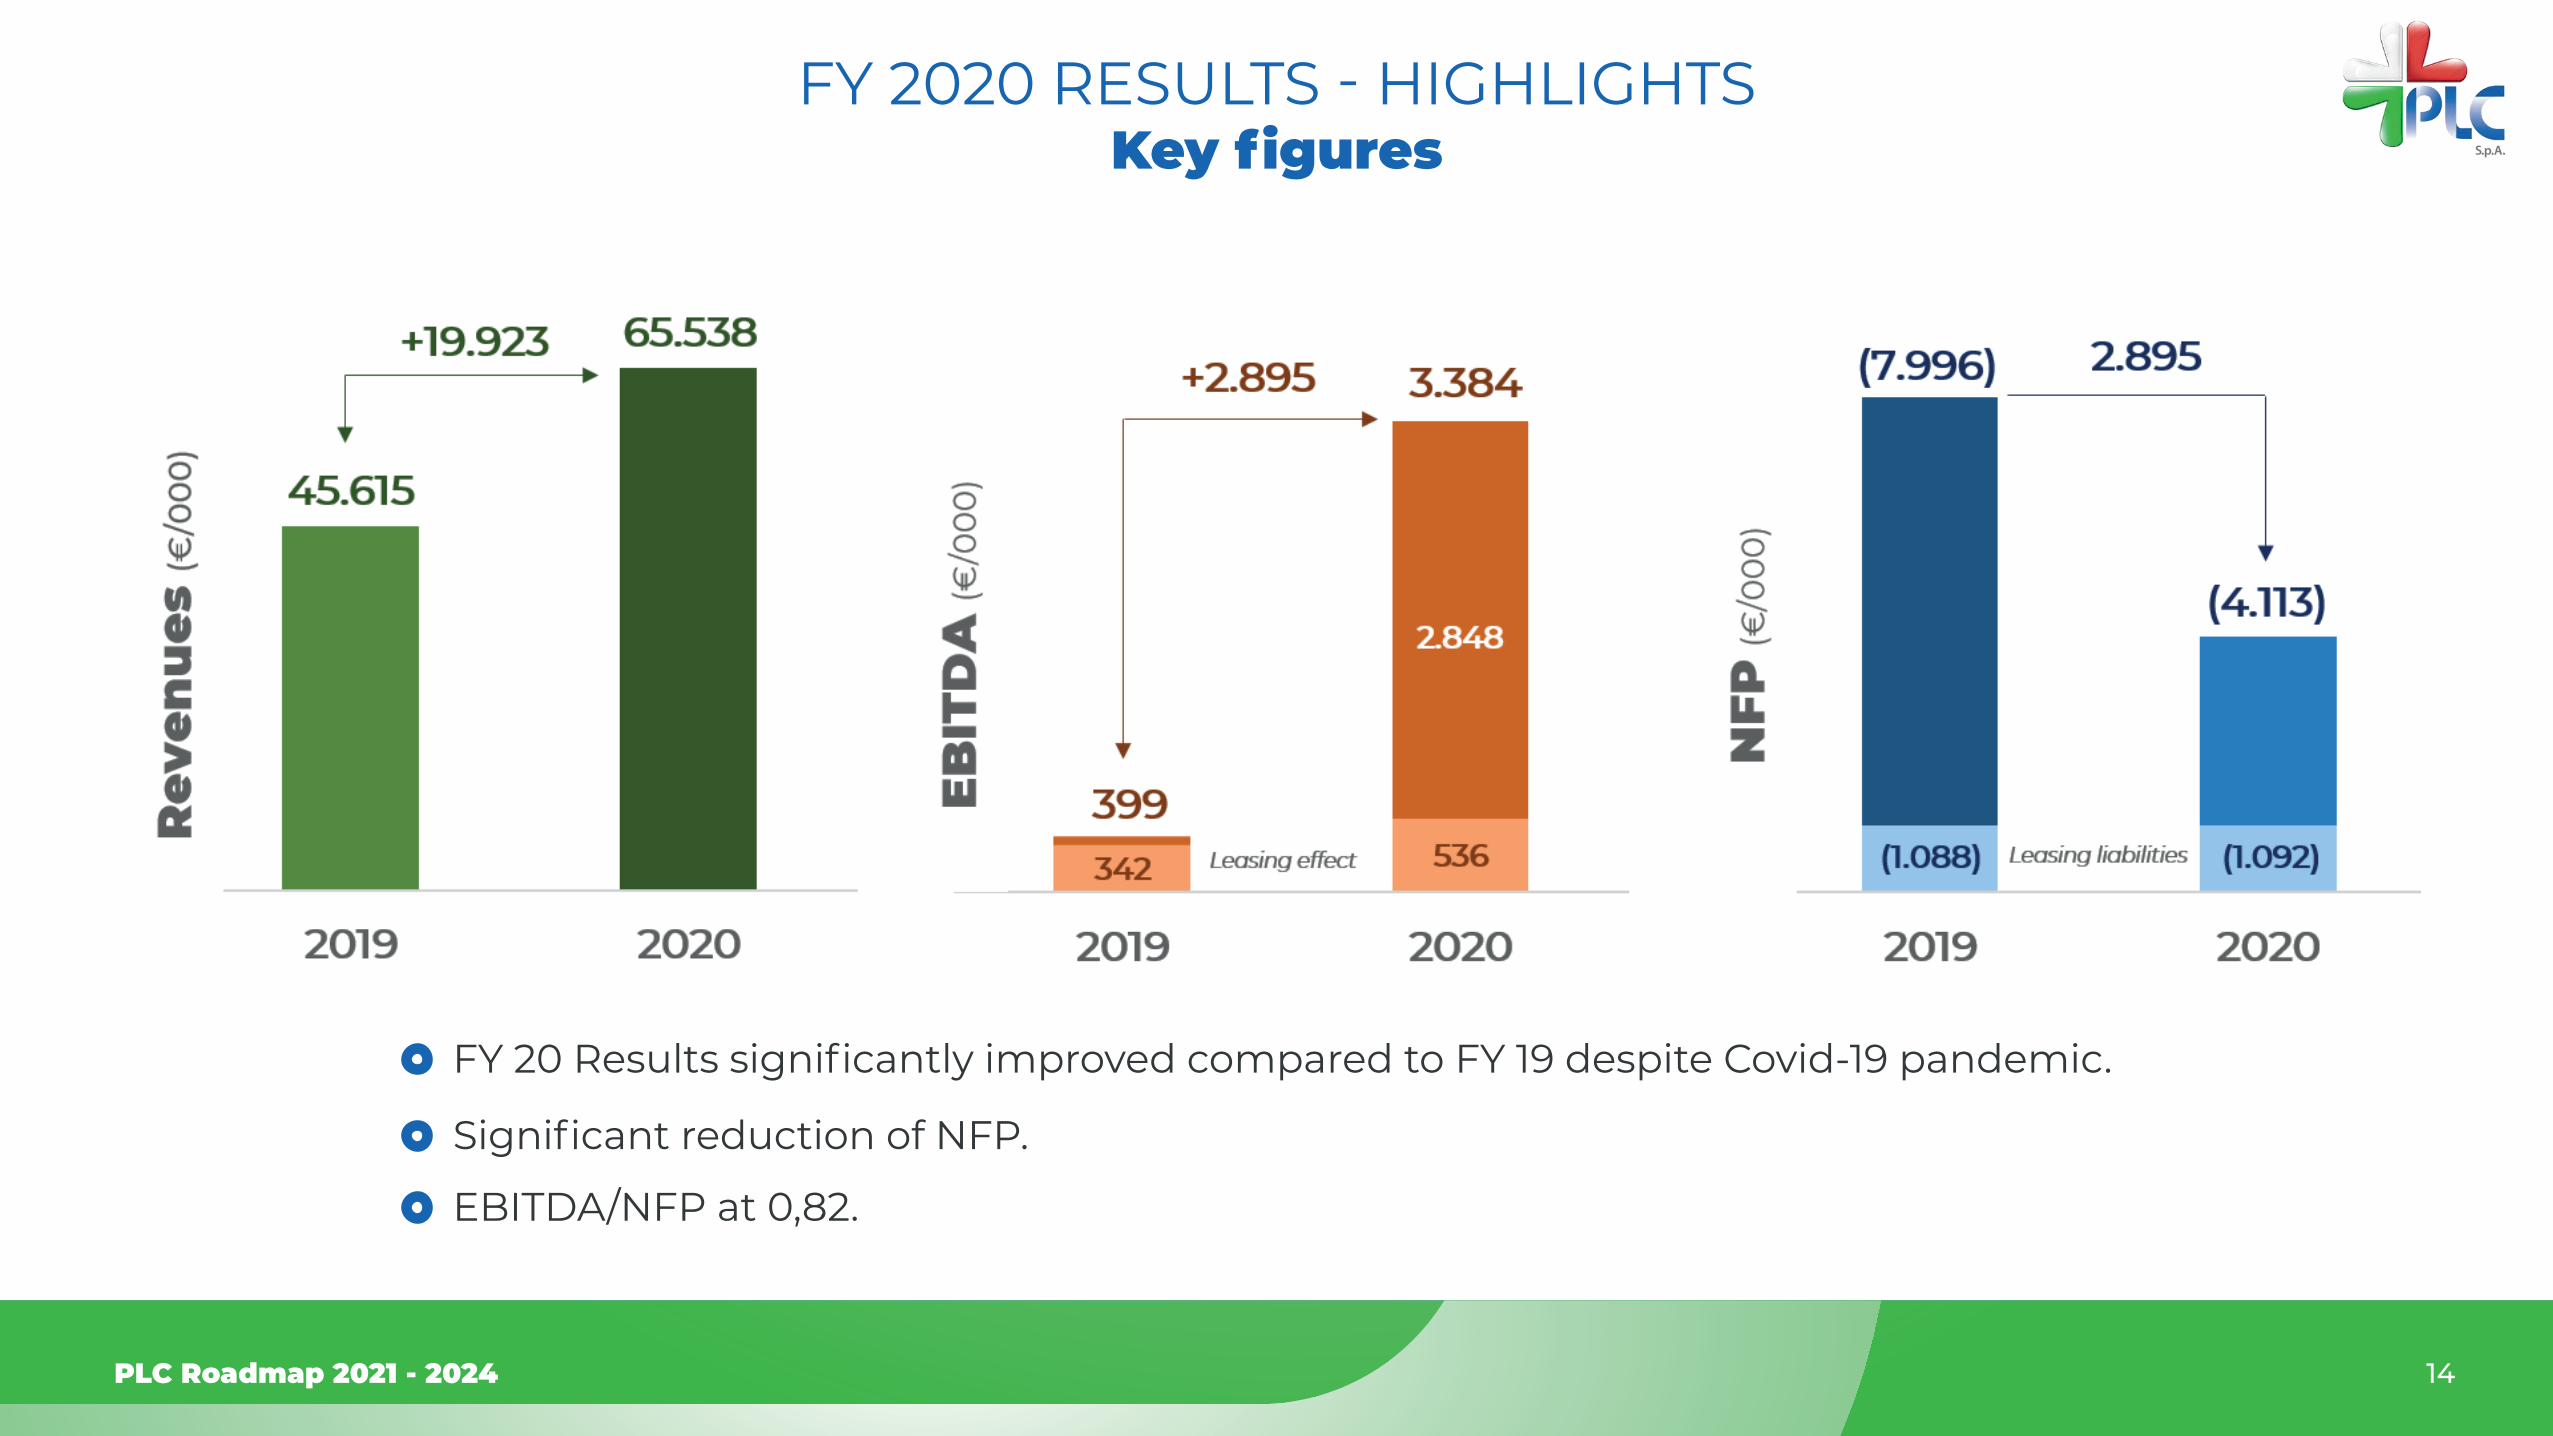
KeyfiguresFY 2020 RESULTS - HIGHLIGHTS
FY 20 Results significantly improved compared to FY 19 despite Covid-19 pandemic.
Significant reduction of NFP.
EBITDA/NFP at 0,82.

15PLC Roadmap 2021 - 2024
ResultsvsGuidance
FY 20 results in line with «revised budget – worst case scenario»
Reflects the delay in finalizing the operation with EDPR
FY 2020 RESULTS - HIGHLIGHTS

16PLC Roadmap 2021 - 2024
GroupEBITDA
Increasingly important role of the Services Segment.
Return to a positive contribution from the Construction Segment
FY 2020 RESULTS - HIGHLIGHTS
17PLC Roadmap 2021 - 2024
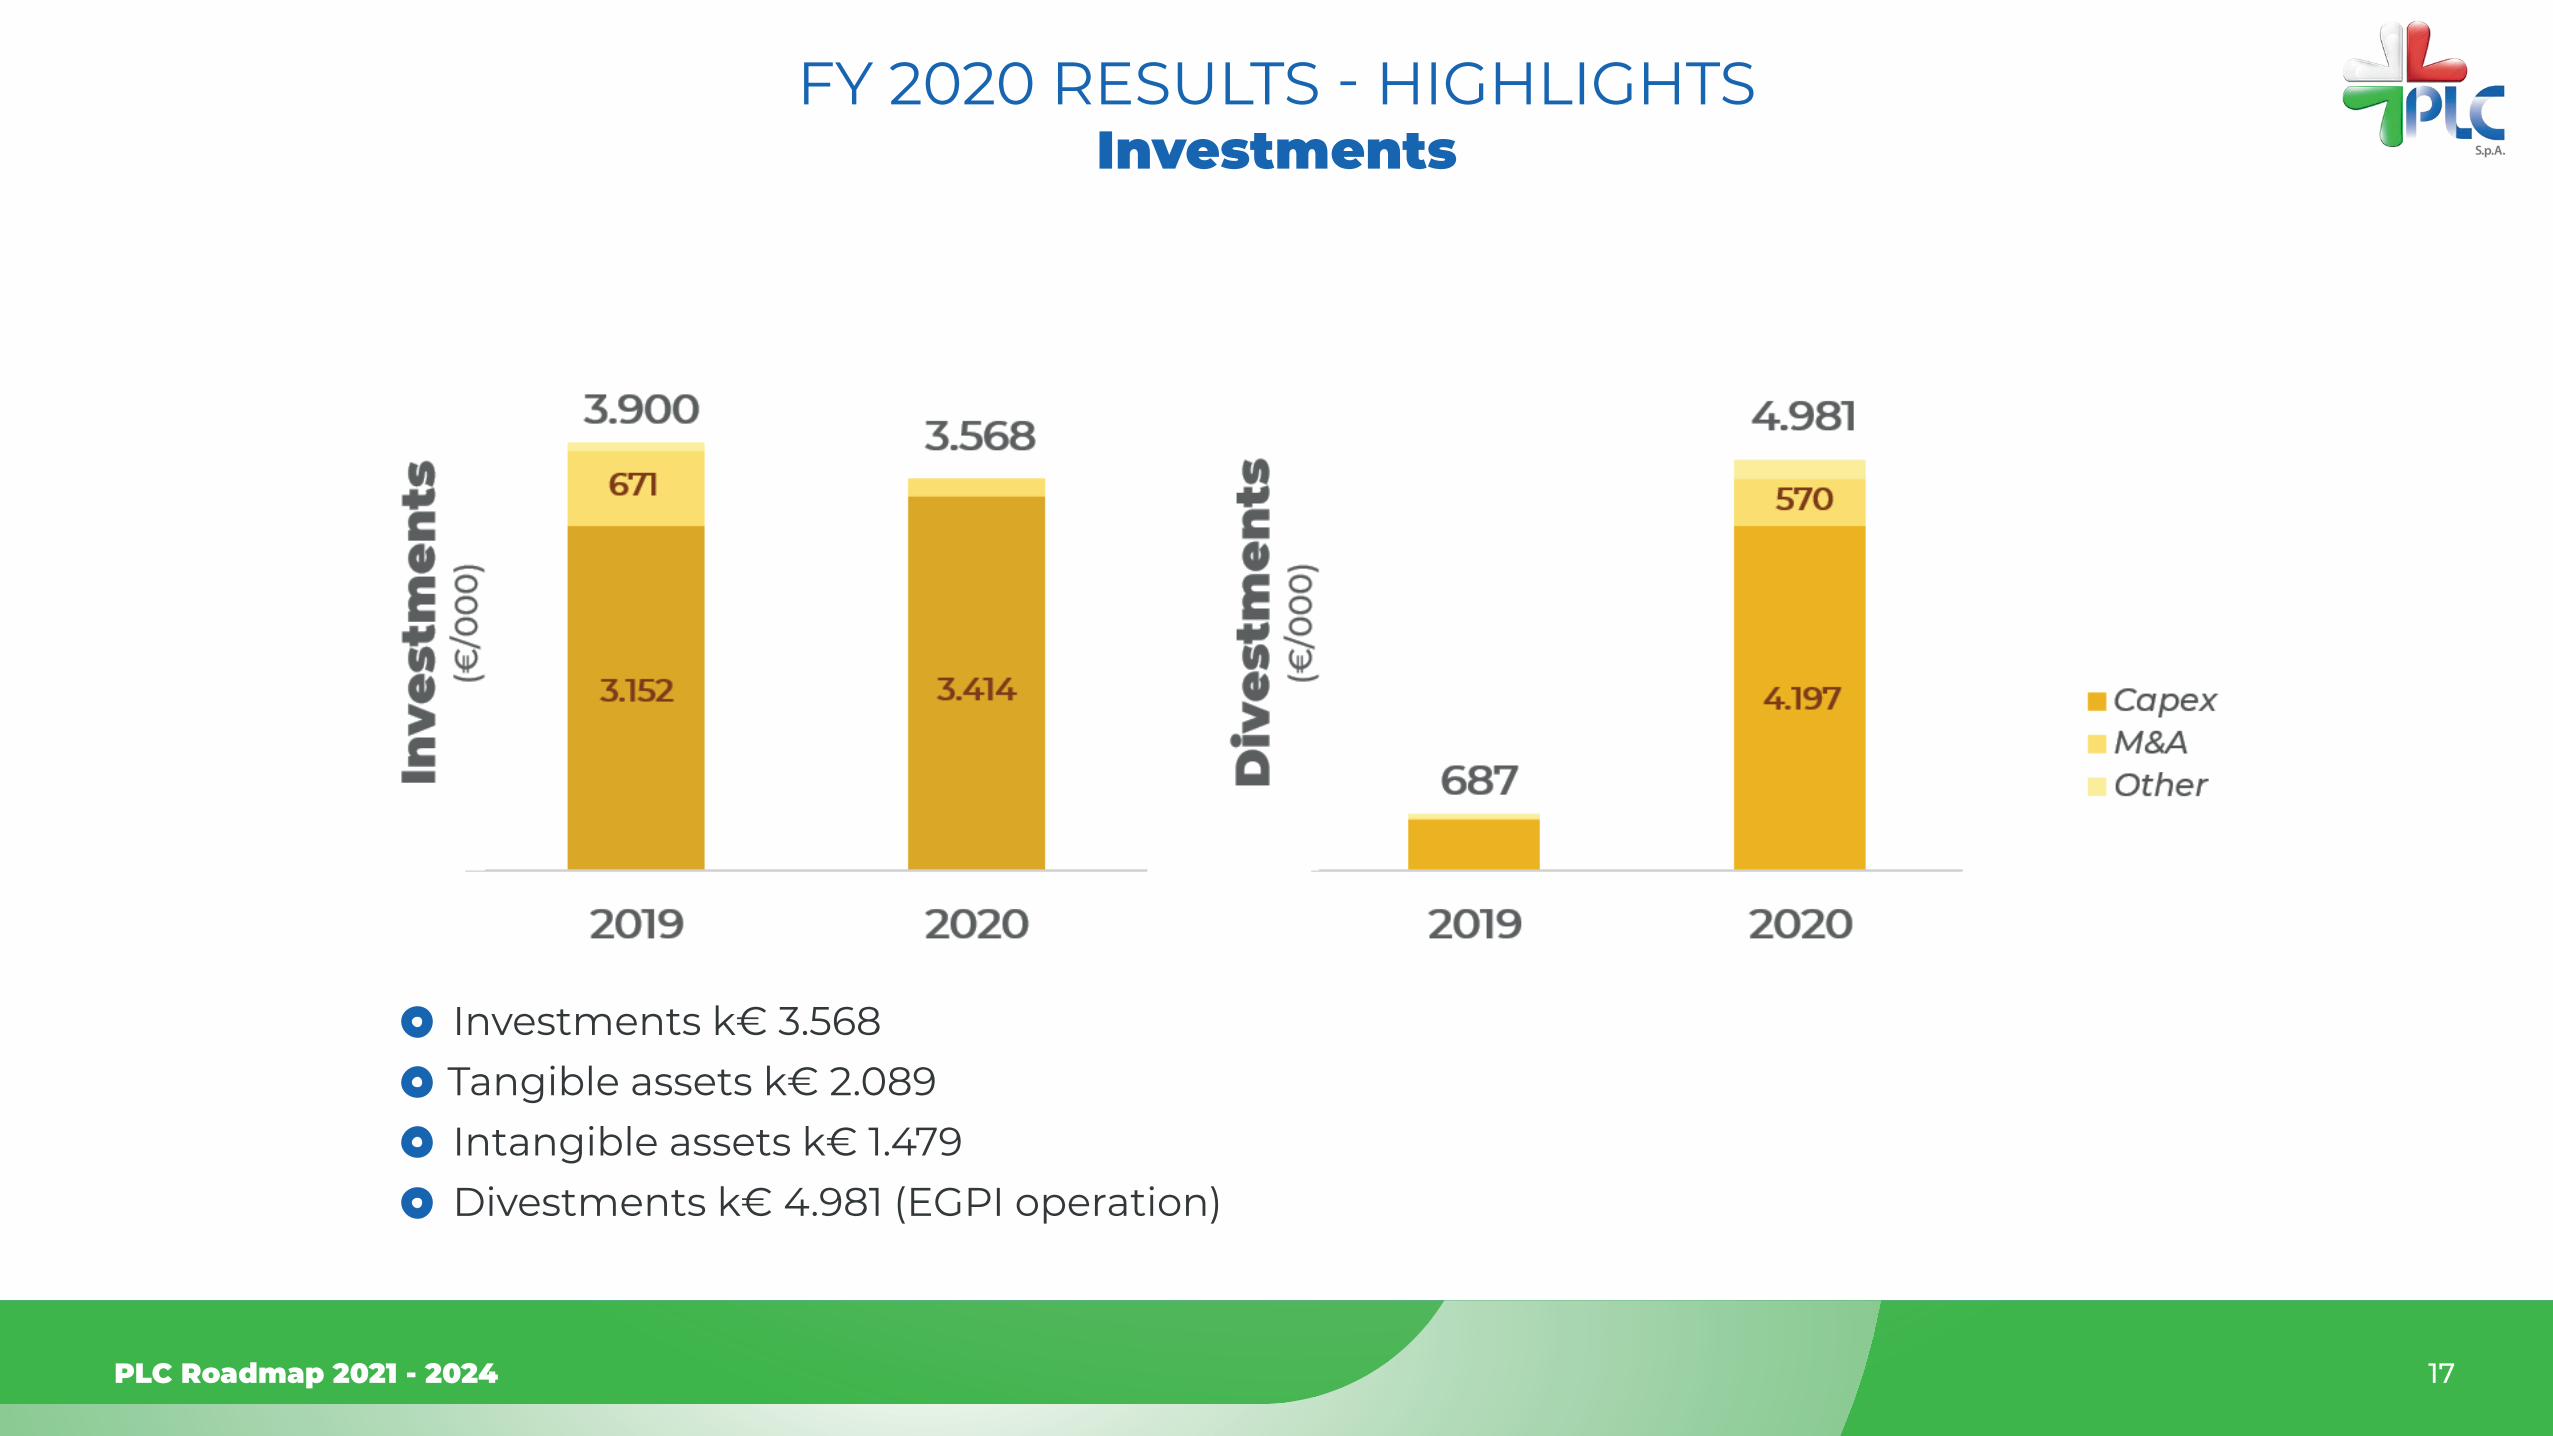
Investments
Investments k€ 3.568Tangible assets k€ 2.089 Intangible assets k€ 1.479Divestments k€ 4.981 (EGPI operation)
FY 2020 RESULTS - HIGHLIGHTS
18PLC Roadmap 2021 - 2024
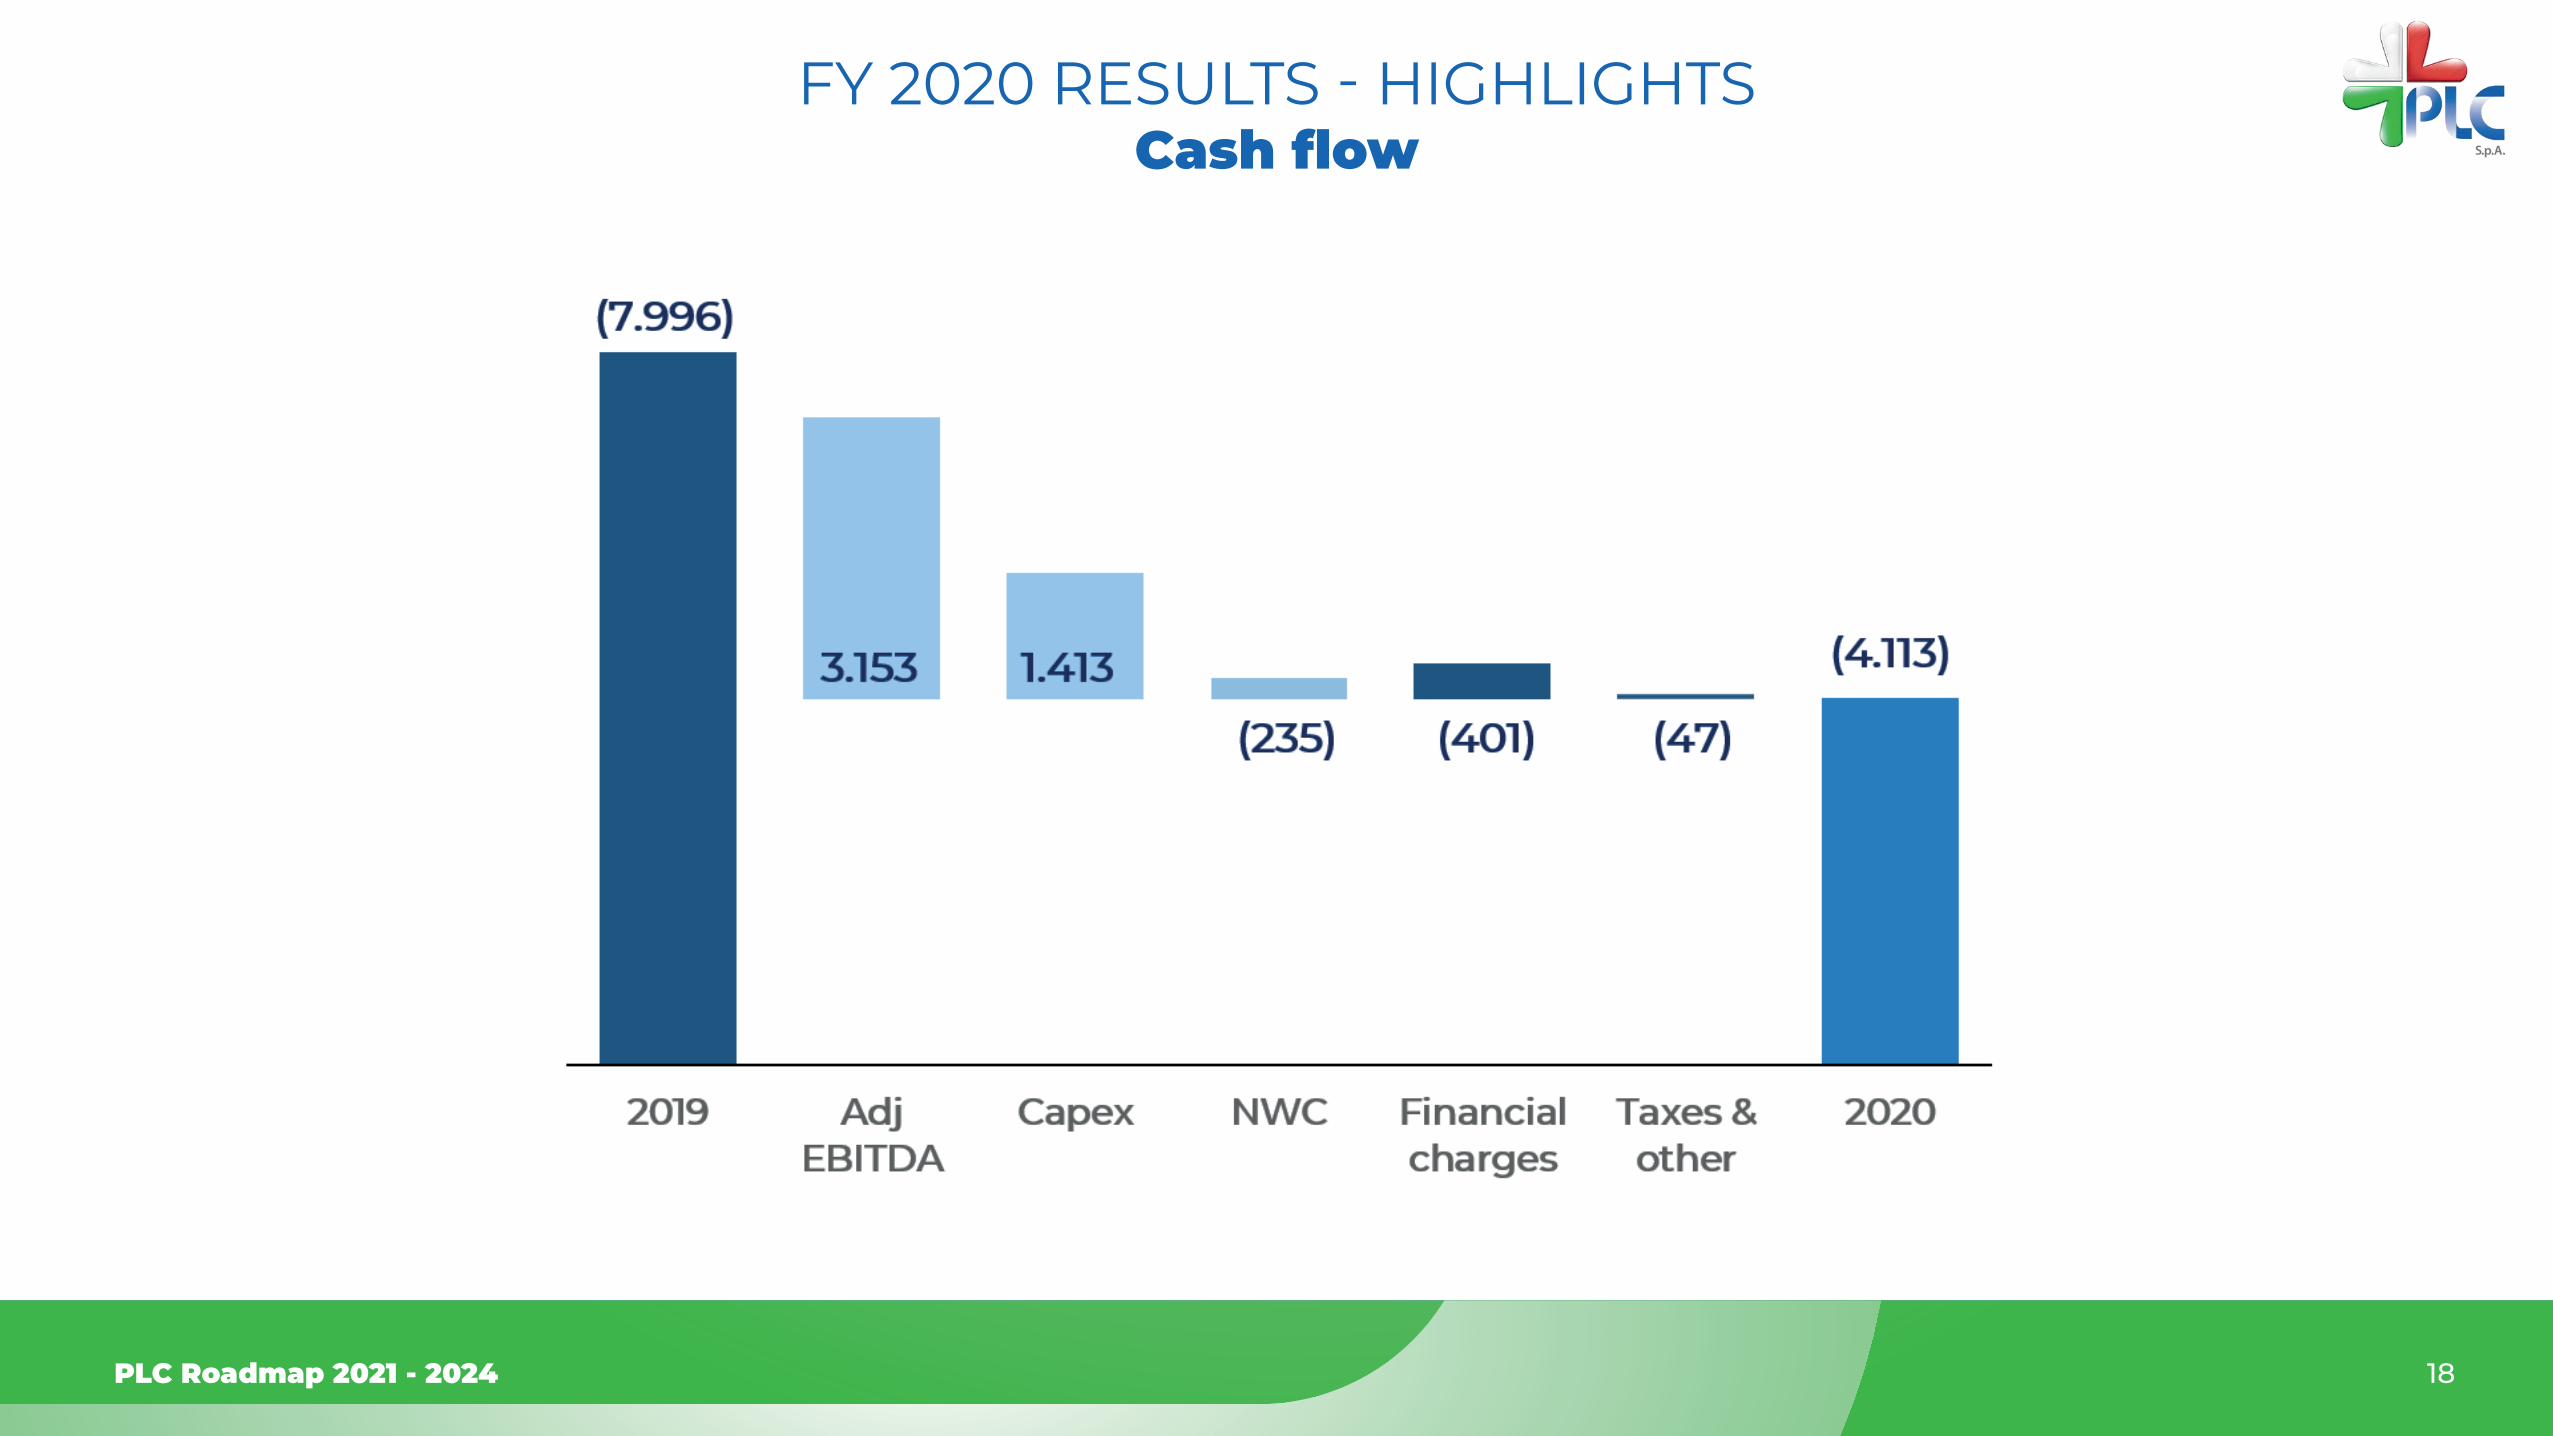
CashflowFY 2020 RESULTS - HIGHLIGHTS

PLC Roadmap 2021 - 2024
MARKET & STRATEGY
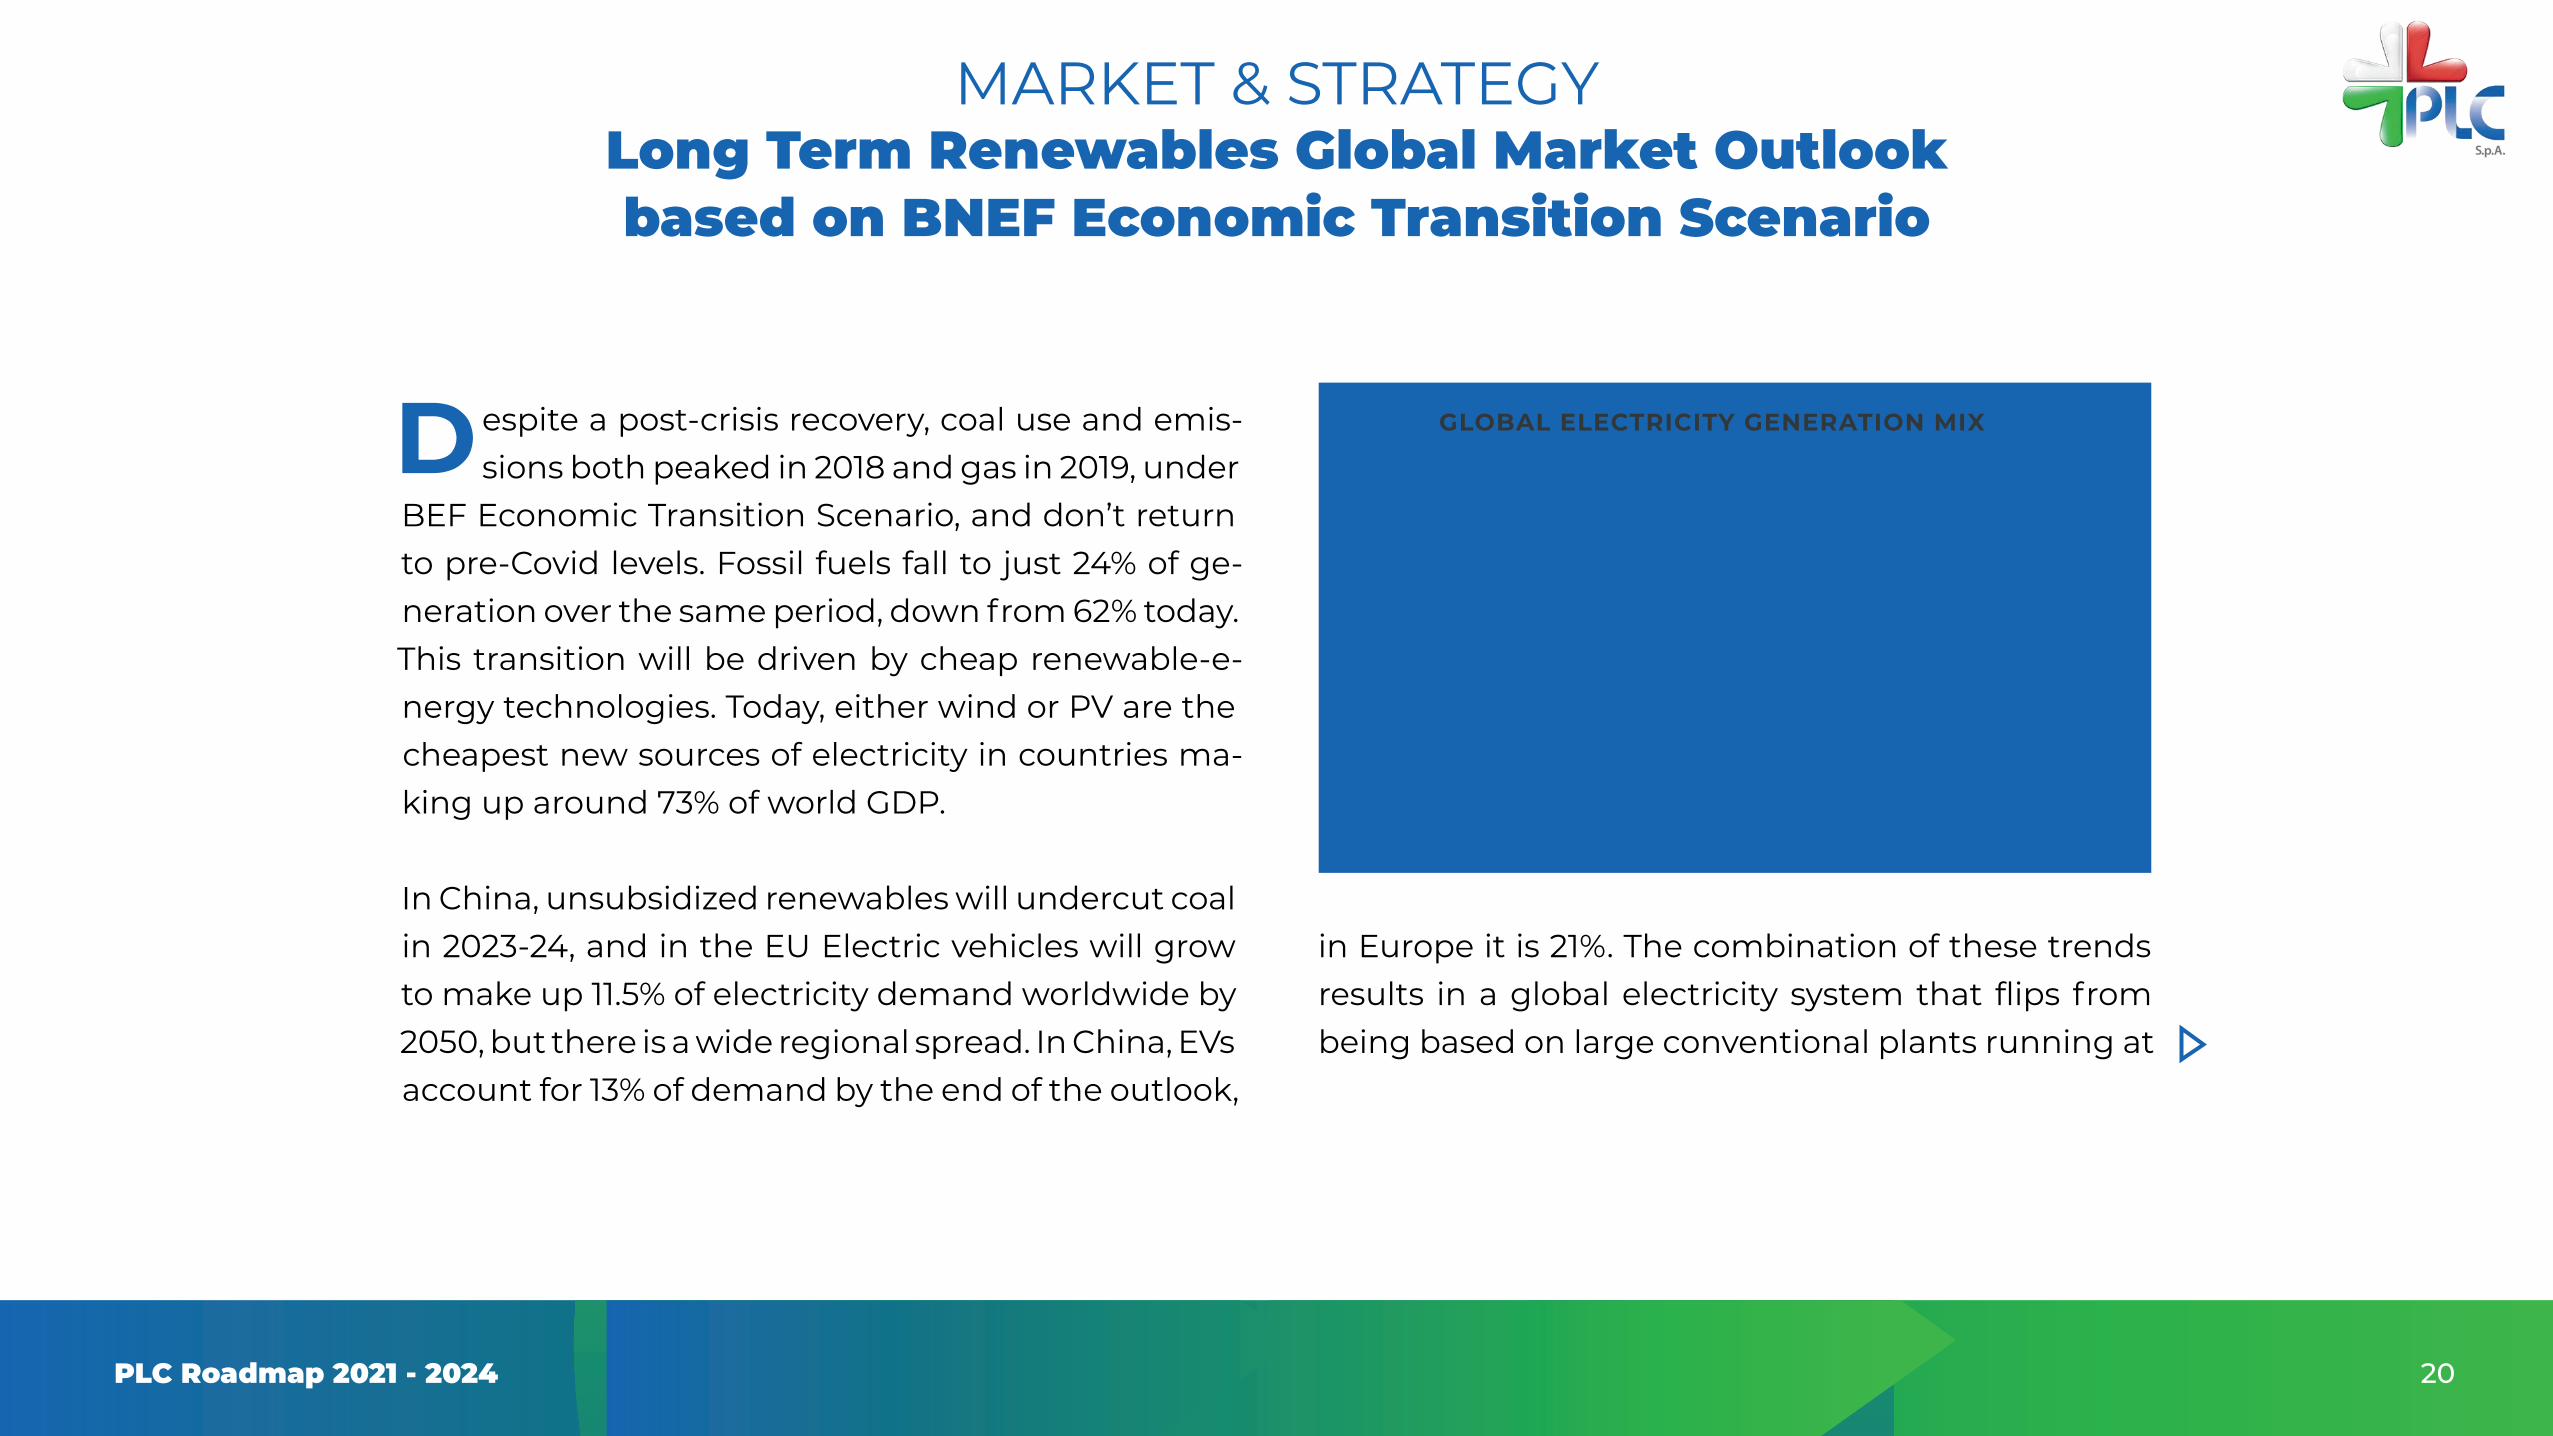
Despite a post-crisis recovery, coal use and emis-sions both peaked in 2018 and gas in 2019, under
BEF Economic Transition Scenario, and don’t return to pre-Covid levels. Fossil fuels fall to just 24% of ge-neration over the same period, down from 62% today. This transition will be driven by cheap renewable-e-nergy technologies. Today, either wind or PV are the cheapest new sources of electricity in countries ma-king up around 73% of world GDP.
In China, unsubsidized renewables will undercut coal in 2023-24, and in the EU Electric vehicles will grow to make up 11.5% of electricity demand worldwide by 2050, but there is a wide regional spread. In China, EVs account for 13% of demand by the end of the outlook,
in Europe it is 21%. The combination of these trends results in a global electricity system that flips from being based on large conventional plants running at
20PLC Roadmap 2021 - 2024
LongTermRenewablesGlobalMarketOutlookbasedonBNEFEconomicTransitionScenario
MARKET & STRATEGY
GLOBAL ELECTRICITY GENERATION MIX
baseload capacity factors, supported by smaller pea-ker units, to a new paradigm of cheap, but inflexible, bulk renewable energy.
This is supported by flexible demand, batteries, pea-kers and conventional, large fossil-fuel plants running at low-capacity factors, and other dedicated flexible units. The 44% of electricity demand, or 18,000TWh, not met with these technologies in 2050 has a very di-stinct load shape that needs to be met by flexible ca-pacity that can ramp up to provide maximum power on demand, for relatively few hours in the year.
As renewables grow, there is less space for competi-tive baseload-type generators. Combined-cycle gas turbine plants adapt to this new environment by be-coming more flexible and running during high-va-lue hours, rather than baseload. In BNEF Economic Transition Scenario, fossil-fuel generation provides the bulk of this back-up, though hydro and intercon-nectors can also do so economically. Even in the ab-sence of emissions policy, gas emerges as the main source of firm capacity by 2050.
21PLC Roadmap 2021 - 2024
MARKET & STRATEGYLongTermRenewablesGlobalMarketOutlookbasedonBNEFEconomicTransitionScenario

Gas peakers and combined-cycle gas stay in the system, not for the hours of highest demand,
but for those of lowest renewable generation. Total firm capacity requirements fall to about 75% of ma-ximum peak demand. Wind-capacity grows at 5.7% year-on-year to 2050, with annual average deploy-ment of 147GW. This gives wind an advantage, as it can meet residual evening hours more cheaply than batteries added to PV.
Cheap renewables and batteries appear to reach an economic limit between 70% and 80% penetration in most markets. First, as new renewables eat into the run-hours of existing coal and gas plants, the most expensive mid-merit generators are displaced first, making the next MW of renewables marginally less
competitive. Second, since renewables all generate together when the conditions are right, at high pe-netration each additional plant tends to increase fle-et-wide curtailment, which lowers capacity factors and weakens the economic case for the next plant. PV creates an opportunity for wind and batte-ries by collapsing wholesale prices during the day, forcing traditional thermal plants to ramp down and even shut off.
The additional costs incurred in ramping back up for the evening push power prices back up, creating high-value hours that wind or batteries can access. Storage batteries get cheaper over the outlook via
22PLC Roadmap 2021 - 2024
RenewablesGlobalMarketMARKET & STRATEGY
synergies with growing battery demand for electric vehicles. Batteries take advantage of a peakier intra-day net load curve, predominantly pairing with PV in sunny regions to meet demand after the sun sets. This is particularly true where other types of peaking capacity is expensive and where wind resources are strongly seasonal.
PLC internal analysis sees significant space for hydro-gen generated energy, that although still very diffi-cult to model due to its infancy stage could poten-tially give more space to renewable surpassing the 100% penetration while retaining significant CCGT or fuel cell-based plant capacity.
Under BNEF scenario the clean-power transition goes furthest and fastest in Europe, where wind and PV account for 74% of electricity in 2050. Wind domi-nates across the continent, making up about 40% of generation in 2030, and more than 50% in 2050. So-lar PV is prominent in southern European countries, such as Spain and Portugal, where it provides over 30% of generation in 2030. Gas use grows to 2024 fro-mits Covid-19 low, before falling to just 10% of gene-ration in 2050.
Overall, worldwide power capacity almost triples between 2019 and 2050. Renewables surge from 35% in 2019 – almost half of which is hydro – to 68% in 2050,
23PLC Roadmap 2021 - 2024
RenewablesGlobalMarketMARKET & STRATEGY

as wind and PV expand rapidly. Fossil-fuel power ca-pacity drops to just 24% in 2050, from 56% in 2019. Capacity also becomes much more distributed, with behind-the-meter consumer PV and batteries ac-counting for 13% of installed capacity.
Around $15.1 trillion is invested in new power capaci-ty to 2050 in BNEF Economic Transition Scenario, at an average of $486 billion per year. Of this, 92% goes to generating capacity and 8% to storage. Around $11 trillion, or 73%, goes to renewables, with wind seeing $5.9 trillion and PV $4.2 trillion. Asia Pacific sees 45% of all new capital, with China and India accounting for 72% of that.
Europe and the Americas invest $2.2 trillion and $2.4 trillion, respectively. There is around $1.7 trillion in-vested in gas power plants, with 58% going to new CCGT, and 42% to peaker plants, such as OCGT and reciprocating engines. Grid investment to 2050 is around $14 trillion in BNEF Economic Transition Sce-nario. Around 41% of this, or $5.8 trillion, is sustain-ment capital to replace ageing assets.
Around 38% goes to grid reinforcements and 21% to new connections. Together, these latter two catego-ries are growth capital and sum to $8.2 trillion.
24PLC Roadmap 2021 - 2024
RenewablesGlobalMarketMARKET & STRATEGY

25PLC Roadmap 2021 - 2024
GW INSTALLED IN THE TARGET SOLAR PV MARKETS
Sources: Global Data, IHS, PLC, Project team analysis
26PLC Roadmap 2021 - 2024
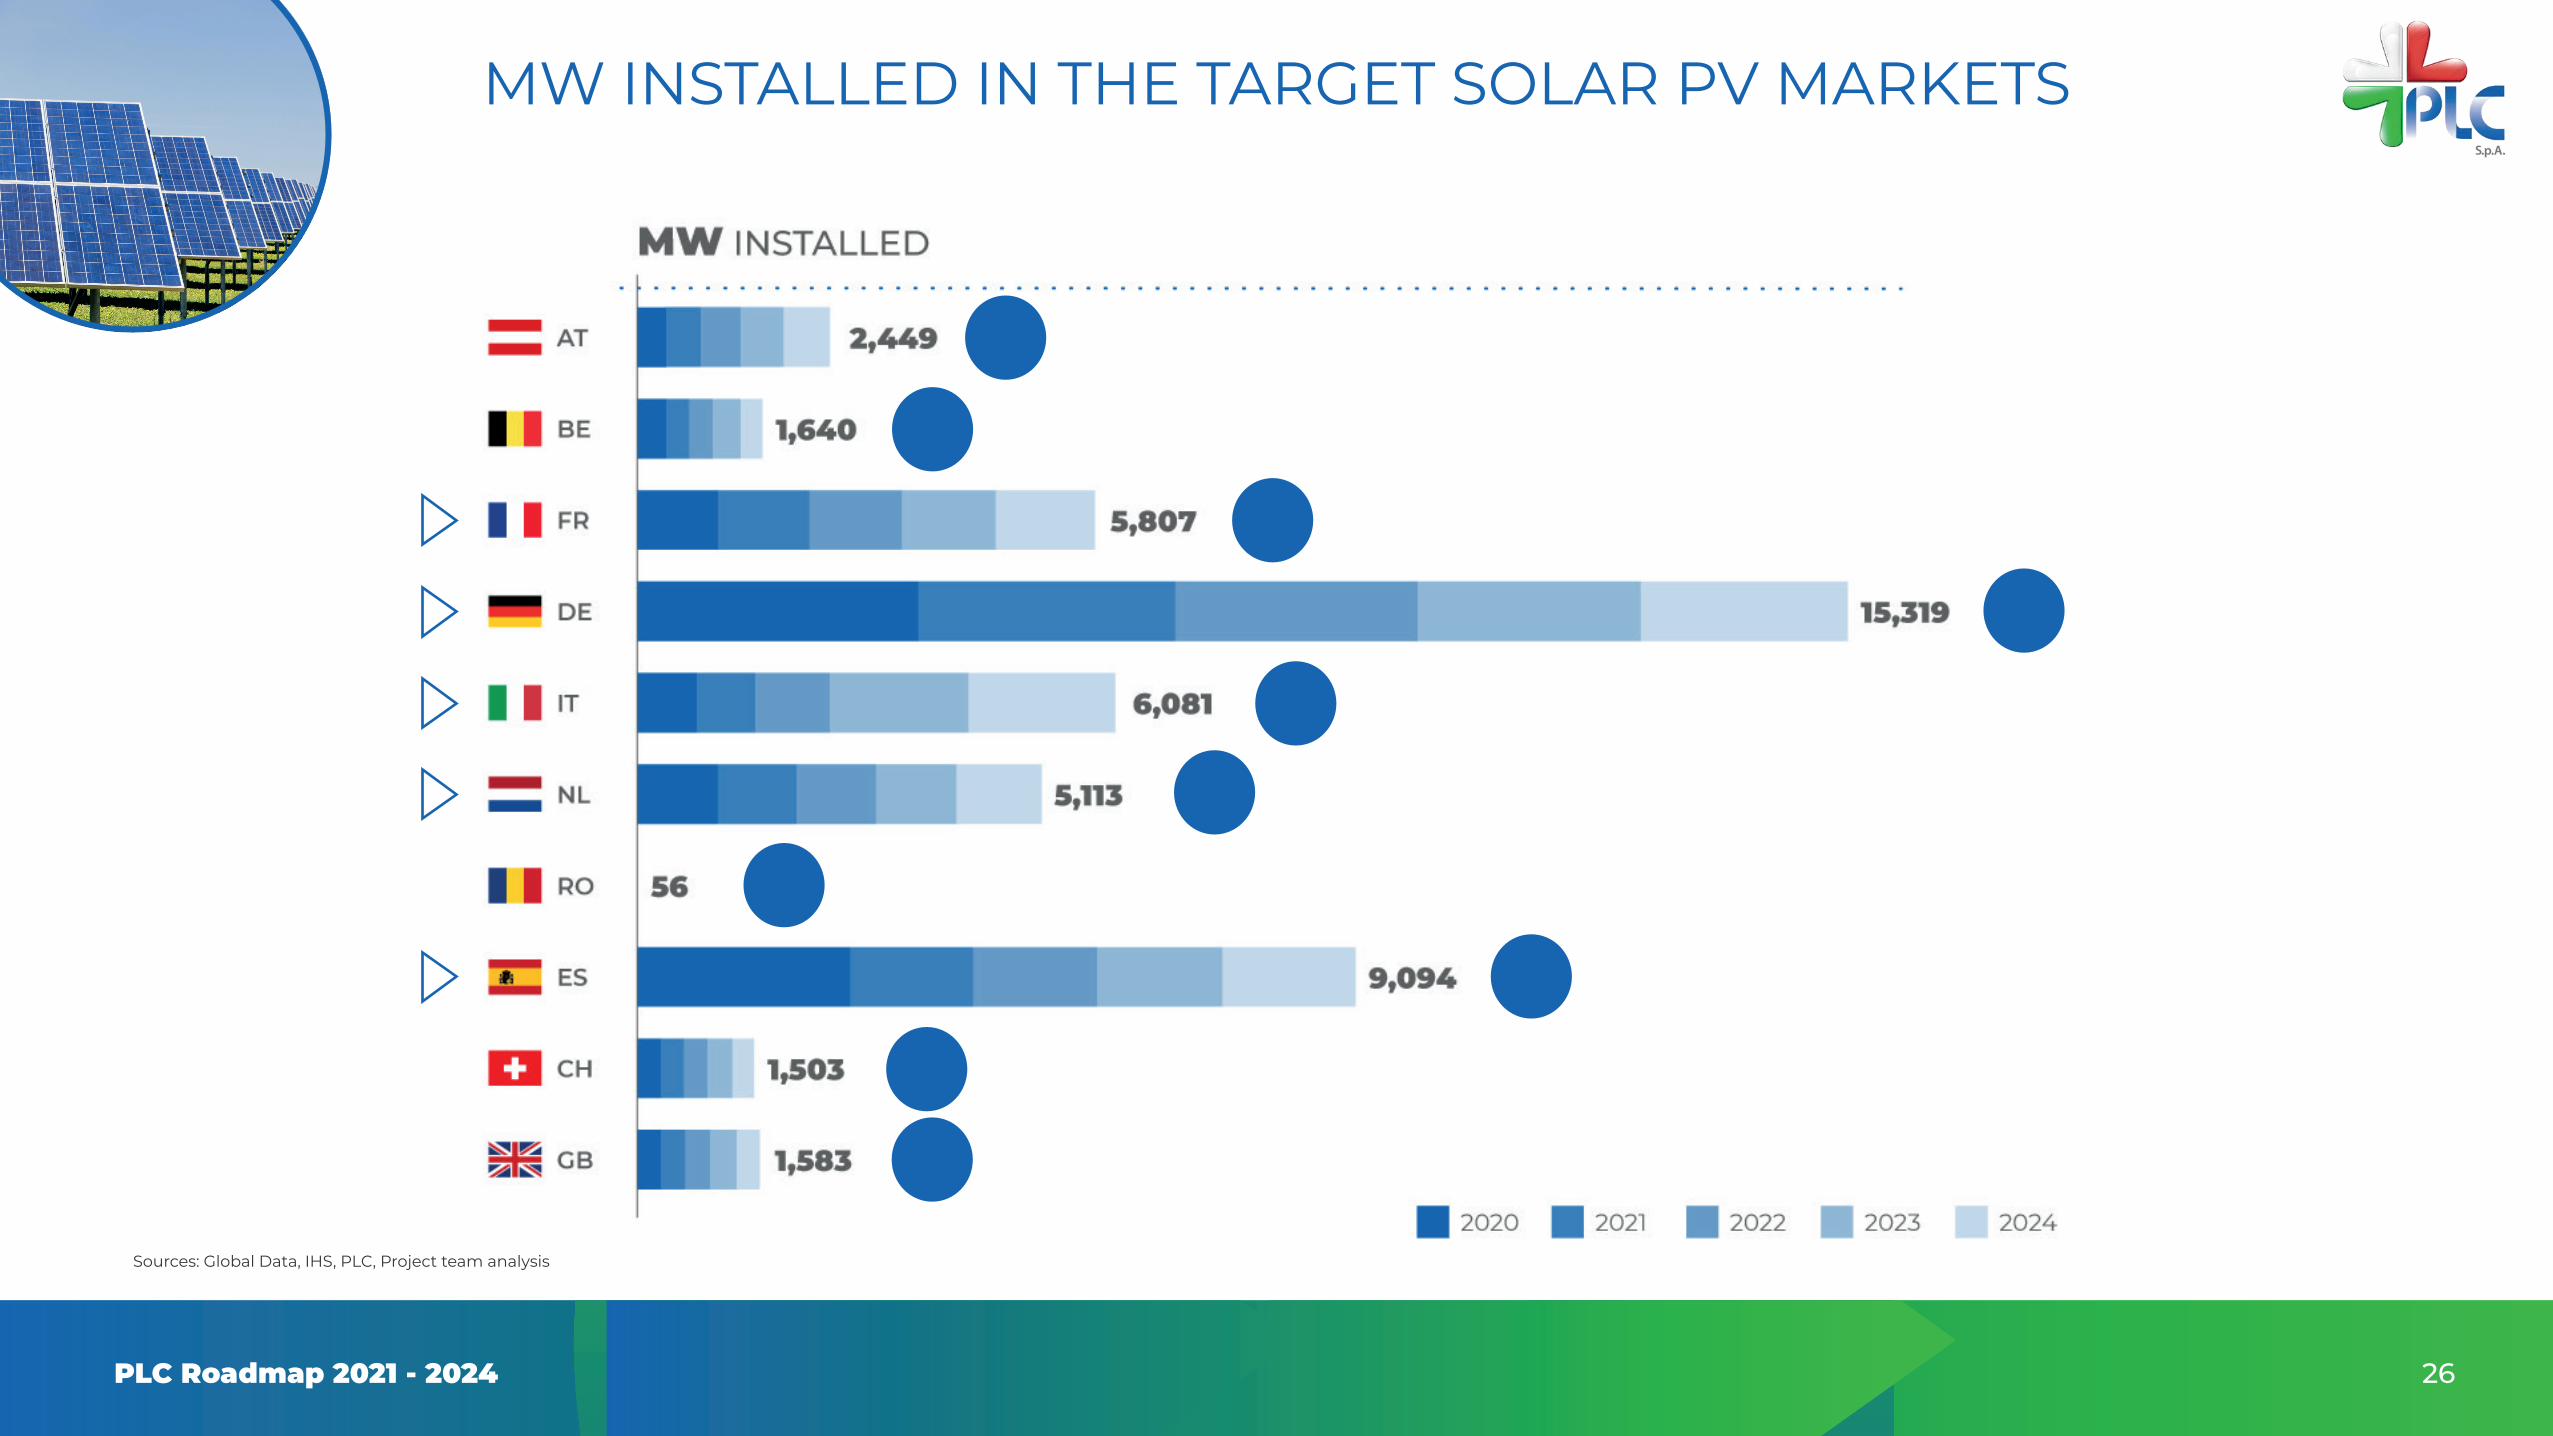
MW INSTALLED IN THE TARGET SOLAR PV MARKETS
Sources: Global Data, IHS, PLC, Project team analysis
27PLC Roadmap 2021 - 2024
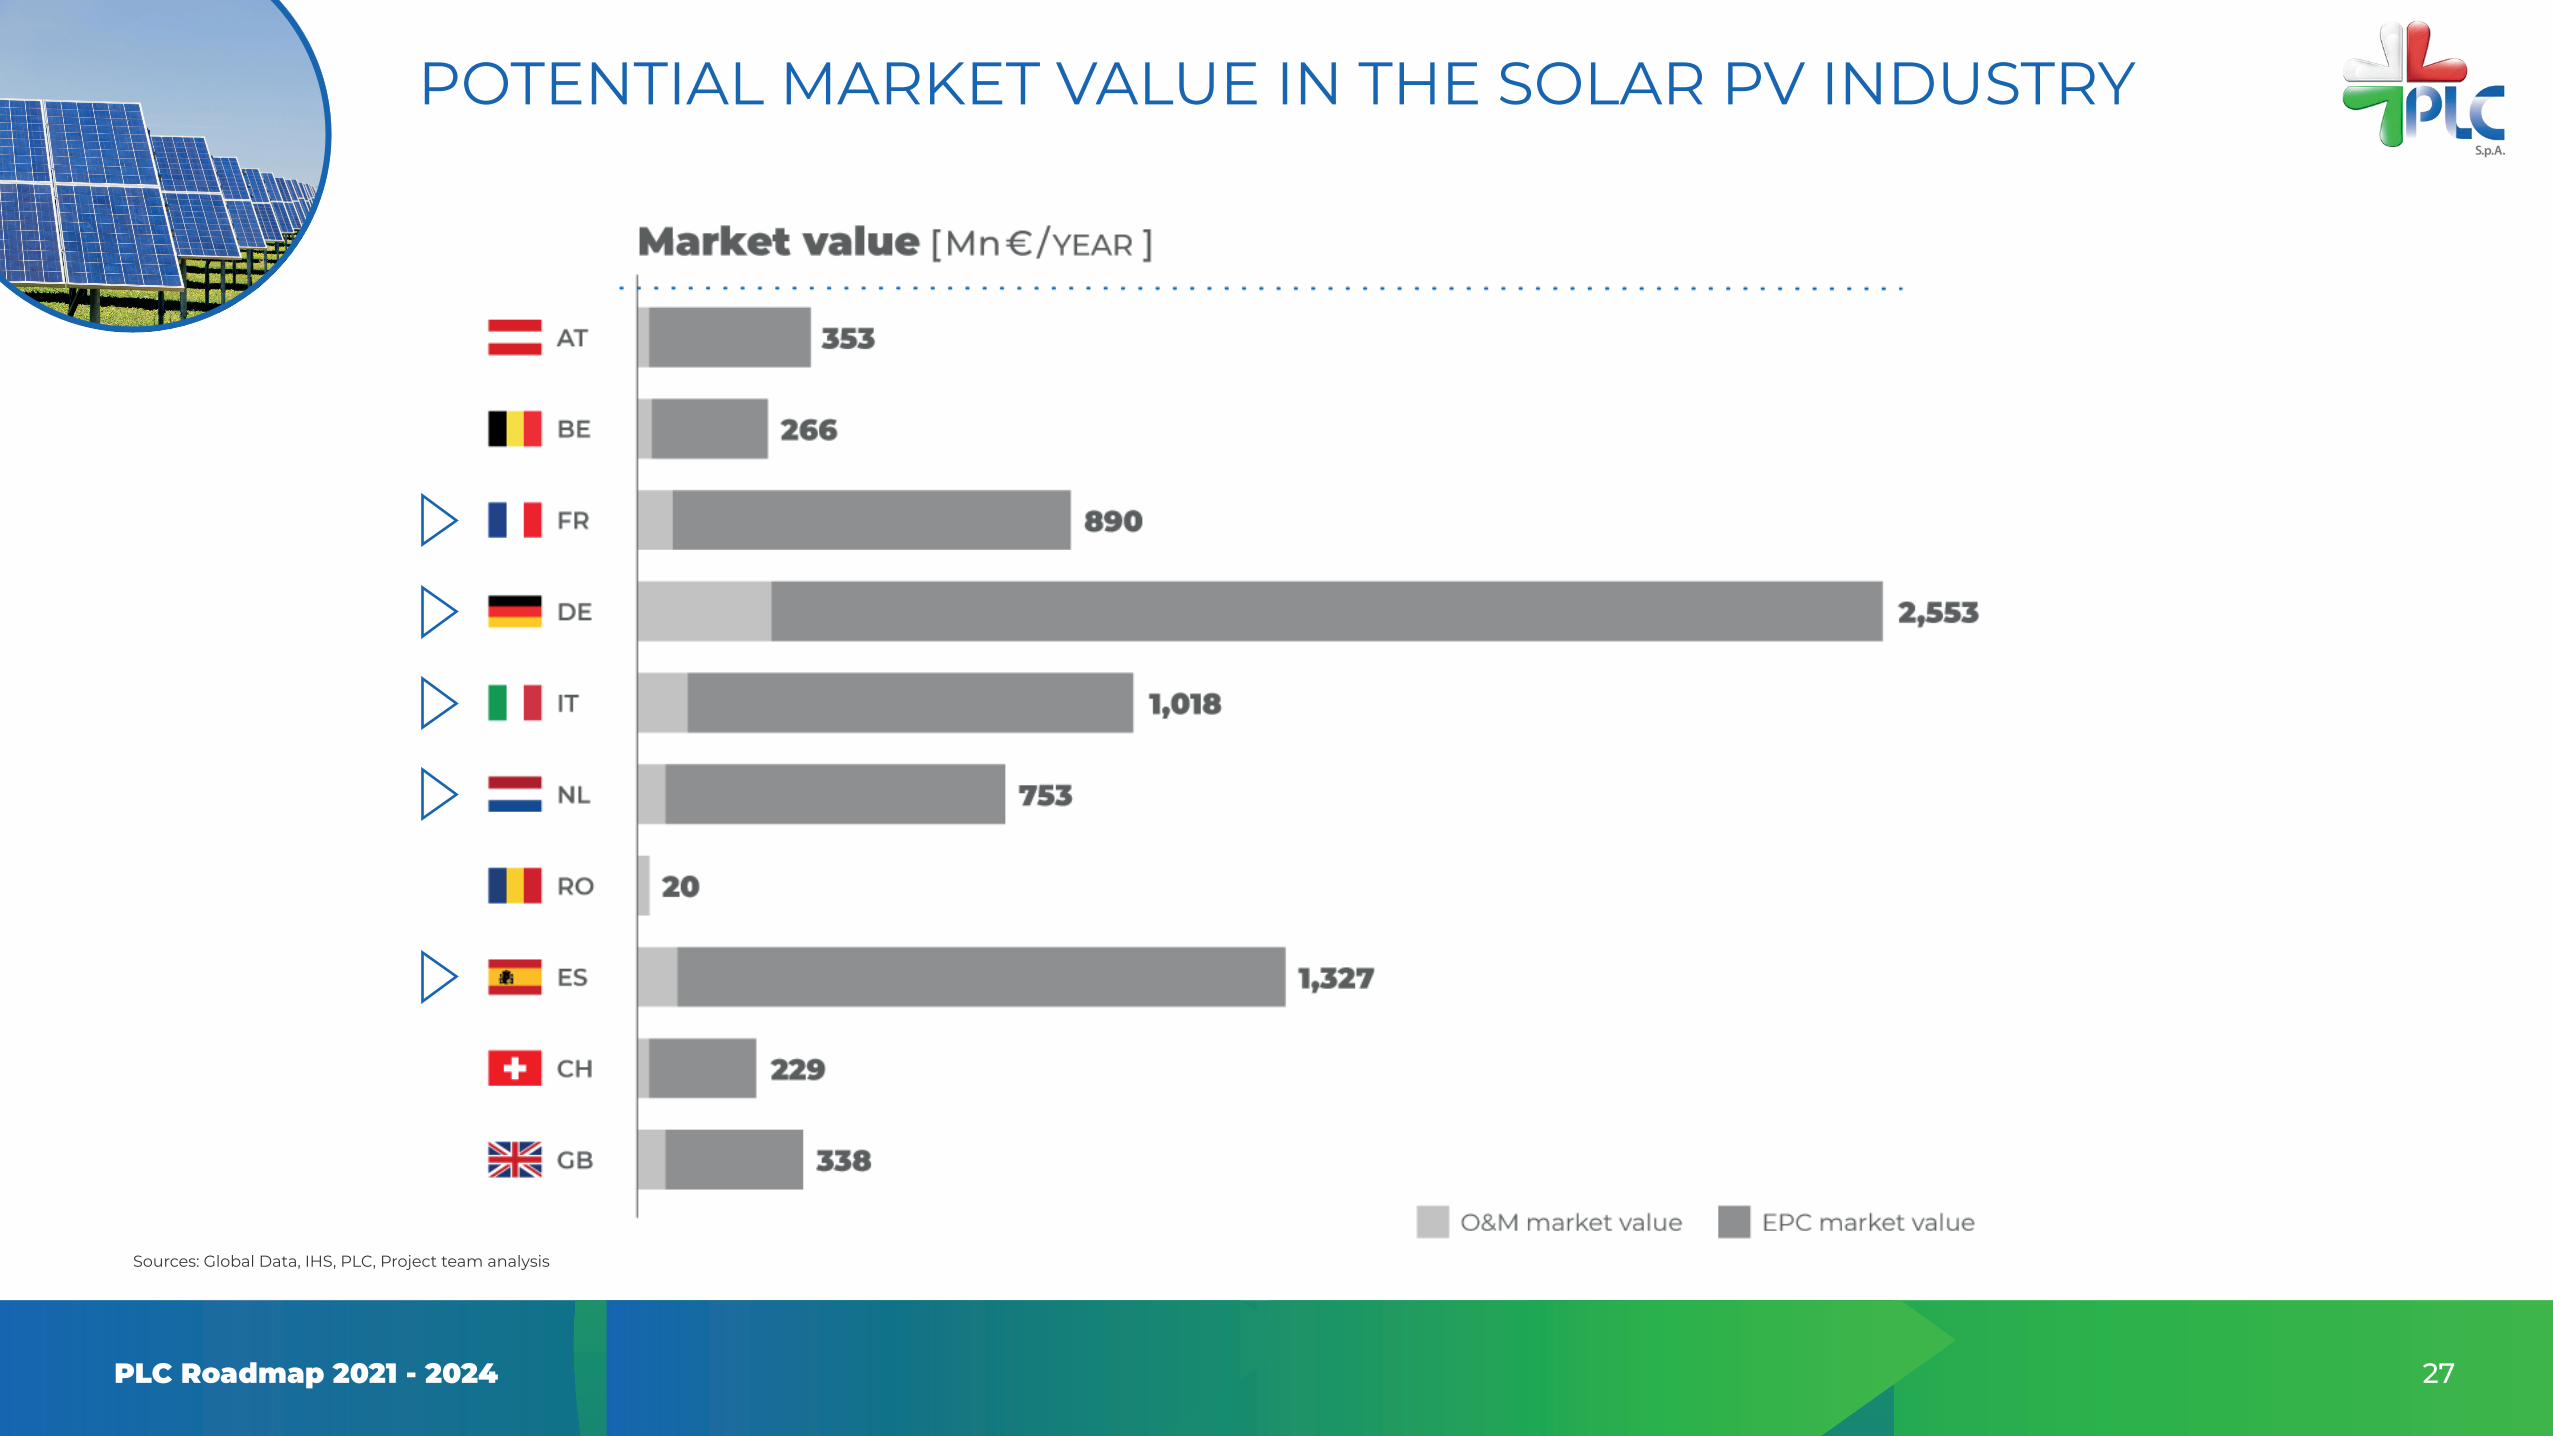
POTENTIAL MARKET VALUE IN THE SOLAR PV INDUSTRY
Sources: Global Data, IHS, PLC, Project team analysis
28PLC Roadmap 2021 - 2024
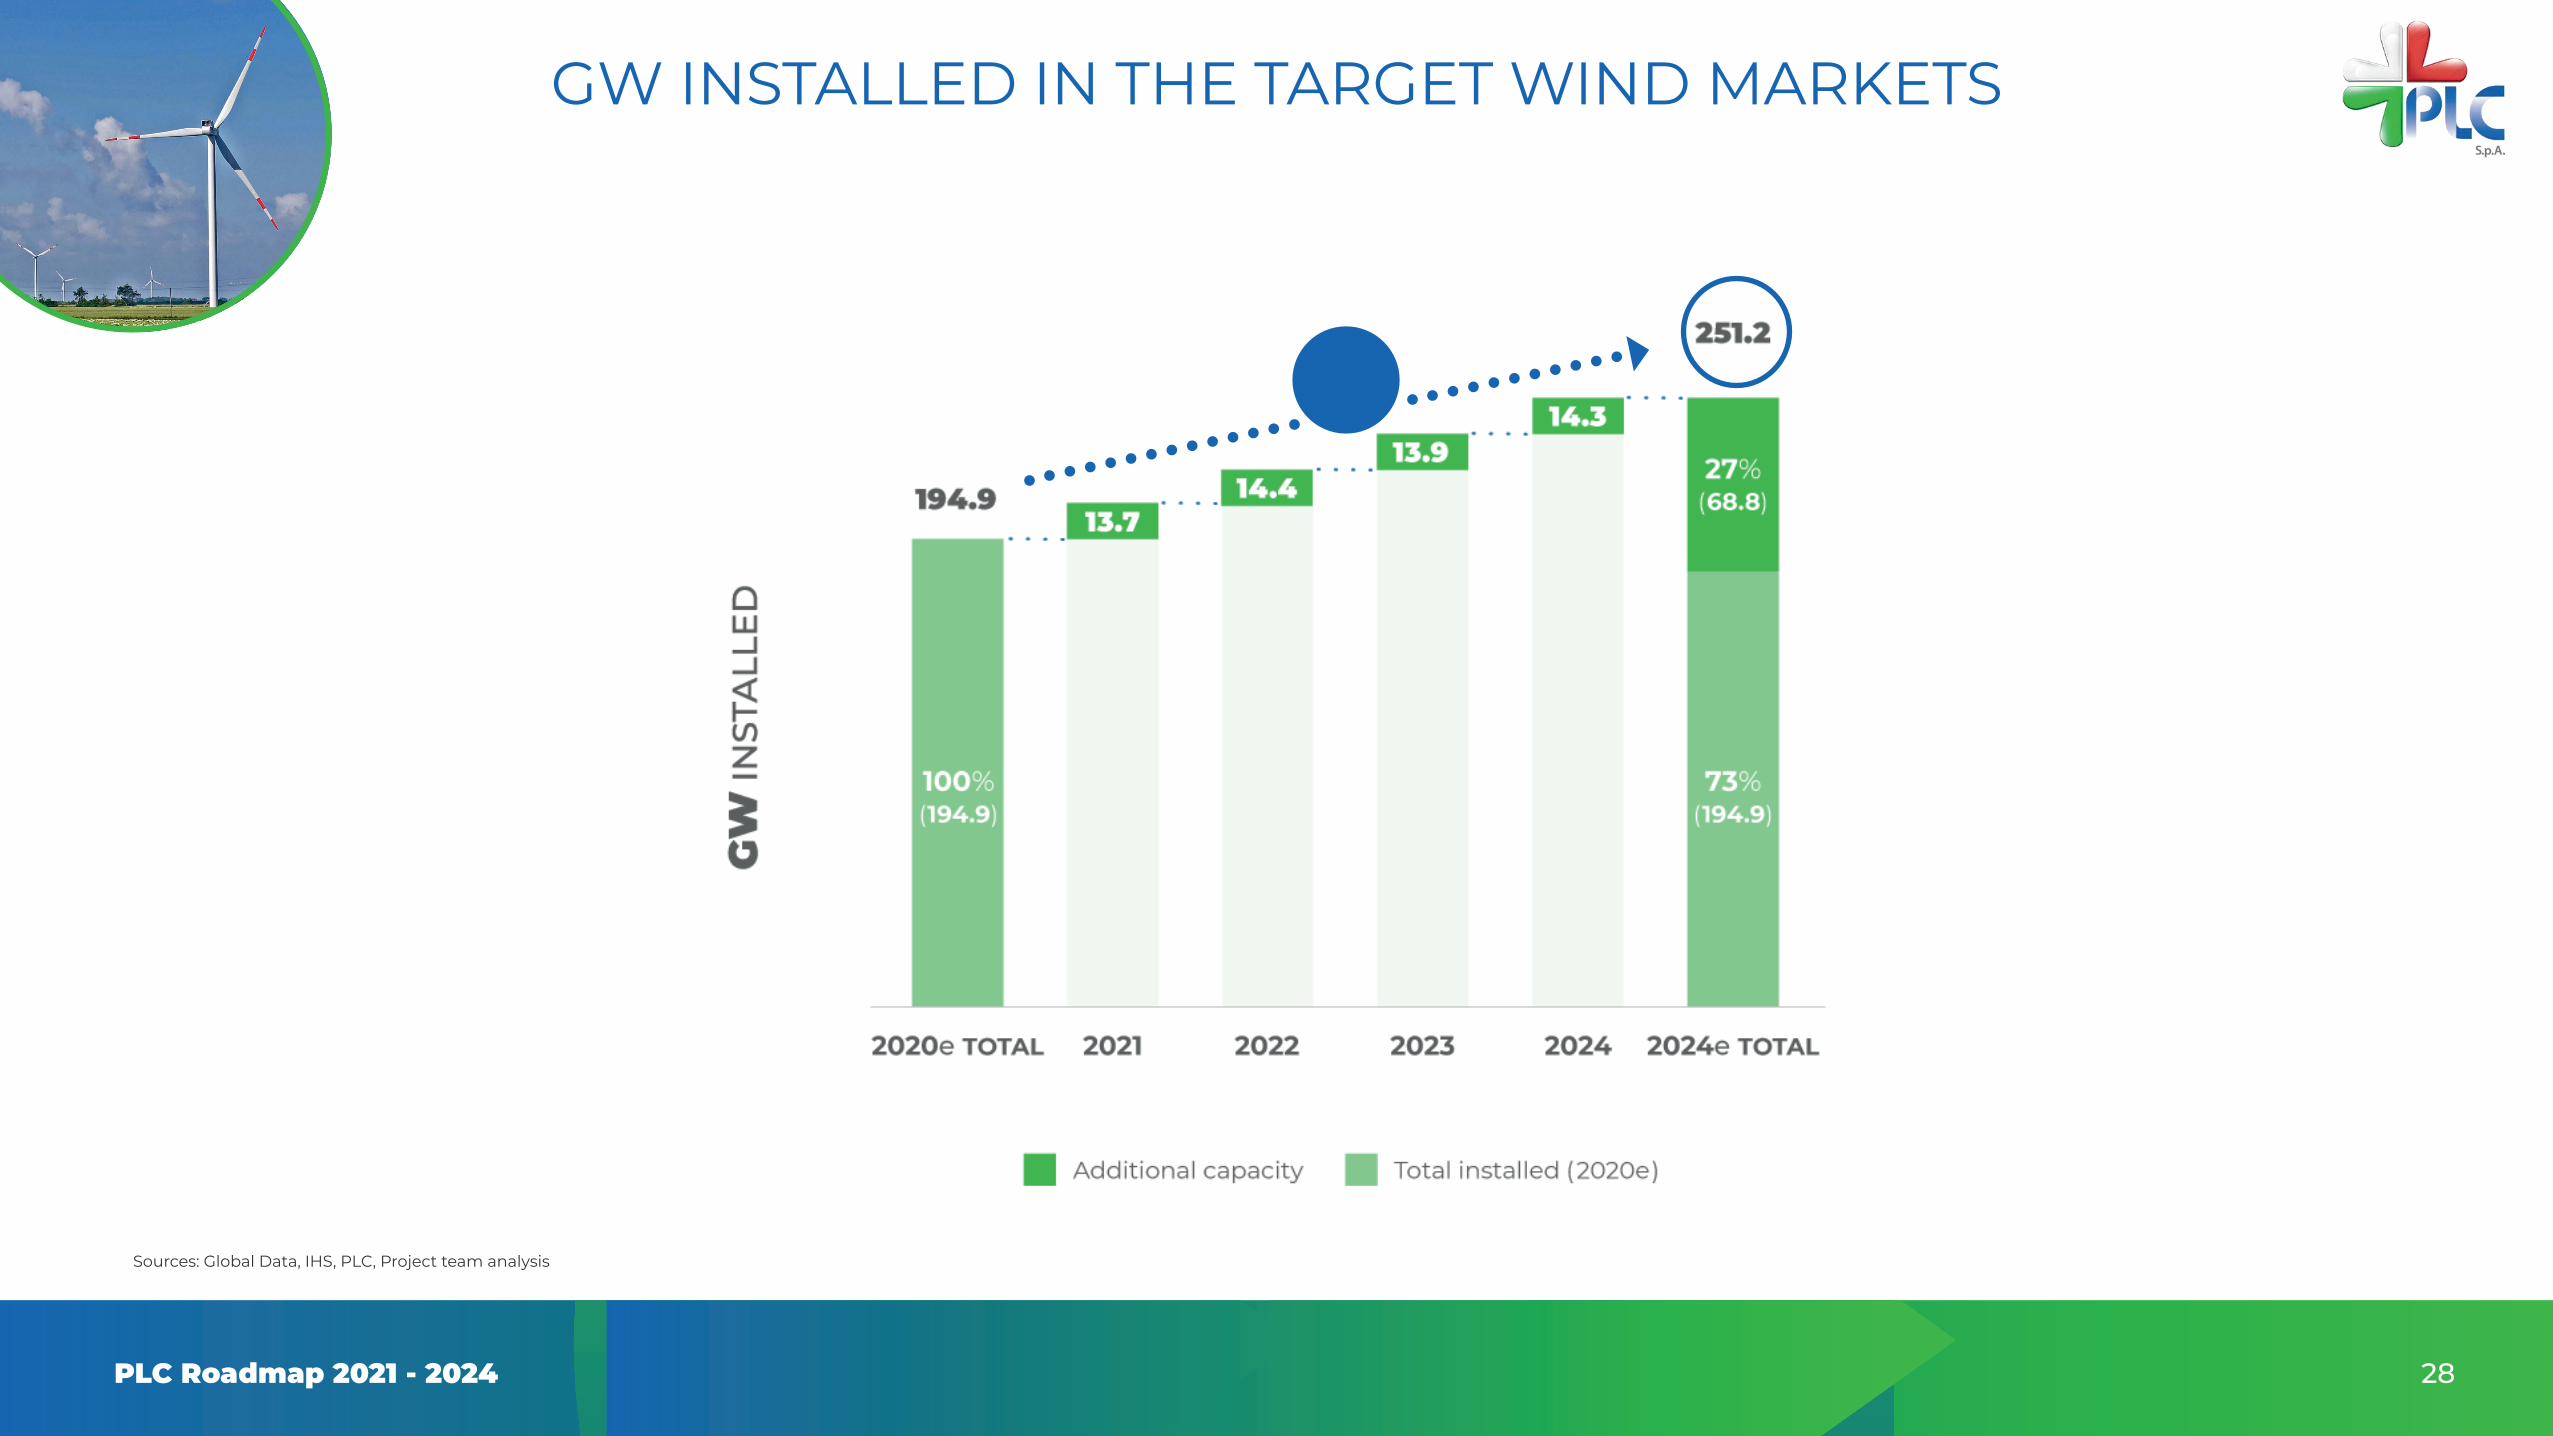
GW INSTALLED IN THE TARGET WIND MARKETS
Sources: Global Data, IHS, PLC, Project team analysis
29PLC Roadmap 2021 - 2024
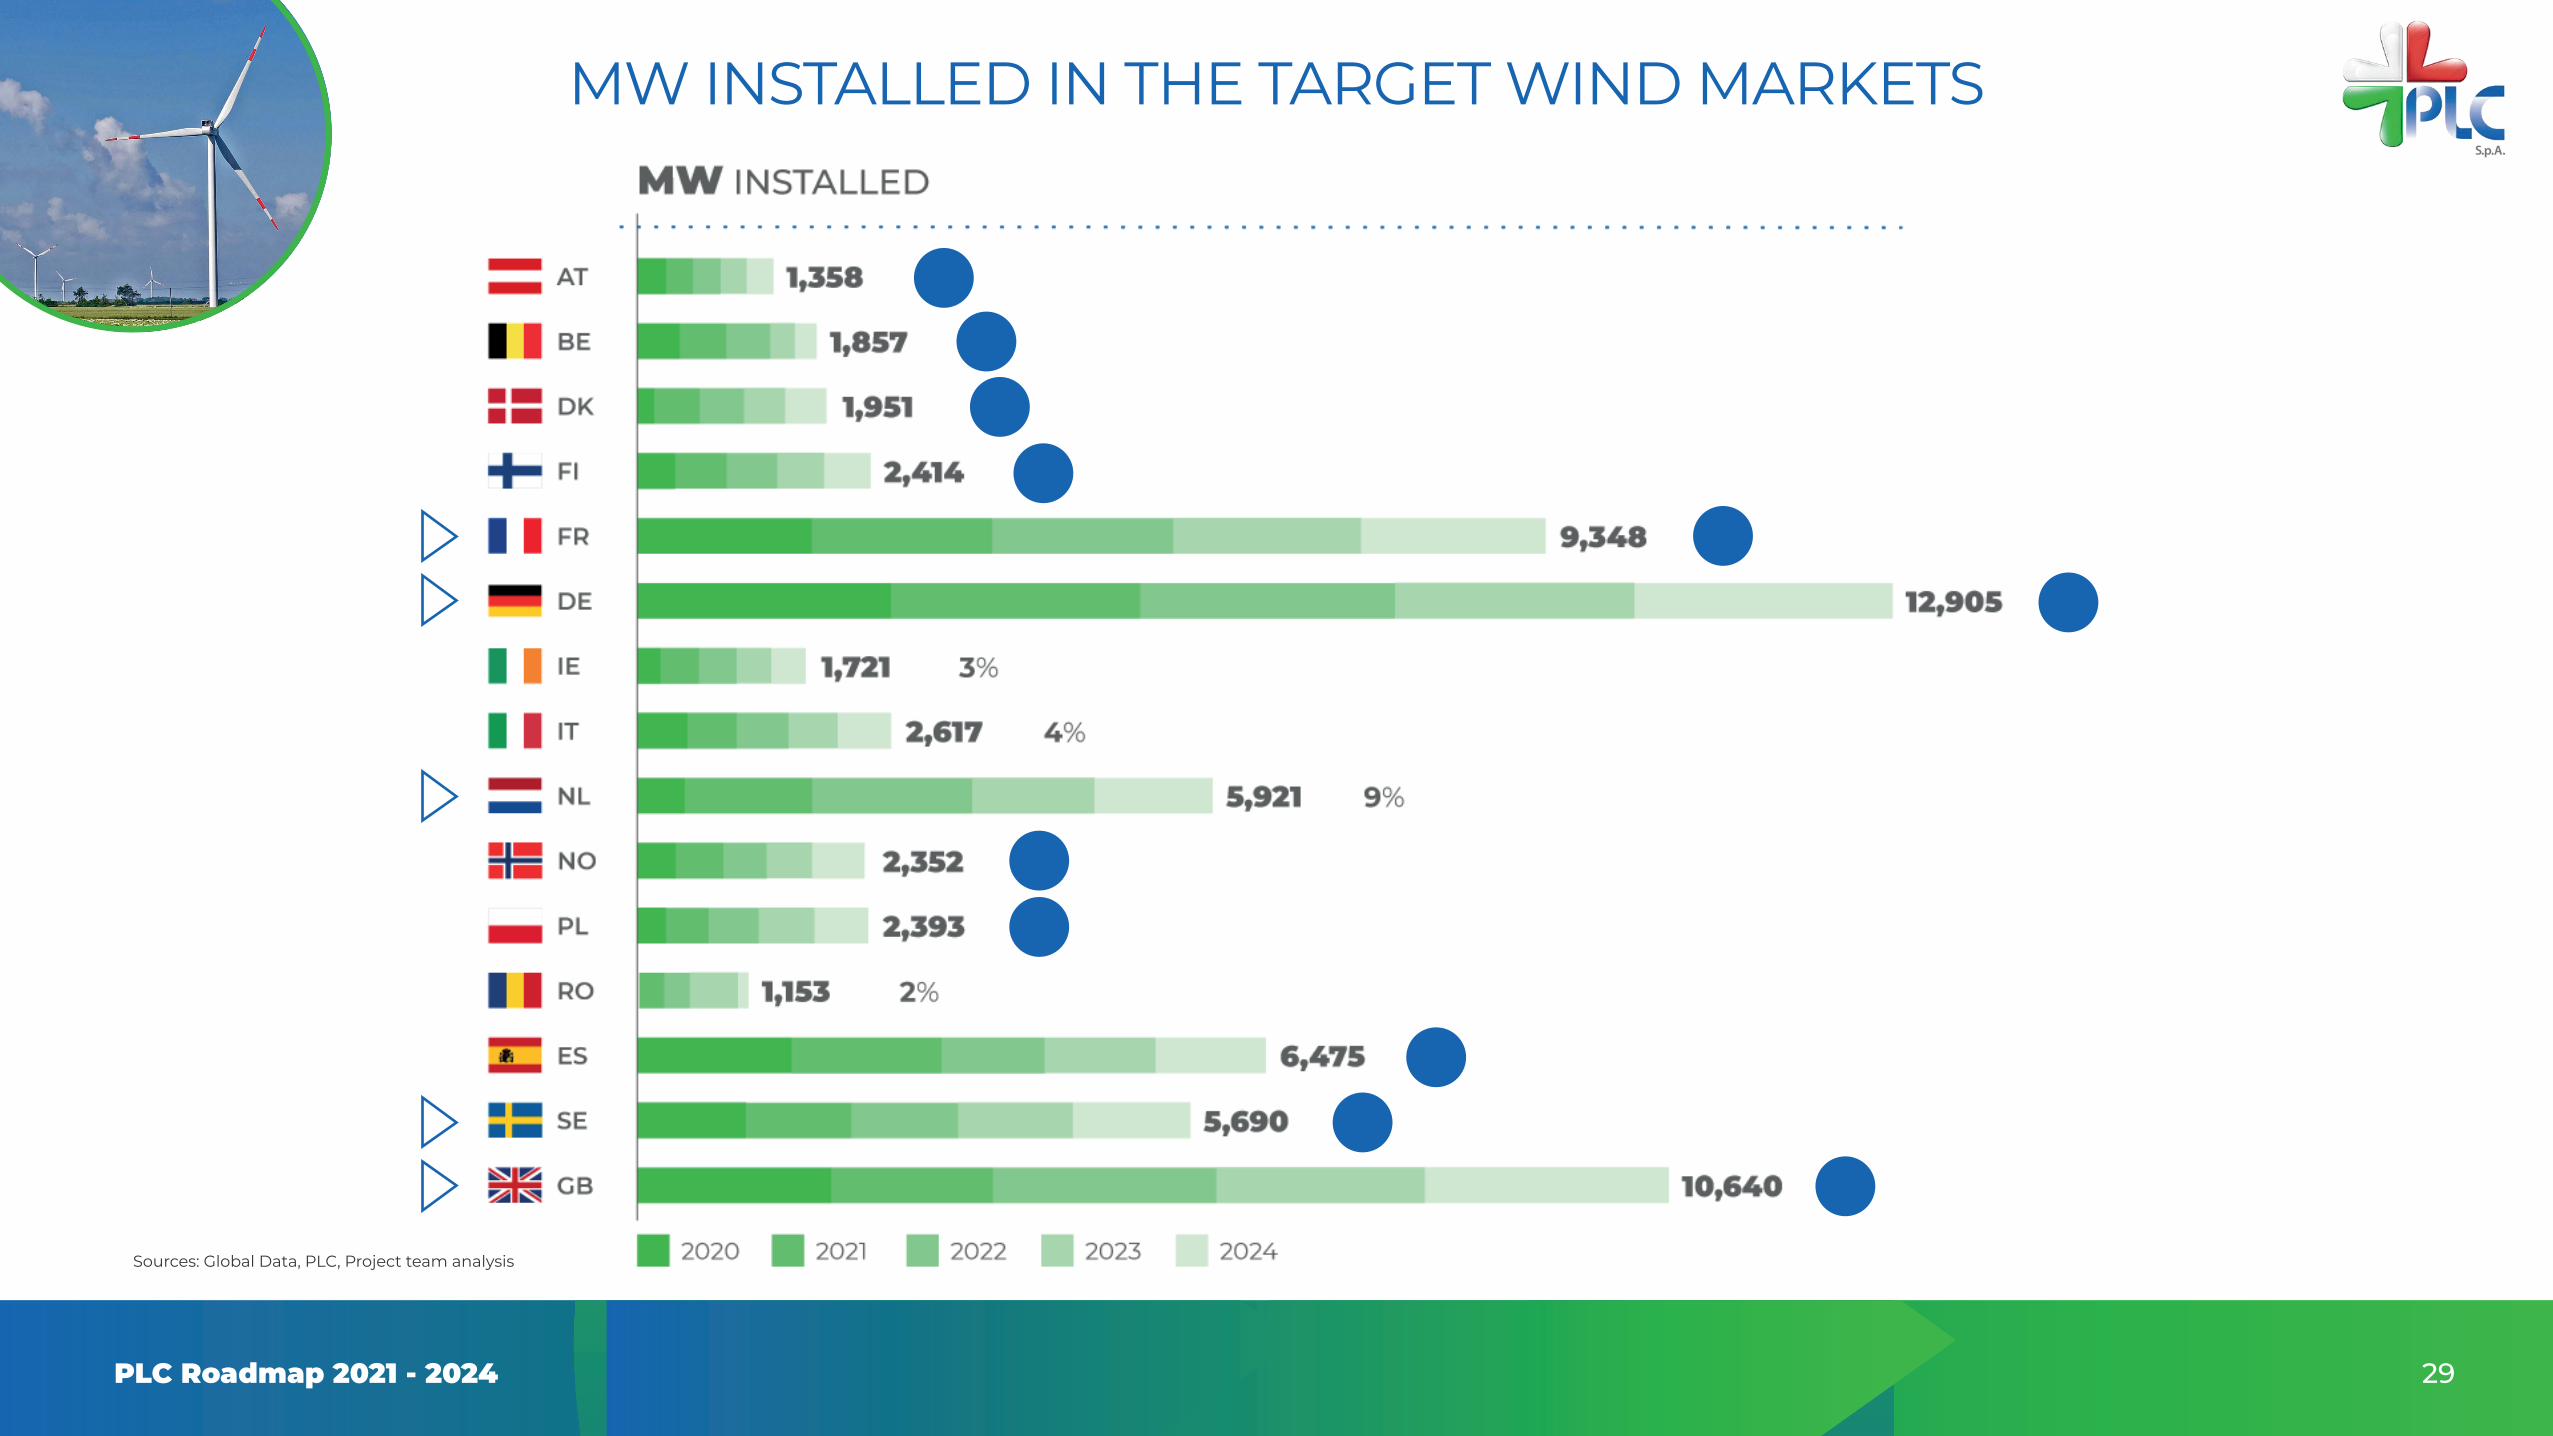
MW INSTALLED IN THE TARGET WIND MARKETS
Sources: Global Data, PLC, Project team analysis

30PLC Roadmap 2021 - 2024
POTENTIAL MARKET VALUE IN THE WIND INDUSTRY
Sources: Global Data, IHS, PLC, Project team analysis

31PLC Roadmap 2021 - 2024
EVOLUTION OF INSTALLED CAPACITY IN SOLAR PV AND WIND INDUSTRY
Sources: PLC Group, Project team analysis, Terna, ANEV Report 2018, GlobalData, SolarPower Europe Global Market Outlook 2018-2022
The Italian pv and wind generation capacity is expected to grow by 7% CAGR between 2018 and 2022, supported by the new incentives regime and the National Energy Strategy to be adopted by the Italian government.
Solar PV installed capacity is located in few regions that are distributed all along the country. Wind capacity is concentrated in southern regions with only Puglia recording over 2GW.
THE ITALIAN PV AND WIND SECTORS ARE EXPECTED TO INCREASE AT AN AVERAGE RATE OF 7% P.A. IN THE PERIOD 2019-2022

32PLC Roadmap 2021 - 2024
EVOLUTION OF INSTALLED CAPACITY IN BIOENERGY INDUSTRY
The Italian bioenergy generation capacity has remained quite stable in the last years. It is almost evenly distributed between solid biomass, biogas and bioliquids.
The bioenergy installed capacity is located in few regions that are concentrated in the north and in the south of Italy, Lombardy being ahead with more than 900 MW as of end 2017..
THE BIOGAS MARKET HAS BEEN QUITE STABLE IN THE LAST YEARS BUT SHOULD BE POSITIVELY IMPACTED BY THE FORTHCOMING AUCTIONS
Sources: PLC Group, Project team analysis, Terna, GSE

33PLC Roadmap 2021 - 2024
GROWTH SCENARIO FOR EXTERNAL LINES
The important organic growth expected until 2023, also thanks to the maximization of the opportunities offered in the Construction Segment, will bring incremental financial resources to be allocated to investments in the Services Segment. The cash generation with subsequent evolution of the net financial position is strong.
Furthermore, the growth is in line with the objective of strengthening the service segment especially its “recurring” component which ensures the stabilization of the Group’s overall profitability, ensuring the achievement of our targets and the creation of value for all stakeholders.
CONSOLIDATION EFFECTS NEWCO
34PLC Roadmap 2021 - 2024
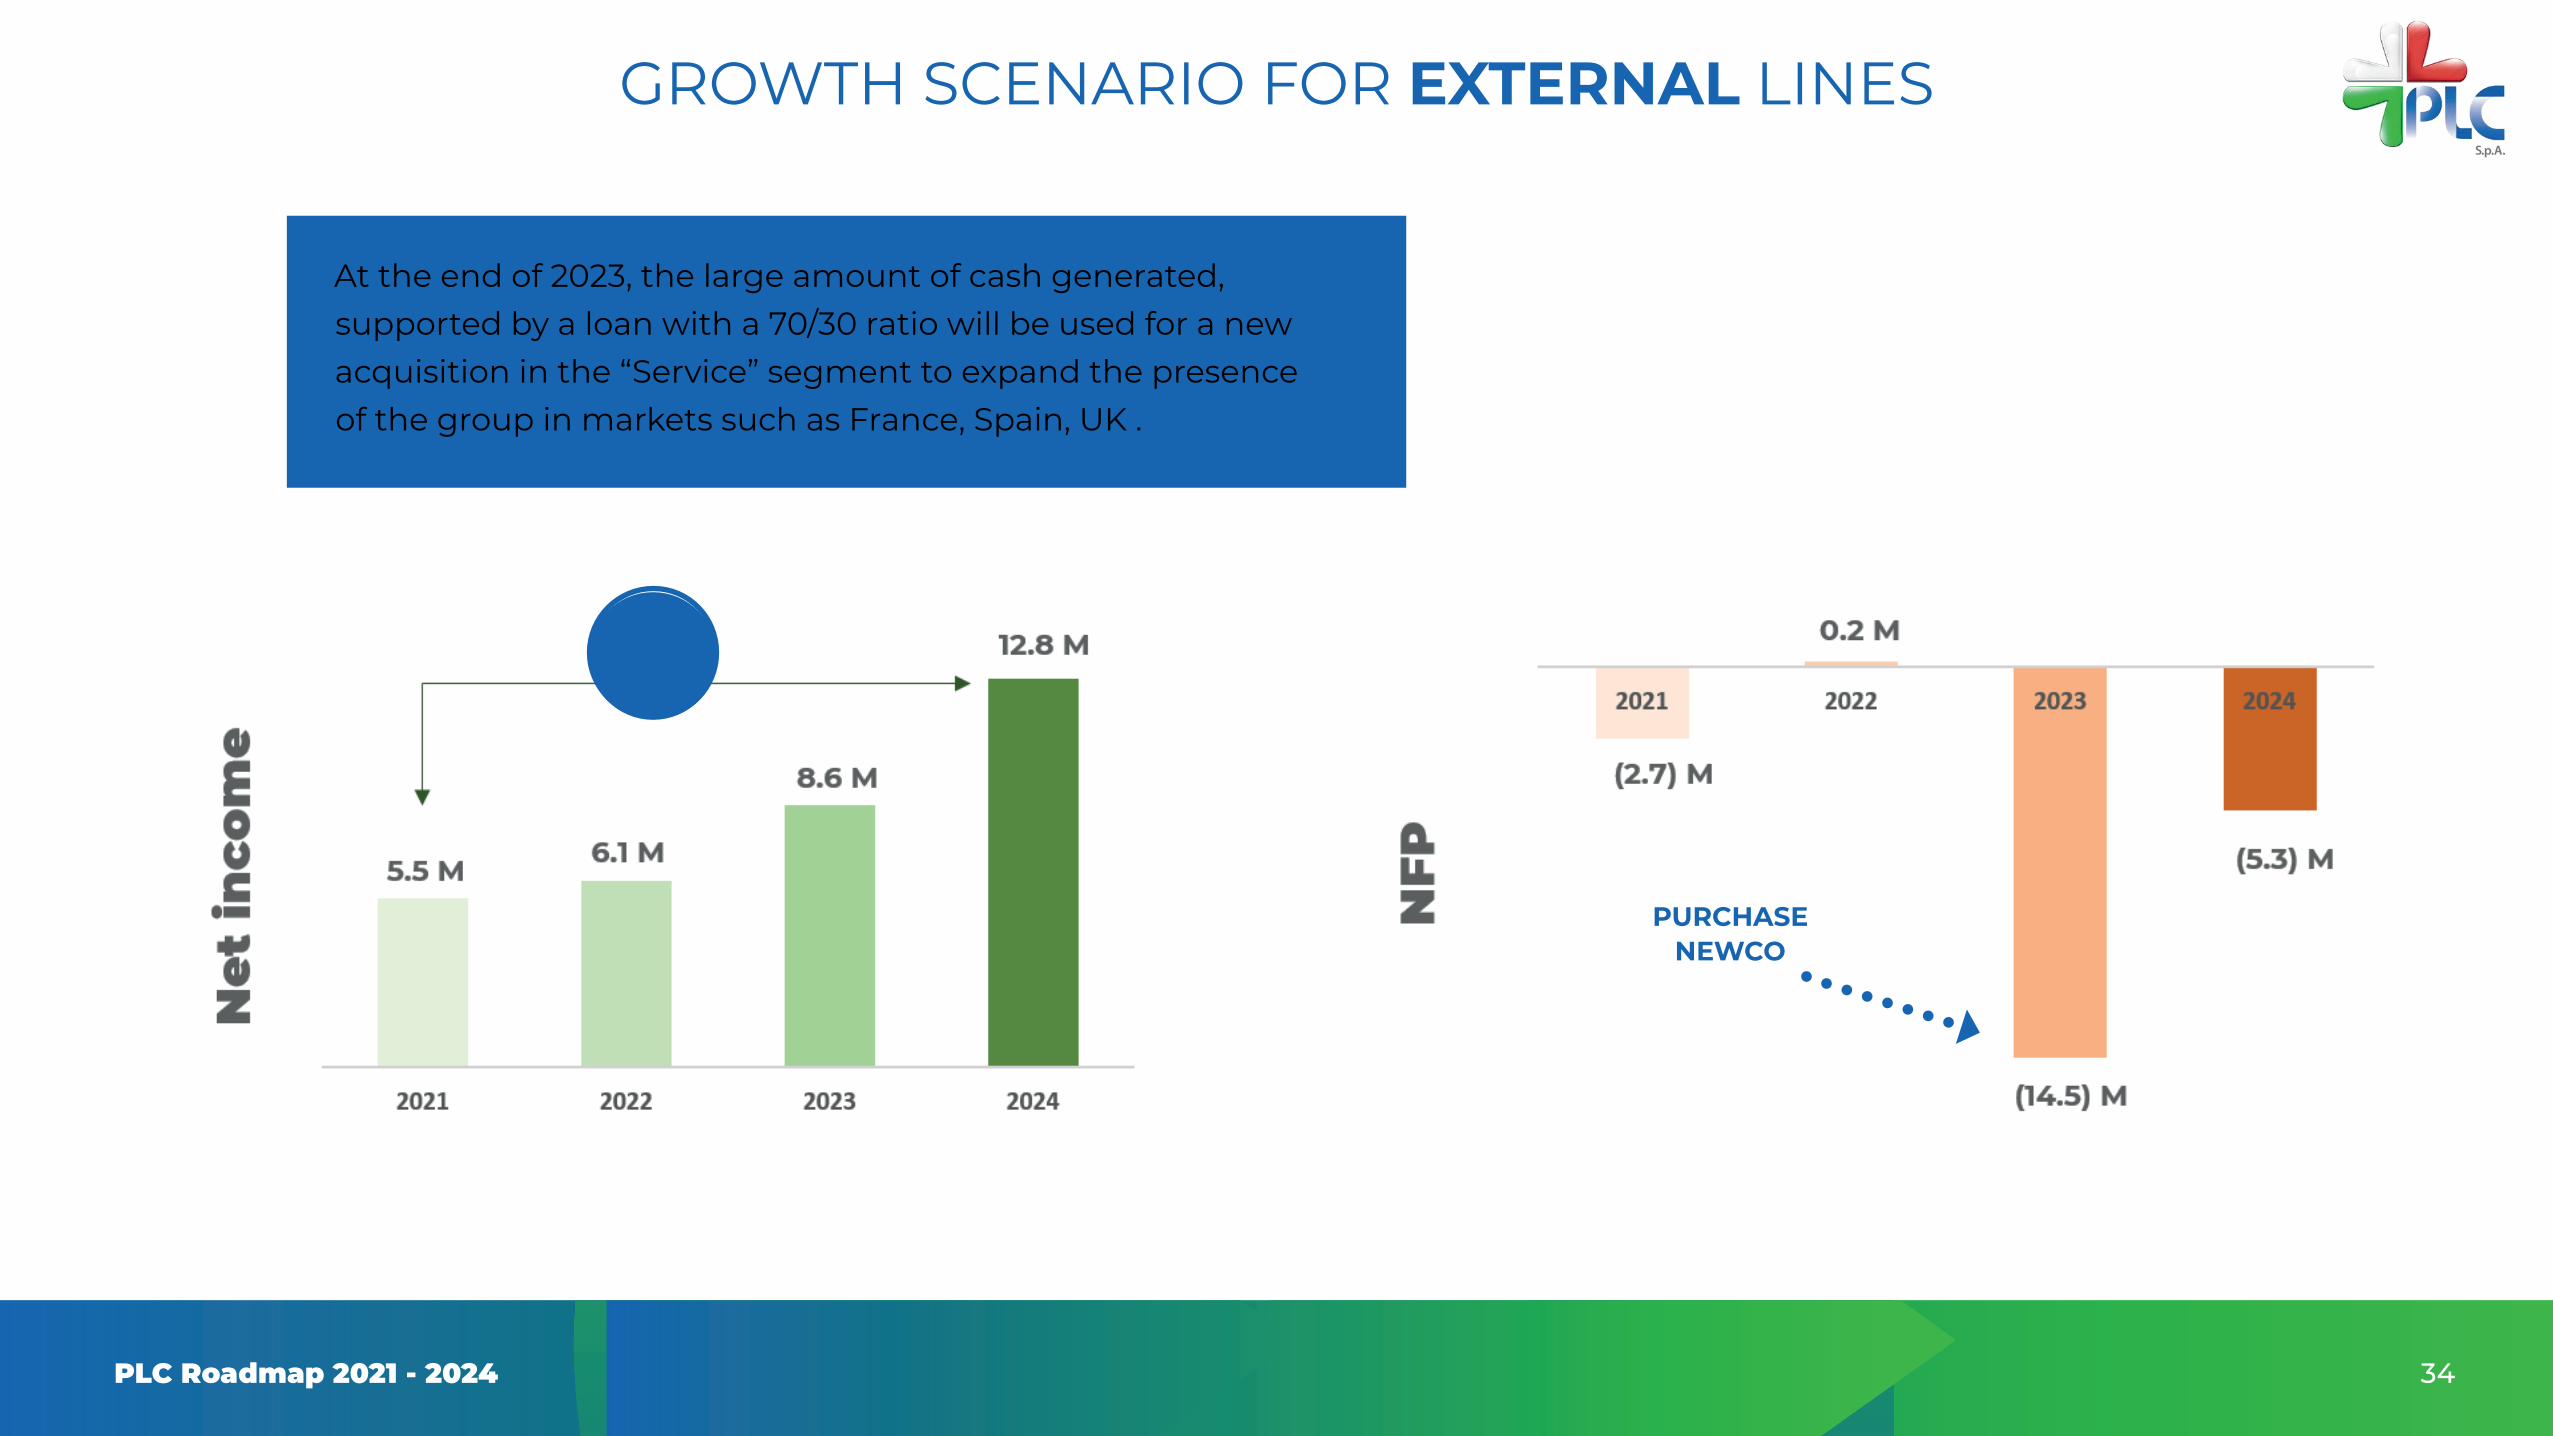
GROWTH SCENARIO FOR EXTERNAL LINES
At the end of 2023, the large amount of cash generated, supported by a loan with a 70/30 ratio will be used for a new acquisition in the “Service” segment to expand the presence of the group in markets such as France, Spain, UK .
PURCHASE NEWCO

35PLC Roadmap 2021 - 2024
GROWTH SCENARIO FOR EXTERNAL LINES
The acquisition is managed out of the consolidation perimeter in order to better understand the expected organic growth of the current perimeter of the PLC Group and the external growth deriving from the possible acquisition.
€ 2.5M in 2022
Entreprise Value target = € 21.0M (7x EBITDA)
€ 2.5M in 2023
Financing = 70% of purchase price = € 14.7M
€ 3.5M in 2024
Revenues NewCo = approx. € 21.0M
EBITDA NewCo = € 3.0M
DIVIDEND DISTRIBUTION PROPOSAL
NEWCO ACQUISITION HYPOTHESIS - END OF 2023 WITH CONTRIBUTIONS STARTING FROM FINANCIAL YEAR 2024
36PLC Roadmap 2021 - 2024
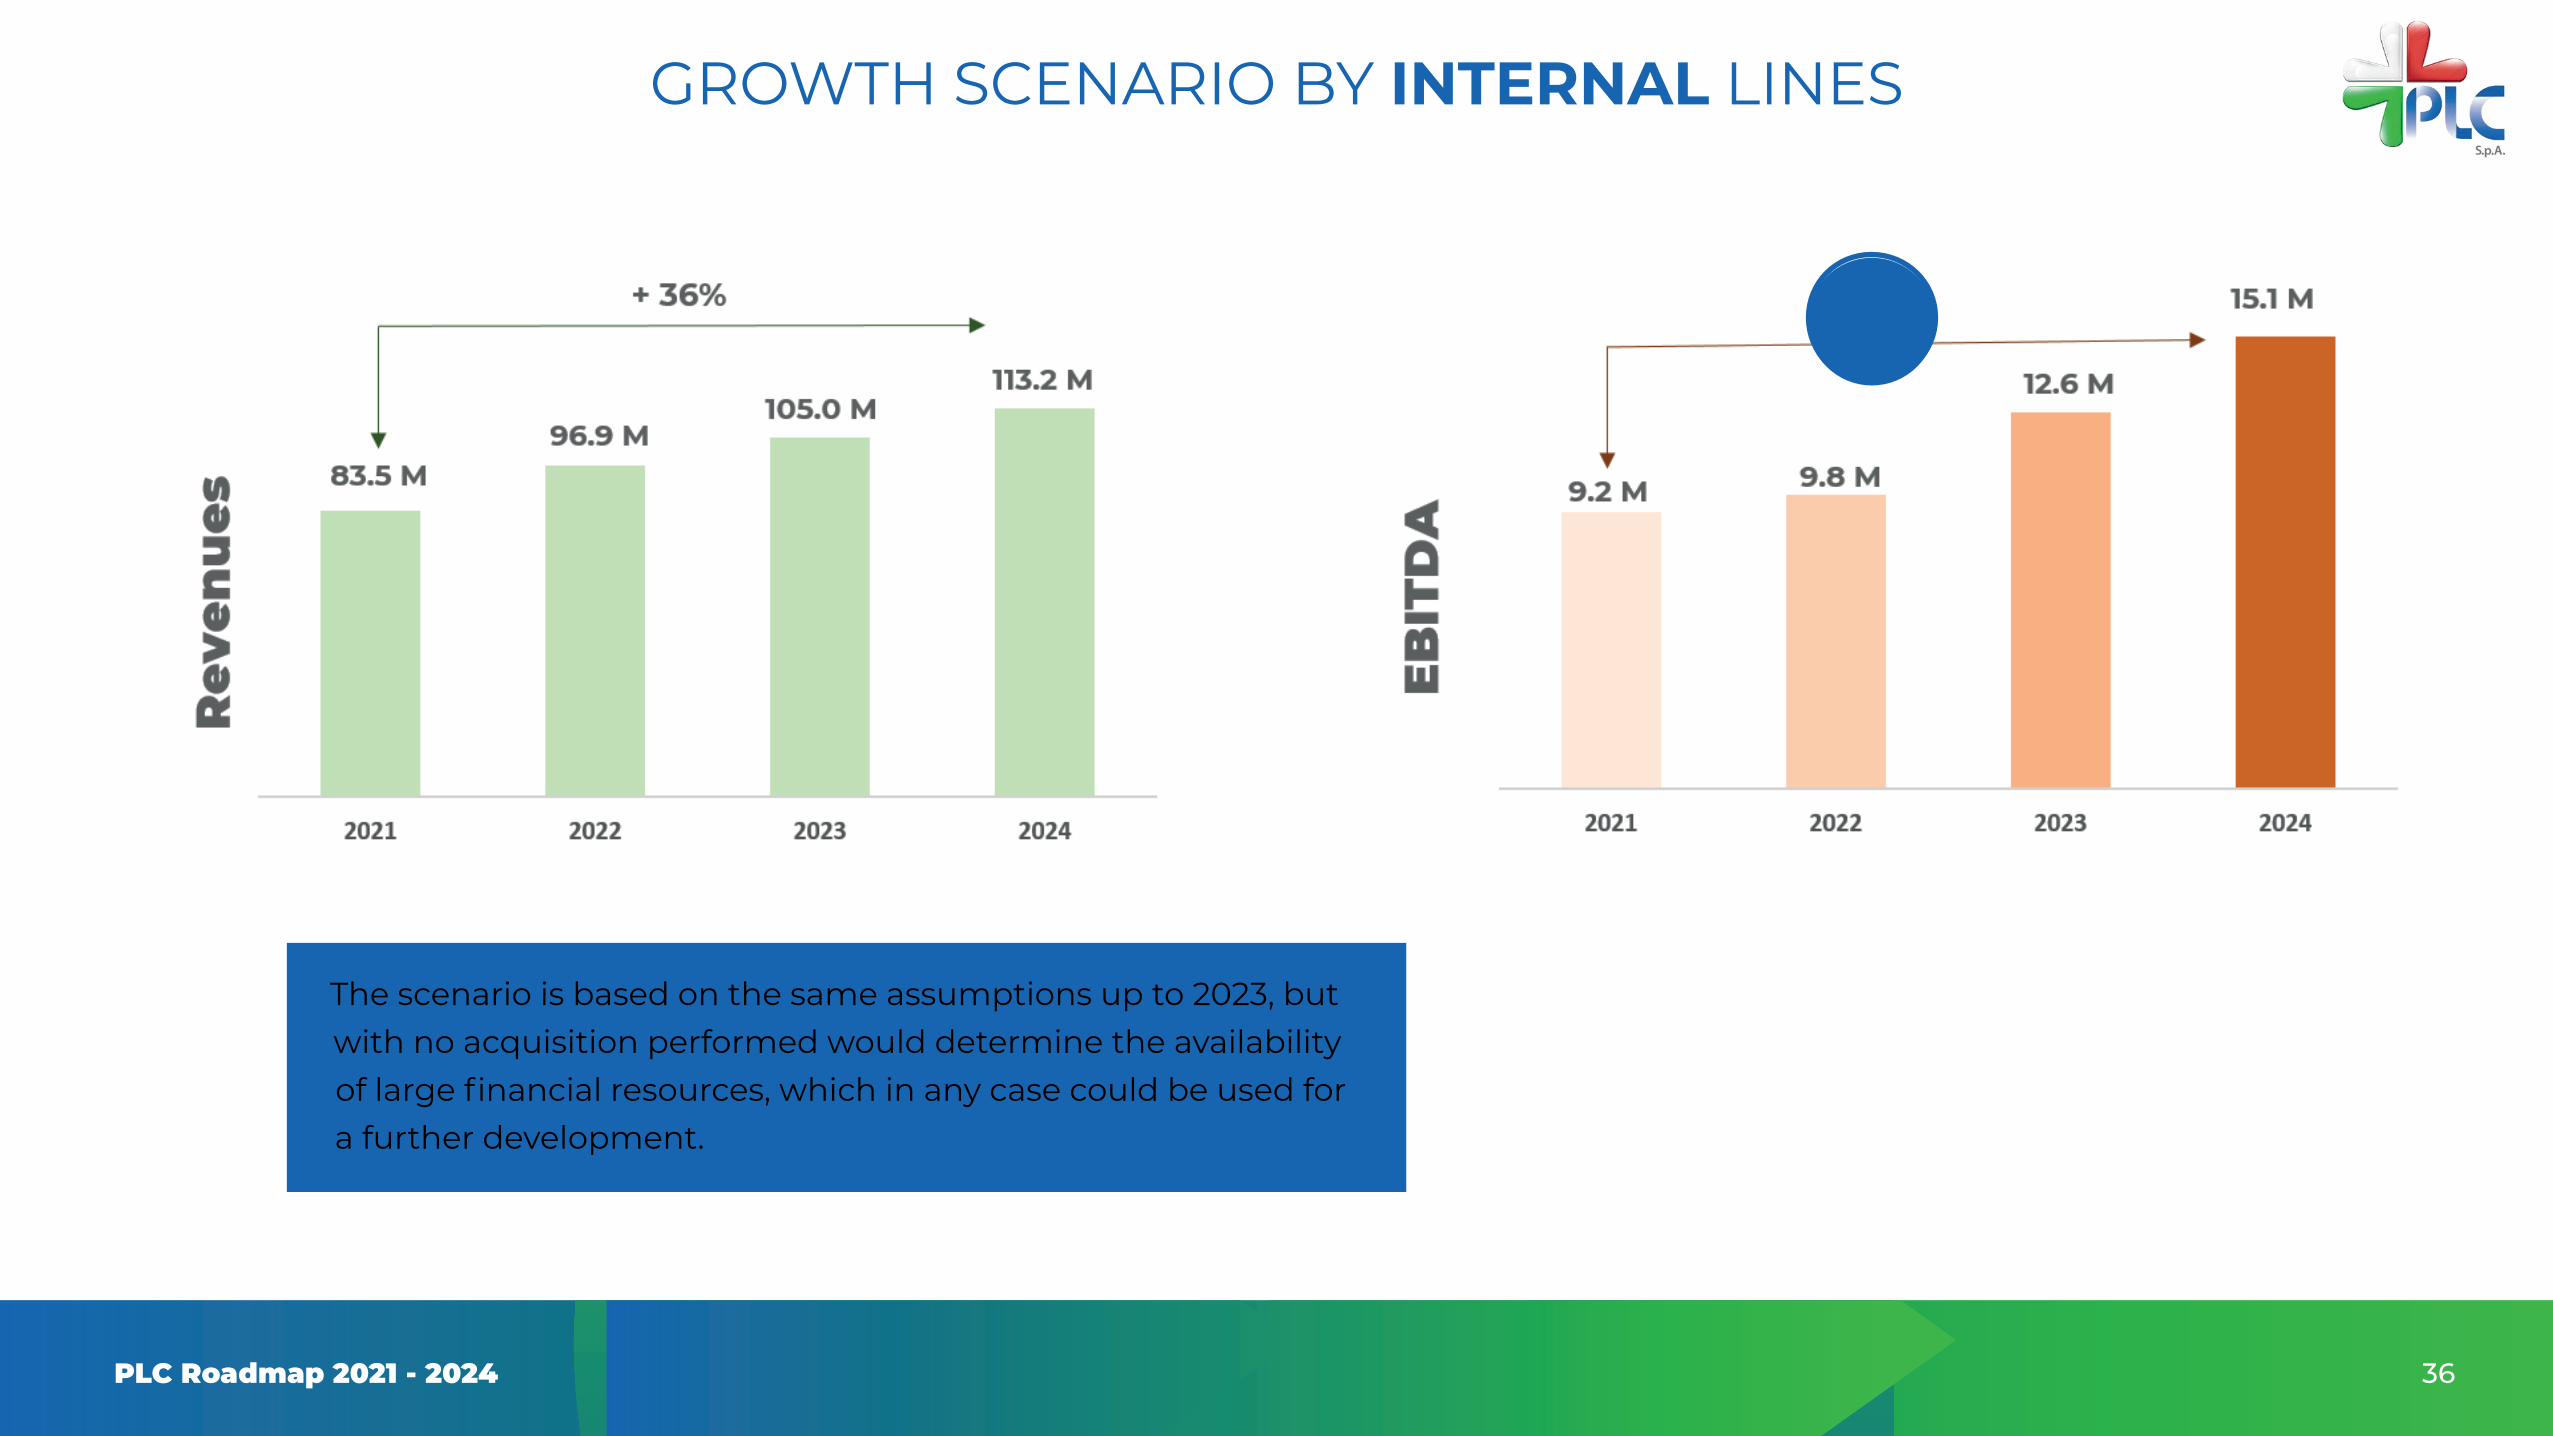
GROWTH SCENARIO BY INTERNAL LINES
The scenario is based on the same assumptions up to 2023, but with no acquisition performed would determine the availability of large financial resources, which in any case could be used for a further development.

37PLC Roadmap 2021 - 2024
GROWTH SCENARIO BY INTERNAL LINES
The significant growth in contribution margins, driven by the conversion to services with higher profitability, as well as by the revolving BOT business, will make available a significant financial resources.
GREAT CASH GENERATION
38PLC Roadmap 2021 - 2024
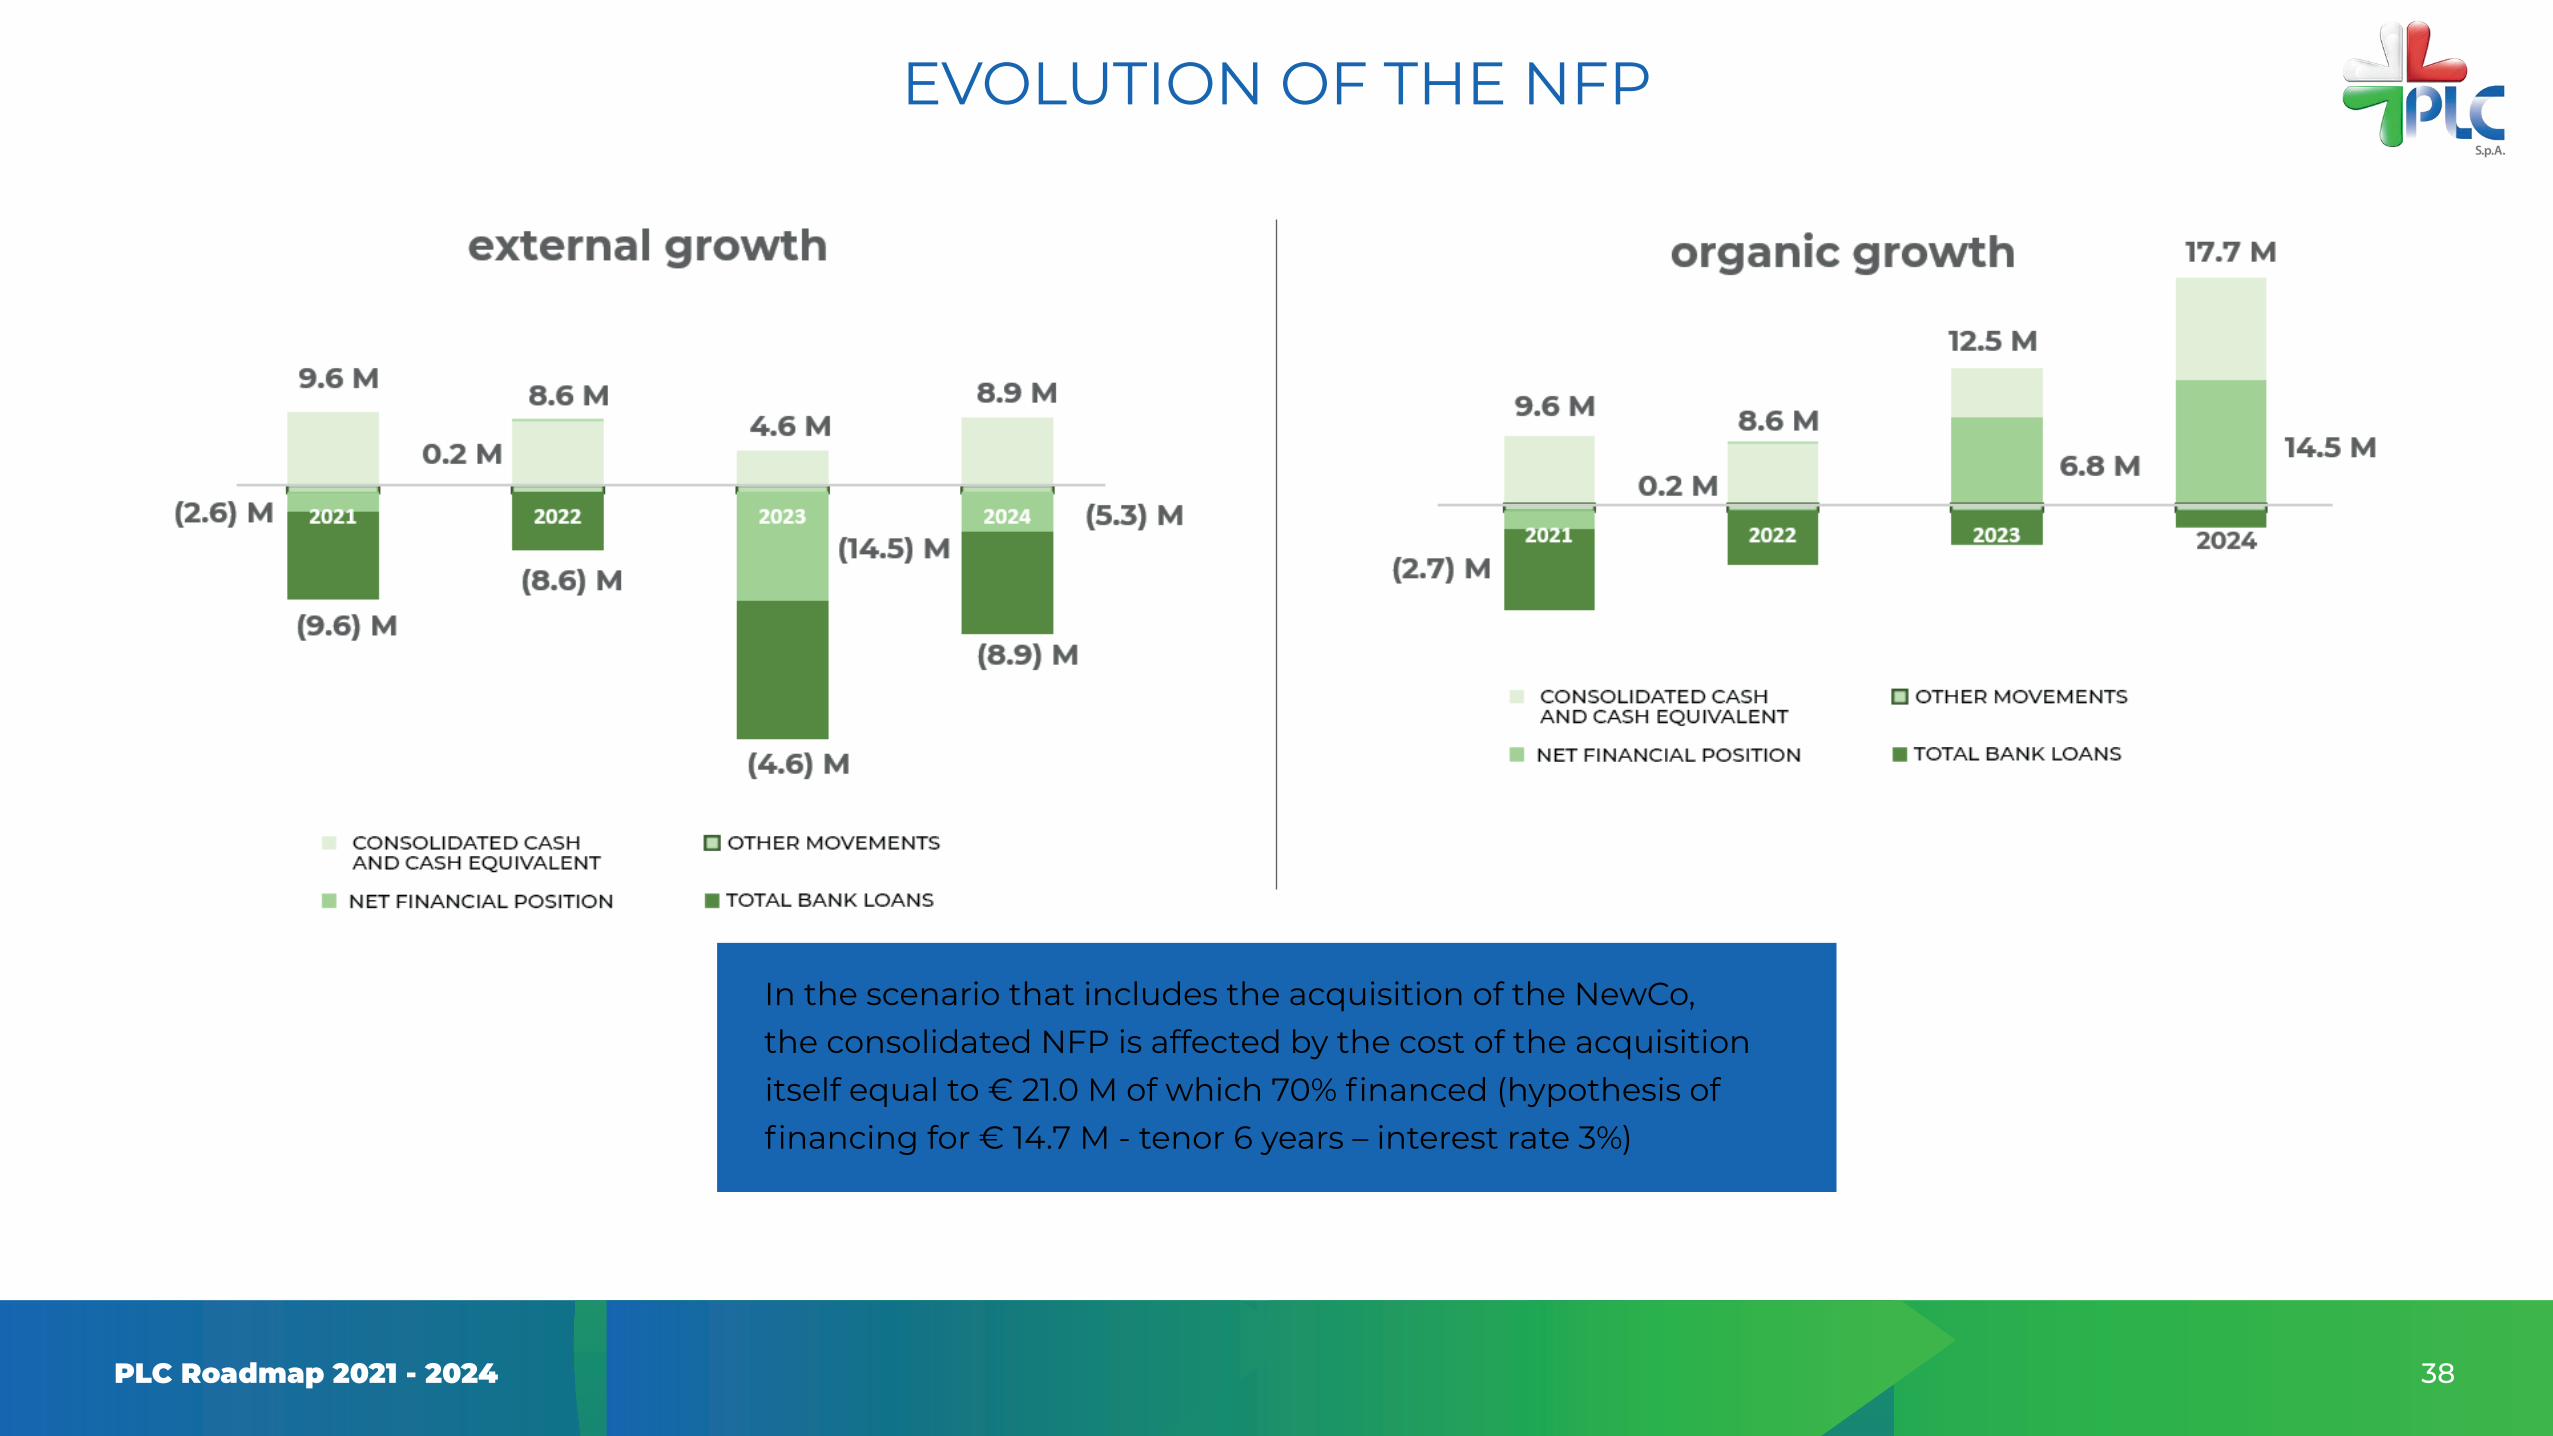
EVOLUTION OF THE NFP
In the scenario that includes the acquisition of the NewCo, the consolidated NFP is affected by the cost of the acquisition itself equal to € 21.0 M of which 70% financed (hypothesis of financing for € 14.7 M - tenor 6 years – interest rate 3%)

39PLC Roadmap 2021 - 2024
PLC SPA - THE HOLDING
Stable throughout the plan. 10 resources in 2021. It is not expected that the structure will need to be further strengthened over the course of the plan.No rationalization of the resources of Schmack is assumed in the plan.
Overhead cost
Dividend distribution of € 2.5M in 2022, € 2.5M in 2023 and € 3.5M in 2024.
Dividends Policy

40PLC Roadmap 2021 - 2024
PLC SPA - THE HOLDING
The major investments of the holding are planned for the transition to a new ERP system (Microsoft Dynamics) that will aim at increasing the level of supervision and control, and at accelerating the process of integration and coordination by the holding on all its subsidiaries:
Capex
ERP investments: € 0.6M of which € 0.4M in 2021 and € 0.2M in 2022
Recurringinvestments: € 0.075M / year

41PLC Roadmap 2021 - 2024
PLC SERVICE - SERVICE SEGMENT
Capex
P&L
Finance
2021: installation of a PV roof financed with 80% leverage.
Steady organic growth in revenues over the plan period.
2021: financing of the PV roof for € 0.32M (6 years tenor with one of pre-amortization).
Investments in spare parts for € 0.15M / year from 2022.
Increase in BOT services able to compensate for the expected reduction in PV services.
Recurring investments for € 0.19M / year
PON project: investments of € 0.84M in 2021 and € 0.41M in 2022.
EBITDA margin Improvement in due to the higher incidence of BOT services (with higher margins).

42PLC Roadmap 2021 - 2024
PLC SERVICE WIND - SERVICES SEGMENT
Capex
P&L
Finance
Investments in spare parts for € 0.05M / year in 2021 and 2022.
Steady organic growth over the course of the plan modeled on the basis of the act ‘20.
Reimbursement of intercompany loan to PLC Service in 2023.
Expected increase in specialty activities (with higher margins) compared to O&M activities in line with the reorganization of the business started in ‘20.From the ‘22 scheduled introduction of E&I services in line with the creation of a single Wind HUB at Group level.
EBITDA% ‘21 prudently lower than ‘20 with realignment starting from ‘22.

43PLC Roadmap 2021 - 2024
PLC SYSTEM - CONSTRUCTION SEGMENT
Construction
2021 - advancement of C&C Uno, C&C Castelvetere and C&C Tre in line with the budget.2022 - completion of C&C Uno, C&C Castelvetere and C&C Tre + start-up of Alisei Wind.2023 - completion of Alisei Wind + start-up 30MW purchased in 2022.2024 - completion of 30MW purchased in 2022 + start-up of 30MW purchased in 2023.
2022 - completion of 15 MW Tirreno.
Realization of n. 6 ss.ni in 2021, n. 7 subsequent years / year from 2022.
2024 - completion of 15 MW purchased in 2023.2023 - completion of 15 MW purchased in 2022.
EPC - BOT(PriceperMW€0.25M-GM29%)
EPC - FV(PriceperMW€0.65M-GM12%)
SUBSTATIONS(Averageprice€2.0M-GM16%)

44PLC Roadmap 2021 - 2024
PLC SYSTEM - CONSTRUCTION SEGMENT
CAPEX AND DIVESTMENTS
2021 - sale of C&C Tre Energy.
2022 - sale of Alisei + sale of Tirreno / purchase of new pipeline (30MW Wind + 15MW PV).
2023 - sale of 30MW Wind + 15MW PV + purchase of new pipeline (30MW Wind + 15MW PV)
2024 - sale of 30MW Wind + 15MW PV + purchase of new pipeline (30MW Wind + 15MW PV).
CapitalgainonsaleMWWIND€0.075M-MWPV€0.06M
Thevalueof€0.075M/MWforWINDwascalculatedonthebasisofongoingnegotiations(EDPR / FRV Italia and Falck Renewables)mitigatedbytheexpectedgreatercompetitivenessexpectedinupcomingauctionswith aconsequenteffectonthelevelofincentives.
The effects of the possible regulatory timeframe shift are included; it is believed that the implementation plan of the RES Decree can be extended until 2030.
45PLC Roadmap 2021 - 2024
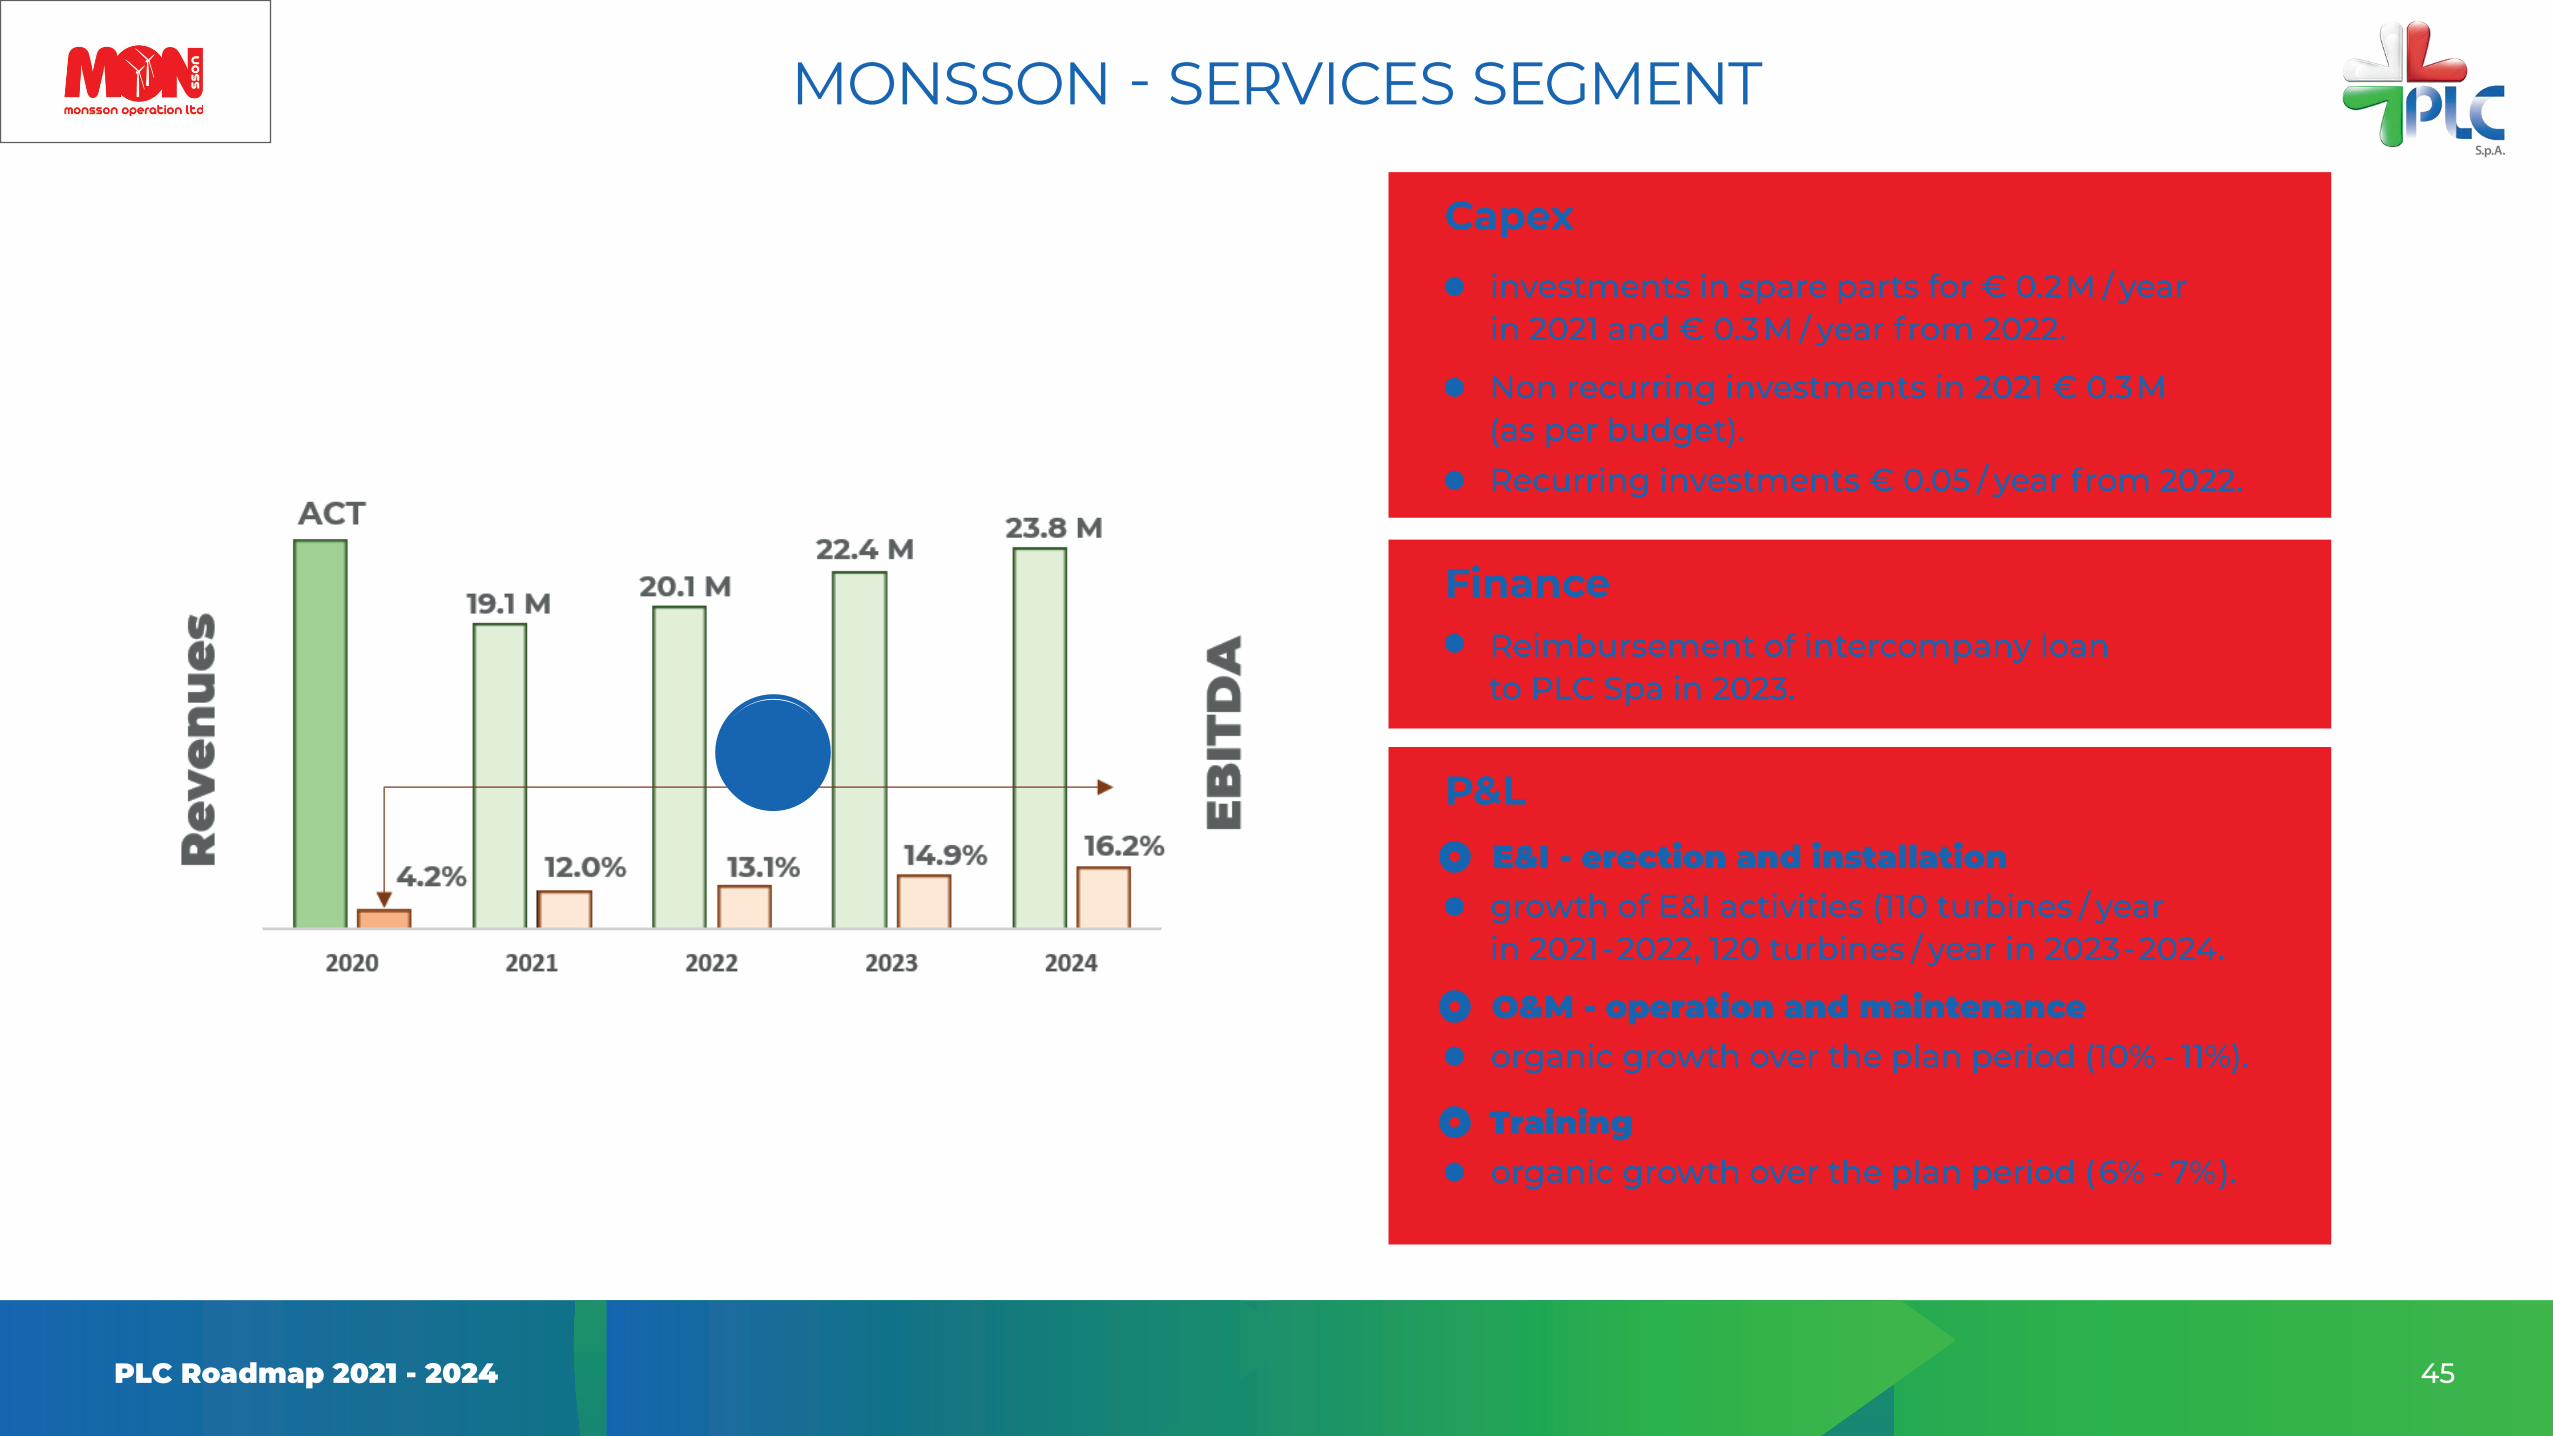
MONSSON - SERVICES SEGMENT
Capex
P&L
Finance
investments in spare parts for € 0.2M / year in 2021 and € 0.3M / year from 2022.
Reimbursement of intercompany loan to PLC Spa in 2023.
Non recurring investments in 2021 € 0.3M (as per budget).Recurring investments € 0.05 / year from 2022.
growth of E&I activities (110 turbines / year in 2021-2022, 120 turbines / year in 2023-2024.
organic growth over the plan period (10% - 11%).
organic growth over the plan period (6% - 7%).
E&I-erectionandinstallation
O&M-operationandmaintenance
Training

46PLC Roadmap 2021 - 2024
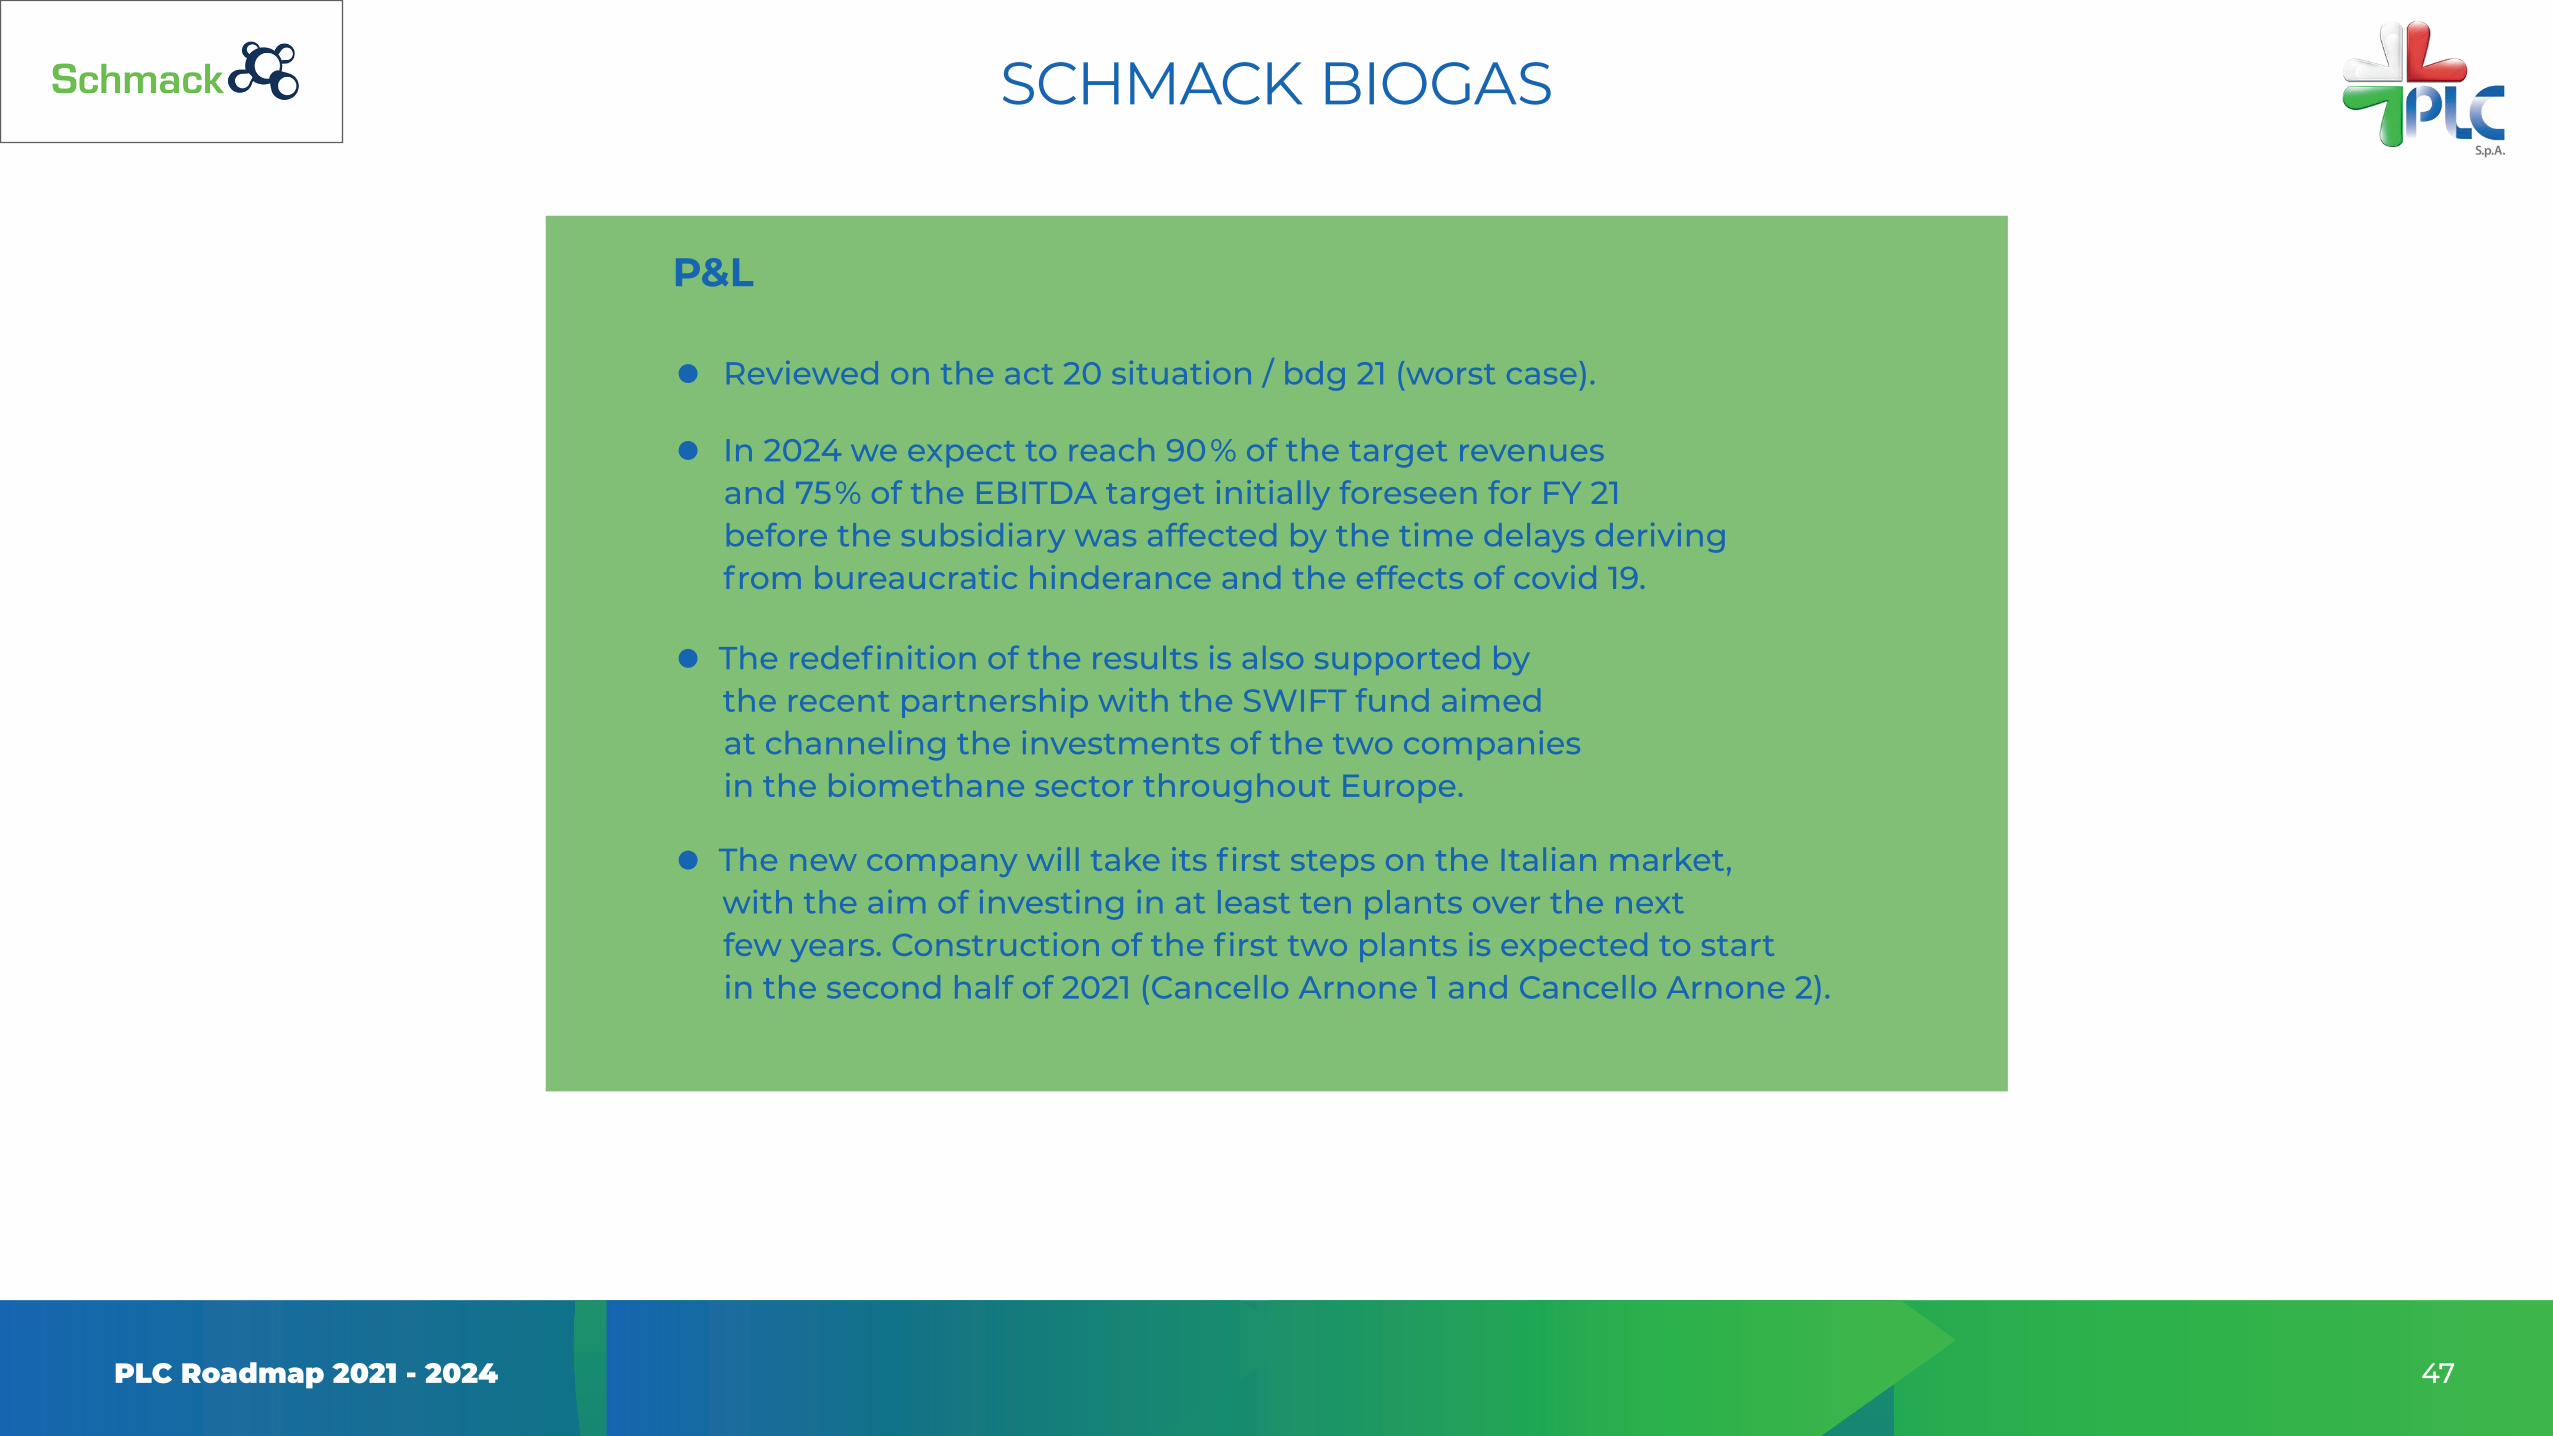
SCHMACK BIOGAS
Financerepayment of shareholder loans in 2023.
ConstructionFORSUBIGPROJECTS (Plant with revenues € 8.0 M - GM 19%)
AGRICULTURALPROJECTS (Plant with revenues € 6.5 M - GM 14%)
2021 - construction n. 1 plant at 90% (Marsala).
2021 - construction n. 2 C&A plants (30% + 10%) + n. 1 Larissa plant (80%).2022 - construction no. 1.5 plants.2023 - construction no. 1.75 plants.2024 - construction no. 2 plants.
2021 - construction no. 1.25 plants.
2021 - construction no. 1 100% plant.
2021 - construction n. 1.50 plants.
47PLC Roadmap 2021 - 2024
SCHMACK BIOGAS
P&L
Reviewed on the act 20 situation / bdg 21 (worst case).
In 2024 we expect to reach 90% of the target revenues and 75% of the EBITDA target initially foreseen for FY 21 before the subsidiary was affected by the time delays deriving from bureaucratic hinderance and the effects of covid 19.
The redefinition of the results is also supported by the recent partnership with the SWIFT fund aimed at channeling the investments of the two companies in the biomethane sector throughout Europe.
The new company will take its first steps on the Italian market, with the aim of investing in at least ten plants over the next few years. Construction of the first two plants is expected to start in the second half of 2021 (Cancello Arnone 1 and Cancello Arnone 2).

48PLC Roadmap 2021 - 2024
MSD SERVICE
Constant business performance, no development opportunities envisaged.
However, operations in the trading world made it possible to better understand the dynamics of the electricity market, generating cross sell business opportunities in the construction segment.
Assumptions

PLC Roadmap 2021 - 2024
BACK UP
50PLC Roadmap 2021 - 2024
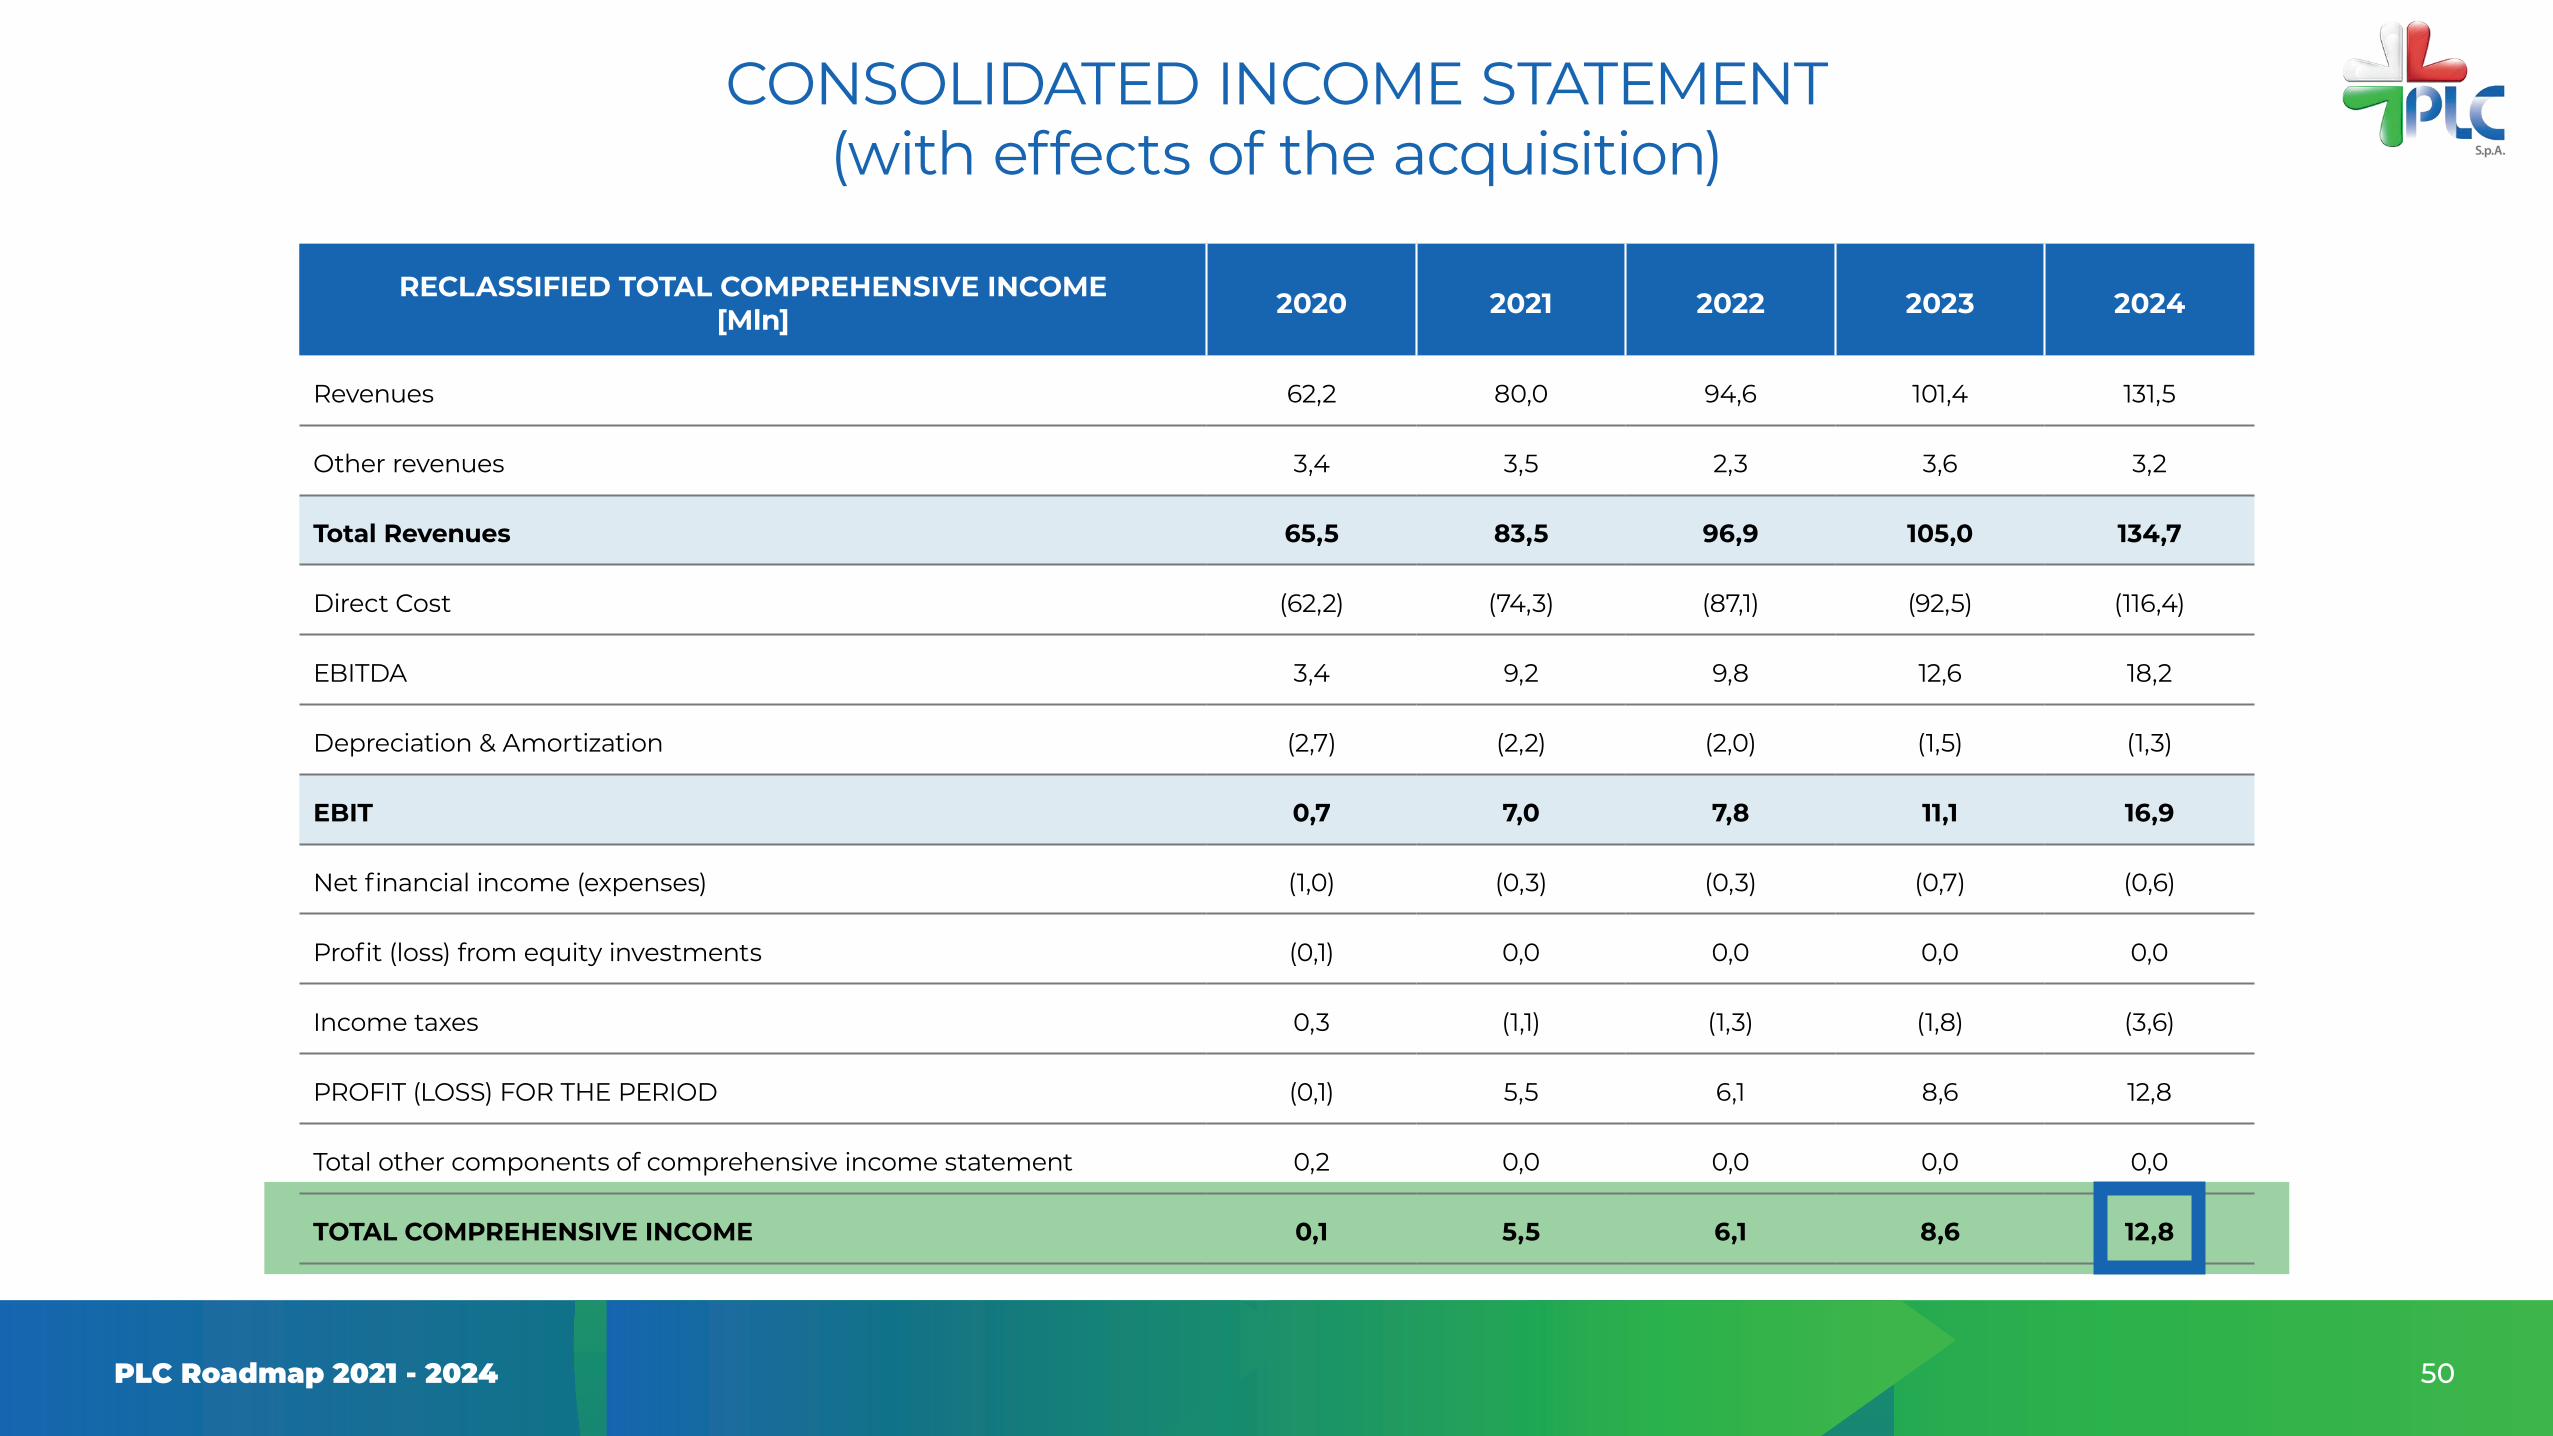
(with effects of the acquisition)CONSOLIDATED INCOME STATEMENT
RECLASSIFIED TOTAL COMPREHENSIVE INCOME [Mln] 2020 2021 2022 2023 2024
Revenues 62,2 80,0 94,6 101,4 131,5
Other revenues 3,4 3,5 2,3 3,6 3,2
Total Revenues 65,5 83,5 96,9 105,0 134,7
Direct Cost (62,2) (74,3) (87,1) (92,5) (116,4)
EBITDA 3,4 9,2 9,8 12,6 18,2
Depreciation & Amortization (2,7) (2,2) (2,0) (1,5) (1,3)
EBIT 0,7 7,0 7,8 11,1 16,9
Net financial income (expenses) (1,0) (0,3) (0,3) (0,7) (0,6)
Profit (loss) from equity investments (0,1) 0,0 0,0 0,0 0,0
Income taxes 0,3 (1,1) (1,3) (1,8) (3,6)
PROFIT (LOSS) FOR THE PERIOD (0,1) 5,5 6,1 8,6 12,8
Total other components of comprehensive income statement 0,2 0,0 0,0 0,0 0,0
TOTAL COMPREHENSIVE INCOME 0,1 5,5 6,1 8,6 12,8

51PLC Roadmap 2021 - 2024
(with effects of the acquisition)CONSOLIDATED BALANCE SHEET
RECLASSIFIED CONSOLIDATED STATEMENTOF FINANCIAL POSITION [Mln] 2020 2021 2022 2023 2024
Net tangible assets 8,9 8,7 8,3 8,3 8,2
Net intangible assets 13,4 13,4 11,8 10,7 9,9
Equity investments 0,0 0,0 1,6 1,6 1,6
Other non-current assets 2,8 1,3 1,3 1,3 1,3
Fixed assets 25,1 23,5 23,0 21,9 21,1
Net working capital 3,9 10,7 11,8 16,8 17,8
Non-current assets held for sale / disposal 0,0 0,0 0,0 0,0 0,0
NET INVESTED CAPITAL 29,0 34,1 34,8 38,7 38,8
Net financial position (4,1) (2,7) 0,2 (14,5) (5,3)
Net financial position relating to assets /liabilities held for sale / disposal 0,0 0,0 0,0 0,0 0,0
NET FINANCIAL POSITION (4,1) (2,7) 0,2 (14,5) (5,3)
SHAREHOLDERS' EQUITY 24,8 31,5 35,0 24,2 33,5
52PLC Roadmap 2021 - 2024
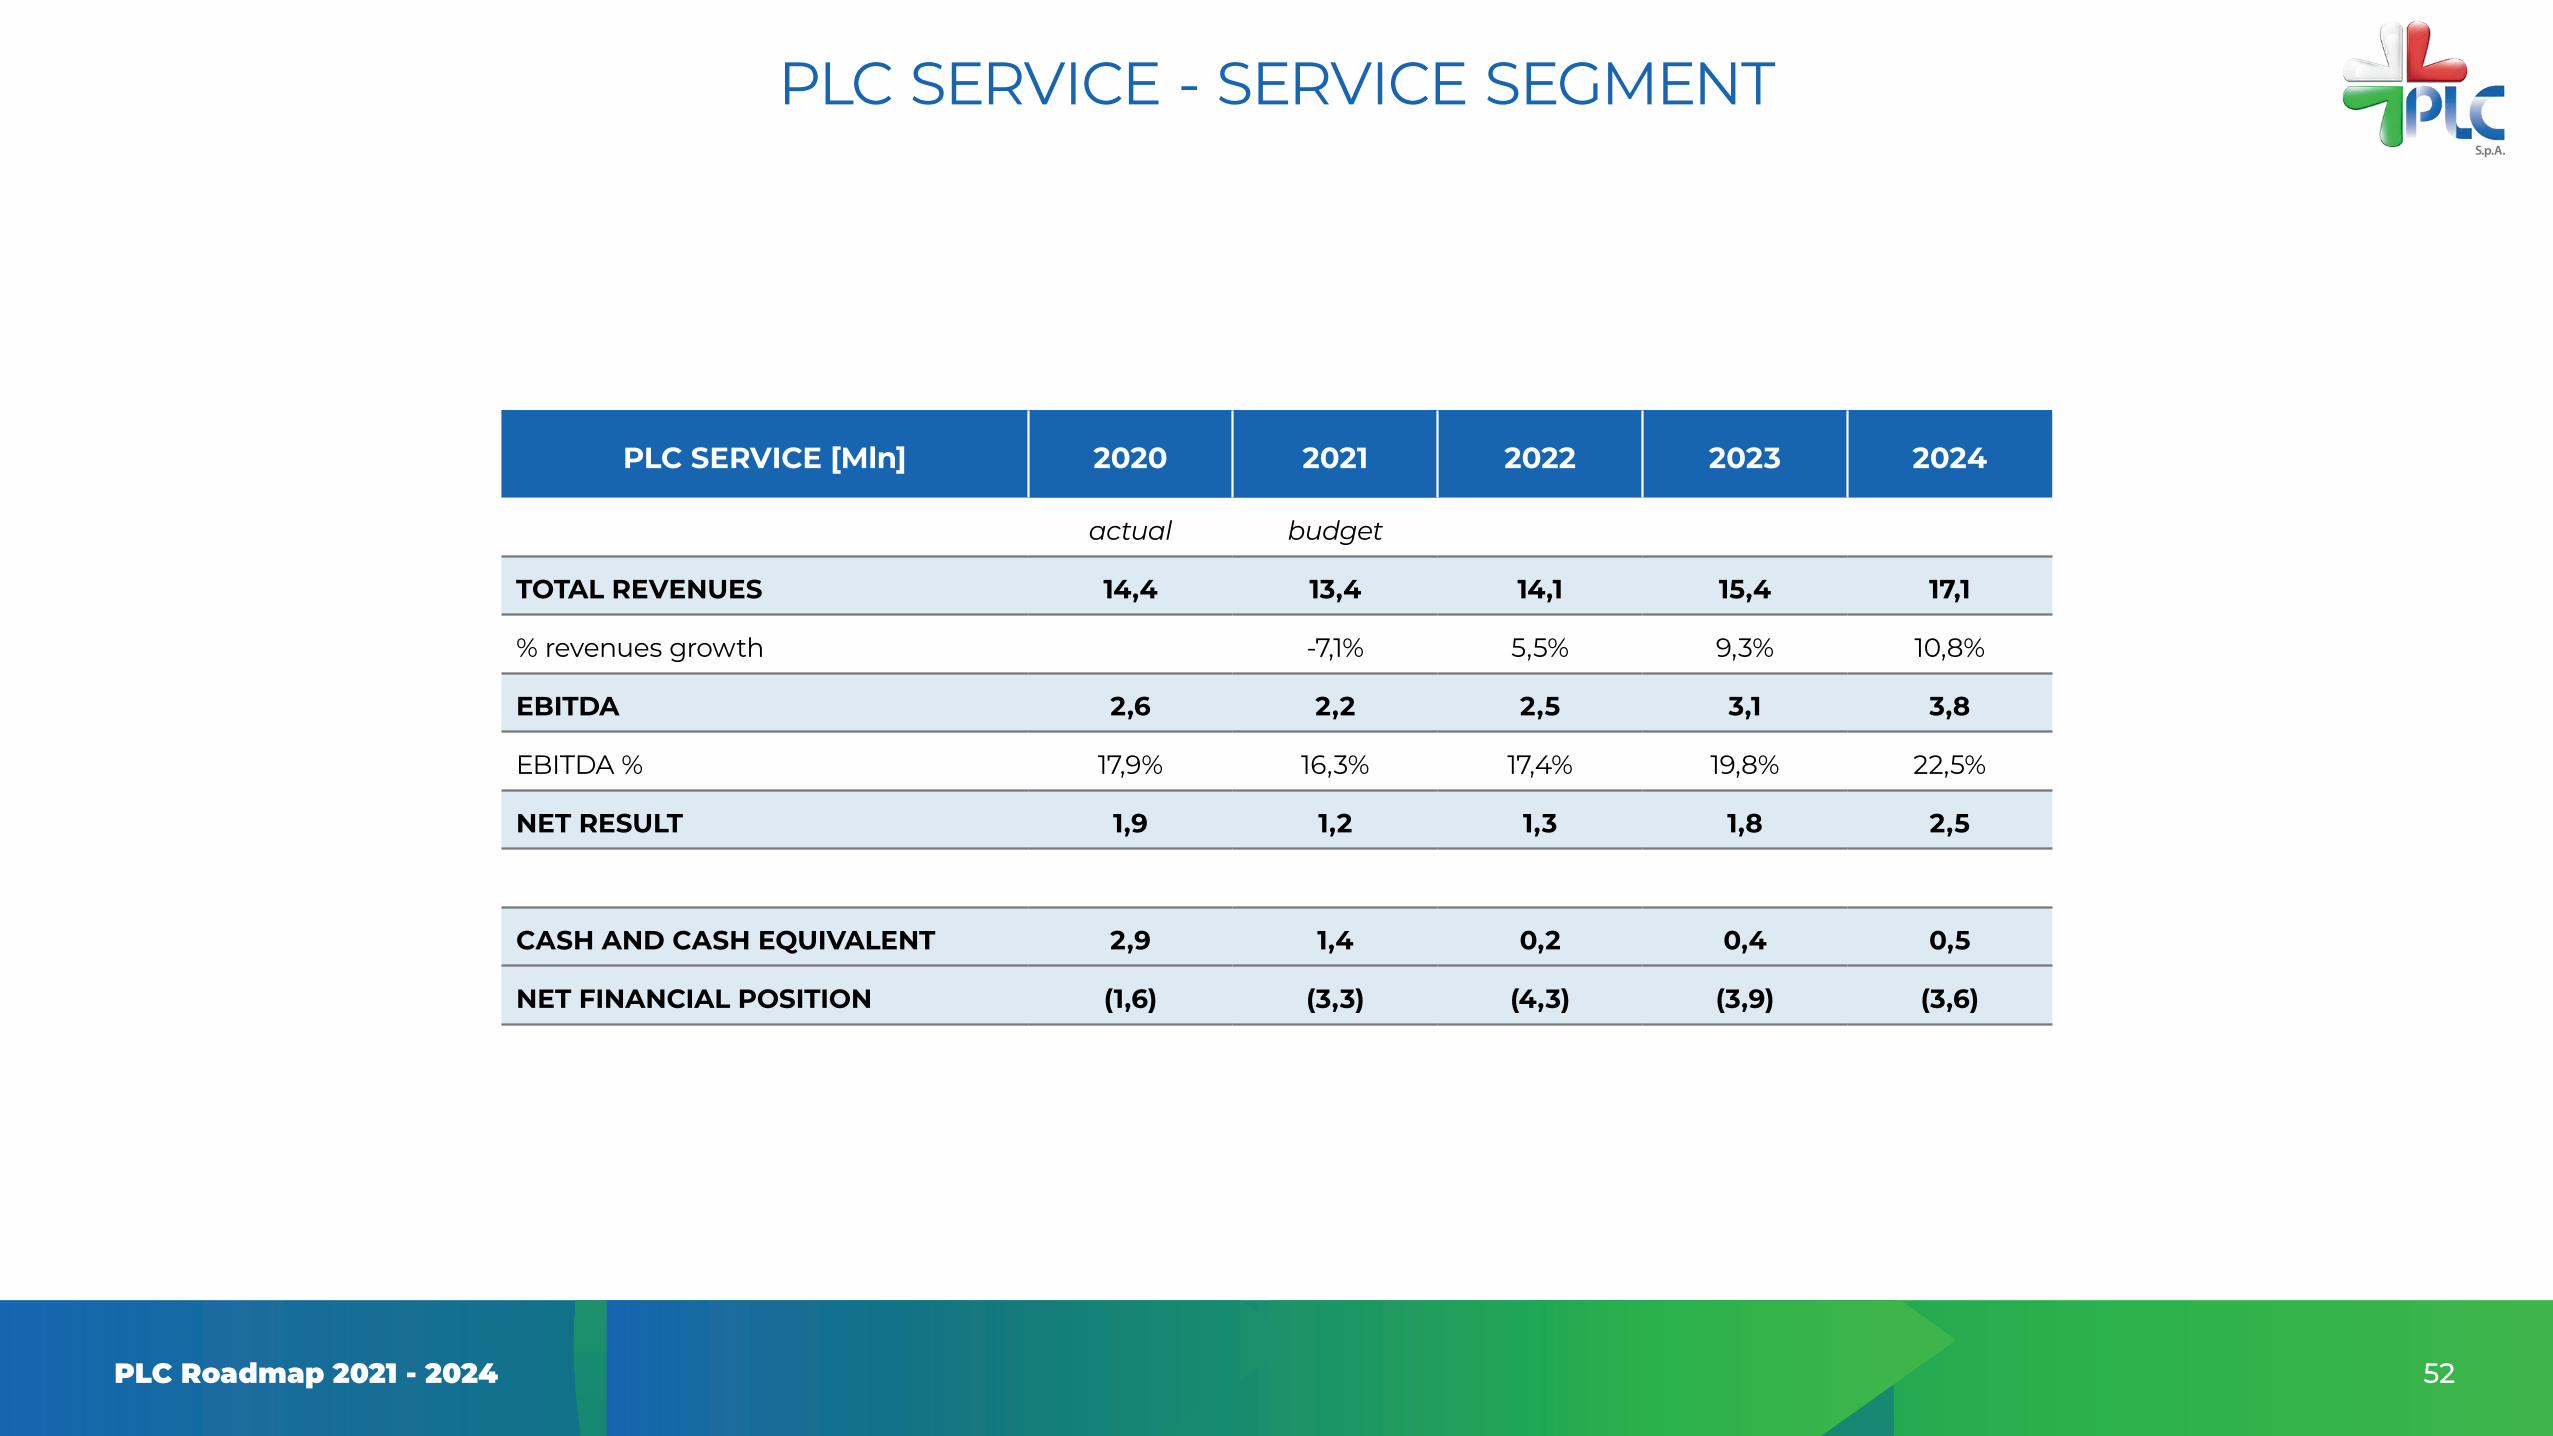
PLC SERVICE - SERVICE SEGMENT
PLC SERVICE [Mln] 2020 2021 2022 2023 2024
actual budget
TOTAL REVENUES 14,4 13,4 14,1 15,4 17,1
% revenues growth -7,1% 5,5% 9,3% 10,8%
EBITDA 2,6 2,2 2,5 3,1 3,8
EBITDA % 17,9% 16,3% 17,4% 19,8% 22,5%
NET RESULT 1,9 1,2 1,3 1,8 2,5
CASH AND CASH EQUIVALENT 2,9 1,4 0,2 0,4 0,5
NET FINANCIAL POSITION (1,6) (3,3) (4,3) (3,9) (3,6)
53PLC Roadmap 2021 - 2024
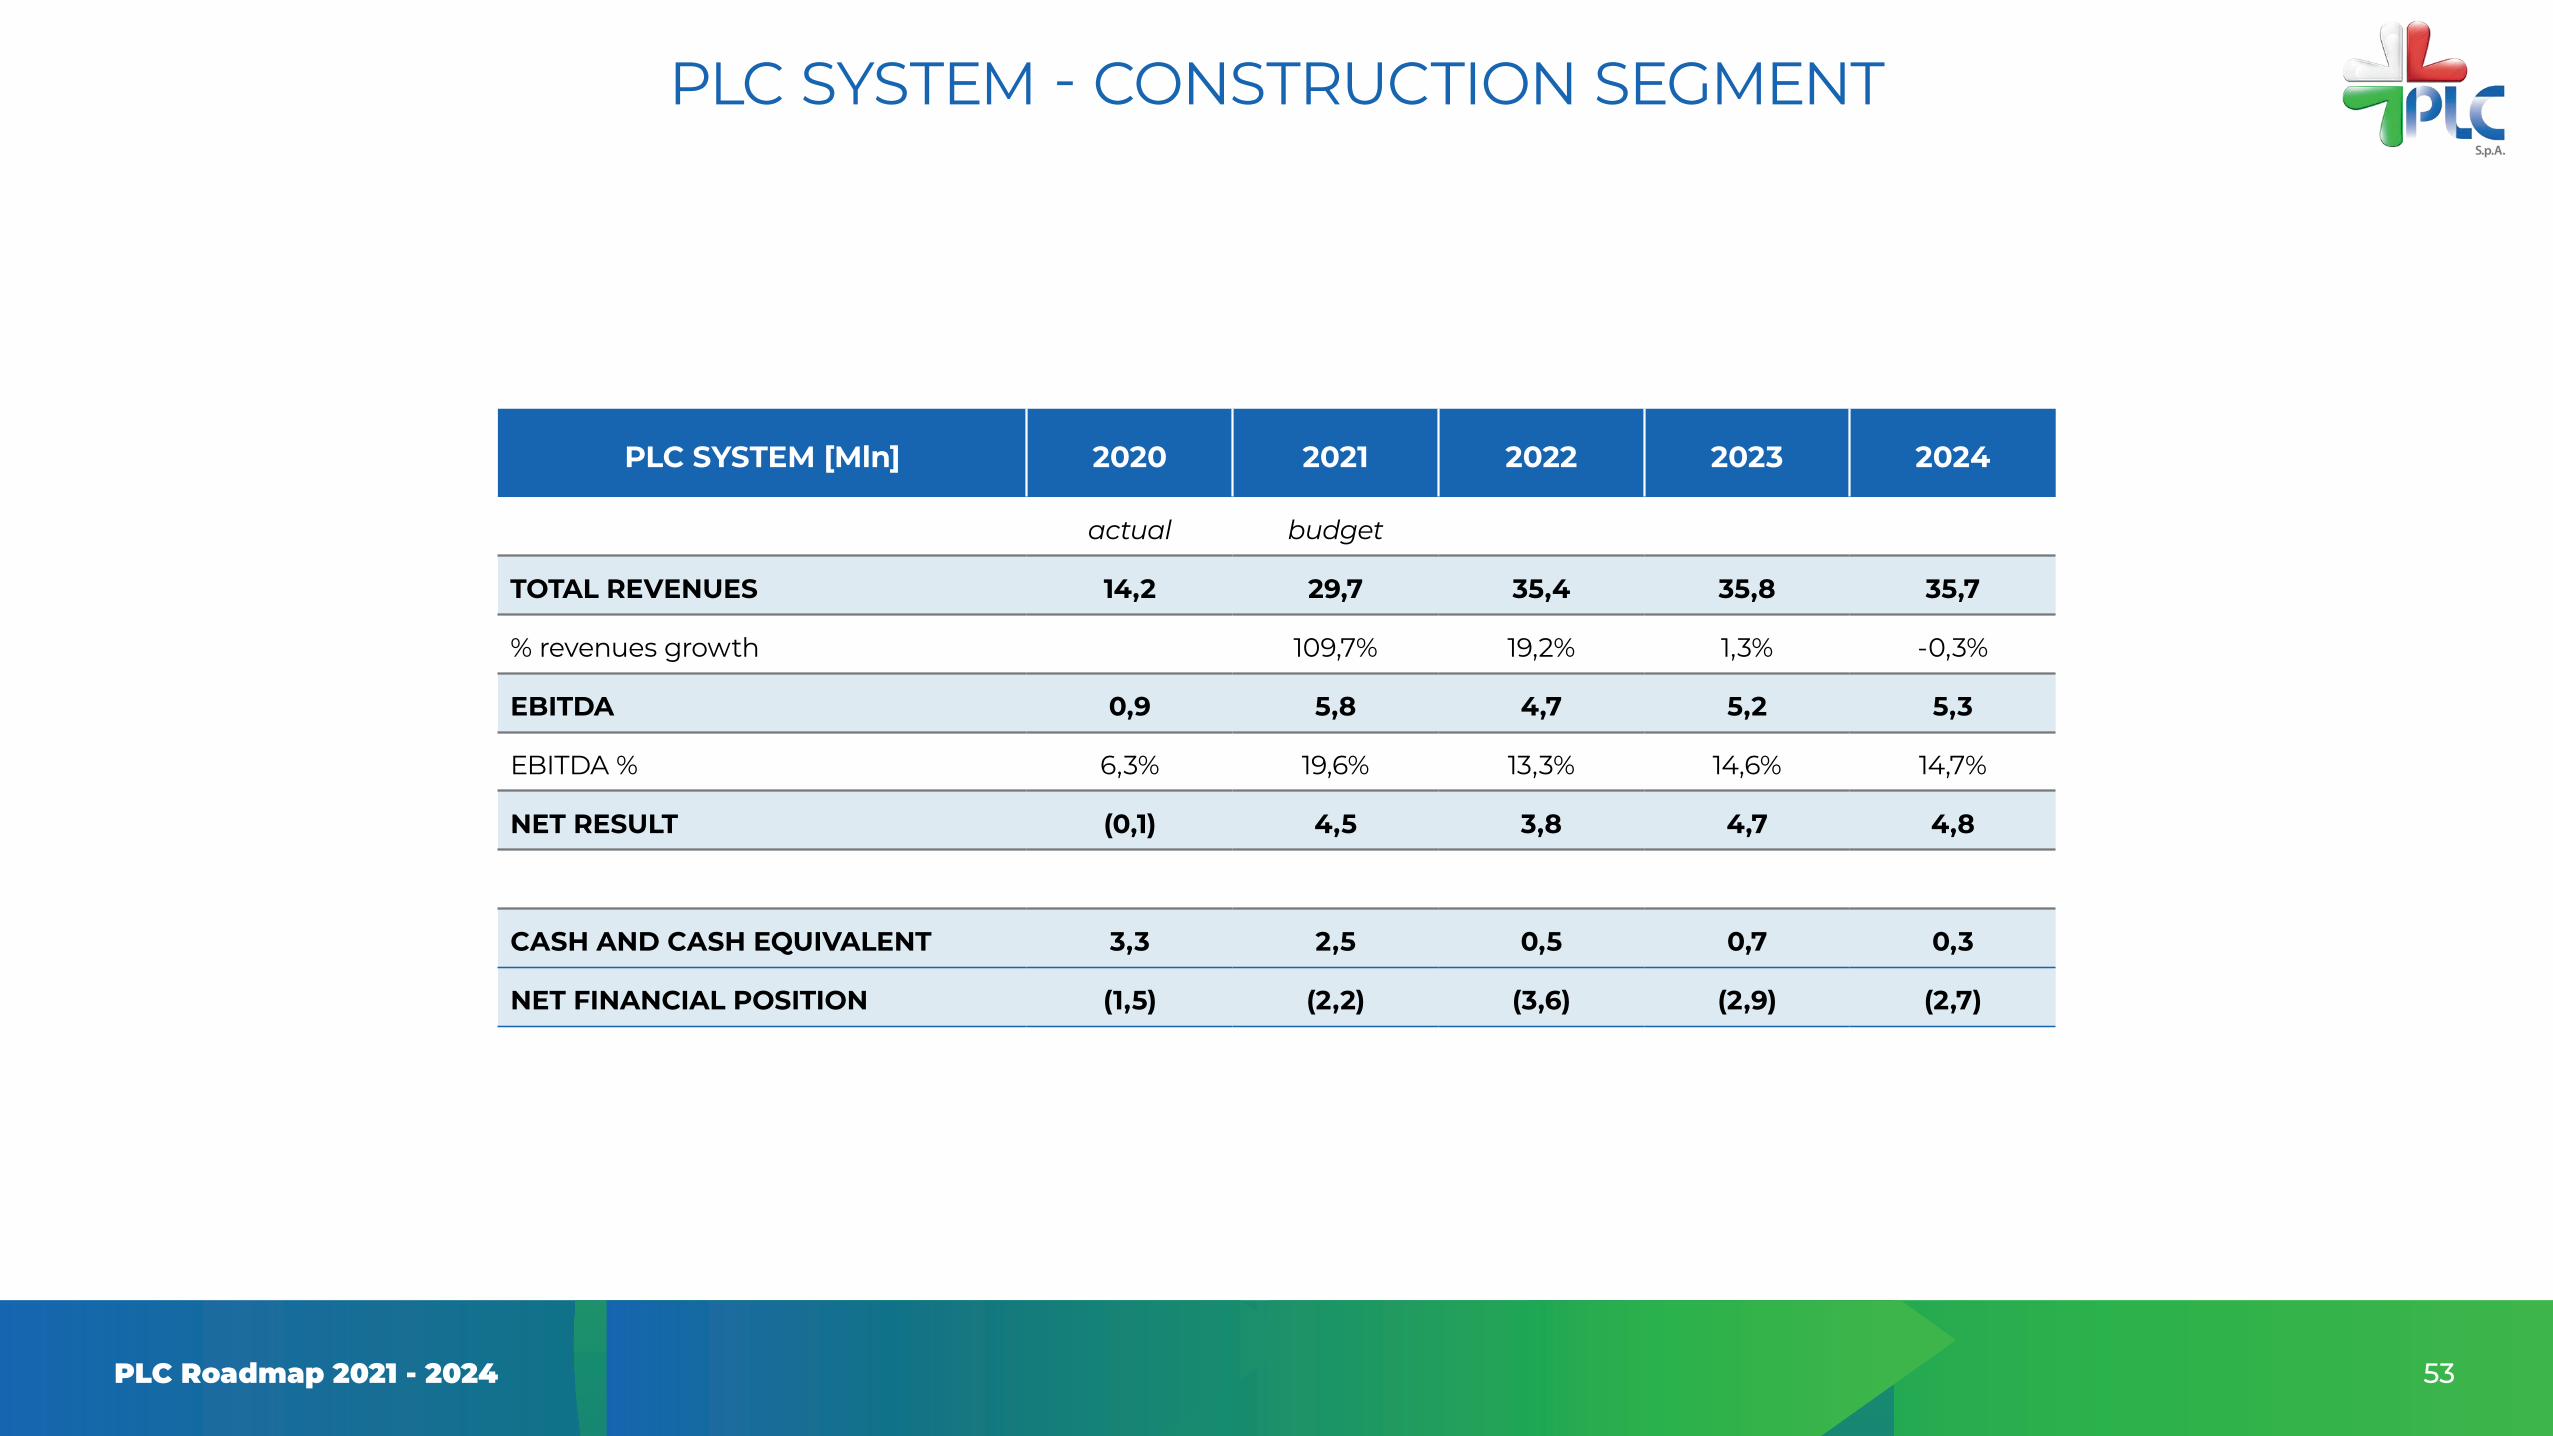
PLC SYSTEM - CONSTRUCTION SEGMENT
PLC SYSTEM [Mln] 2020 2021 2022 2023 2024
actual budget
TOTAL REVENUES 14,2 29,7 35,4 35,8 35,7
% revenues growth 109,7% 19,2% 1,3% -0,3%
EBITDA 0,9 5,8 4,7 5,2 5,3
EBITDA % 6,3% 19,6% 13,3% 14,6% 14,7%
NET RESULT (0,1) 4,5 3,8 4,7 4,8
CASH AND CASH EQUIVALENT 3,3 2,5 0,5 0,7 0,3
NET FINANCIAL POSITION (1,5) (2,2) (3,6) (2,9) (2,7)

54PLC Roadmap 2021 - 2024
PLC SERVICE WIND - SERVICES SEGMENT
PLC SERVICE WIND [Mln] 2020 2021 2022 2023 2024
actual budget
TOTAL REVENUES 2,9 2,8 3,1 3,5 3,9
% revenues growth -3,7% 12,3% 12,3% 13,3%
EBITDA 0,3 0,1 0,3 0,4 0,5
EBITDA % 10,3% 4,0% 8,5% 10,4% 12,2%
NET RESULT 0,2 0,0 0,2 0,2 0,3
CASH AND CASH EQUIVALENT 0,5 0,5 0,6 0,2 0,2
NET FINANCIAL POSITION (0,0) (0,1) (0,0) 0,2 0,1

55PLC Roadmap 2021 - 2024
MONSSON - SERVICES SEGMENT
MONSSON [Mln] 2020 2021 2022 2023 2024
actual budget
TOTAL REVENUES 24,3 19,1 20,1 22,4 23,8
% revenues growth -21,5% 5,5% 11,1% 6,4%
EBITDA 1,0 2,3 2,6 3,3 3,8
EBITDA % 4,2% 12,0% 13,1% 14,9% 16,2%
NET RESULT (0,1) 1,7 2,0 2,6 3,0
CASH AND CASH EQUIVALENT 1,1 1,2 1,5 0,3 0,8
NET FINANCIAL POSITION (3,6) (3,5) (3,2) (0,9) (0,4)

56PLC Roadmap 2021 - 2024
SCHMACK BIOGAS
SCHMACK [Mln] 2020 2021 2022 2023 2024
actual budget
TOTAL REVENUES 7,9 17,0 22,5 26,3 31,1
% revenues growth 115,1% 32,2% 16,8% 18,0%
EBITDA (0,3) 0,5 1,4 2,3 3,4
EBITDA % -3,5% 2,7% 6,2% 8,7% 10,8%
NET RESULT (0,4) 0,4 1,2 2,0 2,6
CASH AND CASH EQUIVALENT 1,2 1,2 1,5 1,5 1,8
NET FINANCIAL POSITION 0,9 0,0 0,2 1,5 1,8

57PLC Roadmap 2021 - 2024
MSD SERVICE
MSD SERVICE [Mln] 2020 2021 2022 2023 2024
actual budget
TOTAL REVENUES 4,8 1,6 1,6 1,6 1,6
% revenues growth -66,8% 1,2% 1,2% 1,2%
EBITDA (0,0) 0,0 0,0 0,0 0,0
EBITDA % -0,5% 1,9% 1,9% 1,9% 1,9%
NET RESULT (0,1) 0,0 0,0 0,0 0,0
CASH AND CASH EQUIVALENT 0,0 0,2 0,1 0,1 0,1
NET FINANCIAL POSITION 0,0 (0,0) (0,1) (0,1) (0,1)

PLC Roadmap 2021 - 2024
Thank you