The Energy Water Nexus - NASEOenergyoutlook.naseo.org/Data/Sites/3/presentations/Webber.pdf · the...
39
The Energy Water Nexus 2014 NASEO Energy Policy Outlook Conference Fairmont, Washington, DC Michael E. Webber, Ph.D. February 5, 2014
Transcript of The Energy Water Nexus - NASEOenergyoutlook.naseo.org/Data/Sites/3/presentations/Webber.pdf · the...

The Energy Water Nexus
2014 NASEO Energy Policy Outlook Conference
Fairmont, Washington, DC
Michael E. Webber, Ph.D.
February 5, 2014

Michael E. Webber | Energy Water Nexus February 5, 2014 2
There Are Good and Bad Tradeoffs At
the Energy Water Nexus (Quantity)
• With sufficiently abundant, clean and affordable energy, our water problems are solved
– Long-haul transfer, desalination, deep wells,…
• With sufficiently abundant, clean, and affordable water, our energy problems are solved
– Biofuels, hydro,…
• Coupled infrastructures causes cascading vulnerabilities
– Water constraints become energy constraints
– Energy constraints become water constraints

Michael E. Webber | Energy Water Nexus February 5, 2014 3
There Are Good and Bad Tradeoffs At
the Energy Water Nexus (Quality)
• Energy affects water quality (good and bad)
– Energy is used to treat (clean, move, heat,…)
– Energy pollutes water (thermal, chemical,…)
• Water affects energy quality (good and bad)
– Improved efficiency at power plants
(thermoelectric, solar PV, …)
– Improved recovery for oil and gas production
– Degraded performance in heat waves

Michael E. Webber | Energy Water Nexus February 5, 2014 4
We Use Water for Energy
• We use water for the power sector – Driving hydroelectric turbines
– Driving steam turbines
– Cooling power plants
• We use water for fuels production – Growing biofuels
– Extracting oil and gas
– Mining coal and uranium
– Refining/upgrading fuels
• We use water for transporting fuels

Michael E. Webber | Energy Water Nexus February 5, 2014 5
There Is Tension Between CO2 and
H2O In The Power Sector

Michael E. Webber | Energy Water Nexus February 5, 2014 6
Water Intensity of Transportation
0.01 0.1 1 10 100 1000 10000
Algal Fuels (Experimental)Algal Fuels (Highly Productive)
Biodiesel (Non-Irrigated Soy)Biodiesel (Irrigated Soy)
E85 (Non-Irrigated Grain & Stover)E85 (Irrigated Grain & Stover)
E85 (Non-Irrigated Stover)E85 (Irrigated Stover)
E85 (Non-Irrigated Grain)E85 (Irrigated Grain)
Hydrogen (SMR)Hydrogen (Electrolysis)
Electricity
Coal-to-LiquidsGas-To-Liquids
Gasoline (Tar Sands)Gasoline (Shale Oil)
CNG (Gas Compression)CNG (Electric Compression)
Diesel (Conventional)Gasoline (Conventional)
Gallons of Water Consumed Per Mile Traveled, Log Scale (Typical)
Water Intensity of Transportation Source: Recreated from King & Webber (2008) and Twomey, Beal, King & Webber (2012)
Graphic: Michael E. Webber, The University of Texas at Austin
© Michael E. Webber

Michael E. Webber | Energy Water Nexus February 5, 2014 7
We Use Energy for Water
• Conveyance
• Pumping
• Treating
• Heating
• Chilling
• Pressurizing

Michael E. Webber | Energy Water Nexus February 5, 2014 8
Water and Steam Are Responsible for >12%
of National Energy Use
Courtesy: Sanders (2013)
Water Heating represented nearly
one-third of all direct water and
steam services

Michael E. Webber | Energy Water Nexus February 5, 2014 9
US Water Heating Unit
Inventory in 2009:
• Electric : 41%
• Natural gas : 52%
• Fuel oil: 4%
• LPG : 7%
• Solar: Trivial
[Data: EIA RECS 2009]
Fractional Distribution of Units
Water heating technologies vary
geographically: electric and gas dominate
Courtesy: Sanders (2013)

Michael E. Webber | Energy Water Nexus February 5, 2014 10
The Energy-Water Relationship Is
Already Under Strain
• Water Constraints Become Energy
Constraints
• Energy Constraints Become Water
Constraints

Michael E. Webber | Energy Water Nexus February 5, 2014 11
Water Constraints Become Energy
Constraints Heat Waves
Freezes
Droughts Floods

Michael E. Webber | Energy Water Nexus February 5, 2014 12
Heat Waves Can Strain The Power
Sector
Source: NASA (2003)
Snapshot of the record
heat wave in 2003
Nuclear power plants
dialed back because of
high water temperatures
(less cooling capability)
and rejection water
temperature limits

Michael E. Webber | Energy Water Nexus February 5, 2014 13
Water Constraints Become Energy
Constraints
• Freeze in Texas in February 2011 shut down
two coal plants causing statewide rolling
blackouts
• Cascading Failures
– Freeze causes coal plants to stop
– Gas power plants cannot come on
• Power outage takes some gas compressors off line
• Cold temperatures means demand for gas is high

Michael E. Webber | Energy Water Nexus February 5, 2014 14
Frozen Water Threatens the Niagara
Falls Hydro Plant (Jan 2014)

Michael E. Webber | Energy Water Nexus February 5, 2014 15
Water Constraints Become Energy
Constraints
• Droughts: – Nuclear power plants within days of shutting in
SE 2008
– TX power plants at risk of shutting down
– Western Hydropower down in drought years
• Floods: – Nebraska nuclear power plant nearly shut down
because of flooding of the Missouri River in June 2011
– Caused silting behind dams in India in 2012

Michael E. Webber | Energy Water Nexus February 5, 2014 16
The 2012 Indian Blackout Affected 600 Million
People and was Triggered Partly by Drought
1) Increased power
demand from
irrigation
2) Decreased power
generation
at dams

Michael E. Webber | Energy Water Nexus February 5, 2014 17
Drought Hurts the Ability to Ship
Energy By Inland Waterways
$7 billion of coal,
petroleum products,
fertilizer, and agriculture
products could not ship in
Jan and Feb 2013
because of low water

Michael E. Webber | Energy Water Nexus February 5, 2014 18
Water Use, Challenges, and
Opportunities In Shale
Production

Michael E. Webber | Energy Water Nexus February 5, 2014 19
Nationally, Oil & Gas Is Responsible
for <5% of Water Withdrawals
• Overall, small part of water withdrawals
– Oil and gas extraction: <1%
– Industrial uses: <4%
• Partly for refining and chemicals [Source: USGS]
• However, at local scale, water use for oil/gas can be large fraction of use
• Shale revolution puts pressure on watersheds for new production AND refining/chemicals

Michael E. Webber | Energy Water Nexus February 5, 2014 20
Drilling and Completion Requires
Significant Volumes of Water
• It requires 2 to 9 million gallons of
frac fluids per well
– Proppants (sand): 0.5 M lbs
– Injected at thousands of gpm
– Chemical additives: 2%
• Fractions grow as water use decreases
• Liquids-rich shales use more acids/gels
• Concerns about induced seismicity
and seepage
Source: Matt Mantell, Chesapeake Energy, Feb 2013, and
DoE: “Modern Shale Gas Development in U.S.,” 2009

Michael E. Webber | Energy Water Nexus February 5, 2014 21
The U.S. shale basins are extensive and
often overlap with areas of drought
Source: Drought
Monitor August
6, 2013

Michael E. Webber | Energy Water Nexus February 5, 2014 22
Water Constraints Are Inhibiting
Shale Production
• Texas
– Grand Prairie: banned the use of municipal water for shale liquid and gas fracking
– Ogallala Aquifer: restrictions on water use for fracking in the groundwater district
• Source: Businessweek, October 2011
• New Mexico: Mora County banned fracking
Michael E. Webber | Energy Water Nexus February 5, 2014 23
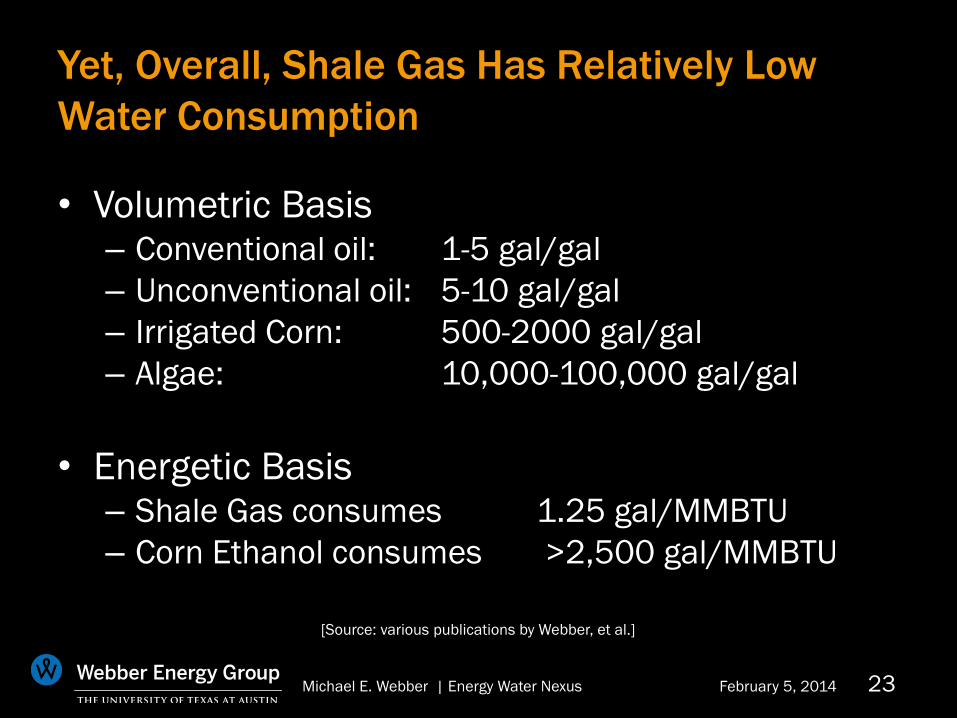
Yet, Overall, Shale Gas Has Relatively Low
Water Consumption
• Volumetric Basis – Conventional oil: 1-5 gal/gal
– Unconventional oil: 5-10 gal/gal
– Irrigated Corn: 500-2000 gal/gal
– Algae: 10,000-100,000 gal/gal
• Energetic Basis – Shale Gas consumes 1.25 gal/MMBTU
– Corn Ethanol consumes >2,500 gal/MMBTU
[Source: various publications by Webber, et al.]
Michael E. Webber | Energy Water Nexus February 5, 2014 24
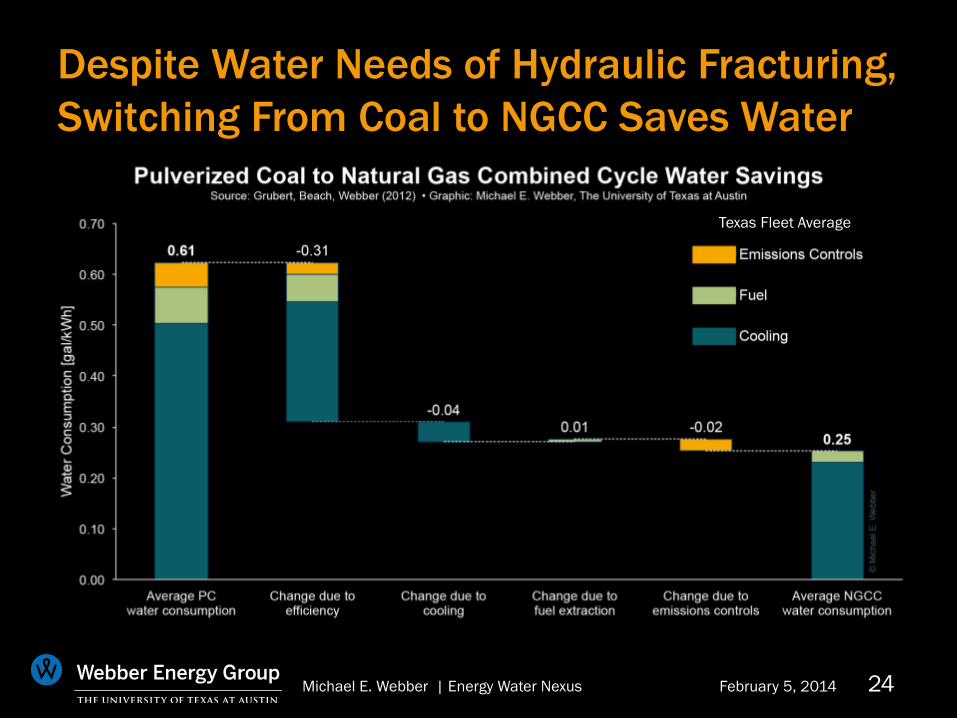
Despite Water Needs of Hydraulic Fracturing,
Switching From Coal to NGCC Saves Water
Texas Fleet Average

Michael E. Webber | Energy Water Nexus February 5, 2014 25
Hydraulic Fracturing in Shale Formations
Produces Significant Volumes of Wastewater
•Volumes: 15% (Marcellus), 30% (EF), 300% (Barnett)
•Wastewater has three components:
– Drilling muds
– Flowback water
– Produced water
• Often stored on-site in ponds/pits
• Wastewater can leak down from the pit to the groundwater
– Pits should be lined to prevent leaks
– Leaks have happened
[Source: Matt Mantell, Chesapeake Energy]

Michael E. Webber | Energy Water Nexus February 5, 2014 26
Injection is One Method of
Wastewater Disposal
• Some states allow wastewater injection to specified locations
– TX does, OH does, PA does not
• Injecting at a fault can induce seismicity
• Reinjection is easier (and probably cleaner) than treatment
• Re-use is even cleaner (but not necessarily easier)
– Some leases prohibit reuse

Michael E. Webber | Energy Water Nexus February 5, 2014 27
The Oil & Gas Industry Could Become the Oil,
Gas, and Water Industry
• Chesapeake, Chevron, ExxonMobil, etc., are actually water producers who happen to have very high value byproducts
• Daily liquids production in the USA:
– Oil extraction: 7 MMBD
– Wastewater injection: 47 MMBD • 2 billion gallons per day (~2% of daily
consumption)
• On-site treatment would yield a lot of water

Michael E. Webber | Energy Water Nexus February 5, 2014 28
Solutions

Michael E. Webber | Energy Water Nexus February 5, 2014 29
Flared Gases Could Be Captured For
On-Site Treatment of Wastewater
• Use flared gases for on-site thermal
distillation
• Reduces trucks
• Increases water supply
• Reduces flares
– Up to 1/3 of gas production is flared in
N. Dakota

Michael E. Webber | Energy Water Nexus February 5, 2014 30
Flowback TDS increases while flowrate
decreases with time
Plot courtesy of
Dr. Kelvin
Gregory,
Carnegie Mellon
University
Well location:
Washington
County, PA
(Marcellus Shale)

Michael E. Webber | Energy Water Nexus February 5, 2014 31
There Are Some Catchy Slogans for
Water Solutions
• Efficiency:
– “more crop per drop”
• Increasing agricultural yields per unit of water
• Water Re-use:
– “showers to flowers”
• Reusing wastewater for irrigation
– “toilet to tap”
• Turning wastewater into drinking water
• International Space Station
• Singapore’s NewWater

Michael E. Webber | Energy Water Nexus February 5, 2014 32
Integrating Power Plants with Water
Treatment & Desalination
• Waste heat from power plants
– Increases throughput for membrane systems
– Reduces energy for distillation systems
• Example: Abu Dhabi’s desalination plant
• Intermittent renewables: wind and solar PV

Michael E. Webber | Energy Water Nexus February 5, 2014 33
Integrating Wind Power With Brackish
Desalination Solves Several Problems
Simultaneously
• Transform low-value products (brackish groundwater and intermittent electricity) into a high-value product (treated drinking water)
• Abundant saline/brackish water in W. Texas
• Abundant wind and solar radiation in W. Texas – 1000+ hours of negative pricing in Texas b/c of extra wind
– Solution: Match intermittent wind w/intermittent desalination
• Provide solutions to challenges of each technology – Desal addresses intermittent, off-peak nature of wind
– Wind addresses high marginal energy of desalination

Michael E. Webber | Energy Water Nexus February 5, 2014 34
0
0.02
0.04
0.06
0.08
0.1
0.12
0.14
0.16
0 0.4 0.8 1.2 1.6 2 2.4 2.8
Pri
ce o
f El
ect
rici
ty [
$/k
Wh
]
Price of Water [$/m3]
Integrated wind power with desalination presents
greater profitability potential for a high water price
and low electricity price
Integrated Wind With
Desalination Favorable
Wind
Favorable
Scenario A
Scenario B
$1,500,000/yr
$1,000,000/yr
$500,000/yr
‐$100,000/yr 0
0.02
0.04
0.06
0.08
0.1
0.12
0.14
0.16
4 4.4 4.8 5.2 5.6 6
Pri
ce o
f El
ect
rici
ty [
$/k
Wh
]
Price of Water [$/m3]

Michael E. Webber | Energy Water Nexus February 5, 2014 35
Integrating Solar PV with Desal
Increases Energy and Water
• Saline/brackish water for cooling solar PV
systems
• Improves Solar PV performance
• Preheats water for higher throughput during
treatment
– Example: El Paso, TX test systems

Michael E. Webber | Energy Water Nexus February 5, 2014 36
Using The Water Sector For Grid
Management
• Demand reduction
– Pumping/treating at night or off-peak
– Installing variable-speed-drives (VSD) on
pumping systems
• Reactive power management
– Rise of solar power worsens power quality
– Water/wastewater pumps are distributed and
can be used to improve power quality

Michael E. Webber | Energy Water Nexus February 5, 2014 37
Clean Energy Commercialization at UT
Austin • Clean Energy Incubator (CEI): Part of Austin Technology Incubator, UT Austin
– Energy startups raised $192M in investor capital since 2007
• Types of Companies:
– Omni Water Solutions: on-site treatment of produced water from shale
– Yan Engines: more efficient diesel engines
– nCarbon: graphene technology for ultracapacitors for energy storage
• IP: current CEI companies have filed 13 patents
• Successful exits: Ideal Power Converters: $17M IPO in November 2013
• Training Entrepreneurs:
– Large-scale internship program (1-2 dozen students annually)
– Working with professors on campus to teach classes
• Sponsor: Texas SECO (Dub Taylor), Austin Energy, Industrial partners
• Next: Water Technology Incubator

www.webberenergygroup.com
Michael E. Webber, Ph.D. Deputy Director, Energy Institute
Co-Director, Clean Energy Incubator
Associate Professor, Mechanical Engineering
Josey Centennial Fellow in Energy Resources
The University of Texas at Austin

Michael E. Webber | Energy Water Nexus February 5, 2014 39
Flared gas energy could be
harnessed to treat a significant
amount of produced water
• In 2012, Texas flared 48 BCF of natural gas
– Enough to treat ~1.6 billion barrels of produced
water
• Our ongoing research focuses on
establishing an analytical framework for
assessing the feasibility of on-site treatment
of produced water using distributed natural
gas and includes a cost-benefit analysis