the energy transition Current and Future Challenges to ...
387
ASSOCIAZIONE ITALIANA ECONOMISTI DELL'ENERGIA the Italian Affiliate of the 3 rd AIEE Energy Symposium Conference Proceedings Current and Future Challenges to Energy Security www.aieeconference2018milan.eu Milan, 10-12 December, 2018 - Bocconi University the energy transition in cooperation with
Transcript of the energy transition Current and Future Challenges to ...

ASSOCIAZIONE ITALIANA ECONOMISTI DELL'ENERGIA
the Italian Affiliate of the
3rd AIEE Energy Symposium Conference Proceedings
Current and Future Challenges to Energy Security
www.aieeconference2018milan.eu
Milan, 10-12 December, 2018 - Bocconi University
the energy transition
in cooperation with


the Italian Affiliate of the
Published by: AIEE - The Italian Association of Energy Economists, Rome, Italy
3rd AIEE Energy Symposium
Current and Future Challenges to Energy Security 10-12 December 2018, Bocconi University, Italy

3rd AIEE Energy Symposium - Current and Future Challenges to Energy Security - Executive Summaries. 10-12 December, in Rome, Italy. Published 2018 by: The Italian Association of Energy Economists (AIEE), Rome , Italy ISBN: 978-88-942781-1-8 The 3nd AIEE Energy Symposium - Current and Future Challenges to Energy Security was organized by AIEE (Associazione Italiana Economisti dell’Energia) and hosted by the Bocconi University © Associazione Italiana Economisti dell‘Energia (www.aiee.it). The editors and publisher assume no rcsponsibility for the views expressed by the authors of the executive summaries and papers printed in this book.
ACKNOWLEDGEMENTS The editors and the publisher acknowledge the support of the following sponsors of the 3rdAIEE Energy Symposium on Current and Future Challenges to Energy Security
Adriatic LNG Axpo ERG
Esso Italiana FEDERMANAGER Fondazione Megalia
Nature Energy Tenaris Dalmine


ORGANIZATION CARLO DI PRIMIO, President, AIEE, Italy (SPONSORSHIP COMMITTEE CHAIR) CARLO ANDREA BOLLINO, Professor University of Perugia, Honorary President AIEE, Italy (GENERAL CONFERENCE CHAIR) MICHELE POLO, Eni Chair in Energy Markets and President GREEN, Bocconi University, Italy (SCIENTIFIC COMMITTEE CHAIR) AGIME GERBETI, Adjunct Professor, LUMSA University, Italy (PROGRAMME COMMITTEE CHAIR) MATTEO DI CASTELNUOVO, MaGER Director and Research Fellow GREEN, Bocconi University, Italy (ORGANIZATION COMMITTEE CHAIR) ANKA SERBU, Head of External Relations & Communication AIEE, Italy ELENA DAL ZOTTO Administrative Assistant GREEN - Bocconi University, Italy (ORGANIZATION AND COORDINATION) THE SCIENTIFIC COMMITTEE Kostas Andriosopoulos, ESCP Europe Business School, Grece Francesco Asdrubali, Roma Tre University, Italy Lars Bergman, Stockholm School of Economics, Sweden Simona Bigerna, University of Perugia, Italy Carlo Andrea Bollino, AIEE and University of Perugia, Italy Carlo Cambini, Polytechnic University of Turin, Italy Pantelis Capros, E3MLab - Energy Economy Environment Modelling Lab, Grece Carlo Carraro, EAERE, Italy Fatma Çiğdem Çelik, Okan University, Turkey Erik Delarue, KU Leuven Department of Mechanical Engineering, Belgium Vittorio De Martino, AIEE, Italy Vittorio D'Ermo, AIEE, Italy Matteo Di Castenuovo, Bocconi University, Italy Georg Erdmann, Technical University of Berlin, Germany Giovanni Ferri, LUMSA University, Italy Massimo Filippini, ETH Zürich,Switzerland Elena Fumagalli, Copernicus Institute of Sustainable Development, Utrecht University, The Netherlands Marzio Galeotti, State University of Milan, Italy Antonio Geracitano, Eosconsulting, Italy Patrice Geoffron, Laboratoire d’Economie de Dauphine,Université Paris-Dauphine, France Agime Gerbeti, LUMSA University, Italy Angelica Gianfreda, Free University of Bozen-Bolzano, Italy Monica Giulietti,School of Business and Economics, Loughborough University, U.K. Eberhard Jochem, Fraunhofer Institute for Systems und Innovation Research (ISI), Germany José María Labeaga Azcona, National Distance Education University, Spain

Xavier Labandeira, University of Vigo, Spain Alessandro Lanza, LUISS University Rome, Italy Arturo Lorenzoni, University of Padua, Italy Reinhard Madlener, E.ON Energy Research Center, RWTH Aachen University, Germany Carlo Mari, Department of Management and Business Administration University of Chieti-Pescara, Italy Shunsuke Mori, Faculty of Science and Technology, Tokyo University of Science, Japan Luis Mundaca, IIIEE - Lund University, Sweden Spiros Papaeftimiou, School of Production Engineering & Management- Technical University of Crete, Grece Silvia Pariente-David,Center for Mediterranean Integration, France Aaron Praktiknjo, E.ON Energy Research Center, RWTH Aachen University, Germany Lucia Visconti Parisio, University Bicocca, Italy Jacques Percebois, Montpellier University, France Alberto Pincherle, AIEE, Italy Paolo Polinori, University of Perugia, Italy Ionut Purica, Advisory Center for Energy and Environment, Romanian Academy, Romania Pippo Ranci, Catholic University of Milan, Italy Nicoletta Rangone, Lumsa University, Italy Fabien Roques, CEEM - Université Paris-Dauphine, France Alessandro Rubino, PWC Advisory, Italy Alessandro Sapio, Parthenope University of Naples, Italy Francesco Scalia, University of Cassino and Southern Lazio, Italy Elisa Scarpa, Edison Trading - Market Analysis, Forecasting & Structuring, Italy Manolis Souliotis,University of Western Macedonia, Greece Silvana Stefani, University Bicocca,Italy Miguel Vasquez, George Washington University, USA Mine Yücel, Federal Reserve Bank of Dallas, USA G.B. Zorzoli, AIEE, Italy THE PROGRAMME COMMITTEE Fabio Catino, Enciclopedia Treccani, Italy Natalia Caldés Gómez, Energy Department - CIEMAT, Spain Mario Iannotti, Advisor on Sustainable Development (IMELS), Italy Manuela Mischitelli, LUISS University, Italy Nicoletta Rangone, LUMSA University, Italy Francesco Scalia, University of Cassino and Southern Lazio, Italy Manfred Weissenbacher, University of Malta Institute for Sustainable Energy, Malta CONFERENCE SECRETARIAT Phone: +39.06.3227367 - Fax: +39 06 8070751 e-mail: [email protected]; [email protected]; [email protected];

INTRODUCTION:
CURRENT AND FUTURE CHELLENGES TO ENERGY SECURITY
- the energy transition -
The AIEE - Italian Association of Energy Economists (Italian affiliate of the IAEE - The International Association for Energy Economics) has organized this international conference in cooperation with the Bocconi University - GREEN (Centre for Geography, Resources, Environment, Energy and Networks), of Milan to bring together energy experts engaged in academic, business, government, international organizations for an exchange of ideas and experiences on the present and future landscape of energy security. The first two editions of the AIEE Symposium on Energy Security - Milan 2016 and Rome 2017, were an opportunity to explore new energy trends, challenges and creative solutions for the energy security, the availability of new technologies, the emergence of new market conditions and of new market operators. Following up on the success of the past editions this third AIEE Energy Symposium to provided a fresh look on the major forthcoming issues offering an excellent occasion to continue the dialogue and to share best practice and experience with delegates from all over the world. The energy situation is evolving in Europe as well as in the rest of the world, where new actors, the emerging economies, are taking the leading role. Political developments in several areas of the globe (North Africa and Middle East, the Caspian region, ASEAN countries) are reshaping the geopolitical situation, generating some worries about the security of supply in the EU countries. The concept of energy security is undergoing a rapid transformation. In the past, geopolitics and the supply of oil and gas were the dominant factors determining energy security. Today, a broader and more complex spectrum of elements are interacting to both stabilize and threaten energy security. The availability of energy sources, when we consider both fossil fuels and renewables, is increasing. In particular, a major source of change is the strong growth in the production and integration of renewable and distributed energy, which offers opportunities to diversify the energy mix and thus improve energy security by reducing physical reliance and price exposure to only a few sources and countries. At the same time, this paradigm of a new energy system has strong implications both on petroleum-producing countries and companies, with knock-on effects on geo-economic balance of powers and energy markets and on the security and reliability of the transmission and distribution networks. The new challenges of the digital revolution that on one hand offers opportunities to improve efficiency, to have lower costs but on the other hand raises a whole new set of challenges and creates vulnerabilities we have never seen before so that energy is being viewed as a key part of national security. While in the past the supply side was the dominant factor in energy security, with the critical element being the possibility of sourcing the products to produce electricity and provide mobility, now the energy security balance is changing.


CONTENT PLENARY Sessions programme and keynote speakers iii
ABSTRACTS Index by Session v
PAPERS Index by Session xi
ABSTRACTS 1
PAPERS 205
ANALYTICAL INDEX 355

ii

iii
PLENARY SESSIONS KEYNOTE SPEAKERS Opening Session
Carlo Di Primio, AIEE President Carlo Andrea Bollino, AIEE Honorary Presidente and General Chair Michele Polo, Bocconi University, Eni Chair in Energy Markets, President Green Matteo Di Castelnuovo, MaGER Director and Research Fellow GREEN, Bocconi University, Organization Committee Chair Agime Gerbeti, LUMSA University, Programme Committe Chair Davide Crippa, Under Secretary, Italian Ministry of Economic Development EU towards 2030 and the energy security concerns
Agime Gerbeti, Adjunct Professor, LUMSA University, Italy Samuele Furfari, Professor of Geopolitics Université Libre de Bruxelles, Belgium Marco Falcone, Government Relations and Issues Manager, Esso Italiana, Italy Giulio Volpi, Policy Coordinator, Directorate General for Energy of the European Commission Regulatory challenges and market developments
Fabrizio Falconi, Regulatory Affairs Coordinator Federation of the Italian Utilities – Utilitalia, Italy Simona Ciancio, Head of Market Regulation Terna, Italy Alessandro Ortis, President Stati Generali dell’Efficienza Energetica, Past President of ARERA, Italy Pippo Ranci, Catholic University of Milan and Advisor, Florence School of Regulation, Past President of ARERA, Italy Energy industry challenges to a low-carbon economy, the gas role in the transition
Carlo Di Primio, AIEE President, Italy Alfredo Balena, Adriatic LNG Public & Government Affairs Manager, Italy Marco Brun, CEO Shell Italia, Italy Michele Mario Elia, Country Manager Italia di TAP – Trans Adriatic Pipeline, Italy Camilla Palladino, EVP Corporate Strategy and Investor Relations, Snam, Italy Giuseppe Ricci, President Confindustria Energia (The Italian Industry Federation), Italy Pierre Vergerio, Head of Gas Midstream, Energy Management & Optimization Edison, Italy Sustainable mobility challenges for the transition targets
G.B. Zorzoli, President FREE Amela Ajanovic, Associate Professor & Senior Research Scientist, Energy Economics Group, Vienna University of Technology, Austria Vittorio Chiesa, Professor Polytechnic University of Milan, Italy Adil Gaoui, Professor GEC Marrakech-École de Management, Delegate Africa–Middle East AAQIUS, STOR-H General Manager, Morocco Vincent Schachter, Senior Vice President Energy Services eMotorWerks, an Enel Group, Company Italy

iv
Grid security and new technologies
Carlo Andrea Bollino, Honorary President AIEE, Italy Luca Bragoli, Head of International and Institutional Affairs ERG, Italy Matteo Codazzi, Chief Executive Officer CESI, Italy Salvatore Pinto, President Axpo, Italy Agostino Re Rebaudengo, Vice President, Elettricità Futura, Italy Europe Roadmap and the future strategies of the energy industry
Vittorio D'Ermo, Vice President AIEE, Italy
Maria Luigia Partipilo, Head of Institutional Affairs Northern Area Enel, Italy Dario Di Santo, Head Manager, Italian Federation for energy efficiency – FIRE Felice Egidi, Federmanager - Federation of Italian Managers, Italy Nicola Pedde, Director of the Institute for Global Studies, Editor of “Geopolitics of the Middle East”, Italy

v
CONTENTS ABSTRACTS INDEX by session pag.
Session 01. Energy efficiency in buildings Chair: Vittorio De Martino, AIEE, Italy
Shunsuke Mori, Aya Kishimoto and Satoshi Ohnish An Assessment of Urban Energy Systems Focusing on the Cooling Energy Demand in Hot Summer Days by an Energy Network Model with 151 Subregions of Tokyo Koto Area 3
Giuseppe Dell’Olio Heat cost allocation: an evaluation of benefits, on the basis of actual operation data (paper pag. 203 ) 7
Sergey Arzoyan, Quirin Oberpriller, Marc Vielle, Michel Zimmermann Endogenous energy efficiency improvement of large-scale refurbishment in the Swiss residential building stock 9
Beatrice Petrovich, Stefanie Lena Hille, Stefano Carattini, Rolf Wüstenhagen Residential solar pv investment: the role of beauty, budget and risk 11
Session 02. The gas market: new perspectives? Chair: Silvia Pariente-David, Senior advisor and energy consultant, Center for Mediterranean Integration
Robert Uberman, Saša Zikoviċ Development of LNG markets & its impact on valuation of natural gas resources in CEE countries 13Silvana Mima, Catherine Locatelli, Olga Garanina China's gas demand in low carbon transition: implications for the international natural gas markets 15Arnaldo Orlandini, Meliyara Consuegra Emergence and Consolidation of a Hybrid Paradigm in the European Gas Market: A Computational Simulation 17Marina Bertolini, Dimitrios Zormpas Playing on two markets: investment evaluation of a biogas – bio-methane power plant in a Smart Grid environment 20
Session 03. The energy-environment Chair: Fereidoon P. Sioshansi, Menlo Energy Economics, USA
Elena Fumagalli, Matteo Rocco Low-carbon electricity generation scenarios for Tanzania: implications for the country’s economy and the environment 23
Eliot Romano, Pierre Hollmuller, Martin K. Patel Real-time Carbon-emissions and consumer responsibility - a marginal approach for an open economy: The case of the Swiss Electricity Consumption 26
Maria Milousi, Manolis Souliotis, Emilios Galariotis, Spiros Papaefthimiou, Georgia Makridou Evaluation of environmental and economic feasibility of Renewable Energy Systems; A stochastic life cycle assessment and cost analysis approach 28
Ryan Timothy Brown Areva, EDF, and the Economic Viability of the Closed Fuel Cycle 30

vi
Session 04. The multiple paths of electricity: new challenges Chair: Lucia Visconti Parisio, Bicocca University Italy
Alessandra Motz The value of security for Swiss residential electricity consumers – a discrete choice analysis
32
Amedeo Argentiero, Simona Bigerna, Maria Chiara D’Errico, Silvia Micheli, Paolo Polinori The measurement of unobserved economy through electricity demand
34
Sophia Kokoni An econometrics analysis of residential energy demand satisfied by heat pumps: lessons from international experience
35
Filippos Ioannidis, Kyriaki Kosmidou, Kostas Andriosopoulos Market design of an energy exchange: the case of Grecce
37
Session 05. Innovation for energy systems Chair: Alessandro Clerici, FAST and WEC Italy
Matteo Pelagatti, Angelica Gianfreda and Lucia Parisio Trends and long-run relations in electricity prices: why prefiltering is inevitable
34
Samuel Carrara, Michela Bevione, Harmen-Sytze de Boer, David Gernaat, Silvana Mima, Robert C. Pietzcker, Massimo Tavoni Exploring pathways of solar PV learning in integrated assessment models
41
Sergio Giaccaria, Alberto Longo, Thijs Bouman, Tilemahos EfthimiadisValuing (in) security of electricity supply: A discrete choice experiment for Estonia, the Netherlands and Portugal
44
Session 06. Decarbonizing the gas sector Chair: Spiros Papaeftimiou, University of Crete, Greece
Giuseppe Ferrari, Iñigo del Guayo Towards renewable natural gas (paper pag. 206 )
47
Simon Morgenthaler, Christopher Ball, Wilhelm Kuckshinrichs Synthetic Natural Gas: an Option Complementing Renewable Energy and Supporting Decarbonisation?
49
Andris Piebalgs, Maria Olczak Decarbonising the Gas Sector: is Renewable Gas a Serious Option? (paper pag.216)
51
Session 07. Energy security & climate change Chair: Mario Iannotti, Ministry of Environment, Italy
Ionut PuricaBig data analysis to seek climate change proof and its risk mitigation
53
Agime Gerbeti A new Governance regulation to foster renewable cooperation post 2020
54
Session 08. The Electricity market: risks and opportunities Chair: Elena Fumagalli, Copernicus Institute for Sustainable Development, Utrecht University, The Netherlands Reinhard Haas, Hans Auer Heading towards sustainable and democratic electricity system
57
Kun Li An intra-day analysis of electricity forward premia (paper pag. 224 )
61
Fereidoon P. Sioshansi Behind and beyond the meter: How new BTM service options are disrupting utility business model
63

vii
Tim Schittekatte, Leonardo Meeus Distribution network tariffs and active consumers: a bi-level equilibrium modelling approach
64
Session 09. The energy-economy nexus Chair: Luigi De Paoli, Bocconi University, Italy
Silvana Stefani, Gleda Kutrolli, Enrico Moretto, Adeyemi Sonubi, Vanda Tulli Hedging rainfall exposure through hybrid financial instruments:
67
Philip Mayer, Stefan Vögele, Kristina Govorukha, Dirk Rübbelke Development of dynamic scenarios: Depicting path dependencies and nonlinearities within storylines
70
Elisabete Neves, Carla Henriques, João Vilas Financial performance assessment of electricity companies: evidence from Portugal (paper pag. 231)
72
Francesco Scalia The energy performance contract (EPC) as an instrument of private public partnership for the energy requalification of public real estate assets (paper pag. 253)
76
Session 10. The union of national energy markets Chair: Silvana Stefani, Bicocca University, Italy
Martin Svec Division of powers between the EU and its member states: implications for energy security
78
Sotirios Manolkidis Regulating Energy Markets: The Experience of South Eastern Europe
81
Maria Olczak, Andris Piebalgs Sector Coupling – the new EU Climate & Energy paradigm? (paper pag. 267)
83
Marco Buso, Luciano Greco, Marina Bertolini Competition and Regulation with Smart Grids
85
Session 11. Global assessment of energy security, efficiency and sustainability Chair: Ionut Purica, Romania Academy and AOSR, Romania
Michael Chesser, Jim Hanly, Damien Cassells Fuel Poverty Measurements in America. Who are the Most Vulnerable?
88
Gianluca Carrino Plastic to Fuel, an innovative solution for energy security
90
Daisy de Selliers, Catalina Spataru Energy-Materials Nexus for a Low Carbon Energy System
92
Jani Mikkola, Liinu Koskela, Peter D. Lund Analysis of Energy System Resilience Under Wicked Socio-Environmental Disruptions – A Framework
97
Session 12. The market prospect of electric vehicles Chair: Chair: Matteo Di Castelnuovo, Bocconi University, Italy
Gabriele Grea, Raffaele Galdi The impact of electric vehicles on air quality related health costs
100
Carolina Merighi Energy Technology, case of electric vehicles, why is it so hard to change course?
101
Amela Ajanovic, Reinhard Haas On the environmental benignity and the market prospects of electric vehicles
103

viii
Session 14. The energy policies post Paris Agreement and the energy roadmap to 2050 Chair: Agime Gerbeti, LUMSA University, Italy
Luis María Abadie, José Manuel Chamorro Physical adequacy in power generation: Spain beyond 2020
113
Franco Del Manso Vision 2050 - A pathway for the evolution of the refining industry and liquid fuels
116
Mario Valentino Romeri Consideration about Hydrogen and Fuel Cells in the Paris Agreement 1.5°C Perspective (paper pag. 276 )
118
André Luis da Silva Leite, Luis Eduardo Nunes, Marcus Vinicius Lima Switch and defer options in renewable energy projects: evidences from Brazil
121
Session 15. Integrating renewables in energy markets Chair: Carlo Andrea Bollino, AIEE, Italy
Sietske Veenman, Karl Sperling How futures materialize: a case future frame of renewable energy the in Denmark
122
Silvia Concettini, Stanislao Gualdi, Anna Creti Assessing the relevance of renewable generation localization through a spot market algorithm simulator: the case of Italy
125
Matteo di Castelnuovo, Monika Dimitrova Corporate renewable energy procurement through PPAs in the United States
127
Agatino Nicita, Gaetano Maggio, Antonio P.F. Andaloro, Gaetano Squadrito The hydrogen production from RES impact on energy and fuel markets
129
Session 16. Strategic contribution of energy storage to energy security Chair: Silvana Mima, CNRS-GAEL, France
Damian Shaw-Williams, Connie Susilawati Valuing the impact on network reliability of residential battery storage (paper pag. 290)
131
Olvar Bergland Dispatch Auction Designs and Arbitrage Strategies for Energy Storage Units
133
Silvia Canevese, Antonio Gatti BESS for Primary Frequency Regulation in Support of Thermal Power Plants
135
Claudia Pavarini Rising flexibility needs in the power sector and the growing role of energy storage in the World Energy Outlook
138
Session 13. The link between the growth of energy consumption, population and income levels Chair: Reinhard Haas, Vienna University of Technology, Austria
Abd Aziz Azlina, Mahirah Kamaludin, Azilah Hasnisah Energy demand and economic growth: panel data evidence from developing countries (ASEAN 4)
107
Sakib Amin, Laura Marsiliani, Thomas Renstrom Can oil based power companies improve the household welfare in Bangladesh economy? a DSGE analysis
109
Hamad M. Mudij, Mohammed AL-Otaibi The study of the impact of economic and population growth on energy consumption: a statistical approach
111

ix
Session 17. Energy supply and security Chair: Vittorio D’Ermo, AIEE, Italy
Balázs R. Sziklai, László Á. Kóczy, Dávid Csercsik The geopolitical impact of Nord Stream 2
139
Julia Vainio the increase of renewable energy sources will change our energy security landscape – a look on the Baltic Sea Region states
141
László Á. Kóczy, Dávid Csercsik, Balázs R. Sziklai A risk-based evaluation of European natural gas supply security – The case of Nordstream 2
144
Session 18. Technology development - Grid management Chair: Iain Staffell, lmperial College London, UK
Andrew Burlinson, Anna Rita Bennato, Monica Giulietti Distributed technologies in the energy markets: Welfare effects in legacy networks
146
Cristian Alvarez, Alejandro Angulo, Pablo Escalona Optimality study of uplifts with a primal-dual solution approach for the Convex Hull Pricing problem
148
Olvar Bergland, Alan Love Revealing Consumption Patterns from Meter Readings: a structural deep machine learning approach
151
Joachim Geske, Richard Green, Iain Staffell Elecxit: The Impact of Barriers to Electricity Trade After Brexit
153
Session 19. The transition to renewable & smart energies and the decarbonization project Chair: Francesco Gullì, Bocconi University, Italy
Hanna-Liisa Kangas, Kimmo Ollikka, Kim Yukyeong Smart energy transition – technology convergence of renewable energy and ICT sectors
156
Carla Henriques, Patrícia Pereira da Silva, Nuno Figueiredo A proposal for assessing wind power systems in Europe (paper pag. 299)
159
Adil Gaoui, Brahim Lekhlif The impact of using green hydrogen on African countries’ energy independence
163
Session 20. From Consumers to nonsumers: How new behind-the-meter service options are disrupting utility business models Chair: Nicola Sorrentino, University of Calabria, Italy
Nicola Sorrentino, Daniele Menniti, Anna Pinnarelli Power Cloud: a framework to implement a “nonsumer” community
165
Nikolas Kampelis, E. Tsekeri, D. Kolokotsa, K. Kalaitzakis, D. Isidori, C. Cristalli Day-ahead demand management at microgrid level using Artificial Neural Network predictions and Genetic Algorithm optimisation
168
Dierk Bauknecht, Joß Bracker, Franziska Flachsbarth, Christoph Heinemann, Dominik Seebach, Moritz Vogel Customer stratification and different concepts of decentralization
170
Tim Schittekatte, Leonardo Meeus Limits of traditional distribution network tariff designs and options to move beyond
172

x
Session 21. Current Oil Market Dynamics Chair: Elisa Scarpa, Head of Market Analysis, Structuring & Pricing Edison, Italy
Vesa Soini, Sindre Lorentzen Determinants of Volatility Smile: the Case of Crude Oil Options (paper pag. 318)
174
Krzysztof Drachal A comparison of various oil price forecasting methods with a large number of variables
175
Román Ferrer, Syed Jawad Hussain Shahzad; Raquel López; Francisco Jareñ Time and frequency dynamics of connectedness between renewable energy stocks and crude oil prices
177
Session 22. Technology development Chair: Giuseppe Dell'Olio, GSE, Italy
Thomas Schröder Value of electricity supply security: a case study for Germany
179
Yalin Huang, Elin Grahn Smart meters in Sweden- lessons learned and new regulations
180
Matthias Kühnbach, Stefan Pisula, Anke Eßer Potentials and limitations of photovoltaic-based cellular energy systems in southern Germany
182
Sheng-Dih Hwang, Yu-Ching Huang Determined a Reference Price by CO2 Abatement Cost for Window Films (paper pag. 326)
185
Session 23. Perspectives of transport sector Chair: Oliviero Baccelli, GREEN Bocconi University
Franco Del Manso Impact of Euro 6 diesel passenger cars on urban air quality compliance in Italy
187
Gabin Mantulet, Silvana Mima, Adrien Bidaud The future of technologies for mobility, a model based approach
189
Alessandro Silvestri, Sebastien Foudi, Ibon Galarraga Current development and future potential of carsharing in Spain: insights from experts and users in-depth interviews
192
Wojciech Drożdż, Jakub Dowejko Prospects for the development of Polish electromobility
195
Session 24. European energy security strategies Chair: Julia Vainio, Subject Matter Expert, NATO ENSEC COE, Lithuania
Marina Petri Regulation and efficiency: which governance model for energy security after the Winter Package?
197
Carsten Herbes, Benedikt Rilling, Lars Holstenkamp Ready for the next step? The human capital of German renewable energy cooperatives’ management with a view to implementing new business models
199
Ryan Brown Anticipatory Strategies for Eastern European Natural Gas Security
201
Maria Belka Belt & Road initiative: Challenge or chance for the European energy security?
202

xi
PAPERS INDEX by Session
Giuseppe Dell’Olio Heat cost allocation: an evaluation of benefits, on the basis of actual operational data (session 1)
207
Giuseppe Franco Ferrari, Íñigo del Guayo Towards renewable gas. regulatory challenges (session 6)
210
Andris Piebalgs and Maria Olczak Decarbonising the Gas Sector: is Renewable Gas a Serious Option? (session 6)
220
Agime Gerbeti A new governance regulation to foster renewable cooperation post 2020 (session 7)
228
Kun Li An Intra-day Analysis of Electricity Forward Premia (session 8)
242
Maria Elisabete Neves, Carla Henriques, João Vilas Financial performance assessment of electricity companies: evidence from Portugal (session 9)
249
Francesco Scalia The energy performance contract as a private public partnership operation to improve energy efficiency of public real estate assets (session 9)
271
Maria Olczak and Andris Piebalgs Sector Coupling: the New EU Climate and Energy Paradigm? (session 10)
285
Mario Valentino Romeri Consideration about Hydrogen and Fuel Cells in the Paris Agreement 1.5°C Perspective. (session 14)
294
Damian Shaw-Williams Valuing the impact on network reliability of residential battery storage (session 16)
308
Carla Henriques, Patrícia Pereira da Silva, Nuno Figueiredo A proposal for assessing the efficiency of wind power systems in Europe: a generalized directional distance function approach (session 19)
317
Vesa-Heikki Soini, Sindre Lorentzen Determinants of Volatility Smile: the Case of Crude Oil Options (session 21)
336
Yalin Huang, Elin Grahn, Carl Johan Wallnerström, Lena Jaakonantti, Tommy Johansson Smart meters in Sweden- lessons learned and new regulations (session 22)
344

xii

Abstracts

2

3
Session 01 - Energy efficiency in buildings
Shunsuke Mori, Aya Kishimoto and Satoshi Ohnishi AN ASSESSMENT OF URBAN ENERGY SYSTEMS FOCUSING ON THE COOLING ENERGY DEMAND IN HOT SUMMER DAYS BY AN ENERGY NETWORK MODEL WITH 151 SUBREGIONS OF TOKYO KOTO AREA
Shunsuke Mori: Dept. of Industrial Administration, Tokyo University of Science Yamasaki 2641, Noda, Chiba 278-8510, Japan
Aya Kishimoto: Dept. of Industrial Administration, Tokyo University of Science Satoshi Ohnishi: Dept. of Industrial Administration, Tokyo University of Science
Overview The energy conservation of the residential and the commercial buildings in the metropolitan area has been focused on to meet the Paris agreement. The authors have previously assessed the urban energy systems considering distributed energy technologies including CGS, Photovoltaics, new heat-pumps as well as the utilization of unutilized heat sources such as the underground and the river heat sources. (Mori et.al., 2017) In that study, we investigated the contribution of energy conservation technologies for the buildings by developing a energy flow model which explicitly deals with the potentials of unutilized energy sources and energy transportation among regions. Koto-area in Tokyo is disaggregated into 151 sub-regions with around 250m by 250m meshes. The building types includes i.e. commercial buildings, office buildings, residential buildings, sport gymnasium, and hospital and hotels. .
In our above study, however, two reservations remained; first, a year was classified into seven categories, i.e. summer-working day, winter-working day, middle-working day, summer-holiday, winter-holiday, middle-holiday and summer peak three days.
PowerUtility
PVElec.Supply
Gas Utility
CGS
Boiler
Gas heater
HP for hot water
HP for air conditioning
Absorption refrigerator
Elec. power demand
Hot water demand
Cooling demand
Heating demand
PVElec.Supply
Gas Utility
CGS
Boiler
HP for hot water
HP for air conditioning
Absorption refrigerator
Wind
Refuse incineration
Sewage treatment
River heat
Underground heat
Energy Flow for Consumers Energy Flow for District Energy center
ー gas ー electricity ー hot water - heat(steam) - chilled water
Figure 1 Energy Flow for Consumers and District Energy Center

4
Session 01 - Energy efficiency in buildings Our model failed to assess the effects of weather on PV. Second, the relationship between the temperature and the cooling energy demand was not considered In this study, we expand our previous model as follows: we expand the classification of seasonal categories by specifying three weather cases, i.e., fine, cloudy and rainy. Thus, a year is divided into 19 categories, i.e. (summer, winter and middle)*(working day and holiday)*(fine, cloudy and rainy)+summer peak three days. Second, we estimate the relationship between the temperature and power demand for cooling since only the relationship between total power demand and weather is currently available. The energy flow of the model is similar to our previous study imposing some new energy sources as shown in Figure 1. Method In the previous study, we extract the detailed building data on the floor area and usage type using GIS. We then estimated the energy demand by end-use, i.e. heating, cooling, hot water and other general electric demand and aggregated them into 151 sub-regions with about 250m by 250m mesh. The energy flow model in Figure 1 is applied to each. Although power demand for industry and other usages are included, their relationship is clearly observed as around 12.7% increase by 1 degree rise. In this study, we employed the following procedure: first, based on the hourly energy demand estimation by purpose, we evaluate the total electric power demand assuming COP=3.0 uniformly. The relationship between temperature and cooling energy demand is essential to design the regional energy system when considering the choice of cooling technologies. However, no statistics from macro view are available. Figure 2 (Ministry of Env., 2004) shows the relationship total power demand and mean temperature for Tokyo Electric Company area. Second, we increase the hourly cooling power demand proportionally until total power demand increases by 12.7%. We find that 1 degree temperature rise causes around 40% increase for cooling power demand. When we consider the enthalpy of air
where H, T and X denote enthalpy, absolute temperature and absolute humidity respectively, the 1 degree rise of ambient temperature from 29°C can cause 33% enthalpy increase keeping 26°C room temperature. Since dehumidification requires additional energy demand, 40% increase would not be so surprising. Although the above estimation is no more than a preliminary one, it helps to assess the energy system under the possible hot summer in Tokyo. With respect to the unused heat resources, we newly included waste heat of subway stations and power substations in addition to river heat, under-ground heat, sewage treatment and refuse incineration.
X*)T*846.12501(T*005.1H
Mean temperature(℃)
Power
dem
and(M
Wday/customer)
Figure 2 Relationship between temperature and power demandin Tokyo Electric Company area (Ministry of Env, 2004)
Y=4.84x ‐ 34.92

5
Session 01 - Energy efficiency in buildings Results We calculate the model for five cases, i.e., case basic: conventional energy facilities only, case-0:PV, case-1:PV+CGS, case-2:PV+CGS+power transportation between consumers, case-3:case-2+power sales to utility, and case-4: case-3+heat transportation between sub-regions via district energy center. We also calculated the cases where temperature in summer rises 1°C and 2°C. Figure 3 shows the example of simulation results, where annual total CO2 emissions of Koto-area are compared.
(a) Average year (b) 1°C higher
(c) 2°C higher
Figure 3 Results on total CO2 Emissions of Koto-area in (a) Average year, (b) 1°C higher, and (c) 2°C higher. CO2 emissions increase by 19% at maximum and 9% in average when summer average temperature rises 1 degree while 53% at maximum and 24% in average in 2 degree higher case. Those of office buildings especially increase whereas those in apartment houses show relatively small changes. One can also observe that CO2 emission of commercial buildings decreases when CGS is introduced,
Apartment houses
Apartment houses
Apartment houses
Detached houses
Detached houses
Detached houses
Hospitals
Hospitals Hospitals
Commercial buildings
Commercial buildings
Commercial buildings
Athletic gym
Athletic gym
Athletic gym
Hotels
Hotels Hotels
Office Buildings
Office Buildings
Office Buildings

6
Session 01 - Energy efficiency in buildings Conclusion We expanded our previous model to see the effects of temperature rise in summer and those of energy facilities based on a detailed building energy demand model dividing the Koto-area into 151 subregions. Since Olympic game in 2020 summer is expected to cause large amount of air conditioning demand, we should pay attention to make use of all possible energy sources.
REFERENCES Mori, S et.al. (2017), “An Assessment of Unutilized Heat Sources and Distributed Energy Technologies
by an Energy Network Model with 151 Subregions of Tokyo Koto Area”, 15th IAEE European Conference 2017
Ministry of Environment Japan (2004), https://www.env.go.jp/earth/ondanka/rep130412/pamph_full.pdf

7
Session 01 - Energy efficiency in buildings
Giuseppe Dell’Olio HEAT COST ALLOCATION: AN EVALUATION OF BENEFITS, ON THE BASIS OF ACTUAL OPERATION DATA
Giuseppe Dell’Olio, GSE Overview Advantages provided by heat control and cost allocation are well known. However, due to lack of operational data, numerical estimates of such advantages are difficult. This paper is based on numerous “real life” operation data, collected from a few tenths of collective heating installations. An evaluation of benefits yielded by heat control and metering is provided. A method is proposed to further increase such benefits and to decrease, at the same time, overall installation costs. Methods 63 methane-fired, central heating installations in apartment buildings have been examined: 51 are equipped with heat cost allocators. The above installations have been monitored for several years as a whole. Heat produced (kWh) and fuel consumed by each boiler have been measured. By weight-averaging those data, two indexes have been calculated: specific consumption and load factor. Results Installations equipped with heat cost allocators exhibit substantially lower load factors (minus 30-31 per cent, both in D and in E climate zone) as compared to installations non-equipped with heat cost allocators. This confirms that heat allocation discourages unnecessary heat production. Besides this positive effect, however, heat cost allocation seems to increase specific consumption (plus 5 per cent in “D” climate zone; plus 12 per cent in “E” climate zone). Overall benefit turns out to be less than expected: fuel saving is lower than heat saving. This can be explained based on load factor. When load factor is low, stand-by losses and start-up losses are significant and should be lowered. Both losses tend to increase with boiler rated capacity. In new installations, therefore, boilers with lower capacity should be chosen, all things being equal. Decreasing capacity, however, amounts to increasing load factor, feasibility of which is investigated in the first place. Let us consider the maximum load factor (Fcmax) that a boiler can withstand. Fcmax is independent of heat cost allocation: boilers with heat cost allocations exhibit the same Fcmax as those without. Conservatively, Fcmax can be assumed to be equal to the highest Fc that was reached during operation: 0,22 in D climate zone; 0,25 in E zone. In conclusion, in the presence of heat cost allocators, Fc can be increased up to the value it would have without them. Conclusions Thanks to heat cost allocation, boiler capacity can be lowered in such a way as to bring load factor back to 0,22 (from 0,15), or to 0,25 (from 0,17), respectively. Capacity reduction is determined by the ratio of latter figure to former one, namely 30 per cent (on average) in both cases. All things being equal, it is nowadays possible to choose boilers with 70 per cent capacity, as compared to those that were chosen in the past, when heat cost allocation was not common practice.

8
Session 01 - Energy efficiency in buildings
References S.Bergero, P. Cavalletti, M. Michelini, “Termoregolazione e contabilizzazione: convenienza economica
per zona climatica di unità immobiliare italiana tipo mediante aggregazione di dati campione”, in “La Termotecnica”, Novembre 2016, pag. 58 (in Italian).
Enrico Biele, Dario Di Santo, Giuseppe Tomassetti “Analisi dell'impatto delle valvole termostatiche sui consumi finali degli utenti collegati alle reti di teleriscaldamento dei comuni montani delle zone climatiche E ed F” Settembre 2015 (in Italian).

9
Session 01 - Energy efficiency in buildings
Sergey Arzoyan, Quirin Oberpriller, Marc Vielle, Michel Zimmermann ENDOGENOUS ENERGY EFFICIENCY IMPROVEMENT OF LARGE-SCALE REFURBISHMENT IN THE SWISS RESIDENTIAL BUILDING STOCK
Sergey Arzoyan, Laboratory for Environmental and Urban Economics, Ecole Polytechnique Fédérale de
Lausanne,(EPFL), Station 16, CH-1015, Lausanne, Switzerland, Office BP 2140 Marc Vielle, Laboratory for Environmental and Urban Economics, Ecole Polytechnique Fédérale de
Lausanne,(EPFL), Station 16, CH-1015, Lausanne, Switzerland, Office BP Quirin Oberpriller: INFRAS Consulting, Analysis & Research. Binzstrasse 23, 8045 Zurich,
Michel Zimmermann, Laboratory for Environmental and Urban Economics, Ecole Polytechnique Fédérale de Lausanne (EPFL), Station 16, 1015 Lausanne, Switzerland, Office BP 2133,
Overview In Switzerland, according to Swiss Federal Office of Energy around 50% of primary energy consumption is attributable to buildings: 30% for heating, air-conditioning and hot water, 14% for electricity and around 6% for construction and maintenance. However, Streicher et al. [2017] show that large-scale energy retrofit of the Swiss residential building stock could result in theoretical energy savings of up 84% of current energy consumption. Of vital importance for energy consumption is the evolution of energy efficiency. In past and current analyses in the field of Swiss energy and climate policies, the speed and extent of energy efficiency improvement is usually set exogenously, i.e., it is assumed to be unaffected even by climate or energy policies designed to foster innovation and the development and adoption of more efficient production and consumption options (Shiell and Lyssenko [2014]). Computable general equilibrium (CGE) models and bottom-up models (e.g. Markal) rely mainly on autonomous energy efficiency improvement (AEEI, see Azar et Dowlatabadi, [1999]) despite clear evidence that technological change is influenced by economic activity and responsive to policies. These effects may be captured in CGEs (Computable General Equilibrium) using the concept of endogenous technical change. Method The Swiss building stock will be divided into seven energy classes, A to G, each representing a different range o f space heating demand (kWh/m^2). The percentage ranges are defined based on CECB energy standards (Cantonal Energy Certificate of Buildings). Buildings are represented with cohorts (before 1919,1945-1960,....2006-2015). First, we need a decomposition of the buildings stock of Switzerland that is relevant for their energy consumption. It could be developed incrementally, e.g. distinguishing fir st by construction period and by energy carrier (heating oil, natural gas, district heating, electricity as in TEP Energie [2016]). The data would fill a two-dimensional matrix. More dimensions may be added such as building typology: Single and Multi-family houses and specific energy efficiency indicators (CECB) that are relevant for energy consumption. The distinction by type of energy carrier will allow us to estimate the demand for these energy sources and CO2 emissions and to simulate policies that affect specific carriers (e.g. the CO2 levy or an electricity tax).

10
Session 01 - Energy efficiency in buildings The energy consumption of the buildings stock changes when buildings are refurbished and when the heating system is replaced. Refurbishment moves buildings from one cohort to another i. e. putting it to higher cohort. In first stage, we can assume that refurbishments move buildings from one cohort to another, i.e. it moves buildings from one column to another. The better the energy refurbishment is, to the higher cohort the building moves, i.e. it becomes equivalent to a more recent building. In a second step, more realistic part refurbishments (only facade, roof, windows, see TEP Energie [2016]) may be considered. Under autonomous energy efficiency improvement, the buildings stock becomes more energy efficient because (i) a given share of buildings are refurbished every year, (ii) new buildings are more energy efficient, (iii) old buildings are demolished. To represent this, we collected data on rates of refurbishment and demolition for each cohort. We are calibrating a model and explaining them, i.e. the choice of energy refurbishment and energy source as it depends on determinants such as energy prices, incentives, regulation, etc. Results The work is on the progress and the simulations are just beginning, we will have preliminary results after a month. We will have detailed results for the conference and will present them during the session. Conclusions The main goal of this research is to introduce a new methodology in an existing economic model of the Swiss economy aiming at a better representation of the acceleration of energy efficiency improvements due to energy and climate policy. The secondary goal is to illustrate this by assessing the impacts of a set of real or realistic policies on the diffusion and adoption of technologies associated with energy consumption in Switzerland, and ultimately on energy use as well as structural changes. A realistic representation should as far as possible include the effects of barriers (incomplete information, uncertainty, bounded rationality, etc.). A realistic representation can significantly influence the stringency of a policy (e.g. the level of a tax) which is necessary to achieve a target (see e.g. Edenhofer et al [2006] where ETC reduces the necessary stringency substantially). Hence, assessing the sensitivity of the results to these assumptions is another key contribution of the planned work. The main academic added values are the following: to demonstrate a theoretically founded and computationally tractable integration of ETC due to policy into a macroeconomic simulation model and to show how relevant ETC can be for energy and climate policy simulation. References Kai Nino Streicher, David Parra, Meinrad C Buerer, and Martin. Patel. (2017) Techno-economic potential
of large- scale energy retrofit in the Swiss residential building stock. Energy Procedia, 122:121-126. Leslie Shiell and Nikita Lyssenko. (2014) Climate policy and induced R&D: How great is the effect?
Energy Economics, 46:279-294. Azar C and Dowlatabadi H. (1999) A review of technical change in assessment of climate policy. Annual
Review of Energy and the Environment, 24(1):513–544. TEP (2016) Erweiterung des Gebäudeparkmodells gemäss SIA-Effizienzpfad Energie. Im Auftrag des
Bundesamtes für Energie BFE, Juni. O. Edenhofer et al. (2006) Induced Technological Change: Exploring its Implications for the Economics
of Atmospheric Stabilization: Synthesis Report from the Innovation Modeling Comparison Project. The Energy Journal, pp 57-107.

11
Session 01 - Energy efficiency in buildings
Beatrice Petrovich, Stefanie Lena Hille, Stefano Carattini, Rolf Wüstenhagen RESIDENTIAL SOLAR PV INVESTMENT: THE ROLE OF BEAUTY, BUDGET AND RISK
Beatrice Petrovich, Chair for Management of Renewable Energies, University of St. Gallen, Tigerbergstr. 2, CH-9000 St. Gallen
Stefano Carattini, Department of Economics, Andrew Young School of Policy Studies, Georgia State University 33 Gilmer Street SE Atlanta, GA 30303
Rolf Wüstenhagen, Chair for Management of Renewable Energies, University of St. Gallen, Tigerbergstr. 2, CH-9000 St. Gallen
Stefanie Lena Hille1, Chair for Management of Renewable Energies, University of St. Gallen, Tigerbergstr. 2, CH-9000 St.Gallen
Overview The transition to renewable energy supply of buildings, especially distributed solar power, is a key element of climate change mitigation. With the phasing out of feed-in tariffs for solar energy all around Europe (Karneyeva & Wüstenhagen 2017), a nuanced understanding of homeowners’ intention to install solar panels is key for reaching a broad market appeal. Moreover, currently support policies for residential solar photovoltaics (PV), including feed-in premium, investment grants and favourable regulation for prosumers, imply some levels of investment risk born by residential solar producers. Perceived investment risk might deter (some) households’ investment decisions, as in the case of professional energy investors (Lüthi & Wüstenhagen 2012, Salm 2017). This study aims to contribute to the policy debate, first, by identifying two segments of potential future solar adopters among homeowners planning a building retrofit and, second, by investigating the role of individual risk and time preferences in solar adoption decisions. Method The study uses Switzerland as a case study. In the first part of the study, we administer an adaptive choice based conjoint (ACBC) survey to a representative sample of Swiss homeowners planning a roof-retrofit (N=408). The ACBC section elicits preferences for selected attributes of the roof renovation solution, that include the type of roof (standard roof without solar panels, a building-attached or building-integrated solar PV system), the color and origin of the modules, total cost and expected future energy cost savings. Using the maximum utility rule, each respondent is assigned to the renovation solution, between a set of preselected competing renovation solutions, that provides her with the highest overall utility, as determined by summing the part-worth utilities associated with each solution. In the second part of the study, a choice experiment survey is submitted to a representative sample of Swiss homeowners interested in purchasing a solar PV system, who have to choose between different offers for a solar PV system for their house. The offers are characterized by different levels of (market-driven and policy-driven) investment risk, linked to factors that regulators can influence in a post- grid parity world, including the waiting time and amount of the investment grant, the details of the feeding-back agreement, level of self-consumption, level of cost savings achieved through self-consumption. ____________________________________ 1
Present affiliation and address: DG CONNECT - Communications Network, Content and Technology, European Commission, 10, Rue Robert Stumper, 2920 Luxemburg

12
Session 01 - Energy efficiency in buildings We assess how their willingness to invest changes depending on the risk level and how this relates with their risk and time preferences, measured through an elicitation task included in the choice experiment survey. Results We identify two segments of likely solar adopters: a “premium segment” composed of homeowners ready to opt (and pay) for a premium solution, and a more price-sensitive value segment. Our analysis on the importance of solar system’s features shows that aesthetic aspects of solar panels are key for expanding the customer base, and that likely adopters are more likely to be surrounded by neighbors, friends and relatives who have already installed solar panels than likely non adopters. The results also reveal that the premium segment cares more about aesthetic aspects in general purchasing decisions and shows higher ecological concern than the value segment. As far as investment risk is concerned, preliminary results, based by preliminary qualitative interviews, suggests that residential solar adoption is better promoted by regulatory frameworks that are easy to understand, foster self-consumption and imply a low (perceived) policy-driven risk, even when they do not fully shield prosumers from energy market-driven risk. In particular, ceteris paribus, we expect that a higher level of self-sufficiency increases willingness to accept investment risk. These expected results will be validated by our empirical analysis of survey data (planned for November 2018). Conclusions Our study could inform solar marketers and policymakers, in Switzerland as well as abroad, on options to maintain a sustained adoption of solar in a post-feed-in-tariff (and pre-carbon-pricing) world. Our results call for product differentiation to meet different customer preferences and price-sensitiveness: some manufacturers should focus on cost leadership and target the value segment, while other ones on developing high-priced design solutions suit for the premium customers. In this regard, marketers should be aware that, while sociodemographic features do not help very much in distinguishing the premium segment from the value segment, the importance that people assign to visual product appeal in their general purchasing decisions and their environmental attitudes do We expect that, as the public’s risk-aversion could deter adoption and perceived investment risk crucially depends on the information that agents receive, policymakers should adjust their communication strategies and manage people’s expectations. Regulatory frameworks that are simple, promote self-consumption and envisage shortly-settled financial support might be then very promising for promoting distributed solar, as well as fairly recent (at least in the Swiss context) business models aimed at reducing risks and households’ hassle, such as third-party ownership. References Karneyeva Y, Wüstenhagen R. (2017) Solar feed-in tariffs in a post-grid parity world: The role of risk,
investor diversity and business models. Energy Policy 2017; 106: 445-56. Lüthi, S., & Wüstenhagen, R. (2012). The price of policy risk—Empirical insights from choice exper-
iments with European photovoltaic project developers. Energy Economics, 34(4), 1001-1011. Salm, S. (2017). The investor-specific price of renewable energy project risk–A choice experiment with
incumbent utilities and institutional investors. Renewable and Sustainable Energy Reviews.

13
Session 02 - The gas market: new perspectives?
Robert Uberman, Saša Zikoviċ DEVELOPMENT OF LNG MARKETS & ITS IMPACT ON VALUATION OF NATURAL GAS RESOURCES IN CEE COUNTRIES
Robert Uberman, Saša Zikoviċ, Polish Association of Mineral Asset Valuators
Overview The paper gives an analysis of possible changes in natural gas pricing schemes and trends in “new” EU economies, in view of the growing importance of LNG and CNG. The key area of analysis refers to the opportunities created by the developments of these technologies, allowing for gas transport by other means besides the classical pipelines. In Europe CEE countries have been handicapped by the fact that natural gas could have been efficiently transported only via pipelines since the Soviet Union effectively cut off this part of Europe from alternative sources. Since constructing a new infrastructure is very time demanding and costly effort, developments in the field of LNG and CNG technologies allow CEEC to circumvent their historical legacy and giving them a chance to create a more competitive gas market. Creation of alternative routes and a more competitive market would have a direct impact on gas pricing schemes and price levels. Giving the role of gas in total primary energy supplies it would influence pricing in other markets and value of other fossil fuels. Methods The cornerstone of the empirical research consists of a dynamic linear model comprising of LNG prices in selected existing and planned access points to CEE countries and their comparison to pipeline delivered natural gas in corresponding sources of supply. The model links LNG prices in key export hubs, transportation & regasification costs and local distribution costs. Thus it allows to evaluate the possible impact of LNG imports on wholesale price level in CEEC. Consequently it creates a platform for linking other prices, including wellhead natural gas prices and selected alternative, eg. hard coal used for power generation and heating. Results The results indicate, as expected, that LNG (and CNG) decreases the overall price level its’ impact varies considerable with market size and access to the sea as major parameters. On top of that the model allows to analyze the possible impact on fuel mix used and thus the value of local mineral deposits of natural gas and hard coal. Conclusions With respect to the CEEC natural gas prices LNG can become an important factor in creating a more competitive market with several alternative sources of supply. However it’s influence will vary on country and regional level. The impact of LNG import is not restricted to a duel with gas pipeline supplies. The consequences can be more profound, since LNG imports can affect the energy mix in selected countries and, thus, value of their mineral deposits. References (selection) Baublys J.; Miškinis V.; Konstantinavičiūtė I.; Lekavičius V. (2014). “Aspirations for sustainability and
global energy development trends”, Journal of Security and Sustainability Issues 3(4): 17–26.

14
Session 02 - The gas market: new perspectives? Bern G. (2011): „Investing in Energy. A primer on the economics of energy industry”. John Wiley &
Sons, Hoboken. Durr C, Coyle D., Hill D., Smith S. (2005): „LNG technology for the commercially minded”. Gastech. Hinchey N. (2018) “The Impact of Securing Alternative Energy Sources on Russian-European Natural
Gas Pricing”, The Energy Journal, 39 (2): 87-102, Kalicki Jan H., Goldwyn David L. (2005): Energy & Security. Towards a new foreign policy strategy.
Woodrow Wilson Centre Press, Washington D.C. Kandiyoti, Rafael (2012): Pipelines. Flowing Oil and Crude Politics. I.B. Tauris & Co, London. Mu X & Ye H. (2018) „Towards an Integrated Spot LNG Market: An Interim Assessment”, The Energy
Journal, 39 (1): 211-234 Yergin D. (2011): „The Quest. Energy, Security, and the Remaking of the Modern World”. Penguin
Books, London

15
Session 02 - The gas market: new perspectives?
Silvana Mima, Catherine Locatelli, Olga Garanina CHINA'S GAS DEMAND IN LOW CARBON TRANSITION: IMPLICATIONS FOR THE INTERNATIONAL NATURAL GAS MARKETS
Silvana Mima, CNRS-GAEL Catherine Locatelli, CNRS-GAEL
Olga Garanina, Graduate School of Management, St Petersburg University
Overview The Asia-Pacific region will be the main source of world gas demand growth before 2030 (representing according IEA, 2018, 50 % of the world growth before 2023). Within this zone, China takes a particular weight. The growth of its gas consumption, by 2017, under climatic policies (substitution of the coal by the gas) was around 15%. The objective of the Chinese government is to increase the part of the gas in the energy balance from 8,3% currently to 10% in 2020. Considering the evolutions of the Chinese gas production including the non-conventional gas development, this demand growth should be translated by massive imports. China could so become the first world importer of gas by 2019 and change the competition between suppliers, regional gas prices and create new tensions between regional markets. In particular the US GNL could be exported towards Asia and not towards the European market which increasingly may become a residual GNL market. The perspective of a new golden age of the world gas will be concentrated in the Asia-Pacific region and particularly in China. Showing important ambitions to substitute at least on the short term the coal by the gas, China may strongly change its gas request profile, being thus fundamental for the balances of the regional natural gas markets. Many uncertainties put us in the face of important differences in the estimations of the Chinese gas demand varying according sources from 300 to 600 Gm3 by 2030. The objectif of the paper is to test various scenarios of the Chinese gas demand under 2D climatic policies. It is then necessary to analyze the consequences for the European market in terms of competition and price level. The paper will consecutively present first (i) an overview of the main drivers of the China’s gas market, current and future challenges; (ii) further will describe scenario’s construction with the POLES model and use them to (iii) analyze China’s gas demand by scenario and implications for the EU gas security. Method POLES model (Prospective Outlook on Long-term Energy Systems) has a good representation of regional gas markets. It can be used to analyze the great opportunities that China’s natural gas demand and supply may face in various scenarios: 1. For eg. what may be the role of China’s climate policy (like increasing shares of
renewable energy) on the demand for gas ; 2. What may be the role of demand for gas in China on global gas markets and how can be
prevented eventual tensions. 3. Certainly, the prospective outlooks on these questions are highly dependent on the future
oil and gas prices, which should also affect the gas demand.

16
Session 02 - The gas market: new perspectives? Results Expected results are two-fold. Firstly, the paper will propose an assessment of gas demand and supply in China under different climate policy scenarios. Secondly, it will derive implications in terms of gas supply options for the EU. Chinese gas demand affects regional gas balances, in particular through availability of LNG supply in the European gas market. Therefore, energy security policies in Europe should consider different gas consumption scenarios in China. References IEA (2017). World Energy Outlook 2017. Paris: OECD/IEA. IEA (2018). Gas 2018. Analysis and forecasts to 2023. Paris: OECD/IEA. Qin Y., Tong F., Yang G., and D.L. Mauzerall (2018). Challenges of using natural gas as a carbon
mitigation option in China. Energy Policy, 117: 457-462. Xunpeng S., Malamakkavu H., Variamb P., and J.Taob (2017). Global impact of uncertainties in China’s
gas market. Energy Policy, 104: 382-394. Xunzhang P., Wenying C., Clarke L.E., Lining W., and L.Guannan (2017). China's energy system
transformation towards the 2 °C goal: Implications of different effort-sharing principles. Energy Policy, 103: 116-126.
Ying Fan, (2018), « The future of China’s natural gas market with increasing shares of renewables », Presented at the 41th IAEE International Conference, School of Economics & Management, Beihang University, Beihang Center for Energy and Environmental Policy Research, June 13, 2018 Groningen.
Knut Einar Rosendahl, (2018), The future of Russian gas exports to the European market. School of Economics and Business, Norwegian University of Life Sciences, IAEE Conference, Groningen, 13 June 2018.

17
Session 02 - The gas market: new perspectives?
Arnaldo Orlandini, Meliyara Consuegra EMERGENCE AND CONSOLIDATION OF A HYBRID PARADIGM IN THE EUROPEAN GAS MARKET: A COMPUTATIONAL SIMULATION
Arnaldo Orlandini, MRC Consultants and Transaction Advisers, CEO Calle Edgar Neville 32, 28202 Madrid, Spain;
Meliyara Consuegra, Universidad Rey Juan Carlos of Madrid, Associate Professor
Overview In continental Europe, for nearly four decades, the conventional wisdom of the gas industry was that long- term oil-linked “take or pay” contracts, which obliged producers to deliver guaranteed volumes of gas, provide security for an increasingly import-dependent market. This worked well during the monopoly era, but, in the aftermath of the 2008 economic crisis, the conditions that made the old “market paradigm” suitable quickly disappeared, leading to an over-contracting crisis, with huge losses for merchant companies and costs for European buyers and consumers which became untenable. The economic crisis certainly played a role as a catalyst, however the structural change of the European gas industry has been due to a confluence of several forces that had been putting pressure on the contracting structures long before the storm broke, which can be identified as follows: a) strengthening of the liberalization process strongly pushed by the EU; b) emergence and widespread of traded gas markets, with a consequent increase of liquidity and transparency; c) impact of technological and commercial developments associated with international LNG trade; d) progressive dis-intermediation of the commercial relation between gas suppliers and consumers. A growing literature has explored these four “structural forces”, frequently emphasizing the relative prominence of one force or another. In our view, to make sense of the new reality, an analysis of the combined dynamics of those forces is required. What seems to emerge is a sort of hybrid market paradigm, where elements of the old-legacy model coexist and interact with key, arguably dominant, features of the Anglo-Saxon liberalized model. This hybrid character calls for innovative theoretical analysis as well as modelling tools. Motivated by this, the authors have adopted a two-pronged approach, namely:
a) exploring theoretically and qualitatively the interactions of the above-mentioned structural forces, within the so-called PSM analytical framework (Fernandez and Palazuelos, 2012), which has proved to be fertile in understanding the functioning and evolutionary path of complex energy systems; and then
b) assessing quantitatively the economic impacts of alternative regulatory, infra-structure or security of supply scenarios by market simulation using a computational model (CBR-EGM) developed by the authors at MRC Consultants Ltd for applied purposes (MRC, 2018); the CBR-EGM was designed to overcome some of the most critical limitations of commonly used models (largely related to unrealistic assumptions).
Methods & Results Applied methodology and modelling techniques The PSM framework (PSM) is based on three components: major players (P), geographical scenarios (S), and exchange mechanisms (M). P are companies and other players which act on gas supply, demand and exchange. S are the regions where supply and demand are physically

18
Session 02 - The gas market: new perspectives?
concentrated, which, if production and consumption areas do not coincide, lead to international gas trade. P may have different degrees of control or influence on supply (production- exports) and demand (consumption-imports) scenarios. Finally, M are to be intended as instruments used by players to organize and conduct the gas exchange between the supply and demand scenarios, notably trading contracts and pricing systems. The PSM, among other things, has provided the authors with the theoretical justification for the choice of the functional form, equation specification and equilibrium targets of several economic relations modelled in the CBR EGM, as well as for the selection of feasible scenarios. The CBR-EGM (Computable Bounded Rationality - European Gas Model) is a quasi-competitive (i.e. firms act as price-takers even though there may be few of them in a given market), dynamic, multi-market and multi-equilibria (i.e. multiple possible “satisficing equilibria”) model for natural gas production, trade, storage, and consumption in Europe. It explicitly includes a supply-demand representation of 35 European countries, as well as their gas storages and transportation links to each other and to the outside world. The time frame of the model is 24 consecutive months, starting in September. Market participants do not have perfect foresight over this period (bounded rationality). From a modelling perspective, bounded rationality requires less computational burdens, ensures existence of a satisficing solution and allows to tackle effectively large-scale modelling problems, where it may be difficult or very time-consuming to attain optimal solutions. A heuristic algorithm usually admits a computationally tractable solution without losing too much accuracy. According to Simon (1982), decisions are sought dynamically and terminate when a certain satisfaction threshold level is found. Results The BR-EGM algorithm reads the input data and searches for the simultaneous supply-demand satisficing equilibrium (including storage stock changes and net imports) of all local markets in all months, respecting all the constraints detailed above (e.g. limited rationality, quasi-competitive markets). For each modelled period it produces equilibrium wholesale gas prices per country, hub prices per country (wholesale prices plus domestic exit fee), consumption by country, gas flows on interconnectors, LNG inflow at regasification terminals (aggregated by country), storage stock change and import volumes through long term contracts and spot trade. This has allowed the authors to:
a) successfully reproduce a reference scenario (back-tested), corresponding to the wholesale gas market in Europe in the gas year September 2016 – August 2017, and, having calibrated the model against this,
b) assess and estimate the impact of alternative regulatory, infrastructure or security of supply scenarios (on the market situation expected in 2020);
c) carry out a number of sensitivities, with adjustment of certain parameters and assumptions analysis to reflect anticipated development in the future.
The results appear to be largely consistent with the relevant economic theory (i.e. market efficiency theory specific to regulated utilities markets). Conclusions The hybrid market paradigm which has emerged in the European gas downstream in the last decade or so requires innovative approaches to be fruitfully investigated, both from a

19
Session 02 - The gas market: new perspectives? theoretical and applied point of view. In this regard, the models discussed in this paper appear to effectively capture some essential features of the actual market functioning and to provide promising results. The concerned simulations have been conducted with an emphasis on the concrete needs of gas industry analysts and practitioners. References Di, X. (2014). Boundedly Rational User Equilibrium: Models and Application, Doctoral Thesis,
University of Minnesota. Fernández, R. and Palazuelos, E. (2012). ‘A Political Economy Approach to the European Union Gas
Model: Continuities and Changes’. JCMS: Journal of Common Market Studies, vol. 52, nº 3, 495-511. Konoplyanik, A. (2013). ‘Evolution in Gas Pricing in Continental Europe: A View from Russia: Modernization of Indexation Formulas versus Gas-to-Gas Competition’. Oil, Gas and Energy Law Intelligence.
MRC Consultants Ltd. (2018). BR-EGM: A Bounded Rationality Computational Model for the European Gas Market. Internal Paper.
Petrovich, B. (2014). ‘European gas hubs price correlation: barriers to convergence?’. NG91 (Oxford: Oxford Institute for Energy Studies).
Simon, H. A. (1982). Models of bounded rationality: Empirically grounded economic reason. Vol. 3. MIT Press (MA).
Stern, J. and Rogers, H.V. (2014). ‘The Dynamics of a Liberalised European Gas Market: key determinants of hub prices, roles and risks of major players’. NG94 (Oxford: Oxford Institute for Energy Studies).

20
Session 02 - The gas market: new perspectives?
Marina Bertolini, Dimitrios Zormpas PLAYING ON TWO MARKETS: INVESTMENT EVALUATION OF A BIOGAS – BIO-METHANE POWER PLANT IN A SMART GRID ENVIRONMENT
Marina Bertolini, University of Padova, Dep. Economics and Management, CRIEP and Levi Cases, Via del Santo 33, Padova
Dimitrios Zormpas, University of Padova, Dep. of Mathematics and Levi Cases
Overview Renewable dispersed generation became, in the past years, source of instability and new challenges for the energy systems, with an impact on related markets and their regulation. Moreover, the entrance of new plants was mainly driven by huge incentives that are now ending: investing in (or revamping) small energy power plants seems not to be profitable anymore. On one hand, the development of a Smart grid could solve problems connected to system management but, on the other, there still is the need to create market conditions to stimulate new investments and keep existing plants on the market once the incentives end. Grid technological improvements can be the way to promote new investments, enabling small power plants to participate in the market (or markets) and gain new profits. The aim of the work is to analyze the private decision to invest in a biogas-bio-methane power plant that can play on both gas market and local electricity market. The plant produces bio-methane but, thanks to the smart grid, it has possibility to play also on local electricity market when it is profitable (e.g. because of balancing needs). In other words, the plant under evaluation embeds an option to switch between markets than enhance its value: the scope of the evaluation is to find the conditions at which it is profitable to invest in the plant in absence of incentives. The paper contributes to the literature on investment evaluation under uncertainty, particularly relevant in the changing environment of energy production and management. Moreover, results of the evaluation are relevant to two main research discussions: the first one is the related to the way in which the Smart grid will affect energy markets and their re-organization – which, in this case, are both electricity and gas markets. The second one regards the role of the Smart grid as a policy instrument, since it drives energy production investments in terms of time of investment, dimension, typology, location, etc.. Methods The analysis focuses on a small investor that decides whether to invest in a biogas power plant equipped with an additional plant section to produce biomethane. The upgrading technology is not an option: it is embedded in the investment decision. The investor is a pure producer (not a prosumer) and the dimension of the plant is limited and cannot influence market prices. The power plant under examination is made up by: A digestor for biogas production; A co-generator for electricity production, connected to the local distribution grid, which
is a smart grid. Being smart, the grid integrates its resources: it can deliver price signals to the producer, allowing him to react and participate to the local electricity market;
An upgrading technology for bio-methane production, with a direct connection to the gas line, where the bio-methane is injected after the refinery process.

21
Session 02 - The gas market: new perspective
The plant is flexible: while running, it can easily switch from the bio-methane production to the biogas production and vice versa (reversible option), with no switching costs. The different production is merely determined by cutting the process earlier when it is more convenient to produce electricity through biogas, rather than to continue with the refinery process and sell bio-methane. Given the characteristics of the two commodities, in standard conditions we expect to run the plant for bio-methane production, and to switch to electricity production to cover electricity peak demand. The mechanism works following a sort of “spark spread”, i.e. the differential between the price of 1 unit of electricity and the price of the gas needed to generate that unit, calculated on a local electricity market and on the two different prices for gas (biogas and bio- methane). It is worth mentioning that we could also use bio-methane to produce electricity, avoiding the decision to use the gas before the refinery process. In this case, the investment decision is taken considering the two alternative uses of the bio-methane: this evaluation will be presented in the work, but a preliminary analysis on bio-methane production costs, and especially those related to electricity consumption, seems to indicate that this alternative will be dominated by the biogas electricity production. The investment will be evaluated with a real option approach, to better capture the value generated by plant flexibilities [real option model, profit maximization]. Results The result of the analysis will be mainly driven by differences between natural gas price and electricity price and differences between biogas and bio-methane production costs (and in performances in electricity production). Considering price differences, to evaluate the investment we are looking at a sort of spark spread, i.e. “the difference between the price received by a generator for electricity produced and the cost of the natural gas needed to produce that electricity”(U.S. Energy Information Administration, 2013). In the case of the biogas – bio-methane power plant, we are interested in the opportunity cost of producing electricity instead of bio-methane (and vice versa, given the reversibility of the option). Considering the smart grid environment in which small power plant will be integrated, local electricity prices (zonal prices) seem to be a good reference for model simulation, since they somehow reflect grid needs that could be manage by local agents. In this work, Italian zonal electricity prices for six different evaluations along the Italian territory will be used. Biomethane price is set at national level. Conclusions The decarbonization of energy systems is a relevant target for Europe and all the member states. In the recent past, a huge amount of incentives makes people invest in RES power plants, increasing the renewable production but raising the need for a smart grid to allow for an efficient integration of new plants. We are now handling with a long debate about smart grid technologies, but we must investigate if plants will be still there when we implement the smart grid. In absence of incentives, plants profitability is low (or absent) and there is the risk of a drop in renewable production after the incentive period. A drop in RES production will cause a step back in EU energy policies and the value of having a smart grid will be considerably reduced. Adding the possibility to participate in the market, we enable new managerial flexibilities for the plant owners: with the valorization of new flexibilities, we can find parameters for investment profitability even in absence of incentives.

22
Session 02 - The gas market: new perspective
Differently from other energy sources, e.g. solar (Bertolini et al., 2018), biogas plants have the possibility to predict their production and manage it playing on two different markets, and this can be a way to make this technology attractive for small investors. In this sense, investments in the grid are not only needed, but they can also be seen as a necessary way to keep small producers in the market and to stimulate new investments, opening to a second phase of regulation through market design. Market design and functioning will be a fundamental step for further researches: Effects on the market of a coordinated actions of small producers: a number of small
producers playing on a grid do influence prices and equilibria; Differences in local characteristics in terms of plant presence and demand lead to
differences in local energy markets; With respect to the smart grid development, market composition will influence optimal
investment strategies and policies. References Banshwara A., Sharma N. K., Sood Y.R., Shrivastavad R., 2017. “Renewable energy sources as a new
participant in ancillary service markets” in Energy Strategy Reviews, Volume 18, December 2017, Pages 106-120
Belli G., Brusco G., Burgio A., Menniti D., Pinnarelli A., Sorrentino N., 2017.”Imbalances costs of small scale renewable not dispatchable power plants in the Italian electricity market” in: 14th International Conference on the European Energy Market, EEM 2017, Article number 7981895. DOI: 10.1109/EEM.2017.7981895, Dresden, Germany, 2017.
Bertolini M., D'Alpaos C., Moretto M., 2018 "Do Smart Grids Boost Investments in Domestic PV Plants? Evidence from the Italian Electricity Market" in Energy, Volume 149, 15 April 2018, Pages 890-902 .
https://doi.org/10.1016/j.energy.2018.02.038 Burgio A., Brusco G., Menniti D., Pinnarelli A., Sorrentino N., Vizza P., 2017. “ Economic evaluation in
using storage to reduce imbalance costs of renewable sources power plants, in: 14th International Conference on the European Energy Market, EEM 2017, Article number 7981982. DOI:10.1109/EEM.2017.7981982, Dresden, Germany, 2017.
Coppo, M., Cappelletto, F., Caldon, R., Turri, R., Natale, N., Pilo, F., Pisano, G., Soma, G.G., 2017. “Ancillary services by DG and storage systems in distribution networks for energy market participation” AEIT 2016 - International Annual Conference: Sustainable Development in the Mediterranean Area, Energy and ICT Networks of the Future, DOI: 10.23919/AEIT.2016.7892746
Hoff, H. Wenger, B. Farmer, Distributed generation - an alternative to electric utility investments capacity, Energy Policy 24(2) (1996) 137–147
Fernandes B., Cunha J. and Ferreira P. (2011). The use of real options approach in energy sector investments, Renewable and Sustainable Energy Reviews, 15, 4491-4497
Fleten, K. Maribu, I. Wangensteen, Optimal investment strategies in decentralized renewable power generation under uncertainty, Energy 32 (2007) 803–815.
Martinez Cesena E.A.M., Mutale J. and Rivas-Davalos F. (2013). Real options theory applied to electricity generation projects: A review, Renewable and Sustainable Energy Reviews, 19, 573.581.
McPherson M., Tahseen S., 2018. “Deploying storage assets to facilitate variable renewable energy integration: The impacts of grid flexibility, renewable penetration, and market structure” in Energy, Volume 145, 15 February 2018, Pages 856-870
Puglisi C., Stabile M., Cabano M., 2017. “Cost saving due to imbalances reduction in the italian ancillary services market, in: Proccedings of the 6th International Conference on Clean Electrical Power: Renewable Energy Resources Impact ICCEP 2017, DOI: 10.1109/ICCEP.2017.8004844, Santa Margherita Ligure, Italy, 2017, pp. 384–391.
Schachter J., Mancarella P., 2016. “A critical review of real options thinking for valuing investment flexibility in smart grids and low carbon energy systems” in Renewable and Sustainable Energy Reviews 56 (2016) 261–271

23
Session 03 - The energy-environment
Elena Fumagalli, Matteo Rocco LOW-CARBON ELECTRICITY GENERATION SCENARIOS FOR TANZANIA: IMPLICATIONS FOR THE COUNTRY’S ECONOMY AND THE ENVIRONMENT
Matteo Rocco, Dep. of Energy, Politecnico di Milano, via Lambruschini 4, 20156 Milano, Italy Elena Fumagalli, Dep. of Management, Economics and Industrial Engineering, Politecnico di Milano,
via Lambruschini 4/b, 20156 Milano, Italy
Overview The causal relation between the use of energy and the economic development of a country is complex topic. In the case of the United Republic of Tanzania, a significant economic growth was registered over the past decade, in the order of 7% of annual GDP. Nevertheless, the electrification rate was only 33% in 2016 (the weighted average of a 65% in urban areas and 17% in rural regions) and it would appear that the consumption of electricity remains limited by a significant lack of infrastructure for power generation and delivery (IEA, 2017). Recent governments have formulated plans and strategies to overcome this issue. Indeed, the country is now looking at energy independence and energy security, relying on local natural resources and imports as well, to guarantee a balanced expansion and diversification of power generation technologies and to increase the share of population with access to modern energy (IRENA, 2016). In this work, the economic and environmental economy-wide consequences of three prospected electricity development scenarios in Tanzania are assessed over the period 2015-2030. The considered scenarios are based on both International Energy Agency (IEA) and Tanzanian government projections (IEA, 2017; URT, 2016). Impact of the prospected scenarios is captured by means of the change in total primary non-renewable energy supply of each economic segment, and the overall primary energy intensity per unit of GDP. On the one hand, our findings are highly supportive of the government plan to decarbonize the electricity sector. We show that the expected impact of such a policy scenario on both indicators is highly significant. On the other hand, we show that a focus in the electricity sector alone is insufficient to achieve more ambitious goals in terms of reductions in primary energy use and GHG emissions, while enabling economic growth and increasing the country’s electrification rate. Method This work relies on an Input-Output (I-O) model of the Tanzanian economy. As known, I-O models assume no technological change and no substitutability between inputs, resulting in a matrix of fixed technological coefficients linking primary resources to total domestic production. While these assumptions limit their forecasting accuracy, their flexibility has made them a widely-adopted tool for modeling national and regional economies and estimating broad economic outcomes and policy change implications within a given system’s boundary (Hamilton and Kelly, 2017). To construct an I-O model for Tanzania we use publicly available data and, in particular, we rely on the EORA database to extract the latest (2013) yearly economic transactions for the country (Lenzen et al., 2013). Then, using data from the International Energy Agency, we proceed to transform the monetary EORA table into a hybrid units table, where information on the electricity sector are provided in physical units while the rest of the transactions of non-energy sectors are in monetary currency.

24
Session 03 - The energy-environment
Furthermore, the energy sector has been disaggregated by distinguishing several electricity production technologies according to a standard disaggregation protocol (Lindner et al., 2013), relying on country budget updated with information regarding the levelized cost of electricity for different technologies (OECD Nuclear Energy Agency, 2010). Finally, a forecast of GDP growth was derived using a simple linear relationship with the country’s latest projection on electricity demand growth (Omri, 2014). To gain insight into the implications of future development in the electricity sector, the I-O model was coupled with three different scenarios based on IEA projections and national development plans. A Business- As-Usual (BAU) scenario captures the electricity development path under the assumption that no new policies are enacted and constitutes our baseline. The New Policy (NP) scenario internalizes the most recent government’s objectives and planned projects. The so-called 450TZ scenario represents the least-carbon intensive pathway, dominated by renewable energy. Results For each scenario, primary non-renewable energy supply and energy intensity of the GDP unit are derived for each five-year interval between 2015 and 2030. A comparison across scenarios shows a country-wide reduction in the primary non-renewable energy use of, respectively, 10% and 6% in the 450TZ and NP scenarios with respect to the baseline scenario in 2030. As for the electricity sector’s use of primary energy, this decreases from 30% of the total primary energy use of the country in 2015 to 27% and 28% in 2030 for the 450TZ and the NP scenarios, respectively. When measured with respect to the baseline, this reduction is significantly larger in the 450TZ (32%) than in NP scenario (19%). Nevertheless, the decrease in energy intensity in the 450TZ and the NP scenarios in relation to the BAU are significantly lower for the other sectors in the economy. When primary energy intensity of the GDP unit is considered and compared with GDP growth, we find that both the 450TZ and the NP electricity development paths conduct to a decoupling between the economic growth of the country and its energy intensity. Finally, considering each five-year interval, we quantify the contribution of each GW of renewable installed capacity in reducing the primary energy intensity of the GPD unit. This indicator, which can be interpreted as the real effectiveness of renewables in displacing non-renewable energy sources, significantly decreases up to 2020 and remains constant afterwards, suggesting that efforts to further reduce primary energy use should be directed to other energy intensive sector of economy as well (e.g., transportation). Conclusions This work explores the impact on the Tanzanian economy and its environment of the expected development of the electricity sector between 2015 and 2030. For this purpose, a hybrid I-O model of the country’s economy was constructed and combined with three different scenarios for the development of the power generation sector representing different levels of renewable energy sources in the generation mix. Efforts to decarbonize the electricity generation sector appear effective in reducing its energy intensity and contribution to the country’s GHG emissions. Moreover, they are instrumental in detaching the economic growth of the country from its primary energy use, at least in the medium-term. Nevertheless, to achieve a more significant reduction in the use of primary energy at country-level and/or to limit the growth in GHG emissions over time as the economy growth, it would be important to target other sector of the economy as well – for instance the transport sector, currently the highest contributor to energy intensity and GHG emissions.

25
Session 03 - The energy-environment
Further work should consider the effect of additional policies promoting reductions in energy intensity and GHG emissions across all sectors of the economy, such as measures directed at energy efficiency and/or incentive-based instruments designed to curb carbon emissions. References Hamilton, T.G.A., Kelly, S., 2017. Low carbon energy scenarios for sub-Saharan Africa: An input-output
analysis on the effects of universal energy access and economic growth. Energy Policy. https://doi.org/10.1016/j.enpol.2017.02.012
IEA, 2017. World Energy Outlook 2017. Int. Energy Agency Paris, Fr. 1–15. https://doi.org/10.1016/0301- 4215(73)90024-4 IRENA, 2016. Renewables Readiness Assessment Tanzania, Renewables Readiness Assessment:
Tanzania. Lenzen, M., Moran, D., Kanemoto, K., Geschke, A., 2013. Building EORA: a global multi-region Input-output Database at High Country and Sector Resolution. Econ. Syst. Res. 25, 20–49. https://doi.org/10.1080/09535314.2013.769938
Lindner, S., Legault, J., Guan, D., 2013. Disaggregating the Electricity Sector of China’s Input–output Table for Improved Environmental Life-Cycle Assessment. Econ.
Syst. Res. 25, 300–320. https://doi.org/10.1080/09535314.2012.746646 OECD Nuclear Energy Agency, 2010. Projected Costs of Generating Electricity, Atomic Energy.
https://doi.org/10.1787/9789264084315-en Omri, A., 2014. An international literature survey on energy-economic growth nexus: Evidence from
country-specific studies. Renew. Sustain. Energy Rev. https://doi.org/10.1016/j.rser.2014.07.084 URT, 2016. National Five Year Development Plan 2016/17 - 2020/21. Minist. Financ. Plan.

26
Session 03 - The energy-environment Eliot Romano, Pierre Hollmuller, Martin K. Patel REAL-TIME CARBON-EMISSIONS AND CONSUMER RESPONSIBILITY - A MARGINAL APPROACH FOR AN OPEN ECONOMY: THE CASE OF THE SWISS ELECTRICITY CONSUMPTION
Elliot Romano – Energy system group – Faculty of Science - University of Geneva – 66 Bld Carl-Vogt, CH-1211 Genève 4
Pierre Hollmuller – Energy system group – Faculty of Science - University of Geneva – 66 Bld Carl-Vogt, CH-1211 Genève 4
Prof. Martin K. Patel – Energy department – Faculty of Science - University of Geneva – 66 Bld Carl-Vogt, CH-1211 Genève 4
Overview Electricity generation is a major source of the global greenhouse gas emissions [CHG]. At the European level, the sector contributed to approximately 25.8% of the global CHG emissions during the year 2015. In Switzerland, over the same period, the share of GHG emissions emanating from electricity generation represented 1.4 % of the country’s global emissions, as most of his electricity generation is issued from hydro and nuclear plants. However, as an open economy at the heart of the electricity system, the total bi-directional energy exchanges, with his European neighbors raised to 85.6 Terawatt hours (TWh) for that period, higher than the total national generation, 58.3 TWh. Electricity trade over power grids makes the measurement of greenhouse gas emissions complex. To bypass the obstacle, accounting methods usually follow the United Nations Framework Convention on Climate Change (UNFCCC), under which the GHG emissions are allocated according to the territorial and issuer principle. According to the latter principle, the CO2 emission factor from the generation mix amounts to approximatively 26 g CO2/kWh. As far as energy exchanges and market integration should be considered, a consumer responsibility method is a preferred approach to estimate the CO2 emissions from electricity consumption at a country level. The aim of the current paper is to provide an accounting framework for GHG emission factors of power consumption in an open economy, such as Switzerland. Method In Switzerland and his surrounding countries, different technologies generate electricity. They differ by their variable costs (€/MWh) and their exhausted CO2 emissions. Following international trade theory, as long as low marginal cost equipment is available in some countries, and outside congestion situation, the global welfare and benefits for market actors will increase through exchanges opportunities. In response to the demand by the importing country, the demand curve in the exporting country will shift to the right of the supply/demand equilibrium, which means that some equipment with higher marginal cost, and likely more emitting plants, will be required to satisfy the domestic demand and exports. Market integration therefore provokes an upward shift of the hourly demand curve in countries with a dominance of low variable cost equipment during most of the year. The number of hours during which those technologies are run increases and does not correspond to that when standing alone from other markets. Consequently, it also leads to different carbon emissions. Our method adopts a marginal approach and allows to measure the real-time impact of the domestic consumption on greenhouse gas emissions, by considering the electricity flows.

27
Session 03 - The energy-environment The impact is measured through the marginal effect of Swiss cross-border exchanges and demand on the generation merit-order of neighboring countries. This analysis will be carried out on an hourly basis. The data, referring to the year 2017, are issued from the ENTSO-E transparency platform, published as part of the market transparency directives to which all market stakeholders are subject. Results Results can be summarized into four main findings. First, the method describes the environmental quality of the imported energy flows from the surrounding countries. It also determines the marginal technologies which are run to comply with the demand issued by cross-border flows. German fossils fuels technologies appear to be marginal more than 45000 hours, when they come to satisfy the incremental demand due to the Swiss imports. Second, the direct emissions footprint from electricity consumption in Switzerland can be estimated. The level of emission amounts to around 130 g CO2/kWh, a figure which is five time higher than the estimated footprint under the territoriality principle. Third, results also show the temporal pattern of emissions associated with the Swiss electricity consumption for 2017. Finally, the method provides a pattern of the estimate of the CO2 emissions cutback due to the saving of a kilowatt-hour of imported electricity all over the year. Conclusions As reality of cross-border flows should be considered, the consumer responsibility method is preferred to estimate the CO2 factors from electricity consumption when electricity markets are integrated. A significative increase in the emission factor estimated through the marginal approach can be observed. The marginal method could be adopted at a national level, as it sensitizes individuals over their real-time carbon footprint. Consumers are also therefore responsible for their CO2 emissions, regardless of whether the power is produced inland or outland. References Bettle R., C. Pout & E. Hitchin (2006): Interactions between electricity-saving measures and carbon
emissions from power generation in England and Wales, Energy Policy, Volume 34, Issue 18, December 2006, Pages 3434-3446
Finon D. & Romano E. (2009): Electricity market integration: Redistribution effect versus resource reallocation, Energy Policy, Volume 37, Issue 8, August 2009, Pages 2977-2985
Hawkes, A. D. (2010): Estimating marginal CO2 emissions rates for national electricity systems, Energy Policy, Volume 38 (10), Pages 5977–5987.
Spork C., Chavez A. , Gabarrell Durany, X. , Patel, M. K. and Villalba Méndez, G. (2015), Increasing Precision in Greenhouse Gas Accounting Using Real-Time Emission Factors, Journal of Industrial Ecology, Volume 19, Number 3, 1 June 2015, pp. 380-390(11)

28
Session 03 - The energy-environment Maria Milousi, Manolis Souliotis, Emilios Galariotis, Spiros Papaefthimiou, Georgia Makridou EVALUATION OF ENVIRONMENTAL AND ECONOMIC FEASIBILITY OF RENEWABLE ENERGY SYSTEMS; A STOCHASTIC LIFE CYCLE ASSESSMENT AND COST ANALYSIS APPROACH
Maria Milousi, Spiros Papaefthimiou: Industrial, Energy and Environmental Systems Lab School of Production Engineering and Management, Technical University of Crete, Chania, Greece,
Manolis Souliotis: Department of Environmental Engineering, University of Western Macedonia, Kozani, Greece
Abstract Life Cycle Assessment (LCA) is a systematic, analytical process for assessing the environmental implications of systems or products, from raw material extraction through manufacture, use, and end of life. The term "life cycle" refers to the total time period between the acquisition of an asset and the moment that it is either fully depreciated (economic or accounting lifetime), or discarded as waste or sold on the second-hand market (technical lifetime). Though it is clear that LCA results are subject to many sources of uncertainty, it is also important to know to what extent the outcome of such an analysis is affected by various types of uncertainty (such as parameter, scenario and model uncertainty) and may occur in the goal and scope definition, the inventory analysis and the impact assessment of an LCA. Proper evaluation of the inherent uncertainties provides useful information for the reliability of LCA-based decisions and a necessary guide for future minimization of inaccuracies. The selection of a proper technique is largely based on the type and extent of details required by the specific case-study (i.e. sensitivity analysis, Monte Carlo simulation, Markov chain, Multiple linear regression, Fuzzy set theory and fuzzy logic, etc.). In addition to LCA, Life Cycle Costing (LCC) is a generic method that allows the objective comparison of various investment opportunities over their technical or economic lifetime. The LCC methodology is the economic counterpart of LCA. In combination with a life cycle assessment that investigates the environmental impact of a product or service, LCC can serve to address the economic dimension of sustainability. Further, LCC together with LCA, is part of many eco-efficiency approaches. Therefore, LCC is also integrated with LCA, a key quality handling the novelty of economic and environmental effects expected from Renewable Energy Systems. LCC has widespread applications, and can be specifically useful for the financial evaluation of projects related to energy systems (i.e. based on renewables, aiming at energy efficiency, etc). A stochastic LCC analysis allows the identification of the numerous variabilities and uncertainties inherent in the LCC process, and specification of those that pose the largest risk. The incorporation of qualitative and quantitative risk analysis in LCC can help towards the anticipation of the impacts due to risks and uncertainties and assist the final decision-policy making processes. There have been several attempts to spot and highlight various statistical-stochastic uncertainties in LCA, as they are increasingly affecting the relevant methodologies, databases and software.

29
Session 03 - The energy-environment The paper will contain a detailed review of such case studies, mainly focusing on Renewable Energy Systems (e.g. solar, wind, geothermal) as their inventories typically lack of site-specific data (i.e. weather parameters) and rely on the aggregation of information gathered over different spatial and temporal scales. The uncertainties incorporated in already completed studies will be identified and validated and the advanced software RETScreen and SimaPro accompanied with the updated Ecoinvent database will be used for the implementation of specific LCA and LCC case studies. The aim of this study is to provide to the researchers a useful guide for the combined applicability of the LCA and LCC methods to such technologies and to present an extended analysis of the advantages and disadvantages of these technologies for simultaneous production of electricity and heat. References "Sima Pro" 2018, available at: simapro.com. "RETScreen Expert" 2018, available at: www.nrcan.gc.ca/energy/software-tools/7465. T. E. Swarr et al., "Environmental life-cycle costing: A code of practice", International Journal of Life
Cycle Assessment, 2011. J. B. Guinée et al., "Life cycle assessment: past, present, and future", Environ. Sci. Technol., (2011) 45(1)
90-96. [5] EN ISO 14040, "Environmental management - Life cycle assessment - Principles and framework", 2006.

30
Session 03 - The energy-environment Ryan Timothy Brown AREVA, EDF, AND THE ECONOMIC VIABILITY OF THE CLOSED FUEL CYCLE
Ryan T. Brown, M.A.; M.G.P.S, 39 Quai Charles Page, 1205, Geneve, CH
Spent fuel reprocessing was initially invented during World War II for the purpose of nuclear weapons production. The closed fuel cycle gained acceptance for civilian power generation shortly after and through the 1970s due to the belief that deposits of uranium were too scarce to be wasted in a once through fuel cycle. The 1974 Indian Smiling Buddha nuclear test changed the viewpoint of many, including the United States, regarding a closed fuel cycle because it revealed that ostensibly “peaceful” plutonium could be used to make nuclear weapons. It soon became broadly accepted that reprocessing was a proliferation risk and that steps were needed to reduce the risk that sharing the nuclear technology of the closed fuel cycle would lead to catastrophe. Shortly thereafter, the Carter administration moved the US toward a once-through fuel cycle so that it could not be called hypocritical when it pushed other countries to do the same. President Reagan did not share this concern and so removed the ban on domestic reprocessing for energy production, but the only proposed reprocessing plant was shuttered because his administration also refused to subsidize the uneconomic closed fuel cycle. Still, even today, skeptics dismiss the security risks associated with plutonium and advocate reprocessing, claiming that current projections for uranium use are too short-sighted and that a closed fuel cycle is necessary to extend the use of the current uranium stock for thousands of years1.
Surprisingly, the French government does not share US concerns with regard to the closed fuel cycle. France’s facilities that today reprocess spent fuel were first built to support the French effort to produce nuclear weapons. These investments could have been abandoned, but instead of taking them as a loss, the French state created the largest reprocessing facility in the world, La Hague, and is the leader in uranium-plutonium “mixed oxide” (MOX) fuel production. The French state-owned energy company, Areva, provides reprocessing services for Électricité de France (EDF), the domestic utility company, and has done so for the utilities of other countries, including Germany, Japan, Belgium, Italy, the Netherlands, and Switzerland.
More recently, these other countries have all made moves away from nuclear power in recent years, and the economic viability of the closed fuel cycle is again being questioned. Some states, such as South Korea, believe that reprocessing is necessary to provide energy security due to the country’s lack of fossil fuel resources. Japan, which is in a similar position lacking domestic uranium or fossil fuel resources, has moved away from nuclear energy after the Fukushima disaster. Areva’s European clients, many of whom been exploring alternatives to nuclear energy, found the Fukushima disaster solidified their customers’ skepticism of nuclear power and the closed fuel cycle. _____________________________ 1 Baldev Raj and P. R. Vasudeva Rao, “Plutonium reprocessing, breeder reactors, and decades of debate”, Bulletin of Atomic Scientists, 71(2015): 14-17.

31
Session 03 - The energy-environment
This paper assesses the economic viability of Areva’s reprocessing services as its foreign clients have moved away from nuclear power production. The reprocessing services of Areva were bolstered by the prices it could charge its foreign clients, given that it was one of only a few companies that provided spent fuel treatment and MOX production. The loss of European clients due to domestic opposition to nuclear energy and the loss of Japanese business after the Fukushima disaster have made Areva’s recycling division uneconomical. Areva was able to charge substantial prices to these clients, but now that EDF is essentially its only client for reprocessing and MOX fuel fabrication, the recycling division is operating at a loss. EDF and Areva are both owned by the French state and, thus, Areva cannot overcharge for its services. The unprofitable nature of the closed fuel cycle has become a cost paid for by the French people, and countries that plan to construct reprocessing facilities should take note.

32
Session 04 - The multiple paths of electricity: new challenges
Alessandra Motz THE VALUE OF SECURITY FOR SWISS RESIDENTIAL ELECTRICITY CONSUMERS – A DISCRETE CHOICE ANALYSIS
Alessandra Motz, Università della Svizzera italiana, Switzerland
Overview The Swiss electricity system was historically characterized by high levels of security and low greenhouse gas emissions, thanks to the combination of hydroelectric and nuclear-based generation plants, and a transmission grid able to accommodate relatively stable national and international flows. In the last few years, however, these favourable conditions have been challenged by the decision of the Federal Council and Parliament to decommission nuclear plants by 2035 and give a fresh impetus to new, low-carbon generation capacities. The practical implementation of nuclear decommissioning and energy transition in Switzerland within the context of an increased integration of European electricity markets, with EU Member States also implementing ambitious emissions’ reduction plans, will require substantial investment in new generation capacity, as well as an expansion and upgrading of transmission and distribution grids. Indeed, the Swiss Energy Strategy 2050 in force since January 2018 sets ambitious renewable generation targets, outlines improved framework conditions for grid upgrading and expansion, and calls for the roll-out of smart meters among all consumption segments. The same Strategy recognizes however the possible hindrances to the implementation of these plans stemming from public opposition to new generation, transmission and distribution infrastructures. Aim of this research is contributing to the debate concerning the optimal level of security of electricity supplies to Swiss households and the kind of investment needed within the Confederation. We assess household consumers’ preferences toward the risk of short and long blackouts, while accounting for their preferences toward the use of specific primary energy sources for generating electricity. This information could support policy makers in defining the optimal level of security for society and, given the recent technological advances allowing demand response from small consumers, could help electricity retailers in designing customized supply contracts, targeted on the blackout aversion and the green attitudes of specific consumer classes. Methods The analysis is conducted by means of a Discrete Choice (DC) experiment on stated preferences. The DC experiment was administered by means of a web-based survey collected on a stratified sample of 1006 Swiss households in 2015. In each choice task the respondents were asked to choose the electricity supply contract they would have been ready to sign for their own dwelling out of a set of five mutually exclusive alternatives, differing by electricity price per kWh, risk of short and long blackouts, and primary energy source used for generation. In addition to the choice tasks, the survey also included questions on the respondent’s demographic characteristics, energy- related habits, and attitudes and opinions toward energy production and consumption, environmental pollution, climate change, and economic impacts of outages and electricity price increases.

33
Session 04 - The multiple paths of electricity: new challenges
DC models assess the impact of variations in specific attributes of the available alternatives on the choice probability for each alternative. By allowing the inclusion of all the relevant attributes of each alternative, as well as demographic and behavioural variables for the respondents, DC models enable the researcher to compare the impact of different attributes on choice probabilities, while accounting for individual-specific characteristics. Several model specifications are being tested and evaluated: a multinomial logit model, a random parameter model, a latent class model, and finally a latent class model with psychometric indicators. All models account for the respondents’ preferences toward the risk of experiencing short or long blackouts, toward specific primary energy sources, and toward electricity price variations, and include the relevant demographic and behavioural variables. The latent class model with psychometric indicators also accounts for attitudinal traits, as measured by responses to psychometric indicators. The respondent’s Willingness-to-Pay (WTP) for avoiding an additional blackout – or the Willingness-to-Accept (WTA) for accepting it – is estimated by computing the ratio between the estimated blackout coefficients and price coefficients. Results Estimates obtained from the multinomial logit and random parameter specifications suggest that the WTP for a further improvement in security above the current level is null, whereas the WTA for avoiding an increase in the frequency of interruptions is around 1.6%-5.9% of 2014 electricity prices for short interruptions, 9.0%-24.0% for long interruptions.

34
Session 04 - The multiple paths of electricity: new challenges Amedeo Argentiero, Simona Bigerna, Maria Chiara D’Errico, Silvia Micheli, Paolo Polinori MEASURING UNOBSERVED ECONOMY THROUGH ELECTRICITY DEMAND
Amedeo Argentiero, Simona Bigerna, Carlo Andrea Bollino, Maria Chiara D’Errico, Silvia Micheli, Paolo Polinori, University of Perugia, Department of Economics, Perugia, Italy
Abstract Recent research on unobserved economy highlights that the phenomenon is increasing worldwide, thus having important implications for macroeconomic policy. Obtaining information about countries’ magnitude of the unobserved economy is crucial for making effective economic policy decisions. Our paper measures the size and development of unobserved economy in Italy using the electricity consumption method. We apply this method to a panel of 103 Italian provinces (NUTS-3 level) for the years 2004-2012. Empirical results show an increasing trend of the size of the unobserved economy, it still has an important weight on the official gross domestic product in Italy.

35
Session 04 - The multiple paths of electricity: new challenges
Sophia Kokoni AN ECONOMETRICS ANALYSIS OF RESIDENTIAL ENERGY DEMAND SATISFIED BY HEAT PUMPS: LESSONS FROM INTERNATIONAL EXPERIENCE
Sophia Kokoni, Centre for the Environment and Sustainability and Surrey Energy Economics Centre University of Surrey
Overview The residential sector is the fourth most greenhouse gas intensive sector in the EU region (EEA, 2017) being responsible for 11.5% share of total greenhouse gas emissions in all the main IPCC sectors (i.e. energy, transport, industry, agriculture, waste management, international aviation, international navigation). Decarbonisation of the energy used for heating through the electrification of the energy system could contribute towards achieving this target. Amongst potential solutions is that of heat pumps, currently used in the both the residential and the commercial sector, for space and water heating in many countries across Europe. This paper identifies the factors, e.g. energy prices, consumer expenditure, influencing demand for heat pumps in the above countries, quantifies their impact on heat pump uptake, and explores the role of policy interventions such as subsidies in shaping the heat pump market. Method The paper will address the research question by applying an econometrics model for Austria, Finland, Norway, Switzerland, Sweden, Germany, France and the UK. These eight countries have been chosen due to a number of reasons: they have well-developed heat-pump markets, but different climatic, socioeconomic, macroeconomic characteristics and consumer preferences. The model is estimated by using log-linear panel data analysis for the period 1989-2013. The model will be estimated through two steps. The statistical significance of the explanatory variables on heat pump sales will be evaluated during the first step, while during the second step the model will be augmented by adding policy (e.g. subsidies on the capital and or running costs of heat pumps) dummies for each country. Results The preliminary results show that the elasticity estimates are positive and statistically significant with regard to total expenditure and gas price while the elasticity is negative and statistically significant with regard to electricity prices. CO2 emissions and heating degree days also have a positive relationship with heat pump sales. Specifically, natural gas prices seem to have the highest impact on heat pumps sales with the highest coefficient of 3.22 followed by electricity prices with a coefficient equal to 1.41. The role of policy on the capital cost has a positive effect on heat pump sales and it is statistically significant. The time trend shows that the increase of heat pump sales is much higher after the year 2002 where time is statistically significant. Conclusions Given the importance of energy prices on heat pump sales policy makers might need to consider supportive measures with regard to electricity prices given the fact that gas prices are significantly lower than electricity prices.

36
Session 04 - The multiple paths of electricity: new challenges With regard to policies, countries like the UK could consider adopting a capital subsidy, the UK is the only country in the panel having a subsidy on the running cost of heat pumps, given the fact that they have the youngest and weakest market while in all the other countries in the panel the demand for hat pumps is much higher. References European Environment Agency (2017). Final energy consumption by sector and fuel [Online] Available
from: https://www.eea.europa.eu/data-and-maps/indicators/final-energy-consumption-by- sector-9/assessment-1
Lund, P. D. 2006. Market penetration rates of new energy technologies. Energy Policy 34, 3317-3326 [Online] Available from: http://www.sciencedirect.com/science/article/pii/S0301421505001862
Wooldridge, J.M., 2002. Econometric Analysis of Cross Section and Panel Data, The Massachusetts Institute of Twchnology, 2nd ed

37
Session 04 - The multiple paths of electricity: new challenges
Filippos Ioannidis, Kyriaki Kosmidou, Kostas Andriosopoulos MARKET DESIGN OF AN ENERGY EXCHANGE: THE CASE OF GRECCE
Filippos Ioannidis: Aristotle University of Thessaloniki, Department of Economics, Thessaloniki, Greece, Kyriaki Kosmidou: Aristotle University of Thessaloniki, Department of Economics, Thessaloniki, Greece
Kostas Andriosopoulos: ESCP Europe Business School, Department of Finance, London, UK,
Overview Driven by the liberalization of the energy market launched in the 1990s, the European Union (EU) aims to unify the internal market and achieve price convergence among all European economies. Nowadays, most of the EU countries have successfully established Power Exchanges (PXs), through which cross-border transactions are conducted in a transparent and reliable manner. Yet, several national electricity market designs denote one of the major obstacles to the construction of integral electricity market. This paper provides a comprehensive overview of prior literature related to PXs market design. Additionally, the paper identifies recent developments regarding the case of Greece, by explicitly decomposing the structure of Hellenic Energy Exchange and the markets to be formed during the upcoming period. Method This paper is a preliminary attempt to provide an updated review, by explicitly addressing two basic objectives. Initially, its prior aim is to review previous studies on the field of PXs, their market design and integration. Secondly, the study aims to present the latest developments in the Greek energy sector, accompanied by the formation of the three new markets that are going to be formed, during the next period (Day-Ahead, Intraday and Forward Markets). The present paper describes and discusses the new market codes, that are currently through the phase of public consultation. Therefore, based on the Cournot model which is designed to capture the oligopolistic market effects of the imminent reform in the wholesale electricity market, we provide a forecast analysis based on price-quantity co- movements to illustrate the potential advantages from market liberalization. Results This study described the theoretical perspective of Power Exchanges, which was separated into three discrete subjects. Initially, we reviewed the literature in terms of (i) the broad concept of PXs, (ii) their market design and, (iii) PXs imminent integration towards a single European energy market. Next, driven by the formation of Hellenic Energy Exchange (HEE), the second objective of this paper was to outline its market design and structure. Hence, we examined concepts such as bidding system modelling, auction mechanisms and order types. Additionally, we provide a comprehensive overview of the recent developments in the Greek wholesale market structure, accompanied by a careful investigation in terms of Day-Ahead, Intraday and Forward markets function. Finally, based on a Cournot simulation, we argue that the main reform of moving from a monopolistic market towards and an oligopolistic one, is expected to boost energy demand accompanied by lower market prices.

38
Session 04 - The multiple paths of electricity: new challenges Conclusions In conclusion, the establishment of HEE is undoubtedly a reform that will introduce Greece into the map of mature energy markets. The initial stages of this process have already begun, and the benefits expected to emerge followed by its formation are multiple. HEE is anticipated to act as a central risk-taking and risk-management platform for all market participants. At the same time, HEE is expected to encourage competition, guarantee transparency, enhance liquidity and finally facilitate integration with the rest European electricity markets. References ECCO-International. 2017. “Detailed Level Market Design of the Hellenic Forward, Day- Ahead and
Intraday Markets and Respective Market Codes and High-Level IT.” http://www.lagie.gr/en/regulatory-framework/consultations/consultation/article/1563/.
European Commission DG TREN. 2008. “Review and Analysis of EU Wholesale Energy Markets.” 44 (July): 1–86.
Green, R. 2001. “Markets for Electricity in Europe.” Oxford Review of Economic Policy 17 (3): 329–45. https://doi.org/10.1093/oxrep/17.3.329.
Hogan, William W. 2016. “Virtual Bidding and Electricity Market Design.” Electricity Journal 29 (5). Elsevier Inc.: 33–47. https://doi.org/10.1016/j.tej.2016.05.009
Kirschen and Strbac. 2004. Fundamentals of Power System Economics. John Wiley & Sons. https://doi.org/10.1109/MPAE.2006.1657723. Madlener, R, and M. Kaufmann. 2002. “Power Exchange Spot Market Trading in Europe: Theoretical
Consideration and Empirical Evidence.” Vol. No. 5 D5.1. Mastro, Michael. 2013. Financial Derivative and Energy Market Valuation: Theory and Implementation in
Matlab. John Wiley & Sons, INC. https://doi.org/10.1002/9781118501788. Milonas, Nikolaos. 2015. “The Establishment of an Energy Exchange in the South-East Region, and its
Contribution to Economic Growth.” Vol: 14: 663–82. Newbery, David M. 1995. “Power Markets and Market Power.” The Energy Journal Volume16 (Number
3): 39–66.

39
Session 05- Innovation for energy systems
Matteo Pelagatti, Angelica Gianfreda and Lucia Parisio TRENDS AND LONG-RUN RELATIONS IN ELECTRICITY PRICES: WHY PREFILTERING IS INEVITABLE
Matteo Pelagatti, University of Milan-Bicocca, Italy Angelica Gianfreda, Free University of Bozen, Italy
Lucia Parisio, University of Milan-Bicocca, Italy
Overview Every scholar or analyst doing empirical research on electricity prices knows that their distributional and dynamic behaviour is extremely different from the one characterizing macroeconomic and financial data. Indeed, electricity prices are highly leptokurtic, often asymmetric and the low frequency components (i.e., the trend) are generally buried into high-variance noise, which reflects the complex structure of the cost of production (e.g., technological mixes, non-continuous production functions, power plant outages, etc.), discontinuities due to grid constraints and the operators’ short-term strategies. However, a large number of empirical works on electricity prices does not take these features into consideration and apply standard least-squares/Gaussianity based econometric methods, thus, obtaining unreliable results. In this work we concentrate on testing for the presence of long-run components (i.e., trends) in scalar and vectorial time series that manifest the typical behaviour of electricity prices. Indeed, many authors support the hypothesis that electricity prices are mean-reverting because, when they apply unit-root tests, they reject the null hypothesis most of the times. Now, on a theoretical level it is hard to believe that electricity prices are not affected by gas, oil and coal prices, which are well known to behave like integrated processes; although recent empirical contributions have shown that RES are vanishing the nexus between fuel and electricity prices. When statistical results are in contradiction with theoretical considerations and common sense, a closer look at possible pitfalls in the used methods should be taken into account. Methods In the case of unit root tests, such as the Dickey Fuller (DF) and its augmented version (ADF), there are at least two possible reasons that make them unreliable when applied to electricity time series. The ADF test is based on a least-square regression and, although the asymptotic results still hold even under non-Gaussianity, in finite samples least-squares methods are well known to perform poorly with highly leptokurtic data. Moreover, the extremely heavy tails of electricity time series could even harm some moment conditions necessary to derive the asymptotic distribution of the test statistic. For applying the ADF test, all the dynamics of the time series must be well approximated by a low order autoregressive process, but the following simple discussion shows that this is not the case for electricity prices. In line with the above reasoning, we can think of electricity price time series as composed by a trend component, which reflects the dynamics of gas, coal and oil prices, and a short-memory noise component that dominates the series in the short-run. For sake of simplicity, we can think of electricity prices as the sum of a random walk and a white noise, whose variance is significantly higher than the one that drives the increments of the random walk:

40
Session 05- Innovation for energy systems
with denoting a white noise sequence with variance . Now, the first difference of such a process, that is, the quantity used in the ADF regression, is given by
which is a MA(1) process with MA coefficient. When the signal-to-noise ratio λ is low, the MA coefficient is only slighter larger than θ = -1 and the
unit root in the process yt gets almost cancelled out. Furthermore, a nearly non-invertible MA process cannot be well approximated by a finite order AR process.
Both these conditions tend to bias the ADF test towards the rejection of the null hypothesis and, this is the reason why in empirical applications many scholars and practitioners conclude that electricity price time series are mean- reverting. A similar reasoning holds also for Johansen’s cointegration test, which can be seen as the multivariate generalization of the ADF. Results In this study, using a battery of Monte Carlo simulations we demonstrate how serious this bias towards stationarity issue is in data generating processes that reproduce the dynamic features of electricity prices. Furthermore, we analyse how the performance of the ADF and Johansen tests improve when these time series are pre-filtered using each of the following three approaches: 1. the frequency of the time series is reduced by taking means; 2. the frequency of the time series is reduced by taking medians; 3. the high-frequency noise of the time series is reduced using a decomposition of the signal based on unobserved component models. Conclusions We anticipate that all these filtering methods improve the performance of ADF and Johansen’s test, but the third one seems to be the most effective.

41
Session 05- Innovation for energy systems
Samuel Carrara, Michela Bevione, Harmen-Sytze de Boer, David Gernaat, Silvana Mima, Robert C. Pietzcker, Massimo Tavoni EXPLORING PATHWAYS OF SOLAR PV LEARNING IN INTEGRATED ASSESSMENT MODELS
Samuel Carrara, Fondazione Eni Enrico Mattei (FEEM), Milano, Italy, and Renewable and Appropriate Energy Laboratory (RAEL), University of California, Berkeley, USA
Michela Bevione, INRIA,Grenoble, France, and Fondazione Eni Enrico Mattei (FEEM), Milano, Italy Harmen-Sytze de Boer, PBL Netherlands Environmental Assessment Agency, Den Haag, the Netherlands
David Gernaat, PBL Netherlands Environmental Assessment Agency, Den Haag, the Netherlands Silvana Mima, Univ. Grenoble Alpes, CNRS, INP, INRA, GAEL, Grenoble, France
Robert C. Pietzcker, Potsdam Institute for Climate Impact Research, Potsdam, Germany Massimo Tavoni, Fondazione Eni Enrico Mattei (FEEM), Centro Euro-Mediterraneo sui Cambiamenti
Climatici (CMCC), and Politecnico di Milano, Milano, Italy
Overview The importance of solar PhotoVoltaics (PV) as a power technology has rapidly grown in the last years and now it is indisputable that it will play a major role in the future energy scenario. One of the most important factors influencing PV penetration in the electricity mix is its investment cost. This cost decreased quite regularly in the past and this trend is expected to continue in the next decades. However, substantial uncertainty still remains on the actual future cost evolution and on the consequent impacts on PV diffusion. Based on this consideration, a modeling scenario exercise has been set up which aims at exploring the impacts of the different cost patterns on PV penetration in the electricity mix and on other relevant variables. The objective of the exercise is twofold: From a policy-relevancy perspective, explore different scenarios related to the possible
future cost patterns of the solar PV technology. From a modeling perspective, assess the responsiveness of models to changes in the cost
data input. This extended abstract briefly describes the exercise and some illustrative results from the preliminary set of runs. Methods The investment cost evolution for renewable power technologies in Integrated Assessment Models (IAMs) is often modeled through an endogenous learning process, and in particular according to a one-factor learning curve (learning-by-doing), where the cost decreases over time thanks to the experience gained with progressive deployment. In formula: where the ratio between the capital cost at time t (CCt) and the initial one (CC1) depends on the ratio between the cumulative capacity at time t (Kt) and the initial one (K1) to the negative power of a parameter (b), which measures the strength of the learning effect. It relates to the learning rate, LR, which measures the rate at which unit costs decrease for each doubling of the cumulative capacity, through the following relationship:

42
Session 05- Innovation for energy systems
LR = 1-2-b. Thus, a 20% learning rate means that when the cumulative installed capacity doubles compared to the initial level, technology costs fall by 20%. Normally models also include a floor cost to set a minimum price below which investment costs cannot fall. In most models, this value is not implemented as a hard bound, but rather it is subtracted from the initial cost in order to highlight the part of the initial cost which actually undergoes learning: Four IAMs agreed to take part in the exercise: IMAGE (de Boer and van Vuuren, 2017), POLES (Després et al., 2017), REMIND (Ueckerdt et al., 2017) and WITCH (Carrara and Marangoni, 2017). All these models implement the modeling scheme described above, with clear benefits for the exercise coherence. The exercise consists in a simple sensitivity analysis on the two main learning parameters: the learning rate and the floor cost. In particular, a matrix of ten cost scenarios is considered: 5 learning rate cases (Very High, High, Ref, Low, Very Low) x 2 floor cost cases (W/, W/o) These scenarios are explored in a standard mitigation policy, where a carbon tax is applied in order to achieve a long-term target of limiting the temperature increase in 2100 with respect to the pre-industrial levels below 2˚C with a likely chance. Such a mitigation policy is taken into account in order to analyze a scenario where PV penetration is predictably considerable. In detail, the tax starts in 2020 and is calibrated as to reach a global cumulative amount of CO2
emissions equal to 1000 Gt in the period 2011-2100 in the reference scenario. The same tax is then applied to all the other mitigation scenarios. No further sensitivity analysis is conducted on the policy dimension, since this aspect is not within the scope of this work (and in any case it has been thoroughly addressed in many other research works). A baseline case (no policy) is simply added for benchmarking purposes. The choice of the ±50% cases derives from an empirical estimate on the PV learning rate (Witajewski-Baltvilks et al., 2015) which identifies 10%, 19%, and 29% as the 5th, 50th, and 95th percentile of the relevant distribution, respectively. Thus, they substantially represent the boundaries of the distribution. The ±25% cases are intermediate scenarios. The reference learning rate is meant to be the default one of the single models. The no floor cost case, especially if coupled with high learning rates, might well lead to an extreme condition where the PV investment cost approaches zero. This is obviously a hardly policy-relevant scenario, but it can be considered an interesting model-stressing case-study. Results This section only reports a couple of illustrative results from the exercise. The first submission has recently been completed, and the analysis of the relevant results is currently under way. All models except POLES show a robust behavior concerning capital cost, as this spans the range 80-1000 $/kW in 2100 in the considered scenarios. The lower bound of this range is a very low cost, hardly reachable in reality, but it can be interesting to stress models in these extreme conditions. POLES, instead, shows a more pessimistic behavior: under no cases does PV capital cost fall below 1100 $/kW in this model. The global penetration of solar PV in the electricity mix markedly varies across scenarios, and across models as well, despite the coherence in the cost evolution mentioned above. It is interesting to see that REMIND, which shows the highest PV penetration levels, is the model showing the highest sensitivity to learning rates as well.

43
Session 05- Innovation for energy systems On the opposite extreme, not only is POLES the model generating the lowest penetration levels, but it is also characterized by essentially no elasticity (partly due to the low elasticity shown in capital costs). WITCH and IMAGE show an intermediate and very similar behavior. If focus is moved from the mere PV share to the whole VRE (Variable Renewable Energies, i.e. wind and solar PV and CSP, Concentrated Solar Power) share, it can be observed that sensitivity to learning rates diminishes, thus proving that the higher/lower PV penetration occurs to the detriment/benefit of wind and CSP. In general, models tend to show higher sensitivity to lower learning rates than to higher learning rates. Conclusions As anticipated, these are very simple illustrative results. A detailed analysis of the results will be conducted in the next months. A number of statistical analyses will be carried out, and the relevant conclusions concerning i) the future PV penetration depending on capital cost and ii) the models response to challenging scenarios will be drawn and discussed. References Carrara, S., and Marangoni G. (2017). Including system integration of Variable Renewable Energies in a
Constant Elasticity of Substitution framework: the case of the WITCH model, Energy Economics, Vol. 64, pp. 612-626
de Boer, H.S., and van Vuuren, D.P. (2017). Representation of variable renewable energy sources in TIMER, an aggregated energy system simulation model, Energy Economics, Vol. 64, pp. 600-611
Després, J., Mima, S., Kitous, A., Criqui, P., Hadjsaid, N., and Noirot, I. (2017). Storage as a flexibility option in power systems with high shares of variable renewable energy sources: a POLES-based analysis, Energy Economics, Vol. 64, pp. 638-650
Ueckerdt, F., Pietzcker, R.C., Scholz, Y., Stetter, D., Giannousakis, A., and Luderer, G. (2017). Decarbonizing global power supply under region-specific consideration of challenges and options of integrating variable renewables in the REMIND model, Energy Economics, Vol. 64, pp. 665-684
Witajewski-Baltvilks, J., Verdolini, E., and Tavoni, M. (2015). Bending the learning curve, Energy Economics, Vol. 52, pp. S86-S99

44
Session 05- Innovation for energy systems
Sergio Giaccaria, Alberto Longo, Thijs Bouman, Tilemahos Efthimiadis VALUING (IN) SECURITY OF ELECTRICITY SUPPLY: A DISCRETE CHOICE EXPERIMENT FOR ESTONIA, THE NETHERLANDS AND PORTUGAL
Sergio Giaccaria: Joint Research Centre – European Commission. Unit C3: Energy Security, Distribution and Markets, Westerduinweg 3 1755 LE Petten, The Netherlands
Alberto Longo: Queen University Belfas, U.K. Thijs Bouman: Faculty of Behavioural and Social Sciences, University of Groeningen.
PO Box 72 9700 AB Groningen, the Netherlands Tilemahos Efthimiadis: Joint Research Centre – European Commission. Unit C3: Energy Security,
Distribution and Markets, Westerduinweg 3 1755 LE Petten, The Netherlands Overview The access to energy services through electricity is a key factor in determining the development of modern economies. Re-thinking the interactions among climate-industrial and energy policies in the view of a transition toward a low carbon economy has brought to the attention in EU countries the needs of warranting reliability of electricity supply, alleviating forms of energy poverty even in developed economies, promoting engagement of final consumers. As indicator of the social benefits of reliability, we present a discrete choice experiment (DCE) providing estimates of the Value of Lost Load (VoLL). It represents the value consumers place on the unserved energy, in case of a disruption of energy supply. VoLL is broadly used by industry and regulators for benchmarking the operating conditions of an energy (power) system. The perceived worth of the reliability of the energy system can be used for assessing the economic convenience of future improvements, or to assess the damages caused by disruptions. The presented in the paper provides evidence for power outages scenarios in Estonia, the Netherlands and Portugal, exploring which is the role of variables as drivers of the perceived damage from black-outs. Method The Discrete Choice Experiments (DCE) applied to the analysis of the preferences of energy users is based on the theoretical framework of Random Utility Theory. In the choice exercises proposed through the interview, respondent has n>2 mutually alternative scenarios. Each alternative is described through quantitative and qualitative attributes. Choosing the preferred one and repeating the choice exercise on different combinations of the attributes, the respondent offer information to derive the importance he puts on the attributes of the alternatives (Longo, Markandya, & Petrucci, 2008) (Pepermans, 2011) (Ratha , Iggland, & Andersson, 2013) (Boeri & Longo , 2017). Survey data are then analysed through econometric analyses, enabling the estimation of utility functions from survey data, disentangling the effect of attributes on the choice process, and allowing to study the heterogeneity in preferences applying Random Parameter Logit estimators. Willingness-to-Pay (WTP) and willingness-to-accept (WTA) and estimates of welfare change can be inferred. The main attributes that may affect the inconveniences suffered from of a black-out event are typically: The seasons in which it occurs (summer or winter) The day of the week (weekday vs weekend) Start time Duration

45
Session 05- Innovation for energy systems
Complete or partial loss of service Voluntary or mandatory Planned/unplanned Amount of advance warning (if any)
Results The results from the DCE analysis can be used to examine respondents’ WTP and WTA for a marginal change in each of the attributes and for selected hypothetical scenarios of VoLL. Respondents are willing to pay €0.44 in Estonia, €1.21 in the Netherlands and €0.71 in Estonia for a reduction by one in the number of planned power outages. If we consider a scenario of deterioration of the service, the WTA data show that respondents are willing to accept €1.83 in Estonia, €1.78 in the Netherlands and €1.27 in Portugal for an increase by one in the number of planned power outages. Conclusions The use of a Random Parameter Logit models allowed to see how the preferences in terms of willingness-to-pay and willingness-to-accept are dispersed around the mean estimates, giving evidence of a notable heterogeneity in the way consumers consider the importance of continuity of power supply. The values mentioned above are referred to power outages that are not expected (unplanned). The study provides as well monetary values for the case of planned outages, and for unit of time lost. The analysis has tested variables within the MNL models with interactions, finding factors that explaining the variability of responses both in the WTA and WTP DCEs: socio-economic variables: (age and income) previous experience of prolonged power cuts orientation toward long term strategies for the EU energy security: personal values
These factors exhibit some statistical significance, without adding a substantial increase in the explanatory power and goodness of fit of the model. More heterogeneity in preferences has been explained with the use of the Random Parameter Logit estimator. References Anderson, R., & Taylor, L. (1986). The social cost of unsupplied electricity: A critical review.
EnergyEconomics, 139-146. Arnold, S., Hunt, A., & Markandya, A. (2007). WP5 Report (1) on National and EU level estimates of
energy supply externalities. Project No 518294 SES6, CASES, Cost Assessment of Sustainable Energy Systems.
Baarsma, B. E., & Hop, P. J. (2009). Pricing power outages in the Netherlands. Energy, 1378–1386. Becker, G. S. (1965). A theory of the allocation of time. The Economic Journal, 493-517.
Beenstock, M., Goldin, E., & Haitovsky, Y. (1998). Response bias in a conjoint analysis of power outages. Energy Economics, 20(2), 135-156.
Bertazzi, A., Fumagalli, E., & Lo Schiavo, L. (2005). The use of customer outage cost surveys in policy decision-making. In IEEE (Ed.), CIRED 2005, International conference on electricity distribution. Turin.
Billinton, R., Abildgaard, H., Alabbas, A. M., Allan, R. N., Arnborg, S., Bogoi, C., et al. (2001). Methods to consider customer interruption costs in power system analysis. CIGRE.
Boeri , M., & Longo , A. (2017). The importance of regret minimization in the choice of renewable energy programmes: Evidence from a choice experiment. Energy Economics, 253-260.

46
Session 05- Innovation for energy systems Cai, Y., Deilami, I., & Train, K. (1998). Customer Retention in a Competitive Power Market: Analysis of a
'Double-Bounded Plus Follow-Ups' Questionnaire. The Energy Journal, 19(2), 191-215. Carlsson, F., & Martinsson, P. (2008). Does it matter when a power outage occurs?- A choice experiment
study on the willingness to pay to avoid power outages. Energy Economics, 30, 1232-1245. Carlsson, F., Martinsson, P., & Akay, A. (2011). The effect of power outages and cheap talk on willingness
to pay to reduce outages. Energy Economics, 33 (5), 790-798. Carson, R. T. (2000). Contingent valuation: a user's guide. Castro, R., Faias, S., & Esteves, J. (2016). The cost of electricity interruptions in Portugal: Valuing lost load
by applying the production function approach. Utilities Policy, 48-57. Commission, E. (2016). Commission Staff Working Document Interim Report of the Sector Inquiry on
Capacity Mechanisms. de Nooij, M., Koopmans, C., & Bijvoet, C. (2007). The value of supply security: the costs of power
interruptions: economic input for damage reduction and investment in networks. Energy Economics (29), 277-295.
de Nooij, M., Lieshout, R., & Koopmans, C. (2009). Optimal blackouts: Empirical results on reducing the social cost of electricity outages through efficient regional rationing. Energy Economics, 342-347.
Eto, J. H., Koomey, J. G., Lehman, B., Martin, N. C., Mills, E., Webber, C. A., et al. (2001). Scoping study on trends in the economic value of electricity reliability to the US economy. Berkeley Lab, Electricity Markets and Policy Groups. LBNL.
Goett, A., Hudson, K., & Train, K. (2000). Customers' Choice Among Retail Energy Suppliers: The Willingness-to-Pay for Service Attributes. The Energy Journal, 21 (4), 1-28.
Hensher, D. A., Shore, N., & Train, K. (2014). Willingness to pay for residential electricity supply quality and reliability. Applied Energy (115), 280-292.

47
Session 06 - Decarbonizing the gas sector
Giuseppe Ferrari, Iñigo del Guayo TOWARDS RENEWABLE NATURAL GAS
Giuseppe Ferrari, Professor, Bocconi University, Dipartiment of Law Studies, A. Sraffa, Via Röntgen, 1, Room 1.D1-9 20136 Milan, Italy,
Iñigo del Guayo, Professor, Universidad de Almería, Departamento de Derecho, Cañada de San Urbano, s/n, 04071 Almería, Spain
Overview This paper tries to present briefly what role natural gas will have in the transition to the energy system that replaces the current one, based on the consumption of fossil fuels, such as coal and hydrocarbons (gas and oil). In short, the role of natural gas in these times of transition to a new system is examined here. These brief reflections also present some of the possibilities that open up for natural gas when the final goal is reached, that is, with the complete electrification of the energy system, through renewable energies. In other words, they are reflections on how natural gas itself must evolve to maintain a leading role in the new paradigm. Method The method we shall use is to collect as much evidence as possible of the consensus around the need to decarbonize the economy and to electrify the energy system through a massive installation of renewable energy production units is increasingly broad. This consensus is being caused by the almost universal acceptance that if we do not fight the increase in the temperature of the planet, the effects of climate change will be irreversible and devastating. We should walk towards an energy system based on renewables, which puts self-consumption, distributed generation and energy efficiency at the centre of the system. Results We expect to show how natural gas can provide the security that a system based on renewables needs. The wind and the sun and other renewable sources of electricity production are intermittent and do not provide all the reliability that the electrical system requires. Combined cycle power plants, powered by natural gas, provide that safe energy when necessary, as a backup to renewable energies. Natural gas contributes to the higher performance of some thermo-solar technology plants. Along with this back-up function, natural gas is a hydrocarbon significantly less polluting than others, and its combustion in transport (in motor vehicles and even in maritime transport) brings economic and environmental benefits. Think of some municipal bus fleets that use vehicular natural gas. Liquefied natural gas constitutes a sector in expansion in these times, as the USA and Australian experiences show. On the demand side, liquefied natural gas has become the resource used by several nations that perceive threats to their safety due to climate change (Colombia, Panama or South Africa, to name just a few examples). Conclusions If natural gas wants to endure and be key in the new energy model that is trying to establish itself, it must undergo its own transition. If in this new model there is only room for renewable energy, natural gas must become a renewable energy. The gas must be decarbonized while competing efficiently with renewable energies. These two tasks constitute the main challenge facing not only the industry, but also the governments of those producing countries, companies and capital markets and, of course, consumers. In some way, there is no alternative to gas decarbonization, in the long term.

48
Session 06 - Decarbonizing the gas sector The aim is to promote biogas, both in the form of biomethane and biomass. The first consists of an improved biogas to reach the same characteristics as natural gas of fossil origin (for that reason it is designated as a renewable gas). The power-to-gas is also included here, when the surplus electrical energy is transformed into gas (mainly, the electrolysis that manages to separate the hydrogen and inject it in the network or use it in transport). Biogas can be generated from a wide variety of biological waste, such as agricultural waste, sludge, sewage, etc. These are new technologies, which must be decisively promoted to the point that they become economically viable and marketable. References Del Guayo, I. (2010), Tratado de Derecho del Gas Natural, ed. Marcial Pons, Madrid. Manuel Götz et al., Renewable Power-to-Gas: A technological and economic review, in: Renewable
Energy, Vol. 85, January 2016, pp. 1371-1390.

49
Session 06 - Decarbonizing the gas sector Simon Morgenthaler, Christopher Ball, Wilhelm Kuckshinrichs SYNTHETIC NATURAL GAS: AN OPTION COMPLEMENTING RENEWABLE ENERGY AND SUPPORTING DECARBONISATION? Simon Morgenthaler, Christopher Ball, Wilhelm Kuckshinrichs: Institute of Energy and Climate Research
– Systems Analysis and Technology Evaluation (IEK-STE), Forschungszentrum Jülich GmbH, Wilhelm-Johnen-Straße, 52425 Jülich, Germany
Overview Increasing penetration of renewable energy sources will require power storage solutions on a bigger scale. Power to gas, involving the creation of synthetic natural gas (SNG) from hydrogen and CO2, offers the opportunity to use the existing gas grid infrastructure to store renewable power and distribute it at points when there is a shortage of power. This makes SNG a potentially attractive counterpart to the expansion of intermittent renewable power sources. Carbon capture and utilization (CCU) technologies, in which the captured CO2 becomes a product, are of interest in the goal to reduce global CO2 emissions. Producing SNG from CCU processes could help decarbonisation, through taking CO2 from a process-related and, therefore, unavoidable, emissions source and using it to store electricity in the form of SNG. This serves to reduce overall CO2 emissions, as this avoids the need to burn additional fossil fuels at points where intermittent renewable power sources are unavailable. The presence of co-products, such as oxygen and heat, could enhance the economic viability of producing SNG and potentially replace energy intensive air separation units for oxygen production. This paper investigates the levelized cost of SNG across EU countries in order to assess its economic feasibility. It also highlights the main cost drivers and analyses the sensitivity of LC-SNG to changing conditions. Methods To examine the economic feasibility of SNG, a supply chain consisting of different market actors and technologies involved in the production process of SNG was established. Then, a cost optimization model, based on cost, technology and weather data, was implemented to find the minimum life cycle cost of producing a kWh of SNG across EU countries. As regards the weather data, data for every hour of the year 2015 was input into the model. The supply chain consists of: (i) suppliers of renewable electricity, (ii) a battery storage unit, so that the power- to-gas unit can run constantly, (iii) the electrolysis unit (iv) the CO2 source and (v) the power to gas unit. To keep it simple, it is assumed that the supply chain does not take the power used by the electrolyzer to produce hydrogen from the electricity grid. Results The levelized cost of SNG diverged starkly from country to country: costs were minimized in Spain and were far higher in Germany. The divergence suggests that a possible business model for SNG would involve trading among European countries, from lower cost to higher cost zones, or even international trade.

50
Session 06 - Decarbonizing the gas sector Whilst the levelized cost of SNG remains high, this must be interpreted in the context of the potential system value provided by SNG, in terms of decarbonisation, the integration of renewables and sector coupling. Conclusions In conclusion, it is proposed that SNG shows signs of economic feasibility under certain conditions and could contribute to decarbonisation and the integration of renewables. It is most likely that a viable economic model for SNG production would involve cross-border trading of SNG.

51
Session 06 - Decarbonizing the gas sector
Andris Piebalgs, Maria Olczak DECARBONISING THE GAS SECTOR: IS RENEWABLE GAS A SERIOUS OPTION?
Andris Piebalgs: Florence School of Regulation, FSR Gas Area, Il Casale,
Via Boccaccio 121, I-50133, Florence, Italy Maria Olczak: Florence School of Regulation, FSR Gas Area, Il Casale,
Via Boccaccio 121, I-50133, Florence, Italy Overview Natural gas is a crucial element of the European Union (EU) energy mix, providing one quarter of the EU’s energy supply. Over the years, the EU has a well-developed gas infrastructure and skilled workforce involved in gas pipelines operation and gas trading. Yet the use of natural gas, which is a fossil fuel, generates significant green- house gas (GHG) emissions. For this reason the gas sector should engage in the EU’s decarbonisation efforts. One of the most politically acceptable and economically viable ways to do it is to inject renewable gas (RG) into the existing gas networks. Despite a substantial experience with the renewable gas in Europe, its production is still relatively low. Changing the status quo requires decisive political support and addressing the cross-border issues stemming mainly from the differences in national legislation on gas quality. Method Reflecting on the available literature, data and discussions with the academics, business representatives, national regulators and the European Commission officials during a one day workshop, this paper reflects upon the key barriers to the growth in the renewable gas production in the EU and a way to address them. Which policy instruments are needed for renewable gas support? Whether a binding targets at national level are necessary? How to create the renewable gas support schemes? How to deal with the obstacles to cross-border trade? Results We found out that the recast of the Renewable Energy Directive (2009/28/EC) provides for positive development of renewable gas, however it falls short of meeting the gas sector’s decarbonisation challenge. To enable a significant change a target for renewable gas in the European gas grid for 2030 should be established, indicative trajectory designed and the Energy Union’s governance procedure used to undertake corrective actions, if necessary. The renewable gas support schemes should encourage the production of the renewable gas with one of the goals regarding its injection in the gas grid. Moreover, the current wording of the Network Code on Interoperability and Data Exchange rules seems satisfactory to avoid cross-border trade restrictions resulting from the gas quality differences. However, the benchmarks on odorization and control processes should be established at the EU level. Finally, the harmonization of the Guarnatees of Origin certification system should facilitate the uptake of renew- able gas in the grid. Conclusions The gas sector should engage in the EU’s decarbonisation efforts in order to remain an important ingredient of the EU energy system in the long-term. The authors believe that the injection of renewable gas into the existing gas grid is the most politically acceptable and economically viable option, which at the same time, is the most likely to be acceptable for the

52
Session 06 - Decarbonizing the gas sector consumers, as it does not require them to change their energy consumption patterns. In order to boost the renewable gas production in Europe, the changes to the EU energy regulation might be necessary and a concrete actions to deal with the obstacles to cross-border trade are needed. References Budzianowski W., Budzianowska D. (2015) “Economic analysis of biomethane and bioelectricity
generation from biogas using different support schemes and plant configurations” Energy Volume 88, pp. 658-666.
Delft, Eclareon, Wageningen Research Study (2016) “Optimal use of biogas from waste streams. An assessment of the potential of biogas from digestion in the EU beyond 2020”.
Green Gas. Facilitating a future green gas grid through the production of renewable gas (2018) IEA Bioenergy Task 37.
Meyer A.K.P. et al. (2017) “Future European biogas: Animal manure, straw and grass potentials for a sustainable European biogas production”, Biomass and Bioenergy.
Spijker, E., et al. (2015) “A level playing field for the European biogas and biomethane markets - Case of the Netherlands and Germany: policy environment, key differences and harmonization issues”. The report prepared as a part of Groen Gas - Grünes Gas major project.

53
Session 07 - Energy security & climate change
Ionut Purica BIG DATA ANALYSIS TO SEEK CLIMATE CHANGE PROOF AND ITS RISK MITIGATION
Ionut Purica, Romanian Academy and AOSR Romania
Abstract The change of the climate is characterized by the increase in temperature and a larger standard deviation of the temperature distribution. Having the data of temperature for each of the 40 regions of Romania on a monthly basis in time, starting 1961, a twofold analysis was done: first, with the purpose to check the evolution of the average temperature and of the associated distributions standard deviation and second, to assess the risks stemming from the combined effects of temperature and precipitation in each region that result in flood and drought and snow and freeze risks. These associated risks combine into a total risk for which a potential insurance system is proposed also correlated with the volatility of the temperature on a decade period in each region. The results of this analysis show evidence of a climate change process and suggest the validity of a risk mitigation policy. Keywords—climate change proof, big data analysis, risk, insurance

54
Session 07 - Energy security & climate change
Agime Gerbeti A NEW GOVERNANCE REGULATION TO FOSTER RENEWABLE COOPERATION POST 2020
Agime Gerbeti, Adjunct professor, University of Roma, LUMSA Overview The reason for the research is to analyse the development of the main measures related to support regimes for renewables adopted to create an internal electricity market. The focus is given to the increase role that cooperation mechanisms for promotion of renewable energy sources (RES) are playing. This paper examines features of cooperation mechanisms starting from the analyse of directive 2001/77/CE and then reviews all relevant legislation measures adopted at European Union (EU) level to boost cooperation between Member States (MS) in the renewables until the recent approved directive 2018/2001/UE on the promotion of the use of RES. The promotion of such mechanisms has been heavily impacted by the decisions of two court cases which have had a strong impact on the recent 2030 legislation. For this reason and taking into account the principle of free movement of goods within the internal market established in the EU Treaties, the paper questions on whether electricity should be yet considered a typical commodity produced and exchanged within this market. The 2030 legislation puts more emphasis on regional cooperation and on promotion of joint projects on renewable. Hence, the Regulation 2018/1999 on Energy Union and Climate Action Governance and the revised Renewable Energy directive 2018/2001/UE have updated and have also included new provisions concerning cooperation. Is scrutinized what the impact of cooperation can be in the upcoming 2021-2030 period within the internal market. Finally, in the conclusions are outlined the theoretical advantages and limits of the overall discipline of the cooperation mechanisms on RES. Method The method used is an analysis of the two recently adopted EU legislative texts. The analysis of outcomes from European regulation took into account current situation on cooperation mechanism implementation and EU court cases that had an impact on this issue. Taking into consideration the bibliography used, the aim is to shed light on the amendments to the directive related to the renewable sources especially on cooperation mechanisms field as well as on the ex-novo regulation on Energy Union Governance 2030. This last text has been also investigated since it is strongly linked to the RES Directive enforcement mechanisms. Results Through RES objectives and sub-objectives, first on electricity then also on transport and heat and cooling sectors, the EU leads countries not only in terms of RES ambition but also in terms of clean technology. The use of cooperation mechanisms gives flexibility to MS to reach the national RES objectives and can be a cost effective way to deploy RES in EU, even though their use has been limited. The recent EU legislation adopted for 2021- 2030 with the overall objective to complete the electricity market, enhanced cooperation between MS and to achieve this, new instruments at EU level have been designed and introduced such as, the opening of support schemes and the Union renewable energy financing mechanism are both voluntary for MS.

55
Session 07 - Energy security & climate change On one hand it is better to have all type of cooperation mechanisms as non-mandatory measures i.e. opening of national support schemes, because the risk would be that we jeopardize the cost efficiency of the cooperation between MS. The qualitative and non-quantitative use of cooperation mechanisms is essential for the EU. On the other hand issues with RES electricity and the principle of free movement of goods arise. The analysed Case C-573/12 will likely constrained MS through a series of bilateral agreements to recognize incentives also to the RES generation occurred in other MS. At present the electricity is not yet a typical commodity not even a completely fungible good. Also the cross-border network capacity is still a constrain to the internal electricity market competition. However, the level of electricity interconnectivity that the MS aim for in 2030 is of at least 15 %. This will certainly contribute in fostering cooperation between MS. Conclusions The financial mechanism introduced to help the Union reaching its mandatory target lays out detailed provisions on the upcoming EU delivering of incentive for RES generation. The EU financial mechanism at the beginning will be in “competition” with the RES national incentives. However, the national support schemes and the various cooperation mechanisms are likely that will come together, over the upcoming years, into the EU financial mechanism. This situation may bring to an overall reduction of economic entity of all MS support schemes and will tend to standardize downward the economic level of support schemes.
Bibliography and legislation
Directive 2018/2001/EU of the European Parliament and of the Council of 11 December 2018 on the promotion of the use of energy from renewable sources.
Two cases of the Court of Justice affected this aspect: Joined cases C-204/12, C-205/12, C-206/12, C-207/12, C-208/12, Essent Belgium/Vlaamse Reguleringsinstantie voor de Elektriciteits- en Gasmarkt and case Ñ-573/12, Alands Vindkraft/Energimyndigheten.
Regulation (EU) 2018/1999 of the European Parliament and of the Council of 11 December 2018 on the Governance of the Energy Union and Climate Action, amending Regulations (EC) No 663/2009 and (EC) No 715/2009 of the European Parliament and of the Council, Directives 94/22/EC, 98/70/EC, 2009/31/EC, 2009/73/EC, 2010/31/EU, 2012/27/EU and 2013/30/EU of the European Parliament and of the Council, Council Directives 2009/119/EC and (EU) 2015/652 and repealing Regulation (EU) No 525/2013 of the European Parliament and of the Council.
Directive 2001/77/EC of the European Parliament and of the Council of 27 September 2001 on the promotion of electricity produced from renewable energy sources in the internal electricity market. Official Journal L 283, 27/10/2001 P. 0033 – 0040.
Directive 96/92/EC of the European Parliament and of the Council of 19 December 1996 concerning common rules for the internal market in electricity has made significant contributions towards the creation of an internal market for electricity Directive 2009/72/EC of the European Parliament and of the Council of 13 July 2009 concerning common rules for the internal market in electricity and repealing Directive 2003/54/EC.
Braathen, N.A. (2011). Interactions Between Emission Trading Systems and Other Overlapping Policy Instruments. OECD Green Growth Papers, 2011-02. See also, Böhringer, Christoph, Henrike Koschel and Ulf Moslener (2008), “Efficiency losses from overlapping regulation of EU carbon emissions”, Journal of Regulatory Economics, Vol. 33, pp. 299-317.9.

56
Session 07 - Energy security & climate change
Gustav Resch, Lukas Liebmann, André Ortner, Sebastian Busch, Christian Panzer, TU Vienna / EEG
Pablo Del Rio, CSIC Mario Ragwitz, Simone Steinhilber, Marian Klobasa, Jenny Winkler, Fraunhofer ISI Malte Gephart, Corinna Klessmann, Isabelle de Lov-infosse, Georgios Papaefthymiou, Ecofys Jana V. Nysten, Dörte Fouquet, BBH Angus Johnston, Eva van der Marel, UOXF Fernando Bañez, Carlos Batlle, Camila Fernandes, Pablo Frías, Pedro Linares, Luis Olmos, Michel Rivier, Comillas Jaroslav Knapek, Tomas Kralik, CVUT, Thomas Faber, Sylvia Steinbaecker, AXPO Bugra Borasoy, EnBW, Felipe Toro, Luis Plascencia, “Design and impact of a harmonized policy for renewable electricity in Europe”. Final report beyond2020, IREES February 2014.
Directive 2009/28/EC of the European Parliament and of the Council of 23 April 2009 on the promotion of the use of energy from renewable sources and amending and subsequently repealing Directives 2001/77/EC and 2003/30/EC.
National Action Plans on renewables of MS: https://iet.jrc.ec.europa.eu/remea/nreaps-and-progress-reports-data-portal Eurostat data 2017 (access 2018) http://appsso.eurostat.ec.europa.eu.
Caldés, N.; Lechón, Y.; Rodríguez, I.; Del Río, P. “Market Uptake of Solar Thermal Electricity through Cooperation Analysis of the Barriers to the Use of the Cooperation Mechanisms for Renewable Energy in the EU”. 2018. Available online: http://mustec.eu/sites/default/files/reports/MUSTECD4. 1_Barriersforcooperationmechanisms.pdf.
Gephart M, Tesnière L and Klessmann C, “Driving regional cooperation forward in the 2030 renewable energy framework” https://eu.boell.org/sites/default/files/hbfecofys_regional_cooperation.pdf D/2015/11.850/3. Ecofys and Heinrich-Böll-Stiftung Report, Brussels 2015.
Consolidated versions of the Treaty on European Treaty and the Treaty on the functioning of the European Union (2012/C 326/01). https://eur-lex.europa.eu/legal-content/EN/TXT/?uri=CELEX:C2012/326/01
Natàlia Caldés, Pablo del Río, Yolanda Lechón, and Agime Gerbeti in “Renewable Energy Cooperation in Europe: What Next? Drivers and Barriers to the Use of Cooperation Mechanisms” Energies 2019, 12, 70; doi:10.3390/en12010070. www.mdpi.com/journal/energies
The decision D2012/04/MC/EnC of the Council of Ministers ECT, which modifies the art. 20 of the Energy Community Treaty and adopted the Directive 2009/28/EC.
European Commission, Communication n. 271 (2012) “Renewable energy: a leading role in the European energy market” published on 6 June 2012.
Communication from the Commission “Delivering the internal electricity market and making the most of public intervention {SWD (2013) 438 final} Brussels, 5.11.2013 C (2013) 7243 final.
Communication from the Commission, “Guidelines on State aid for environmental protection and energy 2014-2020”. OJ C 200, 28.6.2014, p. 1–55.
Italian Ministerial decree of 23 June 2016 on “Incentive of electricity produced from renewable sources other than photovoltaics”.

57
Session 08 - The Electricity market: risks and opportunities
Reinhard Haas, Hans Auer HEADING TOWARDS SUSTAINABLE AND DEMOCRATIC ELECTRICITY SYSTEM
Reinhard HAAS, Hans AUER, Energy Economics Group, Vienna University of Technology, Austria
Overview In the history of electricity systems in several countries different boundary conditions existed and exist with respect to price formation in the market. After the periods of state regulation and the first phase of liberalization of the wholesale markets currently the electricity system faces the third huge challenge: the change towards a bidirectional system, which should be more democratic and sustainable. This process is currently under way in some countries as Germany, Austria, UK and California. And in these countries also a change in the principle how prices come about is already under way. A major reason for this development is that in recent years the electricity generation from variable renewable energy sources especially from wind and photovoltaic (PV) power plants increased considerably. The three historical periods of market design in electricity markets and the resulting approach of price formation is shown in Fig. 1. A major aspect of the second period (in the middle) in Fig. 1 is, that at the beginning of liberalization huge excess capacities for electricity generation existed, which made it possible to rely on pure short-term marginal cost electricity pricing. The major objective of this paper is to analyze and provide insights on how to bring about a sustainable and competitive electricity system with even higher shares of renewable energy sources (RES) and an energy economically balanced system but without escalating political interventions. It is triggered by the current discussion on how to integrate large shares of variable RES but the fundamental intention goes beyond that. It is to show how to head towards real competition in electricity systems, including all dimensions such as generation, storage, but especially the customer side. This is a challenge for all countries world-wide. Method Our method of approach is based on the following principles: (i) Crucial is coverage of residual load (= difference between final electricity demand and generation provided by non-flexible electricity generation) ; this is modeled on an hourly base over a calendar year based on assumed variable RES generation and development of the load profile; (ii) Deduction of available conventional and backup capacities including must-run (iii) flexibility on the demand side based on consumer behavior incl. flexibility instrument such as batteries etc.; (iv) hourly electricity prices equal to short-term marginal costs and scarcity rents.
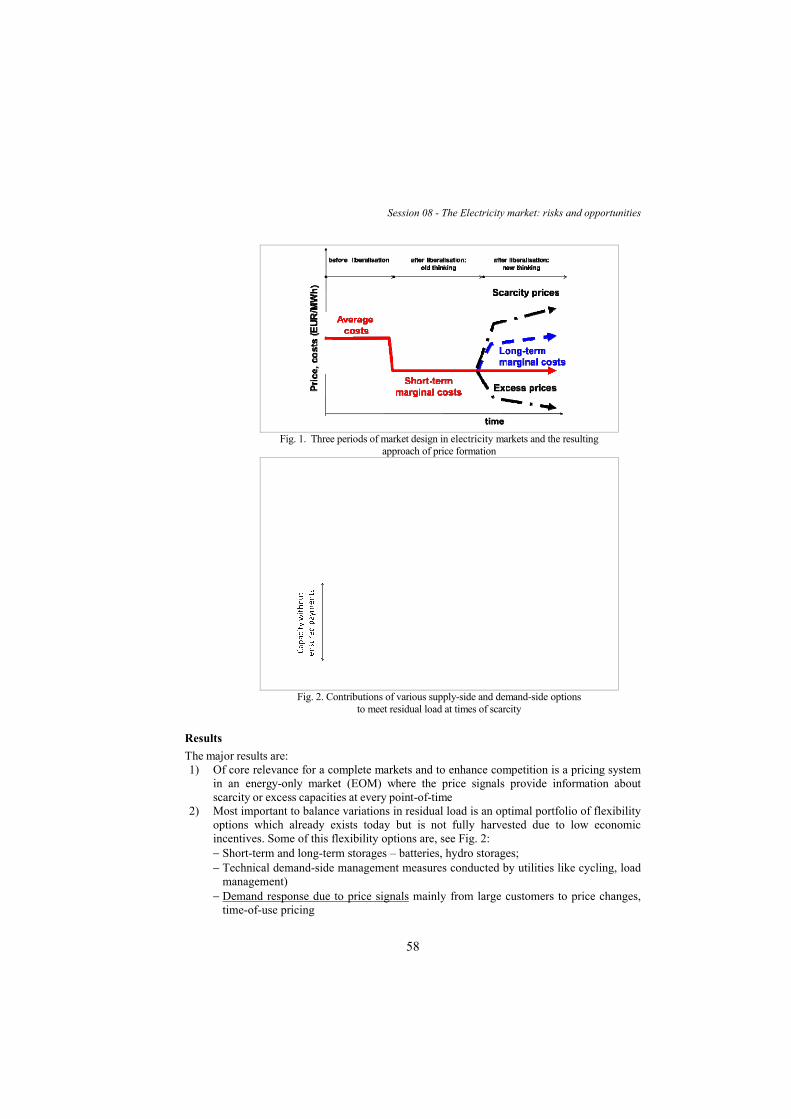
58
Session 08 - The Electricity market: risks and opportunities
Fig. 1. Three periods of market design in electricity markets and the resulting
approach of price formation
Fig. 2. Contributions of various supply-side and demand-side options
to meet residual load at times of scarcity
Results
The major results are: 1) Of core relevance for a complete markets and to enhance competition is a pricing system
in an energy-only market (EOM) where the price signals provide information about scarcity or excess capacities at every point-of-time
2) Most important to balance variations in residual load is an optimal portfolio of flexibility options which already exists today but is not fully harvested due to low economic incentives. Some of this flexibility options are, see Fig. 2: Short-term and long-term storages – batteries, hydro storages; Technical demand-side management measures conducted by utilities like cycling, load
management) Demand response due to price signals mainly from large customers to price changes,
time-of-use pricing

59
Session 08 - The Electricity market: risks and opportunities
Transmission grid extension leads in principle to flatter load and flatter generation
profiles; Smart grids: They allow switch of voltage levels and contribute in this context to load
balancing;
Fig. 3. New thinking in electricity markets: supply-oriented, two-way, very high flexibility and the increasing relevance of „Prosumagers“
Fig. 4. The tenant electricity model and blockchain: Possible future model for trading and using electricity from decentralized PV rooftop systems
Another major finding is that in a complete market there will be a new core player in the chain, the balancing group (the “supplier”), see Fig. 3. This player is the logical market coordinator of the electricity supply chain and the organizer of competition between the different options. Finally we state that the transition towards a competitive and sustainable future electricity system will be based on the following principle of “new thinking”, which is to accept a paradigm shift of the whole electricity system - including switching from an inflexible and one-way system where variable load is met with changes in generation to a more flexible and smarter system allowing two-way electricity flows – to our understanding – a greater scope for demand participation by consumers needs to be included. In addition, suppliers (or balancing groups) are the most important part of the whole energy service providing chain, see Fig. 3.

60
Session 08 - The Electricity market: risks and opportunities In addition, as indicated in Fig. 4 in future decentralized PV systems along with decentral battery storages will play a key role. The astonishing changes in the solar industry epitomize the over-all way PV is heading to. (WNISR 2015): “There seems to be a general recognition that the fall in production costs of RE technologies, particularly of PV, coupled with the expected falling costs of electricity storage will accelerate the transformation of the power sector.” And the IEA, which has been traditionally skeptical with respect to RES states in the WEO (2017): “PV is on track to become the cheapest source of new electricity in most countries world-wide”. One specific approach could be the so-called “tenant electricity model” along with the blockchain. As depicted in Fig. 4 this approach could provide a completely new future model for trading and using electricity from decentralized PV rooftop systems. Conclusions Our major conclusions are: Revised Energy-only-markets have to be introduced which allow temporarily shortage
prices higher than short-term marginal costs and in times of excess electricity negative prices;
A very important element of such a market will be flexibility options. But these will only be harvested when sufficiently high price signals from the electricity markets trigger these options, when “the exploration principle in the markets work” (Erdmann 2012). Yet this will only be done if the market is not distorted by centralized capacity payments.
The final conclusion of this analysis is, that it will be necessary to accept a paradigm shift in our understanding of the whole electricity system where no longer the generators are the centre but the balancing groups respectively the supply companies. And finally we state that the evolution of such a creative system of integration of RES in Western Europe may also serve as a role model for electricity supply systems largely based on RES in other countries world-wide

61
Session 08 - The Electricity market: risks and opportunities Kun Li AN INTRA-DAY ANALYSIS OF ELECTRICITY FORWARD PREMIA
Kun Li, Ph.D. Beijing Normal University, China Overview The issue of electricity pricing in spot and forward wholesale power markets has become one of the most attractive topics. During the recent years, a number of studies have realized that the electricity market is comparable to the financial market, since electricity prices have been determined through the auction mechanism. Thus, some studies employ methodologies from financial studies into the electricity market. Due to the nonstorable nature of electricity, which differs from financial assets, the electricity market is considered as limited in short-term elasticity to demand. The purpose of this study is to explore the price dynamics in the electricity market. We study the forward premium, which is defined as the difference between the forward price and the expected spot price of electricity. Using a dataset which includes multi-transmission-lines with hour-based frequency, we first observe that the electricity forward premium exists in our data, with a large variance, and a negative skewness. Second, we test both the time-varying and cross-sectional effects in the relationship between short-term forward prices and realized spot prices. We decompose the forward price into two components: transmission congestion cost and cost of marginal losses, and we find that the forward transmission congestion cost dominates the forward premium and consequently leads to a higher realized spot price. Third, we derive a new method to examine the significance of seasonality impact in forward premia. We find that the significant calendar effects in forward prices are different from those in spot prices. These results confirm the forward premium, and further extend the existing empirical literature by studying the properties of forward premium documenting new-risk-factor-related time variation. Methods The Bessembinder and Lemmon (B-L) Model An updated panel data analytical Model Results & Conclusions Our preliminary results indicate that there exist significant forward premia in the electricity market. The variance of forward premia is large, and the skewness is negative. In our second step, we find that the pair of cost components play an important role to affect the hourly forward premium. Especially the congestion cost has the larger coefficient than the original variance and skewness of the spot market. This result indicates that the limitations on power deliverability plays a key role on the divergence between the spot and forward market prices. We make three contributions. First, our analyses use a high-frequency intraday dataset and include over 12,000 individual transmission lines in the liberalized Pennsylvania-New Jersey-Maryland (PJM) market. Previous studies use market-level data, which fails to tell the cross-sectional effects on price dynamics. Second, we introduce a new analytical model by including two components: transmission congestion cost and cost of marginal losses. Third, we introduce a new method to test the significance of calendar effects in forward premia. Acknowledgements The authors thank Carlo Andrea Bollino, Carlo Di Primio, Elena Fumagalli, Yalin Huang, Mengfei Jiang, Nasrin Khalili, Gürkan Kumbaroğlu, Alberto Lamadrid, Xi Liang, Yun Liu,

62
Session 08 - The Electricity market: risks and opportunities Alberto Pincherle, Michael Pollitt, Anka Serbu,Adonis Yatchew, participants at the 2018 Associazione Italiana Economisti dell’Energia (AIEE) Energy Symposium, for helpful comments and feedback. The authors gratefully acknowledge the support from National Natural Science Foundation of China (Grant No. 71803012), the Fundamental Research Funds for the Central Universities, China (Grant No. 310422125), and the Beijing Talents Fund of China (Grant No. 2016000020124G051).
References Bessembinder, H., Lemmon, M.L., 2002. Equilibrium pricing and optimal hedging in
electricity forward markets. J. Finance 57, 1347–1382. Li, K.; Cursio, J.D.; Sun, Y. Principal Component Analysis of Price Fluctuation in the Smart
Grid Electricity Market. Sustainability 2018, 10, 4019. https://doi.org/10.3390/su10114019
Li, K., Cursio, J. D., Jiang, M., & Liang, X. (2019). The significance of calendar effects in the electricity market. Applied Energy, 235, 487-494. https://doi.org/10.1016/j.apenergy.2018.10.124
Longstaff, F.A., Wang, A.W., 2004. Electricity forward prices: a high-frequency empirical analysis. J. Finance 59, 1877–1900.

63
Session 08 - The Electricity market: risks and opportunities
Fereidoon Sioshansi BEHIND AND BEYOND THE METER: HOW NEW BTM SERVICE OPTIONS ARE DISRUPTING UTILITY BUSINESS MODEL
Fereidoon Sioshansi, Menlo Energy Economics, USA Overview The electric power sector is undergoing fundamental transformation at an unprecedented pace including the fact that an increasing number of consumers are becoming prosumers by self-generating more of what they consume. As the cost of energy storage continues to fall, prosumers can move a step further turning into prosumagers by storing some of the excess generation for later use, or to share it with others through peer-to-peer trading. Method The migration of consumers to prosumer, prosumager and more exotic forms of trading, sharing is likely to be enabled by intermediaries who can increasingly aggregate the loads, distributed generation and storage of large numbers of participants, monitoring, managing and optimization the entire portfolio of behind-the-meter (BTM) assets. The individual consumers select which of the many new service options is best by the relative costs and economics of the choices. Results With the proliferation of new service options and intermediaries, new business models are emerging where aggregation of loads, distributed generation and storage of large numbers of participants are optimized operating the entire portfolio as a virtual micro-grid with little or no net kWh consumption – in the process turning it into a “nonsumer” community. Conclusion The new service options and enabling technologies will facilitate peer-to-peer (P2P) trading allowing a host of platforms and new services and business models to emerge.
References F. Sioshansi (Ed.), Innovation and disruption at the grid’s edge: How distributed energy resources are
disrupting the traditional utility business model, Academic Press, 2017. F. Sioshansi (d.), Consumers, Prosumers, Prosumagers: How innovative services will disrupt the utility
business model, Academic Press, forthcoming 2019.
64
Session 08 - The Electricity market: risks and opportunities
Tim Schittekatte, Leonardo Meeus DISTRIBUTION NETWORK TARIFFS AND ACTIVE CONSUMERS: A BI-LEVEL EQUILIBRIUM MODELLING APPROACH
Tim Schittekatte, Florence School of Regulation/ Université Paris-Sud XI Leonardo Meeus, Vlerick Business School/ Florence School of Regulation
Overview Until recently consumers connected to the distribution network were passive. The fact that the historically in place volumetric network charges are only slightly cost-reflective was less of an issue. The distribution network tariff had a rather allocative objective, recuperating all the network costs in an acceptable way, instead of ‘guiding’ consumers to efficient grid behaviour. However, times are changing and technological evolutions at the consumer-side, most remarkably solar PV, are challenging the status quo. With volumetric network charges, consumers installing solar PV can lower their contribution to the grid costs while they are still as reliant on the grid as they were before. Next to solar PV, there are also breakthroughs in (stationary) batteries, heat pumps, electric vehicles, smart appliances etc. This all results in active consumers that can better control and monitor their interaction with the grid. There is a large body of recent academic literature discussing how to redesign the distribution network tariff. Earlier work, e.g. Brown et al. (2015), Hledik and Greenstein (2016) and Simshauser (2016), does not take into account the interaction between network tariff design and technology adoption by consumers; consumers are assumed inelastic, or their technology adoption is taken into account exogenously without looking at the incentives from the consumer- side. This is a valid assumption as long as the share of active consumers is limited. However, if higher shares of active consumers become a reality with constantly dropping technology costs, this assumption becomes harder to defend. In this work, a bi-level equilibrium modelling is introduced which endogenously accounts for the interaction between network tariffs and consumer decisions in terms of Distributed Energy Resources (DER) adoption and operation. This work builds further on Schittekatte et al. (2018) and Schittekatte and Meeus (2018). The main advantage of such a modelling approach is that it can show that depending on the design of the network charges the decisions of consumers can result in an overall welfare gain or loss. More precisely, although the rise of active consumers is rightly welcomed, the model takes into account the fact that it can also be a double-edged sword. On the one hand, the more consumers have the ability to react to price signals; the more welfare gains can be made from efficient consumer behaviour as an alternative to the historical practice of ‘fit-and-forget’. On the other hand, the more consumers that are able to react to price signals; the more significant negative welfare impacts can result if these price signals are badly designed. Active consumers could be guided in ‘the wrong direction’ by inadequate tariff design, e.g. investing in DER which are profitable when viewed from their individual point of view but which do not reduce or even increase total system costs.

65
Session 08 - The Electricity market: risks and opportunities Methods A bi-level equilibrium model is introduced. This modelling approach is well established in the literature to model for example strategic behaviour in electricity markets (see, e.g. Hobbs et al. (2000)). In this work, this approach is applied to a problem of a very different nature. The model allows us to capture the interaction between network tariff design, decentralized decision making of self- interest pursuing active consumers investing in solar PV and batteries, and their aggregated effect on the network costs. In the upper-level, a regulator can opt for a combination of real-time charges, capacity-based charges, volumetric charges (with or without net-metering) and fixed charges to recover grid costs. The regulator anticipates the reaction of consumers represented in the lower-level and the tariff is determined in a way that total system costs (incl. network costs, wholesale energy costs and DER investment costs by consumers) are minimized. The minimization is constrained by the fact that all grid costs need to be recovered. Modelled consumers can be passive or active. Passive consumers are assumed not to react to prices; active consumers pursue their own self-interest, i.e. their objective is to minimize their cost to satisfy their electricity demand. They have the option to invest in two technologies: solar PV and batteries. Regarding the solutions technique, the bi-level equilibrium model results in a Mathematical Program with Equilibrium Constraints (MPEC) and the MPEC is reformulated to a Mixed Integer Program (MIP). The final reformulation can be solved with an off-the-shelf solver. Linearization is done using the strong duality theorem and a reformulation of the Karush-Kuhn-Tucker (KKT) conditions which represent the lower-level problem. Next to the bi-level equilibrium model, we also introduce a single-level model representing a centralised decision maker. The centralised decision maker serves as a first best benchmark. Results are shown by two metrics relative to the benchmark: the total system costs as a proxy for cost-efficiency and the increase of network charges paid by passive consumers as a proxy for fairness. Results First, we conduct a simple case study to gain more qualitative insights into the problem. The case study shows that real-time grid charges and capacity-based charges can achieve the same cost-efficiency as the central planner under certain assumptions. However, even though the solutions are equal in terms of cost-efficiency for the two tariff designs under these assumptions, the distributional impact on the different consumer groups is very different. After, it is found that capacity-based charges depart in terms of cost-efficiency from the central planner when assumptions are stricter. However, under these stricter assumptions real-time pricing when combined with fixed network charges still perform as good as the theoretical optimal. Second, a larger case study is performed. In order to derive more general insights, a Monte Carlo simulation is done over the most important parameters. These identified parameters are the consumer profiles and groups, the investment cost of PV and batteries and the grid cost structure. By doing this sensitivity analysis we can show under which environment it is recommended to apply a bi-level modelling approach to the distribution network tariff design problem and when a computationally less intensive approach would suffice. Conclusions The conclusions of the paper are two-fold. First, we contribute to the academic literature by showing that the presented modelling approach can be useful to gain insight into the distribution network tariff design discussion.

66
Session 08 - The Electricity market: risks and opportunities We show explicitly under which environment models which do not endogenously take into account the interaction between consumer technology adoption and tariff design should be cautious. Second, we show policymakers that no one-size-fits-all exists in terms of distribution network tariff design. We also quantify the cost, in terms of cost- efficiency and fairness, of simpler network tariff design when compared to the first best solution. Such a demonstration can prove useful in the ongoing debates. References Brown, T., Faruqui, A., Grausz, L., 2015. Efficient tariff structures for distribution network services. Econ.
Anal. Policy 48, 139–149. doi:10.1016/j.eap.2015.11.010 Hobbs, B. F., Metzler, C.B., Pang, J.S., 2000. Strategic gaming analysis for electric power systems: An
MPEC approach. IEEE Transactions on Power Systems, 15(2), 638-645. Hledik, R., Greenstein, G., 2016. The distributional impacts of residential demand charges. Electr. J. 29,
33–41. doi:10.1016/j.tej.2016.07.002 Schittekatte, Tim and Leonardo Meeus. 2018. “Least-cost distribution network tariff design in theory and
in practice” RSCAS 2018/19 Working Paper. Submitted to The Energy Journal. Schittekatte, Tim, Ilan Momber, and Leonardo Meeus. 2018. “Future-Proof Tariff Design: Recovering
Sunk Grid Costs in a World Where Consumers Are Pushing Back.” Energy Economics 70: 484–498. doi:10.1016/j.eneco.2018.01.028.
Simshauser, P., 2016. Distribution network prices and solar PV: Resolving rate instability and wealth transfers through demand tariffs. Energy Econ. 54, 108–122. doi:10.1016/j.eneco.2015.11.011

67
Session 09 - The energy-economy nexus
Silvana Stefani, Gleda Kutrolli, Enrico Moretto, Adeyemi Sonubi, Vanda Tulli HEDGING RAINFALL EXPOSURE THROUGH HYBRID FINANCIAL INSTRUMENTS
Silvana Stefani, Department of Statistics and Quantitative Methods, Milano-Bicocca University, Piazza dell'Ateneo Nuovo 1, building U7, 20126 Milano, Italy
Gleda Kutrolli, Department of Statistics and Quantitative Methods, Milano-Bicocca University, Piazza dell'Ateneo Nuovo 1, building U7, 20126 Milano, Italy
Enrico Moretto, Department of Economics, University of Insubria, via Monte Generoso 71, 21100 Varese, Italy & CNR-IMATI, via A. Corti 12, 20133 Milano, Italy
Adeyemi Sonubi, Department of Statistics and Quantitative Methods, Milano-Bicocca University, Piazza dell'Ateneo Nuovo 1, building U7, 20126 Milano, Italy
Vanda Tulli, Department of Statistics and Quantitative Methods, Milano-Bicocca University, Piazza dell'Ateneo Nuovo 1, building U7, 20126 Milano, Italy
Overview National and international policy initiatives have focused on reducing carbon emissions as a means by which to limit future climate warming. Much less attention has been paid by policymakers to monitoring, modeling and managing the impacts of climate change on the dynamics of Earth surface systems, including glaciers, rivers, mountains and coasts. However, it is almost universally recognized that the risks connected to climatic changes are high and somehow unpredictable in their consequences. Moreover, the attempts of managing the climatic changes at a global level, i.e. the decisions taken in the 2016 Paris conference, have been recently counterbalanced by a not clear – cut US policy. Surprisingly, the financial world does not seem to care much about the problem. Yet, it is estimated that 80% of world industry is affected (totally or in part) by climate. In particular, agriculture, building industry and hospitality activities are heavily dependent on climate. Rain or low temperatures may cause cancellations or change of destination for tourists; heavy rain or high temperature damage crops and cause exit of farmers from the market. Method The present work contributes to the financial and climate literature by proposing a scientific framework for rainfall risk management using specific financial instruments, the weather derivatives. The aim is to mitigate the negative impacts of rain on the business performance of a company. As a first step, based on a well – established literature we propose a technique for modeling rainfall time series; then, we price a financial instrument (one – month forward) for hedging against high levels of rain. We checked our results in the geographical area of Arezzo, Tuscany, for rainfall daily data 1992 – 2016. We show how a “negative” weather performance can be counterbalanced by the “positive” performance of the correspondent financial instrument. Those financial instruments, typically Over the Counter, can be personalized and tailored according to the specific needs. This can be done through the pricing of the tick size (one rain mm) and the specific weather station close to the client. In our analysis, we have chosen 20€ as a tick size, but of course building contractors and farmers give a different value to one rain mm. To determine the price of a weather derivative we have used Burn Analysis adding to the obtained value some risk loadings.

68
Session 09 - The energy-economy nexus Results Since rainfall data are non-negative, highly skewed and there are many zero values then we propose to apply a multiplicative time series model where the intensity and amount of precipitation on rainy days will be modeled as two separate processes, blending deterministic seasonality effects with random variations. The minimum and maximum values are well captured by the model and the monthly simulated rainfall is within 95% CI based on observed rainfall for January’s months indicating that the model describes data well. We have shown how to hedge a meteorological risk referring to rainfall by pricing a 1-month forward option contract based on the deviation of the rainfall values recorded by a critical threshold. The behavior is very similar to that of a CDD contract for the temperatures, i.e. the contract will pay at the occurrence of rainfall above the critical threshold. The critical threshold is calculated at level of 90% VaR of the distribution of precipitation recorded in the historical series for the month in question (January, 2017), which resulted to be 5.44 mm. Meanwhile the risk loadings represent 5% of 95% VaR of the distribution of the payoff. Results found are promising as numerical findings that such contracts can positively cover rainfall risk. Conclusions As can be seen from the results presented in this paper with regard 1-month forward option contract for rain, in some cases a farmer who intends to cover himself from adverse weather conditions, which may be depending on the season and the crop - winter frosts, periods of drought, heat waves, by signing such a contract could be able to cover the losses eventually incurred. Trading whether derivative contracts in OTC market and therefore directly between the bank and the customer, with the advantage of being built ad hoc on the characteristics of the underwriter, freed from excessive standardization and rigidity, to better meet to the needs of the latter, it is natural to consider how this kind of derivatives will have an easy road in an imminent future. It is obvious, however, that there are some elements of risk to consider, first of all, basis risk, linked therefore to the distance between the measurement station that generates the indices that act as underlying of the derivative and the operational area of the underwriter. In fact, climatic conditions such as rainfall can also vary considerably within a few square kilometers. This family of meteorological derivative contracts is still not widespread in Italy, and also in the US market it is slowly developing; it is clear that in these times, where the debate on climate change is underway, where extreme weather phenomena in all parts of the world leave their traces, where also at international political level there are contrasting positions, this type of financial instruments could find a channel to establish itself in the future. From the results shown and from the analysis of the various indices at the historical level it was then possible to find the confirmation of what was said in the introduction section on climate change underway, as regards rainfall (where the change is highlighted not so much in terms of millimeters of rain fallen - almost similar in time between the various months - but rather in terms of frequency i.e. actual days of rainfall and intensity). This work is a step towards what could constitute a real branch of derivative instruments in the financial field, namely the climatic derivatives. The basic reasoning method will be the same, the instrument pricing models will have to be refined (which in turn will be able to differentiate themselves also by dividing between real derivatives or parametric insurance) and by dynamic modeling of the underlying, which will also be represented by further phenomena, such as snowfall or winds.

69
Session 09 - The energy-economy nexus References Benth, F.E., Benth, J.S. Modeling and Pricing in Financial Markets for Weather Derivatives; Advanced
Series on Statistical Science & Applied Probability: Volume 17 World Scientific, 2013 Andrea Stoppa (PROCOM, Italy) and Ulrich Hess (The World Bank), 2003. Design and Use of Weather
Derivatives in Agricultural Policies: the Case of Rainfall Index Insurance in Morocco. Jerry Skees et al., Developing rainfall-based index insurance in Morocco. Policy research working paper
2577. Steven W. Martin, Barry J. Barnett, and Keith H. Coble, 2001. Developing and Pricing Precipitation
Insurance. [5] Karyl B. Leggio, (2007) "Using weather derivatives to hedge precipitation exposure", Managerial Finance, Vol. 33 Issue: 4, pp.246-252, https://doi.org/10.1108/03074350710721497

70
Session 09 - The energy-economy nexus
Philip Mayer, Stefan Vögele, Kristina Govorukha, Dirk Rübbelke DEVELOPMENT OF DYNAMIC SCENARIOS: DEPICTING PATH DEPENDENCIES AND NONLINEARITIES WITHIN STORYLINES
Philip Mayer: TU Bergakademie Freiberg, Schloßplatz 1, 09599 Freiberg, Germany, Stefan Vögele: Forschungszentrum Jülich, Willhelm-Johnen-Straße, 52425 Jülich, Germany,
Kristina Govorukha: TU Bergakademie Freiberg, Schloßplatz 1, 09599 Freiberg, Germany, Dirk Rübbelke: TU Bergakademie Freiberg, Schloßplatz 1, 09599 Freiberg, Germany
Overview Scenarios have proven to be a highly effective tool for assessing and planning energy policy and supporting the political decision-making process. Model-based energy scenarios provide a quantitative depiction of possible future developments within the energy system. However, especially in the past years, the significance of the interrelation between qualitative context factors, that cannot directly be depicted by modeling frameworks have been addressed by several researchers [see Alcamo, 2008, Schweizer&Kriegler, 2012, Trutnevyte et al, 2014]. Thus, storylines, that ensure consistent context assumptions, directly affect the informative value of scenario studies. While there exists a broad variety of techniques for constructing such storylines, the cross-impact balance analysis (CIB) turned out to perform especially conclusive in the field of climate and energy research [Weimer-Jehle et al., 2016]. Although scenario studies on energy systems tend to analyse long-term developments, to the authors’ knowledge neither the CIB nor other techniques include a formalized approach for the explicit construction of pathways [see e.g. Bishop, et al., 2007]. This work proposes a novel approach for the generation of dynamic pathways, in order to depict path dependencies, windows of opportunities or irreversible developments within the system under consideration. Methods The approach carried out within this work builds on the general concept of CIB analysis. For the purpose of complexity reduction, the paradigmatic cross-impact matrix used in this paper consists of eight elements (or descriptors), where each descriptor can adopt two to five different states (or variations), respectively. In order to generate dynamic storylines, the period of consideration for the scenario analysis is divided in separate sections , with ∑ = . Furthermore, three categories of descriptors are introduced: (1) flow descriptors, (2) stockdescriptors, and (3) static descriptors. In contrast to the original approach, the variations of flow and stock descriptors are not exclusively determined by their cross impacts but also by the variations of certain descriptors in previous periods −1; flow descriptors show behavioural patterns that depend on their variation in the previous period. Stock descriptors relate to a stock (e.g. cumulative CO2-emissions of previous periods) that accumulates over time. As soon as a certain threshold is reached, some of the interdependencies identified in the cross-impact matrix are altered. Results Most scenario techniques merely display a current state at a specific point in time, without providing further information about the developments that made a certain future possible.
n =1

71
Session 09 - The energy-economy nexus The methodology introduced in this work allows for a comprehensive analysis of consistent development trajectories and provides a formalized approach for depicting a dynamic progression rather than a static snapshot. The value added by this novel approach is twofold: Firstly, consideration of dynamics within the construction of storylines provides new insights on a multitude of paths that lead to similar or equal futures. Secondly, consideration of changing cross-impacts between descriptors over time expands the generated scenario set and delivers additional information about future trends. Conclusions Constructing dynamic storylines does not only improve the informative value of scenario studies, it also allows for displaying critical tipping points in the system under consideration. In the context of energy and climate research it enables analysis with regard to windows of opportunity and path dependencies for the deployment of emerging or controversial (e.g. CCS) technologies.
References Alcamo, J. (2008). Chapter six the SAS approach: combining qualitative and quantitative knowledge in
environmental scenarios. Developments in integrated environmental assessment, 2, 123-150. Bishop, P., Hines, A., & Collins, T. (2007). The current state of scenario development: an overview of
techniques. foresight, 9(1), 5-25. Schweizer, V. J., & Kriegler, E. (2012). Improving environmental change research with systematic
techniques for qualitative scenarios. Environmental Research Letters, 7(4), 044011. Trutnevyte, E., Barton, J., O'Grady, Á., Ogunkunle, D., Pudjianto, D., & Robertson, E. (2014). Linking a
storyline with multiple models: a cross-scale study of the UK power system transition. Technological Forecasting and Social Change, 89, 26-42.
Weimer-Jehle, W., Buchgeister, J., Hauser, W., Kosow, H., Naegler, T., Poganietz, W. R., Pregger, T., Prehofer S., von Recklinghausen, A., Schippl, J. & Vögele, S. (2016). Context scenarios and their usage for the construction of socio-technical energy scenarios. Energy, 111, 956-970

72
Session 09 - The energy-economy nexus
Elisabete Neves, Carla Henriques, João Vilas FINANCIAL PERFORMANCE ASSESSMENT OF ELECTRICITY COMPANIES: EVIDENCE FROM PORTUGAL
Maria Elisabete Neves: Polytechnic Institute of Coimbra - Coimbra Business School ISCAC, Portugal And UTAD-CETRAD Quinta Agrícola – Bencanta, 3040-316 Coimbra
Carla Henriques: Polytechnic Institute of Coimbra - Coimbra Business School ISCAC, Portugal and INESC Coimbra, Quinta Agrícola – Bencanta, 3040-316 Coimbra
João Vilas: Polytechnic Institute of Coimbra - Coimbra Business School ISCAC, Portugal, Quinta Agrícola – Bencanta, 3040-316 Coimbra,
Overview The assessment of the efficiency performance of the electricity sector has been the focus of attention of several studies, but there is a lack of studies specifically addressing the financial performance of electric utilities. Hence, this paper is aimed at assessing the financial performance of 743 regulated companies operating in the Portuguese electricity market. We propose a modelling framework which combines the use of the Generalized Method of Moments (GMM) estimation method with data envelopment (DEA) analysis to assess the financial performance of electric utilities in Portugal. The study is focused on the period of 2010 to 2014, i.e. the period particularly impacted by the financial assistance provided to the Portuguese government. Method We have used a sample of 743 Portuguese firms from Amadeus database which belong to the following NACE Rev. 2 codes: 351 - Electric power generation, transmission and distribution. Then, the inputs and outputs considered in the DEA model herein used were evaluated through an unbalanced panel of these firms whose information is available for a period between 2010 to 2014, explicitly including the 2011-14 Financial Assistance Programme. Although there is no consensus on which variables best explain a firm’s performance, we have selected the return on equity (ROE) for assessing the financial performance of every firm, i.e. of each Decision Making Unit (DMU). The use of the GMM estimation method can help us find which items have an impact on ROE, and classify inputs and outputs easily according to the type of influence of each item on the DMU’s ROE. We treated the ROE of every DMU as a dependent variable and the variables given in Table 1 as explanatory variables.
Table 1. Firm’s specific characteristics and external factors
Variable Description
LIQUID Is the liquidity given by the ratio between current assets and current liabilities (Liu et al., 2012)
LEVERAGE Is the financial leverage given by the ration between total debt and total assets (Psillaki and Daskalakis , 2009)
CFTA Is the cash flow to total assets by Martani et. al (2009), a modified version.
DATA Is the value of depreciations and amortizations to total assets (Desai, Foley and Forbes, (2007)
CCI Is the Consumer Confidence Index proposed by Fisher and Statman (2003)
GDP Is a macroeconomic variable and represents the real Gross Domestic Product growth (see e.g. McNamara and Duncan (1995))
SIZE Is the logarithm of total assets Bandyopadhyay and Barua (2016)

73
Session 09 - The energy-economy nexus
Therefore, he proposed GMM model was of the form: ROEit β0 β1LIQUID β2LEVERAGE β3SIZE β4CASHFLOW β5D&A β6GDP β7CCI ,……………………………………………… ….
where it is the random disturbance. Subsequently, after selecting the inputs and outputs with higher significance level, we have used the Slacks-Based Measure (SBM) DEA model which is a non-radial and non-oriented model, since unlike radial models and the input (output)-oriented models it can provide a comprehensive efficiency assessment. Let the set of n DMU be given by DMU1, DMU2, …, DMUn, where each unit uses m input resources to produce s outputs. The input matrix (an mn matrix) is given as X = [xij, i = 1, 2, …, m, j= 1, 2, …, n] while the output matrix (an sn matrix) is Y = [yrj, r = 1, 2,…, s, j = 1, 2,
…, n], where the lines and of these matrices show the quantity of inputs and outputs, respectively, of DMUo. The SBM suggested by (Tone, 2001) as the following form:
(2) In problem (2) it is assumed that X 0. It can also be seen that an increase in either considering everything else constant, will decrease the objective value of problem (2). Moreover, it can be concluded that 0 < < 1. In order to account for variable returns to scale (VRS) it is only necessary to add the constraint 1into model (2). Then, problem (2) can be converted into problem (3) by considering a
positive scalar variable t:
(3)

74
Session 09 - The energy-economy nexus
The optimal solution of (SBM) is given as:
* = *, ,* = */t*, ∗= / t*, ∗= / t*. A DMUo is SBM-efficient if and only if *= 1 which is equivalent to ∗= 0 and ∗= 0.
Moreover, the set of indices matching with ∗ 0 is called the reference set of an SBM-inefficient DMUo. The SBM model can also be used for the definition of superefficiency (Cooper et al., 2007). The super-SBM model considers that the efficiency scores of the inefficient DMUs is kept unaffected and the efficiency scores of the efficient DMUs are bigger than 1,thus allowing for the classification of efficient DMUs. In order to obtain the super-SBM model it is necessary to remove DMUo under evaluation form the set of DMUs. This model is sought to select a virtual DMU* with inputs X* and outputs Y* which will be SBM efficient after the removal of DMUo. In fact, the inputs into DMU* will be higher or equal than those that go into DMUo and all outputs will be lower or equal than those that go into DMUo. The super efficiency rate is thus defined as the distance between the inputs and outputs of both units – DMU* and DMUo. Results The GMM estimation method that we propose to select the inputs and outputs considered in the SBM model suggest that both intrinsic corporate variables and external factors are important in explaining the financial performance of electric companies. Therefore, we have arrived at the results provided in Table 2.
Table 2. Estimation results of the model (1)
Variable Coefficient STD. Error Z P value -const -169.906 (65.166) -2.61 0.009 ***
ROE -0.057 (0.028) -2.08 0.037 **
LIQUID 0.423 (0.171) 2.48 0.013 **
LEVERAGE 38.713 (14.744) 2.63 0.009 ***
SIZE 18.945 (7.881) 2.40 0.016 **
CFTA 204.649 (21.822) 9.38 0.000 ***
DATA -187.964 (39.744) -4.73 0.000 ***
GDP -2.427 (0.955) -2.54 0.011 **
CCI 0.202 (0.113) 1.79 0.073 *
Sargan 9.448 (8) 0.306
Wald 97.77 (8) 0.000
AR (1) -1.009 0.3013
AR (2) -0.638 0.524 The regressions are performed by using an unbalanced panel data composed by 743 companies and about 1860 observations. The remainder of the information needed to read this table is as follows: i) Heteroscedasticity consistent asymptotic standard error in parentheses. It should also be noted that: i) *, **, and *** indicates significance levels at 10%, 5% and 1% respectively; (ii) The Sargan test with a p value greater than 5% shows that the instruments are valid, and the values in parentheses of the test represent degrees of freedom; (iii) The Wald test has a p value less than 5% which means that the joint significance and the coefficients are significant distributed asymptotically as χ2 under a null hypothesis without significance, with degrees of freedom in parentheses. The table shows that there is no second order correlation problems in the model, see AR (2).

75
Session 09 - The energy-economy nexus In order to conduct the DEA performance evaluation, we have only selected those explanatory variables with a significance level higher than 10 %. Besides ROE (our dependent variable), from the management stand point, LEVERAGE and CFTA can be deemed as outputs since they have positive coefficients while DATA as inputs as they affect ROE negatively. Conclusions This paper conveys a modelling framework which combines the use of the GMM estimation method to select the inputs and outputs used in the SBM model considered to perform the financial performance assessment of 743 regulated companies operating in the Portuguese electricity market. The study conducted explicitly considers the period of 2010 to 2014, a period particularly influenced by the financial assistance provided to the Portuguese government. References Bandyopadhyay, A. and Barua, N. M. (2016). “Factors determining capital structure and corporate
performance in India: Studying the business cycle effects”, The Quarterly Review of Economics and Finance, 61: 160-172.
Cooper, W. W., Seiford, L. M. and Tone, K. (2007), Data Envelopment Analysis, Data Envelopment Analysis: A Comprehensive Text with Models, Applications, References and DEA-Solver Software: Second Edition.
Desai, M. A., Foley, C. F., & Forbes, K. J. (2007). Financial constraints and growth: Multinational and local firm responses to currency depreciations. The Review of Financial Studies, 21(6), 2857-2888.
Fisher, K. L. and Statman, M. (2003). “Consumer confidence and stock returns”. Journal of Portfolio Management, 30: 115-127. Liu, C., Uchida, K. and Yang, Y. (2012). “Corporate governance and firm value during the global financial crisis: Evidence from China”, International Review of Financial Analysis, 21(0): 70-80.
Martani, D., Khairurizka, R., & Khairurizka, R. (2009). The effect of financial ratios, firm size, and cash flow from operating activities in the interim report to the stock return. Chinese Business Review, 8(6), 44-55.
McNamara, R. and Duncan, K. (1995). Firm’s performance and macro-economic variables, School of Business Discussion Paper, 59, Bond University.
Psillaki, M. and Daskalakis, N. (2009), “Are the determinants of capital structure country or firm specific?.” Small Business Economics, 33(3): 319-333.
Tone, K. (2001),”On Returns to Scale under Weight Restrictions in Data Envelopment Analysis”, Journal of Productivity Analysis, 16(1): 31–47.

76
Session 09 - The energy-economy nexus
Francesco Scalia THE ENERGY PERFORMANCE CONTRACT AS A PRIVATE PUBLIC PARTNERSHIP OPERATION TO IMPROVE ENERGY EFFICIENCY OF PUBLIC REAL ESTATE ASSETS Summary: 1. Introduction. 2. The energy performance contract. 3. The National Agency for New Technologies, Energy and Sustainable Economic Development position regarding the possibility of configuring the Energy Performance Contract as a private public partnership contract. 4. Conclusions: Energy Performance Contract as a (possible) private public partnership contract. Overvue The Italian National Energy Strategy (NES) 2017, in line with the original proposal for a directive on energy efficiency contained in the Clean Energy Package, assumed the 30% reduction target for consumption by 2030 compared to the 2007 reference scenario. The NES must be adequate to the 32.5% target in the same time frame, set by Directive 2018/844/EU which in meantime entered into force. For sectors not covered by the Emission Trading Scheme (ETS) (residential, services and a large part of the transport sector), the reduction target for Italy is 33% compared to 2005. To date, our country has achieved high energy efficiency performance, especially in the industrial sector. It remains a significant growth potential in the civil (both residential and tertiary) as well as in the transport sectors. The improvement of energy efficiency in buildings is due to two orders of difficulty: the lack of awareness of consumers about the benefits associated with it and investment costs generally high compared to the benefits obtained. In fact, the cost-effectiveness ratio of incentive tools dedicated to the construction sector (tax deductions and incentives for thermal energy) is, up to eight times higher than the mechanism of white certificates, mainly used in the industrial sector. The potential related to the energy efficiency of public real estate assets is particularly relevant. Directive 2010/31/EU on energy performance of buildings has set the obligation on each Member State to adapt, according to the best energy standards, by 3% yearly of the useful floor area of the central public administration buildings. Article. 5 of the legislative decree n. 102 of 2014 states that, starting from 2014 and until 2020, interventions on the properties of the central public administration, including the peripheral ones, can be carried out, aiming at achieving the energy requalification of at least 3% per year of the covered useful floor air-conditioned area or, alternatively, involve a cumulative energy saving over the same period of at least 0.04 Mtoe. Furthermore, in 2009 the European Commission promoted the so called Covenant of Mayors Pact, initiative aimed at encouraging local authorities to adopt, through the Sustainable Energy Action Plans (SEAP), measures to improve energy efficiency, promote energy saving and the use of renewables. In this context, the Energy Performance Contract and the use of the Public-Private Partnership can play a significant role. Conclusions Having regard to the illustrated characteristics of the energy performance contract, it does seem very clear that, if it is involved in the investment borne by the supplier of the energy efficiency measure (the ESCo) and in remuneration according to the performance achieved,

77
Session 09 - The energy-economy nexus qualifies - if stipulated with a Public Administration - as a contract for private public partnership, burdening the economic operator with both the risk of construction and the risk of availability. In fact, the essential requirements established by the general regulation of the partnership contract, introduced by the art. 180 of the Code, and the four elements characterizing the public private partnership operations identified in the Green Paper (2004), relating to the duration of the contract the methods of project financing , the role of the parties and the distribution of risks. Indeed, as authoritative doctrine emphasizes private public partnership is a privileged instrument for guaranteeing energy efficiency, particularly in the renovation of public property assets, where important investments and rapidly changing technical knowledge are required. Actually, a contractual scheme that allows, during the awarding phase, the private initiative, which can propose to the Administration with the feasibility project the best viable solutions (with the possibility that the tender will allow it to identify other preferable) and, in the execution phase, the taking on by the private investor of both the investment and the guarantee of the agreed result, seems to be the classic “Colombo egg” for an administration committed to renovate annually the 3% of its own real estate asset, squeezed between limits of public finance and lack of necessary knowledge. Applying to the public private partnership, due to public finance protection, the contents of the Eurostat decisions (article 3, paragraph 1, letter ee), also the energy performance contracts stipulated with the Public Administration should not have public debt to comply with the Stability Pact. On the other hand, one of the obstacles to the diffusion of EPCs for the improvement of the energy efficiency of public real estate came from the Eurostat guidelines published on 7 August 2016, which required the qualification of the energy performance contract as an off-balance operation, which cost of the investment had to be at least equal to half the value of the properties subject to requalification, as the outcome of the latter: a very difficult condition to be met for measures to improve the energy efficiency of a building. On 19th September 2017, Eurostat published new guidelines that do not allow investment costs of an EPC to be recorded on the balance sheet under the following conditions: the risks of the intervention (performance, maintenance, requalification and management) all fall on the supplier of energy efficiency measure; that the fee to the supplier is linked to the intervention’s performance and in the case of factoring, the supplier does not assign to the factor the credit pro soluto, so does not transfer the risk of performance to the Administration. Basically, according to the new Eurostat guidelines, if the energy performance contract meets the requirements of the public-private partnership contract, as defined in the procurement code, investment costs are not included in the financial statements and therefore are not relevant for the purposes of compliance with the stability pact.

78
Session 10 - The union of national energy markets
Martin Svec DIVISION OF POWERS BETWEEN THE EU AND ITS MEMBER STATES: IMPLICATIONS FOR ENERGY SECURITY
Martin Svec, PhD Candidate, Masaryk University, Masaryk University, Faculty of Law, Veveří 70, 611 80, Brno, Czech Republic
Overview: Energy security is traditionally understood as a fundamental driving force of economic and political integration in the European Union. Since the establishment of the European Coal and Steel Community in 1951, EU (EC, ECSC) energy policy has aimed to address EU’s dependency on supplies of energy (more than half EU’s energy consumption in 2014 came from imported sources). In line with the EU energy security strategy, adopted in 2014, EU seeks to diversify its energy suppliers, routes, and to create stable environment (e.g. Energy Charter Treaty) as well as to export its energy principles and legal framework (e.g. Energy Community). The paper seeks to analyse external dimension of the EU energy policy in relation to energy security and to address division of powers between the EU and the Member States, and its implications for the EU energy security. In order to further strengthen the EU energy policy and to respond to climate change, the European Commission introduced the Energy Union, a coherent energy strategy encompassing special emphasis on environmental issues (2015). The Energy Union aims to give EU one voice on the international scene and to set new energy governance standards. Methods: The author analyses existing instruments of energy diplomacy. On the one side, bilateral energy dialogue platforms with supplier and transit countries (such as Ukraine) as well as with other trade partners (USA, Canada). On the other side, regional cooperation projects and international agreements such as the Energy Charter Treaty and the Energy Community. The paper seeks to analyse recent developments in the EU external energy policy from the legal perspective, as well as to analyse the role of the EU and its Member States in the implementation of the Energy Union project. Results: Special attention is given to the division of powers between the EU and the Member States, and its implications for swift implementation of the EU energy policy, in form of the Energy Union. Art. 194 of the Treaty on the Functioning of the European Union leaves Member State to enjoy shared competence over energy policies including freedom of choice on their respective energy mix. As regards the external dimension of energy relations, the TFEU does not explicitly allocate competence – not even to ensure security of supply. However, implied external competence over energy policy may be found through the application of Article 216 TFEU and the principle of parallel competence. Moreover, the external energy competence has already been successfully exercised by the EU in several Council’s and Commission's decision, such as Decision on a proposal to establish the Energy Community list of energy infrastructure projects adopted by the Commission in 2016, or Decision on the conclusion of the IRENA adopted in 2010.

79
Session 10 - The union of national energy markets In addition, since the transition to a low-carbon economy (in form of deployment of renewable energy) has potential to secure greater energy independence, the EU may invoke its competence over environment under Article 191 of the Treaty on the Functioning of the European Union. Trade related issues of energy security are already addressed by the EU’s exclusive competence over common commercial policy (CCP). Conclusions: The European Union, regardless of its unprecedented character, is limited in its external action, as any other international organization, by scope of powers conferred to it by its Member States. In order to comply with the principle of conferred powers, the EU has to find a legal basis for any of its external action. The legal basis determines procedure of negotiation of a particular international agreement, its conclusion and even the necessity of the Member States becoming the contracting parties of an agreement alongside the EU. Although the Lisbon Treaty has undoubtedly underscored the EU’s role as a global actor (e.g. the EU declared its legal personality and laid down principles and objectives for EU international relations), a large number of questions have been left unanswered. Effective implementation of the Energy Union project requires debate (and possible reform) about the current constitutional framework for EU’s external action. References: COM (2014) 330 final. Communication from the Commission to the European Parliament and the
Council: European Energy Security Strategy. COM (2015) 80 final. Communication from the Commission to the European Parliament, the Council, the
European Economic and Social Committee, the Committee of the Regions and the European Investment Bank: Framework Strategy for a Resilient Energy Union with a Forward-Looking Climate Change Policy.
COM (2015) 572 final. Communication from the Commission to the European Parliament, the Council, the European Economic and Social Committee, the Committee of the Region and the European Investment Bank: State of the Energy Union 2015.
COM (2017) 53 final. Communication from the Commission to the European Parliament, the Council, the European Economic and Social Committee, the Committee of the Regions and the European Investment Bank: Second Report on the State of the Energy Union.
Council conclusions: Energy and Development (November 2016). 98/181/EC, ECSC, Euratom: Council and Commission Decision of 23 September 1997 on the conclusion, by the European Communities, of the Energy Charter Treaty and the Energy Charter Protocol on energy efficiency and related environmental aspects.
2006/500/EC: Council Decision of 29 May 2006 on the conclusion by the European Community of the Energy Community Treaty.
2010/385/EU: Council Decision of 24 June 2010 on the conclusion of the Statute of the International Renewable Energy Agency (IRENA) by the European Union.
Craig Paul, De Búrca Gráinne. EU Law: Text, Cases, and Materials, Oxford University Press 2015. Kuijper P. J., Wouters J., Hoffmeister F., De Baere G., Ramopoulos T. The Law of EU External Relations:
Cases, Materials, and Commentary on the EU as an International Legal Actor. Oxford University Press 2015.
Rafael Leal-Arcas, Jan Wouters. Research Handbook on EU Energy Law and Policy, Cheltenham: Edward Elgar Publishing, 2017.
Ioanna Mersinia, Sirja-Leena Penttinen. Energy transitions: regulatory and policy trends. Cambridge: Intersentia, 2017.

80
Session 10 - The union of national energy markets
Martha M. Roggenkamp, Olivia Woolley. European energy law. Report IX. Cambridge: Intersentia, 2012. Luciani, Giacomo. Security of oil supplies: issues and remedies. Deventer: Claeys & Casteels, 2013. Jakub M. Godzimirski. EU leadership in energy and environmental governance: global and local
challenges and responses. Basingstoke: Palgrave Macmillan, 2016. Marc Bungenberg, Stephan Hobe. Permanent sovereignty over natural resources. Cham: Springer, 2015. Haghighi, Sanam S., Energy security: the external legal relations of the European Union with major oil-
and gas-supplying countries. Oxford: Hart, 2007. Leal-Arcas, Rafael, International energy governance: selected legal issues. Cheltenham: Edward Elgar,
2014. Marise Cremona and Anne Thies, The European court of justice and external relations law: constitutional
challenges. Oxford: Hart publishing, 2014. Barry Barton, Energy security: managing risk in a dynamic legal and regulatory environment. Oxford;
New York: Oxford University Press, 2004. Marise Cremona, Structural principles in EU external relations law. Oxford: Hart publishing, 2018

81
Session 10 - The union of national energy markets
Sotirios Manolkidis REGULATING ENERGY MARKETS: THE EXPERIENCE OF SOUTH EASTERN EUROPE
Sotirios Manolkidis Vice President of RAE, Grece
The European Commission has recently presented a package of measures to keep the European Union energy markets competitive as the clean energy transition is changing global energy markets. The Commission wants the EU to lead the clean energy transition, not only adapt to it. For this reason, the EU has committed to cut CO2 emissions by at least 40% by 2030 while modernizing the EU's economy and delivering on jobs and growth for all European citizens by 2050 (decarbonization). Recent proposals have three main goals: putting energy efficiency first, achieving global leadership in renewable energies and providing a fair deal for consumers. In the context of the electricity market, the European Commission further distinguishes five different types of operations: – generation, the production of electricity in power stations; – transmission, its transport over high tension cables; – distribution, the transport of the electricity over the low tension local cables; – supply, the sales and delivery of the electricity to the final consumer; and – trading, the purchase and re-sale of electricity that is not necessarily directed to final consumers. Each of the first four activities could be regarded as constituting a separate product market, as they require different assets and resources. Relevant geographical markets should be defined on a case-by-case basis, due to fragmentation and isolation issues in South Eastern Europe but, in general, they cover the regions or territories of at least one Member State. Market coupling and the implementation of the Target Model constitute major challenges for the year 2019. Greece, again, currently being an exception operating twelve separate non- interconnected systems in its islands and the main grid in continental Greece will be coupled with Italy and Bulgaria. Aim of my paper. Innovation in the energy sector in South Eastern Europe: Recent Developments The emergence of new technologies, services and new actors is blurring the traditional boundaries of the energy sector across Europe. What is witnessed is a paradigm shift towards low-carbon and user-centric economies, driven by digital and integrated flexible solutions that serve to put end-users in the driving seat. The entire energy system and value chains of Europe is changing due to the appearance of four specific megatrends: sustainability, digitalization, integrated services and local level empowerment. We are observing a diametrical deviation from the passive perception of consumer to the new concept of ‘prosumer’. End-users are put at the centre of decision-making by new dynamic actors, such as electricity aggregators or electric car-sharing platforms. Energy infrastructures are rearranging and instead of focusing on simply selling electrons, they are offering services so as to meet the expected consumer needs which are summarized by the triptych of comfort, independence and security. Growing day by day in importance, the prosumer notion becomes an established feature of the energy system in South Eastern Europe, However, energy innovation won’t become a success story overnight and it won’t be a matter of focus on a single actor.

82
Session 10 - The union of national energy markets It will be the result of a wide variety of contributions of several stakeholders from different horizons, inspired and pushed by smart city projects, end-users associations, the new and traditional energy players, academic institutions and generally by the whole rearrangement atmosphere promoted by the European Commission. The way forward: Wholesale price caps will be removed, making prices reflect the real value of electricity in time and location (scarcity pricing) to drive investments towards the flexible assets most needed for the system, including demand-response and storage in the Greek islands. Expanding the national Grid will create interconnected markets and increase trade opportunities. • Rules on priority dispatch will, however, be maintained for small-scale renewable installations and emerging technologies to ensure their development. • Grid bottlenecks on the borders will have to be minimized, among other things by re-investing congestion revenues into the grid. • The overall electricity system operation by the Greek TSO will see more coordination by coupling the Greek electricity market on a regional level (Italy – Bulgaria) to ensure most optimal utilization of the grid and better grid stability. • Better demand participation: remuneration for demand response will be more in line with the flexibility provided by such services, creating a better economic case for distributed resources and for self-generation of electricity in the small grid autonomous areas (islands). Finally, a new capacity mechanism must be adopted. What’s new here? Capacity mechanisms are support schemes that remunerate generation availability, in addition to any revenue already gained from selling generated electricity on the market. Their primary objective is to guarantee that future capacity is made available, thus ensuring security of supply. So far, such mechanisms have, however, often neglected the availability of electric capacity offered across the borders, thus leading to higher than needed capacity with higher than necessary costs at a national level. The Commission is looking to implement a national market-wide capacity mechanism where capacity obligations are traded between electricity capacity providers (e.g. power plants or demand side operators) and electricity suppliers. Under the mechanism capacity providers offer capacity when demand is highest, for example during extreme winter conditions. In return for their available electricity capacity they receive certificates. Suppliers need to purchase certificates from capacity providers to cover the peak demand of their customers. These certificates can either be traded bilaterally, between providers and suppliers, or through regularly organized public auctions. The Market Design Initiative (Target Model) for Greece introduces a wider regional and European aspect first into the assessment of capacity needs and seeks to better coordinate national capacity mechanisms. Under the new rules, Member States should also set transparent and verifiable adequacy targets, having the freedom to choose their desired level of security of supply. The new rules on capacity mechanisms will complement existing state aid guidelines by creating a European framework and concrete rules for cross-border participation and lead to the integration of capacity markets. This new legal framework will further facilitate State aid control by the European Commission within both the Union and the Energy Community.

83
Session 10 - The union of national energy markets
Maria Olczak, Andris Piebalgs SECTOR COUPLING – THE NEW EU CLIMATE & ENERGY PARADIGM?
Maria Olczak: Florence School of Regulation, FSR Gas Area, Il Casale, Via Boccaccio 121, I-50133, Florence, Italy
Andris Piebalgs: Florence School of Regulation, FSR Gas Area, Il Casale, Via Boccaccio 121, I-50133, Florence, Italy
Overview The European Commission has launched a public consultation on a ‘Strategy for long-term EU greenhouse gas emissions reductions’, which publication is expected to coincide with the climate change negotiations (COP24) in Katowice (Poland) at the end of this year. The new long-term climate strategy will need to specify how the European Union is going to contribute to the achievement of the Paris Agreement 2°C and potentially 1.5°C targets. Both objectives require that in the second half of this century any emissions produced in the EU would need to be offset by negative emissions, e.g. through the Carbon Capture Use and Storage (CCUS) or reforestation. This means that the current EU strategy based primarily on the decarbonisation of the power sector would no longer be sufficient. Sector coupling (SC) binding together power and end-use sectors (e.g. transport) in order to integrate the rising share of variable renewable energy in the power sector offers a new framework that fits for this purpose. Method Although there are numerous papers and reports on sector coupling, the authors of this paper noticed that they mainly focus on some aspects of this concept (e.g. infrastructure), but neglect other elements. Moreover, there are only few studies proposing concrete steps required to put the idea of sector coupling into practice (applied research). In the first part of our research, we focused on the analysis of available literature and studies in order to address the following research questions: how to define sector coupling and what advantages can it offer to the EU long-term climate and energy strategy? In the second part, we presented the building blocks of SC and proposed a list of regulatory changes that need to be taken in each area in order to make the SC work. Results We adopted the following definition of SC: “co-production, combined, use, conversion and substitution of different energy supply and demand forms – electricity, heat and fuels” proposed by IRENA, IEA and REN21. Moreover, we explained its main advantages: environmental – decarbonisation of sectors that are difficult to decarbonise such as transport and industry and less need to use fossil-fuelled power plants as a source of flexibility; system value – integration of rising share of variable renewable energy into the power system; and infrastructural – better use of already existing gas infrastructure and limited need to build new electricity infrastructure, that can increase the social acceptance of the energy transition. It should be noted that one of the most important challenges to sector coupling remains the cost. In the second part, we presented the four building blocks of SC that in our view embrace its key aspects: infra- structure planning, system operation, regulatory framework, and continuous investments in the research, development and deployment.

84
Session 10 - The union of national energy markets We concluded our paper with a list of recommendations for the policy-makers. Conclusions If the European Union is to remain a credible partner in climate change negotiations process it needs to define its pathway towards achieving a net-zero emissions energy system. This ambitious objective requires that all the emitting sectors would need to contribute. We propose adopting a new climate and energy policy paradigm based on the concept of sector coupling enabling to conceive the EU energy system as a whole and continue to use the energy in the form of molecules and electrons. In order to become operational, the changes are required in four basic areas:
- infrastructure planning: linking the processes for the electricity and gas projects under the TYNDP frame- work, which may contribute to the elimination of potential overlaps and overinvestment.
- system operation: more integrated system would require better correlation between the electricity and gas market design and price structure.
- regulatory framework: to consider to ease unbundling rules for P2G, if market test doesn't provides enough evidence for the development of P2G installations
- research, development and deployment: could contribute to decreasing the capital costs for new projects. Moreover, especially in the early stages, companies, industries and the whole sectors may benefit from shared P2G or carbon-storage infrastructure.
References Global Energy Transformation: A Roadmap to 2050 (2018) IRENA Göransson L., Johnsson F. (2018) A comparison of variation management strategies for wind power
integration in different electricity system contexts, Wind Energy. Mac Kinnon, Michael A. et al. (2018) The role of natural gas and its infrastructure in mitigating
greenhouse gas emissions, improving regional air quality, and renewable resource integration, Progress in Energy and Combustion Science 64.
Maroufmashat A., Fowler M. (2017) Transition of Future Energy System Infrastructure; through Power-to-Gas Pathways, Energies 2017, 10, 1089.
Renewable Energy Policies in a Time of Transition (2018) IRENA, OECD/IEA and REN21.

85
Session 10 - The union of national energy markets
Marco Buso, Luciano Greco, Marina Bertolini COMPETITION AND REGULATION WITH SMART GRIDS
Marina Bertolini, dSEA, Centro Studi “Giorgio Levi Cases” and CRIEP, University of Padua, Italy, Marco Buso, dSEA and CRIEP, University of Padua, Italy,
Luciano Greco, dSEA and CRIEP, University of Padua, Italy
Overview The new competitive and regulatory framework have determined the need for infrastructural improvements on transmission and distribution networks. As a matter of fact, the traditional electric infrastructure was not built to support bi-directional power flows. In turn, new small power plants have been connected with a “fit and forget” approach that does not allow for an efficient energy use. As a consequence, renewable production power plants, if not efficiently managed, may cause system instability, i.e., supply-demand power unbalances on the grid. Besides efficiency considerations, such instability may involve a substantial market risk for operators, in particular for small producers. A solution to these challenges may come from technical devices and methods (e.g., smart inverters, batteries, bi-directional meters) improving the management of the connection of new renewable plants. In other terms, such technological de- vices aim at developing a Smart Grid (SG), i.e., “the modernization of the electricity delivery system so that it monitors, protects, and automatically optimizes the operation of its interconnected elements – from the central and distributed generator through the high-voltage transmission network and the distribution system, to industrial users and building automation systems, to energy storage installations, and to end-use consumers, and their thermostats, electric vehicles, appliances, and other household devices.” (Joskow, 2012). Methods In our work, we will focus on economic determinants of SG investments. Given the definition of SG, we characterize smart investments by the significant reduction in market risk for producers they determine, by dampening the impact of supply- demand shocks on (local) market equilibrium prices and quantities. We model the (local) electricity market as an oligopolistic game where risk-averse producers decide whether to enter the local market, taking into account its economic features – i.e., number of competitors, level of investments in SG. All producers use the essential facility, i.e., the local grid, that is managed by the Distribution System Operator (DSO). In particular, the DSO is the only investor in SG technologies. Through this theoretical model we study the interaction between SG investments and the competitive structure of the local market. We also characterize the optimal SG investment from a social welfare point of view. In the empirical analysis, we bring our theoretical predictions to data. Relying on Italian data on municipal grids, we estimate the SG investments decided by DSOs. Then, we compare optimal investments from the social point of view with actual ones. By comparative statics based on theoretical predictions and numerical simulations with the Italian dataset, we assess the optimality of alternative regulatory frameworks in terms of social welfare. In particular, we focus on frameworks that are likely to approximate the social optimum.

86
Session 10 - The union of national energy markets
Results From a theoretical point of view we find that the first best investment in SG is affected by local markets characteristics. Hence, the optimal regulation should con- sider the features of local markets. In particular, comparing input based and output based regulation, we find that output based incentives are more effective to enhance the investment in SG by an independent DSO. We confirm our result also through our simulations. In particular, we consider as an output the number of photovoltaic firms that are entering in the downstream markets. Conclusion This paper is a first step for the understanding of the optimal regulation that should be adopted in a context of SG investment. Not surprisingly, we find that an output based regulation is more effective to provide incentives for such investment that have the main advantage of improving the stability of the grid and, as a consequence, to decrease the level of uncertainty for small operators. References Joskow, P. L. (2012). Creating a smarter u.s. electricity grid. Journal of Economic Perspectives,
26(1):29–48

87
Session 11 - Global assessment of energy security, efficiency and sustainability
Michael Chesser, Jim Hanly, Damien Cassells FUEL POVERTY MEASUREMENTS IN AMERICA. WHO ARE THE MOST VULNERABLE?
Michael Chesser, Dublin Institute of Technology, Ireland, Jim Hanly, Dublin Institute of Technology, Ireland,
Damien Cassells, Dublin Institute of Technology, Ireland
Overview There are three different but related perspectives that make fuel poverty a distinct and serious problem: poverty and its reduction; health and well-being; climate change and the reduction of carbon emissions (Hills, 2011). It is important to properly define fuel poverty and which indicator is used to best gauge its extant for the process of policy formation as Moore (2012) notes “for determining the scale and nature of the problem, targeting a strategy and monitoring progress. A distinction needs to be made, however, between the definition required for policies at a national or regional level and those required for identifying the fuel poor on the doorstep.” (Moore, 2012 p. 19). However, there is debate about which approach to use when attempting to quantify fuel poverty, expenditure or consensual approach but both have their advantages and disadvantages; or is it best to use a multidimensional approach that incorporates the two (Legendre & Ricci, 2015, Aristondo & Onaindia, 2018, Okushima 2017). In this paper, we follow the procedure to measure energy poverty by three different approaches; expenditure approach, consensual approach and the multidimensional approach. The objectives of this paper are as follows; firstly, to present the statistics on the impact of several fuel poverty measurement approaches on the extent and composition of fuel poverty in the USA. Secondly, using econometric analysis to find the most influential demographic, socioeconomic and housing characteristics of those that are fuel poor households under each approach using in the 2015 American Household Survey (AHS) dataset which represents nearly 109 million households. To the best of our knowledge, the limited literature that investigates fuel poverty in the USA has yet to compare and contrast the three approaches available. Methods This paper constructed three fuel poverty indicator variables from each of the three approaches; expenditure, consensual and multidimensional. The 10% ratio indicator is used from the expenditure approach. The definition is households whose required fuel expenditure on energy services that exceeds 10% of their income. One of the drawbacks from this indicator is does not include a cut off for households with high income. As some wealthier households can overconsume their energy needs and therefore, can be classified as fuel poor under this measure. An alternative to using an expenditure approach indicator to quantify the extant of poverty fuel is the consensual approach indicator. This paper uses a consensual approach to energy poverty by analyzing it using subjective variable reported by the AHS, COLD. The COLD variable represents if a household reported that their house was uncomfortably cold for 24 hours or more last winter given such as the absence of central heating and the ability to keep a household warm due to poor insulation, affordability, inadequate heating capacity, etc. However, this approach is not without criticism, the issue of subjectivity of the indicators due to their error of exclusion, whereby people within the households may differ on what they constitute uncomfortable cold.

88
Session 11 - Global assessment of energy security, efficiency and sustainability
To overcome the short comings associated with the expenditure and consensual approaches when measuring fuel poverty, this paper will employ a multidimensional poverty framework approach as illustrated by Okushima (2017) and Alkire & Foster (2011). Under this measure a household is fuel poor if they are found to be fuel poor under both the expenditure approach and the approach. After this a complementary log-log regression model was constructed to examine the factors that influence the probability of a household being fuel poor under the multidimensional measure (Legendre & Ricci, 2015). Results Under the expenditure approach 22.16 % of American households where found to be fuel poor, while under the consensual approach 8.07% of American households where classified as fuel poor. The multidimensional approach reports that just 2.6% of American households are classified as fuel poor which represents 2.8 million households. Reviewing each approach under the lens of ownership or renting of the housing unit, renters represent a higher percentage of fuel poor under each measure. Similarly, households with a non-married couple represent a higher percentage of fuel poor under each measure. Investigating fuel poverty by the year the property was built; shows that in each decade starting from 1910’s until 2010’s those classified as fuel poor decreases as the age of their property decreases. Results from the economic model, where are multidimensional measure for fuel poverty was the dependent variable, were in line with the literature; with active married couple, less likely to be fuel poor than those in another form of relationship. A household with children under the age of 18 increase the likelihood of being fuel poor than those without children. If the household unit is owner occupied they are less likely to be fuel poor than those households that rent. A householder without some amount of college education is more likely to be fuel poor. Households that use portable heaters, fireplaces, furnace and stoves for heat are more likely to be fuel poor while households that use electric heat pump and steam/hot water system for heat are less likely to be fuel poor. Finally, household units built before the 1990’s more likely to be fuel poor. Conclusions This paper estimates fuel poverty in the USA under three approaches; expenditure (10% ratio indicator), consensual (inability to keep house warm) and a multidimensional approach. Using these three indicators led to contrasting results in terms of the extant of fuel poverty in the USA. An area for future study would be on the selection of the dimensions for poverty. This study combined the results from the expenditure approach and consensual approach to form a multidimensional indicator for fuel poverty. Under this indicator, it was found that 2.6% of the observations in the dataset where fuel poor which represents 2.83 million households. A policy to ensure the reduction of fuel poverty over the long-term should provide financial support (subsidies to replace boilers, insulate, walls, etc) for improving housing energy efficiency as older homes in our analysis are more likely to be fuel poor. Also, fuel poor households from our analysis are more likely to be renters so a policy should not be too restricting, and shouldn’t only relate to home ownership.

89
Session 11 - Global assessment of energy security, efficiency and sustainability
References
Alkire, S. and Foster, J., 2011. Counting and multidimensional poverty measurement. Journal of public economics, 95(7), pp.476-487.
Aristondo, O. and Onaindia, E., 2018. Inequality of energy poverty between groups in Spain. Energy, 153, pp.431-442.
Boardman, B., 1991. Fuel poverty: from cold homes to affordable warmth. Pinter Pub Limited.Hills, J., 2011. Fuel poverty: the problem and its measurement. Centre for the Analysis of Social Exclusion, London School Economics and Political Science.
Legendre, B. and Ricci, O., 2015. Measuring fuel poverty in France: Which households are the most fuel vulnerable?. Energy Economics, 49, pp.620-628.
Moore, R., 2012. Definitions of fuel poverty: Implications for policy. Energy Policy, 49, pp.19-26.
Okushima, S., 2017. Gauging energy poverty: A multidimensional approach. Energy, 137, pp.1159-1166.

90
Session 11 - Global assessment of energy security, efficiency and sustainability
Gianluca Carrino PLASTIC TO FUEL, AN INNOVATIVE SOLUTION FOR ENERGY SECURITY
Gianluca Carrino: Junior Analyst, AIEE, Viale Parioli 10, Rome, Italy
Overview The uncontrolled production of polymers has become a fundamental issue for our ecosystem. Large quantities of plastics and microplastics are continuously ending up in our oceans entering in the diet of fish and birds as well as our own food. With the unrestrained increase of population and consumption the total number of polymers produced and thrown irresponsibly into the environment is continuously growing. Efficient actions must be taken to prevent plastic waste from being dispersed into the environment. It has been estimated that 311 million tons of plastic were produced globally in 2014 (335 in 2016); 40% of it goes to landfill, 32% is dispersed in the environment and 14% is burned in incineration plants. Only the 14% is recovered but just 8% is actually really recycled. The materials used in the “plastic to fuel” conversion are: high-density polyethylene (shopping bag, detergent bottles), low-density polyethylene (food packaging), polypropylene (microwave dishes, food containers) and polystyrene (plastic cutlery, hot drink cups, take-away clamshells). Method In short, “plastic to fuel” is an innovative technology to produce fuel from non-recyclable plastic using renewable energy. By doing so the non-recyclable plastic would acquire an intrinsic value, therefore constituting an incentive for their correct management and preventing them from being dispersed in the environment. A technology to transform plastics into fuel is called Pyrolysis (Pyro = heat. Lysis = break down). The process determines the breaking of the molecular chains that make the plastic rigid. This conversion works in absence of oxygen, therefore there is no combustion and so it doesn’t produce any emissions ( zero CO2). The challenge is to turn plastic waste into fuel, but how does this conversion work? Firstly, renewable energy (purchased from the electricity grid) and non-recyclable plastics are injected into the system. After the thermal conversion process - made in the absence of oxygen (without combustion and CO2 emissions) - the resulting fuels are: liquid fuels with low carbon content (similar to petrol, similar to diesel ones); syngas, which covers the energy needs of the process when renewable energy is not available from the electricity grid; char, used in agriculture, construction and cement. Results It is important to quantify how much plastic waste is necessary to produce fuel to better understand the results. GRT Group has declared, that 800 liters of fuel can be produced from 1 ton of plastic. Turning plastics into fuel would save significant portions of land otherwise destined for landfills (a standard 4-line plant would save 26 hectares of land a year). A standard 4-line plant would also be able to treat about 20,000 tons per year of non-recyclable plastic, reducing the amount of waste dispersed in the environment.

91
Session 11 - Global assessment of energy security, efficiency and sustainability Converting plastic into fuel has important advantages such as environmental benefits (low pollution), cash from trash, less amount of oil to be imported, increased employment through a circular economy (the birth of plastic collection companies) linked to the territory and to the low environmental impact and fitting with the concept of “smart city” in an optic of sustainable future. Conclusion “Plastic to fuel” helps the transition to a model that is environmentally friendly and economically advantageous. By using plastics and converting them into energy we would give intrinsic value to disposable waste that would no longer be irresponsibly thrown into the environment but rather collected and reused to create fuel for the transport sectors and to generate electricity by reducing the use of oil and gas, increasing our energy independence. Plastic damages wild and human life, actions must be put in place to avoid waste. Attributing economic value to plastics waste is an incentive to properly dispose it and help environment protection. In conclusion, adopting “Plastic to fuel” technology communities will have the potential to create some of their own fuel locally, providing economic and environmental benefits, while removing a portion of the waste stream that potentially causes harm to their waterways, reefs, and tourism (Cash from Trash). References REA , Gasification and Pyrolysis,(http://www.r-e-a.net/upload/rea_gp_leaflet_june2013_final.pdf) Ellen Macarthur Foundation, The new plastics economy, rethinking the future of plastics
(https://www.ellenmacarthurfoundation.org/assets/downloads/EllenMacArthurFoundation_TheNewPlasticsEconomy_Pages.pdf)
Association of plastics manufactures, Plastics- the Facts 2017, PlasticsEurope (https://www.plasticseurope.org/application/files/5715/1717/4180/Plastics_the_facts_2017_FINAL_for_w
ebsite_one_page.pdf) NGI News, When plastic is part of the food chain (https://www.ngi.no/eng/News/NGI-News/When-
plastic-is-part-of-the-food-chain) ScienceAdvances, Production, use, and fate of all plastics ever made (http://advances.sciencemag.org/content/3/7/e1700782) GRT Group, Circular economy industries (https://www.grtgroup.swiss/environmental/plastic-waste/) Power Technology, Turning waste into power: the plastic to fuel projects (https://www.power-
technology.com/comment/plastic-to-fuel/) Waste Plastic to Fuel Oil Pyrolysis Plant (http://www.huayinenergy.com/products/HY-
5th_Waste_to_Oil_Pyrolysis_Machine/?gclid=CjwKCAiAlb_fBRBHEiwAzMeEdgHacEhYG2qq7sK3SSwOWv5LpwCdoh-IaX5TmmxGP1lLowL1TfIllRoC3-QQAvD_BwE)
Ocean Recovery Alliance, Plastics to fuel project developers’s guide (https://plastics.americanchemistry.com/Education-Resources/Publications/2015-Plastics-to-Fuel-
Developers-Guide.pdf) Plastic Groups, Plastics-to-Fuel Resources (https://plastics.americanchemistry.com/Product-Groups-and-
Stats/Plastics-to-Oil/Plastics-to-Oil-Resources.html) The Conversation, If we can’t recycle it, why not turn our waste plastic into fuel? (https://theconversation.com/if-we-cant-recycle-it-why-not-turn-our-waste-plastic-into-fuel-96128)

92
Session 11 - Global assessment of energy security, efficiency and sustainability
Daisy de Selliers, Catalina Spataru ENERGY-MATERIALS NEXUS FOR A LOW CARBON ENERGY SYSTEM
Daisy de Selliers, UCL Energy Institute, U.K. Overview Successful implementation of the United Nations Sustainable Development Goals (SDGs) and of the Paris Agreement entails the decarbonisation of the energy system and the security of energy supply. The development of a low-carbon system requires a shift towards low carbon technologies, such as solar and wind power, electro mobility, energy storage and energy efficiency. Those technologies involved in the clean energy transition require specific materials and metals and turn out to be more material intensive than the traditional fossil fuel-based energy system. Therefore, material requirements are changing and the energy-materials nexus becomes increasingly important for research consideration. Various challenges such as resource depletion, grade declines, market imbalances, demand shocks and uncertainty can threaten the supply of some materials and metals, and thereby slow down the energy transition and threaten the security of energy supply. Such bottlenecks can affect the implementation of the SDGs. This paper examines the implications of the energy-material nexus on energy security and sustainable development, identifies the linkages between the energy-material nexus and the SDGs and develops a framework to understand the trade-offs and synergies in key domains that are impacted by decisions on materials and energy. Findings show that linkages can be established with all SDGs, showing the importance of assessing material requirements not only for the energy sector, but also for all sectors of the economy. Therefore, there is a call for interdisciplinary research on the risks and challenges related to the energy-material nexus and on the development of solutions to overcome the barriers that may slow down the transition to a sustainable low carbon energy system. Methods The research method can be summarized as follows:
(1) a reviewed expert elicitation process involving literature from diverse disciplines spanning environment and social sciences, and
(2) preliminary scanning of published evidence, concerning relationships between energy systems and materials and development relevant to the subject matter of each specific SDG and Target
On the basis of that process, the study identifies challenges threatening material supply security for the development of a low carbon energy system. It develops a framework to understand the linkages, the trade-offs and the synergies between the SDGs and the energy-material nexus challenges. Results Various challenges can be highlighted with impacts on material supply security and thereby the development of a low carbon and secure energy system, which can be grouped into 7 key themes:

93
Session 11 - Global assessment of energy security, efficiency and sustainability RESOURCE DEPLETION: Available reserves from conventional mining decline (McLellan
et al. 2016). Estimation of resources and reserves involves uncertainty (WWF and Ecofys 2014), which can be due to inaccurate geological data quality, inconsistencies in reporting reserve and resource, likely unknown reserves, changes in profitability of mining projects, and potential interdiction of utilization of some resources due to local conditions (Grandell et al. 2016).
MATERIAL PRODUCTION: Issues with material production include slow reaction of production capacities, grade declines and energy costs (Leopoldina 2018; de Koning et al. 2018; Fizaine and Court 2015; McLellan et al. 2016).
CLIMATE POLICIES: The 2°C temperature target adopted by the Paris Agreement will require radical changes (Tokimatsu et al. 2018). Climate policies, or any policy aiming at fostering the low carbon transition, can impact the demand for materials and metals.
UNCERTAIN DEMAND: The demand for many materials is expected to increase as a result of population growth, economic growth, especially in developing countries, and technological developments. However, future material demand is complex to predict. One important source of uncertainty is the future technological development and the expansion of technologies (Roelich et al. 2014). In addition, since various industries are in competition for critical materials and metals, their availability does not only depends on the demand from the energy sector, but also from other sectors (Leopoldina 2018).
ENVIRONMENT: The extraction of specific materials or metals is associated with social or environmental impacts locally or globally, such as water and soil contamination, waste and air pollution (de Koning et al. 2018). The assessment of socio-environmental impacts is complicated by the fact that the supply chain is often geographically distributed since extraction, processing, refining, manu-facturing and end-use often occur in various regions (McLellan et al. 2016).
GEOPOLITICS: Bottlenecks can occur due to geopolitical constraints that are difficult to eliminate in the short term (WWF and Ecofys 2014). The concentration of material suppliers can represent a source of concern. A decreasing number of countries and companies control an increasing share of material supply (Leopoldina 2018; Roelich et al. 2014). Related fears were amplified when China imposed export restrictions on various materials, including rare earth elements (Pavel et al. 2017). In addition, political instability in some metal-producing countries raised concerns about the future metal availability (Elshkaki and Graedel 2013).
COMMODITY MARKETS: Commodity market imbalances can also represent a challenge to material supply security. In addition, price volatility has been identified as an important source of uncertainty to estimate future material requirements and production (Dawkins et al. 2012).
Based on this identification of challenges, a framework linking the SDGs and each challenge has been develop and highlights the areas where synergies and trade-offs can be found between specific SDGs and the energy-materials nexus. This enables to point out direction for further research to develop solutions to achieve the 2030 Agenda of Sustainable Development.

94
Session 11 - Global assessment of energy security, efficiency and sustainability Those include research on recycling potential of materials and end-of-life products, material efficiency improvement, options for material substitution, technological performance improvements, assessment of environmental impacts, enhanced data quality and transparency. Four attributes to enable promising research advances are multidisciplinary, cross-sectorial, dynamic and long-term perspective. In addition, the role of stakeholders, i.e. industries, governments, communities, policymakers and investors, is highlighted as important for research, but also for decision-making and action. The creation of multi-stakeholders partnerships is not only a SDG in itself, but also an essential means for the achievement of all SDGs. Conclusions To conclude, current and future challenges arise from the changing requirements for materials. This is mainly due to the development of a low carbon economy and the integration of clean technologies. The main concerns include reserve depletion, slow reaction of production capacities, grade decline, environmental and energy costs of material production, unpredictable demand shocks and policy effects, geopolitical constraints and market imbalances. Moreover, several materials are considered as critical, such as lithium, copper, silver and some rare earth elements. Further research on the energy- material nexus challenges needs to be oriented in two directions. First, research must be specific to each technology and each material to understand features such as technological developments, material criticality, recycling and substitution potential. Then, there is a need to study the energy-material nexus in a broader context, conduct inclusive and multidisciplinary analyses, consider the system as a whole with its changing dynamics, and assess the implications on each dimension of the 2030 Agenda for Sustainable Development. Finally, the participation and mobilization of all stakeholders, including industries, policymakers and researchers, is necessary to develop sustainable solutions for a low carbon system, make appropriate and thoughtful decisions, and achieve the SDGs
References
Adler, Rebecca;, Marius; Claassen, Linda; Godfrey, and Anthony Turton. 2007. “Water, Mining, and
Waste: An Historical and Economic Perspective on Conflict Management in South Africa.” The Economics of Peace and Security Journal 2(2).
Arvidsson, Rickard and Björn A. Sandén. 2017. “Carbon Nanomaterials as Potential Substitutes for Scarce Metals.” Journal of Cleaner Production 156:253–61.
Dawkins, Elena, Matthew Chadwick, Katy Roelich, and Richard Falk. 2012. “Metals in a Low-Carbon Economy: Resource Scarcity, Climate Change and Business in a Finite World.” SEI Publications.
Deetman, Sebastiaan, Stefan Pauliuk, Detlef P. Van Vuuren, Ester Van Der Voet, and Arnold Tukker. 2018. “Scenarios for Demand Growth of Metals in Electricity Generation Technologies, Cars, and
Electronic Appliances.” Environmental Science and Technology 52(8):4950–59. Deloitte. 2014. “Mining Spotlight on : Commodity Market Imbalances.” Deloitte Publications. Elshkaki, Ayman and T. E. Graedel. 2013. “Dynamic Analysis of the Global Metals Flows and Stocks
in Electricity Generation Technologies.” Journal of Cleaner Production 59:260–73. European Commission. 2012. Forward Looking Workshop on Materials for Emerging Energy
Technologies. Fizaine, Florian and Victor Court. 2015. “Renewable Electricity Producing Technologies and Metal
Depletion: A Sensitivity Analysis Using the EROI.” Ecological Economics 110:106–18. Fuso Nerini, Francesco, Julia Tomei, Long Seng To, Iwona Bisaga, Priti Parikh, Mairi Black, Aiduan
Borrion, Catalina Spataru, Vanesa Castán Broto, Gabrial Anandarajah, Ben Milligan, and Yacob

95
Session 11 - Global assessment of energy security, efficiency and sustainability
Mulugetta. 2018. “Mapping Synergies and Trade-Offs between Energy and the Sustainable Development Goals.” Nature Energy 3(1):10–15.
Gao, Yun, Xiang Gao, and Xiaohua Zhang. 2017. “The 2 °C Global Temperature Target and the Evolution of the Long-Term Goal of Addressing Climate Change—From the United Nations Framework Convention on Climate Change to the Paris Agreement.” Engineering 3(2):272–78.
Grandell, Leena, Antti Lehtilä, Mari Kivinen, Tiina Koljonen, Susanna Kihlman, and Laura S. Lauri. 2016. “Role of Critical Metals in the Future Markets of Clean Energy Technologies.” Renewable
Energy 95(November 2017):53–62. Grandell, Leena and Andrea Thorenz. 2014. “Silver Supply Risk Analysis for the Solar Sector.”
Renewable Energy 69(September):157–65. Habib, Komal and Henrik Wenzel. 2016. “Reviewing Resource Criticality Assessment from a
Dynamic and Technology Specific Perspective - Using the Case of Direct-Drive Wind Turbines.” Journal of Cleaner Production 112(January):3852–63.
Hayes, Sarah M. and Erin A. McCullough. 2018. “Critical Minerals: A Review of Elemental Trends in Comprehensive Criticality Studies.” Resources Policy (June):1–8.
Kim, Junbeum, Bertrand Guillaume, Jinwook Chung, and Yongwoo Hwang. 2015. “Critical and Precious Materials Consumption and Requirement in Wind Energy System in the EU 27.” Applied Energy 139:327–34.
de Koning, Arjan, René Kleijn, Gjalt Huppes, Benjamin Sprecher, Guus van Engelen, and Arnold Tukker. 2018. “Metal Supply Constraints for a Low-Carbon Economy?” Resources, Conservation and Recycling 129(August 2017):202–8.
Leopoldina. 2018. “Raw Materials for the Energy Transition: Securing a Reliable and Sustainable Supply.” Leopoldina Publications.
Månberger, André and Björn Stenqvist. 2018. “Global Metal Flows in the Renewable Energy Transition: Exploring the Effects of Substitutes, Technological Mix and Development.” Energy Policy 119(January):226–41.
McLellan, Benjamin, Eiji Yamasue, Tetsuo Tezuka, Glen Corder, Artem Golev, and Damien Giurco. 2016. “Critical Minerals and Energy–Impacts and Limitations of Moving to Unconventional
Resources.” Resources 5(2):19. Ministry of Foreign Affairs of Japan. 2015. “Chapter 2: The 2030 Agenda for Sustainable
Development.” White Paper on Development Cooperation 2015 10–20. Moss, Ray, Evangelos Tzimas, Peter Willis, Josie Arendorf, Adrian Chapman, Nick Morley, Edward
Sims, Ruth Bryson, and James Pearson. 2013. Assessing Rare Metals as Supply-Chain Bottlenecks in Low-Carbon Energy Technologies. European Commission.
Papathanasopoulou, Eleni, Nicola Beaumont, Tara Hooper, Joana Nunes, and Ana M. Queirós. 2015. “Energy Systems and Their Impacts on Marine Ecosystem Services.” Renewable and Sustainable Energy Reviews 52(December):917–26.
Pavel, Claudiu C., Roberto Lacal-Arántegui, Alain Marmier, Doris Schüler, Evangelos Tzimas, Matthias Buchert, Wolfgang Jenseit, and Darina Blagoeva. 2017. “Substitution Strategies for Reducing the Use of Rare Earths in Wind Turbines.” Resources Policy 52(April):349–57.
Roelich, Katy, David A. Dawson, Phil Purnell, Christof Knoeri, Ruairi Revell, Jonathan Busch, and Julia K. Steinberger. 2014. “Assessing the Dynamic Material Criticality of Infrastructure Transitions: A Case of Low Carbon Electricity.” Applied Energy 123:378–86.
Simmons, John; Reller, Armin; Ashfield, Morag; Rennie, Cameron. 2011. Materials Critical to the Energy Industry.
Tokimatsu, Koji, Mikael Höök, Benjamin McLellan, Henrik Wachtmeister, Shinsuke Murakami, Rieko Yasuoka, and Masahiro Nishio. 2018. “Energy Modeling Approach to the Global Energy- Mineral Nexus: Exploring Metal Requirements and the Well-below 2 °C Target with 100 Percent Renewable Energy.” Applied Energy 225(June):1158–75.
Tokimatsu, Koji, Shinsuke Murakami, Benjamin McLellan, Mikael Höök, Rieko Yasuoka, and Masahiro Nishio. 2017. “Global Energy-Mineral Nexus by Systems Analysis Approaches.” Energy Procedia 105:3345–48.

96
Session 11 - Global assessment of energy security, efficiency and sustainability UKERC. 2014. “Materials Availability for Low-Carbon Technologies : An Assessment of the
Evidence.” 1–48. United Nations. 2015. Transforming Our World: The 2030 Agenda for Sustainable Development.
Victor, David;, Dadi; Zhou, Essam Hassan Mohamed; Ahmed, Pradeep; Dadhich, Jos; Olivier, H. Holger; Rogner, Kamel; Sheikho, and Mitsutsune; Yamaguchi. 2014. Climate Change 2014: Mitigation of Climate Change. Contribution of Working Group III to the Fifth Assessment Report of
the Intergovernmental Panel on Climate Change. Cambridge (UK) and New York (USA). Vidal, Olivier, Bruno Goffé, and Nicholas Arndt. 2013. “Metals for a Low-Carbon Society.” Nature
Geoscience 6(11):894–96. Viebahn, Peter, Ole Soukup, Sascha Samadi, Jens Teubler, Klaus Wiesen, and Michael Ritthoff. 2015.
“Assessing the Need for Critical Minerals to Shift the German Energy System towards a High Proportion of Renewables.” Renewable and Sustainable Energy Reviews 49:655–71.
World Bank. 2017. “The Growing Role of Minerals and Metals for a Low Carbon Future.” World Bank Publications (June).
World Economic Forum. 2015. Mining & Metals in a Sustainable World 2050. WWF and Ecofys. 2014. Critical Materials for the Transition to a 100 % Sustainable Energy Future. Zhou, Baolu, Zhongxue Li, and Congcong Chen. 2017. “Global Potential of Rare Earth Resources and
Rare Earth Demand from Clean Technologies.” Minerals 7(11):203.

97
Session 11 - Global assessment of energy security, efficiency and sustainability
Jani Mikkola, Liinu Koskela, Peter D. Lund ANALYSIS OF ENERGY SYSTEM RESILIENCE UNDER WICKED SOCIO-ENVIRONMENTAL DISRUPTIONS – A FRAMEWORK
Jani Mikkola, Aalto University, School of Science, Finland - PO.Box 15100, 00076 AALTO, Liinu Koskela, Aalto University, School of Science, Finland
Peter D. Lund, Aalto University, School of Science, Finland
Overview Reliable and stable energy supply is one of the most fundamental requirements for a modern society. Energy supply should be guaranteed even in most severe circumstances. However, several factors threaten the continuous operation [1], including extreme weather events [2], [3], human errors, component break-downs, cyber threats [4], intentional attacks, and political issues [5]. The resilience in power systems means both efficient prevention of such issues and quick recovery from them. Increasing the resilience thus requires versatile actions from all sides of societies: from politicians to end users and power system operators. While numerous studies have been conducted on energy security and power system resilience [6], [7], this work presents a framework where social and environmental aspects and human-made decisions are combined with the technical performance of the power system. The purpose is to find out systemic phenomena impacting the resilience and to get a better understanding of most severe factors threating stable power supply and the functioning of a society. This work was supported by the Research Council at the Academy of Finland (grant number 312623). Method This work presents a modeling framework for the analysis of energy system resilience under socio-environmental disruptions. A simplified representation of the model is shown in Figure 1. The idea is to analyze how different disruptions affect the energy system, and what kind of impacts this has on societies. Policies and decision-making affect directly the resilience and the operation under disruptions, and thus they are included in the model. The decision-making can be split into proactive and reactive parts. The proactive decisions mean long-term policies that try to increase the resilience beforehand, and thus minimize consequences from disruptions. Reactive decisions include operational choices and actions that are taken to minimize the negative effects and to enable quick recovery from a disruption. The model consists of several layers. The core is a macro-level energy system model which is linked through a transmission system (Ti-i') to a regional local level (nodes ij). The nodes in the distribution system (Dij-ij') have different characteristics that describe their resilience to socio-environmental disruptions. Power production capacity and power consumption are defined for each node. On top of that each node has several socioeconomic factors Fijk to describe the nodes and the socioeconomic impacts caused by the disruptions.

98
Session 11 - Global assessment of energy security, efficiency and sustainability
These factors can be, for example, population, industrial activity, and income profiles. In addition, the sensitivity to disruptions Sr,ij is defined for the nodes. The sensitivity of each node to different disruptions r depends on the socioeconomic factors as well as the geographical location and technical parameters. Possible disruptions that could be modeled include extreme weather events, cyber-attacks, component break-downs and cascading failures, and operator errors. To assess the sensitivities Sr,ij and estimate the probabilities of disruptions, data is gathered from literature and historical datasets (e.g., weather data). In addition, experts from different fields are interviewed during the modeling work. When a disruption is applied to the model, the model calculates first what direct consequences the disruption has on the energy system. Then it is checked if the power demand of all the nodes can be satisfied by considering the production capacity in the nodes and the transmission and distribution capacity between them. If this is not possible, the decision-making system must decide about the actions to be taken. In a severe power shortage, for example, it might be necessary to shut down the power supply from some areas to secure the operation of the most vital functions of the society. As an option to a separate decision-making system in the model, it is possible to computationally optimize the actions that cause the least harm to the society. Results The model is applied to the case of Finland. The target with the model was to find systemic phenomena behind the power system resilience and security, and to understand how the severe and concurrent disruptions can affect the Finnish society at the worst. Based on the results, the aim is to give policy recommendations that would efficiently and quickly increase the resilience of the national power system.

99
Session 11 - Global assessment of energy security, efficiency and sustainability The first simulations were done with scenarios of strong wind storms combined with high flooding. These phenomena are to increase in the future due to the global warming [8]. The model was able to show how some of the regions suffer severely and how different areas and social functions must be prioritized over each other in these situations. Furthermore, the model was used to analyze different topologies of distribution networks. Detailed results are given in the full conference presentation. Conclusions A power system model, which includes socio-economic factors and decision-making procedures, was developed in this work. The goal was to better understand the different systemic mechanisms affecting the resilience of power systems and thus societies in general. The model was demonstrated with the power system of Finland. Based on the study, this type of a modeling framework can produce valuable information in the design and management of resilient power systems as well as decision making concerning the resilience aspect of energy supply and the social consequences of the possible threats. References P. Hines, J. Apt, and S. Talukdar, “Large blackouts in North America: Historical trends and policy
implications,” Energy Policy, vol. 37, no. 12, pp. 5249–5259, Dec. 2009. Y. Wang, C. Chen, J. Wang, and R. Baldick, “Research on Resilience of Power Systems Under Natural
Disasters - A Review,” IEEE Trans. Power Syst., vol. 31, no. 2, pp. 1604–1613, Mar. 2016. M. Panteli and P. Mancarella, “Influence of extreme weather and climate change on the resilience of
power systems: Impacts and possible mitigation strategies,” Electr. Power Syst. Res., vol. 127, pp. 259–270, Oct. 2015.
R. Arghandeh, A. von Meier, L. Mehrmanesh, and L. Mili, “On the definition of cyber-physical resilience in power systems,” Renew. Sustain. Energy Rev., vol. 58, pp. 1060–1069, May 2016.
D. K. Jonsson, B. Johansson, A. Månsson, L. J. Nilsson, M. Nilsson, and H. Sonnsjö, “Energy security matters in the EU Energy Roadmap,” Energy Strateg. Rev., vol. 6, pp. 48–56, Jan. 2015.
B. W. Ang, W. L. Choong, and T. S. Ng, “Energy security: Definitions, dimensions and indexes,” Renew. Sustain. Energy Rev., vol. 42, pp. 1077–1093, Feb. 2015. G. A. Pagani and M. Aiello, “The Power Grid as a complex network: A survey,” Phys. A Stat. Mech. its
Appl., vol. 392, no. 11, pp. 2688–2700, Jun. 2013. M. E. Mousavi, J. L. Irish, A. E. Frey, F. Olivera, and B. L. Edge, “Global warming and hurricanes: the
potential impact of hurricane intensification and sea level rise on coastal flooding,” Clim. Change, vol. 104, no. 3–4, pp. 575–597, Feb. 2011.

100
Session 12 - The market prospect of electric vehicles
Gabriele Grea, Raffaele Galdi THE IMPACT OF ELECTRIC VEHICLES ON AIR QUALITY RELATED HEALTH COSTS
Gabriele Grea, Università Commerciale Luigi Bocconi, Via Roentgen 1, 20136, Milan, Italy
Overview Air pollution represents a dramatical issue in Italy’s principal cities, and the presence of a fleet dominated by the internal combustion engine (ICE) based vehicles is a major driver for emissions. Poor air quality affects human health, causing premature deaths and chronic diseases. Electric vehicles may provide a relevant contribution to the solution, as their tailpipe emissions are equal to zero. Method Building on the results of the analyses run by Cambridge Econometrics for European Climate Foundation, providing and estimation of future emissions (PM and NO) through the macro-economic model E3ME, the results of different electrification scenarios have been estimated through a range of impact functions on citizens’ health. Specific functions have been adapted for the main relevant health impacts, and represented in terms of monetary value according to current sanitary costs and to the willingness to pay principle. Results The model proposed focuses on tailpipe emissions of cars, representing only a very specific component of the differential generated impact comparing electric vehicles and traditional ICE propulsions. Moreover, the analysis focuses on a limited range of health related effects, for which medical literature has produced in depth analyses on the correlation with air quality. Results show that estimated benefits can partially contribute to the financing of support measures for the electromobility market take up. Conclusions According to the analysed scenarios, benefits on health and related costs generated by the introduction of relevant shares of electric vehicles are distributed over a long range, while the costs (infrastructure, financial measures) for supporting the market take up are concentrated in the first years. References AIRUSE-LIFE+ (2016) a harmonized PM speciation and source apportionment in five southern European
cities DG MOVE – Handbook on External Costs of Transport 2014 Harrison P, 2018, Fuelling Europe’s Future: How the transition from oil strengthens the economy HEIMTSA (Health and Environment Integrated Methodology and Toolbox for Scenario Assessment): EU
Sixth Framework Program, runtime 2007-2011 INTARESE (Integrated Assessment of Health Risks of Environmental Stressors in Europe): EU Sixth
Framework Program, runtime 2005-2010 Karagulian F. et Al (2015) Contributions to cities' ambient particulate matter (PM): A systematic review of
local source contributions at global level WHO-OECD (2015) Economic cost of the health impact of air pollution in Europe

101
Session 12 - The market prospect of electric vehicles
Carolina Merighi ENERGY TECHNOLOGY, CASE OF ELECTRIC VEHICLES, WHY IS IT SO HARD TO CHANGE COURSE?
Overview Technology is a “crucial mediator” between the energy system and the environment, giving insight into complex energy challenges (Kuzemko et al., 2016:28). Energy technology, linked to the changing of social practices, is a powerful driving force towards a more sustainable future. The car industry was itself an innovation that came out at the end of the 19th century’ industrial revolution. An innovation, as it had a huge impact on society in representing a much faster mode of transportation than the previous one, being carriages trained by horses. Innovation often challenges social rules and expectations as well as existing infrastructure. Innovation can be too shocking and have unintended consequences which scientifically takes time for people to understand. Now, as the threat of climate change is becoming increasingly more apparent, with the emergence of electric cars there is potential for a socio-technical transition, but why is it still so hard to change course? Methods In order to solve the research problem at hand, a literature review of the topic and an exploration of the theories around disruptive technology was carried out. To understand change in energy technology, this paper views innovation as sequential rather than disruptive. A Neo-Classical, deterministic view believes that there is a given rate of technical change that follows the natural evolution of markets throughout history. Holding a Neo-Schumpeterian view over Neo-Classical allows to accommodate the “role of institutions, system of governance and government policies upon the rate of innovation” (Kuzemko et al., 2016: 194). The innovation and the diffusion of new technologies are also very dependent on the value network and sociocultural time period. Results In brief, it is the socio-technological co-evolution that is at play in preventing electric cars from taking hold: institutional structures, which co-evolved in conjunction with the incumbent combustion, engine technology. This is the lens to answer why electric cars have a hard time breaking the market. System rigidness is a slow evolution that has been consolidated through different means, being path dependencies, governments and their policies, social norms and influences that ultimately shaped the acceptance of a new product. Conclusions Bearing in mind that energy transition is an enormous task that impacts the entire system and is often oversimplified. Innovations to take hold require both political and private sector leadership. The global trend of decarbonisation towards more sustainable forms of energy production and consumption has opened opportunities for EVs that not only bring climate change mitigation but also benefits in economic growth, energy access and security.

102
Session 12 - The market prospect of electric vehicles Overall, EVs have had a conceptual breakthrough but not an enough tangible and visible one due to system rigidness in the role of the state and their policies and in the power structure of players that have created the current carbon footpath dependency making it hard to change course towards more electric cars. References Bakker, S. (2010). The car industry and the blow-out of the hydrogen hype. Energy Policy, 38(11),
pp.6540-6544. Brand, S., Petri, M., Haas, P., Krettek, C. and Haasper, C. (2013). Hybrid and electric low-noise cars cause
an increase in traffic accidents involving vulnerable road users in urban areas. International Journal of Injury Control and Safety Promotion, 20(4), pp.339-341.
CCC, (2016). Pathways to high penetration of electric vehicles. The Committee on Climate Change, Element Energy, Cambridge. [online]
IEA, (2017). IEA World Energy Outlook 2017. International Energy Agency. IEA EV, (2017). Global EV Outlook 2017. International Energy Agency, Paris.
Jamasb, T. and Köhler, J. (2007). Learning Curves for Energy Technology: A Critical Assessment. University of Cambridge.
Kuzemko, C., Keating, M. and Goldthau, A. (2016). The global energy challenge. 1st ed. London: Palgrave Macmillian.

103
Session 12 - The market prospect of electric vehicles
Amela Ajanovic, Reinhard Haas ON THE ENVIRONMENTAL BENIGNITY AND THE MARKET PROSPECTS OF ELECTRIC VEHICLES
Amela Ajanovic, Reinhard HAAS, Energy Economics Group, Vienna University of Technology, Austria Overview Currently, the electrification of mobility is seen as one of the key strategies for heading towards a sustainable transport system. Specifically, Electric vehicles (EVs) are considered as an important means to cope with current environmental problems in transport. Many governments have set goals to increase number of electric vehicles. According to the Paris Declaration global electric vehicles stock should over 100 millions. Different types of electric vehicles are already available on the market. However, all these automotive technologies have some advantages and disadvantages compared to conventional internal combustion engine (ICE) vehicles as well as different electrification level. However, there are three major barriers for a broader market penetration: (i) their high capital costs, (ii) limited driving ranges and (iii) doubtful environmental benignity. The core objective of this paper is to investigate the future prospects of various types of EVs from economic and environmental point-of-view for the average of Western European countries. Method Our method of approach is based on calculation of total cost of ownership of electric vehicles in comparison to conventional cars and a life-cycle approach to assess the environmental benignity. We have considered the whole energy supply chain including different primary energy sources used for fuel or energy production. The most crucial parameters in this context are kilometers driven per year and depreciation time of the car as well as battery and interest rate.
Fig. 1. Development of the lithium-ion battery prices
(https:// cleantechnica.com/2017/12/11/batteries-keep-getting-cheaper/)

104
Session 12 - The market prospect of electric vehicles For the analysis of future market prospects we conducted a dynamic economic assessments (incl. technological learning) and scenario developments based on policies implemented and price development, based on technological learning regarding investment costs of batteries. As an example Figure 1 shows development of the lithium-ion battery prices in period 2010-2016.
Fig. 2. CO2 emissions per km driven for various types of electric vehicles in comparison to conventional cars
Results The major results are: Regarding the environmental assessment: Battery electric vehicles (BEV) and fuel cell vehicles (FCV) are seen as an environmentally friendly option for passenger car transport. However, only in the case that electricity and hydrogen are produced from renewable energy sources, BEV and FCV could significantly contribute to the reduction of GHG emissions, see Fig. 2. Total environmental benefits of electric vehicles are very dependent on the available electricity mix, and their future environmental benefits could be significantly improved with the increasing use of renewable energy in electricity generation. plug-in hybrids (PHEV) and range extenders (REXs). However, these technologies have lower CO2 emissions in the whole energy supply chain than conventional vehicles but unlike BEV they are not zero-emission vehicles at the point of use. The number of km driven has a higher impact on total mobility costs than the learning rate. Hence, the use of EVs as taxis and in car-sharing leads to the best economic performance. The most popular electric vehicles are currently hyb. Regarding the low driving range in comparison to conventional vehicles this problem could be reduced at least partly with hybrid electric vehicles (HEVs). They have only slightly higher costs and similar operating ranges as conventional vehicles. But since they are dependent on fossil fuels, they can only be seen as energy efficiency measure.

105
Session 12 - The market prospect of electric vehicles However, they can serve as a bridging technology – as long as BEVs and fuel cell vehicle do not gain high popularity – and together with PHEVs and REX contribute to faster technological learning and reduction in battery costs. Regarding the economic assessment: The major disadvantages of battery electric vehicles (BEVs) are the high capital costs, mainly due to the battery. Fig. 3 and 4 describe the cost structure of total costs of driving for different types of cars in 2016 and in 2050. We can see that the advantages of alternative powertrains regarding lower fuel costs are more than compensated by higher capital costs in 2016, see Fig. 3.
Fig. 3. Total costs of driving passenger cars per per year in 2016 (Average car capacity: 80 kW,
different driving ranges based on historical experience).
Fig. 4. Total costs of driving passenger cars per per year in 2050 (Average car capacity: 80 kW, different driving ranges based on historical experience).

106
Session 12 - The market prospect of electric vehicles The specific capital costs are the component of the driving costs with the highest magnitude for all investigated alternative powertrains (and conventional cars as well). With respect to HEV, BEV and FCV of course also the actual costs for batteries as well as for fuel cells are taken into account. However, these costs can be reduced until 2020 based on technical improvement potentials. By 2050 costs of most cars will even out, see Fig 4. Yet, diesel cars still remain cheapest, mainly because of more km are driven in these cars and capital costs are distributed to larger distances. Conclusions The major conclusions are: (i) to harvest the full environmental benefits of EVs a very important aspect is the introduction of CO2-based fuel taxes. This should ensure that the electricity for EVs is generated from renewable energy sources – otherwise total CO2 emissions are likely higher than those of conventional cars. (ii) Regarding economics: The major uncertainty regarding market prospects of BEV and FCV is how fast cost reduction due to Technological Learning will take place especially for batteries and fuel cells. Finally, CO2 costs (e.g. taxation ) will play a crucial role for the final future fuel mix. E.g. Oslo in Norway is a city with one of the highest penetrations of BEVs in the world. One major reason is that – among other incentives – the driving costs of conventional cars are very high compared to rather cheap electricity costs for BEV drivers.

107
Session 13 - The link between the growth of energy consumption, population and income levels
Abd Aziz Azlina, Mahirah Kamaludin, Azilah Hasnisah ENERGY DEMAND AND ECONOMIC GROWTH: PANEL DATA EVIDENCE FROM DEVELOPING COUNTRIES (ASEAN 4)
A.A. Azlina, Universiti Malaysia Terengganu, Mahirah Kamaludin, Universiti Malaysia Terengganu,
Azilah Hasnisah, Universiti Malaysia Terengganu Overview Demand for energy has always plays a major role in both microeconomic and macroeconomic analysis, especially in selecting appropriate energy policy actions. Consequently, a steady stream of theoretical and empirical research has been carried out worldwide over the past several decades. The total energy demand, either with respect to the whole economy or to a specific sector, has garnered widespread attention in the last fourty five years as a result of the international oil crises of 1973 and 1979. The interest has, however, heightened in recent years, triggered primarily by the issues such as environmentally concerned; namely global warming and the role played by greenhouse gases; advancement in econometrics and their link to energy consumption; and country-specific issues. In spite of the importance of the above issues, studies on the structure and characteristics of energy demand in developing countries are found in a very limited number. In most developing countries, rapidly increasing economic activities coupled with rising incomes have spurred to an increase in the demand for energy. Moreover, the growing concern over the environmental problems namely global warming and the role played by greenhouse gases, has highlighted focus attention on the pattern and trend of energy demand in developing economies. Carbon dioxide emissions from developing countries are projected to grow by 127 per cent higher than in the developed countries by 2040, while the share of developing countries in energy related carbon dioxide emission will increase 46 per cent over the same period from a 2010 baseline (IEA, 2013). Finally, the increasing importance of the share of developing economies in the global energy markets also means that economic growth and the energy and environmental policies taken in these economies will most likely have a significant impact on world prices of primary energies and the global environment. A fuller and more detailed understanding of the trends of energy demand in developing economies is clearly of crucial importance in obtaining more reliable forecasts of international energy prices and demands at the world level. Therefore, it is useful to find out more about energy demand in developing countries. Methods Panel data techniques - fixed effects (FE) and random effects (RE). Results First, the results of this study indicate that not only income and price are important determinant for energy demand, but the degree of industrialization is also statistically significant to determine energy demand in ASEAN 4 countries. Second, the economic growth indicator demonstrates more powerful impact on energy consumption compared to other explanatory variables. Third, the income elasticities for ASEAN 4 countries reflect the response of energy demand is large.

108
Session 13 - The link between the growth of energy consumption, population and income levels Fourth, the price elasticity of energy consumption in developing countries is quite low. Finally, the level of industrialization in developing countries is significant and positively related to energy consumption. Conclusions This study examines the determinants of energy consumption using the panel data framework for ASEAN 4 developing nations. High income elasticity indicate higher GDP will have a major impact on energy demand. If this continues to be the scenario the future energy demands are likely to have a major impact for the environment and energy supply policy within developing countries. The low price elasticity of energy consumption indicate that higher prices will have only a minor effect in energy consumption. This result suggest that energy conservation measures based on the price mechanism are less effective. Thus, policy makers could not rely on the price of energy as a policy instrument and another policy initiative is needed. The statistically significant level of industrialization for developing countries seems to suggest the importance of industrial sector in energy consumption. Therefore, the policy makers should take it into account for policy formulation. References Ilhan Ozturk, Alper Aslan and Huseyin Kalyoncu (2010). Energy consumption and economic growth
relationship: Evidence from panel data for low and middle income countries, Energy Policy, 38: 4422–4428.
Muhammad Arshad Khan and FaisalAbbasab (2016). The dynamics of electricity demand in Pakistan: A panel cointegration analysis, Renewable and Sustainable Energy Reviews, 65: 1159-1178.
Rafał Kasperowicz (2014). Economic growth and energy consumption in 12 European countries: a panel data approach. Journal of International Studies, Vol. 7, No 3, 2014, pp. 112-122.
Thai-Ha Lea, Youngho Chang and Donghyun Park (2017). Energy demand convergence in APEC: An empirical analysis, Energy Economics, 65: 32-41.

109
Session 13 - The link between the growth of energy consumption, population and income levels
Sakib Amin, Laura Marsiliani, Thomas Renstrom CAN OIL BASED POWER COMPANIES IMPROVE THE HOUSEHOLD WELFARE IN BANGLADESH ECONOMY? A DSGE ANALYSIS
Sakib Amin, Ph.D. Commonwealth Rutherford Fellow, Durham University Business School, Durham, U.K.
Laura Marsiliani, Ph.D., Assistant Professor in Economics, Durham University Business School, Durham, U.K.
Thomas Renstrom, Ph.D.,Associate Professor in Economics, Durham University Business School, Durham, U.K.
Overview Bangladesh has achieved a landmark success concerning increasing the country's generation capacity over the last ten years. For instance, net installed electricity generation capacity has increased from 5272 Megawatt (MW) in 2009 to 16892 MW in 2018. This improvement in the generation comes mostly from the privately owned Quick Rental (QR) power plants. Bangladesh government allowed the QR power plants to generate electricity for short-term contracts (three to five years) to mitigate the acute power crisis of 2009-2010. The country now has a total of 43 QR power plants which contributes around 41% of the total electricity generation in the country. However, most of these QR power plants were powered by liquid fuel (Diesel, High-Speed Furnace Oil). With the increase in liquid fuel-based power plants (the total contribution of liquid fuels in electricity generation to 23% cent in 2018, up from only 5% in 2010), the average fuel cost per KWH of electricity increased from BDT 2.53/KWH in 2009 to BDT 5.25/KWH in 2018. Although QR power plants were introduced as a short-term solution with an intention to retire the plants after the expiry of the first tenures, the government continued extending their mandates. This over-reliance on the QR power plants is alarming for the country as the global oil price in the international market experience an upward trend. There is a necessity to quantify the long-term relative costs of these plants. Methods Following Amin (2015) and Amin and Marsiliani (2015), we develop energy augmented DSGE model to investigate the long-term consequences of the QR firms in Bangladesh economy. DSGE models are becoming more popular among the energy researchers as it can facilitate the forecast of the changes in the degree of welfare that would be caused by a change in market conditions. Our model includes household consumption of electricity along with their standard and service consumption in the utility function. Our model also comprises endogenous electricity generating production functions where electricity is produced both publicly and privately for the economy. As far as we have been concerned this is the first study that considers public-private electricity generating firms in the model economy. One of the main assumptions of this model is that all the economic agents rely on energy (electricity) either for household electricity consumption or production of various goods. To our knowledge, there is no study addressing welfare issues associated with the QR power companies in Bangladesh. Although the analysis mainly focuses on Bangladesh electricity sector, the results and policy implications are also relevant for the other developing countries. Results We calibrate the model for the Bangladesh economy, and our results reveal that the introduction of the QR power companies increase the electricity supply and enhance the household welfare in Bangladesh.

110
Session 13 - The link between the growth of energy consumption, population and income levels
However, there is a huge increase in the energy subsidy associated with the quick rental companies as they burn oil to generate electricity and the government needs to import electricity. These energy subsidies can eventually crowd out growth-enhancing public spendings such as spending on physical infrastructure, education, health, and social protection. The effectiveness of energy subsidies also seems to be questionable as they can place a heavy burden on government finances and hamper economic development in the long run. Conclusions The government had introduced the QR power plants to mitigate the persistent electricity crisis in 2009-2010. The additional power supplied to the national grid through the QR power plants has made a significant positive impact in many areas of the economy. The supply of additional power has no doubt contributed to the expansion of economic activities in various sectors including manufacturing industries, RMGs, commercial and business operations, agriculture through providing irrigation and better marketing and processing services, and in trade, communication, and other services (Mujeri and Chowdhury, 2013). This has significantly helped to keep the GDP growth rate over 6% along with a healthy export growth despite the global recession and become a lower-middle income nation in 2018. However, these QR power plants could not be a long-term solution as Bangladesh Petroleum Corporation (BPC) faces persistence losses as they need to sell the imported oil at a subsidised rate to the QR power producers. This has certainly created pressure on the budget as the deficit is increasing. So, given our results, the long-term energy policy should be taken for the energy sector which is less costly with more efficiency and environment-friendly. Bangladesh government should make a clear statement regarding the phasing out of the QR power plants for the country's future energy security. References Amin, S.B. and Marsiliani, L. (2015). “Energy Price Shocks in Dynamic Stochastic General Equilibrium:
The Case of Bangladesh.” Review of Business and Economics Studies 30 (3): 12-21. Amin, S.B. (2015). “The Macroeconomics of Energy Price Shocks and Electricity Market Reforms: The
Case of Bangladesh.” Ph.D. thesis. Durham University, Durham. Mujeri, M.K. and Chowdhury, T.T. (2013). “Quick Rental Power Plants in Bangladesh: An Economic
Appraisal.” Bangladesh Institute of Development Studies.

111
Session 13 - The link between the growth of energy consumption, population and income levels
Hamad M. Mudij, Mohammed AL-Otaibi THE STUDY OF THE IMPACT OF ECONOMIC AND POPULATION GROWTH ON ENERGY CONSUMPTION: A STATISTICAL APPROACH
Hamad M Mudij: Scientist, Glycols & Industrial Gases Technology, Petrochemicals Technology, Saudi Basic Industries Corporation (SABIC). PO Box 5101, Riyadh 11422
Mohammed S AL-Otaibi: Section head of polymer sales in GCC, Petrochemicals Business Unit, National Industrialization Company (Tasnee), P.O Box 26707, Riyadh
Overview In recent years, the issues of energy consumption have become one of the major concerns for many parties, particularly policy makers. European Union (EU) countries are among the highest net importer of energy, specifically fossil fuels. According to the World Bank, the percentage of energy imports exceeded 50% in 2014. As a result, it is important to study the factors that affects energy demand and security globally and quantify their impacts. One of the crucial factors that threaten the energy supply are the energy consumption growth, which drives competition for energy sources in the markets. Energy consumption growth is driven by many factors. In this work, we have considered the main two drivers of such growth, which are the population growth and the GDP. Analyzing the relationships of energy consumption in relation to the states of the economy and population is an important task to ensure a stable and robust economic growth. Method In the present work, a statistical approach utilizing multiple regression conducted to study and evaluate the relationship between the population growth, GDP and energy consumption for the world across 20 years using available data for the period from 1995 to 2014. In addition, the same approach applied for the EU countries utilizing the data for the ten years from 2007 until 2016. Results The regression model revealed that there is a positive relationship between global economic growth, measured by GDP, and energy use and a positive relation as well between population growth and energy use. Moreover, the regression model showed that both factors are statically significant with p values < 10-5 for both factors. However, the population growth showed a higher impact on energy consumption almost five times the impact of GDP. With UN estimate of population growth of 19% by 2030 from the 2014 levels, the model predicts a consumption growth of 19%. For the data concerning the EU, the model indicated that both factors are significant with negative relation with population growth and a positive one with economic growth. Similarly, the population growth showed the highest impact on energy consumption. Conclusions For the EU and the world, a statistical analysis of the impact of economic and population growth on energy consumption showed that both factors are significant with highest impact attributed to population growth.

112
Session 13 - The link between the growth of energy consumption, population and income levels While demand for energy slowed in the EU, global energy demand have been and expected to increase in the future. This demand will drive competition in the global energy market, which will affect the EU being a net importer of energy. References World Bank, https://www.worldbank.org/ Eurostat, the statistical office of the European Union, http://ec.europa.eu/eurostat/web/main/home OECD National Accounts data files: http://www.oecd.org/sdd/na/ United Nations, Department of Economic and Social Affairs, Population Division (2017), https://www.un.org/development/desa/en

113
Session 14 - The energy policies post Paris Agreement and the energy roadmap to 2050
Luis María Abadie, José Manuel Chamorro PHYSICAL ADEQUACY IN POWER GENERATION: SPAIN BEYOND 2020
Luis María Abadie, Basque Centre for Climate Change, José Manuel Chamorro, University of the Basque Country
Overview In our society, when the demand for electricity is not met the resulting economic losses can be further aggravated by social unrest and even political turmoil. Not surprisingly, reliability and safety have been major concerns for stakeholders and regulators alike. A long sequence of complex, intertwined actions has to be arranged before the electricity output reaches end consumers. This sequence can be broken down according to several criteria, among them time. Batlle et al. (2007) consider four time dimensions and identify as many aspects of security of supply (SoS): (i) 'security' in system operation is a very short-term issue which concerns the ability of the system to support unexpected disturbances; (ii) the ability of the facilities in place to efficiently meet existing demand is a short- to medium-term issue that is labelled 'firmness'; (iii) 'adequacy' refers to the ability of existing or prospective facilities to serve demand in the long run; (iv) the concerns about the availability of resources and infrastructures in the very long term fall in the realm of 'strategic expansion policy' (within the broader energy and environmental policy). In the EU, system adequacy is interpreted as the existence within a system of sufficient generation and transmission capacity to meet the load, whether under normal or unusual conditions. Three variables jointly define adequacy: power generation, demand, and availability of lines. Demand is frequently assumed to be price inelastic. Concerning system generation, the standard approach draws on assumptions about the marginal cost of different power technologies and the ensuing merit order. Instead we concentrate our efforts on the feasibility of meeting anticipated demand with a given generation park. Besides, to demonstrate the model by example, we apply our model to a singular country within the European internal power market. The particular choice has to do with the third variable mentioned before, namely availability of lines. As it turns out, right now the Spanish power system can be considered as an 'electric island' to a great extent, and it will remain so at least in the near future. The potential risks from this condition can hardly be exaggerated. The same condition applies to a number of power systems across the world. Methods Our paper addresses these risks by evaluating the adequacy of the Spanish power generating system up to the year 2050. The average growth rate of power demand in Spain is uncertain. The Spanish Ministry of Energy, Industry and Tourism adopts a central rate of 1.9% (with lower and upper levels of 1.7% and 2.3%, respectively). On the other hand, Bailera and Lisbona (2018) consider two scenarios of power demand growth over the next decades, namely 1.36% and 1.73% per year. We stick with these two demand scenarios among others. We also consider a flat demand in the future. We even account for the possibility that demand be 5% lower than initially anticipated. The starting point is a stochastic model for generation technologies and power demand. Thermal stations can be on or off with specific probabilities.

114
Session 14 - The energy policies post Paris Agreement and the energy roadmap to 2050 Renewable technologies display a load factor that subsumes both their availability rate and intermittent nature; we assume that it follows a Weibull distribution. Power demand is random; this holds for both annual demand and maximum hourly demand (the latter is considered a function of the former). The model explicitly matches both demand and supply, thus allowing assess generation adequacy from a physical/technical viewpoint. Next comes the estimation of the underlying parameters from official data sources. The model can then be simulated a number of times. Monte Carlo simulation allows derive the risk profile (or cumulative density function) of any variable or metric of interest, thus providing a useful, early signal of the need for action. Given the emphasis on the system's adequacy (or the lack thereof), we adopt several measures of performance. One of them is deterministic (the reserve margin) while the others are probabilistic: expected energy not served, loss of load expectation, their respective 95th percentiles, and loss of load probability. They allow draw an overall picture of the system adequacy under a high degree of isolation. Results The Table below shows the annual demand observed in 2017 along with the simulated levels from 2020 through 2050 (AD, in GWh). Next comes the maximum hourly demand (MHD, in MWh). They are then set against the available generation capacity (AC, in MW). The first adequacy metrics, EENS, stands for the average energy not served and is measured in MWh; its probability distribution allows compute the 95th percentile, E95. Similarly, LOLE denotes the expected load lost (in minutes per year), while L95 is the 95th percentile. LOLP is the probability of load being lost (an interruption in power supply, in %). The reserve margin RM is the only deterministic metric.
To the extent that EENS is generally taken as the preferred metric, the following Figure displays the probability distribution in a particular year (2040) under the two demand growth scenarios. The average under D₂ (namely 1,472,502 MWh) is 30% higher than under D₁ (1,132,520) despite the stronger growth of available capacity (AC). The overall probability mass is displaced rightwards; the underlying phenomenon not only affects the expected value. The 95th percentile rises from 2,199,081 MWh under D₁ to 2,723,684 under D₂, i.e. a 23.85% increase. Beyond this, the most frequent interruptions under D₂are slightly less so than those under D₁.

115
Session 14 - The energy policies post Paris Agreement and the energy roadmap to 2050
Conclusions According to our results, the system's adequacy worsens in 2020 and does so dramatically in 2040 and 2050, when thermal stations are completely replaced by renewable plants. Next we keep the earlier two generation mixes as such but annual demand and the hourly peak remain fixed throughout at their 2017 levels. In 2020 all adequacy metrics improve (the thermal fleet is the same as in 2017 while the renewable one enlarges). Yet in 2030 physical adequacy is somewhat eroded by some closures of coal and nuclear plants (despite the ever growing total available capacity); this effect is reinforced in 2040 when all those stations cease operation (in 2050 adequacy perks up). Last, when we assume that power demand levels are reduced by 5% the episodes in which load is not met are much less intense but not so much less recurrent; i.e. shortages are rather stubborn even under a shaved demand for power. References Batlle C., Vázquez C., Rivier M., Pérez-Arriaga I.J.: Enhancing power supply adequacy in Spain:
Migrating from capacity payments to reliability options. Energy Policy 2007, 35(9), 4545-4554. Bailera M., Lisbona P. Energy storage in Spain: Forecasting electricity excess and assessment of power-to-
gas potential up to 2050. Energy 2018, 143, 900-910.

116
Session 14 - The energy policies post Paris Agreement and the energy roadmap to 2050
Franco Del Manso VISION 2050 - A PATHWAY FOR THE EVOLUTION OF THE REFINING INDUSTRY AND LIQUID FUELS
Franco Del Manso – Unione Petrolifera – Piazzale Luigi Sturzo, 31 – 00144 Roma, Italy,
A 2050 roadmap was drafted in 2011, calling for a reduction in GHG emissions by 80-95% in 2050 compared to 1990 and indicating ranges of GHG reductions for key economic sectors, including 83-87% for industry and 54-67% for transport. Achieving these ambitions while maintaining the competitiveness of its economy and the quality of life of its citizens represents an enormous challenge for the European Union. The petroleum refining industry and the distribution network of oil products have been operating in Europe for well over 100 years. They have continuously evolved, adapting to the market and the regulatory demands while providing reliable and affordable energy and many other essential products and services to society. The industry will continue to evolve its assets and business models, and play its part in the energy transition; this will require, in the coming decades, very significant investments in low-carbon energy solutions. These efforts need to be accompanied by a policy framework based on the principles of technology neutrality, cost effectiveness and free competition. To satisfy the market demand, about 65% of the crude oil processed in EU refineries are transformed into liquid fuels for transport, about 10% provide petrochemical feedstocks, and about 25% are employed for other products to fulfils the everyday needs of citizens. After over a hundred years, liquid hydrocarbon fuels remain unrivalled for use in transport thanks to their superior energy density; they are simply the best form of portable energy, storage and delivery. Whole sectors of transport and industry cannot function without them. Electric vehicles (EV), in their different forms, will play a major role as the electricity mix becomes low-carbon energy. Hydrogen produced from renewable/low-carbon electricity and consumed in Fuel Cell Hydrogen cars (FCHV) is also offering a viable alternative to contribute to the partial electrification of the passenger car segment. However, even in the most optimistic scenarios of high penetration of alternative powertrain technologies, liquid fuels will continue to be required for many passenger cars and light duty commercial vehicles. For these reasons, low-carbon liquids fuels will be of vital importance to reduce emissions in European energy and transport systems, in every 2050 scenario. A transition from predominantly oil-based products will include low-carbon intensity liquid hydrocarbons, sustainable biofuels, e-fuels and gaseous hydrocarbons including LNG and CNG. In our Vision 2050, the potential pathways of the EU refining system towards the transition of near zero carbon intensity liquid fuels, will be achieved through a combination of structural and operational measures the main of which are: investments and operational measures to boost energy efficiency to the maximum levels; use imported or self- generated renewable-electricity to produce renewable (“green”)
hydrogen; use CCS (Carbon Capture and Storage) and CCU (Carbon Capture and Use) to reduce the
GHG intensity of refining process; production of quality improved hydrocarbon fuels to reduce of carbon emissions of road
transportation;

117
Session 14 - The energy policies post Paris Agreement and the energy roadmap to 2050
process low-carbon feedstocks with a higher advanced bio-content level; production of e-fuels (green hydrogen combined with CO2 captured from air or from other
waste sources, to produce a near zero carbon liquid fuel); on board capture and later storage/conversion of the CO2 emitted at the vehicles tailpipe.
The internal combustion engine (ICE) will continue to play an important role across the different transport sectors for decades. Liquid hydrocarbons will remain an important part of the mobility system in the future, even as alternative energy sources increase. The development and deployment of low-emission hydrocarbon liquid fuels offers a significant opportunity to effectively meet the demand of the market and contribute to addressing the risks posed by climate change. Low-carbon liquid fuels could be produced within the existing refineries and offer the benefit to reduce the emissions of all transport segments in the shortest amount of time, making use of the existing vehicle fleets and of the existing infrastructures for the storage and distribution of fuels. The existing distribution network for marine, aviation and road transport fuels can easily adapt to future low emission liquid and gaseous fuels. To assure the deployment of our 2050 Vision it is essential that the policymakers at EU and national level will adopt the right regulatory framework to give our industry the possibility to remain competitive with respect to non-EU refineries, ensuring the conditions for European refineries to make the necessary investments to deploy the innovative technologies to challenge effectively the Climate Change.

118
Session 14 - The energy policies post Paris Agreement and the energy roadmap to 2050 Mario Valentino Romeri
CONSIDERATION ABOUT HYDROGEN AND FUEL CELLS IN THE PARIS AGREEMENT 1.5°C PERSPECTIVE
Mario Valentino Romeri, Consultant, Italy
Overview For long time Hydrogen energy vector and Fuel Cells technologies seem to be a Cinderella low-carbon solution in the current energy and transport debate but in the coming years will have the potential to be a disruptive low-carbon solution. But recently something happened. In Malmo Sweden (May 24) at the 9th Clean Energy Ministerial and 3rd Mission Innovation Ministerial, according to Hydrogen Council, the situation seems to be rapidly changing: “We are witnessing a crucial moment for hydrogen, Governments are recognizing the key role hydrogen can play in decarbonization and investors the value it can bring worldwide. The critical mass of support needed to drive scale deployment of the value chain is becoming a reality. On our side, industry is committed to growing and deploying hydrogen solutions while continuing to innovate the technology.” and “The recognition of hydrogen as a systemic enabler of the energy transition continues to grow. To meet Paris Agreement commitments, the time to scale up deployment is now. Government roadmaps and policies are already embedding hydrogen more deeply than ever before, collaboration across stakeholder groups will pave the way to making this a reality.” The electricity produced by a Hydrogen Fuel Cell can be used both for stationary and transport application and the traditional model to link transport to energy sector is the Vehicle-to-Grid (V2G) approach. I think that it is time to consider the link between the transport sector and the energy sector not only in a V2G approach but in another perspective, more direct, relevant and disruptive. In fact the Hydrogen Fuel Cell Powertrain (H2FC Powertrain) or, in other words, the propulsion system of a Fuel Cell Vehicle (FCV), is a small power generation plant (typically the H2FC Powertrain size is around 100 kW). In the coming years the high volume associated with the possible FCVs mass production will permit to reduce dramatically the FC system manufacturing costs, in order to be competitive with gasoline in hybrid-electric vehicles. In a mass production perspective, H2FC Powertrain will be so cost competitive to be useful adopted also for stationary power generation application, also in LCOE terms. It is longtime that I underlined the possible relevant implication of Hydrogen and Fuel Cell use in stationary and transport applications and, in recent years I presented different works in which I argued that it’s time to consider FCV as a relevant possible low-carbon solution in energy debate. From 2010 I wrote, presented and published different studies where I compared the H2FC Powertrain LCOE, based on the U.S. Department of Energy (DOE) public data, with the traditional power generation technologies LCOE with very promising results, in the U.S. context and in many other contexts around the world. From 2017 in my analysis I started to use also the International Energy Agency (IEA) data for the H2 production costs. In this paper the most recent data and new considerations about possibly implication of this low-carbon solution in power generation sector have been made, especially in the Paris Agreement perspective and in the context of the “Global Warming of 1.5ºC, an IPCC special report on the impacts of global warming of 1.5 ºC above pre-industrial levels and related global greenhouse gas emission pathways, in the context of strengthening the global response

119
Session 14 - The energy policies post Paris Agreement and the energy roadmap to 2050 to the threat of climate change, sustainable development, and efforts to eradicate poverty” that will be finalized and published next October. Method LCOE analysis Results In a perspective of more and more rapid development of hydrogen and fuel cell application, the H2FC Powertrain technology appears competitive, in LCOE terms, with many of the power generation technologies and, in the most favorable conditions of low H2 production costs, with almost all the technologies currently adopted. Conclusions Observing these H2FCPowertrain data it will be necessary to think the FCVs link to energy sector considering also the possibility to utilize H2FCPowertrain as a power generation plant with relevant and positive consequences for a rapid development of this disruptive low-carbon solution. In line with the spirit of the Holy Father Francis Encyclical Letter “LAUDATO SI’” and with the goals of United Nations “Transforming our world: the 2030 Agenda for Sustainable Development”, in 2015 the UNFCCC COP 21 Conference adopted the historic “Paris Agreement” that introduced a new paradigm to a durable global framework to reduce global greenhouse gas emissions. After the 2017 decision of the United States of America to withdraw from the Paris Agreement, in July 2017 in Hamburg, the Leaders of the other G20 members stated that the Paris Agreement is irreversible. In this global framework it will be useful well explain the advantage to utilize H2FCPowertrain as power generation plant to all the actors involved in order to offer a new and feasible path to implement the Paris Agreement, especially in the 1,5°C perspective, and to accelerate even more the introduction of this break-through low-carbon solution. References G20 GERMANY 2017: “G20 Leaders´ Declaration Shaping an interconnected world Hamburg, 7/8 July
2017” http://www.g20.utoronto.ca/2017/2017-G20-leaders-declaration.pdf (Accessed 24 February 2018);
Hydrogen Council, 2018: “Hydrogen is firmly on the agenda of the Clean Energy Ministerial and Mission Innovation as Hydrogen Council participates for the first time” http://hydrogencouncil.com/wp-content/uploads/2018/05/CEM_MI_PressRelease_Hydrogen- Council_24052018.pdf (Accessed 14 July 2018);
Holy Father Francis, 2015: EncyclicalLetter LAUDATO SI’ on Care for Our Common Home”, http://w2.vatican.va/content/francesco/en/encyclicals/documents/papa-francesco_20150524_enciclica-laudato-si.html (Accessed 24 February 2018);
Intergovernmental Panel on Climate Change (IPCC), 2018: “Global Warming of 1.5 ºC, an IPCC Special report on the impacts of global warming of 1.5 ºC above pre-industrial levels and related global greenhouse gas emission pathways, in the context of strengthening the global response to the threat of climate change, sustainable development, and efforts to eradicate poverty” - http://ipcc.ch/report/sr15/ (Accessed 14 July 2018);
M.V. Romeri, 2010: “Considering Hydrogen Fuel Cells Powertrain as Power Generation Plant”, World Electric Vehicles Symposium EVS 25, Shenzhen, Guangdong, China, World Electric Vehicle Journal Volume 4 (2011), http://www.evs24.org/wevajournal/php/download.php?f= vol4/WEVA4-4131.pdf ;
M.V. Romeri, 2011: “Hydrogen Fuel Cell Powertrain Levelized Cost of Electricity”, 30th USAEE/IAEE North American Conference,

120
Session 14 - The energy policies post Paris Agreement and the energy roadmap to 2050 Washington DC USA, USAEE & IAEE Research Paper Series, http://ssrn.com/abstract=2006758; M.V. Romeri, 2011: “The Hydrogen Fuel Cell Vehicles Powertrain Roles in the Copenhagen Accord and
Cancun Agreement Perspective”, 2011 Fuel Cell Seminar & Exposition, Orlando FL USA, ECS The Electrochemical Society, ECS Transaction, Volume 42 http://ecst.ecsdl.org/content/42/1/59.abstract ;
M.V. Romeri, 2012: “Consideration about the Hydrogen Fuel Cell Powertrain LCOE”, 3rd IAEE Asian Conference, Kyoto Japan, http://eneken.ieej.or.jp/3rd_IAEE_Asia/pdf/paper/025p.pdf ;
M.V. Romeri, 2012: “Considering Hydrogen Fuel Cells Powertrain as Power Generation Plant in the Copenhagen Accord and Cancun Agreements Perspective”, International Battery, Hybrid and Fuel Cell Electric Vehicle Symposium EVS 26, Los Angeles CA USA, http://toc.proceedings.com/16245webtoc.pdf;
M.V. Romeri, 2012: “The Hydrogen Fuel Cell Vehicles Powertrain Possible Roles in the Kyoto Protocol Second Commitment Period Perspective in the Pacific Rim Area”, ECS 222nd Meeting “PRIME 2012 Pacific Rim Meeting on Electrochemical and Solid-State Science”, Honolulu HI USA, ECS Transaction 2013, Volume 50, http://ecst.ecsdl.org/content/50/45/75.abstract;
M.V. Romeri, 2013: “Hydrogen Fuel Cell Vehicles Powertrain Possible Future Roles in a Global Perspective”, 36th Annual IAEE International Conference, Daegu Korea, http://www.iaee2013daegu.org/eng/sub14/sub14_01.asp;
M.V. Romeri, 2014 “Fuel Cell Vehicles are Close to Commercialization and it’s Time to Think Hydrogen Fuel Cell Powertrain as Power Plant. Consideration about Germany, UK and Italy in EU Context”, 14th IAEE European Energy Conference, Rome Italy, http://www.iaee2014europe.it/pages/october30.html and http://www.iaee.org/en/publications/proceedingssearch.aspx (Author: Romeri);
M.V. Romeri, 2014: “Considering Hydrogen Fuel Cell Powertrain as Power Plant in the Three Main Automaker Asian Countries: South Korea, Japan and China”, 4th IAEE Asian Conference, Beijing China, http://iaeeasia.csp.escience.cn/dct/page/70056 and http://www.iaee.org/en/publications/proceedingssearch.aspx (Author: Romeri);
M.V. Romeri, 2015: “Hydrogen and Fuel Cell: A Cinderella or a Disruptive Low-Carbon Solution?”, 2015 Fuel Cell Seminar & Energy Exposition, Los Angeles CA, USA, ECS Transaction 2016, Vo. 71 http://ecst.ecsdl.org/content/71/1/227.abstract ;
M.V. Romeri, 2017: “Considering Hydrogen Fuel Cells Powertrain as Power Generation Plant – 2017 review” 2nd AIEE Energy
Symposium, Rome, “2nd AIEE Energy Symposium Conference Proceedings” http://www.aieeconference2017rome.eu/documents/Rome- Proceedings.pdf, p. 254-260; presentation
available at: http://www.aieeconference2017rome.eu/files/ROMERI.pdf ; United Nations Framework Convention on Climate Change UNFCCC COP 21, 2015: “Adoption of the
Paris Agreement. Proposal by the President”, http://unfccc.int/documentation/documents/advanced_search/items/6911.php?priref=600008831 (Accessed
24 February 2018); United Nations, Resolution adopted by the General Assembly on 25 September 2015: “Transforming our
world: the 2030 Agenda for Sustainable Development”, http://www.un.org/ga/search/view_doc.asp?symbol=A/RES/70/1&Lang=E (Accessed 24 February 2018).

121
Session 14 - The energy policies post Paris Agreement and the energy roadmap to 2050
André Luis da Silva Leite, Luis Eduardo Nunes, Marcus Vinicius Lima SWITCH AND DEFER OPTIONS IN RENEWABLE ENERGY PROJECTS: EVIDENCES FROM BRAZIL
Luis Eduardo Nunes, Federal University of Santa Catarina, Brazil André Luis da Silva Leite, Federal University of Santa Catarina, Brazil
Marcus Vinicius Lima, Federal University of Santa Catarina, Brazil Overview Brazil has a large potential of Renewable Energy sources, such as solar, wind power, biomass, and, of course, water, which is responsible for more than 60% of the electricity installed capacity in the Country. Since 2004, the Brazilian government have been promoting Renewable Energy in order to diversify national grid and to reduce the dependence on hydropower Renewable Energy has expanded more quickly in developing countries facing economic growth. Besides the continuous decline in Renewable Energy materials costs, the governments have been played a key role in promoting and creating incentives to the growth of Renewable Energy markets, using instruments such as feed-in-tariffs, auctions, incentive schemes, for example. Despite this, Renewable energy projects typically presents some uncertainties and flexibilities and traditional methods like Net Present Value (NPV) can cause undervaluation analysis. Therefore, this papers aims to value Renewable Energy generation projects under the real options theory (ROT) framework in order to capture the existing value in uncertainties and flexibilities (switch and defer options) using binomial tree and Monte Carlo simulation. Methods The real options approach for Renewable Energy projects seek to capture the value of uncertainties and flexibilities that all projects have in investor's point of view. The net present value (NPV) technique ignores these flexibilities and uncertainties, causing undervaluation in some cases. There were estimated contracts with duration of less than 2 years that tend to reflect the PLD and contracts with a duration bigger than 2 years tend to reflect regulated market prices with a risk premium. Thus, based on the energy auctions including renewable energy projects, hypothetical projects were designed, assuming a constant cash flow, fee inflation and no tax; no residual value (0) and linear depreciation; Operation costs are the same for Wind and PV; and Projects duration of 20 years. Results In this way, it is concluded that projects with technical uncertainties and without option have bigger value than the same projects without uncertainties and option. Although the value of the first projects presented an increase of value, even so these values were not enough to be economic viable. With a switch option it is asserted that Real Optioin adds significant value to all projects. Regardless what type of stochastic process it was used (MRM and MRM-Jumps) to calculate PLD prices, the project value has increased. Then, when it was adopted a more sophisticate approach that value flexibilities and uncertainties (ROA) for RE projects, it was possible to conclude that was an increase in the value when compared to traditional investment analysis (NPV).

122
Session 15- Integrating renewables in energy markets
Sietske Veenman, Karl Sperling HOW FUTURES MATERIALIZE: A CASE FUTURE FRAME OF RENEWABLE ENERGY THE IN DENMARK Overview There is today little doubt of the importance and urgency of an energy transition towards more carbon neutral energy production. In recent years, much policy effort has been put into this topic. Although the importance of a long-term vision for multi-level governance is widely acknowledged within the framework of the Energy Transition, the idea to speed up the energy transition by ‘collective action problem’ framing with binding targets and timetables has also been critiqued (e.g. Ostrom, 2010; Rayner, 2010). Concrete goals are essential for investments at the shorter term, however, regarding the long term, focusing too strictly on national or international set goals within the energy transition, it may lead to cockit-ism (Hajer et al., 2015): ‘the illusion that top-down steering by governments and intergovernmental organizations alone can address global problems’. Rather, social transformations are created in the web of regulations, directives, agreements, networks, local and regional initiatives, start-ups, etc. In other words, ‘futures are scripted in the present’s materiality’, its artefacts, institutions, routines, etc’ (Brown, 2006, p. 6). Ideas, expectation and stories about the future are performative (Borup et al., 2006; Van Lente and Bakker, 2010) and hence, also play a role in societal transformation. So, apart from deliberately formulated visions with clear goals and roadmaps, other processes also add up to shaping energy futures and it is important to reflect upon the context and actors in which energy futures emerge and are embedded in order to speed up the energy transition. There still lacks a systematical investigation how futures materialise in policy and practice, which is exactly the aim of this paper when answering the research question: how do futures materialize and how is this materialization consolidated? Methods At the basis of our approach is the reasoning that ‘different futures are lurking in the present’: stories may make actors anticipate certain futures and hence, make them reality (Piotti, 2009; Beckert, 2013). Hence, in this study we combine an discursive dimension with an institutional perspective. In two ways, this research is an important addition to existing literature: 1) In most analyses about the Danish energy transition are done from an institutional perspective (see Mey and Diesendorf). 2) Stories are mentioned as important factor, but it has not been the focus of research. The case is the transformation of renewable energy in Denmark, as this country has been successful to place renewable energy as strategy for the energy challenge. For this paper, we take 1985 with the Ban on Nuclear energy, as breaking point. From then, it can be said that the future frame of renewable energy materialized. After that period, we will only emphasize some processes that were set in motion before 1985 and which are important for the further materialisations of the future frame. This study draws on an analysis of the energy transition in Denmark, using three types of data. First, we conducted a comprehensive document analysis based on policy documents, research reports and biographies. Second, we used authoritative scholarly reconstructions of how the energy transition in Denmark took place. Third, we corresponded with key actors in the process: politicians, activists, civil servants, etc.

123
Session 15- Integrating renewables in energy markets Results We analyse the materialisation of the future frame on renewable energy: future knowledge construction and long-term anchoring in Denmark. In Denmark, grassroots initiatives showed that renewable energy was a ‘real thing’ and not just fluffy dreams. By doing so, they created a future frame on renewable energy: the proponents of renewable energy had a strong principle of ‘getting the facts right’ and providing real and well documented alternatives to the official energy plans. These organisations realized the need for positive and constructive foresight communication around energy issues, instead of limiting themselves to protesting against the very same. Through concrete outcomes such as official energy plans (1976 and 1981) and alternative energy plans (1976 and 1983), showed that it was possible to include alternative energy sources, as it did not include nuclear energy and the use of more coal (Beuse et al., 2000). Concrete production data were shown: the Tvind wind turbine and the large wind power export to California from 1982 proved that wind power development could develop into something real and something great. Integration in the form of knowledge exchange between officials and GI-initiated alternative energy plans led to considering renewable energy as realistic alternative to nuclear energy. It became mainstream to talk about 100% renewable energy in 2050. A wide spectrum of actors were engaged and welcomed at different levels. Local energy offices began to form in municipalities around 1975, often with the involvement of people from existing networks and from higher educational institutes. Also, informal network activities in (university) working groups, folk high schools and environmental NGO’s helped to form a knowledge base. Specific actors had a strong influence on the development of renewable energy, being linked in organisations at different levels across networks. For example, renewable energy activists were placed in central positions in one or several official (governmental) organisations. Such persons may play a crucial bridging role, for example the president for the Academy of Technical Sciences took the initiative to establish the Committee for Renewable Energy, that operated under the technological Council in the ministry of Industry, having a budget of 35 mill. DKK to distribute to pilot projects and energy consultation all over the country, making RE known as technically concrete and not just a green dream. Conclusions The case has shown that storylines about the future played a crucial role in the materialization and consolidation of the future frame of renewable energy in Denmark. Different people were mobilized in this future, different actors stress different storylines, so different stories were rooted within society, together adding up to the future frame of renewable energy. The moral, ecological based storyline of NOAH turned out to be some ‘glue’ in the early year, as also the actors (ecological practitioners) with a technological story line were partly mobilized by this story. Also the believe that the RE technology could fit into a modern energy society, solar panel technology being rather simple and going wind to be big, was an important storyline. For the diffusion and consolidation of the future frame of renewable energy, also the future story stating that ‘investing in wind or solar is a good opportunity to gain economic profits’ motivated actors all over society to see and take this opportunity. In turn, this small scale innovation emphasized the story in technology at local scale. Further discussions upon different storylines, how they merge into a future frame and their relationship to certain actors would be interesting.

124
Session 15 - Integrating renewables in energy markets The future storylines found fertile soil in the context: three interlinked socio-economic crises (oil crisis, negative balance of payment, unemployment) have put strong pressure on the Danish society, leading to an open parliament that was looking for ‘something that could work’. Furthermore, the mix of technical infrastructure, ownership and the culture of experimentation gave leeway to the decentral, innovative and small-scale initiatives which seem to be a precondition for a successful movement in Denmark to create a larger multifaceted movement, consisting of entrepreneurs, small companies, folk high schools, universities, employees in central and decentral administrative jobs, etc. This mix strengthened the future storyline as the increase of small scale RE innovations legitimized the story that ‘RE could work’. The pilot plants grew out to be convincing stories themselves. Furthermore, some future stories were explicitly linked to specific aspects that are characterizing for the Danish context (landscape and regime), for example the potential of the Danish market in wind and solar. References Borup, M., Brown, N., Konrad, K., & Van Lente, H. (2006). The sociology of expectations in
science and technology. Technology analysis & strategic management, 18(3-4), 285-298. Brown, N. (2003). Hope against hype-accountability in biopasts, presents and futures. Science
& Technology Studies, 2. Pp 3-21 Beckert, J. (2013). Imagined futures: fictional expectations in the economy.Theory and Society, 42(3), 219-240.Hajer, M., Nilsson, M., Raworth, K., Bakker, P., Berkhout, F., de Boer, Y., ... & Kok, M. (2015). Beyond cockpit-ism: Four insights to enhance the transformative potential of the sustainable development goals. Sustainability, 7(2), 1651-1660.
Holmes, D. R. (2009). Economy of words. Cultural Anthropology, 24, 381–419. Mey, F., & Diesendorf, M. (2018). Who owns an energy transition? Strategic action fields and community wind energy in Denmark. Energy research & social science, 35, 108-117.
Ostrom, E. (2010). Polycentric systems for coping with collective action and global environmental change. Global Environmental Change, 20(4), 550–557.
Piotti, G. (2009). German companies engaging in China. Decision-making processes at home and management practices in Chinese subsidiaries. Köln: Max-Planck-Institut für Gesellschaftsforschung. MPIfG Working Paper 09/14.
Rayner, S. (2010). How to eat an elephant. Climate Policy, 10(6), 615–621. Van Lente, H., & Bakker, S. (2010). Competing expectations: the case of hydrogen storage
technologies. Technology Analysis & Strategic Management, 22(6), 693-709. CBS, 2017

125
Session 15 - Integrating renewables in energy markets
Silvia Concettini, Stanislao Gualdi, Anna Creti ASSESSING THE RELEVANCE OF RENEWABLE GENERATION LOCALIZATION THROUGH A SPOT MARKET ALGORITHM SIMULATOR: THE CASE OF ITALY
Silvia Concettini, IRJI François Rabelais, Université de Tours and Chair Energy and Prosperity, 50 Avenue Jean Portalis, 37206 Tours, France
Stanislao Gualdi, Capital Fund Management, 23 Rue de l'Université, 75007 Paris Anna Creti, LEDa CGEMP, Université Paris Dauphine, PSL Research University, Climate Economics
Chair and Chair Energy and Prosperity, Place du Maréchal de Lattre de Tassigny, 75016 Paris Overview The development of renewable sources and their integration in the electricity market raise a number of technical and economic issues. When power markets are organized as two or more inter-connected sub-markets on the basis of existing network bottlenecks, the localization of renewable generation turns out to be a relevant variable in the forecast of future benefits. A larger renewable supply in certain zones may reduce import needs but it can also modify flow directions affecting the occurrence of congestions and the zonal price gaps. As a consequence, the “merit order effect” may not occurs as straightforwardly as it usually acknowledged. Methods In this paper we develop an algorithm that simulates the equilibrium (price-quantity) of the Italian Day-Ahead market taking into account all transmission constraints between zones and the import from neighboring countries. The algorithm is built on GME (the market operator) data and it is trained using 2015 market outcomes. Compared to the original (not publicly available) algorithm which relies on heuristics to solve the non-linear bounded optimization, we reproduce the equilibria by iterative splitting. Results A number of simulations are performed in order to study the sensitivity of equilibria to changes in: 1) production from renewable power plants, 2) differentiated growth rates of renewable supplies for sun and wind, 3) localization of renewable facilities. We try to mimic several possible configurations for the attainment of national energy strategy’s target of renewable penetration in the generation mix. We compare then ex-ante and ex-post equilibria using the price indexes of Laspeyre and Paasche. Preliminary results highlight the importance of redistributive effects in the integration of renewables in a zonal electricity market. Conclusions With respect to the existing works on the impact of renewables on market outcomes, we focus on distributional effects by showing that if on average all buyers benefit from lower prices, some of them may benefit more than others. Furthermore, we proved that some locations must be preferred for the installation of renewables if a certain target is to be reached in the most efficient way. Our results have important policy implications as the regulator can possibly intervene in defining investment priorities.

126
Session 15 - Integrating renewables in energy markets References Ardian, F., Concettini, S. and Creti A., (2018) “Renewable generation and network congestion: an
empirical analysis of the Italian Power Market”, The Energy Journal, 39 (SI), pages? Gianfreda, A., Parisio L. and Pelagatti, M., (2016), “The Impact of RES in the Italian Day Ahead and
Balancing Markets”, The Energy Journal, 37 (SI), 161-184

127
Session 15 - Integrating renewables in energy markets
Matteo di Castelnuovo, Monika Dimitrova CORPORATE RENEWABLE ENERGY PROCUREMENT THROUGH PPAS IN THE UNITED STATES
Matteo di Castelnuovo, Department of Economics, Bocconi University,
Via Roentgen 1, room 5-A1-06, 20136 Milano, Italy Monika Dimitrova, MSc graduate, Bocconi University, Fritz-Boehle-Strasse 14,
Frankfurt am Main, Germany
Overview Corporate interest in the procurement of renewable energy for meeting their internal energy demand has been increasing exponentially over the past several years. This phenomenon has been most significantly present in the U.S., where the number of projects and the capacities contracted by corporations are of considerable amount with respect to any other country worldwide. PPAs soared from an average of 500 megawatts (MW) in 2001, to cumulatively 22 gigawatts (GW) globally in 2017, and almost all of this in the U.S. (Henze, 2018). Bloomberg New Energy Finance (BNEF) follows the developments in global corporate renewable energy procurement and reports that in 2018 through July, corporations already purchased 7.2GW of clean energy globally, overshadowing the previous record of 5.4GW for the whole of 2017. The PPA as a procurement mechanism is particularly relevant for the development of the renewable energy industry because the contract is usually signed for a period of 10-20 years and for a fixed price per MW of energy generated. The longevity of the contract and the high level of engagement required prior to signing, lead to the assumption that the motivation of companies cannot be purely reputational. Methods Descriptive statistics and multiple linear regression are applied to the data, in order to study the current situation and to unveil the motivation of corporations to sign PPAs. The descriptive research provides information regarding the historical development between 2006 and 2016, key actors, locations, types of contracts and capacity volumes contracted by non-energy companies in the U.S. via PPAs. The dataset used for the linear regression is based on the list of Fortune 500 companies. The dependent variable is binary: signing of PPA versus non-signing. The relationship between various sustainability targets and the signing of a PPA is explored, as well as the eventual influence of belonging to a certain industry on the propensity of signing the contract. Results The descriptive statistical analysis shows the distribution of different contract typologies across six different industries, as well as across different RES technologies. Through the descriptive analysis a strong influence of large corporations on the development of PPA was recognized. Based on the multiple linear regression on the dataset of Fortune 500 companies, an industry-based relation was found to be existent and significant. Companies belonging to the Food & Beverage, Tech, Manufacturing and Retail were more likely to sign a PPA than the other two sectors – Financial & Insurance and Other.

128
Session 15 - Integrating renewables in energy markets
Furthermore, two of the four sustainability indicators showed a positive and significant relation to the propensity of signing a PPA: renewable energy target and a 100% renewable energy target, whereas the other two – GHG target and internal carbon pricing, did not show any statistically significant relation. Conclusions The study primarily sheds light on the current state of PPAs signed by non-energy companies in the U.S, which has so far been the world’s largest market for this type of contracts. An attempt to understand and quantify the key drivers behind companies’ decisions to sign a PPA is also undertaken. Both the descriptive analysis and the regression analysis of data on the Fortune 500 companies have shown that companies belonging to certain industries are more likely to sign a PPA in comparison to others. Sustainability targets have been highlighted as a key factor influencing companies to sign a PPA. In addition, technology-based tendencies, exploring whether certain forms of PPAs are used preferably for sourcing energy generated by a specific type of RES and which RES technology is the source of the greatest MW capacity generated, as well as whether certain contract typologies are associated with specific RES, are also presented. References Henze, V. 2018. Corporations Purchased Record Amounts of Clean Power in 2017. Accessed on
04/09/2018, https://about.bnef.com/blog/corporations-purchased-record-amounts-of-clean-power-in-2017/
O'Shaughnessy, E., Heeter, J. and Liu, C., 2016. Status and Trends in the US Voluntary Green Power Market (2015 Data).
RMI, Business Deal Tracker, 2018, Accessed on 04/09/2018, http://businessrenewables.org/corporate-transactions/
Sharfman, M.P. and Fernando, C.S., 2008. Environmental risk management and the cost of capital. Strategic management journal, 29(6), pp.569-592.
McCrone, A. 2017. McCrone: Companies buying green power – how big a trend? Bloomberg New Energy Finance. Accessed on 12/11/2017, https://about.bnef.com/blog/companies-buying-green-power-big-trend/
Bloomberg New Energy Finance. Corporations Already Purchased Record Clean Energy Volumes in 2018, and It’s Not an Anomaly. Bloomberg New Energy Finance.
Accessed on 12/11/2017, https://about.bnef.com/blog/corporations-already-purchased-record-clean-energy-volumes-2018-not-anomaly/?link=desc

129
Session 15 - Integrating renewables in energy markets
Agatino Nicita, Gaetano Maggio, Antonio P.F. Andaloro, Gaetano Squadrito THE HYDROGEN PRODUCTION FROM RES IMPACT ON ENERGY AND FUEL MARKETS
Agatino Nicita, Istituto di Tecnologie Avanzate per l’Energia “Nicola Giordano” (CNR ITAE), Gaetano Maggio, Istituto di Tecnologie Avanzate per l’Energia “Nicola Giordano” (CNR ITAE),
Antonio P.F. Andaloro, Istituto di Tecnologie Avanzate per l’Energia “Nicola Giordano” (CNR ITAE), Gaetano Squadrito, Istituto di Tecnologie Avanzate per l’Energia “Nicola Giordano” (CNR ITAE,
Overview World countries have set itself to reduce greenhouse gas emissions in the short / medium term, and Europe committed itself to reducing Green House Gas (GHG) emissions to 80-95% below 1990 levels by 2050. These policies are based on the development of non-fossil energy supply and electrification. In this context, the increasing of shares of electricity produced from renewable sources is an ineluctable necessity. In recent years, the production of renewable energy has increased considerably, but given the dependence of these sources from sun daily cycle and weather, there is a mismatch between production and demand. This arises some issues as balancing the electricity grid, and in particular the use of the energy surplus and compensation of energy lacks, as well as the need to strengthen the electricity grid. Among the various new solutions that are being evaluated, there are: the accumulation in batteries, the compressed air and hydrogen storage. These solutions appear to be the most suitable to associate with the water accumulation (pumped hydro). Concerning the hydrogen, recent research highlights that the efficiency hydrogen storage technologies have lower performance compared to advanced lead acid batteries on a DC to DC basis, but”...In contrast, according to the cost of Hydrogen storage is competitive with batteries and could be competitive with CAES and pumped hydro in locations that are not favorable for these technologies.” [1] This means that, once the optimal efficiency rate is reached, the technologies concerning the production of hydrogen from renewable sources will be a viable and competitive solution for balancing electric grid. However hydrogen is not just a storage medium like batteries and compressed air, it is also a fuel with a number of possible applications. Consequently, what will be the impact on the energy and fuel markets? The production of hydrogen through electrolysis will certainly have an important economic impact not only in electricity and in the transport sectors, but will lead also to the creation of a new market and new supply chains that will change the physiognomy of the entire energy market. Methods We start by a review aimed to analyze papers published during a period of 10 years, from 2008 till 2017. The analysis has been focused on socio-technical-economic studies, in particular research conducted through a multidisciplinary approach or in which the economic and social issues coming out from the introduction of storage hydrogen technologies are considered.

130
Session 15 - Integrating renewables in energy markets
In a first stage, more than 300 papers have been considered, of which only 70 of them, in a second stage, have been analyzed deeply. To carry out this review, we have referred at the methodology of McDowall and Eames [2]. This review has been the base to draft some possible scenarios in which a set of possible perspectives and market opportunities due the exploitation of RES based hydrogen has been defined. Results The analysis has allowed to build a framework about forecasts, models and scenarios that have been developed in recent years regarding the impact of the production of hydrogen from renewable sources. The purpose of this research activity was to identify the aspects that have not yet been explored or which must be further researched in order to have a broader and more concrete vision of the possible changes that can occur in the electricity and fuel markets by using the surplus of energy from renewable sources to produce hydrogen. Comparison of the literature appears not simple due to the fact that presented results are dependent by the considered scenarios, although quite all of these are based on the maintenance of the existing structures in electricity and fuel markets also in presence of the new hydrogen applications. While considering the different approaches and scenarios, according to us, it seems clear that hydrogen will unify electricity and fuel markets, changing the actual paradigm of the energy market. Moreover hydrogen is a raw material for a number of industrial productions with high added value that today represent quite the totality of the hydrogen market. This last could be the first market for RES-Hydrogen, but it is usually not too much considered. Finally we have not found out significant evaluation of the social and environmental issues related to large scale RES-hydrogen application. Conclusions The literature review seems to indicate that the large scale commercial exploitation of hydrogen is ineluctable. We can expect that hydrogen will offer new possibilities but, at the same time, will introduce new challenges. Indeed, it will play an important role in both markets fuel and electricity, laying the basis for further development of power generation from renewable sources. These new opportunities have not been sufficiently addressed and evaluated. Our future work will be addressed at evaluating the potential impact of hydrogen as market merging, this without neglecting the possible issues related to large scale RES-hydrogen application. References [1] Moliner R., Lazaro M.J., Suelves I., 2016. Analysis of the strategies for bridging the gap towards the
Hydrogen Economy. International journal of hydrogen energy 41 (2016) 19500 e19508 [2] McDowall W., Eames M., 2006. Forecasts, scenarios, visions, backcasts and roadmaps to the hydrogen
economy: A review of the hydrogen futures literature. Energy Policy 34 (2006) 1236–1250.

131
Session 16 - Strategic contribution of energy storage to energy security
Damian Shaw-Williams, Connie Susilawati VALUING THE IMPACT ON NETWORK RELIABILITY OF RESIDENTIAL BATTERY STORAGE
Damian Shaw-Williams: Queensland University of Technology, 2 George St, Brisbane 4000, Qld, Australia
Connie Susilawati: Queensland University of Technology, 2 George St, Brisbane 4000, Qld, Australia Overview Australian households have lead the world in the adoption of photovoltaics (PV) with over 1.8 million [1] households investing in energy infrastructure. Much research has looked at the challenges to network operation and management presented by moving to higher penetrations of PV on distribution networks. The increasing availability of batteries for residential storage holds great potential for more efficient utilization of networks through helping to manage these challenges. The purpose of this paper is to evaluate the impact of residential storage on network reliability metrics. Methods This analysis will be based on a highly granular techno-economic multi-household simulation model [2]. Due to the stochastic nature of temperature, weather and household demand profiles a Monte Carlo based simulation model will be constructed in a series of modules and an economic evaluation undertaken. The economic evaluation will seek to ascribe a value to measures of self-sufficiency afforded by reserved storage as well as the impact on Distribution Network Service Providers (DNSPs) reliability measures. This study will evaluate the impact of householder investment in energy infrastructure on the commonly used System Average Interruption Duration Index (SAIDI) metric and Value of Customer Reliability (VCR) [3]. Results Using publicly available information for a test suburb in Queensland Australia, feeder and zone substation data simulations were run across a range of PV & battery penetration scenarios. The value of increased reliability per household is valued at an average of $AUD 223 per year and further that SAIDI metrics for the 44% residentially loaded test area are would be improved by 14% if the current 24.9% of detached households were to incorporate battery storage. Conclusions One of the key obligations of network operators is reliability of the network. The nature of the networks themselves are changing as households are investing in energy infrastructure and becoming prosuming participants in network operations. The challenge for network operators is to establish collaborative approaches to unlock the potentially large gains in network capital efficiency and network reliability that is on offer through moving to a ‘thicker’ more decentralized network. The addition of battery storage to households with PV enabling them to utilize a greater proportion of PV generation will have significant impacts on reducing network evening peaks.

132
Session 16 - Strategic contribution of energy storage to energy security Without a collaborative approach between network operators and presuming households many opportunities for network efficiencies will be missed. Households following individually determined charging schemes will have positive impacts on network resilience, however, greater capacity will be left on the table without proactive incentive schemes. References [1] AER, State of the Energy Market 2017, 2017. [2] D. Shaw-Williams, C. Susilawati, G. Walker, Value of residential investment in photovoltaics and
batteries in networks: A techno-economic analysis, Energies 11(4) (2018) Article number 1022. [3] AEMO, Value of Customer Reliability Review, (2014).

133
Session 16 - Strategic contribution of energy storage to energy security Olvar Bergland DISPATCH AUCTION DESIGNS AND ARBITRAGE STRATEGIES FOR ENERGY STORAGE UNITS
Olvar Bergland, School of Economics and Business, Norwegian University of Life Sciences, N-1432 Ås, Norway
Overview The increasing share of intermittent renewable sources in the generation mix is adding strains on the electricity system. Energy storage serves two main purposes; first as readily available power for supply and system security, and second as highly controllable and flexible source or sink to smooth variations in intermittent (and other) supplies. Energy storage in the second capacity serves a potentially important role by eliminating high price periods, or even avoiding curtailment periods, and thus being an important and integral part of the future energy system with a higher degree of intermittent penetration. Assessing the value of energy storage units and the profitability of investment in such strategies is essentially an assessment of uncertain future revenue streams in a highly stochastic environment. A number of past studies of the value of energy storage relies on perfect foresight thereby overestimating the arbitrage value of the storage unit. Other studies have relied on various rule-of-thumb strategies which most likely underestimates the arbitrage value and may give incorrect recommendations with respect to the relative merits of the various rules. This paper describes the arbitrage strategy for an energy storage unit that participates in a dispatch auction. Most restructured energy markets are using auctions in the day-ahead markets and/or in any balancing markets before the operating hour of the electricity system. The optimal bidding for selling and buying electricity by the energy storage unit is modeled explicitly as a dynamic expected profit optimization problem where the decision maker does not know the future electricity price. The analytic solution is characterized, and then solved numerically. The numerical solutions allow for the assessment of the potential arbitrage gains from operating a storage unit, and is an integral part of the investment analysis for such a unit. Furthermore, the numerical model is used to assess the impact of different auction designs with respect to gate closure, intra-day bidding and bid designs. Methods The energy storage unit is assumed to participate in a market auction where the storage manager submit a bid for buying or selling one unit of energy in the next period. The manager has an estimate (belief) of the market clearing price in the next period. The manager decision is modeled using stochastic dynamic programming where the number of energy units in storage is the state variable and the buy and sell bids are the control variables. The analytic model is developed both for a single period auction and for a multi period auction where the manager submits bids for several sequential market clearing periods at a time. The analytic solution is derived and used to characterize the no-arbitrage conditions. The standard day-ahead auction is the default case considered. This is compared to a “continuous” intra- day auction with an explicit auction before each operating period. Furthermore, variants of the flexible order bidding strategy available in the European market is analyzed.

134
Session 16 - Strategic contribution of energy storage to energy security This model is also solved numerically where the probability distributions are taken from the actual market clearing prices in three different markets: the British, the Danish and the German day-ahead markets. These markets are distinct with respect to market penetration of intermittent renewables and also with respect to peak/off-peak prices. Results The explicit formulation of energy storage manager’s bidding problem allows the explicit expression of the no-arbitrage conditions. Furthermore the numerical model first of all demonstrates the viability of this approach to valuing any energy storage units. The numerical analysis shows clear differences in the arbitrage value of an energy storage unit between these three markets. Even if the Danish energy system has the highest renewable energy source penetration, the Danish market represents the lowest arbitrage value. This is a direct result of the low peak/off-peak prices spread observed in Denmark where flexible energy production in interconnected neighboring countries is already absorbing much of the arbitrage value. The increase in solar production in Germany has reduced the peak/off-peak spread over time, and this is reflected in a decrease in arbitrage value for storage in Germany from 2012 to 2017. Participation in a traditional day-ahead market yield lower arbitrage values than the intra-day market and the flexible bid auctions. Th e flexible bid auctions is by design maximizing the arbitrage value over the auction period, while allowing only a single arbitrage action (buy/sell). The “continuous” auction allows for multiple arbitrage actions which is valuable if there are multiple price peaks during a day. Conclusions The increased penetration of intermittent renewable generation sources is placing electricity system under pressure with respect to price volatility and system security. Large scale storage may be needed in order to maintain system security, and could also represent profitable arbitrage opportunities. The analytic model proposed here is designed to represent the storage unit manager’s decision problem when participating in a dispatch auction. The model is also solved numerically, thus demonstrating the practical viability of this approach, and how this model can be used to assess the expected revenue stream from an energy storage unit. The design of the dispatch auction influences the arbitrage value of the energy storage unit, and also the social benefits from the energy storage.

135
Session 16 - Strategic contribution of energy storage to energy security Silvia Canevese, Antonio Gatti BESS FOR PRIMARY FREQUENCY REGULATION IN SUPPORT OF THERMAL POWER PLANTS Silvia Canevese, Energy Systems Development Department, Ricerca sul Sistema Energetico - RSE S.p.A.,
Via Rubattino 54, Milan, Italy Antonio Gatti, Energy Systems Development Department, Ricerca sul Sistema Energetico - RSE S.p.A.,
Via Rubattino 54, Milan, Italy
Overview The increasing share of Non-Programmable Renewable Energy Sources (NPRES) calls for an increasing need for Ancillary Service (AS) supply, to ensure balancing and control of the power system both in normal and in emergency operating conditions. Without sufficient support by NPRES/Distributed Generation (DG) and/or by demand, fewer and fewer conventional thermal power plants have to be able to respond with faster power ramping and with frequent startups/shutdowns, with both technical and economic drawbacks. Battery Energy Storage Systems (BESS), thanks to their high response speed, could be effectively employed for more flexible AS, especially the fast ones like Primary Frequency Regulation (PFR), in a “stand-alone” configuration or in support of NPRES plants (where allowed) or Conventional Power Plants (CPP). In particular, CPP could thus gain economic benefits, i) by selling their whole capacity on the energy market while using the BESS for the PFR service, or ii) by providing more flexible AS (e.g. faster PFR just thanks to the BESS). Methods Here, a techno-economic analysis is carried out about PFR supply by a BESS in support of an Italian fossil-fuelled CPP. The State of Charge (SoC) dynamics are described simply as a function of the power exchanges with the network and take into account, via charge and discharge efficiency coefficients, the losses in the battery and in the inverter. The PFR service requests vary the BESS power set-point in response to the frequency error with respect to 50 Hz, according to a power-frequency characteristic compliant with the specifications of the Italian Grid Code for CPP; here, typical values of the plant permanent droop are considered in the characteristic, namely 2%, 5% and 8%, and a dead-band compensation mechanism is adopted. A SoC restoration mechanism acting when no exchange requests are present from PFR is also modeled: if the SoC is below or above a target range, constant power is absorbed or injected respectively. The BESS size in terms of nominal power Pn is chosen according to typical values required for PFR reserve for CPP in Italy: letting Pn,imp be the maximum power output of the plant, Pn = 1.5% Pn,imp or Pn = 3% Pn,imp here. The adopted input frequency profile is a measured continental system frequency time series along a 29-week period, between June 1, 2015 and December 20, 2015, with a 100-ms sampling step. Along the reference 29 weeks, the hourly generation data for the considered coal plant, with Pn,imp = 660 MW maximum power output, are taken from the ENTSO-E Transparency Platform website. Three battery technologies are evaluated: lithium-ion (referred to as “Li” below), with nominal energy to nominal power ratio En/Pn
= 1 h and Battery Cost BC= 600 k€/MWh; sodium-sulfur (“NaS”), with En/Pn = 6.67 h and BC = 400 k€/MWh; sodium nickel chloride (“NaNiCl2”), with En/Pn = 3 h and BC = 583 k€/MWh; the Power Electronics Cost PEC is assumed as PEC = 300 k€/MW for all the three technologies. The BESS response is analyzed in terms of energy exchanged (in absorption and injection separately), average power exchanged, fractions of time in which power is injected, absorbed, not exchanged.

136
Session 16 - Strategic contribution of energy storage to energy security The energy exchanged, for PFR and for SoC restoration, is evaluated economically according to the Italian regulatory framework, with particular reference to the Northern Italy market zone. Then, considering the BESS investment costs (i.e. the CapEx related to BC and PEC) and the annual profit from the PFR service and from SoC restoration, the Pay-Back Period (PBP) of the BESS investment is evaluated. The PBP is also compared with the BESS cycling life, computed as the ratio between the maximum number of cycles tolerable by the battery and the equivalent cycles performed. For the estimation of these latter, in addition to the standard procedure based on the comparison between the total energy injected into the grid during the reference time period and the BESS nominal energy, a refined procedure is adopted to take into account the actual time profile of the SoC, and therefore of the Depth of Discharge (DoD), during the simulated operation and the maximum number of cycles that a battery of a given technology tolerates as a function of the DoD itself. Results Considering, in particular, a BESS with nominal power Pn = 1.5% Pn,imp, and a 5% plant droop value, by extrapolating to 1 year the results obtained for the considered 29-week period about energy exchanges, one has that against an ideal downward/upward request (i.e. in the absence of any power saturation of
the adopted PFR power- frequency characteristic) amounting to about 1370 Pn h/1364 Pn h, the power limitations of the BESS leads to an absorption request for the BESS about 94.6%/95.0% of the ideal request respectively;
moreover, and in particular because of the BESS energy (i.e. SoC) limitations and energy conversion losses, for the Li BESS (En/Pn = 1 h) the energy not absorbed and not injected for the regulation is 268 Pn h and 416 Pn h respectively; if the En/Pn ratio increases, the energy not absorbed for the regulation decreases, as expected, but less than the increase in En/Pn; the energy not injected for PFR decreases less than the energy not absorbed for PFR.
Among the three technologies considered, the best one from the point of view of the ability to exchange energy is therefore the NaS one, i.e. the one with the highest En/Pn, (6.67 Pn h), even if the differences compared to the NaNiCl2 technology, the one with an intermediate En/Pn (3 Pn h), are not always so relevant.
As to the net annual profit, one has, without the SoC restoration strategy:
for Pn= 1.5% Pn,imp: 800-1000 k€ in case of 2% plant droop (compared with the one associated to the requests for energy exchanges related to the BESS power-frequency characteristic, 1600 k€, and to the one associated to ideal requests, 2300 k€), 400-620 k€ in case of 5% plant droop (compared to 700 k€ and 750 k€ as above) and 300-450 k€ in case of 8% plant droop (compared to about 460 k€ and about 460 k€ again);
for Pn= 3% Pn,imp: 1250-1500 k€ in case of 2% plant droop (compared to 2100 k€ and 2300 k€ as above), 500-700 k€ in case of 5% plant droop (compared to 750 k€ for both actual and ideal exchange requests) e 310-460 k€ in case of 8% plant droop (compared to around 470 k€ for both actual and ideal requests).
Considering SoC restoration, the net annual profit is in the 280-900 k€ range for a BESS with Pn= 1.5% Pn,imp and in the 280-1250 k€ range for Pn= 3% Pn,imp. Thus, considering the battery and converter costs adopted, on the basis of the net profits on a yearly basis, a very variable PBP is obtained: in fact, it does not only depend on the droop and on Pn, but also on the BESS technology in terms of energy capacity, which in turn determines the investment cost. For example, the Li BESS has PBP = 10 and 15 years in the two cases with 2% plant droop, while the NaS and NaNiCl2 BESS can never reach their payback (even with the minimum plant droop considered) within the battery calendar life, which can be considered as 15-20

137
Session 16 - Strategic contribution of energy storage to energy security years. However, if one takes into account the battery cycling aging for Li, return on investment is not possible because cycling life is no longer than 7-10 years. In this last case profitability can be obtained if a regulation support by the CPP itself is introduced: for Li and in the cases with minimum plant droop (2 %), the support would result in an additional net profit such as to halve the PBP (PBP=5-7.5 years) and make it smaller than the useful cycling life computed via the mentioned refined procedure based on the DoD profile. This PBP halving result is obtained also for the two other battery technologies so that the PBP becomes smaller than or equal to 20 years. Conclusions The possible application of a BESS in support to PFR by a conventional power plant is analysed. Using only the BESS for the regulation (i.e. without further support by the plant itself) may not be profitable, due to the BESS limited energy capacity, as it happens for the Li technology, or due to its high investment costs, as in the NaS case. However, although with additional O&M costs, the plant can at the same time employ the reserve made free by the BESS for other services or sell the freed reserve on the day ahead market; an evaluation of the potential profitability of such sale, in particular, is ongoing. Another extension consists of analyzing how to exploit the BESS fast response superposed to the slower plant response, e.g. to increase the plant ramp rate; in this case, the profitability could be increased if the BESS fast response were suitably remunerated. References Benato, R., Bruno, G., Palone, F., Polito, R., and Rebolini, M. (2017) “Large-Scale Electrochemical Energy
Storage in High Voltage Grids: Overview of the Italian Experience”, Energies 10(108): 1-17. AA.VV., “M5BAT - Modular Multi-Megawatt Multi-Technology Medium Voltage BATtery Project”,
[Online]. Available: http://m5bat.de/en-gb/. Thien, T., Axelsen, H., Merten, M., Zurmühlen, S., Münderlein, J., Leuthold, M., and Sauer, D. U. (2015)
“Planning of Grid-Scale Battery Energy Storage Systems: Lessons Learned from a 5 MW Hybrid Battery Storage Project in Germany”, in Battcon Stationary Battery Conference and Trade Show 2015, Orlando (FL), USA.
Lærke, R. and Carne Kjær, P. (2013) “Ancillary services provided from wind power plant augmented with energy storage”, 15th European Conference on Power Electronics and Applications (EPE), Lille, France.
Lærke, R. and Carne Kjær, P. (2013) “Field Tests Experience from 1.6MW/400kWh Li-ion Battery Energy Storage System Providing Primary Frequency Regulation Service”, 4th IEEE PES Innovative Smart Grid Technologies Europe (ISGT Europe), Lyngby, Denmark.
Fan, Q., Gu, W., Xiao, Y., Lin, C. H., Wen, X. K., Chen, J. G., Xu, M. M., Xu, Y. T., Chen, Y. Y., and He, Y. (2016) “Research on Wind-Storage System Participating in Frequency Regulation for Energy Internet”, in Advances in Power and Energy Engineering, CRC Press, pp. 159-162.
Bignucolo, F., Caldon, R., Coppo, M., Pasut, F., and Pettinà, M. (2017) “Integration of Lithium-Ion Battery
Storage Systems in Hydroelectric Plants for Supplying Primary Control Reserve”, Energies 10(1): 98. Meléndez Cabañas, J. (2009) “Conversión de una central térmica convencional en CT hibrida”, XIII ERIAC,
Décimo Tercer Encuentro Regional Iberoamericano de CIGRÉ, Puerto Iguazú, Argentina. Benini, M., Canevese, S., Cavaliere, A., Cirio, D., Gatti, A., Grisi, P., and Pitto, A. (2015) “Cost-Benefit
Analyses of Storage Systems Applications for the Provision of Dispatching Services”, 15th International Conference on Environment and Electrical Engineering (EEEIC), Rome, Italy.
Canevese, S., Gatti, A., Micolano, E., Pellegrino, L., and Rapizza, M. (2017) “Battery Energy Storage Systems for Frequency Regulation: Simplified Aging Evaluation”, 6th International Conference on Clean Electrical Power (ICCEP), Santa Margherita Ligure, Italy, pp. 291-297.

138
Session 16 - Strategic contribution of energy storage to energy security
Claudia Pavarini RISING FLEXIBILITY NEEDS IN THE POWER SECTOR AND THE GROWING ROLE OF ENERGY STORAGE IN THE WORLD ENERGY OUTLOOK
Claudia Pavarini, International Energy Agency (IEA) Abstract In all markets, electricity system flexibility needs to increase as the profile of demand changes and the share of variable renewables rises. Available sources of flexibility almost double by 2040, with power plants accounting for the bulk of the system’s ability to handle hour-to-hour changes. Interconnections, battery storage and demand-side response contribute 1 100 GW. As the cost of battery storage declines fast, batteries increasingly compete with gas-fired peaking plants to manage short-run fluctuations in supply and demand. Also, the pairing of variable renewables with storage becomes an attractive option to increase the value of these technologies as their costs fall. Where the profiles of wind and solar PV output best match demand, their integration is less challenging. Flexibility needs increase dramatically in some regions; Mexico reaches a stage of system integration where few countries are today, and the call for flexibility on an hourly basis triples in India. Several European countries move into uncharted territory in terms of integrating high shares of variable renewables.

139
Session 17 - Energy supply and security
Balázs R. Sziklai, László Á. Kóczy, Dávid Csercsik THE GEOPOLITICAL IMPACT OF NORD STREAM 2
Balázs R. Sziklai, Centre for Economic and Regional Studies, Hungarian Academy of Sciences, László Á. Kóczy, Centre for Economic and Regional Studies, Hungarian Academy of Sciences,
Dávid Csercsik, Pázmány Péter Catholic University Overview We investigate the geopolitical impact and the possible consequences of the construction of the Nord Stream 2 pipeline. We model the European gas network as a cooperative game between regions as players over the pipeline network, where LNG is also treated as a separate player. We focus on the change of influence of the players in three different scenarios. We investigate how the power of the agents shift when the Nord Stream pipeline is expanded, when the Ukrainian pipeline is shut down and finally when both of these happen. Methods We set up a cooperative game, where players are identified with countries. A coalition of players may utilize the segment of the pipeline network they own, and trade on it. We assume that every country can satisfy its gas demand using a (costly) alternative source, hence, trading leads to cost saving. We derive bargaining power by calculating the Shapley-value for the stakeholders. Result Our analysis shows that each country in Europe is governed by self-interest. Russia and Germany are the main beneficiaries and supporters of the Nord Stream 2 project. Northeast Europe, namely, Poland, Ukraine, Czech Republic and Slovakia oppose it because they will lose their advantage as transit countries. Central- and South Europe fear that the construction of Nord Stream 2 will ultimately result in closing down the Ukrainian route in which case there will be a shortage of cheap Russian gas in the region. Network flows show, that even if Nord Stream 2 would provide significantly cheaper gas, the benefits would never reach the Eastern part of Europe. Conclusion The calculated bargaining power provides great insight why certain countries support the Nord Stream 2 project and why others oppose it. Declining inland production and the need to increase supply security, forces EU decision makers to commit themselves on further developing the European gas network. Consequently there is no lack of project plans. Game theoretic analysis of the different scenarios can help us deciding which projects will be realized in the future.

140
Session 17 - Energy supply and security
References Boots, M. G., Rijkers, F. A., and Hobbs, B. F. (2004). Trading in the downstream European gas market: A
successive oligopoly approach. The Energy Journal, 25(3):73–102. Hubert, F. and Ikonnikova, S. (2011). Investment options and bargaining power: The Eurasian supply chain
for natural gas. The Journal of Industrial Economics, 59(1):85–116. Hubert, F. and Coblani, O. (2015). Pipeline power: A case study of strategic network investments. Review
of Network Economics, 14(2):75–110. Lochner, S. (2011). Identification of congestion and valuation of transport infrastructures in the european
natural gas market. Energy, 36(5):2483 – 2492. Mitrova, T., Boersma, T., and Galkina, A. (2016). Some future scenarios of Russian natural gas in Europe.
Energy Strategy Reviews, 11-12:19 – 28.

141
Session 17 - Energy supply and security
Julia Vainio THE INCREASE OF RENEWABLE ENERGY SOURCES WILL CHANGE OUR ENERGY SECURITY LANDSCAPE – A LOOK ON THE BALTIC SEA REGION STATES1
Julia Vainio, Subject Matter Expert, NATO ENSEC COE, Lithuania
Overview
The increase of Renewable Energy Sources (RES) is usually portrayed as the ultimate good and virtue that states can strive towards. However, in the last few years, discussion has risen on the possible threats that might emerge alongside the rapid expansion of renewables in the global energy sector. These changes do not happen radically or overnight. They develop over time as energy sectors gradually change from the phasing out of fossil fuels to the phasing in of renewable technologies. By renewable energy, we adhere to the IEA’s definition of RES [1]: “Energy derived from natural processes (e.g. sunlight and wind) that are replenished at a faster rate than they are consumed. Solar, wind, geothermal, hydro, and some forms of biomass are common sources of renewable energy.” Being part of a resilient modern society, states must identify the emergence of corresponding and widespread risks in their operating environment. This abstract looks at the level of preparedness in assessing risks and vulnerabilities from RES to Baltic Sea Region states. Through the interviews conducted in Norway, Sweden, Finland, Estonia, Latvia, and Lithuania, it became clear that attitudes and preparedness for new types of risks was dependent on the energy mix of each state. Most identified risks were either technical or market-related in their nature. Especially the synchronization of Estonia, Latvia, and Lithuania to the Central-European electricity network was seen as further vulnerability for the states in question.
Methods
A total of 15 experts in 14 different occasions were interviewed for this article. The majority of interviewees work in various levels of policy planning and implementation in the civil sector. Interviewers have also been selected from the academic sector, non-profit organizations and transmission system operators and the private sector. A majority of the interviewees were either recommended by the Ministries of Employment, Energy, Foreign Affairs or Defence (or the equivalent of each Ministry in the countries in question), or chosen based on their academic merit and relevance to the topic. At least one civil servant working in the field of energy is represented from each nation. Of the 15 interviewed persons, there are three people from Finland, Estonia and Sweden, and two people from Latvia, Lithuania, and Norway. ______________________________ 1 The comprehensive article will be published in NATO ENSEC COE’s journal Operational Highlights: 12 during December 2018. Access to the publication: https://enseccoe.org

142
Session 17 - Energy supply and security
The method in the interviews was a pre-structured format of four questions, and the qualitative interviews were either done on the phone or in person. The interviewees were provided a draft version of an Operational Highlight publication’s article as a reference [2]. The questions included a local, regional and global aspect to the issue. Many of the interviewees approached the emerging security threats in a two-fold manner: they discussed both the threats that the increase of renewables might bring with them to different sectors in society as well as the possible threats that might delay the implementation of renewable energy sources.
Results
The qualitative interviews showed that the approach to energy security related issues varied according to each country’s energy mix and international position. Norway and Sweden, which already have large renewable energy production capabilities, were less concerned with more comprehensive security and market related risks related to the price of electricity for industry and households, whereas in Estonia, Latvia and Lithuania these concerns were raised up more often. The most often occurring identified threat to regional electricity system were concerns related to cyber-attacks in transmission networks, however most of the interviewees included both traditional means of power production as well as non-traditional means (such as RES) as being vulnerable to cyber-attacks. Other technical vulnerabilities, such as issues related to system stability; the amount and resilience of interconnectors; and intermittency due to the increased amount of renewable sources of electricity in the system, were also shared across the representatives from the region. From the political and market risk perspective, especially the future role of Russia as a primary fossil fuel resource state was among the most mentioned combining factors. With the projected increase in the production of indigenous sources of energy, states that are largely dependent on raw material demand globally are in danger of losing their markets, which might increase global insecurity in the future. From an environmental risk side, the advances in climate change and the possibility of dry years were seen as threats to hydro power production. This was especially the case in Norway and Latvia. Conclusions There was a general consensus among the interviewed that all sources of energy bring forth both stabilizing and destabilizing factors. The Baltic Sea Region acted as a somewhat integrating factor among the interviewees, and especially the common electricity markets and the shared EU regulation (Norway's target for the increase of renewables follows a decision by the EEA Joint Committee [3]) were regarded as unifying aspects. However, the qualitative analysis showed that opinions and approaches to the emerging security risks from the increase of RES did depend on the country the interviewed person identified with or was interviewed of.

143
Session 17 - Energy supply and security The most frequently occurring conclusion in the interviews was, however, that the current policy-development towards the increase of RES is a good thing. The decrease of fossil fuel consumption brings stability and reduces emissions in the long run. However, in order to stay in the right path, as one interviewee put it: “there is a lack of understanding about energy […], the system knowledge is inadequate and [energy] is taken as granted, not understanding its real share and meaning on a global scale”.
References
[1] The IEA Website. Source: https://www.iea.org/
[2] NATO ENSEC COE. December 2018. Changing security aspects for the future energy systems: Renewable energy and possible risks for nation states, Operational Highlights 12. Access to the publication: https://enseccoe.org/
[3] Energy Facts Norway, Key EU energy legislation. Source: https://energifaktanorge.no/en/eu-lovgivning/sentrale- direktiver-pa-energiomradet/

144
Session 17 - Energy supply and security László Á. Kóczy, Dávid Csercsik, Balázs R. Sziklai A RISK-BASED EVALUATION OF EUROPEAN NATURAL GAS SUPPLY SECURITY – THE CASE OF NORDSTREAM 2
László Á. Kóczy, Centre for Economic and Regional Studies, Hungarian Academy of Sciences and Budapest University of Technology and Economics Dávid Csercsik, Pázmány Péter Catholic University
Balázs R. Sziklai, Centre for Economic and Regional Studies, Hungarian Academy of Sciences,
Overview Much of the literature of the European natural gas pipeline network focuses on the costs of energy supply and supply security is used in the sense of limiting the risk of shortages. We consider the risks of the disruptions of the pipeline network itself and use risk measures widely used in the finance literature to evaluate the consequences of the construction of Nordstream 2. Methods We study a simplified version of the European gas pipeline network focusing on the international pipelines. We consider the possibility of service disruptions on such international pipelines. Such disruptions are possible due to a wide range of causes: failed negotiations between trading partners, accidents, natural disasters, sabotage, terrorist attacks or simply strategic considerations of the operators. Assigning statistical probabilities to such events and calculating the country-level consequences in energy costs we see supply cost as a random variable. By risk we simply refer to the variability of the supply costs. In the finance literature risk measures are used to evaluate the cash value of a risky portfolio. Spectral risk measures are risk measures where states of the world or events with lower values are taken with a higher weight into account to express the conservativism of the investors. The same kind of conservativism must guide us when securing energy supply and therefore the random costs of energy supply are also evaluated using spectral measures of risk. Of these, expected shortfall is the simplest and most established therefore we use that, too, for our numerical evaluation. Result Our calculations reveal critical bottlenecks in the supply of the West- and South-Balkans. It turns out that Nordstream 2 may reduce costs overall, it certainly makes the supply of South-East Europe more risky. In this setting a possible phasing out of the Brotherhood pipeline – often cited as old and outdated – could be catastrophic for this region. Conclusion Our findings highlight the importance of the evaluation of EU energy policies for stressed scenarios. The employed risk measures provide a feasible and intuitive method to quantify supply security. Looking at the effects and possible contingencies of Nordstream 2 the relevance of the solidarity concepts outlined in the Third Energy Package has not decreased and that efforts to increase the connectivity of the region should be further enhanced.

145
Session 17 - Energy supply and security References Acerbi, C. (2002). Spectral measures of risk: A coherent representation of subjective risk aversion. Journal
of Banking & Finance, 26(7), 1505–1518. Acerbi, C., & Tasche, D. (2002). On the coherence of expected shortfall. Journal of Banking & Finance,
26(7), 1487–1503. Boots, M. G., Rijkers, F. A., and Hobbs, B. F. (2004). Trading in the downstream European gas market: A
successive oligopoly approach. The Energy Journal, 25(3):73–102. Hubert, F. and Ikonnikova, S. (2011). Investment options and bargaining power: The Eurasian supply
chain for natural gas. The Journal of Industrial Economics, 59(1):85–116. Hubert, F. and Coblani, O. (2015). Pipeline power: A case study of strategic network investments. Review
of Network Economics, 14(2):75–110.

146
Session 18 - Technology development - Grid management
Andrew Burlinson, Anna Rita Bennato, Monica Giulietti DISTRIBUTED TECHNOLOGIES IN THE ENERGY MARKETS: WELFARE EFFECTS IN LEGACY NETWORKS
Anna Rita Bennato: School of Business and Economics, Loughborough University, U.K. Andrew Burlinson: School of Business and Economics, Loughborough University, 562 Derby Road,
Nottingham, NG72GY, U.K. Monica Giulietti: School of Business and Economics, Loughborough University, U.K.
Overview Renewable variable resources are considered one of the most crucial yet challenging components for the reduction of greenhouse gas emissions (IEA, 2017). With the aim to promote a faster transition towards a low carbon economy, governments across many countries worldwide have invested and subsidised the use of these alternative sources of energy, curbing successfully the carbon intensive behaviour of both consumers and suppliers. These changes, indeed, have been followed by a reorganisation of the energy systems, which have developed into more decentralised networks. However, this transformation is challenged by the innate intermittency of renewable technologies and exacerbated by fragmented market conditions and local network constraints. The deployment of energy storage technologies could represent a viable solution to overcome these barriers, by shifting the local energy generation to a better match in consumption profiles, whilst providing a range of ancillary grid services. Method Our paper utilises and develops the theoretical framework developed by Gautier, Jacqmin and Poudou (2016; 2017) - GJP hereafter - to explore the welfare effects of an energy system in which domestic prosumers deploy energy storage. In this scenario, prosumers become increasingly independent from the local energy network. Fewer power exchanges exert upward pressure on prices since the network costs are shared between a continuously shrinking consumer base. This phenomenon, coined the ‘death spiral’, concerns network operators in several key markets: landline telecommunications, postal services and energy (Decker, 2016). Technological innovations, such as energy storage, accelerate this process, calling for a revision of traditional utility models (Casteneda et al., 2017). In our analysis, we investigate, firstly, the welfare effects of domestic storage, and secondly, the distributional impact of network costs on consumers. While GJP reflect on the available technologies that can improve load balancing, including energy storage, we contribute to the literature by exploring the equity implications of these technological innovations that encourage network defection. Results From the perspective of the grid, we find that storage is a valuable asset due to the fact that fewer power exchanges are made which alleviates grid congestion and in turn reduces curtailment of renewable generation. Thus variable grid costs fall with a greater diffusion of solar and storage equipment. Similarly, for prosumers, the value of storage is derived from the greater level of self-consumption and reflects the ability to avert centralised production and network costs. Upon introducing storage, another key implication is that traditional consumers contribute more to grid financing than prosumers. In contrast, the burden of network costs is transferred to prosumers, rather than traditional consumers, in a system completely void (or with insignificant diffusion) of storage.

147
Session 18 - Technology development - Grid management Conclusion Energy storage can solve many barriers commonly associated with renewable technologies, particularly intermittency. However, there is a clear cause for concern that the legacy costs of the grid may fall disproportionately on low-income and vulnerable consumers which in turn prevents a widespread adoption of innovative technologies, especially given the current upfront cost of solar-storage packages. Importantly we extend the theoretical framework to analyze innovative market structures that might bring about are more equitable energy future, such as peer-to-peer trading, co-operatives and municipal supply - all of which are gaining prominence, challenging the status quo in a variety of markets worldwide. References Castaneda M., Jiminez M., Zapata S., Franco C.J. and Dyner I. (2017) Myths and facts of the utility death
spiral. J. Energy Policy, 110: 105-116. Decker C. (2016) Regulating networks in decline. J. Regul. Econ., 49: 344-370. Gautier A., Jacqmin J. and Poudou J.C. (2018) Prosumers and the grid. J. Regul. Econ., 53(1): 100-126. IEA (2017) World Energy Outlook. Paris, France: International Energy Agency.

148
Session 18 - Technology development - Grid management
Cristian Alvarez, Alejandro Angulo, Pablo Escalona OPTIMALITY STUDY OF UPLIFTS WITH A PRIMAL-DUAL SOLUTION APPROACH FOR THE CONVEX HULL PRICING PROBLEM
Cristian Álvarez C., Department of Industries, Universidad Técnica Federico Santa María, Avenida España #1680, Valparaíso, Chile
Alejandro Angulo C., Department of Electrical Engineering, Universidad Técnica Federico Santa María, Avenida España #1680, Valparaíso, Chile
Pablo Escalona R., Department of Industries, Universidad Técnica Federico Santa María, Avenida España #1680, Valparaíso, Chile
Overview In electricity markets, an independent system operator (ISO) schedules the dispatch of the generation units in a daily time horizon, usually in an hourly basis, solving the unit commitment problem (UCP). Also, as a market operator, ISO must determine the price of energy for transactions. However, due to the characteristics of the units, the market-clearing model is non-convex and therefore there is no uniform price that supports the equilibrium condition (O'Neill, 2005). A given price may incentivize some units to generate a different power output than those ordered by the ISO (Hogan, 2003). As an alternative to reach a quasi-equilibrium condition, a price is defined first and then a side payment or uplift based on the revenues of the units at the settled price. The common practice consists of setting prices based on the variable cost of the system marginal unit, and subsequently define uplifts to those units that fail to cover all operating costs with their revenues. The increase in uplifts, as well as their lack of transparency (Zhang, 2009), have motivated the search for new price schemes for electricity markets that seek to reduce or eliminate them (Liberopoulos, 2016). One way to reduce uplift is to set prices with the Convex Hull Pricing (CHP) method (Gribik, 2007). This method sets prices based on the slope of the convex envelope of the UCP optimal cost function parameterized by demand. The method obtains prices non-decreasing in demand and minimizes a type of uplift. To obtain the prices, the optimal multipliers of the dualized demand constraint in the lagrangian relaxation (LR) of the UCP are calculated (G. Wang, 2013). One of the last solution approach for the CHP problem is to define the convex hull of the set of feasible operations of the unit, thus obtaining the prices from the demand constraint duals, solving the linear programming (LP) relaxation of UCP (Hua, 2016). However, defining the convex hull of a polyhedron can be hard. Also, a change in the modeling implies developing special constraints to keep the convex hull. Method We use a network-flow approach to represent the unit feasible operations, similar to the graph presented in (Guan, 1992). This leads to an extended formulation of the CHP problem. On the one hand, this gives flexibility in modeling since the inclusion of new features only changes the network and not the formulation. On the other hand, it allows obtaining the exact convex hull prices by solving an LP problem.

149
Session 18 - Technology development - Grid management The formulation is solved with a primal-dual approach based on the Bienstock-Zuckerberg algorithm (Bienstock, 2015), which exploits the LR structure of our formulation, obtaining better computational performance than the obtained by commercial available solvers. In addition, the algorithm can stop the solution procedure with a preset optimality tolerance, which allows analyzing the effect of sub-optimal prices on the uplift payments. Results We compare the prices obtained with our formulation with those obtained with a compact formulation when time-dependent startup costs are included (Morales, 2013). In the tested instances, our formulation keeps the minimum uplift unlike the compact formulation that obtains greater or equal uplifts. This is because time-dependent startup costs are not included in the convex hull of the unit feasible operations. On the other hand, as the primal-dual algorithm allows solving the LP problem with a preset optimality tolerance, we analyze the effect of sub-optimal prices on two types of uplifts studied in the literature: make-whole payment and lost opportunity cost (Schiro, 2015). The first consist of covering losses for those units whose revenues are not enough to cover their costs. The second payment covers the difference between the maximum profit that the unit can reach at the market price, and the profit obtained by following the ISO's dispatch at the same price. The analysis shows that the first type of payments is more stable to price variation. The second type of payments can increase considerably when using prices obtained with a more relaxed optimality criterion. Finally, the computational study shows that the algorithm performs faster than commercial solvers, being able to solve large scale instances. For example, cases of 1000 units for 24 hours can be solved in less than 30 seconds. Conclusions Our formulation obtain the minimum uplift even when new features of the unit are included, therefore it proves to be flexible. The solution approach used allows solving large-scale instances faster than commercial available solvers, achieving an average speedup of 2x compared to the CPLEX barrier solver. The optimality analysis reveals the importance of the convex hull that defines the operations of the units, because a slight price variation can have a considerable impact on the uplifts based on lost opportunity cost. While the make-whole payment is the one implemented in most markets, this effect should be considered since lost opportunity cost turns out to be a more representative measure of the equilibrium. References O'Neill, R. P., Sotkiewicz, P. M., Hobbs, B. F., Rothkopf, M. H., & Stewart Jr, W. R. (2005). Efficient
market-clearing prices in markets with nonconvexities. European journal of operational research, 164(1), 269-285.
Hogan, W. W., & Ring, B. J. (2003). On minimum-uplift pricing for electricity markets. Electricity Policy Group.
Zhang, B., Luh, P. B., Litvinov, E., Zheng, T., & Zhao, F. (2009, March). On reducing uplift payment in electricity markets. In Power Systems Conference and Exposition, 2009. PSCE'09. IEEE/PES (pp. 1-7). IEEE.
Liberopoulos, G., & Andrianesis, P. (2016). Critical review of pricing schemes in markets with non- convex costs. Operations Research, 64(1), 17-31.
Gribik, P. R., Hogan, W. W., & Pope, S. L. (2007). Market-clearing electricity prices and energy uplift. Cambridge, MA.

150
Session 18 - Technology development - Grid management
Wang, G., Shanbhag, U. V., Zheng, T., Litvinov, E., & Meyn, S. (2013). An extreme-point subdifferential
method for convex hull pricing in energy and reserve markets—Part I: Algorithm structure. IEEE Transactions on Power Systems, 28(3), 2111-2120.
Hua, B., & Baldick, R. (2017). A convex primal formulation for convex hull pricing. IEEE Transactions on Power Systems, 32(5), 3814-3823.
Guan, X., Luh, P. B., Yan, H., & Amalfi, J. A. (1992). An optimization-based method for unit commitment. International Journal of Electrical Power & Energy Systems, 14(1), 9-17.
Bienstock, D., & Zuckerberg, M. (2009). A new LP algorithm for precedence constrained production scheduling. Optimization Online, 1-33.
Morales-España, G., Latorre, J. M., & Ramos, A. (2013). Tight and compact MILP formulation for the thermal unit commitment problem. IEEE Transactions on Power Systems, 28(4), 4897-4908.
Schiro, D. A., Zheng, T., Zhao, F., & Litvinov, E. (2016). Convex hull pricing in electricity markets: Formulation, analysis, and implementation challenges. IEEE Transactions on Power Systems, 31(5), 4068-4075.

151
Session 18 - Technology development - Grid management
Olvar Bergland, Alan Love REVEALING CONSUMPTION PATTERNS FROM METER READINGS: A STRUCTURAL DEEP MACHINE LEARNING APPROACH
Olvar Bergland, School of Economics and Business, Norwegian University of Life Sciences, N-1432 Ås, Norway
Alan Love, School of Economic Sciences, Washington State University, Pullman, WA 99164-6210, USA
Overview Demand response is viewed as an integral and crucial part of the future electricity system. Activating demand response depends in part on the contracts available to households and firms. Designing effective contracts require knowledge about the individual consumption patterns over time as well as the heterogeneity of consumption patterns. One possible source for learning about consumption patterns is smart meter readings. Smart meter readings represent a new detailed data source. One challenge in the analysis of high time resolution meter readings is the shear volume of the data. This paper applies machine learning methods to smart meter readings where the objective is to detect specific consumption patterns. Although there are many generic machine learning methods that can provide excellent consumption predictions, the focus on demand response requires additional understanding and details about consumption. A structural (econometric) modeling approach in combination with machine learning allows us to reveal and decode consumption patterns that may be relevant for assessing the extent of demand response and for the design of contracts. Methods We have available detailed meter data recording aggregate consumption in the housing unit for each five minute interval for a year. These records are matched with meteorology data from a nearby weather station. The consumption is modeled as a continuous non-negative real number, and is conditional upon the current state of household activities. As the household’s activities are changing over time so are the states and the relevant consumption function. The states are unobserved and may include states such as “heating”, “cooling”, “sleeping”, and “away”. The transition between states are modeled as a time-varying hidden Markov chain where the time-varying transition probabilities depends on temperature and time of day and year. The observed consumption is modeled as a switching regression model with state specific parameters for temperature and time of day and year. The resulting model is an Input-Output Hidden Markov Model with state transition probabilities modeled as multinominal logit models and output modeled as Tobit models. The joint estimation of the model parameters relies on a customized Baum-Welch version of the EM algorithm.

152
Session 18 - Technology development - Grid management
Results Consumption patterns at the individual unit level are heterogeneous. Our results from analyzing some 14 000 households show that for more than half the households the machine learning algorithm is capable of detecting discernible and specific consumption patterns. Our structural modeling approach allows us to draw specific conclusions about the factors influencing the observed consumption patterns. The presence of significant influence on certain state transition probabilities and consumption levels show that it is possible to identify, say, heating and cooling states. Conclusions The availability of meter data with high time resolution at the household level represents a new data source about consumption at the household level. We have developed a structural econometric model embedded in a hidden Markov chain. This model is capable of detecting specific consumption patterns, predict consumption with a high degree of precision, and reveals the underlying drivers for the consumption levels.

153
Session 18 - Technology development - Grid management
Joachim Geske, Richard Green, Iain Staffell ELECXIT: THE IMPACT OF BARRIERS TO ELECTRICITY TRADE AFTER BREXIT
Joachim Geske, Imperial College Business School, U.K. Richard Green, Imperial College Business School, U.K.
Iain Staffell, Centre for Environmental Policy, Imperial College London, U.K.
Overview The United Kingdom decided in June 2016 to withdraw from the European Union, in the process now known as Brexit. The consequences of this exit, currently scheduled for March 2019, are difficult to assess because future relations with the EU are still to be negotiated between the EU and the UK. The UK government hopes to negotiate arrangements somewhere between continued membership of the European Single Market and a free trade agreement for goods and services. The European Commission’s negotiating position is that it will not be possible to have sector-by-sector participation in the Single Market. This paper examines the longer-term (2030) consequences of the UK leaving the EU Single Market for electricity. Emphasis is placed on how Brexit may interact with national climate targets, the planned expansion of electricity interconnection and the integration of hydro-storage potential into the European energy system. While Brexit might result in tariff and non-tariff barriers to trade in goods and services, the starting point for electricity trading is different: It is unthinkable to bypass the EU (plus Norway and Iceland, both in the European Free Trade Association – EFTA) as the UK’s exclusive trading partner, since the construction of transmission lines to more distant countries would entail enormous costs, require long lead times and significant line losses. Electricity generation has been subject to national sovereignty, and a wide variety of national policies, so far. But due to the requirements for continuous market clearing with considerable variability of the load and renewable generation, matching supply and demand is becoming harder, making market integration particularly valuable. Northern Ireland, while part of the United Kingdom, shares a single electricity wholesale market with the Republic of Ireland. The UK government has committed itself to avoid a “hard border” between Northern Ireland and the Republic, and between Northern Ireland and the rest of the UK. At present, several possible consequences of market disintegration for the electricity markets are under discussion. While it seems unlikely that import tariffs will be imposed, interconnectors cut or projects under construction halted, it is reasonable to assume that market rules and planned interconnection projects will be called into question. In particular, it is possible that Britain could leave the system of market coupling painstakingly adopted over the last decade, reverting to separate arrangements to decide interconnector flows, as happened before market coupling was adopted. The European Commission's energy sector inquiry 2005/2006 - prior to the implementation of market coupling - provides clues to the functioning and costs of such a barrier to trade. Interconnector capacity was allocated before the wholesale markets had cleared and so “market participants … had to place auction bids for interconnector capacity based on expected wholesale market prices.”

154
Session 18 - Technology development - Grid management Anticipation errors due to a lack of market integration led to misallocations with a value of €64 million in 2004: the UK was importing power when its price was lower than that in France, or vice versa, and the interconnector was frequently under-used. We analyse these scenarios of reversed market integration with a multi-country trade model. The model will be calibrated to forecast load and generation patterns for 2030, considering the widespread roll-out of low-carbon generation infrastructure. The high share of renewables and their spatial distribution will make spatial arbitrage particularly attractive and will increase the opportunity costs of barriers to increased integration. Methods First, a microeconomic model of decoupled markets between UK and France in 2004 is described. Due to different market closing dates in the UK and France, an early commitment and the anticipation of market prices is required to determine interconnector capacity demand. Therefore, the demand on the spot markets is not completely common knowledge at the time of tendering for interconnector capacity. Anticipation errors must be considered by traders when determining the demand for interconnector capacity. The according uncertainty is added to the load as a zeromean, normally distributed disturbance. Its variance is a measure for the extent of the trade barrier. It can be shown that optimal trading under uncertainty equals perfect foresight trading. Electricity generation and trading after Brexit in 2030 can therefore be modeled by adapting the perfect foresight model DESSTINEE. DESSTINEE is a multi-country trade equilibrium model (Green and Staffell, 2014). It generates country-specific hourly load and renewable generation profiles from general scenarios and determines – also on an hourly basis – the equilibrium outputs and trade flows, for given thermal generation and interconnector capacities. Generation in each of the 9 model regions (for example, Germany is one region; another comprises France and the Benelux countries) follows a merit order stack. Inter-region flows are adjusted until adjoining regions have the same price (and marginal generation is shared between them in proportion to their capacity of that generation type) or until the interconnector capacity is fully used. To model the kind of trade barriers previously described, DESSTINEE was amended with an ex-post trade shock. The model is quantified with load data of the year 2010 and the variance of the disturbance term calibrated to fit the historic value of trade frictions between France and the UK described above: €64 million. While past work using the model has treated the British Isles as a single region, Ireland will be split from the UK so that the local impact of Brexit can be modelled. Results The standard deviation of the anticipation error was calibrated with DESSTINEE for the base year 2010 as 0.2 GW. We ran DESSTINEE for two levels of interconnector capacities between Britain and continental Europe (10 GW according to pre-Brexit expansion plans, and 5 GW on the assumption that some new build would be impeded) and both with and without price convergence (frictions in day-to-day trading based on that anticipation error) between the British Isles and EU-26. Preliminary simulations of the baseline scenario (‘Soft Brexit’) with 60 GW wind and 25 GW solar in the UK and a CO2 price of 93 €/tonne in 2030, 10 GW transmission capacity and without fully integrated markets result in high average electricity prices of 90 €/tonne in the UK and 97 €/tonne in France. The average price difference implies net exports from the UK to France. The focus of this work is not on the absolute predictions, however, but how they change with Brexit frictions – a “diff in diff” approach.

155
Session 18 - Technology development - Grid management If the interconnector is insetad only increased by 5 GW and the markets are decoupled (‘Hard Brexit’) there is an overall loss of welfare of €500 million. 60% of this stems from not building 5 GW of extra transmission capacity and 40% from market decoupling. The short-term frictions have almost no effect on average prices as UK’s electricity exports are frequently limited by the transmission capacity. In contrast electricity prices in the UK react to abandoning 5 GW of transmission capacity with a decline of €6/MWh, to the benefit of consumers, but the detriment of producers. A decline of prices of the exporting country is typical if trading in asymmetric markets is restricted. Conclusions We are not suggesting that abandoning the successful system of electricity market coupling is a likely outcome of Brexit, but wish to illustrate the costs of doing so. Preliminary results find that an abandoning of 5 GW planned interconnector capacities and market decoupling might cause a loss in welfare of €1 billion. Two-thirds of these losses are caused by the reduction in interconnector capacity and one-third by market decoupling. So either friction contributes significantly to these losses in a scenario of 2030, while the impact of capacities is higher. This is work in progress at the current time, and the benefits from greater security and avoided capacity investment will be calculated in more detail, together with winners and losers. Furthermore, we will verify the sensitivity of the results to a range of fuel and carbon prices (and possibly different renewables capacities) to represent both the status quo (UK Carbon Price Support vs EU ETS) and possible new policies and calculate total emissions and relate the ETS price to emissions within whatever area is covered by it in future. Reference Green, R.J. and I. Staffell (2014) A Green European Electricity Market: The role of cross-border trade ,
IFN Stockholm Conference on The Performance of Electricity markets, 12-13 June 2014, https://www.ifn.se/BinaryLoader.axd?OwnerID=24e4615a-916b-46e8-bc1f- 0557f1f34196&OwnerType=0&PropertyName=File1&FileName=2014+stockholm+Green+European+Electricity+ Market.pdf&Attachment=True

156
Session 19 - The transition to renewable & smart energies and the decarbonization project
Hanna-Liisa Kangas, Kimmo Ollikka, Kim Yukyeong SMART ENERGY TRANSITION – TECHNOLOGY CONVERGENCE OF RENEWABLE ENERGY AND ICT SECTORS
Hanna-Liisa Kangas, Finnish Environment Institute SYKE, Finland Kimmo Ollikka, VATT Institute for Economic reseach, Finland
Yukyeong Kim, Finnish Environment Institute SYKE and Lappeenranta University of Technology LUT, Finland
Overview As the share of weather dependent renewable electricity production such as solar and wind power increases, smart energy solutions are needed to enable the transition and balance the energy markets (Lund et al. 2012). The transition towards renewable and smart energy technologies is expected to create a $50.000 billion cumulative market in the next 20 years (IEA, 2014). Therefore, numerous countries and companies are looking for ways to increase their share and competiveness in those markets. Technological transition leads often to fusion or converging of technologies. Technology convergence is the blurring of boundaries between at least two areas of technology, and it increases the connectedness of the areas, which can be seen e.g. in patenting behavior (Curran and Leker, 2011). Technology convergence is a necessary step when developing new cutting edge technologies (Sung et al., 2010). Convergence is not only important in the society level, but also in firm level. Understanding convergence can help firms to form strategic alliances, acquire new technologies and identify business opportunities at early stages of transition. Thus, convergence can enhance the competitiveness of companies. Also, the companies that are not prepared for convergence may face big problems (Suh and Sohn, 2015). Zhang et al. (2015) define smart energy transition as “[a transition] toward a smart energy network of the future that is characterized by widespread deployment of clean energy technologies and intelligent energy management technologies”. Therefore, the definition of smart energy transition includes the idea of at least partly converging renewable energy and information and communications technology (ICT). Our aim is to study the convergence of renewable energy and ICT sectors to analyze the implications of the smart energy transition on both sectors. Our research questions are: (1) Are there any signs of convergence between the renewable energy and ICT sectors?, and (2) Are there differences in the convergence with ICT between the studied technologies, i.e. solar PV and wind power? Methods According to Preschitschek et al. (2013), patent data analysis is the easiest way to monitor convergence in the technology level. Patents entail information that is useful for convergence studies, e.g. technology fields, applicants and citations (Curran and Leker, 2011). Patents are usually first steps towards new technologies, so increasing cross- sectoral patenting indicates technology convergence. The main methods used to study technology convergence with patent data are co-classification and co-citation analysis or a combination of these two (Choi et al., 2015). All patents are arranged to different technology classes by examiners of patent offices according to their technical features. Same patent can be classified to multiple technology fields, i.e. co-classified.

157
Session 19 - The transition to renewable & smart energies and the decarbonization project Co-classification is the most often used and commonly accepted method of measuring technology convergence (Choi et al., 2015). If co- classification of formerly separate technology fields increases, it can be an indicator of technology convergence (Preschitschek et al., 2013). We use the Worldwide Patent Statistical Database (PATSTAT) for our data collection. We use patent data from 1970 to 2011, where the invention year is based on ‘earliest filing year’ in PATSTAT database. Our unit of observation is invention. One invention may have many patent applications in different patent offices. Our selected renewable energy technologies are solar PV and wind power. We use co-classification as an indicator for convergence. The co-classified inventions are classified as both under ICT and RES technologies. To understand the development of convergence we analyze the co-classification shares yearly using descriptive data. In addition, we run regressions by which we try to highlight the technological development under the convergence of renewable and ICT technologies. Results Digitalisation and new ICT solutions are changing the whole society and according to our results, this transition can also been seen in the studied renewable energy technologies. At the same time, the rapid development of the renewable energy inventions is also increasingly impacting the ICT sector. We found difference between the wind power and the solar PV technologies: in the case of wind power the development from virtually no ICT solutions to partial convergence with the ICT sector is straightforward and clearly seen in our results. However, in the case of solar PV, the development in the solar panels’ materials technology was even faster than the development of the solar PV ICT solutions. Therefore, even though the ICT sector is important in the solar PV sector and the absolute numbers of solar PV ICT inventions are growing, the convergence development is not as straightforward as with wind power. Conclusions According to our results the renewable energy and ICT sectors are becoming increasingly interlinked, which is important information, since convergence is necessary for technology transitions (Sung et al., 2010). This poses on the one hand challenges for the RES companies to follow and predict the ICT development, and also opportunities for new innovations and collaborations with the ICT companies. On the other hand, the ICT companies should also follow the renewable energy development, and develop technologies and services for the energy sector. As has been noted in the convergence literature, the companies following and anticipating the technology convergence trends and acting accordingly have competitive advantage on the companies lacking behind (e.g. Suh and Sohn 2015, Curran and Leker, 2011). This conclusion can be also expanded to society and policy level: focusing on only a narrow field when planning innovation policy instruments can slow down convergence, and this in turn can have an impact on the country’s competitiveness (Choi et al., 2015). The years studied in this paper represent most likely the very beginning of the energy transition towards cleaner energy production, and we know from the statistics that the installations of wind and solar power have continued to increase rapidly also after 2011 (IRENA 2018).

158
Session 19 - The transition to renewable & smart energies and the decarbonization project Since the production of wind power and solar PV is fluctuating and weather dependent, their increasing shares in electricity production pose growing need for smart ICT solutions. Therefore, it is very possible that the years studied in this paper describe also only the beginning of the smart energy transition. References Choi, J.Y., Jeong, S., Kim, K. 2015. A Study on Diffusion Pattern of Technology Convergence: Patent
Analysis for Korea. Sustainability 7: 11546-11569. Curran and Leker, 2011 IEA, 2014. World Energy Investment Outlook. https://www.iea.org/publications/freepublications/publication/weo-2014-special-report---investment.html.
IRENA, 2018. Renewable capacity highlights, March 2018. International Renewable Energy Agency. https://www.irena.org/- /media/Files/IRENA/Agency/Publication/2018/Mar/RE_capacity_highlights_2018.pdf?la=en&hash=21795787DA9 BB41A32D2FF3A9C0702C43857B39C
Lund, H., Andersen, A., N., Østergaard, P.A., Mathiesen, B.V., Connolly, D. 2012. From electricity smart grids to smart energy systems - A market operation based approach and understanding. Energy 42: 96-102.
Preschitschek, N., Niemann, H., Leker, J., Moehrle, M.G. 2013. Anticipating industry convergence: semantic analyses vs IPC co-classification analyses of patents. Foresight 15(6): 446-464.
Suh, J., Sohn, S.Y. 2015. Analyzing technological convergence trends in a business ecosystem. Industrial Management & Data Systems. 115(4): 718-739.Sung et al., 2010
Sung, K., Kim, T., Kong, H.K. 2010. Microscopic approach to evaluating technological convergence using patent citation analysis in Kim, T.-h., Ma, J., Fang, W.c., Park, B., Kang, B.-H., Ślęzak, D. (Eds), U-and E-Service, Science and Technology, Springer, Berlin Heidelberg, pp. 188-194.
Zhang, X., Chan, S.H., Ho, H.L., Tan, S.-C., Li, M., Li, G., Li, J., Feng, Z. 2015. Towards a smart energy network: The roles of fuel/electrolysis cells and technological perspectives. International Journal of Hydrogen Energy 40(21): 6866–6919.

159
Session 19 - The transition to renewable & smart energies and the decarbonization project
Carla Henriques, Patrícia Pereira da Silva, Nuno Figueiredo A PROPOSAL FOR ASSESSING WIND POWER SYSTEMS IN EUROPE
Carla Henriques: Polytechnic Institute of Coimbra - Coimbra Business School|ISCAC, Portugal and INESC Coimbra, Quinta Agrícola – Bencanta, 3040-316 Coimbra, Portugal,
Patrícia Pereira da Silva: University of Coimbra, Faculty of Economics, Portugal and CeBER Dias da Silva 165, 3004-512 Coimbra, Portugal,
Nuno Figueiredo: INESC Coimbra, Portugal, Pólo II, R. Sílvio Lima, 3030-290 Coimbra, Portugal
Overview The efficiency performance of electric utilities has been a central topic of research. In this context, wind power (WP) systems are currently prospering in the EU, being responsible for the generation of 336 TWh in 2017, corresponding to 11.6% of the EU’s electricity demand. Because of its specific characteristics, the efficiency performance of WP generation requires special attention. This paper aims at suggesting the use of a non-radial non-oriented DEA model to obtain the efficiency assessment of WP systems in 17 EU countries. The novelty of this work is threefold: it addresses the efficiency measurement of WP systems in EU countries; it selects inputs and outputs through a non-parametric panel model and considers both energy and non-energy inputs and outputs; it performs a returns to scale (RTS) assessment of WP systems. Method One of DEA’s drawbacks is that it does not provide a means to select the inputs and outputs that should be considered for the assessment of each DMU. However, the efficiency score attained for each DMU is highly dependent on this selection procedure (Nataraja and Johnson, 2011). In this case, if the number of inputs and outputs is considerably big, the dimensionality of the production space will increase and proportionally the discriminatory power of DEA will decrease (Subramanyam, 2016). Hence, one of the greatest challenges in a DEA model formulation is the identification of the truly significant input and output variables. Although the available literature on the selection of these particular inputs and outputs is not prolific, there are several approaches that can be used to deal with this particular problem (Nataraja and Johnson, 2011). In our case, the inputs and outputs considered were evaluated through a non-parametric panel model. This model does not require parametric assumptions since the information held in the data allows for the model estimation through kernel methods. The use of non-parametric models is a sound approach when there are reasons to question parametric assumptions (Li and Racine, 2007). We treated the turnover of every DMU as a dependent variable, and the number of employees, the power capacity and power generation as independent variables. The use of non-parametric panel models can help us find which items have an impact on turnover, and classify inputs and outputs easily according to the type of influence of each item on the DMU’s turnover. Therefore, the proposed non-parametric panel model was of the form:
, , , , , , (8) where i and j are, respectively, the country and year. The application of the non-parametric panel model takes into account the effects as explanatory factor variables, resulting in the following estimation:
, , , , (9)

160
Session 19 - The transition to renewable & smart energies and the decarbonization project Results from the non-parametric panel model demonstrate significance of all explanatory variables, as shown in Table 1.
Table 1. Non-parametric panel model estimation results
Regression Data: 136 training points, in 5 variable(s) Continuous Kernel Type: Second-Order Gaussian No. Continuous Explanatory Vars.: 3 Unordered Categorical Kernel Type: Li and Racine (normalized) No. Unordered Categorical Explanatory Vars.: 1 Ordered Categorical Kernel Type: Li and Racine No. Ordered Categorical Explanatory Vars.: 1
employment generation capacity date Country Bandwidth(s): 3517.796 911.9658 5989926337 0.163379 0.9999996 Kernel Regression Estimator: Local-Linear Bandwidth Type: Fixed Residual standard error: 264.3653 R-squared: 0.9926682
Bootstrap individual significance tests employment generation capacity date country < 2.22e-16 *** < 2.22e-16 < 2.22e-16 *** < 2.22e-16 *** < 2.22e-16 ***
This led to the choice of both energy and non-energy inputs in the analysis, i.e. the total WP generation capacity (in megawatts: MW) and the number of employees (in number of persons), respectively. Only desirable (good) outputs were accounted for. In the case of energy outputs, the net WP electricity power generation (in thousand tonnes of oil equivalent: TOE), while for the non-energy outputs the turnover (in million Euros: M€) was used. Since radial models disregard slacks and the input (output)-oriented models only address the input (output) efficiency while output (input) is considered to be less relevant in efficiency assessment, we have considered the non-radial and non-oriented models, since they can provide a comprehensive efficiency assessment. In particular, we have used the slack-based measure (SBM) model proposed by Tone (2001). Results All inputs and outputs have been considered as separable and controllable. Hence, the study involved applying the SBM and Super-SBM models to the 17 DMUs under evaluation. The countries which are always classified as efficient in the time horizon herein considered (2009-2016) are Denmark, Portugal, Germany and Spain. WP systems in Denmark always show constant returns to scale (CRS). In addition, due to propitiate weather conditions of Danish wind farm locations, but also because of low variable and fixed costs, Danish operators have low O&M costs when contrasted with other countries’ operators (Ziegler et al., 2018). These facts might help explain the good efficiency scores of Denmark throughout the time frame of this study. In the case of Portugal (also showing CRS except for 2011), we believe that the good efficiency scores obtained are mainly related with the adoption of a feed-in tari� (FiT) mechanism in this country. Moreover, Portuguese WP operators are mainly owned by multinational companies and major economic groups (Peña, Azevedo and Ferreira, 2017).

161
Session 19 - The transition to renewable & smart energies and the decarbonization project On the other hand, in Germany, the WP systems work with decreasing returns to scale (DRS) within the period of analysis, being always efficient. Furthermore, in Germany, wind farms are usually controlled by small operators with limited assets. One of the reasons for the DRS faced by WP systems in the major EU players of WP systems, i.e. in Germany, Spain and the UK (in 2009, 2012, 2013 and 2016), might be explained by the significant installed capacity of old wind farms connected to the grid in these countries which were expected to face the end of their lifetime in 2016 (Ziegler et al., 2018). Moreover, although in Germany the annual WP installed capacity is still growing, in Denmark, Spain and the UK it is reducing (Wind Europe, 2016). This decrease is mainly influenced by a shift in political motivations (particularly in Spain), shortage of sites for wind farm location, specifically in Denmark, and problems with public approval as for instance in the UK (Ziegler et al., 2018). But in spite all the occurrences, Spain’s WP systems have been considered as efficient with the variable returns to scale model (VRS) model formulations in the entire period of analysis (always facing DRS). Probably, the fact that the majority of wind turbines are mainly owned by large operators might have a significant impact on these results. It also interesting to see that except from the UK which has a quota system, the countries which are more often classified as WP efficient adopted FiT at an early stage of WP deployment. After crosschecking our results with the regulatory framework of WP systems in Europe, it was also possible to conclude that the continuous change and adaption of the support schemes in some countries might have a prevalent influence on the efficiency scores obtained for each country, in particular, in those that had strong budgetary constraints (either due to the financial crises or to bad designed support schemes), like Romania, Italy and Greece. The record countries in terms of the number of times classified as non-efficient are France, Greece and Italy. In the case of France, the non-efficiency scores of its WP systems are mainly related the large increase of WP installed capacity per year from 2009 to 2016, eventually not fully reflected on the WP generation of those years. In general, it can be concluded that 46% of the countries have efficient WP systems in this period of analysis. Nevertheless, with the regulatory framework of some countries still undergoing a downturn, it might be expected that in the future the WP efficiency statuses of some of these countries might cease to exist. Conclusions This paper provided an assessment of WP systems in 17 EU countries by means of the non-radial non-oriented SBM and Super-SBM DEA models. Both models were run under the variable returns to scale (VRS) specification. Furthermore, energy and non-energy inputs and outputs were used in this analysis, which proved to be significant for the evaluation performed within the period that goes from 2009 to 2016 according to the non-parametric panel model herein used. The analysis conducted shows that although no clear pattern regarding the RTS can be obtained within the time frame under scrutiny, the WP sector is mainly characterized by increasing returns to scale (IRS) and CRS. Denmark, Portugal, Germany and Spain are the leading countries in terms of efficiency status nomination. Curiously, the major EU WP players which face DRS, i.e. Germany, Spain, and the UK (in 2009, 2012, 2013 and 2016)), had a significant installed capacity of old wind farms connected to the grid ending their lifetime in 2016 (Ziegler et al., 2018). Another interesting issue refers to the fact that, except from the UK, which has a quota system, efficient WP systems are more often obtained in countries which have adopted FiT at an early stage of WP implementation.

162
Session 19 - The transition to renewable & smart energies and the decarbonization project Finally, it is worth mentioning that future work is currently under way in order to encompass other type of inputs and outputs in WP assessment, namely the average annual wind speed (as a non-controllable input); the average rated power by country (as a controllable input) and the bad outputs regarding the manufacturing stage of the additional installed capacity in each year by means of the IO approach. References Li, Q. and Racine, J. S. (2007) Nonparametric econometrics: theory and practice. Princeton University
Press. Nataraja, N. R. and Johnson, A. L. (2011) ‘Guidelines for using variable selection techniques in data
envelopment analysis’, European Journal of Operational Research, 215(3), pp. 662–669. doi: 10.1016/j.ejor.2011.06.045.
Peña, I., Azevedo, I. and Marcelino Ferreira, L. A. F. (2017) ‘Lessons from wind policy in Portugal’, Energy Policy, 103, pp. 193– 202. doi: 10.1016/j.enpol.2016.11.033.
T Subramanyam (2016) ‘Selection of Input-Output Variables in Data Envelopment Analysis - Indian Commercial Banks’, International Journal of Computer and Mathematical Sciences, 5(6), pp. 51–57.
Tone, K. (2001) ‘On Returns to Scale under Weight Restrictions in Data Envelopment Analysis’, Journal of Productivity Analysis, 16(1), pp. 31–47. doi: 10.1023/A:1011147118637.
Wind Europe (2016) ‘Wind in power 2016 European Statistics’, Wind Europe, (February), pp. 1–24. doi: 10.1007/s10854-007-9177- 9.
Wind Europe (2018) ‘Wind in power 2017’, (February), pp. 1–12. Ziegler, L. et al. (2018) ‘Lifetime extension of onshore wind turbines: A review covering Germany, Spain,
Denmark, and the UK’, Renewable and Sustainable Energy Reviews. Elsevier Ltd, 82(January 2017), pp. 1261–1271. doi: 10.1016/j.rser.2017.09.100

163
Session 19 - The transition to renewable & smart energies and the decarbonization project
Adil Gaoui, Brahim Lekhlif THE IMPACT OF USING GREEN HYDROGEN ON AFRICAN COUNTRIES’ ENERGY INDEPENDENCE
Adil Gaoui, Hassania School of Public Works-km7-BP 8108- Oasis-Casablanc, Morocco, Brahim Lekhlif, Hassania School of Public Works-km7-BP 8108- Oasis-Casablanca, Morocco
Overview The energy transition is an historical occasion for African countries to explore the renewables as a green energy source to allow energy independence and a better local integration. Energy storage is a primary challenge facing the energy transition. Hydrogen is a key strategic solution for clean energy storage from renewables and hydrogen green production economy offers a local industry with many possible sources: sun, wind, biomass and hydraulic. This paper presents the positive impact of green hydrogen sector to promote local integration and energy independence for the African continent. This study summarizes the green technologies and processes that exist to produce hydrogen and the opportunities for African countries to use this resource taking advantage of the continent's assets in terms of sun exposure, wind, and mountain heights as well as hydraulic resources (sea coasts, rivers, dams, …etc.) The other good news for African countries is that natural hydrogen exists in the Earth’s layers. Scientists’ researchers discovered recently in Mali a large accumulation of natural hydrogen in the Bourakebougou region. The different analysis show that natural hydrogen is cheaper compared to the one issued from water electrolysis. All this arguments confirm the real potential for energy independence promoting more local integration in Africa. Methods Hydrogen production realized by water electrolysis using sun, wind or a PV–wind combined and hybrid system enables the creation of jobs and the provision of a clean and sustainable energy source. A comparison of several agencies studies highlights the direct relationship between the establishment of a hydrogen economy and the creation of employment on one side and the economic independence on the other side. Results According to the French Environment and Energy Management Agency (ADEME), when you invest a million euros in the energy transition field, you can create about 15 jobs, whereas the same million invested in coal or nuclear is only six jobs. This confirms the role of hydrogen as a job-creating economy. The International Energy Agency (iea) announces (in its latest publication on World Energy Outlook 2018) that a much stronger push for electricity mainly for mobility, could lead to a 90% rise in power demand from 2018 to 2040. Renewables economy development is now a must and not a choice. The Paris Agreement’s signed at COP 21 in Paris, on 12 December 2015, requires each country to do the maximum efforts to maintain the temperature rise under two degrees Celsius in the years ahead.

164
Session 19 - The transition to renewable & smart energies and the decarbonization project Conclusions All the studies and analysis confirm the energy independence effectiveness character in using hydrogen manufactured by electrolysis and/or natural hydrogen. The energy transition from fossil fuels to renewables could not be executed without courageous Governments decisions. African Governments should be fully involved in an energy transition and thus promote their energy independence by using technological innovations. References Prinzhofer, A., Tahara Cissé, C. S., & Diallo, A. B. (2018). Discovery of a large accumulation of natural
hydrogen in Bourakebougou (Mali). International Journal of Hydrogen Energy. Dincer, I., & Acar, C. (2015). Review and evaluation of hydrogen production methods for better
sustainability. International Journal of Hydrogen Energy, 40(34), 11094–11111. Bartels, J. R., Pate, M. B., & Olson, N. K. (2010). An economic survey of hydrogen production from
conventional and alternative energy sources. International Journal of Hydrogen Energy, 35(16), 8371–8384.
Nema, P., Nema, R. K., & Rangnekar, S. (2009). A current and future state of art development of hybrid energy system using wind and PV-solar: A review. Renewable and Sustainable Energy Reviews, 13(8), 2096–2103.
Sopian, K., Ibrahim, M. Z., Wan Daud, W. R., Othman, M. Y., Yatim, B., & Amin, N. (2009). Performance of a PV–wind hybrid system for hydrogen production. Renewable Energy, 34(8), 1973–1978.
Midilli, A., Ay, M., Dincer, I., & Rosen, M. A. (2005). On hydrogen and hydrogen energy strategies. Renewable and Sustainable Energy Reviews, 9(3), 255–271.

165
Session 20 - From Consumers to nonsumers: How new behind-the-meter service options are disrupting utility business models
Nicola Sorrentino, Daniele Menniti, Anna Pinnarelli POWER CLOUD: A FRAMEWORK TO IMPLEMENT A “NONSUMER” COMMUNITY
Nicola Sorrentino, Energetic, Mechanical and Management Engineering Department, University of Calabria, Italy,
Daniele Menniti, Energetic, Mechanical and Management Engineering Department, University of Calabria, Italy,
Anna Pinnarelli, Energetic, Mechanical and Management Engineering Department, University of Calabria Italy
Overview The cities need energy to develop, grow and innovate. The goal is to guarantee them a sustainable and reliable energy supply. Reducing greenhouse gas emissions, limiting the effects of climate change and the environmental, social and economic costs of energy production are at the center of the future city development, for which technological and infrastructural innovation is only the starting point. The goal is to ensure the energy efficiency of cities, implementing new political strategies on sustainability, economic development and social welfare. The Energy Cloud, as defined in [1] represents all the technical, commercial, environmental and regulatory changes necessary for the transition from a conventional model of energy supply to a clean energy distribution network and so to a sustainable system reducing pollution and dependence on petroleum products. A system that gathers all the innovations of smart technologies, much more complex than the traditional one but also much more efficient for the control of the energy supplied and consumed. The Energy cloud is an emerging platform that may offer a solution to facilitate the integration of distributed renewable energy systems with new environmental-friendly and smart enabling technologies, such as micro and nanogrids, smart meters, blockchain and IoT technologies, storage facilities. They offer technical and economic conditions to support local energy sources and activate local demand-response. The Energy Cloud platforms will therefore require real "orchestra conductors" able to connect end customers to a wide range of products and services in the energy field, where a future convergence among different platforms in an advanced Energy Cloud can not be excluded. In the energy cloud framework, new business models, named as Integrated community energy systems (ICEs), ariseThe ICESs represent locally and collectively organized energy systems and combines the concept of sustainable energy communities, community energy systems, micro-grids community, and peer-to-peer energy. ICESs are capable of effectively integrating energy systems through a variety of local generation of heat and electricity, flexible demand as well as energy storage. Cross-sector integration at the local level helps in the efficient use of available energy. Integrating smart-grid technologies and demand side management facilitate an increase in reliability and efficiency of such local energy systems The realization of all these aspects is not easy: on one hand, a massive use of ICT is required in order to monitor each instant the physical state of the entire electrical system, collecting and exchanging data between the various stakeholders and then managing and checking for any abnormal situations.

166
Session 20 - From Consumers to nonsumers: How new behind-the-meter service options are disrupting utility business models
On the other hand, the participation of all the players who act into the energy sector, from system operators, market operators, large and small producers to the consumers themselves, is necessary.
Methods An ICE, called Unical Energy Cloud, has been designed and implemented as first prototype at University of Calabria based on the Power Cloud concept [5]. Power Cloud consists of several types of users: consumers, consumers that are also producers (prosumer) and producers. It is supposed that an aggregator manages those users. It is a neutral no-profit entity, called in the following Community Energy Provider (CEP). It manages electricity exchanges intra Power Cloud and if necessary in the Electricity Market. The CEP is so the entity designated to interface the energy community with the electricity market and electrical system operators to guarantee the correct functionalities of the whole community. A Power Cloud management model (PCm) is then proposed and implemented assuming as goal of maximizing self-consumption quota in terms of aggregation and maximizing the profit/saving of Power Cloud members with the support of a hardware and software architecture for its implementation. To implement the proposed PCm, an opportune hardware/software platform has to be developed. The ICT architecture chosen is IoT based. It is designed on three levels: cloud level, local level and visualization level. At the cloud level, we have two entities: (i) the CEP and (ii) the CSP. The former is responsible of managing the energy exchanges among Power Cloud users and in the Electricity market; the second one, which can be managed by a single data center or, in case of very large Power Cloud, by a set of interconnected data centres, provides the forecast services and definition of tariffs service.
Results The Unical Energy cloud, realised at the University of Calabria, Italy, is formally an energetic community; it is composed of many buildings located in the University campus; each building is a consumers or a prosumer in case of PV plant installed on the building rooftop; moreover, several RES plants are connected to the same distribution low voltage network that supplies the buildings. The performance of the platform will be measured in terms of increasing quota of RES shared among the prosumers belonging to the community respect to a vision of an isolated selfconsumption criterion.
Conclusions Energy communities are solution to integrate more renewables in energy grid and to allow an active role of the users in the energy market. Actually only few example of energy communities are implemented and tested in realistic scenario. The aim of the talk is to illustrate preliminary results of a specific Energy Community named Power Cloud implemented at University of Calabria Campus constituting the Unical Energy Cloud.
References
[1] White paper “The energy cloud - emerging opportunities on the decentralized grid” - Navigant
Research, 1.303.997.7609 navigantresearch.com

167
Session 20 - From Consumers to nonsumers: How new behind-the-meter service options are disrupting utility business models
[2] Kristina Orehounig, Ralph Evins, Viktor Dorer “Integration of decentralized energy systems in
neighbourhoods using the energy hub approach” Applied Energy - Volume 154, 15 September 2015, Pages 277-289
[3] A. Pasban-Gajan, M. Moeini-Aghtaie, Z. Parvini and M. Fotuhi-Firuzabad, "Optimal scheduling of renewable-based energy hubs considering time-of-use pricing scheme," 2017 Smart Grid Conference (SGC), Tehran, 2017, pp. 1-6. doi: 10.1109/SGC.2017.8308871
[4] Binod Prasad Koirala, Elta Koliou, Jonas Friege, Rudi A. Hakvoort, Paulien M. Herder, “Energetic communities for community energy: A review of key issues and trends shaping integrated community energy systems”, Renewable and Sustainable Energy Reviews, Volume 56, April 2016, Pages 722-744.
[5] G. Belli; G. Brusco; A. Burgio; M. Motta; D. Menniti; A. Pinnarelli; N. Sorrentino "An energy management model for energetic communities of Smart Homes: The Power Cloud" 2017 IEEE 14th International Conference on Networking, Sensing and Control (ICNSC), Calabria, 2017, pp. 158-162.
[6] G. Brusco, A. Burgio, L. Mendicino, D. Menniti, M. Motta, A. Pinnarelli, N. Sorrentino, "A compact nanogrid with a behavior-tree control for islanded applications and remote areas," 2018 IEEE 15th International Conference on Networking, Sensing and Control (ICNSC), Zhuhai, 2018, pp. 1-6.

168
Session 20 - From Consumers to nonsumers: How new behind-the-meter service options are disrupting utility business models
Nikolas Kampelis, Elisavet Tsekeri, Dionysia Kolokotsa, Kostas Kalaitzakis, Daniela Isidori, Cristina Cristalli DAY-AHEAD DEMAND MANAGEMENT AT MICROGRID LEVEL USING ARTIFICIAL NEURAL NETWORK PREDICTIONS AND GENETIC ALGORITHM OPTIMISATION Nikos Kampelis, Energy Management in the Built Environment Research Lab. Environmental Engineering
School . Technical University of Crete. Kounoupidiana. GR 73100 Chania Elisavet Tsekeri, Energy Management in the Built Environment Research Lab. Environmental
Engineering School . Technical University of Crete. Kounoupidiana. GR 73100 Chania Dionysia Kolokotsa, Energy Management in the Built Environment Research Lab. Environmental
Engineering School . Technical University of Crete. Kounoupidiana. GR 73100 Chania. Kostas Kalaitzakis, Electric Circuits and Renewable Energy Sources Laboratory.
Technical University of Crete. Daniela Isidori, cResearch for Innovation. AEA srl. via Fiume 16 60030. Angeli di Rosora (AN)
Cristina Cristalli, cResearch for Innovation. AEA srl. via Fiume 16 60030. Angeli di Rosora (AN) Overview Day-ahead management of loads and resources in a microgrid can be effectively applied to minimize energy costs and optimise Demand Response (DR) performance. In the microgrid under investigation, hourly day-ahead net loads are predicted based on Artificial Neural Network modelling. Optimisation based on a dynamic pricing scheme is implemented based on a Genetic Algorithm approach incorporating the criteria of energy cost and net load shifting. Results illustrate that the proposed approach provides a valuable research tool in modelling and understanding the underlying issues from a prosumers’ perspective. Limitations of this approach and future dimensions are discussed. Method The methodology is comprised by the steps of data collection, load and generation day-ahead forecasting using ANN modelling and GA based optimisation. A full year’s dataset is explored to analyse variability of loads and renewable energy generation with respect to prediction accuracy in different seasons. The developed approach is implemented at a microgrid comprised by several types industrial operations, renewable energy sources including PV (fixed, tracking), micro-hydro generation, storage (thermal/electrical) and electric vehicles. For the 24h ahead prediction a Lavemberg-Marquardt algorithm was deployed in a Nonlinear Autoregressive ANN structure with Exogenous Input (NARX). Electric consumption power, the day of week, the time and the external temperature are used as inputs, while the electrical power 24h ahead is used as target. A dynamic pricing scheme is constructed by taking into account day ahead market and existing energy pricing scheme cost components. The developed Genetic Algorithm approach is based on an objective function composed of the weighted criteria of daily cost of energy and load shifting. Results ANN power predictions accuracy is assessed to provide the basis for a discussion on the applicability of this approach in connection to dynamic pricing.

169
Session 20 - From Consumers to nonsumers: How new behind-the-meter service options are disrupting utility business models
Predictions with Pearson’s correlation coefficients in the range of 0.95-0.99 for 15-minute time steps and 0.93-0.99 for 1h timestep are assessed. The performance of the developed GA based approach, is evaluated based on constraints related to the DR capabilities for the microgrid case study under investigation. Furthermore, design considerations for a dynamic pricing scheme in leveraging DR engagement are touched upon. Conclusions Electric short term forecasting based on ANN modelling is a valuable tool in complementing demand response strategies for day ahead management at microgrid level. ANN NARX modelling provides important capabilities in predicting hourly day-ahead electrical loads at a microgrid interconnecting several industrial facilities together with various renewable energy and storage technologies. Application of GA multi-objective optimisation, of ANN short term electric forecasted demand profiles, was successfully exploited for generating and evaluating alternative day-ahead load shifting effective solutions, based on dynamic hourly pricing profiles. Future steps in this direction involve a) the development of a GA optimisation scheme modelling actual loads (baseload, fixed, flexible) and storage systems and b) investigation under a variety of DR programs. References Bullich-Massagué E. Díaz-González F. Aragüés-Peñalba M. Girbau-Llistuella F. Olivella-Rosell P.
Sumper A. Microgrid clustering architectures. Appl Energy, 2018; 212 (December 2017):340–61. Available from: https://doi.org/10.1016/j.apenergy.2017.12.048
Koliou E. Demand Response Policies for the Implementation of smart grids. Delft University of Technology; 2016.
Mavrigiannaki A. Kampelis N. Kolokotsa D. Marchegiani D. Standardi L. Isidori D. et al. Development and testing of a micro-grid excess power production forecasting algorithms. In: Energy Procedia. 2017.

170
Session 20 - From Consumers to nonsumers: How new behind-the-meter service options are disrupting utility business models
Dierk Bauknecht, Joß Bracker, Franziska Flachsbarth, Christoph Heinemann, Dominik Seebach, Moritz Vogel CUSTOMER STRATIFICATION AND DIFFERENT CONCEPTS OF DECENTRALIZATION
Dierk Bauknecht, Öko-Institut, Germany, Joß Bracker, Öko-Institut, Germany,
Franziska Flachsbarth, Öko-Institut, Germany, Christoph Heinemann, Öko-Institut, Germany,
Dominik Seebach, Öko-Institut, Germany, Moritz Vogel, Öko-Institut, Germany
Overview This presentation starts off with the argument that customer stratification is strongly related to a decentralization of the power system. Decentralization has a range of different meanings, each with specific consequences for the role of consumers. Looking at the German case, the authors present different concepts of decentralization and what they imply, namely regional energy marketing and peer-to-peer trading, regional flexibility markets for network management, the “cell” concept as well as a demand-oriented distribution of renewables. Methods The paper structures the debate on decentralization and customer stratification. It is based on the typology put forward by Funcke and Bauknecht (2016). It disentangles the multi-faceted debate on decentralization and examines how this relates to new consumer roles. The focus of this chapter is on the controllability dimension, i.e. the coordination between generation and demand. The paper shows how the various concepts challenge the centralized market paradigm, i.e. a centralized market and a “copper plate” network that enables all market transactions and where consumers are located at the end of the supply chain. The presentation focuses on how these concepts can contribute to “making the system work”, rather than new business models. Results The following table summarizes the various dimensions of decentralization and their link to customer stratification
Dimension of decentralization Link to customer stratification level
Regional electricity marketing and peer-to-peer trading
Prosumers and prosumagers trade with each other via peer-to-peer trading Prosumer model can be extended to residential blocks: Landlord-to-tenant electricity supply Consumers: Even consumers without self-generation or storage may decide to buy specific products, such as green electricity or regional products and thus become active market players.
Using regional flexibility options for network management
Prosumager may not just use their flexibility (storage and DSM) to optimize their self-consumption, but also offer their flexibility to the market. These include new markets such as a TSO/DSO flexibility platform.
The cell concept as a new key structure of electricity systems
Consumer, producers, prosumer, prosumager could be bundled in regional markets. This would extend the prosumager model to regions.Compulsory participation in cells could limit the choice of consumers on the market.
Regional distribution of renewables
From a system perspective, the prosumer model implies a decentralization of renewables also in terms of a geographical distribution close to consumers.

171
Session 20 - From Consumers to nonsumers: How new behind-the-meter service options are disrupting utility business models
Conclusions Using regional flexibility for network management challenges the copper plate paradigm and can lead to new regional markets and can create new opportunities for flexibility providers including prosumagers. This complements the centralized market. Regional energy marketing and peer-to-peer trading could transform the power market in a more fundamental and bottom-up way. The questions remain whether there is a significantly higher willingness-to-pay for specific, e.g. regional products and to what extent different regional and P2P markets will converge into more centralized markets. Finally, the cell concept can only be implemented based on a top-down restructuring of the power market, as the cells would have to be defined centrally. This would lead to a completely different power market, where the link between decentraliszed and the central markets would still need to be defined. References Funcke, S., Bauknecht, D., 2016. Typology of centralised and decentralised visions for electricity
infrastructure. Utilities Policy 40, 67–74. 10.1016/j.jup.2016.03.005.

172
Session 20 - From Consumers to nonsumers: How new behind-the-meter service options are disrupting utility business models
Tim Schittekatte, Leonardo Meeus LIMITS OF TRADITIONAL DISTRIBUTION NETWORK TARIFF DESIGNS AND OPTIONS TO MOVE BEYOND
Tim Schittekatte, Florence School of Regulation/ Université Paris-Sud XI, Leonardo Meeus, Vlerick Business School/ Florence School of Regulation
Overview With more consumers installing solar PV panels, it makes sense to abandon the historical practice of volumetric distribution network tariffs with net-metering. However, regulators face many practical difficulties when redesigning the distribution network tariff design. Typically, there is a trade-off between cost-reflectiveness and fairness. We illustrate the cost-reflectiveness versus fairness trade-off and we find that some cost-reflectiveness can be sacrificed to limit the distributional impact resulting from tariff redesign. However, this works only up to a certain point without compromising grid cost recovery. If grid costs are mainly sunk, and cost-reflective charges are hard to implement, then smaller passive consumers are always worse off –tools other than ‘standard tariff options’ are needed to keep distributional impacts under control while limiting distortions. Methods We develop a game-theoretical model in which the regulator can decide about the distribution network tariff (volumetric, capacity and/or fixed charges) while anticipating the reaction of the active consumers to the tariff design. The regulator has to respect the condition that all grid costs need to be recovered from the network tariffs. The objectives of the regulator and the active consumers are different. The active consumers are self-interest pursuing, i.e. they can invest in solar PV and batteries and will do so if it results in lowering their private costs to serve their electricity needs. The objective of the regulator is instead to set the network tariff in a way that the actions of the active consumers not only benefit themselves but also the system as a whole. We run a numerical example with the model to elicit a discussion about the limits of traditional distribution network tariff design. Results For the numerical example the least-cost solution consists of a distribution tariff consisting of partly capacity-based and mostly fixed network charges. Because of difficulties with the implementation of cost-reflective capacity-based tariffs in practice, the share of this component is limited. However, a tariff with a high share of fixed charges results into negative distributional impacts for smaller passive consumers. Therefore, we test what would happen if we constrain the increase of network charges of the passive consumers when obtaining a new tariff proposal. By doing so, we can ‘sacrifice’ some cost-reflectiveness in order to lower fairness concerns. Two opposing forces are working in this case. On the one hand, by lowering the fixed network charges, the fairness issue decreases. But by resorting to other network tariff components which are needed to ensure full grid cost recovery (volumetric charges or an increase in capacity-based charges), the network tariff will be distortionary. This implies that active consumers can exploit opportunities that might be beneficial for themselves but which are not necessarily optimal from a system point of view.

173
Session 20 - From Consumers to nonsumers: How new behind-the-meter service options are disrupting utility business models
Moreover, the benefits active consumers obtain in this way come at the expense of passive consumers, thus aggravating the fairness issue once again. These two forces can be played out until the moment the model becomes unfeasible, i.e. there is no way to recover all grid costs while limiting the fairness concern. In this case, the network tariff which results in the least distributional impact and still respects full grid cost recovery is a three-part tariff, consisting of a mix of capacity-based charges, (lowered) fixed network charges and net-purchase volumetric charges. This result shows that even when the accumulated electricity volume flowing through the network does not drive the costs, it can make sense to recuperate part of the grid costs through (net purchased) volumetric charges to reduce fairness concerns. Conclusions We showed that if the regulator only has the three options available that we consider, it will be difficult to implement a fair tariff design. This is especially true if the proportion of sunk grid costs is high and cost-reflective charges are hard to implement. Other options to address fairness concerns are shortly discussed. Finally, it is added the implementation of cost-reflective and fair distribution network tariffs in practice might be even be more challenging due to interference of policy costs and taxes in the electricity bill. References Pollitt, M. G. 2018. “Electricity Network Charging in the Presence of Distributed Energy Resources:
Principles, Problems and Solutions.” Economics of Energy & Environmental Policy 7 (1): 89–104. Schittekatte, T., I. Momber, and L. Meeus. 2018. “Future-Proof Tariff Design: Recovering Sunk Grid
Costs in a World Where Consumers Are Pushing Back.” Energy Economics 70: 484–498.

174
Session 21 - Current Oil Market Dynamics
Vesa Soini, Sindre Lorentzen DETERMINANTS OF VOLATILITY SMILE: THE CASE OF CRUDE OIL OPTIONS
Vesa Soini, Department of Industrial Economics,University of Stavanger P.O. Box 8600 Forus, N-4036 Stavanger, Norway
Sindre Lorentzen, University of Stavanger
Overview One of the most puzzling pricing anomalies in option markets is the “Implied Volatility Smile” (IVS) which is inconsistent with the Black-Scholes option pricing model. We study the empirical relationship between implied volatility and moneyness of call options on WTI crude oil. Our first-stage regression estimates a second-order approximation of implied volatility as a function of moneyness, while our second-stage regression estimates correlations between the estimated parameters and our list of explanatory variables. The first-stage regressions show a positive coefficient on the quadratic term, confirming the existence of implied volatility smile for crude oil options. The main results are that the curvature of implied volatility as a function of moneyness is: (i) positively and significantly correlated with basis and hedging pressure of the underlying crude oil futures contract (ii) positively and significantly correlated with various measures of transaction costs on the options market. We explore various explanations for these results. The paper also contains a variety of robustness checks, mostly related to the assumed functional forms. Methods We use a two-stage regression analysis (see for example Pena et al. (1999)). However, we use a different set of explanatory variables and show that variables related to the underlying crude oil futures are in fact very relevant for the case of crude oil options. Results To our knowledge, this is the first paper looking into the relationship between implied volatility and moneyness in the crude oil option market. Our results are three-fold. First, we show that crude oil option market tends to exhibit a volatility smile. Second, we show that the main determinants of the smile are basis and hedging pressure in the market of the underlying crude oil futures. Third, we show that transaction costs on the options market also play a role. Conclusions Overall, we believe that our analysis sheds light on the importance of hedging needs for the behavior of crude oil derivatives prices. More specifically, the hedging pressure in the market for the underlying crude oil futures directly feeds into the pricing of crude oil options. The implied volatility smile is a pricing anomaly since it violates the Black-Scholes option pricing model. We believe our results provide a plausible reason for such deviations from theoretically correct pricing. References Black, F. and M. Scholes (1973). The pricing of options and corporate liabilities. Journal of political
economy 81 (3), 637– 654. Pena, I., G. Rubio, and G. Serna (1999). Why do we smile? on the determinants of the implied volatility
function. Journal of Banking & Finance 23 (8), 1151–1179.

175
Session 21 - Current Oil Market Dynamics
Krzysztof Drachal A COMPARISON OF VARIOUS OIL PRICE FORECASTING METHODS WITH A LARGE NUMBER OF VARIABLES
Krzysztof Drachal, Faculty of Economic Sciences, University of Warsaw,
Overview Finding an econometric model which would produce more accurate forecast of a commodity spot price than the naïve method is a very hard task. This is true, as a general observation for the commodities market. However, the reported research is focused on forecasting spot oil price, which is in no way simpler. In order to tackle this problem various methods have been applied. However, it is hard to find a one, particular study which would apply a bunch of various methods to the same sample. Therefore, the aim of the reported research is to present the analysis of the accurracy of various popular forecasting methods, evaluated over the consistent sample. In particular, Juvenall and Petrella (2015) quarterly data are used. This data set covers the period between 1971 and 2009. The original Juvenall and Petrella (2015) data consists of 150 observations, but here in order not to deal with missing observations, etc. this data set is reduced. In particular, 127 explanatory variables are taken from the original data set. Juvenall and Petrella (2015) data set contains several macroeconomic variables from different countries, as well as, data derived from stock markets, economic activity index, etc. Indeed, the scope of this reseach is to narrow the considerations to the methods dealing with variable (model) uncertainity problem. In other words, the starting point can be such that a researcher has some initial evidence about the importance of a given variable as the explanatory one for the spot oil price. On the other hand, this set can consist of reasonably large variables. If, for example, the number of variables exceeds the number of observations for each of the time-series, then definitely the conventional methods are not suitable. One of the econometric approaches which is suitable in such a case, is to apply the Baysiean methodology. However, there are also lasso and ridge regressions, etc. (which actually also have their Bayesian versions). It seems therefore interesting to compare the forecast accuracies obtained from such various methods. Methods The following econometric models are used: Dynamic Model Averaging, Bayesian Model Averaging, Dynamic Model Selection, Bayesian Model Selection, time-varying parameters regression, lasso regression (also the Bayesian version), ridge regression (also the Bayesian version), the elastic net regression and the least-angle regression. As the benchmark models the following ones are used: ARIMA model with dynamically changing lags, the naïve forecast and the moving average (Friedman et al., 2010; Gramacy, 2017; Hastie and Efron, 2013; Hyndman and Khandakar, 2008; Onorante and Raftery, 2016; Raftery el al., 2010). Results The most accurate forecasts (accoriding to Root Mean Squared Error) is produced by the lasso regression. However, according to the multivariate Diebold-Mariano test for the Equal Predictive Accuracy (Drachal, 2018; Mariano and Preve, 2012) only the time-varying parameters regression can be stated to produce significantly less accurate forecasts than all the other models.

176
Session 21 - Current Oil Market Dynamics According to the Model Confidence Set procedure (Bernardi and Catania, 2014; Hansen et al., 2011) additionally Bayesian Model Averaging with the dynamic Occam’s window and the naïve method produce statistically less accurate forecasts. Conclusions The differences in the forecasts’ accuracies between the considered methods seem to be statistically insignificant. However, it is interesting to consider the methodology of each of the model, and to compare how these models select the important explanatory variables. In this context, it can be discussed whether (except just the task of the price forecasting) the considered methods give similar or different conclusions about how different factors impact the spot oil price. References Bernardi, M. and Catania, L. (2014). The model confidence set package for R. https://arxiv.org/abs/1410.8504 Drachal, K. (2018). multMDM: Multivariate version of the Diebold-Mariano test. https://CRAN.R-
project.org/package=multDM Friedman, J., Hastie, T. and Tibshirani, R. (2010). “Regularization paths for generalized linear models via
coordinate descent”, Journal of Statistical Software, 33: 1-22.
Gramacy, R.B. (2017). monomvn: Estimation for multivariate normal and Student-t data with monotone missingness. https://CRAN.R-project.org/package=monomvn
Hansen, P.R, Lunde, A. and Nason, J.M. (2011). “The model confidence set”, Econometrica, 79: 453-497. Hastie, T. and Efron, B. (2013). lars: Least angle regression, lasso and forward stagewise.
https://CRAN.R-project.org/package=lars Hyndman, R.J. and Khandakar. Y. (2008). “Automatic time series forecasting: the forecast package for R”,
Journal of Statistical Software, 26: 1-22. Juvenal, L. and Petrella, I. (2015). “Speculation in the oil market”, Journal of Applied Econometrics, 30: 612-649. Mariano R.S. and Preve, D. (2012). “Statistical tests for multiple forecast comparison”, Journal of Econometrics,
169: 123-130. Onorante, L. and Raftery, A.E. (2016). “Dynamic model averaging in large model spaces using dynamic Occam's
window”, European Economic Review, 81: 2-14. Raftery, A.E., Karny, M. and Ettler, P. (2010). “Online prediction under model uncertainty via Dynamic Model
Averaging: Application to a cold rolling mill”, Technometrics, 52: 52-66.

177
Session 21 - Current Oil Market Dynamics
Román Ferrer, Syed Jawad Hussain Shahzad, Raquel López, Francisco Jareñ TIME AND FREQUENCY DYNAMICS OF CONNECTEDNESS BETWEEN RENEWABLE ENERGY STOCKS AND CRUDE OIL PRICES
Román Ferrer, Department of Actuarial and Financial Economics, University of Valencia, Spain Syed Jawad Hussain Shahzad, Energy and Sustainable Development (ESD),
Montpellier Business School, France, Raquel López, Department of Economics and Finance, University of Castilla - La Mancha, Spain
Francisco Jareño, Department of Economics and Finance, University of Castilla - La Mancha, Spain
Overview Renewable energy has gained considerable ground worldwide as a viable energy alternative due to a combination of factors, such as growing international concern about climate change, fossil fuel depletion, energy security issues, technology innovation, high and volatile prices of fossil fuels and public policy initiatives in support of clean energy. In recent years, the renewable energy sector has undergone record developments and trends. According to the Global Status Report published by REN21 (2017), about 19.3% of global final energy consumption was supplied by renewable energy in 2016. Despite the tremendous development of the alternative energy sector over the past few years, crude oil remains the largest source of primary energy, accounting for a third of global energy consumption in 2016. The strength of the renewable energy sector, together with the still predominance of crude oil and its extremely volatile behavior from mid-2008, have spurred a strong interest among researchers recently in knowing whether oil prices are a key determinant of the financial performance of clean energy companies. Method In this setting, the aim of this paper is to analyze the dynamic connectedness among stock prices of U.S. renewable energy firms, crude oil prices and a number of key financial indicators, i.e., stock prices of technology firms, U.S. Treasury bond yields and the volatility of the U.S. stock and government bond markets, in the time-frequency space. To this end, the time-frequency connectedness methodology recently developed by Barunik and Krehlik (2015) is applied. This method can be seen as the time-frequency version of the spillover index approach of Diebold and Yilmaz (2012). Results The main findings of this study can be summarized as follows. First, return and volatility connectedness among the variables under examination are mostly driven by the transmission of information in the very short-term (up to five days). Second, an increase in the degree of connectedness is observed since the onset of the U.S. subprime mortgage crisis in summer of 2007, consistent with the intuition that systemic risk rises rapidly in times of financial turmoil. Third, we find evidence of strong pairwise bidirectional connectedness in return and volatility, at both higher and lower frequencies, between renewable energy stock prices and technology stock prices throughout the whole sample.

178
Session 21 - Current Oil Market Dynamics Conclusions The findings support the argument that investors perceive clean energy companies similar to high technology companies. Lack of a significant long-term connectedness between oil prices and alternative energy stock prices suggests that the clean energy sector does not need specific policies of protection against the long-term effect of major crude oil price shocks. References Barunik, J. and Krehlik, T. (2015). Measuring the frequency dynamics of financial and macroeconomic
connectedness (arXiv paper: 1507.01729). Diebold, F.X. and Yilmaz, K. (2012). Better to give than to receive: Predictive directional measurement of
volatility spillovers. International Journal of Forecasting, 28, 57-66. REN21 (2017). Renewables 2017 – Global Status Report. Technical report, REN21.

179
Session 22 - Technology development
Thomas Schröder VALUE OF ELECTRICITY SUPPLY SECURITY: A CASE STUDY FOR GERMANY
Thomas Schröder: Institute of Energy and Climate Research–Systems Analysis and Technology Evaluation (IEK-STE), Forschungszentrum Jülich GmbH,
Wilhelm-Johnen-Straße, 52425 Jülich, Germany
Overview The electrical energy system is strongly interlinked with many other parts of public infrastructure and can thus be considered a central part of modern society. Therefore, guaranteeing uninterrupted electricity supply is one of the overriding aims of energy policy. At the same time the increasing share of fluctuating energy sources (wind, photovoltaics) with possible time discrepancies between renewable electricity generation and consumption, long distances between regions where electricity is produced and used (generation-load gap), and delayed grid expansion all lead to situations requiring grid operators to intervene much more frequently. This development jeopardizes this aim of security of supply, mentioned above. Methods Despite the current position of a very high level of electricity supply security in most European countries, questions arise about the potential economic consequences of power interruptions. In this context, the economic indicator for security of power supply, the value of lost load (VoLL), can be used to address this question. VoLL is determined by relating the monetary damage arising from a power outage due to the loss of economic activities to the level of kWh that was not supplied during an interruption. According to this indicator, the key for knowing the economic damage in a certain period is to know how much electricity is consumed in this period. Following this logic, this paper combines the VoLL and electricity load curves, both on an individual regional and sectoral resolution to assess potential economic production losses. Results The simulation of power supply interruptions on a national scale delivers potential production losses connected to certain interruptions. The results show that the extent of the economic consequences varies according to season, day of week and hour of day. As this study is based on individual sectoral classification per German federal state, potential economic production losses of a certain power interruption can perfectly be located to specific regions and sectors. Conclusions A time dependent range of potential production losses can be identified, which indicates that the vulnerability of the German electrical energy system is varying. Moreover, the results locate potential production losses on specific sectors and federal states. These findings may function as a basis for grid management in electricity shortage situations in which certain customers are cut-off, i.e. sectors or regions that contribute less to national welfare. Although the case study is for Germany, the use of the approach is not restricted.

180
Session 22 - Technology development
Yalin Huang, Elin Grahn SMART METERS IN SWEDEN- LESSONS LEARNED AND NEW REGULATIONS
Yalin Huang, Energy Market Inspectorate in Sweden, Technical analysis Divison Elin Grahn, Energy Market Inspectorate in Sweden, Technical analysis Divison
Overview Sweden was one of the first countries to roll out smart meters. It started with new regulations in 2003. According to the regulations, monthly metering for small consumers and hourly metering for larger consumers should be implemented by 2009, which led to the roll-out of the first generation of smart meters. The impact of the first roll-out was evaluated in 2013 by the national regulatory authority for energy in Sweden, the Swedish Energy Markets Inspectorate (Ei). The functionality of smart meters has evolved from automatic reading of data once a month to more frequently data measuring and remote control. Based on the lessons learned in the smart meter roll-out and the development of functionality of smart meters, Ei has developed new regulations on minimum functional requirements for smart meters. Method In Sweden smart meters are owned by the distribution system operators (DSOs). Varying functionalities of smart meters between different DSOs endanger the consumers’ right to be treated equally and the consumers to have the same possibility to e.g. utilise services from energy suppliers or energy service providers. Therefore, minimum functional requirements for smart meters need to be defined. In 2013, the impact of the first smart meter’s roll-out on market participants was investigated. More specifically, the number of consumers who reacts to the electricity price, the availability of hourly price contracts and the competition among different metering service providers were studied. Based on the results and the current development of functionality of smart meters, Ei submitted a report to the Swedish Government in 2015 suggesting that minimum functional requirements for smart meters should be regulated and presented a preliminary proposal of requirements based on a long-term cost-benefit analysis (CBA). The CBA was performed according to the EU Commission recommendation on preparations for the roll-out of smart metering system [1]. The reference scenario was defined as the current smart metering system in Sweden. For each proposed functional requirement, the costs and the benefits for both the consumers and DSOs were quantified. Sensitivity analysis was then performed to identify critical variables for the positive roll-out conditions. The proposal was open for public consultation and all responses were reviewed by the government office. In 2016 the government concluded that it is necessary to develop minimum functional requirements for smart meters before the roll-out of the next generation. In 2017, Ei was tasked by the Swedish government to propose new rules concerning minimum functional requirements for smart meters, based on the previous suggestions in 2015. Results The investigation in 2013 shows that the lack of hourly price information, the lack of knowledge on electricity contract, and lack of standardisation on smart meters are the main reasons that have reduced the benefits of using smart meters.

181
Session 22 - Technology development
After restudying the proposal from 2015 and the outcome of the public consultation, Ei presented to a final proposal concerning minimum functional requirements for smart meters to the government in November 2017. The proposed functional requirements focus on both providing more information to consumers to increase their interest in being active and more information to the DSOs to increase their efficiency. Furthermore, the proposal also states that the new functionality should be implemented in a way that protects consumer privacy and data security. The minimum functional requirements cover the following areas: 1) Extended measurement data, 2) Consumer interface, 3) Remote collection of meter data, 4) Energy measurements for every hour or fifteen minutes, 5) Registration of power outages, 6) Remote update of software and settings, and 7) Remotely turn on and off the power. The new regulation is expected to be released during autumn of 2018. Conclusion Within the next few years, many of the current electricity meters in Sweden will be replaced, as they have reached their economic lifespan. Introducing minimum functional requirements for smart meters will ensure consumers the same right to the technical solutions and data security, furthermore, it facilitates a fair competition among commercial developers. References [1] EU, ”Commission recommendation of 9 March 2012 on preparations for the roll-out of smart metering systems (2012/148/EU),” Official Journal of the European Union, 2012.

182
Session 22 - Technology development
Matthias Kühnbach, Stefan Pisula, Anke Eßer POTENTIALS AND LIMITATIONS OF PHOTOVOLTAIC-BASED CELLULAR ENERGY SYSTEMS IN SOUTHERN GERMANY
Stefan Pisula, Fraunhofer Institute for Systems and Innovation Research ISI, Breslauer Straße 48, 76139 Karlsruhe, Germany
Matthias Kühnbach, Fraunhofer ISI, Germany Anke Eßer, Fraunhofer ISI, Germany
Overview In course of the energy transition, the German energy system is shifting from a small number of large and controllable power plants situated close to locations with high electricity demand to a large number of decentralized and weather-dependent energy generation units particularly installed in regions with high renewable energy potential. This paradigm change necessitates the need for a fundamental reconstruction of the energy system. On the one hand, transferring electricity from where it is generated to demand centers asks for an expansion of the existing power grid. On the other hand, dealing with volatility of renewably produced electricity becomes challenging as dispatchable power plants are being replaced by renewable energy sources (RES). A cellular energy system - one example for distributed electricity systems - could be a viable concept to cope with this complexity (VDE and ETG 2015): Generation units as well as storage systems are bundled in energy cells aiming to balance out generation and consumption on the most local level before interacting with neighboring or superordinate cells. In this study, we present an optimization approach in which decentralized, cellular systems using photovoltaic (PV) and battery storage are modelled, while evaluating implications of a large-scale deployment of energy cells on the regional and systemic level. Methods For the purpose of this study, we consider the districts NUTS-3 regions (districts) within the southern part of Germany (Bavaria, Baden-Wuerttemberg and Hesse) as energy cells. To analyze impacts both on regional and systemic level, we define sample cells, which are subsequently aggregated. To select sample cells, we perform a hierarchical cluster analysis using the Ward method based on cell-specific load profiles and regional expansion potential of PV. Afterwards, an economic expansion of PV and battery storage is determined. For doing so, overall yearly electricity expenses including net present value of investments in PV and battery storage within a cell as well as external electricity purchases are minimized using a mixed- integer linear programming approach. In the model, PV generation is directly consumed within the cell, stored in the battery storage or sold on an external spot market using hourly price signals. The model also considers the possibility of arbitrage trading. We define two different cases for energy cells in the year 2030. In the base case, no restrictions with respect to self-sufficiency are applied. In case II, the cellular approach is implemented defining a degree of self-sufficiency of a least 60 % for each cell. Having performed the previous steps for all the sample cells, results are scaled-up to the level of southern Germany in a final step. An overview visualizing the approach presented here is given in figure 1.

183
Session 22 - Technology development
Figure 1: Economic analysis of energy cells using hierarchical cluster analysis to group regions and mixed-integer linear programming to model PV and battery storage investment. Results There are results for two levels of consideration: The level for the sample cells and the level of the three federal states (up-scaled results). From cell perspective, results show that regional heterogeneity concerning the structure of consumers and generators plays a major role in the technical and economic feasibility of the cellular approach. While PV expansion potential is insufficient in satisfying energy demand in urban areas, a self-sufficiency level of up to 68 % is economically viable in others with a high share of wind energy plants. Furthermore, the cells’ different cost structures affect investment and usage of PV systems and battery storages significantly. However, in the base case no battery storage is installed, which shows that under the given assumptions battery systems would not be economic. On an aggregated level, the results show that in order to achieve a noticeable level of self-sufficiency within cells, a much higher expansion of PV systems would have to be realized than current political objectives pursue. Relating to the interaction between a cell and its environment, results illustrate that on the one hand temporarily a substantial surplus of PV electricity exceeding storage capacity in the cell is observed, which thus has to be handled outside the cell. This is particularly the case, if a self-sufficiency level of 60 % is to be reached. On the other hand, especially in the winter season, an external electricity supply has to be ensured in periods of low PV generation. Conclusions The high impact of regional differences in the structure of consumers and generators on the feasibility of a cellular energy system raises the question of the design of appropriate implementation measures. In addition, the issue of how to determine a suitable cell size is crucial when implementing a cellular energy system. Modelling results show that in case of a large-scale cellular approach, PV systems and battery storage units exceed political objectives. Therefore, the implementation of cellular systems would have to go along with adaptations of RES expansion policy. Besides theoretical feasibility and political support, questions with respect to the definition of valid (business) use cases, which incentivize the diffusion of concepts in which electricity generation and consumption are handled decentrally, have to be assessed closely in order to create added value by implementing energy cells.

184
Session 22 - Technology development Finally, to manage the temporarily high surplus of PV generation as well as the provision of external energy supply solutions have to be developed. In this context, the consideration of additional flexibility stemming from inter-cellular balancing or the demand side could result in complementary insights. Reference VDE and ETG (2015): The cellular approach - The basis of successful, cross-regional energy
transition.Edited by Association for Electrical, Electronic and Information Technologies. Munich.

185
Session 22 - Technology development
Sheng-Dih Hwang, Yu-Ching Huang DETERMINED A REFERENCE PRICE BY CO2 ABATEMENT COST FOR WINDOW FILMS Overview
Window film could provide its benefit to retrofit a building, improve the thermal gain from the window, and not seriously reduce the light. Window film is a cost-effective measure for retrofitting to reduce the demand of cooling in existing buildings.To let the heat received be minimized in summer and maximized in winter; also to maximize the light into a house are basic considerations. The energy-saving potential of a window film is no less than that of low-E glass at the hot climate zones. In general, the market price is determined by the suppliers. Some institutes thought that the market price could be expected to within the range 40 and 70 USD/m2 for window film; yet, the chaos of market price is still happened. We try to make an assessment by the definition of CO2 abatement cost to establish a reference price of window films in Taiwan. A reference price could also be obtained by calculating the CO2 abatement cost as well. The reference price is defined as a balance between saved money and invested cost. This price is not conducted with the manufacturing cost, material cost, personnel cost, management cost, cost of sales and the benefit. The resulted reference prices are close to the GSA and IWAF recommended. The reference price implies a same characteristic with the life- cycle cost.Conclusions show that a window film should be with the energy-saving ability not lower than 11%, the life- cycle longer than 10 years and price under 43USD/m2. Methods The CO2 abatement cost is defined by the following equation ACt= (CDEV -CBAU) / (EBAU - EDEV )=ΔCt / ΔEt
The notations of CBAU, CDEV, ACt, ΔCt, EBAU, EDEV, and ΔEt each of them has a corresponding relation. In equation the numerator is a critical portion of the determination of the reference price. When CDEV equaled to CBAU means that the saved money equaled to the invested cost, in other word, this is a balance between the saved cost and the invested cost. When determining the CO2 abatement cost, the reference price could be calculated as well. The data of Chunying Li et.al. are quoted to assess the feasibility of this methodology. It provided that the linking of the energy saving ability and the reference price with the CO2
abatement cost of a window film. Results
The quoted data would be shown in Tables or Figures. The energy-saving ability is proportional to the reference price. An average reference price for every orientation is 72USD/m2, which approximates to the IWFA and DOE recommended price. Discussion on reference price with the energy-saving ability, life-cycle, and the market price would also be included. The variation rate of CO2 abatement cost with the energy-saving ability among the region 2%- 10% was ten times larger than the region 10%-20%. A manufacture should develop a product with an energy-saving ability larger than 11%. If the market price of the window film with an energy-saving ability 17% is less than 43 USD/m2 then the CO2 abatement cost is negative, which means that the electricity bills can be saved more money than their annual invested cost of the window film. The life-cycle should be longer than 10 years.

186
Session 22 - Technology development
Conclusions All the discussions can be concluded in briefly as the follow: the market price of window film should not excess 43USD/m2, energy-saving ability is not lower than 11%, and the life-cycle is longer than 10 years are preferred. References J.W.Lee, H.J.Jung, J.Y.Park, J.B.Lee, Y.Yoon, Optimization of building window system in Asian regions
by analyzing solar heat gain and daylighting elements, Renewable Energy, 50,(2013) 522-531 Chunying Li, Junyi Tan, Tin-Tai Chow, Zhongzhu Qiu, Experimental and theoretical study on the effect of
window films on building energy consumption, Energy and Buildings, 102,(2015) 129-138 The Policy Pathway series, Modernising Building Energy Codes to Secure our Global. Energy Future,
IEA-UNDP, ( 2013). Jeffrey R. Plummer, Window Film: A Cost Effective Window Retrofit, Green Builder Media, Mar 15,
(2015) Tetsuya Takeuchi, Osamu Goto, Masataka Inuduka, Tetsuji Narasaki, Yoshihiro Tokunaga, Hisami
Bessho and Hitoshi Takeda, Development of Window Films for Solar Shading and Heat Insulating Applications, SEI Technical Review, 74 April (2012 ) 95-105
Karma Sawyer, Windows and Building Envelope Research and Development: Roadmap for Emerging Technologies, Building Technologies Office US Department of Energy (2014)
Energy Analysis for Window Film Applications in New and Existing Homes and Offices, International Window Film Association IWFA, Feb 7 ( 2012)
Tae Yong Jung, Chan Park, Marginal Abatement Cost of CO2 Mitigation Options for the Residential Sector in Korea, Korea and the World Economy, Vol.18, 1, ( 2017) 27-40
RongxinYina, Peng Xub, Pengyuan Shen, Case Study: Energy Savings from Solar Window Film in Two Commercial Buildings in Shanghai, Energy and Buildings, 45, (2012) 132-140
Peter Turnbull, Advanced Window Film Technology Assessment-Phase I Report, Pacific Gas and Electric Company, (2012)
U.S. Department of Energy/ Energy Efficiency& Renewable Energy, Energy Saving from Window Attachments, (2012)
Samah K.AlghoulHassan G.RijaboMohamed E.Mashena, Energy consumption in buildings: A correlation for the influence of window to wall ratio and window orientation in Tripoli, Libya, Journal of Building Engineering, 11, (2017) 82-86
ZT Taylor VV Mendon N Fernandez, Methodology for Evaluating Cost Effectiveness of Residential Energy Code Changes, U.S. Department of Energy under Contract DE-AC05-76RL01830, August (2015)

187
Session 23 - Perspectives of transport sector
Franco Del Manso IMPACT OF EURO 6 DIESEL PASSENGER CARS ON URBAN AIR QUALITY COMPLIANCE IN ITALY
Franco Del Manso, Unione Petrolifera, Piazzale Luigi Sturzo, 31 00144 Rome, Italy
In recent years, significant improvements have been made to air quality in Italy and Europe thanks to the extraordinary reduction of exhaust emissions for both passenger and commercial vehicles. However, air quality remains problematic in many urban areas due to non-compliance with the air quality limit values (AQLV) set by the World Health Organization, especially for nitrogen dioxide (NO2) and particulate matter (PM). In many cities, road transport has been the main objective, often the only one, of emission reduction measures and, in particular, diesel cars are considered the main cause of non-compliance with air quality limit values. Many public administrators therefore think to avoid the urban air quality non-compliance by simply banning all diesel engines in the private mobility in their cities. These measures are unlikely to help to reach an earlier compliance of air quality limits The latest generation of Euro 6/d diesel engines have near-zero emissions through the combination of ultra-low sulphur fuel, advanced engine technologies and sophisticated emissions abatement systems. In the turnover of the vehicle fleet from older vehicles to new vehicles, the latest Euro 6d diesel vehicles will be very effective in helping Italian cities become compliant with Air Quality standards. Concawe – The European oil industry downstream association - commissioned two studies in 2017 to determine the expected emissions from the latest Euro 6 diesel passenger cars under the new testing methodology and to understand how the emissions from these new diesel cars would influence ambient air quality compliance. The data generated from the first studio (Ricardo Study) show that real world NOx emissions from diesel passenger cars are significantly reduced by successive improvements in Euro 6 legislation and the current Euro 6d cars will meet the 80 mg/km EU NOx emission standard for Euro 6 passenger cars under real driving emissions test conditions. A second study, commissioned to AERIS Europe, made a comparison of the impact on ambient air quality compliance of two different scenario: Ricardo Median Scenario: All new diesel passenger car registrations from 2020 onwards
are Euro 6d conform to the median level of the Ricardo results. ZEV Scenario: All new diesel passenger car registrations from 2020 onwards are replaced
by a zero tailpipe emissions vehicle undertaking the same amount of kilometres driven For NOx the study shows an approximate 80% reduction by 2030 in Italy, as a result of improved emissions from Euro 6 diesel passenger cars. With the modified scenario to reflect the ZEV scenario, further minimal reductions in 2025 and 2030 are shown. With the current Italian fleet’s turnover rate, older technology vehicles will persist through to 2030. For PM2.5, the successful implementation of exhaust treatment systems removes nearly all PM exhaust emissions from diesel cars. The remainder of the PM emissions are abrasive emissions from road, brake and tyre wear which are related to activity rather than technology. The non-exhaust PM emissions also persist in the ZEV scenario.

188
Session 23 - Perspectives of transport sector The overall results show that both the Ricardo median and the ZEV scenarios exhibit a similar evolution of compliance over time. The difference in the overall number of stations achieving compliance between the two scenarios is just above 0.5% in 2025, while in 2030 is almost 0%. This strongly suggests that the progressive replacement of older diesel passenger cars by Euro 6d diesel cars will show a similar improvement in urban air quality compliance compared to a replacement with zero exhaust emission cars. The ZEV scenario is unlikely to deliver any significant improvement compared to the Ricardo median scenario. An analysis of local sources of pollutants is needed to effectively address the remaining non-compliant areas and to identify the most effective mitigation measures. Measures to address residential combustion would likely make the most marked improvements for PM2.5. As road transport is the largest source of NOx emissions for Italy, by removing the higher polluting older vehicles (both light-duty and heavy-duty) from the current vehicles fleet, as soon as possible, would result in the most significant ambient air quality improvements for NO2. To try to address the issue with the ZEV vehicles only is likely to reduce the rate of air quality improvement.

189
Session 23 - Perspectives of transport sector
Gabin Mantulet, Silvana Mima, Adrien Bidaud THE FUTURE OF TECHNOLOGIES FOR MOBILITY, A MODEL BASED APPROACH
Gabin Mantulet, PhD student, LPSC – CNRS, Laboratoire de Physique Subatomique & Cosmologie (LPSC), 53 Avenue des Martyrs, 38000 Grenoble
Adrien Bidaud, CNRS researcher, LPSC – CNRS, Laboratoire de Physique Subatomique & Cosmologie Silvana Mima, CNRS researcher, GAEL – CNRS, UPMF - BP 47 - 38040 Grenoble cedex 9,
Overview/context Energy consumption aims at different purpose: to meet humans’ needs (lighting, cooking, heating, etc.), to produce several type of products in industrials processes to improve our life quality and to move people. As security of energy supply raises serious concerns, strategies for self-sufficiency are becoming of crucial importance worldwide. By diversifying their energy transactions and increasing self-consumption, countries would become more competitive and will avoid world tensions counter side effects. Moreover, because of actual concerns with global warming, humanity must change its way of life and apply sustainable development. Hence, decarbonizing energy sector with local resource allows countries to succeed on both board: being less carbon intensive and limit global warming and increase independence ratio for more resilience. In particular changing mobility sector is key to reach these objectives. Indeed, we currently move ourselves mainly thanks to ways of transportation powered by conventional fuels. Here, oil and relative products such as gasoline, diesel are essential. Countries are thus in high dependency of oil producers and are all subjects to oil market side effects.
Figure 1: mobility mix in 2050 in France, EPFL 2016 study

190
Session 23 - Perspectives of transport sector Some politicians views aim at renew this sector that is still mainly driven by car manufacturers, big oil companies and petroleum lobbies. Furthermore, diminishing the use of oil power vehicle brings about improvements for micro particles emissions and decrease health hazards. An example of a study concerning futures of mobility has been conducted in 2016 for France at the 2050 horizon and figure 1 represent the different mobility mix for each scenario conducted (no changes, willingness to reduce the use of individual cars and willingness to decrease the overall need in mobility). It’s worth noticing that depending on the scenario considered, and so individual needs, political views and policies implemented, the repartition of each way of transportation change a lot. Trends like this one have to be considered in analysis concerning the future of energy mix and mobility repartition to determine the best advices for decision makers to address the right investments in the appropriate technologies. Method We will use bottom up long-term modelling tool for the energy system POLES (Prospective Outlook on Long-term Energy Systems) to carry out energy scenarios that span across the whole 21st century until 2100. The model used enables us to implement simulations through several scenarios and sensitivity analysis and to estimate how the technologies considered in this study would develop in the future energy mix and mobility paradigm. For example, we consider “baseline scenarios” where policies do not aim at fighting climate change that trigger a plus 4°C in 2100 warming as well as “2°C scenarios” where climate policies are implemented and limit global warming. Then we do sensitivity analysis on key parameters for the mobility technology development: R&D and learning rates, technology costs, infrastructures costs. But also external parameters that modify the market and technology development for mobility such as ecological bonus/malus tax, carbon tax (that is in relation with climate policies scenario), urbanization rates, strong policies aiming at phasing out one type of vehicle at a certain milestone the need of mobility and the influence of “resilience way of thinking” that tend to decrease overall need of mobility for humans. Results The strength of our study is the assessment of each technology penetration for mobility for different regions and time scale. Only few research papers address the role not only of the type of mobility (individual, rail, tramway, metropolitan, bus, bike, walk, etc.) but also the technology used for each way of transportation (electrical vehicle, hybrid, electrical bike, gas vehicle, etc.). Instead of looking only the individual or collective development rates and the need for haulage, our simulations and analysis allow us to see the contribution of each mobility technology for each mobility sector as global numbers and share of each technology in the mobility mix. Hence we will see the evolution of electricity, gas, oil based, hybrid, hydrogen mobility penetration for the different mobility purpose and if they go along or compete with the other energy technologies. Costs are then estimated and put into comparison with CO2 emissions. Finally yet importantly, comparison between scenarios will quantify the interest of each parameter so that we will emphasize the added-value of this or that technology in the decarbonisation. In summary we should be able to assess the role of each technology for the decarbonisation of mobility sector in each scenario and draw some conclusions on the futures for mobility paradigms according to local cultures and particularities.

191
Session 23 - Perspectives of transport sector Conclusions There is no doubt that an other mobility paradigm will develop mainly in next decades, and these new trends have to appear in long term energy modeling tools. This environment is complex but the capture of interactions and competitions between the different ways to move are a clue to better describe the decarbonized energy mix for the future. While electricity sector and buildings can be decarbonized with actual wide spread technologies that are more and more competitive and with gains in energy efficiencies, transportation sector decarbonisation has to be more widely promoted and encouraged by politicians to phase oil base products. For instance, as mentioned in new policies plans in France ”clean mobility”, strong efforts and big mentalities changes have to emerge in order to progressively limit the use of individual and pollutant cars and succeed in the transportation sector decarbonisation challenge. Some countries such as Norway pave the way to get rid of thermal oil engine before 2050 with ambitious objectives. Then further work has to be done to estimate the feasibility of each scenario proposed, for example by studying the impact in term of raw materials needs, supply chain, costs and environmental side effects or also with the social acceptation in changing transportation and life habits. References ADEME, «Consommations conventionnelles de carburant et émissions de CO2, réglementation», 2017 Vincent Kaufmann, Emmanuel Ravalet, “From Weak Signals to Mobility Scenarios: A Prospective Study
of France in 2050”, Laboratory of Urban Sociology, EPFL, Lausanne, Switzerland, available online 28/12/16
Joël Cossardeaux, «Qualité de l’air: l’exécutif durcit les règles pour rouler propre», Les Echos, 21/07/18 Raphaël Bloch, «Automobile: ces pays qui veulent mettre fin aux voitures diesel et essence», Les Echos,
09/11/17 Sandrine Youknovski, «Bilan du marché automobile français en 2015», le lynx.fr, 28/12/17

192
Session 23 - Perspectives of transport sector Alessandro Silvestri, Sebastien Foudi, Ibon Galarraga CURRENT DEVELOPMENT AND FUTURE POTENTIAL OF CARSHARING IN SPAIN: INSIGHTS FROM EXPERTS AND USERS IN-DEPTH INTERVIEWS Alessandro Silvestri, Basque Centre for Climate Change (BC3) UPV/EHU Science Park, Sede Building 1,
Bº Sarriena s/n , 48940, Leioa, Basque Country, Spain Sebastien Foudi, Basque Centre for Climate Change (BC3), Spain Ibon Galarraga, Basque Centre for Climate Change (BC3), Spain
Overview Unlike many other energy related sectors, transport has kept increasing its emissions’ levels in the last 25 years. Road transportation is dominating this trend and urges us to find a new paradigm to the current mobility based on private conventionally-fuelled vehicles. In this context shared mobility can play a relevant role in Spanish urban areas. In particular, carsharing experienced a rapid growth in the last years in Spain and especially in Madrid. We explored the current development of this sector from both the expert and user perspective to unveil potential for future development, as well as users’ preferences and habits towards this mode. Our aim in this study is to test whether user preferences for urban and shared mobility and the current and future development of shared mobility can contribute to a sustainable urban mobility, which would improve social wellbeing in cities. In doing so we gave specific attention to the relation with public transportation and the role of electro- mobility. Methods The study has been conducted through 28 in-depth semi-structured interviews with both carsharing users and experts from different Spanish cities. 15 carsharing users have been interviewed in the cities of Madrid and Barcelona, from different companies and carsharing types. Users have been selected to represent different gender, age groups and having or not children. The interviews followed a structure based on 5 main topics of discussion: the use of the mode; the factors influencing adoption and motivation to use carsharing; the relation with public transport; the relation with private vehicle; and the future development and considerations on the vehicles involved. 13 stakeholders representing businesses, public administration and sectorial association from Bilbao, Madrid and Barcelona have been interviewed. The interviews followed a structure based on 4 main topics of discussion: the current development of carsharing; the facilitation of carsharing, political and social factors; the relation with other transport modes; questions related to the specific stakeholder type. Interviews have been analysed through a template analysis strategy based on the different topics forming the guidelines. Users and experts’ interviews have been analysed separately. Then outcomes have been compared to highlight potential barriers. Results The analysis of users’ interviews revealed that the mode is mainly used for leisure activities; younger users seems more incline towards using more than one carsharing operator, where available, and in general to use multiple modes to move (e.g. bicycle, walking, shared bike, public transport).

193
Session 23 - Perspectives of transport sector Factors influencing carsharing adoption seems mainly related to convenience in use, such as practicality, availability, immediateness and flexibility compared to other transport modes.
The use of carsharing could reduce private car purchases but may also reduce public transport use. In fact, the majority of free-floating carsharing users stated after joining the service they reduced their use of public transportation, while station-based users stated their use of public transportation remained equal.
The great majority of users owning at least a car stated the service could allow them not having to buy a second car or to reduce the number of cars owned in the household; Users not owning a car stated the service helped them to not having to buy one.
The electric technology is demanded by users. The majority of users would prefer the service being offered by electric cars and, all else equal, the majority of them state they would be open to pay a bit more for the electric technology. Those who use the electric carsharing have a generally positive opinion of the vehicle type and say the experience of it could make them consider such vehicle in an eventual purchase.
On the stakeholders’ side carsharing is regarded as an opportunity by public administration to complement public transportation and reduce carbon emissions thanks to electric vehicles. For instance in Madrid the enhancement of carsharing is included in a specific measure of the mobility plan. Parking facilitations and restricted areas access, as well as a specific legal recognition are key policies identified to pursue carsharing development.
According to business stakeholders, carsharing mobility should be pursued as the benefit to society it could bring is threefold: economic, avoiding car purchasing and maintenance costs; social, mainly connected to the freeing of public space and environmental. The use of electric vehicles in carsharing service is at the moment seen viable only by free-floating operators; while station-based carsharing have concerns with respect to the autonomy due to the higher length of the trips. Moreover, cities would benefit from the integration of carsharing with other urban services and in particular public transport to make easier to avoid using private vehicles. Both types of carsharing services can contribute in this sense to sustainable mobility. However, it will be important to control that the flow of carsharing users will come from people reducing their private vehicle use rather than their public transport use. Conclusions The potential substitution of public transport uses by carsharing uses revealed by the analysis of users’ preferences can undermine the development of a sustainable mobility in cities. Instead, carsharing system should be organized as a complement to the public transport system and favour electro-mobility. Further investigation is needed to design instruments that facilitate the integration of these transport modes.
References Costain, C., Ardron, C., Habib, K.N., 2012. Synopsis of users’ behaviour of a carsharing program: A case
study in Toronto. Transp. Res. Part -Policy Pract. 46, 421–434. https://doi.org/10.1016/j.tra.2011.11.005
Kent, J.L., 2014. Carsharing as active transport: What are the potential health benefits? J. Transp. Health 1, 54– 62. https://doi.org/10.1016/j.jth.2013.07.003
Kent, J.L., Dowling, R., 2013. Puncturing automobility? Carsharing practices. J. Transp. Geogr. 32, 86–92. https://doi.org/10.1016/j.jtrangeo.2013.08.014

194
Session 23 - Perspectives of transport sector
Prettenthaler, F.E., Steininger, K.W., 1999. From ownership to service use lifestyle: the potential of car
sharing. Ecol. Econ. 28, 443–453. https://doi.org/10.1016/S0921-8009(98)00109-8 Prieto, M., Baltas, G., Stan, V., 2017. Car sharing adoption intention in urban areas: What are the key
sociodemographic drivers? Transp. Res. Part -Policy Pract. 101, 218–227. https://doi.org/10.1016/j.tra.2017.05.012 Shaheen, S.A., Cohen, A.P., 2013. Carsharing and Personal Vehicle Services: Worldwide Market
Developments and Emerging Trends. Int. J. Sustain. Transp. 7, 5–34. https://doi.org/10.1080/15568318.2012.660103 Steg, L., 2005. Car use: lust and must. Instrumental, symbolic and affective motives for car use. Transp.
Res. Part Policy Pract., Positive Utility of Travel Positive Utility of Travel 39, 147–162. https://doi.org/10.1016/j.tra.2004.07.001
Symon, G., Cassell, C., 2012. Qualitative Organizational Research: Core Methods and Current Challenges. SAGE.

195
Session 23 - Perspectives of transport sector
Wojciech Drożdż PROSPECTS FOR THE DEVELOPMENT OF POLISH ELECTROMOBILITY
Wojciech Drożdż, Prof. US Ph.D. Vice-president for Innovations and Logistics of Enea Operator Ltd. 60-479 Poznan; Poland, Strzeszyńska 58 Street, Poland
Overview The energy industry has been facing civilization challenges for years. Constantly increasing customer expectations, emerging new areas of activities, international cooperation of energy companies, thanks to the involvement of significant financial resources for cooperation with scientific units and innovative approach of employees, solutions are created to the XXI century. Electromobility is one of them. The development of large urban agglomerations is indispensably linked to the development of transport as a whole. These solutions can be used not only by customers, but also by energy companies themselves by improving the financial condition and own market value. Methods Proceedings in line with the Act on Electromobility and alternative fuels (Journal of Laws item 317). A brief analysis of the trend of electromobility in Poland (increasing number of electric cars and charging stations and analysis of the impact of the development of the electric vehicles market and the increase in energy demand on the distribution grid); comparison of the catalog of incentives for buyers of electric cars used in Poland and selected European countries. In addition, the forecast of alternative drive sources for the years 2016-2021 in accordance with PwC Autofacts® 2017 and the analysis of the purchase of an internal combustion engine or electric vehicle with a choice of the same class and brand car, at the same price. The final resources are the perception of an electric car (pros and cons) and cooperation of local governments and the act on electromobility. Results Currently, the scope of this branch of transport in Poland is not a threat to the operation of both the distribution and transmission networks. The sale of electric cars has been steadily growing since 2010. In different countries there are different privileges for people who decide to buy an electric car. There is an increase in the demand for hybrids and electric vehicles, however, the prices of electric cars are still too high in relation to the declared amount that customers could pay. There is a lot of pressure to change the car for an eco car, unfortunately, the long charging time and road infrastructure are only partially adapted to such a challenge. Conclusions Electromobility as an idea is aimed at developing the infrastructure of electric cars and alternative fuels Implementation of plans included in the Act is connected with strong cooperation of Distribution Network Operators and local governments. On the basis of surveys, it is possible to register an increase in the demand for power at the local and regional level, the possibility of escalation of currently occurring demand peaks in larger urban agglomerations, the emergence of new devices using the power of 50KW or even 500kW in the network system.

196
Session 23 - Perspectives of transport sector However, the development of electromobility is affected by many factors, both economic, social and economic, which is why Enea Operator in 2017 took part in many research and development programs in cooperation with leading universities, institutes and companies in Poland. Emphasis on the development of electromobility at the regulatory level should provide a development impulse for the whole industry and allow for the intensive development of pioneers, giving them the opportunity to build new competitive advantages, over time distribution networks, brand recognition and new cooperative networks References Power distribution and transmission of the PTPiREE 2018 report Electromobility in the development of
cities Wojciech Drożdż publ. PWN Warsaw 2018 PWC Poland

197
Session 24 - European energy security strategies
Marina Petri REGULATION AND EFFICIENCY: WHICH GOVERNANCE MODEL FOR ENERGY SECURITY AFTER THE WINTER PACKAGE?
Marina Petri, Bocconi University, Milan, Italy Overview Energy is an area of shared competences between the EU and its Member States. With Member States retaining large powers, regulation was, for a long time, left to informal networks of stakeholders who played a key role in coordinating policies. Following the introduction of Art 194 TFEU in the Lisbon Treaty, EU’s 2009 third energy package builds on these informal arrangements and delegates regulatory and enforcement powers to public national regulators and to private transmission system operators (TSOs). These are organized in networks outside the EU framework, coordinated by the (EU) Agency for the Cooperation of Energy Regulators (ACER). ACER carries out tasks meant essentially to enhance cooperation between the different public and private players, while also having a monitoring function, and decision making power in technical areas. The interactions between these actors is particularly crucial with regards to energy security, an area characterized by both public policy concerns and private enforcement tools: the role of ACER in this context is vital, as it provides a platform for cooperation for NRAs and TSOs, which, as expressly articulated under the legislation, should lead to the creation of a common regulatory regime to deal with cross border issues. The 2016 Winter Package introduces an innovative set of tools which could potentially destabilize the institutional relationships between the aforementioned actors, while presenting an autonomous corpus of challenges to the governance of energy security throughout the EU.
Methods Following the approach suggested by the European Court of Justice in the Meroni and Esma judgments, this paper uses a comparative socio-legal methodology to assess the current practice of ACER in the field of energy security, with a particular focus on the justiciability of its soft law. This analysis is used as an interpretative tool to observe the governance implications brought about through the “Clean Energy for All Europeans” 2016 Package. Results The paper suggest that a socio-legal approach can be fruitfully introduced when interpreting the practice of ACER, as it represents a key tool in observing the tangible interactions between the Agency, NRAs and TSOs, which diverge from the relationships inferable from a purely legal analysis. Moreover, the study proposes a structured set of critical variables to be considered when assessing the post-Winter Package governance scenario for energy security. Conclusions While energy security retains its structurally shared governance model, the Winter Package could represent a relevant turning point in the institutional framework, both with regard to the relevant actors involved and with regard to the nature of their interactions. The regulatory oversight of the ENTSOs, ROCs and the newly-established EU DSO Entity, with the possibility for ACER to issue decisions to ensure compliance, is among the most relevant examples.

198
Session 24 - European energy security strategies References
Eberlein, The Making of the European Energy Market: The Interplay of Governance and Government, Journal of Public Policy, 2008, p. 28 – 73.
Lavrijssen – Ottow, Networks on track: from European regulatory networks to European Regulatory “network” agencies, in Legal issues of European Integration, n. 36/2009, p. 23 – 55.
Pototschnig – Vaona, Un’agenzia per la cooperazione fra ia regolatori nazionali dell’energia: partecipazione e cooperazione strutturale tra le autorità nazionali di regolamentazione nell’interesse dell’unione attraverso un organism indipendente, in Merusi – Antoniazzi, “Vent’anni di regolazione accentrata di servizi pubblici locali”, 2017, p. 152 – 187.
Scott, Regulation in the age of governance: the rise of the post – regulatory State, in Levi-Faur – Jordana, The Politics of Regulation, Elgar, Cheltenham, 2004, p. 145 – 174.

199
Session 24 - European energy security strategies
Carsten Herbes, Benedikt Rilling, Lars Holstenkamp READY FOR THE NEXT STEP? THE HUMAN CAPITAL OF GERMAN RENEWABLE ENERGY COOPERATIVES’ MANAGEMENT WITH A VIEW TO IMPLEMENTING NEW BUSINESS MODELS
Carsten Herbes, Nuertingen-Geislingen University, ISR, Neckarsteige 6-10, 72622 Nuertingen, Germany Benedikt Rilling, Nuertingen-Geislingen University, ISR, Neckarsteige 6-10, 72622 Nuertingen, Germany,
Lars Holstenkamp, Leuphana University of Lueneburg, Scharnhorststraße 1, 21335 Lüneburg, Germany
Overview Community energy projects and especially renewable energy cooperatives (RECs) are an opportunity to foster the production and the marketing of renewable energies. RECs have emerged in many European countries as a new player over the last decade. As of end of 2016, around 950 RECs were operating in Germany (Kahla et al. 2017). Most RECs in Germany have relied on an easily scalable, simple and low-risk business model: producing electricity with photovoltaic (PV) systems and receiving feed-in tariffs (FIT) (Yildiz et al. 2015). With the recent disruptive legal changes, RECs - not only in Germany, but also in the UK (Harnmeijer 2016) - have to look into new business models. A recent study has revealed that managers and members of German RECs have concerns about competencies regarding new business models (Herbes et al. 2017). Therefore, our study examines if the human capital of REC management boards meets the requirements of future business models and if the level and structure of human capital corresponds with their self-assessment and their future plans. Methods Drawing on the literature on human capital, top-management teams and current challenges for RECs (Herbes et al. 2017; Klagge et al. 2016), we identified eleven areas especially relevant for RECs’ future development. We aggregated the human capital (education and professional experience) of the entire management team per organization along these areas to identify types of RECs with regard to the human capital of their board. We will then link these types with the planned future business models and the management’s confidence regarding their ability to successfully implement them. To this end we performed an online survey of the members of the management board (‘Vorstand’) of 761 citizen energy cooperatives (out of a total of around 1.000 energy cooperatives in Germany) with an estimated 2.100 management board members of which 187 members responded to our survey. The online questionnaire was sent via email by our partners, three cooperative associations and two organizations from the renewable energy sector with a link, followed by two reminders. We contacted 55 RECs via telephone in order to increase the number of complete managements boards (all members) in the sample. Results 94% of all respondents are male, the median age is 56 and more than 30% are retired. On average, they have at least 27 years of job experience. They are rather well qualified, with 60% holding a university degree. 45% of these degrees were obtained in engineering.

200
Session 24 - European energy security strategies More than a third has a vocational training, mostly in the banking sector. Although they devote on average 8 hours per week to their REC management work, 60% perform their duties on a purely voluntary basis without any compensation and only 7% perform their duties as their main paid job. The qualification profiles (structured by the eleven qualification areas) made clear, that overall, management board members’ qualifications, resulting from education and past job experience, are comparatively low in the fields of marketing and sales. With regard to future development, 44% of the surveyed managers state that their REC is planning for a change or a supplement of their current business model(s). The most favored approaches include direct sales of electricity to consumers and mobility related services like car sharing and electric vehicle charging stations. Surprisingly, more than ¾ think that the existing overall qualifications meet the requirements of new business models at least well. However, they rate their qualifications in the areas of marketing and sales clearly much lower than their overall qualification and the analysis of their education and past experience corroborates this. This weakness in marketing and sales could come into the way of realizing direct electricity sales in the future. Conclusions The results of our analysis will help to get a better understanding of the human capital that can be found in the management teams of RECs and of links between human capital and current business activities. It reveals potential human capital gaps such as skills in marketing and sales that prevent RECs from successfully entering new business models and give first hints on how to overcome these barriers.
References
Harnmeijer, J., 2016. Community Energyin the UK, 2016: The Beginning of the End? WWEA Quarterly
Bulletin, 2016, 36–39. http://www.wwindea.org/download/wwea_quaterly_bulletin/Bullletin_WWEA2016%EF%BC%8D01small. pdf (26 February, 2018).
Herbes, C., Brummer, V., Rognli, J., Blazejewski, S., Gericke, N., 2017. Responding to policy change: New business models for renewable energy cooperatives – Barriers perceived by cooperatives’ members. Energy Policy, 109, 82–95.
Kahla, F., Holstenkamp, L., Müller, J.R., Degenhart, H., 2017. Development and State of Community Energy Companies and Energy Cooperatives in Germany, Lüneburg.
Klagge, B., Schmole, H., Seidl, I., Schön, S., 2016. Future of German energy co-operatives. Raumforschung und Raumordnung, 74, 243–258.
Yildiz, Ö., Rommel, J., Debor, S., Holstenkamp, L., Mey, F., Müller, J.R., Radtke, J., Rognli, J., 2015. Renewable energy cooperatives as gatekeepers or facilitators? Recent developments in Germany and a multidisciplinary research agenda. Energy Research & Social Science, 6, 59–73
201
Session 24 - European energy security strategies
Ryan Brown ANTICIPATORY STRATEGIES FOR EASTERN EUROPEAN NATURAL GAS SECURITY
Ryan T. Brown, M.A.; M.G.P.S, 39 Quai Charles Page, 1205, Geneve, CH Countries asymmetrically dependent on the import of energy resources are potentially vulnerable to coercion from supplier states. Anticipating the potential for coercion, asymmetrically dependent states will make infrastructure improvements to substitute supply if the cost of these improvements is lower than the potential cost of coercion. This thesis provides a pricing framework for members of the European Union to estimate substitution strategies in order to reduce dependence on and the potential for coercion by Russia. Currently, Russia provides roughly 30% of the EU’s natural gas consumption and half of this gas is transported by pipeline through Ukraine. In 2006 and 2009, supply disruptions occurred due to a breakdown in negotiations between Russia and Ukraine, and some EU members responded by constructing the necessary infrastructure to substitute Russian gas transited through Ukraine. The infrastructure improvements employed by the EU and its member states are examined to provide a pricing framework for countries still asymmetrically dependent. These strategies include LNG import facilities, new pipeline construction, reversing the flow of existing pipelines, and adding natural gas storage. This thesis applies the pricing framework to Finland and Bulgaria to evaluate which strategies would be most effective in terms of cost and the provision of natural gas security. Further interconnection to the EU internal market is lowest in cost, but requires the cooperation of transit states in order to be effective. LNG import is reasonable in terms of capital expenditure and provides a viable short-term response to disruption, but the additional operating cost of LNG versus pipeline supply makes long term substitution via LNG too costly. Overall, countries can apply the pricing framework to evaluate their natural gas security and to reduce coercive vulnerability.

202
Session 24 - European energy security strategies
Maria Belka BELT & ROAD INITIATIVE: CHALLENGE OR CHANCE FOR THE EUROPEAN ENERGY SECURITY?
Maria Belka, Forschungszentrum Jülich, Germany
Overview Within the changing geopolitical situation, the concept of energy security is undergoing a rapid transformation. While the European Union created its Energy Union in order to enhance the European energy security level, the Chinese government under Xi Jinping established the major infrastructure project of the Chinese Belt & Road Initiative. Building up infrastructure via the economic belt on the land roads, as well as via the maritime road follows a dualistic approach. On the one side China supports the development of the Asian countries, especially in terms of their energy transition within the context of the Sustainable Development Goals. On the other side Chinas policy meets its demand of resources by focusing on the Middle East in contrast to the European Union´s ambitions within the same region. Methods From a (neo)realistic point of view a comparative foreign and security analyses is done. The main focus of this examination is the systemic level. First of all the foreign and security policy of China and the European Union is analyzed. Afterwards the energy security concepts are evaluated and the level of energy security for both is determined. Within this research energy security is defined via the dimensions of affordability, availability, reliability and sustainability (Sovacool 2012: 10). Due to the comparative approach the Belt & Road Initiative is analyzed under the European Union’s concept and claim of the strategic ellipse. Finally, the question if the Belt & Road Initiative is a chance or challenge for the European energy security is answered. Results In comparison of the Chinese ambitions concerning the Belt & Road Initiative and the European Foreign Energy Policy the region of the so-called strategic ellipse comes into focus. Here both players, China and the EU, are highly interested within this region. Most of all the resources of this area are important for the two states due to the similar circumstances concerning energy import dependency. Therefore the New Silk Road Project is a challenge as well as a chance for the European Union in the same moment. A chance most of all because the Chinese major project could lead to a more peaceful situation within the Middle East due to economic progress, energy access due to energy transition and political influence. Here the EU itself becomes more energy secure because of the higher degree of stability. Simultaneous, a challenge especially in terms of limited resources, political influence and governance mechanism caused by the lack of international energy governance. Conclusions Within the international system a lack of energy governance is obvious. In order to enhance the European Union’s influence within the Asian continent the G20 could be a measure to balance Chinas international power. Here first steps and ambitions are initiated through the G20 summits and declarations.

203
Session 24 - European energy security strategies Different common Action Plans are launched and will further developed even in the upcoming Argentina G20 summit. Here the European Union could use its normative soft power and also the Chinese ambitions in means of the creation of a more peaceful or at least stable situation within the Asian countries. References Sovacool, Benjamin K. (2011): Introduction: Defining, measuring and exploring energy security, in:
Sovacool, Benjamin (Ed.), Routledge Handbook of Energy Security, Abingdon, p. 1-42.

204

205
Papers

206

207
HEAT COST ALLOCATION: AN EVALUATION OF BENEFITS, ON THE BASIS OF ACTUAL OPERATIONAL DATA Giuseppe Dell’Olio, GSE S.p.A. Overview Advantages provided by heat control and cost allocation are well known. However, due to lack of operational data, numerical estimates of such advantages are difficult. This paper is based on numerous “real life” operation data, collected from a few tenths of collective heating installations. An evaluation of benefits yielded by heat control and metering is provided. Introduction Advantages provided by heat control and cost allocation are well known. Thanks to heat cost allocation, individual families, which have by now to directly sustain heating costs, are encouraged to heat rooms in their houses only when needed, namely when people are staying in them. Besides, where and when heating is in fact necessary, heat control devices prevent ambient temperature from raising too much. This twofold action limits unnecessary heat production and, as a result, fuel consumption and operational costs. However, to translate these benefits into figures and percentages is not easy, and only few papers (e.g. [1]) have so far reported numerical assessments on this subject, probably due to lack of operational data. This paper is intended to be a further contribution, with the advantage of being based on numerous “real life” data. Besides, a method is proposed to further increase the above benefits and to decrease, at the same time, overall installation costs. 63 methane-fired, central heating installations in apartment buildings have been examined: 51 are equipped with heat cost allocators. The above installations have been monitored for several years as a whole. Heat produced (kWh) and fuel consumed by each boiler have been measured. By weight-averaging those data, two indexes have been calculated: specific consumption and load factor. The above installations have been monitored for several years as a whole. Heat produced (kWh) and fuel consumed (Sm3) by each boiler have been measured. By weight-averaging those data, two indexes have been calculated: specific consumption and load factor. Separate calculations have been performed for installations equipped and, respectively, not equipped with heat cost allocators. Average specific consumption is simply the weight-average of specific consumptions (Sm3/kWh) of individual boilers during respective monitoring times. Load factor (denoted by “Fc”) can be defined both for each individual boiler, and for all the boilers taken as a whole (overall load factor). For each boiler, Fc is the ratio of heat (kWh) that was in fact produced during the monitoring time to maximum heat (kWh) that could have been produced. The latter (maximum heat) is in turn the product of boiler power (kW) times monitoring time (hours). The overall load factor is the weight-average of individual load factors, weights being the respective maximum heats that could be produced. If the overall load factor is high, boilers have been operated close to respective rated power. First, available data were checked for verisimilitude, based on climate zones. In climate zone E, where ambient temperatures are lower, it is reasonable to expect a higher load factor: boilers are operated for a longer time every day. According to our data, E zone load factor in fact exceeds that in D zone by 12-13 per cent. This is the case both with and without heat cost allocators (Table 2; Table 3).

208
Climate zone Heat cost allocators Average rated power (kW)
Average load factor (p.u.)
Specific consumption (Sm3/kWh)
D YES 344,08 0,15 107,44 E YES 183,6 0,17 104,88
Table 1 – Operation data of installation equipped with heat cost allocators;
comparison between climate zones.
Climate zone Heat cost allocators Average rated power (kW)
Average load factor (p.u.)
Specific consumption (Sm3/kWh)
D NO 264,2 0,22 102,03 E NO 277,2 0,25 93,62
Table 2 – Operation data of installation not equipped with heat cost allocators;
comparison between climate zones.
There is more. The longer the operation period of a boiler, the fewer the on/off cycles. A few heat losses are associated just to switching the boiler on and off. When the boiler is switched off, ventilation losses start to take place: the chimney draft causes an air flux to flow through the boiler (which is still hot) and to cool it. Heat removed from the boiler disperses into the atmosphere, which amounts to a heat loss (“stand-by losses”). As to ignitions, they are usually preceded by an air washing of the combustion chamber, which causes further cooling and heat loss (“start-up losses”). Based on the above, higher efficiency (or lower specific consumption) is to be expected in areas where the climate is colder. In this case, too, available data confirm expectations: in E zone, specific consumption is 0.92 times that in D zone for “non-allocation” case (a somewhat lower consumption also occurs in the “allocation” case). Verisimilitude of available data is confirmed by two circumstances, both predictable and reasonable: as climate gets colder, boilers are used for longer times (higher load factor) and more efficiently (lower consumption). This corroborates following analysis, where different behaviour of installation with and, respectively, without heat cost allocators is investigated. Results Installations equipped with heat cost allocators exhibit substantially lower load factors (minus 30-31 per cent, both in D and in E climate zone: see Tables 3 and 4) as compared to installations non-equipped with heat cost allocators. This confirms that heat allocation discourages unnecessary heat production. Besides this positive effect, however, heat cost allocation seems to increase specific consumption (plus 5 per cent in “D” climate zone; plus 12 per cent in “E” climate zone). Overall benefit turns out to be less than expected: fuel saving is lower than heat saving. This can be explained based on load factor. When load factor is low, stand-by losses and start-up losses are significant. In order to make the most of heat cost allocation, the above losses should be decreased. Both losses tend to increase with the volume of combustion chamber, and, as a result with the boiler rated power. In conclusion, for new installations, boilers with lower rated power should be chosen, all things being equal. Decreasing rated power, however, amounts to increasing load factor, feasibility of which should be investigated in the first place. The above results suggest that this is in fact possible; indeed, they provide an estimate of the power decrease that can be obtained.

209
Let us consider the maximum load factor (Fcmax) that a boiler can withstand. Fcmax is independent of heat cost allocation: boilers with heat cost allocations exhibit the same Fcmax as those without. Conservatively, Fcmax can be assumed to be equal to the highest Fc that was reached during operation: 0.22 in D climate zone (Table 3); 0.25 in E zone (Table 4). In conclusion, in the presence of heat cost allocators, Fc can be increased up to the value it would have without them. Conclusions Thanks to heat cost allocation, boiler capacity can be lowered in such a way as to bring load factor back to 0.22 (from 0.15), or to 0.25 (from 0.17), respectively. Capacity reduction is determined by the ratio of latter figure to former one, namely 30 per cent (approximately) in both cases. All things being equal, it is nowadays possible to choose boilers with 70 per cent capacity, as compared to those that were usually chosen in the past, when heat cost allocation was not common practice. This figure should be regarded just as a rough estimate, for two main reasons: it is relative to two climate zones only (D and E); it has been calculated as an average based on several installations: the individual characteristics of each installation are therefore neglected. The installation designer has the responsibility of adjusting the above figure, based on such individual circumstances as the characteristics of the building, its usage, climate zone etc. Therefore, current dimensioning criteria for boilers should be reviewed in order to take into account heat cost allocators, which are by now mandatory. This will provide a further , obvious advantage, in addition to those described above: a considerable reduction in overall installation cost. Assessments in the above text are based solely on the author’s personal opinions. References [1] S.Bergero, P.Cavalletti, M.Michelini, “Termoregolazione e contabilizzazione: convenienza economica
per zona climatica di unità immobiliare italiana tipo mediante aggregazione di dati campione”, in “La Termotecnica”, November 2016, pag. 58 (in Italian).
[2] Enrico Biele, Dario Di Santo, Giuseppe Tomassetti “Analisi dell'impatto delle valvole termostatiche sui consumi finali degli utenti collegati alle reti di teleriscaldamento dei comuni montani delle zone climatiche E ed F” Settember 2015 (in Italian).
.
TOWARDS RENEWABLE GAS. REGULATORY CHALLENGES Giuseppe Franco Ferrari, Professor of Constitutional Law, Department of Legal Studies, Bocconi University Íñigo del Guayo, Professor of Administrative Law, University of Almeria , Spain 1. Introduction Natural gas is a very important source of energy in the future energy of the European Union and Spain. In the transition to an electrified energy system, natural gas provides the security that wind and solar energy do not have. The combustion of natural gas produces less polluting emissions, hence offering advantages over other fossil fuels. Natural gas is an alternative already available in land, rail and maritime transport (such as liquefied natural gas, compressed or vehicular natural gas). Think of some municipal bus fleets that use vehicular natural gas. However, natural gas is a hydrocarbon, whose combustion contaminates. Natural gas must be replaced in the long term by a renewable gas, as a sustainable alternative for the gas industry. The natural gas industry (in Spain, Italy and in the European Union) must accelerate the process of technological innovation to find an accommodation in the energy model that is to be implemented in 2050. In that year the economy must be completely de-carbonized and must not be any emission of greenhouse gases into the atmosphere. Consequently, the demand for natural gas is to go down. Companies must change their strategies and lead the transformation of the industry towards renewable gas. This work aims to identify the regulatory and regulatory reforms necessary to promote the production of renewable gas, in all its forms (bio-methane, biogas and methane from renewable hydrogen or power-to-gas). The documents containing the formulation of the energy policy (in Europe, Spain and Italy) always refer to renewable gas. However, the forecasts contained in the European regulations are insufficient. The renewable gas industry needs to be promoted by regulation, but also channelled, because there are many unresolved legal issues. The absence of regulatory response to this incipient industry constitutes a hindrance. Norms must establish the responsibilities of the different subjects and establish the necessary support mechanisms. 2. Relevance of natural gas in the world Liquefied natural gas constitutes a sector in expansion in the present times. The United States and Australia have increased their production capacity and in the immediate future will continue to do so. The first of these two countries experienced the shale gas revolution, which has turned it into a net exporter. On the demand side, liquefied natural gas has become the resource used by several nations that perceive threats to their safety due to climate change. Growth has been spectacular in China and India. This is the case of Colombia, Panama or South Africa, to name just a few examples. Thus, in the face of phenomena such as El Niño, which reduce or eliminate rainfall, the generation of electricity through natural gas can provide the energy that hydroelectricity does not provide in those circumstances1. 3. The ultimate goal: a predominantly electrified energy system with renewable gas The current energy system is based fundamentally on the consumption of fossil fuels, such as coal and hydrocarbons (gas and oil). This energy industry is responsible for the majority of greenhouse gas emissions into the atmosphere. There is an international consensus around the need to de-carbonize the economy. It must be transferred to another predominantly electrified
1 World Energy Outlook 2018.
210 210

211
energy system, based on a massive installation of renewable energy production units, which places self-consumption, distributed generation and energy efficiency at the centre of the system. However, electrification is not the exclusive solution, nor the most efficient in all cases (economically and environmentally). For example, all transportation can’t be electrified: there are gas vehicles with a cost similar to conventional ones which, however, pollute much less, and their electrification would be very expensive; and there are industries that can’t be electrified, such as the steel industry. Not only the electric recharging points for vehicles, but also the "gas stations" should be promoted in the existing petrol stations (for example, in Spain there are 64 and in Italy around 1000). In short, the gas industry must be part of the solution. Electrification must be accompanied by gasification by means of renewable gas, suitably fostered. 4. The natural gas industry in transition towards the ultimate goal In the transition period towards an electrified electricity system, natural gas will have great relevance. Combined cycles are essential for renewables, because only with the support of natural gas are they manageable. Natural gas is the backup technology. Renewable energy is the most environmentally sustainable, but at present it does not provide the electrical system with all the necessary safety and quality. The only technology truly available to provide such safety and quality is the combined cycle of natural gas (CCCG). It guarantees at all times the regularity and quality of supply. In the United Kingdom, for example, coal power plants have been closed, which has been replaced by natural gas. In these transition years, it must be ensured that the CCCGs, as the ultimate guarantee of safety and quality of the entire electrical system, are adequately remunerated. 5. Natural gas as the fuel of the future After the transitional period, which will imply an increase in the volumes of natural gas, its consumption will decrease. Here arises the need for the gas to carry out its own transition, hand in hand with technological innovation. The gas industry must de-carbonize, to compete efficiently with renewable energies. This is the main challenge facing not only the industry, but also the governments of producer countries, companies, markets and consumers. An alternative that is increasingly relevant is the so-called renewable gas, which includes bio-methane, biogas and hydrogen from renewable sources2. Bio-methane and biogas can be obtained from organic waste (urban organic waste, dry manure and wet manure) 3. Biogas is a gaseous fuel produced from biomass and/or from the biodegradable fraction of waste (agricultural waste, sewage sludge or slurry) and can be purified to a quality similar to natural gas, for use as biofuel or wood gas (for that reason it is designated as a renewable gas). Something similar can be said about bio-methane (which can be obtained from agricultural or forestry biomass), but its purpose is to be injected into natural gas networks. The capture of bio-methane that the waste already produces and its injection into the network is a paradigm of the circular economy and contributes to the improvement of the environment. Renewable hydrogen has its origin in surplus electricity of solar or wind source. This technique is what is known in English as power-to-gas, which has become a key concept when
2 Strauch, S., Krassowski, J., Singhal, A., Biomethane Guide for Decision Makers. Policy guide on biogas injection into the natural gas grid, December 2013. 3 M. Roggenkamp, J. Sandholt y D.G. Tempelman, Innovation in the EU Gas Sector: Injection of Biomethane into the Natural Gas System, in Zillman, D., Godden, L., Paddock, L., Roggenkamp, M. (editors), Innovation in Energy Law and Technology: Dynamic Solutions for Energy Transitions, Oxford
University Press, Oxford 2018.

212
storing alternative energy4. This process converts excess electricity, from photovoltaic systems and wind turbines, into hydrogen. In combination with carbon dioxide, this hydrogen can be used to produce methane, which can then be stored and distributed in existing natural gas networks. The investigations are getting to optimize the process5, through the use of carbon dioxide derived from the production of biogas, which, combined with hydrogen (H2) obtained from excess renewable electricity, produces methane (CH4), which can not only be distributed easily and profitably in the network of natural gas, but it can also be stored for longer periods of time. While the production of bio-methane and biogas is limited, since it is able to replace only a part of the demand, hydrogen combined with renewable has an unlimited potential, obtained from water. In these three modalities (bio-methane, biogas and power-to-gas6), renewable gas is a renewable energy for all purposes and responds to the concept of circular economy, as it implies an adequate management of waste. There are already studies that have quantified the potential of renewable gas in the European Union in 2050. In that year it could be achieved a production of renewable gas equivalent to 122 billion cubic meters, from conservative calculations, 98 of which would be bio-methane and 24 of renewable hydrogen, from low-cost solar and wind energy (surplus). This estimate may increase if possible imports are considered (for example, Ukraine and Belarus could contribute 20 bcm of bio-methane annually). This increases the security of supply in Europe and strengthens the economy of rural areas. Those 122 billion cubic meters are allocated to those sectors where the greatest social savings can be, that is, heating and electricity generation. It is also assigned to the transport of heavy goods. The use of this gas in the existing infrastructure -intelligently combined with electricity from renewable sources- can lead to savings of 138 billion euros for the society (compared to a de-carbonization in which no entry is granted to the renewable gas). The low-carbon renewable gas, transported, stored and distributed with the current infrastructure, can help achieve a zero emission level in 2050, in an efficient way (because the use of the existing infrastructure allows the costs of the whole energy system to be significantly). Access must be given to third parties to that infrastructure, to obtain the full potential. This access must be transparent, equal and no discriminatory. The study starts from the premise that all gas produced in 2050 in Europe must be renewable and that the remaining consumption of natural gas must be combined with carbon capture and storage or permanent use7. 6. Energy Policy and regulation towards renewable gas 6.1 International aspects As for the efforts of the countries of the world to de-carbonize the economy, the most important instrument is the International Agreement reached in Paris on December 14, 2015, under the umbrella of the United Nations Framework Convention on Climate Change. The Agreement has important consequences for the European Union and for its Member States. Its main objective is to limit any increase in temperature to a maximum of 2 degrees Celsius
4R. Fleming and J. Fershee, The 'Hydrogen Economy' in the United States and the European Union: Regulating Innovation to Combat Climate Change, in Zillman, D., Godden, L., Paddock, L., Roggenkamp, M. (editors), Innovation in Energy Law and Technology: Dynamic Solutions for Energy Transitions, Oxford University Press, Oxford 2018. 5 See https: www.empa.ch 6 Götz, M. et al., Renewable Power-to-Gas: A technological and economic review, in: Renewable Energy, Volume 85, January 2016, pp. 1371-1390. 7 Executive Summary del estudio Ecofys. Gas for Climate. How gas can help to achieve the Paris Agreement target in an affordable way, en https://www.gasforclimate2050.eu/files/files/Ecofys_Gas_for_Climate_Feb2018.pdf

213
above pre-industrial levels8. The energy industry is the main responsible for the emissions of greenhouse gases, which are the cause, in turn, of global warming and climate change. If we don’t fight the increase in the temperature of the planet, the effects of climate change will be irreversible and devastating. The Paris Agreement has immediate practical effects in four areas: a) the reduction of CO2 emissions by the energy industry, b) investment in CO2 capture and storage technologies (including all support measures for sinks and reservoirs), c) the promotion of renewable energies and d) the promotion of energy efficiency and energy savings. The latest report of the IPCC (September 2018) gave an alarm signal because the temperature of the planet increases above the forecasts. Urgent changes are necessary. Renewable gas connects both with the objective of promoting renewable energies, and with the objective of promoting CO2 capture and storage techniques. 6.2 In the European Union Regarding the leadership of the European Union in the implementation of a sustainable energy model, the EU presented its plan for an Energy Union in 2015. This Union will guarantee a safe, affordable and climate-friendly energy and that Europe will become a sustainable, low carbon and environmentally friendly economy. The EU will lead the production of renewable energy (core of the new policy) and the fight against global warming. This will be achieved thanks to new technologies, an increase in energy efficiency measures and a renewed infrastructure. The objectives of the Energy Union are three: i) security; ii) efficiency (competitiveness); and ii) sustainability. Renewable gas can help achieve these three objectives. At the moment, given the incipient development of the industry, it only contributes to safety and sustainability, since it still can’t compete with natural gas9. Of the five dimensions of the energy policy of the Energy Union, four have to do directly with renewable gas:
i) Energy security that depends on solidarity and trust: to the extent that renewable gas is an indigenous source, it provides security to the system. Europe depends too much on fuel and gas imports. The need to diversify EU energy sources encourages the use of renewable energy sources, as well as the reduction of energy dependence of several Member States;
ii) Energy efficiency contributes to the moderation of demand: renewable gas implies a high degree of efficiency, as part of the circular economy;
iii) Decarbonizing the economy: renewable gas helps to suppress emissions of greenhouse gases into the atmosphere; and
iv) Research, innovation and competitiveness: the promotion of renewable gas implies a high investment in research and innovation. There are fifteen action points in the Energy Union. Point number thirteen refers to the goal of achieving 27% renewable energy penetration at the EU level by 2030. Along with this objective, the Energy Union also aims to reduce greenhouse gas emissions by 40%. % (in relation to 1990 levels) and a 32.5% improvement in energy efficiency. The coal will be replaced by gas (for electricity generation), oil will be replaced by gas (for heating) and in the transport natural gas vehicle and LNG will replace diesel. In the year 2050, the EU must be completely decarbonized.
8 21th session of the Conference of the Parties (COP 21) to the United Nations Framework Convention on Climate Change (UNFCCC) and the 11th session of the Meeting of the Parties to the Kyoto Protocol (CMP 11), Paris 2015. 9 “A Framework Strategy for a Resilient Energy Union with a Forward-Looking Climate Change Policy. Energy Union”, Communication from the Commission to the European Parliament, the Council, the European Economic and Social Committee, the Committee of the Regions and the European Investment Bank, COM (2015) 80 final, Brussels, 25 February, 2015.

214
In 2009, Directive 2009/28/ EC of the European Parliament and of the Council of 23 April 2009 on the promotion of the use of energy from renewable sources and amending and repealing two Directives of 2001 and 2003 was adopted10. This Directive was part of the so-called energy and climate package. For the Directive (Article 2, letter a), the nature of "energy from renewable sources" means landfill gas, wastewater treatment plant gases and biogas. Recital No. 12 underlines that the use of agricultural materials, such as manure and slurry, as well as other animal or organic waste to produce biogas, offers significant environmental advantages both in terms of heat and electricity production and to its use as biofuels. Its use represents an important potential for savings in terms of greenhouse gas emissions. In July 2018 an agreement was reached between the European Parliament, the Commission and the Council, concerning the 2017 Proposal for a Directive of the European Parliament and of the Council, for the promotion of the use of energy from renewable sources, to modify the Directive of 2009. On November 13, 2018, the European Parliament completed the approval of this Directive (together with other elements that make up the so-called winter package, such as the Directive that modifies the Efficiency Directive). The Directive was formally approved by the Council of Ministers at the end of 2019. The Directive establishes an object of penetration of renewable energies of at least 32% in 2030, with a revision clause in 2023. It improves the design and stability of the support schemes for renewables. It imposes a reduction and simplification of procedures. The level of ambition in transport and in the heating and air conditioning sectors increases and so does the sustainability criteria for the use of bioenergy11. Directive no. 2009/73/EC of the European Parliament and of the Council of 13 July 2009 on common rules for the internal market in natural gas and repealing Directive 2003/55/ EC refers to biogas12. Its Article 2, 1, establishes that the rules of the Directive in relation to natural gas, including LNG, are applicable in a non-discriminatory way to biogas and gas obtained from biomass or other types of gas as long as it is technically possible and secure to inject such gases into the natural gas network and transport them through it. The Directive calls on the Member States to adopt concrete measures that contribute to the wider use of biogas and gas obtained from biomass, with non-discriminatory access to the gas network for producers, provided that such access be permanently compatible with the technical standards and the relevant safety requirements. These standards must ensure that it is technically possible and safe to inject such gases into the natural gas network and transport them through it and must also consider their chemical characteristics. 6.3 In Spain and the region of Andalusia In the Spanish case, natural gas represents an essential aspect of the energy mix. Spain has lived one of its successful stories with natural gas. In the time between the Gas Protocol and the Gas Law of 1985 and 1987, respectively, and the present moment (2018), gas infrastructures have grown dramatically, gas consumption is already comparable to that of mature gas European countries with a longer gas tradition, and competition and security of supply increased simultaneously.
10 Directive 2009/28/EC of the European Parliament and of the Council of 23 April 2009 on the promotion of the use of energy from renewable sources and amending and subsequently repealing Directives 2001/77/EC and 2003/30/EC, OJ (2009) L 140/16. 11 Directive (EU) 2018/2001 of the European Parliament and of the Council of 11 December 2018 on the promotion of the use of energy from renewable sources (Text with EEA relevance): OJ L 238, 21.12.2018, p. 82. 12 Directive 2009/73/EC of the European Parliament and of the Council of 13 July 2009 concerning common rules for the internal market in natural gas and repealing Directive 2003/55/EC (Text with EEA
relevance): OJ L 211, 14.08.2009, p. 94.

215
The increase in the supply of liquefied natural gas, in relation to pipeline gas, has led to the creation of a gas hub (MIBGAS) that is contributing, little by little, since 2015, to the increase in liquidity and the determination of a reference price for traders. In a marginalist system of pool price formation, such as the Spanish one, companies which operate CCCGS incur in large losses, since they have an obligation to be available all the time and there are many regulated costs. Previously, payments for capacity and long-term investment incentives were received, but not anymore. If society wants security and quality, it must pay for it. There are 56 combined cycle power plants or CCCGs in Spain. All are necessary. Natural gas is necessary for the storage of electricity (in Spain, some 5500 MW of natural gas must always be available). There are fourteen coal plants in Spain, but nine of them have not made the necessary investments to reduce emissions and must close before June 2020 (the rest do not have much time left). At that time, natural gas will increase its importance even more. In these transition years, it must be ensured that the CCCGs, as the ultimate guarantee of safety and quality of the entire electrical system, are adequately remunerated, since combined cycles generate losses at present and the proprietary companies have had to face severe contracts with take clauses -or-pay. To that end, the toll system must be improved, so that natural gas is not penalized. A system must be established that recognizes the value of the investment. Regarding the Spanish regulation on renewable gas, it is necessary to refer, first of all, to Act no. 34/1998, of October 7, of the Hydrocarbons sector13. Due to need to transpose requirements of the 2009 European Directive on the internal market for natural gas, the Act refers to biogas. This mention was introduced in the Act through Royal Decree-Law no. 13/2012, of March 30. Art 54 of the 1998 Act is limited to saying that gaseous fuels are natural gas and its specialties liquefied natural gas and compressed natural gas, manufactured or synthetic combustible gases, where one can distinguish between: I) mixtures of natural gas, butane or propane with air; ii) biogas and/or any other gas obtained from biomass; iii) any other type of manufactured or synthetic fuel gas or fuel gas mixture with air. Norms established in the 1998 Hydrocarbons Act in relation to natural gas are also applied, in a non-discriminatory way, to biogas and gas obtained from biomass or other types of gas provided it is technically possible and safe to inject such gases in the natural gas network and transport them through it. For these purposes, the composition requirements of these gases have to be established in order to guarantee the safety of people, facilities and consumer equipment as well as the correct conservation thereof. Since 2012, the Hydrocarbons Act establishes that companies which supply natural gas, biogas or manufactured gases to be used as fuel, in service stations are considered as the final consumer, provided they are supplied by a supplier. Facilities destined to this purpose, must meet the technical and safety conditions legally required. There is another applicable regulation, such as Act no. 22/2011, of July 28, on waste and contaminated soil14. Article 2, 2, of the Act states that it doesn’t apply to waste water. It is also not applicable to the animal by-products covered by Regulation no. 1069/2009, of the European Parliament and of the Council, of October 21, 2009, by which the sanitary norms applicable to the animal by-products and the derived products not destined for the human consumption are established and by which Regulation no. 1774/2002 is repealed. The Waste and Contaminated Soil Act 2011 is not applicable to these two types of waste (wastewater and animal by-products) in the aspects already regulated by another regional or national regulation incorporating EU norms into our legislation. However, Article 2, 2, of the Waste and Contaminated Soil 2011 clarifies that animal by-products and their by-products, when they are destined for incineration, landfills or used in a biogas or composting plant, aren’t included in said exception, and therefore are regulated by the 2011 Act. 13 BOE no. 241, 8.10.1998. 14 BOE no 181 29.07.2011

216
The Preliminary Draft Act on Climate Change and Energy Transition begins with a reference to the special report of the Intergovernmental Panel on Climate Change published on October 8, 2018. In this report, an unequivocal call to action is made. In accordance with Article 13 of this Preliminary Draft, the Government is empowered to approve mechanisms to support bio-methane, hydrogen and other synthetic fuels whose production has exclusively used raw materials and renewable energy. They must be financed with the regulated revenues of the natural gas sector within the limits determined by regulation. This Article 13 also enables Government to approve support mechanisms and regulations that allow the injection of renewable gases into the natural gas network. Regarding the Andalusian regulations with an impact on the generation of renewable gas, we can highlight the following three legal norms in Andalusia: a) Act no. 2/2007, of March 27, for the promotion of renewable energy and energy saving and efficiency in Andalusia15; b) Decree-Law no. 2/2018, of June 26, on the simplification of regulations on energy and promotion of renewable energies in Andalusia16; and c) Act no. 8/2018, of October 8, on measures against climate change and for the transition to a new energy model in Andalusia17. 6.4 In Italy Since 2013, thanks mainly to direct public incentives, renewable energy sources have become a major component in the national energy grid. In 2016 the Italian energy demand was met for 19.6% by energy produced from renewable sources, an increase compared to 2015 (19.33%), but a decrease compared to 2014 (20.89%). These data are in line with the European average, which, in fact, has a rate of consumption of renewable energy reaching 16.7% of the gross final consumption18. With regard to the national production of renewable energy, in 2016 it increased by 2.8% compared to 2015. In 2015, however, there was a decline in production of 3.7% compared to 2014. Lastly, in 2016, imports of renewable energy fell by 9.8% compared to 2015. The negative trend in imports of renewable energy is therefore confirmed. Renewable energy sources are used in Italy mainly for the production of electricity (electrical sector) and for the production of heat (thermal sector). There are solid, liquid or gaseous biomass plants in 4,114 Italian municipalities. Solid biomass plants are mainly localized in the northern and central Italian regions. In southern Italy, these plants are mainly located in coastal areas, as biomass if often shipped from abroad. On the other hand, the distribution of biogas plants is homogeneous on the Italian peninsula. However, the areas of greatest concentration are the Po Valley and Trentino Alto Adige19. The renewable energy regulation finds its basis in the legal regime established by the Constitution on environment and energy. The energy sector and its development is influenced by the Italian regional system, and the related distribution of competences between Regions and State. Alongside a unified national legislation, regional provisions have indirectly influenced the energy sector, especially on the side of renewable energy (the reference is to the regional laws on the protection of the landscape and territory, which may limit or completely avoid the installation of bioenergy production plants), which often have not passed the scrutiny of the Constitutional Court, considering that art. 117 of the Constitution assigns to the State the legislative competence about energy.
15 BOE no 109 7.05.2007. 16 BOE no 127 3.07.2018. 17 BOE no 269 7.11.2018. 18 Eurostat: http://appsso.eurostat.ec.europa.eu/nui/show.do?dataset=nrg_ind_335a&lang=en. 19 Legambiente (a cura di), with GSE and ENEL, Comuni rinnovabili 2017, giugno 2017, 98 ss.: http://www.comunirinnovabili.it/wp-content/uploads/2017/06/Rapporto_2017.pdf.

217
In the Italian legal system, regulatory measures in the renewable energy sector, including biogas, can be dated back to 2003, when legislative decree n. 387 implemented directive n. 2001/77/EC, on the promotion of electricity produced from renewable energy sources in the internal electricity market. The decree introduced the definition of "renewable energy sources", referring to renewable non-fossil energy sources (wind, solar, geothermal, wave, tidal, hydropower, biomass, landfill gas, sewage treatment plant gas and biogases), and to biomass as the biodegradable fraction of products, waste and residues from agriculture (including vegetal and animal substances), forestry and related industries, as well as the biodegradable fraction of industrial and municipal waste. The main purpose of d.lgs. 387/2003 was to promote the use of renewable Energy, introducing support schemes for the related supply chain. Biogas received specific attention, as, according to article 5, the Ministry of Agriculture was delegated to adopt a decree in order to define the criteria for the allocation of the incentives. Legislative decree n. 128/2005, which implemented directive n. 2003/30/EC, later extended the regulatory powers of the Ministry to the adoption of support schemes for the cultivation of crops used for the production of biofuels and other renewable fuels. The described powers were never exercised. In 2010, it was the Ministry of the Economic Development to start a new renewable energy policy, approving the "Italian National Renewable Energy Action Plan"20. Complying with article 16 of directive n. 2009/28/EC, the Plan prescribed that biogas should be integrated into the national natural gas network, according to legislative decree n. 164/2000, which provides that gas produced on the national territory may for no reason be denied access to the grid. The specific discipline on support schemes for renewable energy, and biogas in particular, was later introduced by legislative decree n. 28/2011, which implemented directive 2009/28/EC, adopted in order to comply with the guidelines of the Commission communication of 10 January 2007 entitled ‘Renewable Energy Roadmap — Renewable energies in the 21st century: building a more sustainable future’, that demonstrated that a 20 % target for the overall share of energy from renewable sources and a 10 % target for energy from renewable sources in transport would be appropriate and achievable objectives, and that a framework that includes mandatory targets should provide the business community with the long-term stability it needs to favour rational, sustainable investments in the renewable energy sector, capable of reducing dependence on imported fossil fuels and boosting the use of new energy technologies. Those targets are achievable to the context of the 20 % improvement in energy efficiency by 2020 set out in the Commission communication of 19 October 2006, entitled ‘Action Plan for Energy Efficiency: Realising the Potential’, which was endorsed by the European Council of March 2007, and by the European Parliament in its resolution of 31 January 2008 on that Action Plan. On one hand, legislative decree n. 28/2011 simplified the authorizing procedures for the installation of plants for the production of renewable energy and, on the other, it introduced new support schemes for the production of energy from renewable sources. In 2013, the new “National Energy Strategy”21 published by the Ministry of Economic Development, was aimed at a sustainable development of renewable energy. Italy intends to exceed the European renewable production targets (20-20-20), contributing to the reduction of emissions, and to achieve the objective of energy security. In doing so, however, the Ministry acknowledged the importance to limit energy bills, which burdens on businesses and families, setting the level of incentives at European values. It was established to concentrate resources on the development of the most virtuous technologies and on the sectors with greater returns in
20 Available in Italian at: https://www.gse.it/Dati-e-Scenari_site/monitoraggio-fer_site/area-documentale_site/Documenti%20Piano%20di%20Azione%20Nazionale/PAN%20DETTAGLIO.pdf 21 Available in Italian at: https://www.sviluppoeconomico.gov.it/images/stories/normativa/20130314_Strategia_Energetica_Nazionale.pdf

218
terms of environmental benefits and on the national economic chain (in this sense, particular attention was payed to recycling and waste exploitation). For the first time, the government acknowledged the importance of developing an efficient biofuel supply chain, in order to comply with the 20 20 20 key targets. In particular, the European target for the use of renewable energy sources in the transport sector is 10% by 2020, and the main instrument provided by the legislation in order to achieve the goal is the obligation, imposed on the parties that sell fuel on the national market, to place a certain share of biofuels on the same market (mainly biodiesel, bioethanol and its derivatives, ETBE and bio-methane or bio-hydrogen). The obligation had been introduced since 2006 by d.l. 2/2006, aiming at implementing urgent measures for the agricultural sector. Again on the legislative side, a decree was approved in 2014, aiming at extending to bio-methane production plants the simplified authorizing regime provided for other renewable energy installations. In 2017, the Ministry of Economic Development approved the new “National Energy Strategy”22, which examines the experience of support schemes adopted in force of legislative decree 28/2011 (and subsequent ministerial decrees) and tries to implement more efficient policies. With regard to the existing bioenergy plants, the document remarked that these sources represent a peculiarity in the renewable energies panorama. In fact, unlike other forms of energy, bioenergy is characterized by high variable costs, mainly due to the costs of raw materials, which result in the request to maintain high incentives even after amortization. For that reason the 2016 financial law extended to 2021 the support schemes for the production of electricity from renewable sources (biomass, biogas, bio-liquids). The sector therefore expresses a request for a virtually constant and apparently non-reducible public incentive, even in cases where the raw material should come from agricultural self-production. In order to reduce the burden of system costs in the bill and avoid treatments that do not stimulate efficiency, the Government acknowledged that it is necessary to reduce the incentives for existing bioenergy, since the variable cost of the raw material does not give signs of reduction over time, and indeed it probably remains high because of incentives. For that reason, the “National Energy Strategy” considers that further development of medium and large size bioenergy installations for the production of electricity is not anymore required. However, there should be the possibility to convert existing plants in order to benefit of new support schemes for the production of bio-methane to be used for transport. In fact, the new strategy aims at assessing the potential of bio-methane, which can efficiently convert biogas to biofuel for the transport sector, replacing other imported biofuels without additional burdens for consumers. Bio-methane can already count on a potential, estimated on the basis of biogas electricity production, of about 2.5 billion cubic meters, with an estimated maximum growth potential equal to 8 billion by the year 2030. In order to implement the growth policy for bio-methane, on the 2nd of March 2018, the Ministry of the Economic Development approved a decree on the promotion of bio-methane and of other advanced biofuels for the transport sector. The decree defines bio-methane as the fuel obtained from biogas (that can also be obtained from the organic fraction of solid urban waste) which, following the appropriate chemical-physical treatments or through the processes of methanation of hydrogen obtained from renewable sources and the CO2 present in the biogas, is suitable for the introduction into the gas network and for the use in the transport sector. If the bio-methane complies with the technical requirements provided by the Authority for the Regulation of Energy, Networks and Environment (ARERA), it can have access to the grid.
As said, the mechanism of incentives is strictly connected to the obligation to place a certain share of biofuels on the market for the operators of fuel for transport sector, according to different minimum rates for biofuels, advanced biofuels and other advanced biofuels other 22 Available at: https://www.sviluppoeconomico.gov.it/images/stories/documenti/Testo-integrale-SEN-2017.pdf

219
than bio-methane. In order to comply with the obligation, these operators may buy the so called “CIC”s (Certificates of release for consumption), which are issued to the producers of bio-methane. A particularly favourable regime is granted to advanced bio-methane (which is produced from specific sub products listed in annex 3 of d.m. 10.10.2014), that can be directly acquired by the GSE (Manager of energy services – a public company controlled by the Treasury) for the maximum amount allowed by the Ministry of the Economic Development. The same incentives are granted in case of conversion to bio-methane production of plants previously used for the production of electricity from biogas.
7. Conclusion The main conclusion is to point out that there are no adequate regulatory measures in the European Union (support and promotion, and control and supervision) for renewable gas to become a reality in the energy supply. A regulatory framework must be established allowing the natural gas industry to move properly from the current situation to the situation forecast by the year 2050, where a zero level of polluting emissions must be achieved. A new regulatory framework must be set up such to help the natural gas industry to find an accommodation in a de-carbonized energy system. In this way, renewable gas must go from being a source of energy merely mentioned in the standards, to being a source of energy actually used in significant proportions.

220
DECARBONISING THE GAS SECTOR: IS RENEWABLE GAS A SERIOUS OPTION? Andris Piebalgs, Maria Olczak, Florence School of Regulation Highlights
Today, natural gas provides one quarter of the EU’s energy supply. The EU has a well-developed gas network and skilled people to operate and trade the gas. Using natural gas as a fossil fuel produces significant GHG emissions. Because of that the gas sector should engage in the EU’s decarbonisation efforts. One of the most politically acceptable and economically viable ways to decarbonise the gas sector is to inject renewable gas into the existing gas networks.
The EU has considerable experience in the production and use of renewable gas. The current schemes have mostly supported its use on the spot, mainly for electricity generation, and only a small share has been injected into the gas grid. The experience of the injection has been positive and in most cases increases the value of using renewable gas. However, the considerable increase of renewable gas production is not possible without concrete political support and addressing the cross-border issues stemming mainly from the differences in national legislation on gas quality.
Policy instruments for renewable gas support. The recast of the Renewable Energy Directive (2009/28/EC) provides for positive development of renewable gas, however it still falls short of meeting the gas sector’s decarbonisation challenge.
To enable a real change a target for renewable gas in the European gas grid for 2030 should be established, indicative trajectory designed and the Energy Union’s governance procedure used to undertake corrective actions, if necessary.
The renewable gas support schemes should encourage the production of the renewable gas with one of the goals regarding its injection in the gas grid.
Dealing with obstacles to cross-border trade. The Network Code on Interoperability and Data Exchange rules seems satisfactory to avoid cross-border trade restrictions resulting from the gas quality differences.
EU benchmarks on odorization and control processes should be established to facilitate cross-border trade.
Harmonisation of the Guarantees of Origin (GoO) certification system should facilitate the uptake of renewable gas in the grid.
1. Introduction The spring of 2017 marked ten years since European leaders reached an agreement on climate and energy objectives. The adoption of the so-called 20/20/20 targets, which were based on three pillars – the reduction of GHG emissions, deployment of renewable energy and energy efficiency – began a new chapter in the European Union’s climate and energy policy. Ten years on, the Union en bloc is well on track to meet those objectives, with 17 Member States having already met their national targets in all three areas1 Nevertheless, achieving the 2030 and subsequent targets is proving to be a bigger challenge.

221
In order to meet the Paris Agreement objectives, the EU is required to reduce its emissions by 80-95% by 2050. This implies that the EU energy system, and necessarily the gas system, need to be decarbonised over the course of next three decades. However, today the generation of 1 MWh of electricity from natural gas produces 200 kg of CO2, and overall the current level of gas consumption creates more than 700 MtCO2e emissions2. At the same time, for security of supply and market integration purposes the EU continues to support, and in some cases to finance, the construction of the new natural gas infrastructure. The latest list of the Projects of Common Interests (PCIs) proposed by the European Commission in November 2017 includes 173 PCIs, of which 53 are gas projects3
The list prompted vocal opposition, on the grounds that the continued spending on fossil fuels infrastructure is in conflict with EU climate policy objectives4 and may lead to the problem of stranded assets5 The argument that natural gas is a cleaner alternative to other conventional fuels and may serve as a back-up to intermittent renewable power production is being questioned, especially in the long-term perspective6 The current models for the future role of gas in the EU energy system anticipate a steady gas demand. The CEER Report ‘Study on the Future Role of Gas from a Regulatory Perspective’ even in the low demand scenario case expects a demand of more than 400 bcm in 20357. That makes a gas sector decarbonisation a real challenge. The options for the decarbonisation could be CCSU (Carbon Capture Storage and Use), increased use of renewable gases in place of natural gas, and carbon offsets by other actions (forestation etc.). An additional challenge is that measures taken shouldn’t undermine the internal gas market functioning. From a political acceptability point of view, the increased use of renewable gases seems the easiest option for gas system decarbonisation. By the term ‘renewable gas(es)’, known also as green gas, the authors understand: biogas and biomethane produced via anaerobic digestion, synthesis gas (syngas) generated through gasification and hydrogen and synthetic methane created via Power-to-Gas (P2G)8. This paper is structured as follows: the first part provides an overview of the EU experience with renewable gas and the projected potential of renewable gas production in 2030 perspective. In subsequent sections, the authors explain the major policy and cross-border barriers preventing the penetration of renewable gas in the EU energy mix. In the context of the current discussion on the role of gas in the future EU energy mix, this paper proposes some
_____________________ 1. See: European Environment Agency, Trends and projections in Europe 2017. Tracking progress towards Europe’s climate and energy targets. EEA Report, No 17/2017, p. 14. 2. ENTSOG Ten-year network development plan (TYNDP) 2017. Main report., p. 90 and p. 92. 3. Commission Staff Working Document accompanying the document Commission Delegated Regulation amending Regulation (EU) No 347/2013 of the European Parliament and of the Council as regards the Union list of projects of common interest. C(2017) 7834 final, p. 2. 4. Claude Turmes, ‘The future of gas is not fossil but green’, Euractiv, 20 February 2018. 5. Danila Bochkarev, ‘“Projects of Common Interest”, or waste of public resources?’, Euractiv, 8 February 2018. 6. Jonathan Stern, The Future of Gas in Decarbonising European Energy Markets: the need for a new approach, OIES Paper, NG 116, p. 6. 7. CEER “Study on the Future Role of Gas from a Regulatory Perspective”, Ref: C17-GPT-04-01, 6 March 2018, pp. 54-55. 8. Green Gas. Facilitating a future green gas grid through the production of renewable gas. IEA Bioenergy Task 37, 2018:2, p. 5.

222
ways in which, according to the authors, renewable gas penetration in the EU’s gas market might be boosted that will be followed by conclusions. 2. Renewable Gas Experience in the EU Renewable gas is still a marginal energy carrier in Europe, accounting for 4% of the entire gas market in the European Union9. Moreover, the pace of growth of renewable gas production has been gradually declining since 2011 (22.4% in 2011, 17% in 2012, 14.3% in 2013, 7.3% in 2014, 4.2% in 2015 and 3% in 2016). Most renewable gas is produced in the form of biogas and is used locally to generate heat and power. However, between 2011 and 2016 biogas electricity generation has almost doubled from 35.9 TWh to 62.5 TWh. The majority of biogas (74.1%) is produced via an anaerobic digestion process from non-hazardous waste and raw plant matter. The rest is landfill biogas and gas from wastewater treatmentplants. Only a small part has been upgraded to biomethane and injected into the gas grid10. Some EU Member States, such as Germany, Italy, France, the UK and Scandinavian countries have accumulated ample experience in the production and use of green gases. The utilisation of green gas has demonstrated additional benefits to low level of GHG emissions – empowerment of local communities, job creation in rural areas, and the reduction of emissions in agriculture. Biogas can be derived from various, locally-available feedstock. It is fair to say that the experience of renewable gas has shown that its production and use has clear environmental and social benefits11. There are many reasons why the penetration of renewable gas is so limited. Most importantly, so far, renewable gas has been seen as a marginal renewable energy source, mainly as a form of support to rural communities. The task has never been to decarbonise the whole gas sector. Technology challenges are not fundamental, apart from the technologies involved in transforming woody biomass into green gas and Power-to-Gas that need additional investments to improve the cost/value performance. The question of feedstock is also important, especially given the difficult experience with biofuels12. Complicated administrative procedures delayed or cancelled some of the planned investments. Low carbon price and inconsistent support policy is also to blame13. At this stage, cross-border issues played a limited role, but there is already a case that demonstrates a need to cross-border challenges, which could hamper penetration of the renewable gas. As a result, at this stage it is nearly impossible to forecast the share of renewable gas in the overall gas consumption for 2030. In general, long-term gas demand scenarios do not recognise renewable gases14. Some experts have suggested it could grow to 12-14%, but also that it could stay at the current level of 4%. _______________________ 9 Frédéric Simon, Gas lobby chief: ‘In 2050, 76% of gas could be renewable’, Euractiv Special Report, 25-30 October 2017. 10 Biogas Barometer 2017. EurObserv’ER, 2017. Available at: <https://www.eurobserv-er.org/biogas-barometer-2017/> (consulted on 03/04/18). 11. For more information see: ECOFYS Study: Gas for Climate. How gas can help to achieve the Paris Agreement target in an affordable way, 15 February 2018, pp. 16-19. 12 A.K.P. Meyer, et al., Future European biogas: Animal manure, straw and grass potentials for a sustainable European biogas production, Biomass and Bioenergy (2017). 13 CE Delft, Eclareon, Wageningen Research Study: Optimal use of biogas from waste streams. An assessment of the potential of biogas from digestion in the EU beyond 2020, December 2016, pp. 22-29. 14 One of the exceptions is ENTSOG Ten-Year Network Development Plan 2018. In the recently published ENTSOs TYNDP 2018 Final Scenario Report, the share of green gas ranges from 4.5% to 14%, depending on the scenario analysed. In all cases, ENTSOs expect strong biomethane development and that biomethane will form the lion’s share of the green gas supply, pp. 14-15.

223
The willingness and the direction of the support for the renewable gas installations in EU Member States will play an important role in the growth of renewable gas production. In March 2018, the European Commission approved a EUR 4.7 billion public support scheme for advanced biomethane and biofuels in Italy. The scheme will incentivise farmers to produce biomethane from manure and other residues originating from their farming activities and to use it in turn to power their agricultural machines and vehicles15. In France the objective is to inject 8 TWh of biomethane into the gas grid in 2023, which is forty times the amount injected in 2016. In 2015 the adopted Energy Transition Law for Green Growth expects that renewable gas will provide 10% of France’s energy mix by 2030. The production should reach 30 TWh. The ADEME (French Agency for the Environment and Energy Management) has found that the first injection experiences in the French network are positive. Biomethane injection units are rapidly reaching expected production and reliability levels16. Economic viability is guaranteed for sites with good technical performances thanks to the feed in tariffs (guaranteed for 15 years). IRENA (International Renewable Energy Agency) in its study ‘Renewable Energy Prospects for the European Union’ recognises that biogas represents an interesting alternative for the future supply of renewable energy, and that it could be the solution for flexible power production and an option for the decarbonisation of the natural gas sector17. Nonetheless, it emphasises that ‘The existence, stability and reliability of the policy framework and support schemes appears to be the number one driver in all countries. National targets and goals also are identified as an important driver for the sector’18. In IRENA’s analysis, the EU could double the renewable energy share in its energy mix, from 17% in 2015 to 34% in 2030 in a cost-efficient way using today’s technologies19. The main drivers with strong cost savings are wind, solar and solar thermal sectors, the use of biomass in power and district heat requires additional costs. Interestingly the study does not consider the intermittency of the renewable electricity as an important challenge. It believes that by strengthening the grid and improving congestion management there should be no major problems. As a result, the study does not mention Power-to-Gas related issues. The analysis of the experience of the EU in the production and use of renewable gas shows that in the business-as-usual scenario we cannot expect substantial penetration of green gas in the EU energy mix. 3. Policy Issues The penetration of renewable gas on the European level has been guided by the Directive on the promotion of the use of energy from renewable sources20. European legislators are finalising the recast of this directive, which will guide the penetration of the renewable energy sources in the EU’s energy mix in the period after 202021. ______________________ 15 State aid: Commission approves €4.7 billion public support scheme for advanced biomethane and biofuels in Italy, European Commission – Press release, 1 March 2018. 16 Etude ‘Un mix de gaz 100 % renouvelable en 2050 ?’, conduite par l’ADEME en collaboration avec GRDF et GRTgaz, January 2018. 17 IRENA in cooperation with the European Commission, Renewable Energy Prospects for the European Union, February 2018. 18 Ibid., p. 47. 19 Ibid., pp. 19-22. 20 Directive 2009/28/EC of the European Parliament and of the Council of 23 April 2009 on the promotion of the use of energy from renewable sources and amending and subsequently repealing Directives 2001/77/EC and 2003/30/E. 21 Review of the Renewable Energy Directive 2009/28/EC to adapt it to the EU 2030 Climate and Energy Targets. In: European Parliament Legislative Train Schedule (consulted on 10/04/2018).

224
There are many elements in the recast that could support stronger penetration of the renewable gas in the energy mix. The share of the renewable energy sources should reach at least 27% in the final energy mix by 203022. Administrative obstacles to build and operate RES installations will be substantially reduced with the creation of the ‘one-stop-shop’ for permit granting processes (Art. 16). Moreover, yearly targets to increase minimum annual shares of the renewable energy sources in heating and cooling and transport will be introduced (Art. 23). Changes in the targets for biofuels will favour an increased amount of feedstock to renewable gas (Art. 26). There are also gas specific articles, demanding transparency and nondiscrimination in connecting renewable gas sources to the gas network and calling Member States to evaluate the need to extend their grids for the integration of the renewable gas (Art. 15). What is more, the proposed extension of Guarantees of Origin (GoO) to cover renewable gas could facilitate greater cross-border trade (Art. 19). There aren’t any country-specific binding targets. Member States should define their contribution to the achievement of the overall EU target as part of their Integrated National Energy and Climate Plans. The risks of this approach are that opportunities created for the production and use of the renewable gas won’t be used and there will be parallel development of the renewable sector and natural gas sector without the decarbonisation of the latter. Such a development would be evidently more expensive for society as a whole. Additional risk comes from patchy developments of the decarbonisation of the renewable gas sector, which will impact the functioning of the internal energy market for gas. It seems that the decarbonisation effort of the gas sector with the use of renewable gas should be more organised compared with the general approach to the increased use of renewable energy. The governance process set out in the respective Regulation23 could be used to agree on the soft targets for the share of the renewable gas in the gas grid. Taking into account the current development, the conservative target could be 12% of renewable gas in the EU gas network in 2030. After agreeing the target one could also anticipate the trajectory of this target. The use of governance procedure monitoring could be established and corrective actions taken. Even if the approach seems to be very top-down, it has been the best means of moving the EU’s policies and targets forward. The success of ‘20-20-20’ by 2020 is a good example. The non-binding nature of the approach could encourage the political support on the part of the Member States. It would be a mistake not to use the EU’s well-developed gas grid, worth more than EUR 400 billion, to reach climate objectives24. The serious decarbonisation in the supply chain could help to avoid costly investments in the final use and provide for customers’ comfort, as they will be able to use gas, which they were using for years, to satisfy their energy needs. ____________________________ 22 European Commission, Proposal for a Directive on the promotion of the use of energy from renewable sources (recast), COM(2016)767. 23 Proposal for a Regulation of the European parliament and of the Council on the Governance of the Energy Union, amending Directive 94/22/EC, Directive 98/70/EC, Directive 2009/31/EC, Regulation (EC) No 663/2009, Regulation (EC) No 715/2009, Directive 2009/73/EC, Council Directive 2009/119/EC, Directive 2010/31/EU, Directive 2012/27/EU, Directive 2013/30/EU and Council Directive (EU) 2015/652 and repealing Regulation (EU) No 525/2013. 24 A. Bressand, Renewable gases: The EU energy transition context and some questions to bear in mind, presented at the FSR Policy Workshop ‘The Renewable Gas Complex and the European Path to Decarbonisation’ (9 April 2018, Florence).

225
Looking from the consumers’ perspective, the use of hydrogen and synthetic methane generated through Power-to-Gas technology is promising25, even if today’s experience is mostly based on biogas. The ADEME 2016 study concludes that hydrogen produced from renewables could provide a serious contribution, in particular in transport and storage26. Also fertiliser production could be based only on the use of ‘green’ hydrogen. The hydrogen can compete with other technologies, since it provides a similar user experience to already available technologies, with lower impact on the environment, yet it is still too costly27. If hydrogen is to play an important role in greening the gas grids, innovation and technological advancement will be needed to reduce the costs. There are factors beyond the gas sector like the availability of biomass, availability of green electricity and technological development in Power-to-Gas and woody biomass to gas processes, but even now quite a few measures could be used to provide predictable support for having more renewable gas in the existing gas networks. Favourable tariffs can be set for the renewable gas injected into the natural gas network. Favourable connection procedures could be set for the renewable gas transport to the gas network. It is particularly important to note that research indicates that today’s tendency to use biogas for the local electricity production is less efficient compared with the production of biomethane28. Budzianowski demonstrates that biomethane feed-in-premium at a level of 0.03 EUR2015/kWhf is sufficient to effectively support biomethane production. The lessons learnt from the renewable electricity support schemes demonstrate that the state aid granted to renewable energy projects must be limited to the ‘minimum necessary’ for the investment to take place and the potential reduction of investment costs must translate into lower subsidies29. On the other hand, the investors need to acknowledge the inherent risk resulting from the fact that the public support schemes are not immune to the business cycle and that the reduction of subsidies, even retroactive, is always possible. That is why the poten-tial support schemes for renewable gas must be carefully designed and the investors need to assess the guarantees provided by governments. 4. Cross-Border Issues Renewable gas, when injected into the natural gas grid, shouldn’t create additional challenges for the internal gas market. The First ACER Implementation Monitoring Report of the Network Code on Interoperability and Data Exchange signals the first problem case regarding the exchange of biomethane between the Danish and German networks30. ________________________ 25 Hydrogen is produced via electrolysis (electric current is used to split the molecules of water into hydrogen and oxygen). If the hydrogen is generated from renewable electricity, it is known as ‘green hydrogen’, in contrast to ‘blue hydrogen’ (involving the use of CCS technology) and ‘grey hydrogen’, both obtained from fossil sources. 26 Fiche technique, L’hydrogène dans la transition énergétique, ADEME, March 2018. 27 P. Dodds, Hydrogen markets and challenges, presented at the FSR Policy Workshop ‘The Renewable Gas Complex and the European Path to Decarbonisation’ (9 April 2018, Florence). 28 W. Budzianowski, D. Budzianowska, Economic analysis of biomethane and bioelectricity generation from biogas using different support schemes and plant configurations, Energy (2015). 29 V. Parail, Lessons from the renewable electricity transition, presented at the FSR Policy Workshop ‘The Renewable Gas Complex and the European Path to Decarbonisation’ (9 April 2018, Florence). 30 First ACER Implementation Monitoring Report of the Network Code on Interoperability and Data Exchange, 4 December 2017, pp. 18-19.

226
Biogas is naturally rich in sulphur and as a result it is quite corrosive. Before the biogas becomes biomethane and is injected into the gas grid, it undergoes the process of the desul-phurisation, which consists in the use of oxygen. As a result, the biomethane is low in sulphur, but contains oxygen. This becomes an issue when the biomethane produced in Denmark crosses the border to Germany as the German national gas quality standards demand a lower oxygen level because oxygen damages the underground storage sites located close to the Danish-German border. In fact, different gas quality standards could provide an obstacle to the free movement of gas with injected renewable gas. Commission Regulation 2015/703 establishing a Network Code on Interoperability and Data Exchange rules provides guidelines on how to address the potential cross-border trade restrictions due to gas quality differences31. Article 15(1) provides that the Transmission System Operators (TSOs) should cooperate to avoid restrictions to cross-border trade due to gas quality differences, and have at their disposal tools such as swapping and co-mingling. In case the cross-border trade restrictions are unavoidable, Art. 15(2) of the Network Code foresees a series of concrete actions that the TSOs are obliged to undertake within one year. It includes the submission of a joint proposal by the TSOs to the relevant NRAs, preceded by a cost benefit analysis and a public consultation, in order to find the most viable and cost-effective solution. It should be noted that these steps are to a large degree based on the good-will of the involved TSOs and NRAs. It seems that at this stage the currently binding regulatory provisions are satisfactory to address the potential challenges, provided the actors involved exhibit goodwill. This view is supported by the findings of the 2016 ENTSOG Implementation Monitoring Report that identified a potential trade restriction only on one Interconnection Point (IP). The procedure of Art. 15(2) has never been triggered, as any arising gas quality issues have been solved by the way of mutual cooperation between TSOs32. However, the gas quality in the EU should be monitored regularly, as it is possible that with the increase of the injection of renewable gases into the gas grids this issue will require a more decisive approach in the future. On the basis of different experiences in different Member States a European benchmark on odorization and control processes could be established. The Directive on common rules for the internal market in natural gas adopted in 2009 encourages the Member States to support the use of renewable gases, provided that their access to the gas grid ‘is compatible with the relevant technical rules and safety standards on an ongoing basis’33. The safety issues should be regarded with the upmost importance and are crucial to encourage the penetration of renewable gas in the existing gas grid. After the renewable gas is fed into the gas grid, it mingles with natural gas and can no longer be distinguished34. In order to provide the information to the final consumer about the renewable gas content, the Guarantee of Origin certificates are being issued. To enable cross-border trade the certificates will need to be interchangeable and represent the same value. Ultimately, there should be no differences between domestic and imported renewable gas35. ________________________
31 Commission Regulation (EU) 2015/703 of 30 April 2015 establishing a network code on interoperability and data exchange rules. 32 Implementation Monitoring Report of the Network Code on Interoperability and Data Exchange Rules, 19 September 2016, p. 22. 33 Directive 2009/73/EC of the European Parliament and of the Council of 13 July 2009 concerning common rules for the internal market in natural gas and repealing Directive 2003/55/EC, recitals para. 26. 34 Spijker, E., et al. (2015). A level playing field for the European biogas and biomethane markets - Case of the Netherlands and Germany: policy environment, key differences and harmonisation issues, pp. 4-5. 35 Biomethane. Status and Factors Affecting Market Development and Trade. A Joint Study by IEA Bioenergy Task 40 and Task 37, September 2014, p. 55.

227
5. Renewable Gas is Currently a Key Decarbonisation Option for the Gas Sector The gas sector should engage in the EU’s decarbonisation efforts in order to remain an important ingredient of the EU energy system in the long-term. We believe that the injection of renewable gas into the existing gas grid is the most politically acceptable and economically viable option, which at the same time, do not require the consumers to change their energy consumption patterns. The analysis of the European Union’s experience with renewable gas production demonstrated that the boost in the green gas production will not be possible without the change of current status quo, thereby we propose to: Incorporate a soft target for renewable gas injection into the gas network
Encourage the creation of the incentives for the green gas injection into the grid Incentivise innovation through regulatory changes Introduce an European benchmark on the odourisation and control processes in order to
avoid potential cross-border restrictions in renewable gas trade Monitor, on a regular basis, any issues that can constitute a challenge to cross-border trade
in renewable gas.

A NEW GOVERNANCE REGULATION TO FOSTER RENEWABLE COOPERATION POST 2020 Agime Gerbeti, Professor (Environmental and Social Sustainability) Introduction, 2) Directive 2009/28/EC and cooperation mechanisms, 3) Encouraging Member States to use cooperation mechanisms, 4) Judgment of the European Justice Court, 5) Cooperation mechanisms towards 2030. 6) Final consideration
1. Introduction.
The reason for the research is to analyse the development of the main measures related to support regimes for renewables adopted to create an internal electricity market. The focus is given to the increase role that cooperation mechanisms for promotion of renewable energy sources (RES) are playing. This paper examines features of cooperation mechanisms starting from the analyse of directive 2001/77/CE and then reviews all relevant legislation measures adopted at European Union (EU) level to boost cooperation between Member States (MS) in the renewables until the recent approved directive1 2018/2001/UE on the promotion of the use of RES. The promotion of such mechanisms has been heavily impacted by the decisions of two court cases2 which have had a strong impact on the recent 2030 legislation. For this reason and taking into account the principle of free movement of goods within the internal market established in the EU Treaties, the paper questions on whether electricity should be yet considered a typical commodity produced and exchanged within this market.
The 2030 legislation puts more emphasis on regional cooperation and on promotion of joint projects on renewable. Hence, the Regulation3 2018/1999 on Energy Union and Climate Action Governance and the revised Renewable Energy directive 2018/2001/UE have updated and have also included new provisions concerning cooperation. Is scrutinized what the impact of cooperation can be in the upcoming 2021-2030 period within the internal market. Finally, in the conclusions are outlined the theoretical advantages and limits of the overall discipline of the cooperation mechanisms on RES.
2. Context of EU and national objectives on renewables and cooperation mechanisms
The European Community after assuming binding obligations on emission reduction by signing and ratifying the Kyoto protocol recognized the need to promote renewable energy sources as a “priority measure given that their exploitation contributes to environmental protection and sustainable development”4. In fact, the purpose of the directive 2001/77/EC
1 Directive (EU) 2018/2001 of the European Parliament and of the Council of 11 December 2018 on the promotion of the use of energy from renewable sources (Text with EEA relevance). 2 Two cases of the Court of Justice affected this aspect: Joined cases C-204/12, C-205/12, C-206/12, C-207/12, C-208/12, Essent Belgium/Vlaamse Reguleringsinstantie voor de Elektriciteits- en Gasmarkt and case Ñ-573/12, Alands Vindkraft/Energimyndigheten. 3 Regulation (EU) 2018/1999 of the European Parliament and of the Council of 11 December 2018 on the Governance of the Energy Union and Climate Action, amending Regulations (EC) No 663/2009 and (EC) No 715/2009 of the European Parliament and of the Council, Directives 94/22/EC, 98/70/EC, 2009/31/EC, 2009/73/EC, 2010/31/EU, 2012/27/EU and 2013/30/EU of the European Parliament and of the Council, Council Directives 2009/119/EC and (EU) 2015/652 and repealing Regulation (EU) No 525/2013 of the European Parliament and of the Council (Text with EEA relevance). 4 Directive 2001/77/EC of the European Parliament and of the Council of 27 September 2001 on the promotion of electricity produced from renewable energy sources in the internal electricity market. Official Journal L 283, 27/10/2001 P. 0033 – 0040.
228

229
was related to exploitation of RES within the internal electricity market5 and the “creation of a basis for a future Community-wide framework”, thereof to meet Kyoto targets more quickly. This was a first step towards harmonization of support schemes at European level. However, at that time the introduction of a new European mechanism to deliver incentives was considered not appropriate because MS had no experience on renewable subsidies. The directive 2001/77/EC required national indicative targets to be in line with the global indicative target of 12 % of gross national energy consumption by 2010 and in particular with the 22, 1 % indicative share of electricity produced from RES in total Community as electricity consumption by 2010. Beside the EU target, indicative targets on MS and a sub target on electricity were adopted. The Governance of the first directive on the promotion of renewable sources can be substantiated into three elements:
a) Objectives: EU and national indicative targets to meet climate objectives6; the indicative nature of the objectives was linked to the achievement of the climate binding targets;
b) Measures: national support schemes7; MS had greatest freedom in drawing their national support schemes;
c) Direction: Starting from this directive on promotion of RES the foundations for the future are laid. The aim is to create a basic for a Community-wide framework regarding support schemes; the intention was pave the way for legal conditions enabling electricity to flow within the European electricity market8.
The directive 2009/28/EC which modifies directive 2001/77/EC changed the approach by introducing binding targets both at EU level of 20% in terms of gross final consumption from renewables by 2020 and at national level9. Taking into account that biofuels in transport sector were lagged behind also a sub-target of 10 % was set. This was due to the fact that the RES share in electricity was rapidly increasing in the EU due to all support schemes set up in different EU Countries. The directive is part of the so called 20-20-20 package which set triple objectives: 1) 20% cut in greenhouse gas emissions (from 1990 levels); 2) 20% of EU energy from RES; 3) 20% improvement in energy efficiency. Since objectives were set separately, this has resulted over the years (2009-2019) to consider the three fields as standalone pillars of the environmental and energy policies and not as different measures to reach the same targets,
5Directive 96/92/EC of the European Parliament and of the Council of 19 December 1996 concerning common rules for the internal market in electricity for the first time introduces at EU legislation the possibility to give priority to the renewable electricity generation for environmental protection reasons (consideration 28). 6 Directive 2001/77/EC, Art 3.4. It was required to Member States to ensure that the targets were compatible with any national commitments accepted in the context of the climate change commitments accepted by the Community pursuant to the Kyoto Protocol to the United Nations Framework Convention on Climate Change. Taking into account this requirement it is clear that the connection between clime issues and energy were linked and monitored together, not as separated pillars. 7 Directive 2001/77/EC (14) “Member States operate different mechanisms of support for renewable energy sources at the national level, including green certificates, investment aid, tax exemptions or reductions, tax refunds and direct price support schemes. One important means to achieve the aim of this directive is to guarantee the proper functioning of these mechanisms, until a Community framework is put into operation, in order to maintain investor confidence.”. 8 Directive 2001/77/EC (15) “It is too early to decide on a Community-wide framework regarding support schemes, in view of the limited experience with national schemes and the current relatively low share of price supported electricity produced from renewable energy sources in the Community.” 9 The target per each Country are included in the Annex of the directive 2009/28/EC.

230
the environmental one. This has also brought to the overlapping of policies10 and sometime of subsidies11.
As far as the Governance of this directive is concerned, it could be included in the following themes:
a) Objectives: introduces for the first time binding targets on RES; both European and national objectives were mandatory;
b) Measures: national support schemes and opportunities of cooperation between different MS and with third countries for achieving national overall targets; Countries could still choose the way on which to promote national deployment of RES. The cooperation included as a voluntary measure was meant to increase chances to reach Countries’ nation goals;
c) Direction: facilitating cross-border support of energy from renewable sources without affecting national support schemes. It was still early to ask compulsory cooperation between MS consequently allowing access to all private operators to benefit from other Country’s economic incentives.
As mentioned above, this directive besides the national incentives introduces for the first time,12 the cooperation mechanisms13 between MS and also with third Countries. Cooperation mechanisms constitute a group of flexible instruments made available to MS for voluntary implementations. Is in the spirit of the directive to guarantee the effectiveness of both measures (support schemes and cooperation mechanisms) towards the target compliance. The capability of national support schemes applying to energy from RES produced in other MS is of relevance important. So, this capacity could possibly be experienced and performed through cooperation mechanisms provided in the directive. The cooperation mechanisms defined in the directive 2009/28/EC are:
a) Statistical transfers (Art. 614) through which it is possible the accounting of renewable energy produced in one MS towards meeting the objective of another Member State. Therefore, the Country with a surplus share of energy can transfer it to another MS in deficit. This is an accounting exchange available only to MS and not to private operators. In this case,
10 Braathen, N.A. (2011). Interactions Between Emission Trading Systems and Other Overlapping Policy Instruments. OECD Green Growth Papers, 2011-02. See also, Böhringer, Christoph, Henrike Koschel and Ulf Moslener (2008), “Efficiency losses from overlapping regulation of EU carbon emissions”, Journal of Regulatory Economics, Vol. 33, pp. 299-317.9. 11 Design and impact of a harmonized policy for renewable electricity in Europe. Final report beyond2020, Gustav Resch, Lukas Liebmann, André Ortner, Sebastian Busch, Christian Panzer, TU Vienna / EEG Pablo Del Rio, CSIC Mario Ragwitz, Simone Steinhilber, Marian Klobasa, Jenny Winkler, Fraunhofer ISI Malte Gephart, Corinna Klessmann, Isabelle de Lov-infosse, Georgios Papaefthymiou, Ecofys Jana V. Nysten, Dörte Fouquet, BBH Angus Johnston, Eva van der Marel, UOXF Fernando Bañez, Carlos Batlle, Camila Fernandes, Pablo Frías, Pedro Linares, Luis Olmos, Michel Rivier, Comillas Jaroslav Knapek, Tomas Kralik, CVUT, Thomas Faber, Sylvia Steinbaecker, AXPO Bugra Borasoy, EnBW, Felipe Toro, Luis Plascencia, IREES February 2014. 12 Also inspired from the flexible mechanisms of the Kyoto Protocol. 13 The Renewable Energy Directive 2009/28/EC on the promotion of the use of energy from renewable sources introduces Cooperation Mechanisms in Articles 6 to 11. 14 Article 6. “Statistical transfers between Member States. 1. Member States may agree on and may make arrangements for the statistical transfer of a specified amount of energy from renewable sources from one Member State to another Member State. The transferred quantity shall be: a) deducted from the amount of energy from renewable sources that is taken into account in measuring compliance by the Member State making the transfer with the requirements of Article 3(1) and (2); and b) added to the amount of energy from renewable sources that is taken into account in measuring compliance by another Member State accepting the transfer with the requirements of Article 3(1) and (2)...”

231
the RES share sold, by means of an agreement between the interested MS, is deducted from the quantity of renewable energy of the transferring State, for the benefit of the recipient.
b) Joint projects (Art. 715, 816) renewable energy generation supported by more than one MS is then shared for target compliance purposes between them. In this case, one or more MS can cooperate on all types of joint projects for RES production and allocate the share of energy for their targets without any physical transfer.
c) Joint projects (Art. 917) on electricity only, with third countries. In the present case, one or more MS may cooperate with one or more third Countries on all types of joint projects for the production of electricity from renewable sources but the consumption of the renewable electricity must be within the European Community.
d) Joint support schemes (Art. 1118) is as well included between the cooperation instruments. Through which MS can create a common cross-border support scheme for renewable generation. Based on this article, two or more MS may decide, on a voluntary basis, to merge or partially coordinate their national support schemes for the purpose of achieving the national indicative targets. Then they could share the renewable generation using the statistical transfers.
The EU MS in drafting their National Action Plans on renewable energy, as required by the directive 2009/28/CE did not envisage the possibility19 to take advantages of the new cooperation mechanisms that were introduced. MS did not consider this option as an opportunity to reach their mandatory national targets faster and in a cost effective way. It is
15 Article 7. “Joint projects between Member States” 1. Two or more Member States may cooperate on all types of joint projects relating to the production of electricity, heating or cooling from renewable energy sources. That cooperation may involve private operators. …” 16 Article 8. “Effects of joint projects between Member States ... 3. For the purposes of measuring target compliance with the requirements of this Directive concerning national overall targets, the amount of electricity or heating or cooling from renewable energy sources notified … shall be: (a) deducted from the amount of electricity or heating or cooling from renewable energy sources that is taken into account, in measuring compliance by the Member State issuing the letter of notification under paragraph 1; and (b) added to the amount of electricity or heating or cooling from renewable energy sources that is taken into account, in measuring compliance by the Member State receiving the letter of notification in accordance with paragraph 2”. 17 Article 9. “Joint projects between Member States and third countries. 1. One or more Member States may cooperate with one or more third countries on all types of joint projects regarding the production of electricity from renewable energy sources... 2. Electricity from renewable energy sources produced in a third country shall be taken into account only for the purposes of measuring compliance with the requirements of this Directive concerning national overall targets if the following conditions are met: (a)the electricity is consumed in the Community…. This proportion or amount shall not exceed the proportion or amount actually exported to, and consumed in, the Community … “ 18 Article 11. “Joint support schemes. 1.Without prejudice to the obligations of Member States under Article 3, two or more Member States may decide, on a voluntary basis, to join or partly coordinate their national support schemes. In such cases, a certain amount of energy from renewable sources produced in the territory of one participating Member State may count towards the national overall target of another participating Member State if the Member States concerned: (a) make a statistical transfer of specified amounts of energy from renewable sources from one Member State to another Member State in accordance with Article 6; or (b) set up a distribution rule agreed by participating Member States that allocates amounts of energy from renewable sources between the participating Member States...” 19 Only Italy included this option in its first National Action Plan. While transposing the directive 2009/28/CE, Italy also regulated their use into the national legislation by d. lgs no. 28 of 2011. However, never implemented them.

232
worth mentioning that some MS20 are still far21 from reaching their national objectives set for 2020 but nevertheless the use of these mechanisms has been insignificant22.
During the implementation of directive 2001/77/EC took place the modification and signing of the Treaty on European Treaty (TEU) and the Treaty on the functioning of the European Union (TFEU)23. The Treaties entered into force on 1 December 2009, then a few months after the entry into force of directive 2009/28/EC. The Treaties give to the EU exclusive power over commercial policy, Art. 3. 1, of TFEU. In the same article in paragraph 3 of the TUE (ex Art.2 of the TUE) reference is made to the internal market to be established so, “The Union shall establish an internal market. It shall work for the sustainable development of Europe based on balanced economic growth and price stability, a highly competitive social market economy, aiming at full employment and social progress, and a high level of protection and improvement of the quality of the environment. It shall promote scientific and technological advance”. To the Union is recognized the exclusive competence in the field of the common commercial policy and the subjects of energy and the environment are included within the shared competence (Art. 4. TFUE). In order to achieve the completion of the European market and therefore an internal space without frontiers, in which the free movement of goods, persons, services and capital is ensured in Art. 26 of the TFEU (ex Art.14 of the TEC), paragraph 1 which reads “The Union shall adopt measures with the aim of establishing or ensuring the functioning of the internal market, in accordance with the relevant provisions of the Treaties”. In the same direction goes also Art. 30 of the TFEU (ex Art. 25 of the TEC) which prohibits customs duties on imports or exports or charges having equivalent effect between MS. This prohibition also applies to customs duties of a fiscal nature. Furthermore, Article 34 of the TFEU also prohibits quantitative restrictions on imports and any measure having equivalent effect between MS.
Therefore, if the principle of free movement of goods is in force within the internal market, then electricity has to be treated as a typical commodity produced and exchanged within this market. At this point an incentive instead of a tax, therefore an incentive or a disincentive aspect of a national or European legislation on RES generation would be considered a limit to the exchange of goods? And this is where the problems of interpretation linked to national support schemes arise. The RES sources have peculiarities in terms of production potential, physical exchange, network limits for the transport and commercialisation. In addition, RES for the energy balance of a Country have environmental purposes different from the energy tout court.
3. Encouraging MS to use cooperation mechanisms
During the last years, much effort has been put by MS on drafting various support schemes differentiated per technology and/or based on installed capacity. As far as cooperation
20 Several member States are lagging behind the target. Also EU 28 according to Eurostat data 2017 has reach 17.5 % out of 20%, http://appsso.eurostat.ec.europa.eu/nui/show.do?dataset=nrg_ind_ren&lang=en 21 Caldés, N.; Lechón, Y.; Rodríguez, I.; Del Río, P. Market Uptake of Solar Thermal Electricity through Cooperation Analysis of the Barriers to the Use of the Cooperation Mechanisms for Renewable Energy in the EU. 2018. Available online: http://mustec.eu/sites/default/files/reports/MUSTECD4. 1_Barriersforcooperationmechanisms.pdf. 22 Gephart M, Tesnière L and Klessmann C, “Driving regional cooperation forward in the 2030 renewable energy framework” https://eu.boell.org/sites/default/files/hbfecofys_regional_cooperation.pdf D/2015/11.850/3. Ecofys and Heinrich-Böll-Stiftung Report, Brussels 2015. 23 Consolidated versions of the Treaty on European Treaty and the Treaty on the functioning of the European Union (2012/C 326/01). https://eur-lex.europa.eu/legal-content/EN/TXT/?uri=CELEX:C2012/326/01
233
mechanisms’ implementation is concerned, can be stated that their use has been limited24 both between MS, and with other neighbouring third countries such as the Energy Community Countries who have adopted25 and transposed the directive 2009/28/EC. All MS were castled in their national “expensive” support schemes with no concerns on implementing cooperation mechanisms. Since 2012 a joint support schemes based on green certificates scheme has been set up between Sweden and Norway. This has been the first concrete case of implementation. Then in 2016 started the partial opening of the pilot auctions for ground-mounted photovoltaic (a mutually open tender) between Germany and Denmark.
Even though MS gained enough experience on structuring the national support schemes especially for the electricity generation, they were reluctant to cooperate with each other. Notwithstanding, since the beginning26 it was clear from National Action Plans on RES elaborated by Members States that the interest of cooperation was low.
At EU level in the interest of strengthening the internal electricity market and increasing collaboration between MS several EU Communications were approved. For this purpose, on one hand it was important addressing the harmonization of methodologies through which subsidies in each Country were designed and delivered. On the other hand it was important to give guidance to MS on how to potentially implement cooperation on RES.
In 2012, the European Commission in the Communication27 on “RES energy: a leading role in the European energy market” among other actions, referred to the promotion and orientation towards a greater use of cooperation mechanisms as they allow MS to reach binding national targets through the exchange of RES energies by reducing their costs and ensuring energy cooperation also with neighbouring countries.
In 2013 the European Communication28 on “Delivering the internal electricity market and making the most of public intervention” called for more competition on the internal electricity market. Thus, Commission’s finding showed that the opening of support schemes to RES production of other MS, building on increased connectivity and, where relevant, cooperation mechanisms contribute to strengthening the competition on the internal electricity market. The Communication reads that the “Commission strongly encourages MS to use these opportunities and progressively open up their nationally oriented support schemes to producers from other MS”. Furthermore, is specified that “the Commission regrets that, with the exception of the joint support scheme between Norway and Sweden no use has been made of these cooperation mechanisms so far. Developing RESs in cross border support schemes, can reduce the costs of compliance with Directive 2009/28/EC. It can also help remove possible distortions to the single market arising from different national approaches”. Within the abovementioned document the Commission provided guidance to Member State on the use of cooperation mechanisms including concrete optional design features and accompanied 24 Natàlia Caldés, Pablo del Río, Yolanda Lechón, and Agime Gerbeti in “Renewable Energy Cooperation in Europe: What Next? Drivers and Barriers to the Use of Cooperation Mechanisms” Energies 2019, 12, 70; doi:10.3390/en12010070. www.mdpi.com/journal/energies 25 The decision D2012/04/MC/EnC of the Council of Ministers ECT, which modifies the art. 20 of the Energy Community Treaty, is an expression of the precise will of these countries to incorporate the community legislation on renewable energy. In fact, the ECT countries on 18 October 2012 adopted the Directive 2009/28/EC which for them came into force on 18 December 2012, while the transposition was required by 1 January 2014. 26 Member states were asked based on Article 4 of directive 2009/28/CE to submit to the European Commission their National Action Plans on Renewable Energy within 30 June of 2010. 27 European Commission, Communication n. 271 (2012) “Renewable energy: a leading role in the European energy market” published on 6 June 2012. 28 Communication from the Commission “Delivering the internal electricity market and making the most of public intervention {SWD (2013) 438 final} Brussels, 5.11.2013 C (2013) 7243 final.

234
templates of “standardized” agreements for any of the cooperation mechanisms. Several analyses from MS, and European financed project were developed, but even the knowledge was available, nothing will come of it.
In April of 2014 “Guidelines on environmental and energy state aid for 2014–2020”29 were adopted by the European Commission. The state aid discipline recognizes the need to maintain national support mechanisms for the promotion of RES taking into account that national objectives were in place. However, paragraph 122 of the Guidelines reads: “The Union set an overall Union target for the share of RES energy sources in final energy consumption and translated this target into mandatory national targets. The RES Energy Directive includes cooperation mechanisms to facilitate cross border support for achieving national targets. Operating aid schemes should in principle be open to other EEA countries and Contracting Parties of the Energy Community to limit the overall distortive effects. ... The Commission will consider positively schemes that are open to other EEA or Energy Community countries.” The Guideline asks MS to deliver incentive through competitive and transparent biddings. Even RES incentives are allocated directly from each Country, the methodology and procedures on how to design was almost harmonized (through competitive bidding) at the European level. The Guidance had left to MS little room for manoeuvre. Those bidding must be open to all generators producing electricity from RES on a non-discriminatory basis, in order for the Commission to presume that the aid is proportionate and does not distort competition to an extent contrary to the internal market. So, it is required for the aid to be available also for producers of other MS unless a cooperation mechanism already exists. The European Commission considers positive and encourages the opening of support scheme to other countries. However, Guidelines does not oblige MS to open up support scheme, but the Commission during the notification of national RES support schemes asked Countries to do so. For this reason, Italy30, Germany31, and other Countries included in their laws on support schemes the possibility of participation in their national incentives also to plants located in other MS. Therefore, this is an important step, because at this stage that at European level we move from imposing binding objectives to MS, to the detailed specification on how to draw national schemes to support RES production.
4. Judgment of the European Justice Court
Precisely from the interpretation on what RES’s incentives are and how they can impact in a market space without customs and cross-border limits, arise some of the most significant legal disputes that will lead to define the function and limits of national incentives.
The conclusions of Advocate General Yves Bot in Case C-573/1232 between the company Ålands Vindkraft AB against the Swedish energy agency, the Energimyndigheten, are of particular interest.
29 Communication from the Commission, Guidelines on State aid for environmental protection and energy 2014-2020. OJ C 200, 28.6.2014, p. 1–55. The Communication was published in April of 2014 by the Communication No. C (2014)2322. 30 Ministerial decree of 23 June 2016 on “Incentive of electricity produced from renewable sources other than photovoltaics”. Article 31 on the participation in auction procedures for plants located in other Member States. 31 Denmark and Germany sign first cooperation agreement on mutual cross-border pilot auctions for PV installations A partial opening of the pilot auctions for ground-mounted photovoltaic. https://www.bmwi.de/Redaktion/EN/Pressemitteilungen/2016/20160720-daenemark-und-deutschland-unterzeichnen-erste-kooperationsvereinbarung.html 32 Judgment of the Court (Grand Chamber) of 1 July 2014. Ålands vindkraft AB v Energimyndigheten. Request for a preliminary ruling from the förvaltningsrätten i Linköping. Reference for a preliminary ruling; National support scheme providing for the award of tradable green certificates for installations

235
The question arises when on 30 November 2009, Ålands Vindkraft AB which operates a wind farm located in Finland, in the Åland archipelago, but linked to the Swedish electricity grid, has called for an agreement to be able to obtain green certificates in force of Swedish legislation. By decision of 9 June 2010 the Energimyndigheten rejected this request, on the grounds that only green electricity production installations located in Sweden may be approved for the award of electricity certificates.
Ålands Vindkraft brought an action before the förvaltningsrätten i Linköping for annulment of that decision and approval of its application. In particular, it alleges infringement of Article 34 TFEU, arguing that the effect of the electricity certificate scheme is that approximately 18% of the Swedish electricity consumption market is reserved to green electricity producers located in Sweden, to the detriment of electricity imports from other MS. In fact, according to Ålands Vindkraft, the directive 2009/28/EC, if it is intended to promote the use of green energy so that MS can comply with their mandatory targets, it does not allow the establishment of discriminatory support schemes, which would create illegal barriers to trade. A radically opposite reading is suggested by the Energimyndigheten and by the Swedish, German and Norwegian governments, which believe that directive 2009/28/EC expressly authorizes, or even presupposes, a limitation of the benefit of national support schemes to green energy produced in the national territory.
The arguments of Advocate General Yves Bot are based on the premise that directive 2009/28/EC must be examined in relation to Article 34 TFEU. It is clear from the settled jurisprudence that any national measure in a sector which has undergone exhaustive harmonization at Union level must be assessed in relation to the provisions of this harmonization measure and not to those of primary law, such jurisprudence is not applicable, as it is undisputed that directive 2009/28/EC has not harmonized the substantive content of support schemes to promote the use of green energy.
At this point must be recognized that not only the national law but also the Community legislation should be interpreted in the light of primary law and, certainly, the freedom of trade between MS is one of the fundamental principles of the common market. Therefore, the impossibility for electricity producers located in other MS to benefit from the Green Certificates scheme when exporting green electricity constitutes. Therefore, a discriminatory restriction on the free movement of goods, prohibited by Article 34 TFEU and, consequently, is directive 2009/28/EC invalid in the part where it introduces only voluntary cooperation mechanisms between MS?
The arguments that will lead the Advocate General’s ruling are enlightening: first of all, he affirms that33 directive 2009/72/EC as shown in its whereas 6234 aims at creating a fully
producing electricity from renewable energy sources; Obligation for electricity suppliers and certain users to surrender annually to the competent authority a certain number of green certificates; Refusal to award green certificates for electricity production installations located outside the Member State in question; Directive 2009/28/EC; Art 2, second paragraph, point (k), and Art 3(3); Free movement of goods; Article 34 TFEU. Case C‑573/12. 33 Judgment on point 85. “In particular, as was pointed out by the Advocate General in points 83 to 86 of his Opinion, the finding made by the Court in paragraph 78 of the judgment in PreussenElektra, that Directive 96/92/EC of the European Parliament and of the Council of 19 December 1996 concerning common rules for the internal market in electricity (OJ 1997 L 27, p. 20), then in force, merely marked a phase in the liberalization of the electricity market and left in place some barriers to trade in electricity between Member States, no longer holds true”. 34 “Since the objective of this directive, namely the creation of a fully operational internal electricity market, cannot be sufficiently achieved by the Member States and can therefore be better achieved at Community level, the Community may adopt measures, in accordance with the principle of subsidiarity as

236
operational internal electricity market, which allows the sale of electricity on identical terms through a network of connections; that the completion of the internal electricity market for 2014 is not only a Commission’s own ambition, but also a “necessity” and an objective of the Union. Finally, he argues, with wit that it is easy to admit that green certificate schemes, by stimulating the production of green energy, contribute to the protection of the environment, there is, on the contrary, a paradox in believing that the incentive of importation of green electricity from another Member State could harm environmental protection. Therefore, affirm that territorial restrictions such as those at the main proceedings, do not comply with the principle of free movement of goods and that directive 2009/28/EC can be interpreted only in the sense that it authorizes such restrictions, consequently, the directive must be considered invalid on this point.
The conclusions of Advocate General Yves Bot appear to be of the highest quality and, to a large extent, shareable. Nevertheless, they could be so far ahead of time. Treating, in the name of the free European market, the “good” electricity from RES just like any other consumer goods could be “too much”. In fact, if it is now widely recognized, in Italy at least since 1942, from the first text of the civil code, that electricity is a good susceptible to exchange and theft, is with the same obligations of a specific RES production, in Italy dating back to the so called Bersani decree no 79 of 1999, that electricity has ceased to be a completely fungible good to take on specific connotations: therefore green energy produced by wind, photovoltaic, long or short chain biomasses etc. often with specific incentive schemes and associated national percentage obligations on production or on consumption.
This means that this good has its own specificity and function for the purposes of national production obligations: it is not a potential good that can be produced anywhere in the Union, from the same sources and at similar costs. So, probably Sweden will not have the same possibility of photovoltaic production of Spain or the Italy of the Danish wind. Different production costs entail, in many cases, different incentive schemes, therefore a cross-border regime of high production competition between various private subjects who prefer to sell to national subjects other than production sites with high incentives rather than internally at lower costs. So, the first consideration is that, given the technological and productive level, production competition could lead to inefficient costs for RES production.
The second observation is that electricity production is limited by technical needs for distribution and transport and cross-border network capacity. The electricity grid, beyond the progressive (and partly existing) creation of interconnection corridors between MS, requires balances in absolute equilibrium. Therefore, also the “highways” on which the electricity from RES (as a good) is distributed, contribute to limiting the supply of that good in the market. It could be argued that instead of physical consumption, the transaction could be limited to energy balance and accounting. In this case the risks are different and involve a loss of internal investment to obtain supplies from the bid offers in the EU or in third Countries, perhaps belonging to the Energy Community Treaty without a technological commitment within the EU itself.
Simply, there are no such conditions as outlined in whereas 62 of the directive 2009/72/EC and included in the judgment, namely the creation of a fully operational internal electricity market, which allows the sale of electricity at identical conditions through a network of connections.
At the end, the various support schemes over the years have behaved as competitive tax regimes aimed at attracting productive investments but, in the case of RES, they have boost hedge funds looking for a low-risk annuity, which derives from the location of plats, or as it
set out in Article 5 of the Treaty. In accordance with the principle of proportionality, as set out in that Article, this directive does not go beyond what is necessary in order to achieve that objective”.

237
may be now, from a functional sale. So, if it is certainly correct to state that the share of RES fed into the network is useful to the environment whether it is of domestic production or that of another MS, it could also not be useful for the environment to increase efficiency and specialize production plants as erga omnes supply sites. Therefore, have sellers and buyers Countries for percentages to reach for meeting the obligations on RES energy.
Finally, a consideration regarding the “external” coherence of the judgement: if it is evident, as also reported in the judgment that, directive 2009/28/EC does not create exhaustive harmonization at Union level, it is perhaps this precise judgment likely to force MS towards a real harmonization through a series of bilateral agreements or an internal adjustment of national legislation. In fact, if it is not possible to place restrictions on the recognition of incentives to generation occurred in other MS, in order not to undermine their energy trade balance, the MS will tend to standardize downward the economic level of support schemes. Maybe this would be one of the few cases in which it is not convenient to be too attractive.
5. Cooperation mechanisms towards 2030.
In December 2018 were adopted both the revised directive on RES and the Regulation35 on Governance of the Energy Union and Climate Action. New and updated mandatory objective are set at European Union by 2030. The managing of the revised directive and of almost overall energy policies relies on the Governance mechanism36:
a) Objectives: Union binding targets on RES has been confirmed and updated; MS, even in the absence of specific binding targets must set an appropriate contribution to the achievement of the Union’s target37. The overall binding target at EU level on RES gross final consumption of energy in 2030 is at least 32% does not necessarily translate into equal national targets. For decarbonisation issues sub targets on transport and heat & cooling sectors are set. The 2030 legislation embraces energy and climate policies which may avoid overlapping policies and subsidies. b) Measures: the national support schemes, measures of cooperation including the opening of support schemes and the Union renewable energy financing mechanism. The provisions are meant to unlock cooperation; Countries could still decide elements for the national deployment of RES. However, their decision-making space has been reduced considerably. c) Direction: Support and funds for the creation of a European - wide scheme to deliver incentives and fostering the cross-border flow of renewable energy. This will have impacts on national support schemes. The new provisions not only have the goal of aligning the design of
35 Regulation (EU) 2018/1999 of the European Parliament and of the Council of 11 December 2018 on the Governance of the Energy Union and Climate Action, amending Regulations (EC) No 663/2009 and (EC) No 715/2009 of the European Parliament and of the Council, Directives 94/22/EC, 98/70/EC, 2009/31/EC, 2009/73/EC, 2010/31/EU, 2012/27/EU and 2013/30/EU of the European Parliament and of the Council, Council Directives 2009/119/EC and (EU) 2015/652 and repealing Regulation (EU) No 525/2013 of the European Parliament and of the Council (Text with EEA relevance). 36 Regulation (EU) 2018/1999 in “Article 1. Subject matter and scope. 1. This Regulation establishes a governance mechanism to: (a) implement strategies and measures designed to meet the objectives and targets of the Energy Union and the long-term Union greenhouse gas emissions commitments consistent with the Paris Agreement, and for the first ten-year period, from 2021 to 2030, in particular the Union's 2030 targets for energy and climate; (b) stimulate cooperation between Member States, including, where appropriate, at regional level, designed to achieve the objectives and targets of the Energy Union; (c) ensure the timeliness, transparency, accuracy, consistency, comparability and completeness of reporting by the Union and its Member States to the UNFCCC and Paris Agreement secretariat; (d) contribute to greater regulatory certainty…” 37 Both MS and the Union must follow a precise trajectory in the increase of RES and will have to respect the three points of reference, i.e. to reach 18% (of the objective on RES) by 2022, 43% by 2015 and 65% by 2027 and then reach 100% that is, 32% in 2030. Reference points behave as intermediate targets.

238
incentives but also include a detail framework for licensing of plants and other administrative procedures linked to the development of RES.
In the directive 2018/2001/EU provisions regarding the existing cooperation mechanisms remain almost unchanged; only Art. 8 on Union Renewable Development Platform (URDP) and statistical transfers between MS reads in paragraph 3 that” The Commission shall ensure that the URDP is able to match the demand for and supply of the amounts of energy from renewable sources that are taken into account in the calculation of the renewable energy share of a Member State based on prices or other criteria specified by the MS accepting the transfer.” A similar platform was foreseen in Article 24 of directive 2009/28/EC to increase transparency on statistical transfers and joint projects. Although, a new article has been introduces ex novo and deals with the opening of support schemes. Based on which MS may progressively open RES support schemes in the electricity sector to plants located in other MS, at least 5% of new annual capacity between 2023 and 2026 and 10% between 2027 and 2030, through the signing of cooperation agreements which will include rules for RES share allocation based on the economic commitment made by each.
In 2016, the proposal of the Commission for this article was to set a compulsory opening of support. One of the factors that affected the non-mandatory opening should be attached to the abovementioned 2014 case. On the obligation of opening of support schemes, an economic assessment should be made. If Countries would be obliged to respect an annual percentage to be attributed the foreign RES generation, than the risk to consider is that, Countries in respecting the quantitative obligation would have lost sight of the economic convenience that must be strictly attached to all incentive’s measures.
However, by 2023 the Commission will analyse the state of implementation and evaluate whether to introduce a partial obligation on this issue. Furthermore, the Commission will assess by 2025 benefits on the cost-effective deployment of renewable electricity in the Union on provisions set out in the Art. 5. On the basis of this assessment, the Commission may propose to increase the percentages.
In the overall 2030 framework, the cooperation and regional approach are considered crucial to 2030 Governance to reach targets in a cost effective way. So, for the first time a definition on regional cooperation is included in Art. 2 “means cooperation between two or more MS engaged in a partnership covering one or more of the five dimensions of the Energy Union”. Furthermore, the Art. 12 on regional cooperation, paragraph 1, reads that ”MS shall cooperate with each other, taking account of all existing and potential forms of regional cooperation, to meet the objectives, targets and contributions set out in their integrated national energy and climate plan38 effectively”. Based on paragraph 339 of the same article, the cooperation can be even enhanced because MS may jointly draft parts of their integrated national energy and climate plans and progress reports.
38 However, MS have to include in their plans the consultation on regional cooperation as required by Art 3 Integrated national energy and climate plans in paragraph 2 (a) that reads “The integrated national energy and climate plans shall consist of the following main sections: (a) an overview of the process followed for establishing the integrated national energy and climate plan consisting of an executive summary, a description of the public consultation and involvement of stakeholders and their results, and of regional cooperation with other Member States in preparing the plan, as established in Articles 10, 11 and 12 and in point 1 of Section A of Part I of Annex I”. 39Article 12 on regional cooperation, in paragraph provides that “Member States may engage in voluntary joint drafting of parts of their integrated national energy and climate plans and progress reports, including in regional cooperation fora.”

239
To conclude, a new instrument the “Union renewable energy financing mechanism” which will be created at Union level. A voluntary financial payment to this financing mechanism is foreseen by MS in case of deviation between the 2030 target at EU level and the collective contributions of the MS. According to Art. 33 the financing mechanism will be set up by 1 January 2021 for the development of RES projects. The RES share will be distributed statistically to the participating MS, reflecting their relative payments. Projects supported by this EU mechanism financed from other sources different from the MS’s payments will not be counted towards MS’s national contributions but for the EU binding target. However, it is specified40 that this mechanism should contribute to the purpose of promoting RES in the EU, regardless of any gap with respect to the indicative trajectory of the Union. MS have the right to decide whether, and if so, under which conditions, they allow installations located on their territory to receive support from the financing mechanism. The text of the article represents “the general test” of the future EU disbursement of incentives for RES. In fact, it is also described in details what the design of the EU mechanisms will be. It is specified that the support to the RES generation may be provided inter alia in the form of a premium additional to market prices, and shall be allocated to projects bidding at the lowest cost or premium.
6. Final considerations
Through RES objectives and sub-objectives, first on electricity then also on transport and heat and cooling sectors, the EU leads countries not only in terms of RES ambition but also in terms of clean technology. The use of cooperation mechanisms gives flexibility to MS to reach the national RES objectives and can be a cost effective way to deploy RES in EU, even though their use has been limited.
The recent EU legislation adopted for 2021- 2030 with the overall objective to complete the electricity market, enhanced cooperation between MS and to achieve this, new instruments at EU level have been designed and introduced such as, the opening of support schemes and the Union renewable energy financing mechanism are both voluntary for MS.
On one hand it is better to have all type of cooperation mechanisms as non-mandatory measures i.e. opening of national support schemes, because the risk would be that we jeopardize the cost efficiency of the cooperation between MS. The qualitative and non-quantitative use of cooperation mechanisms is essential for the EU.
On the other hand issues with RES electricity and the principle of free movement of goods arise. The analysed Case C-573/12 will likely constrained MS through a series of bilateral agreements to recognize incentives also to the RES generation occurred in other MS. At present the electricity is not yet a typical commodity not even a completely fungible good. Also the cross-border network capacity is still a constrain to the internal electricity market competition. However, the level of electricity interconnectivity that the MS aim for in 2030 is of at least 15 %. This will certainly contribute in fostering cooperation between MS.
This situation may bring to an overall reduction of economic entity of all MS support schemes and will tend to standardize downward the economic level of support schemes.
The financial mechanism introduced to help the Union reaching its mandatory target lays out detailed provisions on the upcoming EU delivering of incentive for RES generation. The EU financial mechanism at the beginning will be in “competition” with the RES national
40 Paragraph 2 of Art.33. “Without prejudice to paragraph 1 of this Article, the financing mechanism shall contribute to the enabling framework pursuant to Art 3(4) of directive (EU) 2018/2001 with the aim of supporting renewable energy deployment across the Union irrespectively of a gap to the indicative Union trajectory”.

240
incentives. However, the national support schemes and the various cooperation mechanisms are likely that will come together, over the upcoming years, into the EU financial mechanism.
Bibliography and legislation
Directive 2018/2001/EU of the European Parliament and of the Council of 11 December 2018 on the
promotion of the use of energy from renewable sources. Two cases of the Court of Justice affected this aspect: Joined cases C-204/12, C-205/12, C-206/12, C-
207/12, C-208/12, Essent Belgium/Vlaamse Reguleringsinstantie voor de Elektriciteits- en Gasmarkt and case Ñ-573/12, Alands Vindkraft/Energimyndigheten.
Regulation (EU) 2018/1999 of the European Parliament and of the Council of 11 December 2018 on the Governance of the Energy Union and Climate Action, amending Regulations (EC) No 663/2009 and (EC) No 715/2009 of the European Parliament and of the Council, Directives 94/22/EC, 98/70/EC, 2009/31/EC, 2009/73/EC, 2010/31/EU, 2012/27/EU and 2013/30/EU of the European Parliament and of the Council, Council Directives 2009/119/EC and (EU) 2015/652 and repealing Regulation (EU) No 525/2013 of the European Parliament and of the Council.
Directive 2001/77/EC of the European Parliament and of the Council of 27 September 2001 on the promotion of electricity produced from renewable energy sources in the internal electricity market. Official Journal L 283, 27/10/2001 P. 0033 – 0040.
Directive 96/92/EC of the European Parliament and of the Council of 19 December 1996 concerning common rules for the internal market in electricity has made significant contributions towards the creation of an internal market for electricity Directive 2009/72/EC of the European Parliament and of the Council of 13 July 2009 concerning common rules for the internal market in electricity and repealing Directive 2003/54/EC.
Braathen, N.A. (2011). Interactions Between Emission Trading Systems and Other Overlapping Policy Instruments. OECD Green Growth Papers, 2011-02. See also, Böhringer, Christoph, Henrike Koschel and Ulf Moslener (2008), “Efficiency losses from overlapping regulation of EU carbon emissions”, Journal of Regulatory Economics, Vol. 33, pp. 299-317.9.
Gustav Resch, Lukas Liebmann, André Ortner, Sebastian Busch, Christian Panzer, TU Vienna / EEG Pablo Del Rio, CSIC Mario Ragwitz, Simone Steinhilber, Marian Klobasa, Jenny Winkler, Fraunhofer ISI Malte Gephart, Corinna Klessmann, Isabelle de Lov-infosse, Georgios Papaefthymiou, Ecofys Jana V. Nysten, Dörte Fouquet, BBH Angus Johnston, Eva van der Marel, UOXF Fernando Bañez, Carlos Batlle, Camila Fernandes, Pablo Frías, Pedro Linares, Luis Olmos, Michel Rivier, Comillas Jaroslav Knapek, Tomas Kralik, CVUT, Thomas Faber, Sylvia Steinbaecker, AXPO Bugra Borasoy, EnBW, Felipe Toro, Luis Plascencia, “Design and impact of a harmonized policy for renewable electricity in Europe”. Final report beyond2020, IREES February 2014.
Directive 2009/28/EC of the European Parliament and of the Council of 23 April 2009 on the promotion of the use of energy from renewable sources and amending and subsequently repealing Directives 2001/77/EC and 2003/30/EC.
National Action Plans on renewables of MS: https://iet.jrc.ec.europa.eu/remea/nreaps-and-progress-reports-data-portal Eurostat data 2017 (access 2018) http://appsso.eurostat.ec.europa.eu.
Caldés, N.; Lechón, Y.; Rodríguez, I.; Del Río, P. “Market Uptake of Solar Thermal Electricity through Cooperation Analysis of the Barriers to the Use of the Cooperation Mechanisms for Renewable Energy in the EU”. 2018. Available online: http://mustec.eu/sites/default/files/reports/MUSTECD4. 1_Barriersforcooperationmechanisms.pdf.
Gephart M, Tesnière L and Klessmann C, “Driving regional cooperation forward in the 2030 renewable energy framework” https://eu.boell.org/sites/default/files/hbfecofys_regional_cooperation.pdf D/2015/11.850/3. Ecofys and Heinrich-Böll-Stiftung Report, Brussels 2015.
Consolidated versions of the Treaty on European Treaty and the Treaty on the functioning of the European Union (2012/C 326/01). https://eur-lex.europa.eu/legal-content/EN/TXT/?uri=CELEX:C2012/326/01
Natàlia Caldés, Pablo del Río, Yolanda Lechón, and Agime Gerbeti in “Renewable Energy Cooperation in Europe: What Next? Drivers and Barriers to the Use of Cooperation Mechanisms” Energies 2019, 12, 70; doi:10.3390/en12010070. www.mdpi.com/journal/energies
The decision D2012/04/MC/EnC of the Council of Ministers ECT, which modifies the art. 20 of the Energy Community Treaty and adopted the Directive 2009/28/EC.

241
European Commission, Communication n. 271 (2012) “Renewable energy: a leading role in the European energy market” published on 6 June 2012.
Communication from the Commission “Delivering the internal electricity market and making the most of public intervention {SWD (2013) 438 final} Brussels, 5.11.2013 C (2013) 7243 final.
Communication from the Commission, “Guidelines on State aid for environmental protection and energy 2014-2020”. OJ C 200, 28.6.2014, p. 1–55.
Italian Ministerial decree of 23 June 2016 on “Incentive of electricity produced from renewable sources other than photovoltaics”.

AN INTRA-DAY ANALYSIS OF ELECTRICITY FORWARD PREMIA Kun Li, Business School, Beijing Normal University, 1. Overview The issue of electricity pricing in spot and forward wholesale power markets has become one of the most attractive topics. During the recent years, a number of studies have realized that the electricity market is comparable to the financial market, since electricity prices have been determined through the auction mechanism. Thus, some studies employ methodologies from financial studies into the electricity market. Due to the nonstorable nature of electricity, which differs from financial assets, the electricity market is considered as limited in short-term elasticity to demand. The purpose of this study is to explore the price dynamics in the electricity market. We study the forward premium, which is defined as the difference between the forward price and the expected spot price of electricity. Using a dataset which includes multi-transmission-lines with hour-based frequency, we first observe that the electricity forward premium exists in our data, with a large variance, and a negative skewness. Second, we test both the time-varying and cross-sectional effects in the relationship between short-term forward prices and realized spot prices. We decompose the forward price into two components: transmission congestion cost and cost of marginal losses, and we find that the forward transmission congestion cost dominates the forward premium and consequently leads to a higher realized spot price. Third, we derive a new method to examine the significance of seasonality impact in forward premia. We find that the significant calendar effects in forward prices are different from those in spot prices. These results confirm the forward premium, and further extend the existing empirical literature by studying the properties of forward premium documenting new-risk-factor-related time variation. We make three contributions. First, our analyses use a high-frequency intraday dataset and include over 12,000 individual transmission lines in the liberalized Pennsylvania-New Jersey-Maryland (PJM) market. Previous studies use market-level data, which fails to tell the cross-sectional effects on price dynamics. Second, we introduce a new analytical model on the basis of the Bessembinder and Lemmon (B-L) Model, by including two components: transmission congestion cost and cost of marginal losses. Third, we introduce a new method to test the significance of calendar effects in forward premia. 2. Forward Premium and B-L Model 2.1. Forward Premium The forward premium is defined as the difference between the forward price and the expected prices. Examples include Hirshleifer (1988, 1990), Hirshleifer and Subrahmanyam (1993), Bessembinder and Lemmon (2002), Longstaff and Wang (2004), Botterud et al (2010), Haugom and Ullrich (2012). According to Longstaff and Wang (2004), in the electricity market, the forward premium refers to the equilibrium compensation for bearing the price and demand risk for the electric power. The forward premium is related to the fundamental economic risk and the electricity-market-specific risk linked with the willingness of market participation. The ex ante forward premium can be defined as
, Where , , is the forward price observed on day t for delivery on day t+1; is the expected spot price on day t+1 given information available on day t.
242

243
Since the expected price of one day ahead is generally unavailable, some studies develop models to generate it. But according to Timmermann and Granger (2004), it is not appropriate to estimate the future spot price in a market environment where the public availability of information cannot be guaranteed. Therefore, many studies use the observed spot price as the alternative proxy, and define the ex post forward premium as
, As stated by Haugom and Ullrich (2012), the ex post forward premium can be decomposed into the ex ante forward premium and a forecast error.
,
,
, Where , is the forecast error. The objective of this paper is to study what factors drive the forecast error. 2.2. the B-L Model The B-L Model states that forward premia are related to the variance and skewness of spot prices.
Where is the ex post forward premium, Var is the variance of spot prices and Skew is the skewness of spot prices. The empirical results in Bessembinder and Lemmon (2002) predicts that forward premia are negatively related to the variance of spot prices and positively related to the skewness of spot prices. According to Longstaff and Wang (2004), spot prices of electricity is slightly different from the market-clearing price in the typical financial markets, because the location of the electricity buyer and seller may have an influence on the price. Transmission line congestion, voltage constraints, or thermal limits, could disturb the electricity prices. These limitations on power deliverability may affect the realized electricity price to be the sum of (1) the ideal price that equates supply and demand and (2) the associated congestion charges available to the marginal buyer. In this sense, these locational issues may slightly increase the volatility of prices observed in the market, and need to be involved in consideration. In practice, the locational issues can be measured by two components in the prices of electricity. First, the congestion cost component reflects the marginal cost of congestion at a given node relative to the load weighted average of node prices in the whole electricity system. Second, the marginal loss component reflects the cost of losses at one location relative to the load weighted average of the system node prices. An updated model includes the two components.
3. PJM System and Data In this section, we begin by describing the structure and functions performed by the PJM smart grid system. We then discuss the data and covariates to analyze the price fluctuation. 3.1. PJM System The PJM interconnection has become one of the earliest smart grid systems for electric transition, which formed the world’s first continuing power pool since it was established in

244
1927. Early in 1962, PJM installed the first online computer to control generation, and then completed the first energy management system in 1968. In 1997, PJM opened its first bid-based energy market and then became the first fully functioning independent system operator (ISO) approved by the Federal Energy Regulatory Commission (FERC). At the beginning of 2013, PJM further enhanced its smart-grid development and implemented the Advanced Control Center in order to ensure uninterrupted operation of the electric system and maintain the steadiness of the electric market. PJM now is the biggest regional transmission organization (RTO) of power in the United States, and coordinates the movement of power in 13 states and the District of Columbia. It is responsible for the operational and planning functions of the PJM bulk power system on behalf of participant members. In order to lower the energy costs of end users, PJM manages competition among power suppliers located in multi-state service areas through establishing trading rules and protocols (Bessembinder and Lemmon, 2002; Longstaff and Wang, 2004; Li et al, 2018; Li et al, 2019). Areas served by PJM are divided by the transmission lines, which are referred to as the pricing nodes (Pnode). In summary, PJM is a power system with advanced smart grid configurations and operates a large number of transmission lines and areas. Thus, we select PJM as the target smart grid system to investigate its sustainable power management from the perspective of economics. 3.2. The PJM Spot and Forward Markets PJM serves as a clearing house, matching bids and offers, and thus giving the reasonable market-clearing price for each service area. The market-clearing price is referred to as the locational marginal price (LMP) and is updated hourly. LMP represents the incremental value of an additional megawatt (MW) of power transported to a particular Pnode. There are two basic types of markets for participants to trade electricity power. The first market is the real-time market (spot market). Participants enter sale offers and purchase bids for electricity on a real-time basis, and have electricity generated and transmitted within minutes of the spot trade. PJM serves as an auctioneer in the electronic auction market by matching bids and offers and in determining market-clearing prices. The second market in the PJM system is a forward market, referred to as the day-ahead market. In this market, participants submit offers to sell and bids prior to 4pm of the trading day, to purchase electricity for delivery at any specified hour during the subsequent day. By 4pm, PJM announces the 24 hourly clearing prices for the next day’s delivery, arranges the production schedules for generators, and informs buyers about their filled orders. Thus, PJM provides services in two markets to fulfill immediate energy consumption and hedge against potential price risk in future. 3.3. Data and Covariates We use the hourly LMP data for the complete years 2013–2016 in the PJM market. We randomly select 100 Pnodes which include over 3.5 million LMP records. Table 1 presents the descriptive statistics of hourly LMPs from the real-time and day-ahead markets. The means of the real-time and day-ahead markets are $35.75 and $36.43 respectively, and the medians between the two markets differ with a larger extant ($28.66 vs $31.05). The range of real-time LMPs is between -$640.26 and $2321.24, while the range of day-ahead LMPs is much narrower, between -$115.30 and $1060.85. In Table 1, the summary statistics of the ex post forward premia are also given. The mean is $0.69 and the median is $1.77, indicating the closeness between LMPs from two markets at one specified hour of a Pnode. But the range is between -$2072.54 and $962.30, indicating that the substantial divergence also exists in some cases.

245
To have a deep look at the forward premia, we make Figure 1 to depict the distribution of forward premia by percentile. We sort and rank the forward premia in the ascending order, and pick up the first percentile premium value, the second percentile premium value … and finally the 99th percentile premium value. The first percentile premium value, starts at -$92.69 and approaches zero at the 37th percentile (-$0.08). Starting at the 38th percentile ($0.07), the forward premium turns to be positive. About 1/3 of the forward premia in our sample are negative values. These negative premia suggest that using the forward market is unnecessary since the spot market provides a more competitive price for the power consumers. But the majority observations are still positive, suggesting that the forward market is still needed to hedge against potential price risk. As a further investigation from an intra-day perspective, we classify these forward premia by 24 hours of a day. Figure 2 presents the medians of forward premia for each hour. During the night (hour 1-5, and hour 22-24), medians of forward premia are lower than $1. Prices from both market are close. There is an upward trend from hour 2 to hour 10, as the time moves from the night to the daytime. The medians of premia move up to $3 at 10am. During the daytime, especially the working hours, the medians of premia maintain at a high level between $2 and $3. The highest median occurs at hour 19, which is the “peak load” time period with large consumption of power. Hours during the daytime have more uncertain conditions regarding power consumption, and thus lead to higher forward premia. Figure 2 shows that the occurrence of high forward premia varies across hours, which Figure 1 shows that Pnodes from different locations may also diversify forward premia. These phenomena suggest that we should take account of location issues in the analysis. 4. Analysis In this section, we investigate the factors that affect forward premia. We test the typical B-L Model and the updated model including locational cost components respectively, and compare their results. Since the data includes 100 Pnodes and hourly updated, it is a panel data. For each Pnode x at hour h of day t+1, the forward premium according to the typical B-L Model is presented as follow:
, , , , For each Pnode x at hour h of day t+1, the forward premium according to the updated model is presented as follow:
, , , , , ,
, , Table 2 presents the summary statistics of the congestion cost and the marginal loss. The means of both cost components are negative (-$0.33 and -$0.31), and the medians are non-positive. The ranges of both cost components are very large, so the variousness of both cost components may result in a large influence on the forward premium. Table 3 presents the results of regressions using the typical B-L Model and the updated model. All the coefficients are statistically significant in both models. The results of the typical B-L Model show that the hourly forward premia are negatively related to the variance of spot prices (-0.21) and positively related to the skewness of spot prices (0.03). These results are in line with Bessembinder and Lemmon (2002). By comparison, the updated model also confirms the similar relationships of the variance and skewness of spot prices (-0.3 and 0.01 respectively). Moreover, it shows that the pair of cost components, the congestion cost and marginal loss, have large influences on the forward

246
premia. Especially the congestion cost, whose coefficient is 0.44, indicates that the limitations on power deliverability plays a key role on the divergence between the spot and forward market prices. With the pair of cost components added, the updated model raises the R-square to 0.33, which largely improves the explanatory power by contrast with the typical model (0.04). In summary, the new model with cost components included provides new findings with higher accuracy to explain the potential factors that affect the forward premia in an intra-day level. 5. Conclusions In this study we examine the forward premium, which is defined as the difference between the forward price and the expected spot price of electricity. We explore the factors that affect the forward premium in an environment with multiple transmission lines and hourly updated prices. Using an intra-day dataset, we first observe that the forward premium varies in the electricity markets. It indicates the significant divergence between spot and forward electricity markets. Second, we employ the typical B-L Model and verify the forward premium is related to the variance and skewness of the spot prices in an intra-day frequency. Third, we introduce an updated model on the basis of the B-L Model, by including a pair of cost components regarding locations. Our results show that the pair of cost components, the congestion cost and marginal loss, have large influences on the forward premia, and thus the limitations on power deliverability plays a key role on the divergence between the spot and forward market prices. Acknowledgments The authors thank Carlo Andrea Bollino, Carlo Di Primio, Elena Fumagalli, Yalin Huang, Mengfei Jiang, Nasrin Khalili, Gürkan Kumbaroğlu, Alberto Lamadrid, Xi Liang, Yun Liu, Alberto Pincherle, Michael Pollitt, Anka Serbu, Adonis Yatchew, participants at the 2018 Associazione Italiana Economisti dell’ Energia (AIEE) Energy Symposium, for helpful comments and feedback. The authors gratefully acknowledge the support from National Natural Science Foundation of China (Grant No. 71803012), the Fundamental Research Funds for the Central Universities, China (Grant No. 310422125), and the Beijing Talents Fund of China (Grant No. 2016000020124G051).
Table 1: Descriptive Statistics of LMPs and Forward Premia
Real-time LMPs Day-ahead LMPs Forward Premia
Observation 3,504,500 3,504,500 3,502,000 Mean 35.75 36.43 0.69 Median 28.66 31.05 1.77 Standard Deviation 42.30 31.05 40.44 Min -640.26 -115.30 -2072.54 Max 2321.24 1060.85 962.30
Table 2: Descriptive Statistics of Congestion Cost and Marginal Loss
Congestion Cost Marginal Loss Observation 3,504,500 3,504,500 Mean -0.33 -0.31 Median 0 -0.16 Standard Deviation 21.55 2.76 Min -796.51 -232.8 Max 1791.38 302.85

247
Table 3: Regression of Forward Premia
B-L Model Updated Model
Var , S -0.21 -0.3 Skew , S 0.03 0.01 Congestion , , 0.44
Loss , , -0.07
R-square 0.04 0.33
Figure 1: Percentile of Forward Premia
Figure 2: Medians of Forward Premia by 24 hours of a day
‐100
‐80
‐60
‐40
‐20
0
20
40
60
80
Forward Premium
0,00
1,00
2,00
3,00
4,00
5,00
1 2 3 4 5 6 7 8 9 10 11 12 13 14 15 16 17 18 19 20 21 22 23 24
Medians of Forward Premia

248
Reference Bessembinder, H.; Lemmon, M. Equilibrium pricing and optimal hedging in electricity forward markets.
J. Financ. 2002, 57, 1347–1382. Botterud, A., Kristiansen, T., & Ilic, M. D. (2010). The relationship between spot and futures prices in the
Nord Pool electricity market. Energy Economics, 32(5), 967-978. Haugom, E., & Ullrich, C. J. (2012). Market efficiency and forward premia in short-term forward prices.
Energy Economics, 34(6), 1931-1941. Hirshleifer, David, 1988. Residual risk, trading costs, and commodity futures forward premia, Review of
Financial Studies 1, 173–193. Hirshleifer, David, 1990. Hedging pressure and future price movements in a general equilibrium model,
Econometrica 58, 441–28. Hirshleifer, David, and Avanidhar Subrahmanyam, 1993. Futures versus share contracting as a means of
diversifying output risk, Economic Journal 103, 620–638. Li, K.; Cursio, J.D.; Sun, Y. Principal Component Analysis of Price Fluctuation in the Smart Grid
Electricity Market. Sustainability 2018, 10, 4019. https://doi.org/10.3390/su10114019 Li, K., Cursio, J. D., Jiang, M., & Liang, X. (2019). The significance of calendar effects in the electricity
market. Applied Energy, 235, 487-494. https://doi.org/10.1016/j.apenergy.2018.10.124 Longstaff, F.A.; Wang, A. Electricity forward prices: A high-frequency empirical analysis.
J. Financ. 2004, 59, 1877–1900. Timmermann, A., Granger, C.W.J., 2004. Efficient market hypothesis and forecasting. Int. J. Forecast. 20,
15–27.

FINANCIAL PERFORMANCE ASSESSMENT OF ELECTRICITY COMPANIES: EVIDENCE FROM PORTUGAL Maria Elisabete Neves, Carla Henriques, João Vilas, Polytechnic Institute of Coimbra - Coimbra Business School The assessment of the efficiency performance of the electricity sector has been the focus of attention of several studies, but there is a lack of scientific literature specifically addressing the financial performance of electric utilities. Hence, this paper is aimed at assessing the financial performance of regulated companies operating in the Portuguese electricity market. With this objective in mind, we propose a modelling framework which combines the use of the Generalized Method of Moments (GMM) estimation method with data envelopment (DEA) analysis. The study is focused on the period of 2010 to 2014, a period particularly impacted by the financial assistance provided to the Portuguese government. The GMM estimation method allowed us to select the intrinsic corporate variables that were then used to assess the financial performance of electric companies through the Slack Based Measure (SBM) DEA model. In this framework, the return on equity (ROE), the leverage and the cash flow to total assets (CFTA) were selected as outputs, while the values of depreciations and amortizations to total assets (DATA) have been regarded as inputs. Our findings suggest that while in 2010 the majority of non-efficient firms should foster the investment in new fixed assets in order to become efficient, in 2014 an expressive percentage of non-efficient firms should decrease this type of investment. Additionally, in both periods, the majority of inefficient electric firms should further increase their ROE in order to become efficient, highlighting the role of ROE in the explanation of financial efficiency. Moreover, in 2014, non-efficient companies are able to efficiently generate cash flows since almost no adjustments are required regarding the CFTA values attained for these companies. Finally, the need to promote leverage in order to increase financial performance is more evident in 2010 than in 2014, acknowledging that the new investments made in this time frame used borrowed funds. Keywords: financial performance, electric utilities, GMM, DEA, SBM 1. Introduction
The electricity system in Europe has undergone profound transformations since the 1990’s which led to the unbundling of vertically integrated companies and to the formation of wholesale markets and retail competition [1]. The Portuguese electricity system followed the same trend experiencing two major legal and structural changes in 1995 and in 2006, respectively [2]. In 1995, the formerly 20-year-old vertically integrated State monopoly structure was reformed and converted into a dual market structure, where “regulated” and “free market” systems coexisted. Additionally, the transmission and the distribution system operators were unbundled, generation was liberalized and retail was partly opened to competition. After 2006, the dual regime was abolished favouring the free market approach. Simultaneously, the Climate and Energy programme adopted in 2008 redesigned power generation, fostering renewable electricity support schemes. In Portugal, special incentives and guaranteed purchase prices have been awarded, since 1988, to the Special Regime generators – i.e., electricity producers based on renewable energy sources and co-generation [2]. Hence, the obligation to purchase this type of electricity was first imposed to the system’s operator and as of 2007 to the last-resort supplier (EDP – The Portuguese Electricity company).
249

250
In Portugal, the increase of subsidies to renewable and conventional power generation imposed a rising burden on electricity costs, consequently creating a tariff deficit1 [1]. The increase of electricity production costs was not reflected on electricity tariffs because the Portuguese authorities advocated that the energy policy costs should not be fully covered by electricity tariffs, in particular in a period of economic crisis. As a result, the tariff deficit has considerably increased over the years. The financial burden imposed by the tariff deficit was temporarily taken by the last resort supplier of energy, the EDP (one of the major electricity players in Portugal). The Portuguese legal framework entitled the tariff deficit bearer to recuperate the corresponding amount. Therefore, EDP securitised this deficit being backed by payment rights repaid as a surcharge on electricity costs, leading EDP to place tariff deficit bonds on the market as of 2009 [1]. Several measures to tackle the electricity tariff deficit have been encompassed in the economic programme for Portugal which were aimed at correcting the tariff deficit by 2020 [3]. Nevertheless, the outcomes of these measures have been inconsistent so far, indicating the need of adopting additional measures to eliminate this deficit [1]. Furthermore, in spite of the considerable retail electricity price2 increases across the period of 2007 to 2013, the wholesale electricity prices3 suffered a down turn since 2009 [1]. Several causes may have contributed to the sector’s excess capacity and price decline [4]: 1) The impact of economic crisis on energy demand; 2) An increase in renewable power generation; 3) Merchant generation capacity increased as legacy investments; 4) CO2 prices crashed, and remained at very low levels. In addition, energy efficiency has been encouraged in all spheres, leading to a decrease of the energy intensity of overall activity sectors [5]. These forces have hindered price signals for investment from energy-only markets, also reducing the profitability of existing generation companies, dependent on wholesale market revenues. Given the importance of the electricity companies in any country’s economic system, it is desirable to assess their financial performance. Furthermore, through this type of analysis it is
possible to monitor the tariff deficit, particularly in regulated electricity companies, i.e. in the transmission, distribution or trade segments (NACE 3512, 3513, 3514). There is a wide panoply of available approaches in scientific literature that can be used to cope with the financial performance assessment of electricity utilities. In general, the financial performance evaluation of companies makes use of financial indicators which allow appraising their financial status and operating results [6]. In this framework, [7] performs the financial analysis of EU energy companies through the evaluation of several financial indicators that provide information on the financial performance of these companies over a period of interest. Their findings suggest that companies with a higher share of conventional thermal power plants in their energy mix operate with a significant decrease in profit, and generally face a decrease in their asset value. [8] analysed the 91 major energy producers from Romania using financial data from the years of 2012 to 2015 for the selected companies. Conclusions of their 1 The tariff deficit in Portugal represents a mismatch between the integral electricity tariff (which should cover energy, network, taxes, levies and other relevant costs) and the sum of the corresponding costs borne by energy utilities. 2 The retail electricity price corresponds to the price that is charged to the final consumer for the electricity produced, plus the margin on behalf of the retailer depending on the degree of competition in the market, plus the distribution and transmission network charges carried out by the Transmission System Operator (TSO) and the Distribution System Operator (DSO), and hence the regulated part of the sector, i.e. capital expenditure, which will reflect factors such as infrastructure costs, the design of the network, local factors (such as climate, geography, and environmental considerations), reliability standards, and cost of capital. The regulator generally determines the rate of return for the network operators and often the economic life of investments, which have implications on the capital costs of the system operator. 3 The wholesale electricity price reflects the costs of electricity generation, which include costs related to capital expenditure, fuels, including possible costs for environmental externalities (e.g. for CO2-allowances), and operation and maintenance costs.

251
study indicate that investments on renewables have been rather opportunistic, based on the commitment of the government to keep the subsidies, and have not been based on the realistic long-term financial performance of the companies in this area. [9] study the impact of the increase of clean energy production on the financial performance of electric firms. Their study showed that the deployment of renewable energy may not necessarily have positive economic implications (at least) for electric utilities operating inmature markets (i.e.,those markets affected by overcapacity, declining demand and so on). The authors concluded that the problem identified, may not be the adoption of more renewable energy per se but the challenging task of balancing it with conventional generation while gradually phasing out fossil fuels. Despite the undisputable merit of this type of financial performance evaluation, some limitations are recognized, namely the fact that it does not allow to identify the electric companies that could be used as benchmarks, making it hard to understand how electric companies are performing against their peers. In this context, DEA is a nonparametric approach which has been broadly accepted and used with the purpose of assessing the efficiency performance of the electricity sector because of its flexibility, thus providing help with the identification of possible sources of inefficiency offering managers the chance of studying ways to overcome them. The use of DEA in the assessment of energy and environmental performance has been particularly proficuous since the beginning of 2000. In a review conducted by [10] more than 407 DEA papers related to energy were counted, mainly focusing on the environmental efficiency assessment of electricity, energy efficiency and energy savings. Table 1 provides a brief review of the recent application of DEA models to the electricity sector. Usually, the majority of DEA models therein studied do not reconcile both energy and non-energy inputs and outputs. In this framework the novelty of our proposal is threefold: 1) it suggests the use of the SBM non-radial non-oriented DEA model to obtain the comprehensive assessment of the financial performance of Portuguese electric utilities; 2) it considers the selection of inputs and outputs through the use of the GMM estimation method; 3) it reconciles the use of non-energy inputs and outputs. In the next section, the methodology which will be followed to select the inputs and outputs, as well as the DEA approach used will be briefly described. In Section 3, a discussion of the main results obtained is presented. Finally, in Section 4 the main conclusions are drawn.

Table 1. DEA models applied to the electricity sector
Brief description Region/Country Inputs Outputs Model Reference
Uses two different approaches applied to assess the eco-efficiency of 24 power plants in a European country.
24 power plants in an European country
Total costs. Electricity generation; dust; NOx and SO2 emissions. Charnes, Cooper and Rhodes (CCR)
model. [11]
Assesses the environmental efficiency of the electricity power industry of the United States (USA)
USA (1990 - 2006).
CO2 emissions; Electricity and Losses.
Fossil fuel utilization. CCR and an environmental index. [12]
Suggests a DEA approach to appraise the overall efficiency of US electric utilities in the presence of both desirable and undesirable outputs.
USA (1996 - 2000).
Power capacity and Fuel consumption.
Non fossil power generation; Fossil power generation; NOx and SO2 emissions.
Hybrid Slack Based Measure (SBM). [13]
Proposes the application of a DEA model to assess the unified (operational and environmental) efficiency of Japanese fossil fuel power generation firms.
Japan (2005-2008).
Power capacity and number of employees. Electricity generation and CO2 emissions. Range-Adjusted Measure (RAM);
[14]
Appraises the eco-efficiency regarding electricity generation and grid corporations
China (2002-2009).
Capital; Equipment; Fuel consumption; Labor; Auxiliary power and
on-grid electricity. Electricity generation and electricity consumed.
A two-stage environmental network DEA model.
[15]
Assess energy and CO2 emission performance of electricity generation from over one hundred countries.
126 OECD and non-OECD countries (2005).
Fuel consumption. Electricity generation and CO2 emissions. A non-radial direction distance function
(DDF). [16]
Suggests a new use of the Malmquist index to measure a frontier shift among different periods.
OECD (1999–2009). Installed capacity of fuel, nuclear, hydro and other
renewables. Electricity generation and CO2 emissions. Malmquist Index [17]
Measures the environmental efficiency of the electricity power industry
16 cities in the region of Yangtze River Delta (2000 -2010)
Installed capacity and coal consumption. Power output; SO2 emissions; Soot emissions; Waste water
emissions; Solid waste emissions DDF considering constant and variable
returns to scale. [18]
Studies the relationship between fossil fuel consumption and the environmental regulation of China's thermal power generation.
China (2007-2009).
Installed capacity; Labor; total coal and gas Power generated; SO2 and NOx emissions; and soot
emissions. SBM. [19]
Performs the energy efficiency analysis of Korean power companies
Korea (2007-2011).
Capital; Labor and Energy consumption Total turnover and GHG emissions. SBM. [20]
Assesses efficiency analysis of electricity and heat generation.
25 EU member states (2000-2007).
Primary Energy; Installed capacity; Labor. Electricity and Derived Heat; CO2 emissions; and
Radioactivity. DDF; SBM. [21]
Introduces a method to overcome the infeasibility problem of mixed periods.
Iran (2003 - 2010) Installed capacity and Fuel consumption. Electricity generation; SO2, NOx and COx emissions;
Operational availability;Deviation from generation plan.
An SBM and Malmquist-Luenberger index in the presence of undesirable
outputs. [22]
Assesses the eco-efficiency change of thermal power plants (Steam, Gas and Combined Cycle) in Iran.
Iran (2003-2010) Installed capacity; Fuel consumption. Electricity generation; SO2, NOx and COx emissions;
Operational availability; Deviation from generation plan.
An SBM and Malmquist-Luenberger index in the presence of undesirable
outputs. [23]
Analyses the environmental performance and provides the benchmarks for the thermal power firms in China
30 thermal power firms in China (2010)
Production time; Coal consumption. Total industrial output value; Solid waste An integrated Enhanced Russell measure
model [24]
Assesses the environmental performance of the electricity mix of 27 European economies.
27 top European economies
Acidification potential; Climate change; Eutrophication potential; Freshwater aquatic eco-toxicity; Freshwater
sediment eco-toxicity; Human toxicity; Ionising radiation; Land use; Malodorous air; Marine aquatic eco-toxicity; Marine sediment; Photochemical oxidation; Resources antimony; Stratospheric ozone; Terrestrial eco-toxicity.
Production of 1 kW. CCR. [25]
Assesses the environmental efficiency of the electricity sector in the USA.
USA (2001, 2002 and 2003). Total energy transmission and total operating costs. Utilization of net capacity; CO2 , SO2 and NOx emissions. CCR, BBC and SBM. [26]

2. Methodology In the next sections, a brief description of the Slacks-Based Measure (SBM) non-oriented DEA model that will be used is provided and the methodology followed to select the inputs and outputs that will be subsequently used to instantiate the DEA model is described. 2.1. The DEA model
[27] paved the grounds for DEA, which is a non-parametric approach that allows assessing the relative efficiency of a set of decision making units - DMUs (organizations under assessment) with homogeneous characteristics. In general, DEA models can be grouped into four classes [28]: 1) radial and oriented, 2) radial and non-oriented, 3) non-radial and oriented, and 4) non-radial and non-oriented. In this context, by 'radial' it is meant the required proportional increase or reduction of outputs/inputs to reach efficiency, whereas 'oriented' refers to input-oriented or output-oriented DEA problems. Hence, we have used the SBM DEA model which is a non-radial and non-oriented model, since unlike radial models and the input (output)-oriented models it can provide a comprehensive efficiency assessment. Additionally, the SBM efficiency measure is immune to the units considered in the quantification of the inputs and outputs, i.e. it is "dimension free" or "units invariant." Let the set of n DMU be given by DMU1, DMU2, …, DMUn, where each unit uses m input resources to produce s outputs. The input matrix (an mn matrix) is given as X = [xij, i = 1, 2, …, m, j= 1, 2, …, n] while the output matrix (an sn matrix) is Y = [yrj, r = 1, 2, …, s, j = 1, 2, …, n], where the lines and of these matrices show the quantity of inputs and outputs, respectively, of DMUo. The SBM suggested by [29] as the following form:
, , = ∑ /
∑ /
s.t. = ,
, 0, 0, 0, (1) In problem (1) it is assumed that both X 0. If 0, then its value is replaced by a very small positive number so that the term / is interpreted as a penalty. It can also be seen that an increase in either or , considering everything else constant, will decrease the objective value of problem (1). Moreover, it can be concluded that 0 < < 1. In order to account for variable returns to scale (VRS) it is only necessary to add the constraint 1 into model (1). Then, problem (1) can be converted into problem (2) by considering
a positive scalar variable t:
, , , = ∑ /
s.t. ∑ / 1,
= , ,
0, 0, 0, t >0 (2) The optimal solution is given as: * = *, * = */t*, ∗ = / t*, ∗ = / t*.
253

254
A DMUo is SBM-efficient if and only if *= 1 which is equivalent to ∗ = 0 and ∗ = 0. Moreover, the set of indices matching with ∗ 0 is called the reference set of an SBM-inefficient DMUo. The point of the efficient frontier which can be viewed as a target DMU for the SBM-inefficient DMUo is: ( , ) = ( - ∗, + ∗) = (∑ ∗ , ∑ ∗ . (3) 2.2. Selection of inputs and outputs
One of DEA’s drawbacks is that it does not provide a means to select the inputs and outputs that should be considered for the assessment of each DMU. However, the efficiency score attained for each DMU is highly dependent on this selection procedure [30]. In this case, if the number of inputs and outputs is considerably large, the dimensionality of the production space will increase and proportionally the discriminatory power of DEA will decrease [31]. Hence, one of the greatest challenges in a DEA model formulation is the identification of the truly significant input and output variables. Although the available literature on the selection of these particular inputs and outputs is not prolific, there are several approaches that can be used to deal with this particular problem [30]. In our case, the inputs and outputs considered will be evaluated through the GMM estimation method.
Table 2. Firm’s specific characteristics and external factors
1 In fact, a high level of financial leverage can increase ROE, because it means a business is using the minimum possible amount of equity, instead relying on debt to fund its operations. As a result, the amount of equity in the denominator of the return on equity equation is minimized. Therefore, if any profits are generated by funding activities with debt, these changes are added to the numerator in the equation, thereby increasing ROE, leading to the so-called financial leverage effect.
Variable Description
ROE It compares the equity invested to the net income of the company and it provides a measure to analyze the success of the investments [8]. This indicator has been used as a proxy of financial performance in several studies (see e.g. [32], [33], [34])
LIQUID Is the liquidity given by the ratio between current assets and current liabilities of company i in period t [35]. [36] and [37] demonstrate that working capital management influences firms’ performance.
LEVERAGE Is the financial leverage given by the ratio between total debt and total assets of company i in period t [38]. [39] established a positive relationship between leverage and firm’s
performance1.
SIZE
Is the logarithm of total assets of company i in period t [40]. In [41] it is concluded that the firms’ size has a positive and significant impact on firms’ performance. Similar conclusions were also reached in [42] which conclude that performance is positively influenced by firms’ size.
CFTA Is the cash flow to total assets as considered in [43] of company i in period t. With this regard, [44] examine the relationship between changes in cash flow positions and firms’ financial performance.
DATA Is the value of depreciations and amortizations to total assets [45] of company i in period t. Depreciations have been used as a firms’ measure of performance in [46].
GDP Is a macroeconomic variable and represents the real Gross Domestic Product growth in period t. In this context, [47] found significant effects between GDP growth rate an ROA.
CCI Is the Consumer Confidence Index proposed by [48] for company i in period t. In a recent paper, [49] found that investor’s sentiment is positively related to stock’s returns, a measure of firm’s performance.

255
Although there is no consensus on which variables best explain a firm’s performance, we have selected ROE for assessing the financial performance of every firm, i.e. of each DMU. The use of the GMM estimation method can help us find which items have an impact on ROE, and classify inputs and outputs easily according to the type of influence of each item on the DMU’s ROE. We have treated the ROE of every DMU as a dependent variable and the variables given in Table 2 as explanatory variables. Therefore, the proposed GMM model was of the form: ROE β β LIQUID β LEVERAGE β SIZE β CFTA β DATAβ GDP β CCI ,……………………………………................................… (4) where it is the random disturbance. The model was estimated by using the panel data methodology. Two issues were considered in making this choice. First, unlike cross-sectional analysis, panel data allows controlling for individual heterogeneity and this fact is very important because the ROE depends on management decisions and this circumstance could be very closely related to the specificity of each firm. The second issue addressed by using the panel data methodology is the endogeneity problem. This methodology accommodates the possible endogeneity between the dependent variable and some of the explanatory variables in the model by means of appropriate instruments. In particular, the GMM system estimator uses lagged values of the dependent variable in levels and in differences as instruments, as well as lagged values of other repressors, which could potentially suffer from endogeneity. The latter problem would lead to a correlation between those endogenous variables and the error term and to inconsistent estimates if not properly taken care of [50]. The GMM estimation method that we propose to select the inputs and outputs considered in the SBM model suggest that both intrinsic corporate variables and external factors are important in explaining the financial performance of electric companies. Therefore, we have arrived at the results provided in Table 3. In order to conduct the DEA financial performance evaluation, we have only selected those explanatory variables with a significance level of 10%. Besides ROE (our dependent variable), from the management stand point, leverage and CFTA can be deemed as outputs since they have positive coefficients while DATA as inputs as they affect ROE negatively. We have used a sample of 743 Portuguese firms from Amadeus database which belong to the following NACE Rev. 2 codes: 351 - Electric power generation, transmission, distribution and trade. However, because of data availability we have ended up only using 213 firms in 2010 and 2014, respectively (only firms with information regarding all inputs and outputs selected and with a positive ROE in both periods have been considered). The descriptive statistics of these firms for the years of 2010 and 2014 are illustrated in Tables 4 and 5, respectively. As it can be seen in Tables 4 and 5 there is a high variability of ROE across the sample of electric firms assessed in both periods. As a result, it might be concluded that, in Portugal, the economic crisis had a different impact on companies’ financial performance, depending on the type of source used to produce electricity.

256
Table 3. Estimation results of the model (1)
Variable Coefficient STD. Error Z P value
-const -169.906 (65.166) -2.61 0.009 ***
ROE 0.057 (0.028) 2.08 0.037 **
LIQUID 0.423 (0.171) 2.48 0.013 **
LEVERAGE 38.713 (14.744) 2.63 0.009 ***
SIZE 18.945 (7.881) 2.40 0.016 **
CFTA 204.649 (21.822) 9.38 0.000 ***
DATA -187.964 (39.744) -4.73 0.000 ***
GDP -2.427 (0.955) -2.54 0.011 **
CCI 0.202 (0.113) 1.79 0.073 *
Sargan 9.448 (8) 0.306
Wald 97.77 (8) 0.000
AR (1) -1.009 0.3013
AR (2) -0.638 0.524
The regressions are performed by using an unbalanced panel data composed by 743 companies and about 1860 observations. The remainder of the information needed to read this table is as follows: i) Heteroscedasticity consistent asymptotic standard error in parentheses. It should also be noted that: i) *, **, and *** indicates significance levels at 10%, 5% and 1% respectively; (ii) The Sargan test with a p value greater than 5% shows that the instruments are valid, and the values in parentheses of the test represent degrees of freedom; (iii) The Wald test has a p value less than 5% which means that the joint significance and the coefficients are significant distributed asymptotically as χ2 under a null hypothesis without significance, with degrees of freedom in parentheses. The table shows that there is no second order correlation problems in the model, see AR (2).
Table 4. Descriptive statistics of data obtained in 2010
ROE CFTA Leverage DATA
Mean 44.869 0.156 0.752 0.063
Standard deviation 56.918 0.096 0.375 0.044
Minimum 0.400 0.001 0.042 0.000
Maximum 559.100 0.639 1.797 0.289 Source: Authors’ own calculations
Table 5. Descriptive statistics of data obtained in 2014
ROE CFTA Leverage DATA
Mean 42.677 0.201 0.601 0.067
Standard deviation 56.816 0.131 0.327 0.048
Minimum 0.800 0.019 0.009 0.000
Maximum 737.900 0.719 1.626 0.319 Source: Authors’ own calculations.

257
3. Results As shown in Tables 6 and 7, there are 11 and 12 efficient firms (efficiency score = 1) in 2010 and in 2014, respectively. Specific information on these efficient DMUs is provided in Tables 8 to 11. In 2010, the two efficient firms which are more often seen as benchmarks are DMUs 19 and 165, which are two biomass and natural gas thermal power stations, respectively. DMUs 19 and 165 present a mean ROE above average (44.869) and a DATA value significantly below average (0.067). Regarding the leverage and the CFTA values, DMU 165 is slightly below average (0.752) for the first indicator and significantly above average (0.156) for the second one, while DMU 19 shows a leverage value above average and a CFTA value below average. These two benchmark companies have a leverage value lower than 1, suggesting a lower financial risk. In this context, it is worth mentioning that thermoelectric generating companies have a wholesale margin on its production, depending on the market conditions which are namely affected by the use of capacity mechanisms2 and the introduction and design of renewable support schemes. In Portugal, these capacity mechanisms which reward the provision of additional capacity in the electricity system in order to balance peak loads and be able to ensure security of supply, might help understand the efficiency of natural gas power utilities in this period. These results are also consistent with the ones obtained in [8], where the financial performance of electric companies which used classical sources followed an upward trend from 2009 until 2010. Additionally, it is interesting to observe that only DMU 13 belongs to NACE 3514 - Trade of electricity - with all the remaining efficient firms belonging to NACE 3511 - Production of electricity. In this context, DMU 13 has the lowest ROE and CFTA values of the sample of efficient firms, but its efficiency is guaranteed because it reaches the maximum leverage (eventually related to the tariff deficit) and the minimum DATA of the 213 companies considered (this sector is not particularly impacted with capital investment and thus depreciations). Moreover, from the efficient companies that produce electricity based on renewable sources, there is only one hydropower utility and three wind farm utilities, two of which have the highest ROE values of the sample. Finally, only DMU13 (a trade company), and two conventional power thermoelectric utilities, DMUs 131 and 165 (two thermoelectric utilities), report a significantly positive number of employees directly assigned to these firms, i.e. 23, 139 and 49 employees, respectively. These results might be explained by the fact that a considerable part of the costs faced by renewable sources is related to investment, i.e., depreciation of the assets. The other costs, in particular with employees, selling and general and administrative costs are insignificant, since most of these companies have reported no employees at all. This can be easily understood because of the fact that renewable sources are mostly controlled by software and the sale of energy automatically enters into the grid and is purchased by the distributors. Regarding 2010, in 2014, only four electric companies remain efficient, i.e. DMUs 13 (trade), 131 (Coal), 165 (Natural Gas) and 1105 (Biomass) – Tables 8 and 10. It can also be concluded that the mean ROE, leverage and DATA values of efficient firms suffer a decrease, while CFTA faces an increase – Tables 9 and 11. Overall, this suggests that, when contrasting the values achieved in 2014 with the ones obtained in 2010, efficient companies reduce their financial performance, but increase their efficiency in terms of generating returns out of their assets, also reducing their debts.
2 A capacity mechanism compensates the delivery of additional capacity in the electricity system in order to balance peak loads and be able to ensure security of supply.

Table 6. Efficiency scores and rankings of electric firms in 2010
DMU Efficiency
Score Rank DMU
Efficiency Score
Rank DMU Efficiency
Score Rank DMU
Efficiency Score
Rank DMU Efficiency
Score Rank DMU
Efficiency Score
Rank
11 0.003 178 150 0.052 34 1102 0.007 96 1151 0.047 37 1207 0.004 146 1256 0.000 210 13 1.000 1 151 0.004 141 1103 0.011 69 1152 0.004 168 1208 0.005 133 1257 0.005 115 14 0.005 120 152 0.006 107 1105 1.000 1 1153 0.009 86 1209 0.007 97 1258 0.004 163 15 0.004 154 153 0.045 40 1106 0.006 109 1154 0.006 110 1210 0.004 148 1259 0.005 126 17 0.002 184 154 0.060 30 1110 0.010 78 1155 0.069 29 1211 0.010 80 1261 0.005 121 18 0.003 174 159 0.010 81 1111 0.027 52 1156 0.009 87 1212 0.001 192 1263 0.003 172 19 1.000 1 160 0.014 63 1115 1.000 1 1161 0.406 15 1213 0.000 212 1264 0.004 152
110 0.003 169 161 0.052 35 1116 0.005 113 1162 0.034 49 1214 0.264 18 1265 0.001 194 111 0.006 106 162 0.108 25 1119 0.240 19 1163 0.014 61 1215 0.004 155 1266 0.001 205 112 0.016 58 165 1.000 1 1120 0.494 14 1164 0.007 100 1218 0.004 137 1267 0.001 195 113 0.047 38 166 0.008 94 1121 0.780 13 1165 0.013 65 1219 0.003 170 1268 0.001 193 115 0.005 134 167 0.016 59 1122 0.002 182 1166 0.009 88 1220 0.011 73 1269 0.050 36 116 0.054 32 168 0.018 57 1123 0.005 132 1167 0.003 177 1221 0.008 95 1272 0.004 149 117 0.008 93 169 0.006 105 1124 0.004 153 1171 0.020 56 1222 0.122 24 1273 0.000 211 118 0.004 164 170 0.004 138 1125 0.007 99 1175 0.004 167 1223 0.005 122 1274 0.005 124 119 0.215 20 171 0.070 28 1126 0.045 39 1176 0.001 198 1224 1.000 1 1275 0.000 207 120 0.004 158 174 0.037 48 1127 0.003 171 1177 0.005 118 1225 0.000 209 1276 0.004 140 121 0.056 31 175 0.014 62 1128 0.004 144 1179 0.010 82 1226 0.005 116 1277 0.004 147 122 0.044 41 176 0.006 112 1129 0.809 12 1180 0.108 26 1227 0.002 186 1278 0.005 136 123 0.011 76 177 0.002 189 1130 0.025 53 1181 0.005 114 1228 0.003 173 1280 0.004 160 124 0.038 46 179 0.034 50 1131 0.004 162 1183 0.005 130 1229 1.000 1 1281 0.005 125 125 0.002 185 180 0.005 119 1132 0.212 21 1184 0.004 142 1230 0.011 75 1282 0.003 180 127 0.364 16 181 0.008 90 1133 0.005 123 1186 0.014 60 1232 0.000 208 1283 1.000 1 128 0.005 129 182 0.005 127 1135 0.004 157 1188 0.002 187 1234 0.010 85 1286 0.042 42 129 0.008 92 183 0.001 200 1137 0.037 47 1189 0.004 166 1235 0.001 199 1287 0.001 197 131 1.000 1 184 0.010 84 1138 0.131 23 1191 0.002 188 1237 0.006 108 1288 0.004 143 132 0.054 33 186 0.039 44 1139 0.006 111 1192 0.038 45 1238 0.001 196 1289 0.002 181 134 0.004 139 187 0.012 67 1140 0.024 54 1193 0.008 89 1239 0.003 176 1292 0.004 159 137 0.100 27 188 0.011 72 1141 0.007 101 1194 0.006 104 1241 0.001 201 138 1.000 1 191 0.031 51 1142 0.003 175 1196 0.011 74 1246 0.001 202 139 0.005 117 193 0.021 55 1144 0.001 204 1198 0.004 150 1247 0.000 213 140 0.004 151 194 0.012 66 1145 0.010 79 1200 0.005 131 1248 0.007 98 141 0.011 70 195 0.004 165 1146 0.014 64 1201 0.134 22 1249 0.001 203 143 0.007 102 197 0.004 156 1147 0.005 135 1202 0.361 17 1251 0.011 71 145 0.010 77 198 0.002 183 1148 0.004 145 1203 0.002 190 1252 0.004 161 148 0.007 103 199 0.008 91 1149 0.012 68 1204 0.003 179 1254 0.039 43 149 1.000 1 1100 0.010 83 1150 0.005 128 1206 0.002 191 1255 0.001 206
258

259
Table 7. Efficiency scores and rankings of electric firms in 2014
DMU Efficiency
Score Rank DMU
Efficiency Score
Rank DMU Efficiency
Score Rank DMU
Efficiency Score
Rank DMU Efficiency
Score Rank DMU
Efficiency Score
Rank
11 0.001 190 150 0.043 42 1102 0.010 77 1151 0.002 148 1207 0.022 61 1256 0.000 207 13 1.000 1 151 0.002 152 1103 0.001 171 1152 0.001 179 1208 0.000 203 1257 0.006 96 14 0.002 161 152 0.006 93 1105 1.000 1 1153 0.001 172 1209 0.007 87 1258 0.003 132 15 0.001 181 153 0.003 138 1106 0.014 65 1154 0.044 35 1210 0.005 99 1259 0.001 188 17 0.001 193 154 0.044 38 1110 0.004 108 1155 0.004 117 1211 0.008 83 1261 0.009 81 18 0.003 130 159 1.000 1 1111 0.046 33 1156 0.010 72 1212 0.005 98 1263 0.004 110 19 0.362 16 160 0.061 24 1115 0.003 133 1161 0.001 173 1213 0.036 47 1264 0.004 120 110 0.000 201 161 0.044 39 1116 0.004 109 1162 0.003 135 1214 0.006 92 1265 0.054 26 111 0.007 89 162 0.031 49 1119 0.042 43 1163 0.006 95 1215 0.003 140 1266 0.015 64 112 0.173 19 165 1.000 1 1120 0.002 145 1164 0.008 86 1218 0.000 212 1267 0.043 41 113 0.024 57 166 0.011 70 1121 0.003 127 1165 0.023 59 1219 0.001 180 1268 0.053 27 115 0.001 175 167 0.044 36 1122 0.001 170 1166 0.009 80 1220 0.009 79 1269 0.001 197 116 0.001 182 168 1.000 1 1123 0.006 93 1167 0.150 22 1221 0.014 66 1272 0.009 78 117 0.049 29 169 0.005 101 1124 0.002 150 1171 0.003 124 1222 0.000 200 1273 0.000 213 118 0.002 167 170 0.003 136 1125 0.167 21 1175 0.046 31 1223 0.002 162 1274 0.005 105 119 0.080 23 171 0.002 149 1126 0.003 129 1176 0.001 192 1224 0.027 54 1275 0.024 58 120 0.002 166 174 0.003 137 1127 0.047 30 1177 0.473 13 1225 0.000 208 1276 0.004 121 121 0.179 18 175 0.170 20 1128 0.002 147 1179 0.010 73 1226 0.003 142 1277 0.002 165 122 0.029 51 176 0.006 97 1129 0.003 139 1180 1.000 1 1227 0.005 107 1278 0.003 123 123 0.060 25 177 0.001 184 1130 0.009 82 1181 1.000 1 1228 0.002 160 1280 0.002 159 124 0.034 48 179 0.007 90 1131 0.000 204 1183 0.043 40 1229 0.000 206 1281 0.010 76 125 0.001 189 180 0.000 204 1132 0.005 102 1184 0.430 15 1230 0.011 71 1282 0.001 183 127 1.000 1 181 0.003 125 1133 0.004 122 1186 0.027 53 1232 0.001 195 1283 0.023 60 128 0.008 84 182 0.003 143 1135 0.004 118 1188 1.000 1 1234 0.002 154 1286 0.448 14 129 0.051 28 183 0.003 141 1137 0.019 62 1189 0.338 17 1235 0.003 131 1287 0.002 164 131 1.000 1 184 0.001 168 1138 0.002 163 1191 0.001 199 1237 0.005 103 1288 0.001 198 132 0.038 46 186 0.002 146 1139 0.004 113 1192 0.025 55 1238 0.000 209 1289 0.004 115 134 0.005 104 187 0.046 32 1140 0.004 111 1193 0.002 158 1239 0.001 174 1292 0.001 196 137 0.038 45 188 0.000 211 1141 0.001 177 1194 0.013 67 1241 0.000 202 138 0.001 169 191 0.028 52 1142 0.004 114 1196 0.013 68 1246 0.003 128 139 0.018 63 193 0.042 44 1144 0.010 75 1198 0.004 119 1247 0.000 210 140 1.000 1 194 0.003 144 1145 0.002 156 1200 0.008 85 1248 0.003 126 141 0.001 185 195 0.002 155 1146 0.005 100 1201 0.010 74 1249 0.001 186 143 0.007 88 197 0.001 176 1147 0.007 91 1202 0.005 106 1251 0.003 134 Code: 145 0.002 151 198 0.001 187 1148 0.024 56 1203 0.045 34 1252 0.002 157 Efficient in both periods 148 0.012 69 199 0.004 112 1149 0.002 153 1204 0.044 37 1254 0.004 116 Efficient in 2014 149 1.000 1 1100 0.029 50 1150 0.001 178 1206 0.001 194 1255 0.001 191 Efficient in 2010

In 2014, DMUs 13, 1180 and 165, become the three firms more often selected to be benchmarks. DMU 13, which was also efficient in 2010, becomes the efficient electric company more frequently selected as a reference to other non-efficient companies. In what regards this company’s financial performance, in 2014, there is a significant increase of ROE. Concerning the leverage and the CFTA values, this firm also has a value above average (0.601) for the first indicator (eventually related to the tariff deficit) and frankly below average (0.201) for the second indicator (suggesting that the net amount of cash being spun off by or used in the operations of this company is low), respectively. Once more, this is the only trade company considered as efficient. On the other hand, the 2nd firm more frequently used as a benchmark, DMU 1180 (a renewable power producer), presents values for the first output slightly below average and for the second output significantly above average. DMU 165 remains efficient and in 2014 is the 3rd firm more frequently considered as benchmark. If we compare its financial performance with the one attained in 2010, there is a decrease of ROE, while the other factors remain near the previous values. Overall, it can be concluded that the most efficient firms in both periods have mean values above average vis-à-vis the ROE (suggesting that efficient firms are good investment opportunities that are very profitable), CFTA (signifying that companies are able to generate cash flows from their current operations) and leverage (indicating that, in average, efficient electric companies own assets which do not allow them to cover their debt, some of them eventually due to the tariff deficit), while the mean DATA value is low, being near the average value of the sample, i.e. companies are replacing fixed assets with new ones in a fast manner (see Tables 8 to 11).
Table 8. Specific characteristics of efficient electric firms in 2010
Electricity branch/Source
DMU ROE CFTA Leverage DATA Nº of times considered
as reference Trade 13 2.700 0.001 1.797 0.000 73
Biomass 19 56.000 0.102 0.936 0.000 150 Coal 131 97.600 0.447 0.906 0.010 7
Wind power 138 98.800 0.110 1.760 0.069 5 Biomass 149 98.200 0.639 0.809 0.289 0
Natural Gas 165 83.700 0.559 0.660 0.002 157 Biomass 1105 90.600 0.484 1.269 0.200 0
Renewable power 1115 49.100 0.108 1.725 0.046 5 Wind power 1224 559.100 0.089 1.056 0.057 27 Wind power 1229 492.500 0.083 0.996 0.049 0 Hydropower 1283 53.500 0.142 1.481 0.003 40
Source: Authors’ own calculations.
Table 9. Descriptive statistics regarding efficient electric firms in 2010
ROE CFTA Leverage DATA
Mean 152.891 0.251 1.218 0.066
Standard deviation 187.237 0.230 0.411 0.094
Minimum 2.700 0.001 0.660 0.000
Maximum 559.100 0.639 1.797 0.289
Source: Authors’ own calculations.
Table 10. Specific characteristics of efficient electric firms in 2014
260
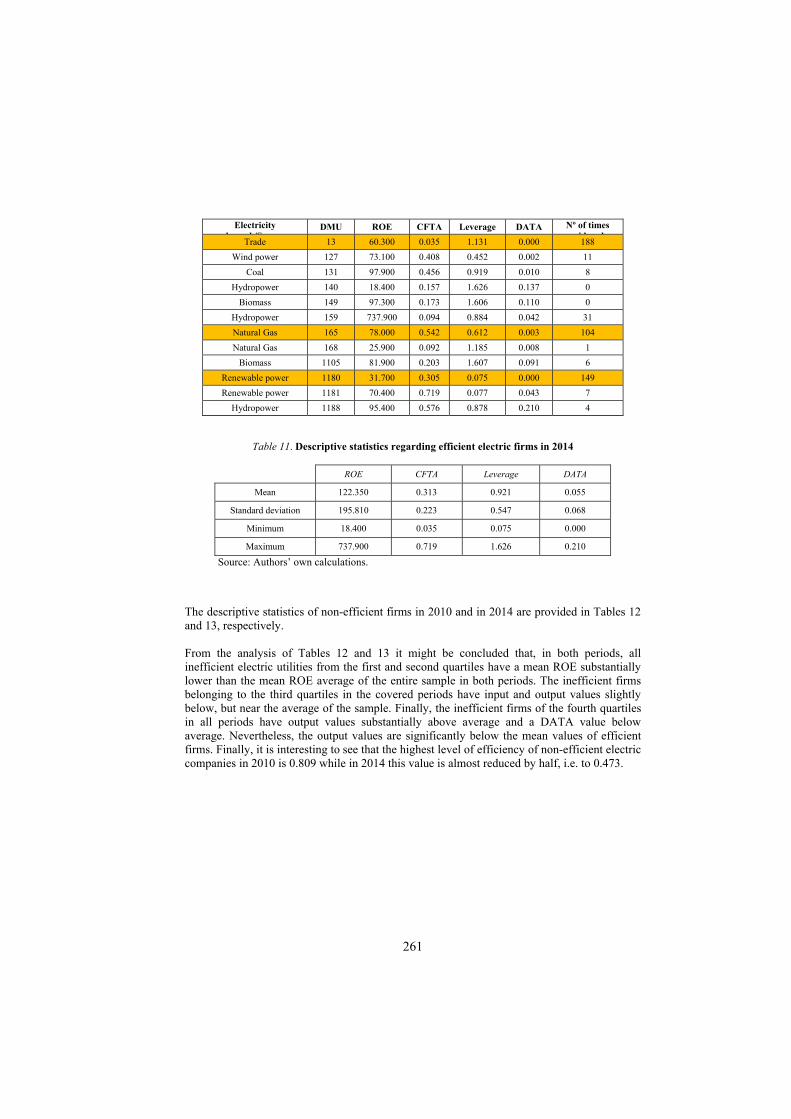
261
Electricity
b h/SDMU ROE CFTA Leverage DATA Nº of times
id dTrade 13 60.300 0.035 1.131 0.000 188
Wind power 127 73.100 0.408 0.452 0.002 11
Coal 131 97.900 0.456 0.919 0.010 8
Hydropower 140 18.400 0.157 1.626 0.137 0
Biomass 149 97.300 0.173 1.606 0.110 0
Hydropower 159 737.900 0.094 0.884 0.042 31
Natural Gas 165 78.000 0.542 0.612 0.003 104
Natural Gas 168 25.900 0.092 1.185 0.008 1
Biomass 1105 81.900 0.203 1.607 0.091 6
Renewable power 1180 31.700 0.305 0.075 0.000 149
Renewable power 1181 70.400 0.719 0.077 0.043 7
Hydropower 1188 95.400 0.576 0.878 0.210 4
Table 11. Descriptive statistics regarding efficient electric firms in 2014
ROE CFTA Leverage DATA
Mean 122.350 0.313 0.921 0.055
Standard deviation 195.810 0.223 0.547 0.068
Minimum 18.400 0.035 0.075 0.000
Maximum 737.900 0.719 1.626 0.210
Source: Authors’ own calculations.
The descriptive statistics of non-efficient firms in 2010 and in 2014 are provided in Tables 12 and 13, respectively. From the analysis of Tables 12 and 13 it might be concluded that, in both periods, all inefficient electric utilities from the first and second quartiles have a mean ROE substantially lower than the mean ROE average of the entire sample in both periods. The inefficient firms belonging to the third quartiles in the covered periods have input and output values slightly below, but near the average of the sample. Finally, the inefficient firms of the fourth quartiles in all periods have output values substantially above average and a DATA value below average. Nevertheless, the output values are significantly below the mean values of efficient firms. Finally, it is interesting to see that the highest level of efficiency of non-efficient electric companies in 2010 is 0.809 while in 2014 this value is almost reduced by half, i.e. to 0.473.

262
Table 12. Descriptive statistics regarding non efficient electric firms in 2010
1st Quartile ROE CFTA Leverage DATA Efficiency score
Mean 11.976 0.126 0.540 0.081 0.002
Standard deviation 8.883 0.073 0.349 0.053 0.001
Minimum 0.400 0.042 0.059 0.033 0.000
Maximum 34.700 0.336 1.326 0.277 0.004
2nd Quartile ROE CFTA Leverage DATA Efficiency score
Mean 28.028 0.153 0.689 0.066 0.005
Standard deviation 10.853 0.083 0.292 0.037 0.001
Minimum 7.000 0.032 0.042 0.019 0.004
Maximum 52.100 0.436 1.493 0.251 0.005
3rd Quartile ROE CFTA Leverage DATA Efficiency score
Mean 42.200 0.172 0.723 0.062 0.009
Standard deviation 16.997 0.076 0.297 0.028 0.002
Minimum 3.100 0.031 0.095 0.002 0.006
Maximum 74.600 0.379 1.405 0.160 0.014
4th Quartile ROE CFTA Leverage DATA Efficiency score
Mean 74.873 0.150 0.961 0.043 0.125
Standard deviation 38.075 0.086 0.362 0.028 0.178
Minimum 9.500 0.015 0.050 0.001 0.014
Maximum 221.700 0.476 1.736 0.104 0.809
Source: Authors’ own calculations.
Table 13. Descriptive statistics regarding non efficient electric firms in 2014
1st Quartile ROE CFTA Leverage DATA Efficiency score
Mean 12.437 0.105 0.542 0.060 0.001
Standard deviation 8.803 0.047 0.296 0.029 0.000
Minimum 0.800 0.019 0.009 0.003 0.000
Maximum 39.700 0.251 1.008 0.133 0.002
2nd Quartile ROE CFTA Leverage DATA Efficiency score
Mean 25.508 0.177 0.528 0.066 0.003
Standard deviation 9.437 0.068 0.316 0.031 0.001
Minimum 1.200 0.054 0.063 0.003 0.002
Maximum 51.800 0.360 1.257 0.171 0.004
3rd Quartile ROE CFTA Leverage DATA Efficiency score
Mean 39.674 0.230 0.552 0.065 0.008
Standard deviation 13.443 0.078 0.221 0.025 0.003
Minimum 5.800 0.031 0.076 0.001 0.004
Maximum 83.300 0.396 0.963 0.137 0.018
4th Quartile ROE CFTA Leverage DATA Efficiency score
Mean 74.572 0.267 0.704 0.082 0.089
Standard deviation 33.999 0.177 0.329 0.078 0.117
Minimum 6.500 0.025 0.059 0.000 0.019
Maximum 136.500 0.630 1.371 0.319 0.473
Source: Authors’ own calculations.

263
The influence of DATA on efficiency might be seen in Figures 1 a) and b) for 2010 and 2014, respectively. In 2014 some inefficient firms have slightly increased their mean DATA, indicating that these companies have reduced the rate of replacement of fixed assets with new ones (Figure 1 b)). Additionally, it is possible to conclude that in order to become efficient the majority of non-efficient firms should reduce DATA in 2010 (implying the necessity of increasing the investment in new fixed assets in the future), while in 2014 there is a representative percentage of non-efficient firms that have increased their DATA values which according to projections should be maintained at these levels (suggesting that new investments took place from 2010 to 2014) – see Figure 2. In Figure 3 it is possible to see the positive influence that ROE has on efficiency. Overall, the majority of inefficient electric firms should further increase their ROE in order to become efficient – Figure 4. Figure 5 depicts the positive effect of CFTA on efficiency. While in 2010 some companies still have to improve this indicator, the majority of inefficient electric firms in 2014 should maintain the values already reached for this indicator in 2014 – Figure 6. These outcomes might be related to the economic recovery that begun precisely in 2014. Finally, the influence of leverage on financial efficiency might be see in Figure 7. Additionally, from Figure 8 it can also be observed that the increase required for this output to make non-efficient firms efficient is more evident in 2010 than in 2014. These results suggest that the new investments made within this time frame were based on borrowed funds.
a) 2010
b) 2014 Figure 1. DATA values vs efficiency scores.
0
0.05
0.1
0.15
0.2
0.25
0.3
0.35
0 0.1 0.2 0.3 0.4 0.5 0.6 0.7 0.8 0.9 1
0
0.05
0.1
0.15
0.2
0.25
0.3
0.35
0 0.1 0.2 0.3 0.4 0.5 0.6 0.7 0.8 0.9 1

264
a) 2010
b) 2014
Figure 2. Real DATA values vs projections.
a) 2010
b) 2014
Figure 3. ROE vs efficiency scores
0
0.05
0.1
0.15
0.2
0.25
0.3
0.3511 11
813
415
417
519
111
1111
2911
4411
5611
7911
9612
1112
2612
4712
6312
77
DATA Projection (DATA)
0
0.05
0.1
0.15
0.2
0.25
0.3
0.35
11 117
132
152
171
188
1110
1128
1144
1161
1181
1201
1215
1230
1252
1268
1286
DATA Projection (DATA)
0
100
200
300
400
500
600
700
800
0 0.1 0.2 0.3 0.4 0.5 0.6 0.7 0.8 0.9 1
0
100
200
300
400
500
600
700
800
0 0.1 0.2 0.3 0.4 0.5 0.6 0.7 0.8 0.9 1

265
a) 2010 b) 2014
Figure 4. Real ROE values vs projections.
a) 2010
b) 2014
Figure 5. CFTA vs efficiency scores.
0
100
200
300
400
500
600
700
80011 11
813
415
417
519
111
1111
2911
4411
5611
7911
9612
1112
2612
4712
6312
77
ROE Projection (ROE)
0
100
200
300
400
500
600
700
800
11 117
132
152
171
188
1110
1128
1144
1161
1181
1201
1215
1230
1252
1268
1286
ROE Projection (ROE)
0
0.1
0.2
0.3
0.4
0.5
0.6
0.7
0.8
0 0.1 0.2 0.3 0.4 0.5 0.6 0.7 0.8 0.9 1
0
0.1
0.2
0.3
0.4
0.5
0.6
0.7
0.8
0 0.1 0.2 0.3 0.4 0.5 0.6 0.7 0.8 0.9 1

266
a) 2010 b) 2014
Figure 6. Real CFTA values vs projections.
a) 2010
b) 2014
Figure 7. leverage vs efficiency scores in 2010.
0
0.1
0.2
0.3
0.4
0.5
0.6
0.7
0.811 118
134
154
175
191
1111
1129
1144
1156
1179
1196
1211
1226
1247
1263
1277
CFTA Projection (CFTA)
0
0.1
0.2
0.3
0.4
0.5
0.6
0.7
0.8
11 117
132
152
171
188
1110
1128
1144
1161
1181
1201
1215
1230
1252
1268
1286
CFTA Projection (CFTA)
0
0.2
0.4
0.6
0.8
1
1.2
1.4
1.6
1.8
2
0 0.1 0.2 0.3 0.4 0.5 0.6 0.7 0.8 0.9 1
0
0.2
0.4
0.6
0.8
1
1.2
1.4
1.6
1.8
2
0 0.1 0.2 0.3 0.4 0.5 0.6 0.7 0.8 0.9 1

267
a) 2010 b) 2014
Figure 8. Real leverage values vs projections in 2010.
Conclusions
This paper conveys a modelling framework which combines the use of the GMM estimation method to select the inputs and outputs used in a DEA SBM model. This modelling framework was used to assess the financial performance of 213 regulated companies operating in the Portuguese electricity market. This approach is new and to the best of our knowledge it is the first time that it has been used in financial performance evaluation. From the analysis conducted it was possible to identify the Portuguese electric companies that could be used as benchmarks, providing an additional understanding of how Portuguese electric companies are performing against their peers. Regarding the analysis of the years covered (2010-2014), distinct impacts on companies’ financial performance were obtained, mainly depending on the type of source used to produce electricity. From 2010 to 2014 only four electric companies remained efficient, belonging to distinct electric branches, i.e. DMUs 13 (trade), 131 (Coal), 165 (Natural Gas) and 1105 (Biomass). In 2014, it was possible to ascertain a decrease of the mean ROE, leverage and DATA values of efficient firms, while CFTA improved. These outcomes, point out that, when comparing the values attained in 2014 with the ones obtained in 2010, efficient companies had a reduction of their financial performance, but they also increased their efficiency in terms of generating returns out of their assets, in spite of increasing the rate of replacement of fixed assets with new ones, also reducing their debts. In general, it can be established, in both periods, that: efficient firms were very profitable according to their ROE; they were efficient in the generation of cash flows from their current operations; some efficient electric companies owned assets which did not allow them to cover their debt (which might be explained by the tariff deficit supported by trade companies); efficient companies were replacing fixed assets with new ones in a fast manner. Finally, it was also possible to conclude that while in 2010 the majority of non-efficient firms should increase the investment in new fixed assets in order to become efficient, in 2014 a representative percentage of non-efficient firms should decrease this type of investment. Additionally, in both periods, the majority of inefficient electric firms should further increase their ROE in order to become efficient, highlighting the role of ROE in the explanation of financial efficiency. Regarding, CFTA, while in 2010 some companies still had to improve this indicator, in 2014, the majority of inefficient electric firms, should maintain the values already accomplished for
0
0.2
0.4
0.6
0.8
1
1.2
1.4
1.6
1.8
2
Emp
117
132
153
174
188
1110
1128
1142
1155
1177
1194
1210
1225
1246
1261
1276
Leverage Projection (Leverage)
0
0.2
0.4
0.6
0.8
1
1.2
1.4
1.6
1.8
2
Emp
115
128
148
166
181
198
1120
1132
1147
1163
1183
1201
1214
1228
1248
1264
1278
Leverage Projection (Leverage)

268
it. These results might be explained with the recovery of the Portuguese economy in the aftermath of the Great Financial Crisis. Finally, the need to foster leverage in order to increase financial performance is more evident in 2010 than in 2014, because of the new investments made between this period. Acknowledgements This work has been supported by the Portuguese Foundation for Science and Technology (FCT) under project grant UID/Multi/00308/2019. References [1] A. J. Linden, F. Kalantzis, E. Maincent, and J. Pienkowski, Electricity Tariff Deficit:
Temporary or Permanent Problem in the EU?, vol. 534, no. October. 2014. [2] C. O. Henriques, P. P. da Silva, and D. Coelho, Two decades of economic policy-making in
Portugal: Revisiting the energy arena in the wake of a recession. 2012. [3] J. Berrigan et al., The Economic Adjustment Programme for Portugal - Tenth Review, no.
171. 2014. [4] McKinsey&Company, “Beyond the storm – value growth in the EU power sector.” [5] ADENE – Agência para a Energia, “Energy Efficiency Trends and Policies in Protugal,”
no. October, 2018. [6] A. Xian, Xi, Haizhong, “Research on energy stock market associated network structure
based on financial indicators,” Phys. A Stat. Mech. its Appl., vol. 490, no. 20, pp. 1309–1323, 2018.
[7] D. Borozan and D. P. Starcevic, “Entrepreneurship, Business and Economics - Vol. 2,” vol. 3/2, pp. 231–246, 2016.
[8] D. Paun, “Sustainability and Financial Performance of Companies in the Energy Sector in Romania,” 2017.
[9] S. Ruggiero and H. Lehkonen, “Renewable energy growth and the financial performance of electric utilities: A panel data study,” J. Clean. Prod., 2017.
[10] T. Sueyoshi and M. Goto, Environmental assessment on energy and sustainability by data envelopment analysis. John Wiley & Sons., 2018.
[11] P. J. Korhonen and M. Luptacik, “Eco-efficiency analysis of power plants: An extension of data envelopment analysis,” in European Journal of Operational Research, 2004, vol. 154, no. 2, pp. 437–446.
[12] A. Y. Vaninsky, “Environmental efficiency of electric power industry of the United States: A data envelopment analysis approach,” World Acad. Sci. Eng. Technol., 2009.
[13] K. Tone and M. Tsutsui, “Applying an Efficiency Measure of Desirable and Undesirable Outputs in DEA to U.S. Electric Utilities,” J. Cent. Cathedra, vol. 4, no. 2, pp. 236–249, 2011.
[14] T. Sueyoshi and M. Goto, “DEA approach for unified efficiency measurement: Assessment of Japanese fossil fuel power generation,” Energy Econ., vol. 33, no. 2, pp. 292–303, 2011.
[15] X. Bai-Chen, F. Ying, and Q. Qian-Qian, “Does generation form influence environmental efficiency performance? An analysis of China’s power system,” Appl. Energy, 2012.
[16] P. Zhou, B. W. Ang, and H. Wang, “Energy and CO 2 emission performance in electricity generation: A non-radial directional distance function approach,” Eur. J. Oper. Res., vol. 221, no. 3, pp. 625–635, 2012.
[17] T. Sueyoshi and M. Goto, “DEA environmental assessment in a time horizon: Malmquist index on fuel mix, electricity and CO2 of industrial nations,” Energy Econ., 2013.
[18] Y. Tao and S. Zhang, “Environmental efficiency of electric power industry in the Yangtze River Delta,” Math. Comput. Model., 2013.

269
[19] G. B. Bi, W. Song, P. Zhou, and L. Liang, “Does environmental regulation affect energy efficiency in China’s thermal power generationα Empirical evidence from a slacks-based DEA model,” Energy Policy, 2014.
[20] N. Zhang and J. D. Kim, “Measuring sustainability by energy efficiency analysis for Korean Power Companies: A sequential slacks-based efficiency measure,” Sustain., 2014.
[21] R. Gómez-Calvet, D. Conesa, A. R. Gómez-Calvet, and E. Tortosa-Ausina, “Energy efficiency in the European Union: What can be learned from the joint application of directional distance functions and slacks-based measures?,” Appl. Energy, 2014.
[22] B. Arabi, S. Munisamy, and A. Emrouznejad, “A new slacks-based measure of Malmquist-Luenberger index in the presence of undesirable outputs,” Omega (United Kingdom), 2015.
[23] S. Munisamy and B. Arabi, “Eco-efficiency change in power plants: Using a slacks-based measure for the meta-frontier Malmquist-Luenberger productivity index,” J. Clean. Prod., 2015.
[24] J. Wu, B. Xiong, Q. An, Q. Zhu, and L. Liang, “Measuring the performance of thermal power firms in China via fuzzy Enhanced Russell measure model with undesirable outputs,” J. Clean. Prod., 2015.
[25] A. Ewertowska, A. Galán-Martín, G. Guillén-Gosálbez, J. Gavaldá, and L. Jiménez, “Assessment of the environmental efficiency of the electricity mix of the top European economies via data envelopment analysis,” J. Clean. Prod., 2016.
[26] G. E. Halkos and M. L. Polemis, “The impact of economic growth on environmental efficiency of the electricity sector: A hybrid window DEA methodology for the USA,” J. Environ. Manage., 2018.
[27] A. Charnes, W. W. Cooper, and E. Rhodes, “Measuring the Efficiency of Decision Making Units, short communication,” Eur. J. Oper. Res., vol. 3, p. 339, 1979.
[28] W. W. Cooper, L. M. Seiford, and K. Tone, Data Envelopment Analysis. 2007. [29] K. Tone, “On Returns to Scale under Weight Restrictions in Data Envelopment Analysis,”
J. Product. Anal., vol. 16, no. 1, pp. 31–47, 2001. [30] N. R. Nataraja and A. L. Johnson, “Guidelines for using variable selection techniques in
data envelopment analysis,” Eur. J. Oper. Res., vol. 215, no. 3, pp. 662–669, 2011. [31] T Subramanyam, “Selection of Input-Output Variables in Data Envelopment Analysis -
Indian Commercial Banks,” Int. J. Comput. Math. Sci., vol. 5, no. 6, pp. 51–57, 2016. [32] A. Amendola, F. Giordano, M. L. Parrella, and M. Restaino, “Variable selection in high-
dimensional regression: a nonparametric procedure for business failure prediction,” Appl. Stoch. Model. Bus. Ind., 2017.
[33] E. Platonova, M. Asutay, R. Dixon, and S. Mohammad, “The Impact of Corporate Social Responsibility Disclosure on Financial Performance: Evidence from the GCC Islamic Banking Sector,” J. Bus. Ethics, 2018.
[34] H. Song, C. Zhao, and J. Zeng, “Can environmental management improve financial performance: An empirical study of A-shares listed companies in China,” J. Clean. Prod., 2017.
[35] C. Liu, K. Uchida, and Y. Yang, “Corporate governance and firm value during the global financial crisis: Evidence from China,” Int. Rev. Financ. Anal., 2012.
[36] S. Ding, A. Guariglia, and J. Knight, “Investment and financing constraints in China: Does working capital management make a difference?,” J. Bank. Financ., 2013.
[37] J. Enqvist, M. Graham, and J. Nikkinen, “The impact of working capital management on firm profitability in different business cycles: Evidence from Finland,” Res. Int. Bus. Financ., 2014.
[38] M. Psillaki and N. Daskalakis, “Are the determinants of capital structure country or firm specific?,” Small Bus. Econ., 2009.
[39] D. Margaritis and M. Psillaki, “Capital structure, equity ownership and firm

270
performance,” J. Bank. Financ., 2010. [40] A. Bandyopadhyay and N. M. Barua, “Factors determining capital structure and corporate
performance in India: Studying the business cycle effects,” Q. Rev. Econ. Financ., 2016. [41] C.-H. Yang and K.-H. Chen, “Are small firms less efficient ?,” Small Bus. Econ., 2009. [42] J. L. Miralles-Marcelo, M. del M. Miralles-Quirós, and I. Lisboa, “The impact of family
control on firm performance: Evidence from Portugal and Spain,” J. Fam. Bus. Strateg., 2014.
[43] D. Martani, Mulyono, and R. Khairurizka, “The effect of financial ratios, firm size, and cash flow from operating activities in the interim report to the stock return,” Ser. Chinese Bus. Rev., 2009.
[44] J. R. Kroes and A. S. Manikas, “Cash flow management and manufacturing firm financial performance: A longitudinal perspective,” Int. J. Prod. Econ., 2014.
[45] M. A. Desai, C. F. Foley, and K. J. Forbes, “Financial constraints and growth: Multinational and local firm responses to currency depreciations,” Rev. Financ. Stud., 2008.
[46] K. J. Forbes, “How Do Large Depreciations Affect Firm Performance?,” 2002. [47] A. Trujillo-Ponce, “What determines the profitability of banks? Evidence from Spain,”
Account. Financ., 2013. [48] M. Statman and K. L. Fisher, “Consumer Confidence and Stock Returns,” 2002. [49] Y. Zhang, Y. Zhang, D. Shen, and W. Zhang, “Investor sentiment and stock returns:
Evidence from provincial TV audience rating in China,” Phys. A Stat. Mech. its Appl., 2017.
[50] M. E. D. Neves, “Payout and firm’s catering,” Int. J. Manag. Financ., 2018.

THE ENERGY PERFORMANCE CONTRACT AS A PRIVATE PUBLIC PARTNERSHIP OPERATION TO IMPROVE ENERGY EFFICIENCY OF PUBLIC REAL ESTATE ASSETS Francesco Scalia, Professor University of Cassino Summary: 1. Introduction. 2. The energy performance contract. 3. The National Agency for New Technologies, Energy and Sustainable Economic Development position regarding the possibility of configuring the Energy Performance Contract as a private public partnership contract. 4. Conclusions: Energy Performance Contract as a (possible) private public partnership contract. 1. Introduction The Italian National Energy Strategy (NES) 20171, in line with the original proposal for a directive on energy efficiency contained in the Clean Energy Package, assumed the 30% reduction target for consumption by 2030 compared to the 2007 reference scenario. The NES must be adequate to the 32.5%2 target in the same time frame, set by Directive 2018/844/EU3 which in meantime entered into force. For sectors not covered by the Emission Trading Scheme (ETS) (residential, services and a large part of the transport sector), the reduction target for Italy is 33% compared to 20054. To date, our country has achieved high energy efficiency performance5, especially in the industrial sector6. It remains a significant growth potential in the civil (both residential and tertiary) as well as in the transport sectors. The improvement of energy efficiency in buildings is due to two orders of difficulty: the lack of awareness of consumers about the benefits associated with it and investment costs generally high compared to the benefits obtained. In fact, the cost-effectiveness ratio of incentive tools dedicated to the construction sector (tax deductions and incentives for thermal energy) is, up to eight times higher than the mechanism of white certificates, mainly used in the industrial sector. The potential related to the energy efficiency of public real estate assets is particularly relevant. Directive 2010/31/EU on energy performance of buildings has set the obligation on
1 Adopted by inter-ministerial decree of 10 November 2017. 2 This is the point of arrival of a close negotiation between the Council, the Commission and Parliament. Indeed, the energy ministers of the EU Council conducted an initial review of the proposed package on 27 February, ruling for a 27% indicative target on energy efficiency by 2030, compared to 30% proposed by the EU Commission. On the other hand, the European Parliament approved a resolution that set the minimum binding target of 35% energy efficiency by 2030. The final text of the directive approved by the Parliament and the one which the Council adopted, as a compromise, contains the target of 32.5%. Italy is among the countries that pushed for an even more ambitious goal. The Commission X - Industry, Commerce, Tourism - of the Italian Senate approved a resolution (Doc. XVIII No. 203) on 23 May 2017 on the proposal for a directive on energy efficiency, which called for the adoption of a more ambitious target for the 40%. 3 Directive 2018/844/EU revising Directive 2010/31/EU on the energy performance of buildings and of Directive 2012/27/EU on energy efficiency entered into force on 9 July 2018 and will have to be transposed by all member states by 10 March 2020. 4 Target set in 2016 in the proposal to extend the Effort Sharing Decision to 2030. 5 Defined by the art. 2, paragraph 1, let. f) of the Legislative Decree of 30 May 2008, n. 115, referred to art. 2, paragraph 1, let. a) of Legislative Decree 4 July 2014, n. 102: «the ratio between the results in terms of performance, services, goods or energy, to be understood as supplied performance and the input of energy». 6 Italy, with an energy intensity of around 100 toe (tone of oil equivalent) per million euro of GDP in 2015, 18% lower than the Euro-EU average (EU 28): 120 toe per million euro of GDP. Better than Italy is the only United Kingdom with 94 toe per million euros of GDP.
271

272
each Member State to adapt, according to the best energy standards, by 3% yearly of the useful floor area of the central7 public administration buildings. Article. 5 of the legislative decree n. 102 of 2014 states that, starting from 2014 and until 2020, interventions on the properties of the central public administration, including the peripheral ones, can be carried out, aiming at achieving the energy requalification of at least 3% per year of the covered useful floor air-conditioned area or, alternatively, involve a cumulative energy saving over the same period of at least 0.04 Mtoe. Furthermore, in 2009 the European Commission promoted the so called Covenant of Mayors Pact, initiative aimed at encouraging local authorities to adopt, through the Sustainable Energy Action Plans (SEAP), measures to improve energy efficiency, promote energy saving and the use of renewables8. In this context, the Energy Performance Contract9 and the use of the Public-Private Partnership can play a significant role. 2. Energy Performance Contract The energy performance contract10 (EPC) was introduced by the Directive 2006/32 /EC, on the efficiency of end-use energy and energy services, and implemented in the internal legal system with the Legislative Decree of 30 May 2008, n. 115, implementing the aforementioned directive. Today it is governed by Legislative Decree 4 July 2014, n. 10211, whose art. 2, let. n), defines it as: «contractual agreement between the beneficiary or the person exercising the power of negotiation and the supplier of an energy efficiency improvement measure, verified and monitored during the entire duration of the contract, where investments (works, supplies or services) made are paid according to the level of energy efficiency improvement established by contract or other agreed energy performance criteria, such as financial savings12”.
7 The Commission X of the Italian Senate, with resolution dated 27 October 2017 (Doc. XVIII No. 223) called for the extension of this obligation to all real estate portfolio of the entire Public Administration. 8 The new Covenant of Mayors, launched in 2015, has increased the CO2 reduction target, bringing it to 40% by 2030. 9Article 5, paragraph 11, of the legislative decree n. 102/2014 establishes that, for the realization of interventions included in the annual energy requalification program of at least 3 percent of the useful area of Central Administration buildings, the Public Administrations “favor the use of the financing instrument through third parties and contracts on energy performance and can do so through the intervention of one or more ESCo”. Furthermore, Article 18 of Directive 27/2012/EU provides that Member States shall promote the energy services market and the access of SMEs to this market, inter alia, “d) supporting the public sector in examining energy service offers, in particular for building renovation interventions: i) offering standard contracts for energy performance contracts which contain at least the elements listed in Annex XIII; ii) providing information on best practices for energy performance contracts, including, if available, a cost-benefit analysis based on the life cycle approach”. 10 On the energy performance contract see: F. Benatti, “The energy performance contract” (general profiles) and P. Biandrino, “The energy efficiency contracts: civil law and public interest” (specific points), in P. Biandrino, M. De Focatiis (edited by) “Energy efficiency and efficiency of the energy system: a new model?” Milan, 2017, respectively, page. 137 ss. and page. 149 ss.; M.G. Landi, M. Matera, P. Telesca, C. Benanti, E. Valeriani, “Energy Performance Contracts (EPC)” RT/2017/39ENEA, in openarchive.enea.it; S. Trino, “The energy performance contract”, in L. Carbone, G. Napolitano, A. Zoppini (edited by) “Public policies and energy efficiency discipline”, Bologna, 2016, pp. 395 ss.; L. Parola, T. Arnoni, S. Granata, Energy efficiency contracts. Regulatory profiles and practices, in “The Contracts”, 2015, pp. 517 ss.; M. Maugeri, “The energy performance contract and its “minimum elements””, in Nuova giur. civ., 2014, page. 420 ss; M. Pennasilico (edited by), “Manual of civil law of the environment”, Naples, 2014, page 242 ss.; P. Piselli, A. Stirpe (ed.) “The Energy Performance Contract”, Turin, 2011, page 37 ss; P. Piselli, S. Mazzantini, A. Stirpe, “The energy performance contract” in www.treccani.it, 11 March 2010. 11 Transposition of the Energy Efficiency Directive 2012/27/EU. 12 M.G. Landi, M. Matera, P. Telesca, C. Benanti, E. Valeriani, Energy Performance Contracts (EPC), op.cit., Note that, despite the literal translation of EPC “Energy Performance Contract” is “contract of providing energy services “, was introduced in our Italian legal system by Legislative Decree no. 115/2008

273
Annex VIII of Legislative Decree no. 102/2014 indicates the minimum elements that must appear in the energy performance contracts signed with the public sector and in the related tender specifications13, following a standardization process of this contractual figure initiated by art. 7 of the decree of the Ministry of economic development of 28 December 201214 and implemented by art. 5 of the decree n. 63 of June 4, 2013 which, inserting the art. 4-ter in the legislative decree 19 August 2005, n. 192, entitled the National Agency for New Technologies, Energy and Sustainable Economic Development (ENEA), to make available, within 90 days from the entry into force of the provision, “a standard contract for the improvement of energy
as an “energy performance contract”. The authors highlight the promiscuous use of the nomenclature in Legislative Decree no. 102/2014, which defines in art. 2, lett. n) the «energy performance contract», refers in art. 14, paragraph 1, of «energy performance contracts». The abovementioned text authoritatively opts - considering the ENEA technical report - for the use of the name “energy performance contract” as “performance in general can refer only to the operation of the plant while the service considers the building system in relation to user’s profile related to the allocation and performance of the plants, but also to the performance that the building develops based on the improvement of the plants themselves ». It seems, however, to the writer, beyond the technical meaning of the terms, preferable to keep the title given to the contract by the Legislator. The latter, in fact, uses the terms energy “performance” and “services” indifferently, so that the Italian translation of the English title of Directive 2002/91/EC “on the energy performance of building” is “on the energy performance of buildings” while the translation of the same English title of Directive 2010/31/EU is “on the energy performance of buildings”. The original text of art. 2, paragraph 1, lett. c) of the Legislative Decree of 19 August 2005, n. 192, implementing Directive 2002/91/EC “on the energy performance of buildings”, contained the definition of “energy performance, energy efficiency or performance of a building” demonstrating that the various nomenclatures were considered equivalent. The current text of the law, as amended by art. 2, paragraph 1, law decree June 4, 2013, n. 63, converted with amendments by the law 3 August 2013, n. 90, refers only to the “energy performance of a building”, defined as “the annual quantity of primary energy actually consumed or expected to be needed, with a standard use of the building, the various energy needs of the building, winter and summer air conditioning, hot water preparation for sanitary purposes, ventilation and, for the tertiary sector, lighting, lifts and escalators“. Article. 2, however, does not contain a different definition of energy performance, thus confirming that it considers as equivalent terms. Article. 2, lett. n), Leg. Decree no. 102/2014, finally, indicates as subject of the energy performance contract the supply of a measure of energy efficiency improvement paid “according to the level of improvement of energy efficiency established contractually or other agreed energy performance criteria, such as financial savings “, showing conclusively that nomenclatures: “energy performance “ and, ” energy services“ are considered equivalent. 13 a) a clear and transparent list of efficiency measures to be applied or results to be achieved in terms of efficiency; b) the guaranteed savings to be achieved by applying the measures foreseen in the contract; c) the duration and the fundamental aspects of the contract, the methods and terms envisaged; d) a clear and transparent list of obligations on each contracting party; e) date or reference date for the determination of the savings achieved; f) a clear and transparent list of the stages of implementation of a measure or package of measures and, where relevant, the related costs; g) the obligation to fully implement the measures provided for in the contract and the documentation of all the changes made during the project; h) provisions governing the inclusion of equivalent requirements in any concessions contracted to third parties; i) a clear and transparent indication of the financial implications of the project and the shareholding of the two parties to the realized pecuniary savings (exp. remuneration of service providers); j) clear and transparent provisions for the quantification and verification of guaranteed savings achieved, quality controls and guarantees; k) provisions that clarify the procedure for managing changes to the framework conditions that affect the content and results of the contract (exp. modification of energy prices, intensity of use of a plant); (l) detailed information on the obligations of each of the contracting parties and on penalties for non-compliance. 14 Laying down provisions on incentives for thermal energy production from renewable sources and small-scale energy efficiency measures. Article. 7 of the cited decree specified that, within ninety days from the entry into force of the decree Consip and the regions, also with the involvement of the ANCI, would have to jointly develop “templates of energy performance contracts, between public administrations, the ESCo and the funding bodies in order to facilitate access to incentives for energy efficiency and the production of heat from renewable sources “. For this fulfillment Consip could have used ENEA’s technical support. These contractual models are also made available by the GSE on its portal.

274
performance of the building, similar to the EPC European performance contract15”. The need to define a standard model16 is explained by the particular complexity of these contracts, which intertwine legal, economic (financing methods, performance calculation, etc.) and engineering (energy diagnosis, building redevelopment and plant upgrading interventions) 17. Moreover, in practice, the EPC is usually divided into a number of related contracts (sub-contracts of the basic contract, connected contracts and ancillary contracts) that are interdependent18. The punctual typification of the energy performance contract made by the Legislator and, on the mandate of these, by ENEA, doesn’t seem has changed its nature of an atypical19 contract, having its main characteristic in the combination of activities and instrumental services to improve energy efficiency, which is the cause or function of the contract, far beyond the parties’ contingent interests20.
15 ENEA published in September 2014 the “Guidelines for Energy Performance Contracts (EPC)”, defining a standard, integrated contract (according to Article 14, paragraph 4, of Legislative Decree No. 102/2014) with minimum elements listed in Annex VIII to Decree No. 102. In March 2017, ENEA sent to the Ministry of Economic Development a new version of the guidelines, defining a standard reference framework (guidelines with more technical specifications) through which to elaborate a model of EPC contract that has as object One Service, the «Energy Performance Service». It is unique that in an ENEA publication (MG Landi, M. Matera, P. Telesca, C. Benanti, E. Valeriani, Energy Performance Contracts (EPC), op.cit., page 19-20) one complains inadequacy of the minimum elements” to provide the public and private operators with an easy-to-use tool that will allow the rapid spread of the contract in Italy over time“ and invoke a ”legislative provision that quickly leads to their typification “ given that the Legislator has delegated ENEA precisely to provide for this purpose. 16 Set by art. 18, let d) of Directive 27/2012/EU which states that Member States shall promote the energy services market and the access of SMEs to this market, inter alia, “d) supporting the public sector in examining energy service offers, in particular for building renovation interventions: i) offering standard contracts for energy performance contracts which contain at least the elements listed in Annex XIII; [...] ». 17 See, on this point, F. Benatti, The energy performance contract (general profiles), in P. Biandrino, M. De Focatiis (edited by), Energy efficiency and efficiency of the energy system: a new model?, op.cit., page 139: “the stipulation the contract must be preceded by an energy audit that ascertains the current performance of the plant, foresees the consumption after the realization of the project and subsequently by an economic analysis that values current consumption and hypothesize future ones, the quantification of the necessary investments, the economic forecast of savings, the identification of possible forms of public support “. See also P. Piselli, S. Mazzantini, A. Stirpe, Energy performance contract, op.cit., which also underline the importance of the phase of drafting the contract, “because the variables (including executive ones) of the renovation interventions are so many and so, that have to be punctually defined in contractual regulation, which must be modulated as much as possible to the type of intervention to be carried out on the basis of the approved project “. 18 See P. Biandrino, Energy efficiency contracts: civil law rules, in P. Biandrino, M. De Focatiis (edited by), Energy efficiency and efficiency of the energy system: a new model? op.cit., page 154, which stresses that “to ensure maximum efficiency, effectiveness and economy it is essential to “plan” all the agreements with a holistic view”. 19 F. Sciaudone, Access to credit for energy efficiency projects, in L. Carbone, G. Napolitano, A. Zoppini (edited by), Public policies and regulation of energy efficiency, op.cit., P. 140. See also M.G. LANDI - M. Matera, P. Telesca, C. Benanti, E. Valeriani, Energy Performance Contracts (EPC), op.cit., page 17, “the EPC contract is atypical contract, because it lacks a systematic legal discipline and is characterized by numerous peculiarities that make each contract different from any other”. 20 M. Pennasilico (edited by), Manual of civil right environmental, op.cit., page 247-248. The Author, moving from the consideration that energy efficiency is a “value that increasingly tends to impose itself in the Italian-European system”, states that the EPC pursues a worthy interest in protecting «in re ipsa». On this point see also P. Piselli, A. Stirpe, The structure of the contract: the cause and the type, in P. Piselli, S. Mazzantini, A. Stirpe (ed.), The energy performance contract, op. cit., page 37. The authors note that the interests pursued by the EPC “are identified in the pursuit of energy efficiency and savings, in the use and development of renewable energy sources, in the increase and circulation of technologies, in the containment or in the elimination of investment costs and technical risks for the community wishing to access this particular mechanism for the modernization of existing plants and structures”. See also S.

275
Others, on the other hand, speak of “weak typicality” 21 or “nominated contract, being defined by the legislator, but by the not typicalized content”22. And indeed, the minimum elements have the function of guaranteeing constant monitoring of the approximation process towards of energy efficiency objectives23. In fact, the essential elements of this contractual figure are the increase in the level of energy efficiency24 (the performance) and the ratio between the performance and remuneration, which is commensurate with the results actually achieved25 For the rest, the energy performance contract may also not correspond to the contractual model typified by Decree no. 102 of 2014, inclusive of all the “minimum elements” indicated in its Annex VIII provided that the flaw of the minimum requirements does not render null the contract due to the indeterminability of the object26. This except the case in which the contract has as a party a Public Administration or, even if concluded between individuals, they prefer not to access the thermal incentive scheme of the so called «Conto termico», referred to in decree of December 28 of 2012, according to art. 7, paragraph 6 of Legislative Decree no. 102/201427.
Trino, the energy performance contract, in L. Carbone, G. Napolitano, A. Zoppini (edited by), Public policies and discipline of energy efficiency, op.cit., page 405, which qualifies the energy performance contract, an “instrument of private regulatory law”, precisely for the general and system purposes to which is functional the particular type of contract governed by Legislative Decree no. 102/2014. 21 F. Benatti, Energy performance contract (general profiles), in P. Biandrino, M. De Focatiis (edited by), Energy efficiency and efficiency of the energy system: a new model? op.cit., page 145. The author notes that if “one adheres to a rigorous conception of typicality, the energy performance contract must be configured as a typical contract, more precisely of weak typicality, because - once the object has been specified, its purpose and its function is connected to all the instruments and norms set up to achieve energy efficiency - it relies on a conventional typicality that cannot be replaced by code rules”. 22 L. Parola, T. Arnoni, S. Granata, Energy efficiency contracts. Regulatory profiles and practices, op.cit., page 526. See also P. Piselli, S. Mazzantini, A. Stirpe, Energy performance contract, op.cit., which states that “the legislator has intentionally entrusted the regulation of the relationship to the full contractual autonomy of the parties, with the aim to make it as congruous as possible to the set of interests concretely pursued by the parties, without prejudice, of course, to the application of the general principles concerning obligation and contracts “. 23 See, on this point, M. Maugeri, The Energy Performance Contract and its “minimum elements”, op.cit., page 425: “these elements are prescribed in order to characterize the type of contract that is deemed appropriate to achieve the objectives that the legislator intends to pursue.” 24 Article. 2, paragraph 1, lett. c) of Legislative Decree no. 115/2008, defines “improvement of energy efficiency”: “an increase in the efficiency of end-use energy, resulting from technological, behavioral or economic changes”. 25 The obligation carried by the energy efficiency measure provider is a result obligation and not a means. See M. Maugeri, The Energy Performance Contract and its “minimum elements”, op.cit., which identifies the characteristic element of the contract in the “bound relationship between the remuneration of the investment and the improvement of energy efficiency (where “energy efficiency” means the relationship between results in terms of performance, services, goods or energy, to be considered as supplied performance, and the injected of energy, and for the “improvement of energy efficiency” the increase of efficiency of end uses of energy, resulting from technological, behavioral or economic changes ». 26 F. Benatti, Energy performance contract (general profiles), in P. BIANDRINO - M. DE FOCATIIS (edited by), Energy efficiency and efficiency of the energy system: a new model? op.cit., page 142-144, on the basis of the conclusions reached by the doctrine concerning the articles. 35, 85 and 86 of the Consumer Code, states that the essential requirement that make the contract null is also “the clarity and transparency of the dictate”, since it is functional to the protection of the customer. 27 Article. 7, paragraph 6 of Legislative Decree no. 102/2014 establishes that, for the purposes of access to the incentive referred to the “conto termico” (for the thermal energy), energy performance contracts are considered only those that have the minimum elements listed in Annex VIII of the legislative decree. See L. Parola, T. Arnoli, S. Granata, Energy efficiency contracts. Regulatory profiles and practices, op.cit., page 528: “nothing prohibits, therefore, that the parties enter into a contract without the minimum elements set out in Annex 8, but aimed at improving the energy performance of buildings and facilities,

276
Essential parts of the contract are the supplier of the energy efficiency measure, usually an ESCO28, and the beneficiary thereof. The energy performance contract can also have a trilateral structure: this happens when the investment is financed by a party other than the supplier of the energy efficiency measure, by the mechanism of financing through third parties (FTT) 29. The contract’s object is the energy service, defined by the art. 2, paragraph 1, let. mm), legislative decree n. 102/2014: «the material performance, utility or advantage deriving from the combination of energy with technologies or with operations that effectively use energy, which may include the management, maintenance and necessary control activities for the provision of the service, whose supply is made on the basis of a contract and which under normal circumstances has shown to lead to improvements in energy efficiency and to verifiable and measurable or estimable primary energy savings” 30. 3. The National Agency for New Technologies, Energy and Sustainable Economic Development position regarding the possibility of configuring the Energy Performance Contract as a private public partnership contract It has been said that the Legislator has entitled ENEA to prepare a standard contract for the improvement of the energy performance of the building, similar to the European performance contract, EPC. The Agency fulfilled this task in 2014 and subsequently, in 2017, transmitted to the Ministry of Economic Development a new version of the guidelines, defining a standard reference framework (guidelines with more technical specifications) through which to draw up an EPC template contract having as object the «Energy Performance Service». The document, to date, has not yet been placed in public consultation. The position of ENEA on the possibility of configuring the EPC as an instrument of private public partnership is, however, deducted from a publication of the Agency which anticipates, on this point, the content of the guidelines sent to the Ministry, stating that these guiding specifications “were drafted considering the with the consequence that the latter, while not being able to qualify as an energy performance contract and thus accessing the benefits of the “conto termico” it remains valid and effective anyway ». 28 Acronym of Energy Service Company, defined by the art. 2, paragraph 1, lett. i), Legislative Decree no. 115/2008: “natural or legal person providing energy services or other measures to improve energy efficiency in installations or premises of the user and, doing so, accepts a certain amount of financial risk. The payment of the services provided is based, totally or partially, on the improvement of the energy efficiency achieved and on the achievement of the other established criteria “. P. Piselli, S. Mazzantini, A. Stirpe, Energy performance contract, op.cit., shows that the EPC is the contractual model that characterizes activities of the ESCO. If it is true, in fact, that these are operators of the energy services market able to have an overview of the customer’s energy problem, managing and coordinating the various phases aimed at identifying, planning and implementing the intervention that best guarantees the achieving the energy efficiency of structures and plants, the EPC is undoubtedly the instrument that summarizes the operations of these subjects. 29 Defined in art. 2, paragraph 1, lett. m), Legislative Decree no. 115/2008: “contractual agreement including a third party, in addition to the energy supplier and the beneficiary of the energy efficiency improvement measure, which provides the capital for this measure and charges the beneficiary a fee equal to part of the energy savings achieved using the measure itself. The third party can be an ESCO”. 30 M.G. Landi, M. Matera, P. Telesca, C. Benanti, E. Valeriani, Energy Performance Contracts (EPC), op.cit., page 20, believe that this definition is problematic for EPC that affect buildings, due to the difficulty of including, in the absence of an extensive interpretation of the term “operations”, the works involving the envelope. More accurate for buildings the definition of energy service proposed by ENEA in the “Guidelines for energy performance contracts for buildings”, drawn up pursuant to art. 14 of the legislative decree n. 102/2014, not yet in the public consultation phase: “the material performance, usefulness or advantage deriving from the use of energy combined with technologies, consisting in the supply and installation of products, components and systems for a building including management, maintenance and control actions, all aimed at improving the energy efficiency of the building itself and at verifiable and measurable primary energy savings, and regulated on the basis of a contract whose performance cannot be separated. The provision of energy carriers is also part of the energy performance service”.

277
EPC as a service contract because, in accordance with the established case law, we did not recognize in it the typical elements of the concession31”. In essence, the Agency, by identifying the private public partnership with the sole concession, generally leads the EPC back to the “service contract”, since in that contract “not only the classic elements of the concession are found, that is to say, a third party with respect to the Public Administration and the direct collection from users (necessary elements for the consolidated jurisprudence), but also if we analyse the doctrine which emphasizes the distinction based only on the element of “operational risk”, full of substantive, the operational risk is not external i.e. it does not respond to the provision of art. 3 of Leg. Decree 50/2016 that states “under normal operating conditions, the recovery of investments made or costs incurred for the management of the works or services covered by the concession” is not guaranteed nor does it entail a “real exposure to market fluctuations32”. ENEA allows the EPC to qualify as a private public partnership operation only if the payment of the fee does not cover more than 50 percent of the initial cost of the investment, “due to the “risk component” being effectively present even if reduced33”. So, by bulldozing over every opportunity of configuring as public private partnership because in this case the financial economic plan would be structurally in disequilibrium and could not be certified. Indeed, the position of ENEA reflects the traditional difficulty in conceiving the concession for “cold” works and services: that is, they do not generate income through revenues from external users (such as the so called. hot and warm works and services) but are remunerated directly by the Public Administration through a fee. This possibility, already envisaged by the Legislator in the past34, was in conflict with the European Union35 and the Italian concept of concession36
31 M.G. Landi, M. Matera, P. Telesca, C. Benanti, E. Valeriani, Contracts of energy performance (EPC), op.cit., page 25. 32 M.G. Landi, M. Matera, P. Telesca, C. Benanti, E. Valeriani, Contracts of energy performance (EPC), op.cit., page 30. 33 Ibidem. On the same positions of ENEA also the foundation of the National Association of Italian Municipalities (IFEL). See, Municipal dimension of the Public Private Partnership, in www.fondazioneifel.it, 2018, page 255 and the ANAC in an opinion - however - old and to be considered outdated. See ANAC, Opinion No. 37 of the Meeting of 4 April 2012. 34 Article. 142, paragraph 9 of Legislative Decree no. 163/2006 (which reproduced paragraph 2-ter of article 19 of law 109/1994, introduced by article 7, letter l), l. n. 166/2002) provided that “contracting authorities may entrust works intended for direct use of the public administration as functional to the management of public services, provided that the concession holder is responsible for the economic and financial management of the work”. 35 The directives 89/440/CE, for works, and 2004/18/CE, for services, identify the distinctive element of the concession compare to the procurement contract in the fact that the compensation “consists solely in the right to manage the work” or services “or in this right accompanied by a price”. Also the 2014/23/EU directive qualifies the concession as a contract under which the Administration entrusts one or more economic operators for the execution of works (works concession) or the supply and management of services (service concession), “where the compensation consists solely of managing the works [or services] which are the object of the contract or in that right accompanied by a price”, with the further clarification that “the awarding of a works or service concession entails the transfer to the concession holder of an operational risk related to the management of the works or services, including a risk on the demand side or on the supply side, or both “(Article 5, point 1, paragraphs 1 and 2). The European jurisprudence, before the entry into force of Directive 2014/23 / EU, has clarified that decisive element for the qualification of the assignment of a certain service as a concession resides in the transfer of risk (see EC Court of Justice, 13 November 2008, C-437/07, Commission v. Italy, in Town Planning and Procurement, 2009, 20), specifying that management risk must be understood as a risk of exposure to the market that occurs, in the first place, in the case in which, being the remuneration of the service guaranteed by third parties with respect to the Administration, the economic operator can find itself in the situation in which the proceeds of the activity carried out in favor of third parties do not allow full coverage of the costs incurred (see Court of Justice) EU, 10 March 2011, C-275/09, Strong Segurança SA, in EUR-Lex), while risks related to mismanagement or errors of assessment by the economic operator are not relevant o

278
and the jurisprudential orientation according to which “the essence of the concession, whether related to public goods or services, lies in the fact that the concessionaire is remunerated by providing service to users [...] or by exploiting the state property for economic purposes37”. However, the new code of public contracts has solved the dilemma regulating- unlike what happens in the European Union38 and as already done by other Member States39 - the private public partnership contract40 as a typology of contract including also the concession but does
because it is inherent in any contract, regardless of whether the latter is due to the type of public service contract or to the service concession (cf. Court of Justice EU, 10 November 2011, C-348/10, Norma-A Sia, in EUR-Lex). 36 Article. 30, par. 2, of the legislative decree n. 163/2006 provided that “in concession of services the compensation in favor of the concessionaire consists solely in the right to functionally manage and to exploit the service economically. The granting party also establishes a price at the time of the tender if the concessionaire is required to charge lower prices to users than the sum of the cost of the service and of ordinary business profit, or if it is necessary to ensure the concessionaire pursuing the economic-financial balance of investments and related management based on the quality of the provided service”. 37 State Council, sect. IV, March 13, 2014, n. 1243. See also State Council, ad. plen., 7 May 2013, n. 13, identifies the distinction between the service procurement and the concession of services in the structure of the relationship: bilateral in the first (the service is rendered by the contractor to the Administration), trilateral in the second (the service is offered to users). 38 The European Parliament in the past stated its position against the creation of a specific legal regime for public private partnership (see European Parliament, Report on Public Private Partnerships and European Law on Procurement and Concessions, A6-0363 / 2006 - point 2 of the Remarks). Detect M.P. Chiti, Public private partnership and the new concessions directive, in G.F. Cartei, M. Ricchi (edited by), Project Finance and Public Private Partnership, Naples, 2015, p. 3, that “in the European Union law does not exist a general reference or a definition of the PPP, in spite of numerous proposals in this sense; but neither refers to it clearly in the recent concessions directive “. Speaking of “forging ahead of the Italian legislator compared to that of the EU Community” G. Fidone, The private public partnership and the concessions in the new code of public contracts: some proposals for the improvement of the current legislation, in The implementation of public contracts: problems, perspectives, verifications, in www.italiadecite.it, page. 65-66. The main documents of the European Union on the Public Private Partnership are: the Green Book on public-private partnerships and the EU community law of public procurement and concessions of 30 April 2004 COM (2004) 327 final; the Communication of the European Commission of 15 November 2005 on public-private partnerships and the law of public procurement and concessions COM (2005) 569 final; the Resolution of the European Parliament of 16 October 2006 n. 2043; the Commission Interpretative Communication on the application of EU law of public procurement and concessions to institutionalized public-private partnerships of 5 February 2008 COM (2007) 6661 final; the 2011 Green Paper on the modernization of the EU public procurement policy to improve the efficiency of the European procurement market COM (2011) 15 def. A. Massera, The framework for the transposition of European directives between harmonization obligations and opportunities for the reorganization of national legislation, with particular reference to the concessions of works and services, in A. Fioritto (edited by), New forms and new disciplines of public and private partnership, Turin, 2017, page 37 ss., highlights the contradiction between the reference to the PPP in numerous documents of the European institutions and the lack of a specific discipline. On the same topic see also M.A. Sandulli, The Public Private Partnership and the European law of procurements and concessions, Conference proceedings SPISA, 29 July 2005. 39 France, with the Contrat de partenariat governed by the Ordonnance n. 559 of 17 June 2004, adopted by law no. 1343 of December 9, 2004; Spain with the Contrat de colaboración entre el sector público y el sector privado (Article 11 of Ley 30/2007). Although Germany did not codify a precise definition of the public-private partnership, it adopted a series of rules with the ÖPP-Beschleunigungsgesetz, which entered into force on 7 September 2005, including a competitive dialogue aimed at making flexible the implementation of types of cooperation between public and private. See on the Gary Louis Pietrantonio, the Project Financing between public and private. Problems, scenarios and perspectives, Turin, 2018, page 53. 40 In fact, even the previous code (Legislative Decree 12 April 2006, No. 163) defined in art. 3, paragraph 15-ter (introduced by the third corrective decree of Legislative Decree No. 152/2008 and amended by Article 44, paragraph 1, letter b), l. 27/2012), the “public private partnership contracts” (in the plural) as “contracts having as object one or more services such as the design, construction, management or

279
not really resolve itself into it41. In fact, the art. 180, paragraph 8, of the Code, states that in the partnership contract “fall the project finance, the construction and management concession, the concession of services, the financial leasing of public works, the availability contract and any other procedure for realization in partnership of works or services that show the characteristics referred to in the preceding paragraphs ». Now, beyond the improper reference to the project finance - which is not a contract but a procedure for the assignment of a contract - the rule clarifies how the public private partnership is such when it has the elements indicated by it and does not resolve itself into concession, which is only one of the possible types of the contract - even the most important42 - attributable to this typology of contract43. As noted by the State Council, this is an “atypical contract, in which the parties fix the structure of their respective [interests] in the most appropriate and adequate manner, based on the achievement of the public interest identified exclusively by the public body. [...] a contractual type referable to several specific models44”. With reference to private public partnership contracts, art. 180 of
maintenance of a public work or public utility, or the supply of a service, including in any case the total or partial financing by private individuals, even in different forms, of these services, with allocation of risks in accordance with the provisions and the EU guidelines “. The law, however, did not define the distinctive features of the public-private partnership contract nor did it contain a typical regulation of the same. On the evolution of the private public partnership in the EU and national law, see F. Mastragostino (edited by), The private public collaboration and the administrative system. Dynamics and models of partnership based on recent reforms, Turin, 2011 and M. Cafagno, A. Botto, G. Fidone, G. Bottino (ed.), Public negotiations. Writings on concessions and public-private partnerships, Milan, 2013. 41 G. Fidone, Public private partnership and the concessions in the new code of public contracts: some proposals for improvement of the current discipline; in The implementation of public contracts: problems, perspectives, verifications, op.cit., page 67, states that “the PPP is an autonomous category that includes concessions and is different from procurement, thus preserving independent legal importance”. According to the author of this paper, “for European law there would be two typified contracts (i.e. procurements and concessions, subject to two specific directives) and subject to specific disciplines, while PPP contracts would remain atypical contracts, as they were neither foreseen nor regulated from any directive. Apart from the two contracts typified by directives 24 (procurements) and 23 (concessions) we would be in the presence of a EU law principle of not-typified of the other forms of bargaining between public administration and private individuals and, in this context, could exist (in national laws) other PPP contracts different from concessions”. 42 So, G. Fidone, Private public partnership and the concessions in the new code of public contracts: some proposals for the improvement of the current discipline, in The implementation of public contracts: problems, perspectives, verifications, op.cit., page. 68, who speaks of the PPP as “a contractual category (open), in which different instruments and institutes can be included. The first and most important of these is without a doubt the Concession”. See also Gary Louis Pietrantonio, Project Financing between public and private. Problems, scenarios and perspectives, op.cit., page 49, according to him, the European Commission, while acknowledging the heterogeneity of the PPP and the lack of uniform legislation on the subject at EU level, “sees in the concession model the structural DNA of the PPP contract”. 43 The Council of State, in giving the opinion on the draft legislative decree of the new code of public contracts (Council of State, Comm. Spec, opinion of 1 April 2016, No. 855) found that “articles 180, 181 and 182 contain a general archetype of the contract on private public partnership which is the concrete declination of the project finance, the leasing of public works, the construction and management concession, the availability contract, as well as the figures of minor economic importance, but certainly of social impact, of administrative barter (exchange) and of horizontal subsidiarity interventions such as forms of social partnership”. 44 State Council, ad. of the comm. spec. of 22 February 2017, n. 775, “Opinion on the outline of guidelines on” Monitoring of contracting authorities on the activity of the economic operator in public-private partnership contracts”. See also the same Guidelines no. 9 of the ANAC, according to which the «PPP represents a complex legal phenomenon that emerges as a genus of contract referable to several specific models in which the economic-financial nature prevails». It seems instead to reverse the relationship between genus and species M. Ricchi, “The architecture of concession contracts and PPP in the new code of public contracts Decree 50/2016”, in www.giustizia-amministrativa.it, 29 July 2016, which states that the PPP contracts, as indicated in art. 180, paragraph 8 of the Code, are species of the genus wider than the

280
the code specifies that the operating revenues of the economic operator “come from the fee recognized by the grantor and/or any other form of economic consideration received from the same economic operator, also in the form of direct revenue from the management of the service by external users” (paragraph 2). Therefore, the object of the partnership operations can be both the works and the services so called “cold”, remunerated through a fee, both “hot and warm” works and services, in which the compensation is represented, respectively, by the right to manage the work or service and by the same right accompanied by a price, paid by the Administration to the only objective to ensure ex ante the economic and financial management balance45. It is evident, however, that while the right to manage the work or service is indeed the remuneration of the concession, as defined by art. 3, paragraph 1, lett. vv) and uu) 46, the fee (unless it is paid by the Administration according to the actual service, based on the shadow toll mechanism47) is proper to other categories of contract referable to the private public partnership type 48.
European concession contract. The author believes that in fact “in the genus of European concession, expressed by the Directive, are included, but not distinctly named, both types of contracts (concession contracts and public partnership contracts) in relation to the forms that operational risk can take”. 45 See art. 165, paragraph 2 of the Code in which, for the sole purpose of achieving the economic and financial balance of management, to be assessed ex ante in the tender the contracting authority can also establish a price consisting of a public contribution or in the sale of real estate. In any case, any recognition of the price, added to the value of any public guarantees or other financing mechanisms to be borne by the Public Administration, may not exceed forty-nine percent of the total investment cost, including any financial charges. The maximum share of public participation in the financing of the work or service has been increased from 30% to the current threshold from the first corrective to the contract code (Article 101, paragraph 1, letter a) of Legislative Decree no. 19 April 2017, n. 56). The Council of State in giving an opinion on the draft decree has found that such innovation “is in clear contradiction with the risk-sharing criteria only recently decided with a view to reducing public partnership (and therefore the burden on public funds) ». On the other hand, there is no cap to the limitation of management risk borne by the concessionaire in the European area. Detects G.F. Cartei, Risk and negotiation discipline in concession contracts and public-private partnerships, in Riv. Trim. Public law 2018, page 599 et seq., that the criterion identified by the Court of Justice is based on an empirical parameter: in order to maintain, in fact, a concession “it is necessary that the contracting authority transfers the management risk that it carries to full load or, at least, significant to the concessionaire “(Court of Justice EC, III, 10 September 2009, case C-206/08, Eurawasser, in www.dirittodeiservizipubblici.it), since the risk may also be” very small“ (Court of Justice EU, 10 March 2011, case C-274/09, Stadler, Court of Justice EU, 10 November 2011, case C-348-10, in Urb. And app., 2012, pp. 287 ss., with note by R. Caranta, The Court of Justice downsizes the importance of management risk). See also the Commission Staff Working Document Impact Assessment of an Initiative on Concessions, Brussels, 20 December 2011, SEC (2011) 1588 final, which states that the concept of operational risk “is still not sufficiently clear, in particular regarding the level of operating risk to be transferred to the economic operator so that contract can qualify as concession”. 46 See also art. 165, paragraph 1 based on which, in concession contracts, most of the concessionaire’s revenue derives from the sale of services offered on the market. 47It is controversial in doctrine whether “warm or tepid” partnerships remunerated with a fee by the Administration with the shadow toll system are attributable to the concession or to PPP. G.F. Cartei, Risk and negotiation discipline in concession contracts and public-private partnership, op.cit., page. 599 ss., frames these cases in the partnership contract, but moving from the thesis - as you will see, in the opinion of the author who does not agree - that the operational risk is proper of all PPP contracts and not just of the concession. Instead, it seems preferable to the thesis that, where the operator is exposed to market fluctuations and bears the operational risk of management, the remuneration by the Administration in place of the users is compatible with the concession. In this sense, as we have seen, also the concessions directive rules (see point 44). 48 On this point see Government Deficit and Debt (Implementation of ESA 2010) of 4 March 2016, 332: «in a concession contract, government makes no regular payments to the partner, or such payments, if they exist, do not constitute a majority of fees received by the partner (see chapter VI.3 of this Manual). In a PPP contract, as covered by this chapter, the final users do not pay directly (i.e. in a way proportional to

281
Article. 3, paragraph 1, let. eee) of the public procurement code, in defining the private public partnership contract49, indicates the typical cause identifying it in the agreement between Administration and an economic operator, for a limited period and commensurate with the duration of the investment’s amortization or with fixed financing modalities, as a result of which the Administration confers activities to which it would be required to achieve its institutional purposes, in exchange of economic benefits for the private operator with assumption of risks on the same. The central theme, for the purposes of the issue addressed in this paper is whether, as ENEA believes, why an operation qualified as a public private partnership must transfer also the “operational risk” to the private sector. Indeed, the assumption by the private operator of the “operational risk” linked to the management of the works or service is an essential features - and distinctive - of the concession, not also of the other types of contract referable to the public private partnership, nor of the “general archetype” as outlined in article 18050. In fact, the national regulation of public-private partnership requires that the risk of the construction and - in fact - the risk of availability or, in the case of profitable external activities, the risk of demand for services rendered, encumber on the economical operator for the period of management of the work (Article 180, paragraph 3), not also the “operational risk” 51, which remains a feature of the sole concession of works or services52.
the use of the asset and clearly identified only for this use), or only for a minor part (and generally for some specific uses of the asset), for the use of the assets for which a service will be provided». 49 The “contract for pecuniary interest stipulated in writing by which one or more contracting confer one or more economic operators for a fixed period according to the duration of the amortization of the investment or the financing modalities established, a complex of activities consisting of in construction, transformation, maintenance and operational management of a work in exchange for its availability, or its economic exploitation, or the supply of a service related to the use of the work itself, carrying risks by the operator according to modalities identified in the contract». 50 Instead, they believe that the transfer of “operational risk” characterizes all partnership contracts and not just the concession: M. Ricchi, The architecture of concession contracts and PPP in the new code of public contracts Decree 50/2016, op.cit., And GF Cartei, Risk and negotiation discipline in concession contracts and public-private partnership, op.cit., page 599 ss. 51 Article. 3, paragraph 1, lett. zz) of the code in defining the operational risk, substantially reproduces the art. 5, par. 2, of Directive 2014/23/EU. This is in fact defined by the code “the risk related to the management of works or services on demand or on supply side or both”. The economic operator is considered to carry operational risk if, under normal operating conditions i.e. not affected by unforeseeable events, the recovery of the investments made or the costs incurred for the management of the works or services object of the concession is not guaranteed. Finally, the law specifies that the part of risk transferred to the economic operator “must involve a real exposure to market fluctuations such that each potential estimated loss suffered by the economic operator is not merely nominal or negligible”. 52 See regional administrative court (TAR) Lombardia, section IV, 9 February 2018, n. 386, in www.giustizia-amministrativa.it, where the distinction between concession, characterized by the transfer of operational risk and the partnership, for which is necessary the transfer on the economic operator the risk of construction and one of the risks of demand and availability. See also State Council, ad. plen., 27 July 2016, n. 22 and State Council, sect. V, March 21, 2018, n. 1811, both in www.giustizia-amministrativa.it., which identify the transfer of operational risk of the management and in the direction of service to user and not of the granting authority, the elements characterizing the concession. F. Goisis, “The economic risk as proprium of the concept of concession in Directive 2014/23/EU: economic approach versus traditional visions”, op.cit., page. 743, indicates in the operational risk “the proprium of the concession institute”. B. Raganelli, The concession contract as a model of public-private partnership and the new code of contracts, in Administration on the way, page. 21, indicates in the permanence of the operational risk of the private entity the ubi consistam of the concession. M. Macchia, Concession contracts, in Giorn. dir. adm., 2016, page. 478, notes that, unlike the previous legislation, which already provided for the transfer of the economic-financial management of the work to the concessionaire, in the new directive the operational risk turns from an accessory factor to the concession in a qualifying element of this contract and is an obligation of the parties to precisely map this economic size.

282
In other words, the concession of works or services is a private public partnership contract that is characterized by the remuneration of the economic operator - in whole or in part - through the management of the work or service53, having as consequent the exposure of these to market fluctuations and therefore with the transfer to the same of the operational risk54, or the possibility that, under normal operating conditions55, the changes related to the costs and revenues involved in the concession affect the balance of the economic and financial plan56. Instead, the model of private public partnership contract outlined by art. 180 of the code - to which the concession is also attributable - essentially involves the transfer to the private operator of the construction risk and the risk of availability or - (only) in the case of profitable external activity - of the risk of demand related to the management of services offered. In essence, the art. 180 of the code outlines the essential regulation of each private public partnership contract57, including the concession (to which the risk of demand is inherent), which however, according to art. 165, is also characterized by the transfer of operational risk58 to the operator. 4. Conclusions: Energy Performance Contract as a (possible) private public partnership contract Having regard to the illustrated characteristics of the energy performance contract, it does seem very clear that, if it is involved in the investment borne by the supplier of the energy efficiency measure (the ESCo) and in remuneration according to the performance achieved, qualifies - if stipulated with a Public Administration - as a contract for private public partnership59, burdening the economic operator with both the risk of construction and the risk of availability60. In fact, the essential requirements established by the general regulation of the partnership contract, introduced by the art. 180 of the Code, and the four elements characterizing the public private partnership operations identified in the Green Paper (2004),
53 See art. 165, paragraph 1 of the Code, according to which in concession contracts most of the concessionaire’s revenue derives from the sale of services offered on the market. 54 See Directive 2014/23/EU, recital 20: “operational risk should be understood as a risk of exposure to market fluctuations which may arise from a demand or supply side risk or a simultaneous risk on the demand side or on the supply side”. 55 The clause, implemented by art. 5, paragraph 1 of the directive would refer to exceptional cases related to the so called systemic financial risk. See on this point M. Ricchi, The new Community directive on concessions and the impact on the Code of public contracts, op.cit., page 747. 56 Not qualified as concessions, but services contracts, those contracts - as the case of entrusting the management of integrated water service - in which the contractor is remunerated on the basis of regulated tariffs calculated in such a way as to cover the total costs and investments. See also G.F. Cartei, Risk and negotiation discipline in concession contracts and public-private partnership, op.cit., page 599 ss. 57 See State Council, comm. spec., opinion 855/2016, cit.: the code introduces “a framework discipline valid, for the standard as well as atypical figures, defined [...] as “any other procedure of realization of partnership in the field of works or services […]”. 58 The transfer of operational risk on the concessionaire is also the reason why, as we shall see, only for the assignment of concession, art. 166 of the code allows the Administration to freely organize the procedure for the selection of the concession holder. 59 In the form of the “contractual PPP”, since the relations between Public Administration and private sector and the reciprocal activities of competence of a contractual nature. When, on the other hand, the realization of the partnership involves the creation of an entity in which the public administration and the private economic operator participate jointly, we refer to an “institutionalized” PPP. 60In doctrine, the energy performance contract is signed with a Public Administration to the PPP, among others, F. Sciaudone, Access to credit for energy efficiency projects, in L. Carbone, G. Napolitano, A. Zoppini (edited by), Public policies and discipline of energy efficiency, op.cit., page. 145 ss.; M. Pennasilico (edited by), Manual of civil right environmental, op.cit., page. 248-249.

283
relating to the duration of the contract61, the methods of project financing62 , the role of the parties63 and the distribution of risks64. Indeed, as authoritative doctrine emphasizes65, private public partnership is a privileged instrument for guaranteeing energy efficiency, particularly in the renovation of public property assets, where important investments and rapidly changing technical knowledge are required. Actually, a contractual scheme that allows, during the awarding phase, the private initiative, which can propose to the Administration with the feasibility project the best viable solutions (with the possibility that the tender will allow it to identify other preferable) and, in the execution phase, the taking on by the private investor of both the investment and the guarantee of the agreed result, seems to be the classic “Colombo egg” for an administration committed to renovate annually the 3% of its own real estate asset, squeezed between limits of public finance and lack of necessary knowledge. Applying to the public private partnership, due to public finance protection, the contents of the Eurostat decisions (article 3, paragraph 1, letter ee), also the energy performance contracts stipulated with the Public Administration should not have public debt to comply with the Stability Pact. On the other hand, one of the obstacles to the diffusion of EPCs for the improvement of the energy efficiency of public real estate came from the Eurostat guidelines published on 7 August 201666, which required the qualification of the energy performance contract as an off-balance operation, which cost of the investment had to be at least equal to half the value of the properties subject to requalification, as the outcome of the latter67: a very difficult condition to be met for measures to improve the energy efficiency of a building. On 19th September 2017, Eurostat published new guidelines68 that do not allow investment costs of an EPC to be recorded on the balance sheet under the following conditions: the risks of the intervention
61See the Green Paper on public-private partnerships and European law on public procurement and concessions, COM (2004) 0327 final, point 2:” relatively long duration of collaboration which implies cooperation between the public and private partners in relation to various aspects of a project to be implemented “. 62 Ibidem: “the way of financing the project, guaranteed by the private sector, sometimes through complex relationships between different subjects. Often, however, shares of public funding, sometimes very substantial, can be added to private financing “. 63 Ibidem: “the important role of the economic operator, participating in various phases of the project (design, implementation, implementation, financing). The public partner focuses mainly on defining objectives to be achieved in terms of public interest, quality of services offered, pricing policy, and ensures control of compliance with these objectives.” 64 Ibidem: “risk-sharing between the public partner and the private partner, on which risks are transferred usually to the public sector. However, PPPs do not necessarily imply that the private partner assumes all the risks, or the most relevant part of the risks associated to the operation. The precise distribution of risks is made on a case-by-case basis, depending on the ability of the concerned parties to evaluate, control and manage them”. 65 R. Villata, The public private partnership in the energy sector, in E. Bruti Liberati, M. De Focatiis, A. Travi (ed.), Aspects of the transition in the energy sector: procurement in special sectors, the market design and governance structure, op.cit., pp. 37 ss., Spec. page 44 ss. 66 EUROSTAT, The impact of energy performance contracts on government accounts. The other two conditions laid down by the guidelines are the public contribution eventually granted to the economic operator not exceeding 50% of the expenses incurred and the presence in the contract of a growing system of penalties on the economic operator as the achievement of the performance requirements is reduced established by the contract and such as, to cancel the fee due by the Administration in case of absence of energy savings. 67 Another condition laid down in the Eurostat guidelines of 7th August 2015 was related to the public contribution eventually received by ESCo would not exceed 50% of the expenses incurred and that the risk of “availability” was correctly allocated. 68 Eurostat, The Recording of Energy Performance Contracts in Governments Account, 19th September 2017.

284
(performance, maintenance, requalification and management) all fall on the supplier of energy efficiency measure; that the fee to the supplier is linked to the intervention’s performance and in the case of factoring, the supplier does not assign to the factor the credit pro soluto, so does not transfer the risk of performance to the Administration. Basically, according to the new Eurostat guidelines, if the energy performance contract meets the requirements of the public-private partnership contract, as defined in the procurement code, investment costs are not included in the financial statements and therefore are not relevant for the purposes of compliance with the stability pact.

285
SECTOR COUPLING: THE NEW EU CLIMATE AND ENERGY PARADIGM? Maria Olczak and Andris Piebalgs, Florence School of Regulation Highlights To contribute to the achievement of the Paris Agreement 2°C, and potentially 1.5°C,
objectives the EU needs a new energy paradigm. Sector coupling, binding together power and end-use sectors to integrate the rising share of variable renewable energy in the energy system, offers a new framework for this purpose.
In order to translate the concept of sector coupling into the EU energy and climate policies, we propose to focus on four building blocks: infrastructure planning; system and market operation; regulatory framework; and research, development, demonstration and deployment.
For infrastructure planning, the Ten-Year Network Development Plan (TYNDP) selection process should conclude with one integrated list of projects. Power-to-Gas installations, due to the system value and multitude of applications should become a part of this process and be eligible for the Connecting Europe Facility (CEF) funding.
Regarding system operations, a more integrated system would require better correlation between the electricity and gas market design and price structure. Adjustments to the current electricity price structure may be necessary. The gas quality issues will require enhanced cooperation between upstream producers, end-use consumers and TSOs.
For the regulatory framework, easing the unbundling rules for P2G in specific cases is worth considering, on the condition that the market test does not provide enough evidence for the development of P2G installations.
The possibility of creating a single Target Model for both electricity and gas could be of interest.
Research, development, demonstration and deployment is important for decreasing the capital costs of the new projects. Especially in the early stages, companies, industries and the whole sectors may benefit from the shared P2G or carbon storage infrastructure
Introduction The European Council conclusions from March 2018 invite the European Commission to publish “a proposal for a Strategy for long-term EU greenhouse gas emissions reduction” by the first quarter of 20191. The discussions on the document replacing the 2011 ‘Roadmap for moving to a competitive low carbon economy in 2050’2, the so-called 2050 Roadmap, are underway. Whereas the introduction of any new binding climate policy objectives will require the European Council’s approval, a new roadmap is expected to determine the pathway allowing the European Union to contribute to the achievement of the Paris Agreement objectives. _________________________________________________________________ 1.European Council meeting (22 March 2018) – Conclusions, Brussels 23 March 2018, p. 3. 2 Communication from the Commission to the European Parliament, the Council, the European Economic and Social Committee and the Committee of the Regions A roadmap for moving to a to a competitive low carbon economy in 2050. COM/2011/0112 final.

286
The 180 Parties that have already ratified the Paris Agreement, including the European Union, are committed to the objective of limiting the increase in the global average temperature to well below 2°C and taking steps to limit the warming to 1.5°C above preindustrial levels. The shift from 2°C to 1.5°C objective would require similar transformations in the production and the use of energy, yet the decarbonisation of the whole system would need to be accelerated and “more pronounced”3. In the 1.5°C scenario, the global GHG emissions need to peak no later than around 2020, be net-zero by 2050 (approximately 10 years earlier than in the 2°C scenario) and then become negative. It means that the use of fossil fuels after 2050 should be offset by negative emissions, e.g. through the Carbon Capture and Storage (CCS). In fact, the EU’s new long-term strategy would need to tackle some particularly challenging issues such as how to decarbonise the industrial sectors, especially carbon-intensive cement and steel; how to deal with difficult-to-decarbonise energy uses including aviation, long-distance transport, shipping, and the agricultural sector; and how to integrate the growing ratio of variable renewable energy into the energy system. Last but not least, it will need to consider the future role of the gas sector in EU long-term decarbonisation efforts. There is a growing consensus that the change of such magnitude requires a new approach to the way we conceptualise and manage our energy systems. One of the concepts that is often quoted in the discussions is “sector coupling”.
2. Sector coupling and its benefits The notion of sector coupling (SC) has been known for some time and there is already a vast literature aimed at finding the right definition and its main principles4. Here, the concept is understood as encompassing the “co-production, combined use, conversion and substitution of different energy supply and demand forms – electricity, heat and fuels.”5 In other words, sector coupling binds together power and end-use sectors to integrate the rising share of variable renewable energy in the power sector6. One crucial aspect of sector coupling is an indirect electrification of those energy processes that cannot be electrified directly (e.g. high-temperature industrial processes using hydrogen produced from renewable electricity). Moreover, sector coupling creates new links between energy carriers7 and the respective transport infrastructure, as the excess electricity can be used to produce hydrogen (electrolysis) and synthetic methane (methanation) that can serve to provide energy service through technologies such as Power-to-Gas (P2G), Power-to-Liquid(s) (P2L) or Power-to-Heat (P2H). All the potential pathways are frequently referred to under the common name of Power-to-X (P2X)8. As a result, sector coupling may offer advantages to the whole energy system.
________________________________________________________ 3
Bill Hare et al., Implications of the 1.5°C limit in the Paris Agreement for climate policy and decarbonisation, 2016, p. 4. 4 Cf: T. Brown et al., Synergies of sector coupling and transmission extension in a cost-optimised, highly renewable European energy system, 2018. Martin Robinius et al., Linking the Power and Transport Sectors—Part 1: The Principle of Sector Coupling, 2017. Katrin Schabe et al., Managing Temporary Oversupply from Renewables Efficiently: Electricity Storage Versus Energy Sector Coupling in Germany, 2013. 5 Renewable Energy Policies in a Time of Transition. IRENA, OECD/IEA and REN21, 2018, p. 93. 6 Global Energy Transformation: A Roadmap to 2050. IRENA, 2018, p. 70. 7 Ibid. 8 Maroufmashat and Fowler distinguish as much as ten different “pathways” for P2G applications: A. Maroufmashat, M. Fowler, Transition of Future Energy System Infrastructure; through Power-to-Gas Pathways, Energies 2017, 10, 1089, July 2017

287
First, it will exploit the rising share of electricity. Currently, the excess renewable electricity is curtailed. However, sector coupling enables the use of the excess electricity in electrolysers to produce hydrogen and synthetic methane, which can be stored on a large scale and over longer periods, constituting the source of seasonal flexibility. IRENA estimates that thanks to the large capacity of gas pipelines in Europe, even low blending shares would lead to the absorption of substantial quantities of intermittent renewable energy9. Second, blending hydrogen with natural gas is also a way to progressively decarbonize the gas grids and fully utilize the value of existing gas assets10. The environmental benefits of sector coupling go beyond the gas networks. The hydrogen produced from the renewable electricity – or ‘green hydrogen’ – can replace fossil fuels in many end-use applications11. In transport, Fuel Cell Electric Vehicles (FCEVs) fueled by hydrogen could compliment Battery Electric Vehicles (BEVs) in specific segments of the transport market, such as heavy vehicles or buses. In heavy industry, green hydrogen could replace hydrogen produced mostly from natural gas via Steam-Methane Reforming (SMR)12. It is estimated that in 2015 total global hydrogen demand amounted to 8 exajoules and 90% of the demand came from three sectors: chemicals (ammonia and polymer production), refining (hydrocraking and desulphurization of fuels), and iron and steel production13. Last but not least, the sector coupling could decrease the need to use conventional power plants to provide system services, thus reducing the emissions and their adverse air quality impact, “partly resulting from the demand for flexible operation”14. To sum up, sector coupling may contribute to the achievement of the EU climate and energy objectives – competitiveness, sustainability and security of supply – in a cost-competitive and publicly acceptable way. However, the integration of power generation with end-use sectors would require significant changes in the energy system. The authors believe that the implementation of a sector coupling policy framework should be based on four building-blocks: integrated infrastructure planning; system and market operation; regulatory framework; and research, development and deployment. In the following sections the four pillars of sector coupling are presented. Each section consists of the analysis of the main challenges and current bottlenecks preventing closer integration, as well as the policy recommendations aimed at overcoming the barriers. Due to the limited length of this publication the focus is on the links between the electricity and gas sectors through Power-to-Gas technology. The paper will conclude with more general remarks regarding the role of sector coupling in the EU’s long-term decarbonisation strategy.
3. Sector coupling building blocks 3.1 Infrastructure planning Sector coupling cannot be realised without integrated infrastructure planning. This is of particular importance for the electricity and gas infrastructure, which is characterised by high capital-intensity and a long-term pay-back period. _________________________________________________________________________ 9 Hydrogen from Renewable Power. Technology outlook for the Energy Transition, IRENA, September 2018, pp. 38-40. 10 J. Speirs et al., A Greener Gas Grid: what are the options? White Paper, Sustainable Gas Institute, Imperial College London, July 2017, p. 4. 11 Hydrogen from Renewable Power, op. cit., pp. 38-40. 12 Currently, over 95% of hydrogen is produced from fossil fuels. 13 IRENA 2018, op. cit., p. 14. 14 Michael A. MacKinnon et al., The role of natural gas and its infrastructure in mitigating greenhouse gas emissions, improving regional air quality, and renewable resource integration, Progress in Energy and Combustion Science 64(2018), p.65.

288
In fact, the anticipated increase in the generation of electricity from renewable sources requires massive electricity grid reinforcements and the increase in energy storage capacity to match the power supply and demand. However, in highly-integrated systems, existing natural gas networks could facilitate significant energy transfers in the form of molecules15. The cross-sectoral approach would ensure the best use of existing infrastructure and prevent unnecessary and costly infrastructural investments. The long-term planning of gas and electricity infrastructure in the European Union is governed under the Ten-Year Network Development Plan (TYNDP) framework. The TYNDP is a non-binding document that builds upon national and regional investment plans with the aim to provide a coherent outlook of the pan-European energy infrastructure and to identify potential infrastructure gaps16. The plan is updated every two years and consists of the following elements: the modelling of the integrated network; scenario development; a European supply adequacy outlook (for gas TYNDP) and a European generation adequacy outlook (for electricity TYNDP)17; and the assessment of the resilience of the system. Although the procedures for the establishment of the TYNDP for electricity and gas look very similar, currently the processes are separated and conclude with two separate lists of electricity and gas projects, published by ENTSO-E and ENTSOG, respectively. Moreover, both sectors use different cost-benefit analysis (CBA) Methodologies, which are a crucial instrument for the TYNDP, Projects of Common Interest (PCIs) selection and serve as a reference for investment requests and financial support. In this light, the publication of ENTSOs Scenario Development for TYNDP2018 should be welcomed as a positive development18. For the first time, ENTSOs worked together on a document providing the overview of potential developments in the European energy system up to 2040. It means that as of this year the electricity and gas infrastructural projects will be assessed against the same future scenarios. In addition, the ENTSOs continue to work on the “interlinked electricity and gas market and network model including both electricity and gas transmission infrastructure”19, de facto sector coupling. This year, ENTSO-E and ENTSOG launched the Focus Study, the results of which will become the basis of the Interlinked Model. The Model will be a part of the CBA Methodologies and will apply for the project assessment starting from TYNDP2020. Moving from the European to the regional and local perspective, the availability of local infrastructure has a tremendous impact on the deployment of technologies such as P2G20.
__________________________________ 15 Maurits Kreijkes, Synergies on the Dutch gas infrastructure: Hydrogen and the changing function of the Dutch gas infrastructure. TU Delft Repositories. 16 Regulation (EC) No 714/2009 of the European Parliament and of the Council of 13 July 2009 on conditions for access to the network for cross-border exchanges in electricity and repealing Regulation (EC) No 1228/2003 (Art. 8 points 10 and 11), Regulation (EC) No 715/2009 of the European Parliament and of the Council of 13 July 2009 on conditions for access to the natural gas transmission networks and repealing Regulation (EC) No 1775/2005 (Art. 8 points 10 and 11). 17 Please note that under the Art. 45 of the Proposal for a Regulation of the European Parliament and of the Council on the internal market for electricity (recast) a European generation adequacy outlook has been deleted. 18 TYNDP 2018 Scenario Report. Main Report. March 2018. 19 Regulation (EU) No 347/2013 of the European Parliament and of the Council of 17 April 2013 on guidelines for trans- European energy infrastructure and repealing Decision No 1364/2006/EC and amending Regulations (EC) No 713/2009, (EC) No 714/2009 and (EC) No 715/2009, Art. 11(8). 20 Power to Gas system solution. Opportunities, challenges and parameters on the way to marketability. DENA, November 2015.

289
Before taking the investment decision the companies need to assess the following factors: the connection to the electricity grid and the closeness to the renewable energy sources, and curtailed energy; the connection to the gas network and gas storage facilities; the proximity to potential buyers/end-use consumers; the demand for by-products (e.g. oxygen); finally, the local planning, permit procedures and requirements and the public acceptance. More coordinated planning at local level will gain growing importance as the EU energy system becomes increasingly decentralised. As the works on the final Interlinked Model are ongoing, the authors would like to highlight the following:
The Interlinked Model should not only provide the right instruments to map and assess the interactions between the electricity and gas projects, but also the right tools to eliminate projects whose construction can be avoided in the integrated energy system.
The new P2G installations should be included in the TYNDP. It is also worth considering whether the P2G infrastructure could be eligible for the funding under the Connecting Europe Facility (CEF).
In the more distant future, the TYNDP processes for electricity and gas should be fully integrated resulting in one TYNDP list prepared jointly by ENTSOs.
At the national and local level, the MSs should make sure that the national planning incorporates the timely construction of the associated infrastructure. For instance, extension of electricity grid to connect to the sites with newly-developed decarbonised production units such as P2G facility or biogas-fueled combined heat and power (CHP) plants.
3.2 System operation and market rules The rules enabling the proper functioning of the highly integrated energy system are the second pillar of the sector coupling. There are two main challenges: economic – current electricity price structure; and, technical – the gas quality considerations that could constitute a barrier to cross-border trade. With the gradual electrification of end-use sectors, the access to low-cost clean electricity will become one of the key concerns for the hydrogen producers, the industries using hydrogen as a feed-stock or fuel, and for electrified heat. McKinsey&Company estimated that at current commodity prices the CCS is the cheapest option for decarbonisation. However, with the renewable electricity prices dropping below 50 USD/MWh, using electricity for heat or hydrogen generation becomes more economical than CCS21. It should be noted that this level of prices has been already achieved in Sweden, where the power sector is based on hydropower and nuclear power. In many EU countries the regulated components of electricity price – that is the elements that do not relate to the supply of electricity such as grid fees, taxes and levies – constitute a significant part of the electricity bill. For instance, it has been estimated that in Germany taxes, levies and surcharges constitute 54% of a total power price, whereas the regulated grid fees account for almost a quarter of the price (24.7%). This leaves only 21% of the price set by the market22. In cases where the P2G installations are considered as the end-users and thus obliged to pay the full grid fees, it may constitute a considerable barrier to build a robust business case.
______________________________________________________ 21 McKinsey&Company, Decarbonization of industrial sectors: the next frontier, June 2018, p.8. 22 E. Thalman, B. Wehrmann, What German households pay for power, Clean Energy Wire Factsheet, 5 June 2018.

290
It should be noted that in some EU countries – France, the United Kingdom, Denmark and also Germany – partial exemptions from grid fees, electricity taxes or levies for electrolyser operators are already in place. However, the exemptions are based on the condition that electrolysers operate in a system-beneficial mode, that is, they do not consume electricity during the system peak load23. For example, in Denmark electrolysis is not considered as an end use, but a “special process”, and as a result gains the lowest possible electricity tax rate24. The electricity system can also benefit from the possibility to store green gases, mostly hydrogen and biomethane with the use of already existing natural gas infrastructure and potential newly constructed hydrogen infrastructure. This would make it possible to match electricity supply and demand, which will become increasingly challenging with the rising share of intermittent renewable sources. Despite the already existing storage options such as pumped hydro storage or batteries, hydrogen and other low-carbon gas storage seem to be the most suitable for large-scale and long-term storage including seasonal backup and the reserves stored for energy security reasons25. On the other hand, the quality considerations could prevent higher ratios of hydrogen and synthetic methane injected into the gas pipelines and transported to the final consumers. Even though blending is technically possible, the technical and regulatory problems arise with higher hydrogen content. The studies show that the higher content may be harmful to transmission and distribution pipelines, compressors, and storage facilities, gas metering (currently used chromatographs are not suitable to measure hydrogen) and the end consumers – gas turbines have not been designed to operate on a fuel rich in hydrogen26. The low hydrogen concentrations up to 10-20% are, with some exemptions, acknowledged to be safe for the operation of pipelines or require only minor adjustments. Some of the problems can be solved by retrofitting and using argon to detect hydrogen in gas meters27. Nevertheless, the implications of the increased hydrogen content in the transmission and distribution system would need to be further examined. Recommendations One of the measures that could strengthen the business case of P2G applications is to imple-ment adjustments to the current electricity price structure. Offering the discounted grid tariffs for reversible electrolysis or tax exemptions for electrolyser operators producing green hydrogen, and provided their operations provide benefits to the functioning of the electricity system is one of the potential solutions that is relatively easy to implement. Another possibility is to exempt the green hydrogen producers from RES support levies, on the grounds that this solution creates incentives to decarbonise non-power sectors such as: industry, transport or heat. Also, the electrolysers should be eligible to participate in ancillary service and capacity markets, which could constitute an additional revenue streams for the operators of such facilities. _____________________________________________________________________ 23 Study on early business cases for H2 in energy storage and more broadly power to H2 applications. Final report. Prepared for the Fuel Cells and Hydrogen 2 Joint Undertaking, June 2017, pp. 69-75. 24 Framework conditions for flexibility in the Gas – Electricity interface of Nordic and Baltic countries. A focus on Power-to- Gas (P2G), Flexible Nordic Energy Systems, June 2017, p. 8. 25 J. Moore, B. Shabani, A Critical Study of Stationary Energy Storage Policies in Australia in an International Context: The Role of Hydrogen and Battery Technologies, Energies 2016, 9, 674. 26 M. W. Melaina, Blending Hydrogen into Natural Gas Pipeline Networks: A Review of Key Issues, NREL, March 2013. 27 M. Chaczykowski, A. J. Osiadacz, Power-to-gas technologies in terms of the integration with gas networks, Trans. Inst. Fluid-Flow Mach. 137(2017), pp. 85–103.

291
Electricity grid connection. In cases, where the electrolyser operators are obliged to pay full connection fees, splitting these costs between P2G operators and TSOs is worth considering. Enhancing the cooperation between upstream producers, end-use consumers and TSOs could
be at least an interim measure to deal with gas quality issues. It should be noted that the gas quality resulting from the increased content of renewable gases will probably remain a local issue. That is why setting the European or even national gas quality standard would not always be the optimal solution.
More research is needed to assess the cost associated with the pipeline system modifications required in specific EU regions at several hydrogen blend levels and to test the impact of hydrogen on the end-use systems, such as household appliances and power generation apparatus (e.g. turbines).
3.3 Regulatory framework The sector coupling will not be possible without changing our approach towards the energy sector regulation, as the technologies linking electricity and gas sectors require the adoption of a set of coherent rules. One of the challenges that frequently arises in the discussions regarding the cross-sectoral integration are the current unbundling rules. According to the proposal for a Recast Electricity Directive28, Power-to-Gas falls under the category of energy storage29. In principle, the proposal does not allow either transmission or distribution system operators to own, develop, manage or operate energy storage facilities30. The exemptions are possible only in limited cases. As a result, the Member States may allow the derogation from unbundling rules to P2G projects only if the following conditions specified in the Art. 36(2) and Art 54(2) of the Recast Electricity Directive are met:
other market participants have not expressed their interest to own, develop, manage or operate a P2G facility following the non-discriminatory tendering procedure;
the P2G facility in question is necessary to fulfil TSO’s or DSO’s obligations under the Electricity Directive to ensure system safety, efficiency and reliability and are not used to sell electricity to the market;
the NRA grants its approval after assessing the need for such derogation and taking into account the abovementioned conditions;
the Recast Electricity Directive presents an opportunity to reverse the status quo resulting from the application of the derogation decision, if the public consultation performed at least every five years reveals the interest of other market entities to invest in storage facilities, the system operators are obliged to cease their activities.
_______________________________________________________
28 Proposal for a directive of the European Parliament and of the Council on common rules for the internal market in electricity (recast). 29 Art 2(47) of the Recast Electricity Directive defines the “energy storage” in the electricity system as: “deferring an amount of the electricity that was generated to the moment of use, either as final energy or converted into another energy carrier”. This definition may be considered as not detailed enough; however the General approach adopted by the Council on 20 December 2017 proposes a more detailed definition, which leaves no doubt that P2G facilities should be considered as energy storage. In the Art 2(47) ‘energy storage’ in the electricity system is defined as “the conversion of an amount of the electricity that was generated into a form of energy which can be stored, the storing of that energy, and the subsequent direct use or reconversion of that energy back into electrical energy or into another energy carrier and use of that reconverted energy at a later moment than it was generated”. Please note that the General approach is not a binding document, but a negotiating position allowing the Council to start negotiations with the European Parliament. 30 Art. 36 and 54.

292
The above-mentioned proposal will be discussed in the coming months and is still subject to revision. However, the provisions in the current form open the door for the system operators to own, develop, manage or operate energy storage facilities, including P2G installations. This may happen by way of derogation from unbundling rules granted by the NRA if storage facilities are necessary for TSOs and DSOs to fulfill their tasks and there is no interest from the market participants to invest in such facilities. The authors believe that the Electricity Directive proposal in the current form determines the right balance between the unbundling rules, which are the cornerstone of the EU energy markets’ liberalisation, the interests of system operators and the market entities. As a matter of fact, the provisions strengthen the role of the national regulators, as by granting derogation decisions they can enhance or limit the pace of the construction of the new facilities. Apart from the rules on unbundling, creating cross-sectoral regulation suitable for a more integrated energy market is tempting. Currently, there are two separate sets of regulation dealing with electricity and natural gas markets, respectively. It seems that both markets would benefit from more integrated regulation, especially if sector coupling becomes the new normal. The potential starting point could be the integration of non-binding rules such as Electricity and Gas Target Models. Interestingly, the need for closer cooperation between electricity and gas sectors as a consequence of the higher shares of renewable energy source generation affecting both markets has been already recognised in the updated version of European Gas Target Model. The 2015 Gas Target Model proposes the introduction of a legally-binding obligation on gas and electricity TSOs to cooperate with each other, inter alia, through a better exchange of information and “a cooperative review of gas and electricity industry timelines” and the TYNDP process31. Recommendations A set of non-binding guidelines for NRAs to make the decisions regarding the granting of a derogation from unbundling rules could be helpful. The Guidelines should on the one hand support the role of system operators in constructing and operating energy storage facilities, based on the fact that some technologies are in their early deployment phase, but on the other hand they should guarantee the necessary level of competition in the market. The definition of ‘energy storage’ in the Recast Electricity Directive should be clarified.
Potentially, the definition of Power-to-Gas could be included in the new electricity and the upcoming gas package.
3.4 Research, development, demonstration and deployment (RDD&D) The research, development, demonstration and deployment of the most promising technologies is the last pillar on which the sector coupling is founded, as it is the only way to achieve the robust and affordable low-carbon energy system32. It has been proven that innovation and the production scale-up could lead to capital cost reduction by as much as 30% and the creation of new (business) opportunities33. But the achievement of the GHG reductions beyond 80% would require not only that the technologies are developed, but also that they are ready to be commercialised at an opportune time. According to the study on sectoral integration ordered by the European Commission, the review of the technological developments providing a clear indication of which (technological) strategy to follow should take place within the next decade.
__________________________________________________ 31 European Gas Target Model – Review and update, ACER, January 2015, p. 7. 32. Steven J. Davis et al., Net-zero emissions energy systems, Science 360, eaas9793, 29 June 2018, p. 7. 33 O. Schmidt et al., Future cost and performance of water electrolysis: An expert elicitation study. International Journal of Hydrogen, Energy Volume 42, Issue 52, 28 December 2017, Pages 30470-30492.

293
In fact, achieving the net-zero emissions energy system around 2050 would require that the modifications of the current energy systems are well-advanced a decade before, that is around 204034. This claim is based on the observation that the high investment requirements make it impossible to continue the development of certain options over a prolonged period. In fact, in the long-term perspective only a handful of technologies will achieve the required economies of scale and will dominate in the energy market. Recommendations In the following years, more effort should be made to decrease the capital costs via innovation and the deployment of technologies at different scales, with a focus on technologies that provide multiple energy services such as Power-to-Gas. The industry should take a more active role in decarbonisation efforts identifying the synergies between the industrial decarbonisation and the decarbonisation in other sectors. A good example is a joint AkzoNobel and the Dutch TSO - Gasunie project to build a 20MW electrolyzer in the northern part of the Netherlands35. Conclusions In order to keep up with its international climate commitments under the Paris Agreement, the European Union will need to define the pathway towards achieving net-zero emissions energy system by 2050. The new EU long-term emissions strategy expected to be published this autumn will be a significant step. The deep decarbonisation of the whole energy system including the gas sector, industry, transport and heating would require more integrated policy and regulatory frameworks. The notion of sector coupling, based on linking together power and end-use sectors to integrate the rising share of VRE, is well-suited for this purpose. It is a solution that offers not only the environmental benefits but also seems to be one of the most cost-competitive, and politically and socially acceptable options. Putting this notion into practice would require the focus on four equally important building blocks: infrastructure planning, system and market operation, regulatory framework, and continuous investments in the research, development, demonstration and deployment. In this paper we have presented a list of recommendations addressing the key challenges in these areas. Finally, although sector coupling could be good strategy for a successful energy transition in Europe, we need also to remember that “(…) a successful transition is one that holistically considers three aspects - or layers - of the system: technical [flow of energy between source and load], economic [monetary flows between different market participants], and institutional [flows of information and division of roles and responsibilities].”36 ________________________________________________________________________ 34 Sectoral integration-long-term perspective in the EU Energy System. Final report. Asset project. February 2018, p. 11. 35 Bart H. Meijer, Akzo and Gasunie plan to build Europe’s largest green hydrogen plant, Reuters, 9 January 2018. 36 Status of the Power System Transformation: System integration and local grids. OECD/IEA, 2017, p. 83.

CONSIDERATION ABOUT HYDROGEN AND FUEL CELLS IN THE PARIS AGREEMENT 1.5°C PERSPECTIVE Mario Valentino Romeri, Consultant, Italy Overview For long time hydrogen energy vector and fuel cells technologies seem to be a Cinderella low-carbon solution in energy, transport and climate change debates but recently something happened. In recent months this low-carbon solution is living a new favorable momentum in the international debate. From November 2017, when Hydrogen Council presented the report “Hydrogen, Scaling up” that outlines and quantified roadmap to scale deployment and its enabling impact on the energy transition, through October 2018, when at the Hydrogen Energy Ministerial Meeting 2018 (Tokyo, Japan) countries agreed on specific areas of collaboration detailed in the “Tokyo Statement”, and up to now. New specific national or international studies, reports, policy strategies and roadmaps considered, included and/or developed the hydrogen and fuel cells clean energy option. From longtime I underlined the possible relevant implication of hydrogen and fuel cell use in stationary and transport applications and, in recent years I presented works in which I argued that it’s time to consider Fuel Cell Vehicle (FCV) as a relevant possible low-carbon solution in energy debate. The electricity produced by a hydrogen fuel cell can be used both for stationary and transport application and the traditional model to link transport to energy sector is the Vehicle-to-Grid (V2G) approach. But I think that it is time to consider the link between the transport sector and the energy sector not only in a V2G approach but in another perspective more direct, relevant and disruptive. In fact the Hydrogen Fuel Cell Powertrain (H2FCPowertrain) or, in other words, the propulsion system of a FCV, is a small power generation plant (typically the H2FCPowertrain size is around 100 kW). In the coming years the high volume associated with the possible FCVs mass production will permit to reduce dramatically the FC system manufacturing costs, in order to be competitive with gasoline in hybrid-electric vehicles. In a mass production perspective, H2FCPowertrain will be so cost competitive to be useful adopted also for stationary power generation application, also in LCOE terms. From 2010 I wrote, presented and published studies where I compared the H2FCPowertrain LCOE, based on the U.S. Department of Energy (DOE) public data, with the traditional power generation technologies with very promising results, in the U.S. context and in many other contexts around the world. From 2017 in my analysis I started to use also the International Energy Agency (IEA) data for the hydrogen production costs. At the end of this analysis, hydrogen and fuel cells seem not more a Cinderella in the international debates. This low-carbon solution has made a strong comeback in energy portfolio options and today it is considered as one of possible ‘game changer’. This analysis confirmed, in LCOE terms, the economic advantage “to consider a H2FCPowertrain as power generation plant” and explained related possible long-term effects in power generation. But other analyses seem to be needed in order to well understand the relevance of hydrogen and fuel cells in “1.5°C” perspective and to suitably assess all the economic, financial an geopolitical implications. At this point, most important thing to do seem to be to well explain to all involved actors, with peculiar attention to policy-makers, all the advantages to use hydrogen and fuel cells and the possibility to utilize H2FCPowertrain as power generation plant. In this way we hope to
294

295
accelerate even more the introduction of this breakthrough low-carbon solution and to support this new and feasible path to implement the Paris Agreement pursuing efforts to limit the temperature increase to 1.5°C above pre-industrial levels. 1. General Consideration It is longtime that I underlined the possible relevant implication of hydrogen and fuel cell use in stationary and transport applications and, in recent years I presented works in which I argued that it’s time to consider FCV as a relevant possible low-carbon solution in energy debate. From 2010 I wrote, presented and published different studies where I compared the H2FCPowertrain LCOE, based on the DOE public data, with the traditional power generation technologies LCOE with very promising results, in the U.S. context and in many other around the world. From 2017 in my analyses I started to use also the IEA data for the hydrogen production costs. In this paper recent data and new considerations about possibly implication of this low-carbon solution in power generation have been made. 2. Investment Costs in Energy Sector The Energy Sector is capital intensive and characterized by long-term investment. Investment costs are probably most important element in any investment decision also in power generation. They vary greatly from technology to technology, from time to time and from country to country. Overnight cost is a common unit of measure of power investments. Overnight cost is the cost of a construction project if no interest was incurred during construction, as if the project was completed ‘overnight’. The unit of measure typically used for Overnight cost is USD/kW. Levelized Costs of Generating Electricity (LCOE) is often cited as a handy tool for the analysis of generation costs and to compare the unit costs and the overall competiveness of different generating technologies. Focus of estimated average LCOE is the entire operating life of the power plants for a given technology. In LCOE model, different cost components are taken into account: capital costs, fuel costs, operations and maintenance costs (O&M), decommissioning costs. The resultant LCOE values, one for each generation option, are the main driver for choice technology. The unit of measure typically used for LCOE is USD/MWh. 3. Fuel Cells Fuel cell is a device that uses a fuel and oxygen to create electricity by an electrochemical process, without combustion. A single fuel cell consists of an electrolyte and two electrodes (anode and cathode). Fuel cells are classified primarily by the kind of electrolyte they employ and PEM Fuel Cells (PEMFC) use hydrogen as fuel and have emissions only of water. Today PEMFC are present in a wide range of products and prototypes and I chose to consider in my analysis the H2FCPowertrain as “Power Generation Plant” because the high volume associated with the FCVs mass production (from 10k to 500k and more units/year) will permit to reduce dramatically the fuel cell system manufacturing costs, in order to be competitive with gasoline in Hybrid-Electric Vehicles (HEVs). In my opinion, in this perspective, H2FCPowertrain will be so cost competitive to be useful adopted also for stationary power generation application as a power generation plant. This opinion is supported by my LCOE analyses.
3.1 Beyond the Vehicle-to-Grid Concept: Considering H2FCPowertrain as Power Generation Plant Every day more than 90% of vehicles are parked, even during peak traffic hours. In this situation the vehicle power generation system H2FCPowertrain, if properly equipped, could

296
become a new power generation source, supplying electricity to homes and to the grid like a new type of distributed generation: Vehicle-to-Grid (V2G). Academics, public and private operators well know the V2G concept and V2G could be realized indifferently with Electric Vehicles and FCVs, but only in the case of FCV we are in presence of a real new power generation capacity greenhouse gas (GHG) emission free: the H2FCPowertrains. FCV in a V2G mode may profitably provide power to the grid when they are parked and connected to an electrical outlet. The study “Fuel cell electric vehicle as a power plant: Fully renewable integrated transport and energy system design and analysis for smart city areas” (V. Oldenbroek, et al., 2017, quoted in IPCC, 2018c) is useful to well understand the V2G concept. In my opinion, in the coming years, hydrogen and fuel cells have the potential to be a disruptive low-carbon solution. The electricity produced by a hydrogen fuel cell can be used both for stationary and transport application and I think that it is time to consider the link between the transport sector and the energy sector not only in a V2G approach but in another perspective, more direct, relevant and disruptive. The H2FCPowertrain or, in other words, the propulsion system of a FCV, is a small power generation plant (typically the H2FCPowertrain size is around 100 kW). In the coming years the high volume associated with the possible FCVs mass production will permit to reduce dramatically the fuel cell system manufacturing costs, in order to be competitive with gasoline in hybrid-electric vehicles. In a mass production perspective, H2FCPowertrain will be so cost competitive to be useful adopted also for stationary power generation application. 4. Considering H2FCPowertrain as Power Generation Plant: LCOE Analysis In order to calculate the H2FCPowertrain LCOE it is necessary to know some specific data: system cost and efficiency, expected system lifetime and fuel cost (i.e. hydrogen production cost). This analysis is based on DOE and IEA public data. 4.1 The U.S. DOE Data Current Status (2017) - 80-kWnet PEM FC System: Overnight cost, 45 USD/kW (at 500k units/year; 50 USD/kW at 100k units/year; 179 USD/kW 1k units/year); 52% System efficiency; Lifetime, 4,100 hours; Hydrogen cost: 5 UDS/kg-GGE (based on natural gas steam reforming, high volume projection; including: production, delivery & dispensing) (DOE, 2017). Main data in next DOE figure (DOE, 2017). 2020 DOE technical targets: Overnight cost, 40 USD/kW (at 500k units/year); 60% System efficiency; Lifetime, 8,000 hours; Hydrogen cost, 4 UDS/kg-GGE (same assumptions of current status) (DOE, 2016 and 2017). Main data in next page DOE figure (DOE, 2017).

297
4.2 The IEA Hydrogen Production Costs Data Considering the fact that DOE data regarding hydrogen including “production, delivery & dispensing” costs, from 2017, I started to use the IEA hydrogen production costs presented in “Producing ammonia and fertilizers: new opportunities from renewable” (updated version dated 1st October 2017). The IEA hydrogen production costs data-range is 1-4 UDS/kg-GGE and includes both hydrogen from natural gas steam reforming and hydrogen from electrolyzes, for different electricity costs and load factors. Main data in next IEA figure (IEA, C. Philibert, 2017). According to Philibert: “Thanks to the recent cost reductions of solar and wind technologies, ammonia production in large-scale plants based on electrolysis of water can compete with ammonia production based on natural gas, in areas with world-best combined solar and wind resources” and “similar hydrogen prices could be reached in countries with lower-quality renewable resources if “surplus” electricity is considered free” (IEA, C. Philibert, 2017).
4.3 The 2020 H2FCPowertrain LCOE Combining the 2017 DOE fuel cell data and the 2017 IEA hydrogen production costs data-range (1-4 USD/kg-GGE) the current H2FCPowertrain LCOE value-range would be 70-243

298
USD/MWh. The 2020 H2FCPowertrain LCOE value-range would be 56-206 USD/MWh. It is interesting to note that these values are mainly due to the hydrogen production costs data-range that impact for 50-200 USD/MWh in LCOE.
H2FC Powertrain Levelised Cost of Electricity (USD/MWh)
Efficiency LIFE Hours
IEA Hydrogen cost USD/kg-GGE^
Capital Overnight
Cost USD/kW
Levelized Capital Cost
LCC USD/MWh
O&M + Others (Assumed Equal
to 10% LCC) USD/MWh
Fuel Cost USD/MWh
LCOE USD/MWh ASSUMPTIONS
60% 8000 4,0 40,0 5,0 0,5 200,0 205,5 2020 DOE Targets (2017) & H2 IEA (2017) 60% 8000 3,0 40,0 5,0 0,5 150,0 155,5 2020 DOE Targets (2017) & H2 IEA (2017) 60% 8000 2,0 40,0 5,0 0,5 100,0 105,5 2020 DOE Targets (2017) & H2 IEA (2017) 60% 8000 1,0 40,0 5,0 0,5 50,0 55,5 2020 DOE Targets (2017) & H2 IEA (2017)
^ Production costs: H2 from natural gas steam reforming and H2 from electrolizers (for different electricity costs and load factors)
4.4 The U.S. Energy Information Administration (EIA) Levelized Cost of New generation
Resources Based on projected mass-production volume assumptions, the 2020 H2FCPowertrain LCOE value-range would be 56-206 USD/MWh and, for the lower value of this range, it appeared competitive with many of the U.S. power generation technologies analyzed by the U.S. Energy Information Administration (EIA) that annually realizes forecast about Overnight Costs and LCOE in the Annual Energy Outlook. So, in favorable conditions of hydrogen production costs, H2FCPowertrain seems to be useful to be adopted also for stationary power generation application. LCOE data for different plant types for the period 2012-2017 and Overnight Costs for years 2012-2016 are in next table (EIA, 2017a and 2017b). The U.S. LCOE of New Generation Resources from the EIA Annual Energy Outlook 2012-2017 (Plants Entering Service in 2022
2012 Overnight
Cost in 2012 (USD/kW
2011)
2013 Overnight Cost in 2013
(USD/kW 2012)
2014 n.s. Overnight
Cost in 2014
(USD/kW 2013)
2015 Capacity Factor
(%)
2015 n.s.
Overnight Cost in 2015
(USD/kW 2014)
2016 Capacity Factor
(%)
2016 n.s.
Overnight Cost in 2016
(USD/kW 2016)
2017 Capacity Factor
(%)
2017 n.s.
Plant Type
Total LCOE (USD/ MWh)
Total LCOE (USD/ MWh)
Total LCOE (USD/ MWh)
Total LCOE (USD/ MWh)
Total LCOE (USD/ MWh)
Total LCOE (USD/ MWh)
Conventional Coal 97,7 2883 100,1 2925 95,7 2726 85 95,1 Advanced Coal IGCC 110,9 3718 123,0 3771 115,9 3483 85 115,7 Advanced Coal IGCC with CCS 138,8 5138 135,5 6567 147,4 5891 85 144,4 5098 85 139,5 4586-5072 85 123-140 Conventional Gas Combined Cycle 66,1 901 67,1 915 66,3 869 87 75,2 956 87 58,1 923 87 57,3 Advanced Gas Combined Cycle 63,1 1006 65,6 1021 64,4 942 87 72,6 1080 87 57,2 1013 87 56,5 Advanced Gas Combined Cycle with CCS 90,1 2059 93,4 2084 91,3 1845 87 100,2 2132 87 84,8 1917 87 82,4 Conventional Combustion Gas Turbine 127,9 956 130,3 971 128,4 922 30 141,5 922 30 110,8 1040 30 109,4 Advanced Combustion Gas Turbine 101,8 664 104,6 673 103,7 639 30 113,5 664 30 94,7 640 30 94,7 Advanced Nuclear 111,4 5429 108,4 5501 96,1 4646 90 95,2 6108 90 102,8 5091 90 99,1 Geothermal 98,2 2567 89,6 2494 47,8 2331 92 47,8 2331 91 45,0 2331 91 46,5 Biomass 115,4 4041 111,0 3919 102,6 3399 83 100,5 3498 83 96,1 3540 83 102,4 Fuel Cells 6982 7044 6042 7181 6252 Wind 96,0 2175 86,6 2205 80,3 1850 36 73,6 1536 40 64,5 1576 39 63,7 Wind - Offshore 6121 221,5 6192 204,0 4476 38 196,9 4605 45 158,1 4648 45 157,4 Solar PV 152,7 3805 144,3 3564 130,0 3787 25 125,3 2362 25 84,7 2169 24 85,0 Solar Thermal 242,0 4979 261,5 5045 243,1 3123 20 239,7 3895 20 235,9 3908 20 242,0 Hydro 88,9 2397 90,3 2435 84,5 2651 54 83,5 2191 58 67,8 2220 59 66,2 n.s. = no subsidy
5. Considering H2FCPowertrain as Power Generation Plant: Possible
Long-Term Effects in Power Generation
Based on the data of this analysis, it is possible to observe that the future progressive introduction of H2FCPowertrain as power generation plant in the power generation sector could involve considerable long-term effects in this sector. In terms of Overnight Cost (USD/kW, based on EIA 2016 data) the H2FCPowertrain plant cost is equal to 1/127 of Nuclear plant; 1/115 of Coal with CCS plant; 1/58 of Geothermal power station; 1/25 of Advanced Gas Combined Cycle with CCS plant and 1/16 of Advanced Combustion Gas Turbine plant. Thanks to the introduction and use of H2FCPowertrains as power plants it seem to be possible to think that the present capital intensive profile of the power generation sector could change gradually.

299
In terms of Plant Lifetime, the H2FCPowertrain appears poor (also considering the 2020 DOE target of 8,000 hours lifetime) if compared either to the other generation technologies or to the DOE CHP target (80,000 hours). But, in a long term investment perspective, it is possible to foresee a planned replacement of the H2FCPowertrain stack at the end of each lifetime at a cost that today is about 42% of the whole system (details in upper left DOE figure) and this, without taking into account the value of recoverable platinum from the exhaust stack. Thanks to the introduction and use of H2FCPowertrains as power plants it seem to be possible also to think that the present long-term investment profile of the power generation sector could change gradually. 6. A New Favorable Momentum for Hydrogen and Fuel Cells in the International Debates For long time hydrogen and fuel cells seem to be a Cinderella low-carbon solution in energy, transport and climate change debates but recently something happened. In recent months this low-carbon solution is living a new favorable momentum in the international debate. New specific national or international studies, reports, policy strategies and roadmaps considered, included and/or developed the hydrogen and fuel cells clean energy option. More in detail, among other: November 2017. Hydrogen Council1 presented in Bonn at COP 23 “Hydrogen, Scaling up” a report developed with McKinsey that outlines a comprehensive and quantified roadmap to scale deployment and its enabling impact on the energy transition. According to the report: “Hydrogen is a central pillar of the energy transformation required to limit global warming to 2°C. Abundant, versatile, clean, and safe, hydrogen can play seven vital roles in this transformation: 1) Enabling large-scale renewable energy integration and power generation2; 2) Distributing energy across sectors and regions; 3) Acting as a buffer to increase energy system resilience; 4) Decarbonising transportation; 5) Decarbonising industrial energy use; 6) Helping to decarbonise building heat and power; 7) Providing a clean feedstock for industry. To realize this vision, investors, industry, and government will need to ramp up and coordinate their efforts. Overall, the annual demand for hydrogen could increase tenfold by 2050 to almost 80 exajoule (EJ) meeting 18% of total final energy demand. Deployed at scale, by 2050 hydrogen could reduce annual CO2 emissions by roughly 6 gigatons (Gt) or one-fifth of the abatement required to limit global warming to 2°C. Decarbonising road transport is a key to achieving the 2°C scenario and hydrogen and fuel cells are critical elements to do that. FCVs could complement Battery EVs to achieve a deep decarbonisation of all segments. By 2030, 1 in 12 cars sold in California, Germany, Japan, and South Korea should be powered by hydrogen when sales start ramping up in the rest of the world. The potential for hydrogen is to power about 10 to 15 million cars and 500,000 trucks by 2030 and more than 400 million cars, 15 to 20 million trucks and around 5 million
1 Hydrogen Council is a global CEO-level advisory body providing long-term vision on the important role of hydrogen technologies toward an energy transition. Launched in January 2017, it is currently composed of CEOs and chairpersons from the following companies: 3M, Airbus, Air Liquide, Air Products, Alstom, Anglo American, Audi, BMW GROUP, China Energy, Cummins, Daimler, EDF, ENGIE, Equinor, Faurecia, General Motors, Great Wall Motor, Honda, Hyundai Motor, Iwatani, Johnson Matthey, JXTG Nippon Oil & Energy Corporation, Kawasaki, KOGAS, Plastic Omnium, Royal Dutch Shell, Sinopec, The Bosch Group, The Linde Group, Thyssenkrupp, Total, Toyota and Weichai (Hydrogen Council, 2018d). 2 In Energy Council vision, by 2050, hydrogen enables the deployment of renewables by converting and storing more than 500 TWh of otherwise curtailed electricity (Hydrogen Council, 2017).

300
buses3 in 2050, with the results to 20 million barrels of oil replaced per day and 3.2 Gt CO2 abated per year. By 2050 hydrogen also power a quarter of passenger ships and a fifth of locomotives on no electrified tracks, and hydrogen-based synthetic fuel powers a share of airplanes and freight ships” (Hydrogen Council, 2017). December 2017. IEA Hydrogen presented the special report “Global Trends and Outlook for Hydrogen” that examines why hydrogen offers an elegant solution to environmental problems. As a highly flexible energy carrier, hydrogen can deliver clean, integrated and multi sector-systems approach to energy that will contribute decisively to solving the environmental problem and securing earth’s energy future. In this perspective use of hydrogen for storage of renewable electricity (converted via water electrolysis) is a ‘game changer’ and hydrogen reserves can help to buffer the electricity system, enhancing system security (IEA Hydrogen, 2017). January 2018. World Energy Council (WEC) Netherlands presented the report “Bringing North Sea Energy Ashore Efficiently” that underline the North Sea crucial role in the energy transition of Northwest Europe assuming a rapidly increasing in offshore wind capacity. The study looks at two pathways electrons (power) and molecules (hydrogen produced by power-to-gas generation), and it concludes that the best solution is to create an affordable and reliable energy supply based on a hybrid system of green-power and green-hydrogen (WEC, 2018). April 2018. International Renewable Energy Agency4 (IRENA) presented the report “Global Energy Transformation: A Roadmap to 2050” that shows the capacity for renewable energy in combination with energy efficiency to provide over 90% of the necessary energy-related CO2 emission reductions to limit average global temperature rise to “well below 2°C”. This report assumes the introduction of renewable hydrogen as a transport fuel used in FCV and also an important role in industry sector where hydrogen will be used to replace natural gas and produce chemicals (IRENA, 2018a).
May 2018. At 9th Clean Energy Ministerial - 3rd Mission Innovation Ministerial (Malmo, Sweden) international community discussed steps to enhance public and private investment and collaboration on clean energy research and innovation and governments seem able to recognizing the key role hydrogen can play in decarbonization and investors the value it can bring worldwide. Mission Innovation Action Plan: 2018-2020 included the new “Hydrogen Innovation Challenge” launched with the aim of accelerating development of a global hydrogen market by identifying and overcoming key barriers to the production, distribution, storage, and use of hydrogen at gigawatt scale (Mission Innovation, 2018a and 2018b; Hydrogen Council, 2018a). July 2018. California Fuel Cell Partnership (CFCP) presented “The California Fuel Cell Revolution”, a vision document that envisions a new era of zero-emission fuel cell vehicles with a network of 1,000 hydrogen stations and up to 1,000,000 FCVs by 2030 in California. According to the document: “The environment for hydrogen-powered fuel cell cars has never been more conducive to growth. The time to act is now” (CFCP, 2018). August 2018. CSIRO presented the National Hydrogen Roadmap for the development of a hydrogen industry in Australia. The development of a hydrogen export industry (to China,
3 Decarbonizing these segments is particularly important as they consume a large share of total energy – while trucks and buses would account for only 5% of all FCVs in 2050, they could achieve more than 30% of hydrogen’s total CO2 abatement potential in the transport sector (Hydrogen Council, 2017). 4 With more than 170 Member States actively engaged, IRENA is an intergovernmental organisation that promotes renewable resources and technologies as the key to a sustainable future and helps countries achieve their renewable energy potential (IRENA, 2018c).

301
Japan and South Korea) represents a significant opportunity for Australia and a potential ‘game changer’ for the local industry and the broader energy sector (CSIRO, 2018). September 2018. IRENA presented the report “Hydrogen from Renewable Power - Technology Outlook for the Energy Transition” that outlines the potentially pivotal role hydrogen may play in a deeper energy transition. According to the report: “In the energy transition, hydrogen could be the ‘missing link’ to help supply large amounts of renewable power to sectors that are otherwise difficult to decarbonise through direct electrification, such as transport, industry and current natural gas uses. The technologies are ready. A rapid scaling-up is now needed to achieve the necessary cost reductions and ensure the economic viability of hydrogen as a long-term enabler of the energy transition. To achieve rapid scale-up, a stable and supportive policy framework would be needed to encourage the appropriate private investments. The latest economic assessment by IRENA (2018a) estimates hydrogen’s economic potential at about 8 EJ at the global level by 2050 in addition to feedstock uses” (IRENA, 2018b). September 2018. Austrian Presidency of the Council of the European Union proposed and signed a “The Hydrogen Initiative” (Linz, Austria) a policy document to support the development of sustainable hydrogen, favoring cross-sector linking and energy flexibility. The signatories underline that renewable hydrogen has the potential to contribute to the Union’s pathway of decarbonising the economy and wider application of sustainable hydrogen technology is able to contribute to the economic competitiveness of the EU. Signatories focused ambitions and efforts in the following fields: sector integration and coupling; energy storage; direct injection into the gas-grid; conversion of hydrogen to renewable methane; industry; transport and mobility (Austrian Presidency, 2018). September 2018. Hydrogen Council presented the report “Hydrogen Meets Digital” prepared for the Global Climate Action Summit. According to the report: “Hydrogen will play a major role in the energy transition, but it is also key to power the digital revolution.” and” By 2030, hydrogen technologies could power up to 1.5 million autonomous taxis, 700,000 autonomous shuttles, 8,000 vertical take-off and landing taxis, 3.6 million delivery trucks and provide up to 1 TWh of backup power for data centres. As a result, this digital future could grow the world’s hydrogen market, in addition to the applications highlighted in the 2017 Hydrogen Council Report Scaling Up by another 7 million tons of annual hydrogen demand and the use of 6.4 million fuel cells by 2030” (Hydrogen Council, 2018b and 2018c). October 2018. Intergovernmental Panel on Climate Change (IPCC) presented the Special Report on “Global Warming of 1.5ºC” (SR15). As part of the decision to adopt the Paris Agreement, the IPCC was invited to produce, in 2018, a Special Report on global warming of 1.5°C above pre-industrial levels and related global GHG emission pathways .5 SR15 key messages are: Limiting warming to 1.5°C is possible within the laws of chemistry and physics but doing so would require unprecedented changes. We are already seeing the consequences of 1°C of global warming through more extreme weather, rising the sea level and diminishing Arctic sea ice, among other changes. The next few years are probably the most important in
5 Paris Agreement 1.5°C perspective is stated by Article 2: “This Agreement, in enhancing the implementation of the Convention, including its objective, aims to strengthen the global response to the threat of climate change, in the context of sustainable development and efforts to eradicate poverty, including by: (a) Holding the increase in the global average temperature to well below 2°C above pre-industrial levels and pursuing efforts to limit the temperature increase to 1.5°C above pre-industrial levels, recognizing that this would significantly reduce the risks and impacts of climate change;” (UNFCCC, 2015).

302
our history6. SR15 included Hydrogen as technology useful to reduce CO2 emission (IPCC, 2018a and 2018c). October 2018. “Hydrogen Energy Ministerial Meeting 2018” (Tokyo Japan) was the first Ministerial-level meeting on hydrogen since the U. S. launched the International Partnership for Hydrogen and Fuel Cells in the Economy (IPHE) in 2003. Ministers and Delegates met to promote cooperation on research, development and deployment of hydrogen and fuel cells technologies within their societies. Together, they shared the view that hydrogen can be a key contributor to the energy transitions underway to a clean energy future. Participants agreed on four specific areas of collaboration7 detailed in the “Tokyo Statement” with the aim to accelerate progress in hydrogen technologies, contributing to a “Hydrogen Society”, as part of a broad energy portfolio, to a clean, more prosperous and secure energy future worldwide (METI, 2018a and 2018b). November 2018. IEA presented “World Energy Outlook 2018” (WEO) that give a clear indication: “Over 70% of global energy investments will be governments-driven and the world’s energy destiny lies with decisions and policies made by governments”.8 WEO included hydrogen in some of the proposed scenarios and explored “low-carbon hydrogen” as one of the various ‘game-changing’ options in the future energy system. It consider the possible future role of water electrolysis to produce hydrogen and his role to unlock stranded renewable resources, establishing new hydrogen production facilities in parts of the world with significant renewable-based electricity potential. Also, it argue about hydrogen as alternative fuel and about hydrogen-based fuels and, more generally, about “low-carbon hydrogen” as a possible way to reduce emissions from the refining sector (IEA, 2018a). November 2018. Committee on Climate Change (CCC-UK) published the report “Hydrogen in a low-carbon economy” that assesses the potential role of hydrogen in the UK’s low-carbon economy. According to the report “hydrogen: is a credible option to help decarbonise the UK energy system but its role depends on early Government commitment and improved support to develop the UK’s industrial capability; can make an important contribution to long-term decarbonisation if combined with greater energy efficiency, cheap low-carbon power generation, electrified transport and new ‘hybrid’ heat pump systems, which have been successfully trialed in the UK; could replace natural gas in parts of the energy system, where electrification is not feasible or is prohibitively expensive”, and “Key recommendations are: Government must commit to developing a low-carbon heat strategy within the next three years; Government must support the early demonstration of the everyday 6 In model pathways with no or limited overshoot of 1.5°C, global net anthropogenic CO2 emissions decline by about 45% by 2030 (40–60% interquartile range), reaching net zero around 2050 (2045–2055 interquartile range). For limiting global warming to below 2°C CO2 emissions are projected to decline by about 25% by 2030 in most pathways (10–30% interquartile range) and reach net zero around 2070 (2065–2080 interquartile range) (IPCC, 2018b). 7 Tokyo Statement areas of collaboration: 1) Collaboration on technologies and coordination on harmonization of regulation, codes and standards so as to accelerate a decrease in costs of hydrogen supply and products (e.g. FCVs); 2) Promotion of information sharing, international joint research and development among member countries to expand hydrogen utilization (e.g. ensuring the safety of hydrogen stations and storage facilities); 3) Study and evaluation of hydrogen’s potential economic effects and CO2 emission-reduction potential; and 4) Communication, education and outreach activities to increase the understanding of hydrogen (METI, 2018b). 8According to WEO Executive Summary: Government policies will shape the long-term future for energy. More than 70% of the USD 2 trillion required in the world’s energy supply investment each year, across all domains, either comes from state-directed entities or responds to a full or partial revenue guarantee established by regulation. Frameworks put in place by the public authorities also shape the pace of energy efficiency improvement and of technology innovation. Government policies and preferences will play a crucial role in shaping where we go from here (IEA, 2018b).

303
uses of hydrogen in order to establish the practicality of switching from natural gas to hydrogen; A strategy should be developed for low-carbon heavy goods vehicles which encourages a move away from fossil fuels and biofuels to zero-emission solutions by 2050” (CCC-UK, 2018). November 2018. European Commission adopted the strategy “The Commission calls for a climate neutral Europe by 2050” for long-term EU GHG reduction in accordance with the Paris Agreement. The strategy presents 8 different pathways for the EU that achieve GHG emissions reductions between -80% by 2050 (compared to 1990) up to net zero GHG emissions by 2050. It sets the scene for future policy choices of the EU. It is a strategic vision and not a legislative proposal, supported by a detailed analysis, on how the EU can deliver on the Paris Agreement while enhancing the socio-economic benefits of emission reductions and transforming its economy for the 21st century. Hydrogen features strongly in this strategy as one of key enabling technologies (European Commission, 2018a and 2018b). At the end of this brief overview appears evident that today hydrogen and fuel cell is not more a Cinderella in the international debates. This low-carbon solution has made a strong comeback in energy portfolio options and now it is considered as one of possible ‘game changer’. 7. Consideration about Hydrogen and Fuel Cells in the Paris Agreement 1.5°C Perspective Paris Agreement 1.5°C perspective is stated by Article 29 and the first assessment of his global implications was published in October 2018 by IPCC with the Special Report on “Global Warming of 1.5ºC” (SR15). Studies and reports mentioned above developed analyses mainly based on the “2°C” perspective or, in few cases, “below to 2°C” or “well below 2°C” perspectives. The main difference between “below 2°C” and “1.5°C” perspectives are the timelines. In fact, simplifying data,10 according to IPCC SR15 in order to limit global warming to “1.5°C” CO2 emissions need to decline by about 45% by 2030, reaching net zero around 2050. For limiting global warming to “below 2°C” CO2 emissions are projected to decline by about 25% by 2030, and reach net zero around 2070. “Limiting warming to 1.5°C is possible within the laws of chemistry and physics but doing so would require unprecedented changes” (IPCC, 2018a) and, for this reason “the next few years are probably the most important in our history” (IPCC, 2018a). According to “1.5°C” perspective in the next few years it will be necessary to start unprecedented changes and to speed up CO2 emissions reduction. 7.1 What Could Be the Role of Hydrogen and Fuel Cells in this “1.5°C” Perspective? It is possible to find a preliminary answer to this question in two of the above mentioned reports: Hydrogen Council “Hydrogen, Scaling up” and IRENA “Hydrogen from Renewable Power”.
9 For details see footnote n. 5. 10 For details see footnote n. 6.

304
According to Hydrogen Council: “Hydrogen is a central pillar of the energy transformation required to limit global warming to 2°C. Overall, the annual demand for hydrogen could increase tenfold by 2050 to almost 80 exajoule (EJ) meeting 18% of total final energy demand. Deployed at scale, by 2050 hydrogen could reduce annual CO2 emissions by roughly 6 gigatons (Gt) or one-fifth of the abatement required to limit global warming to 2°C. To realize this vision, investors, industry, and government will need to ramp up and coordinate their efforts” (Hydrogen Council, 2017). According to the IRENA: “In the energy transition, hydrogen could be the ‘missing link’ to help supply large amounts of renewable power to sectors that are otherwise difficult to decarbonise through direct electrification, such as transport, industry and current natural gas uses. The technologies are ready. To achieve rapid scale-up, a stable and supportive policy framework would be needed to encourage the appropriate private investments” (IRENA, 2018b). Both answers attribute a relevant role to hydrogen and fuel cell in the energy transition but the magnitudes of these contributions are completely different. The next IRENA figure11 compares these reports and show the dimension of these magnitudes (IRENA, 2018b). So, in order to give a shared answer to this question, other analyses seem to be needed in order to well understand the relevance of hydrogen and fuel cells in the “1.5°C” perspective and to suitably assess all the economic, financial and geopolitical implications.
11 Title: “Potential for hydrogen in total final energy supply, excluding feedstock (all values in EJ)”. According to IRENA: “The Hydrogen Council (2017) study envisages that by 2050, 18 % of global final energy demand could be met by hydrogen, equal to about 78 EJ (of which 19 EJ are feedstock uses). As of 2015, hydrogen demand was 8 EJ, dedicated mostly to feedstock uses in industry. The latest economic assessment by IRENA (2018a) estimates hydrogen’s economic potential at about 8 EJ at the global level by 2050 in addition to feedstock uses (e.g. hydrogen for ammonia). Most of this would be in transport. While the Hydrogen Council roadmap is industry’s consensus vision of hydrogen’s potential in the economy under the right circumstances (e.g. alignment of policies, regulations, codes and standards), it is just one vision of numerous potential outcomes; IRENA’s assessment looks at the mix of renewable options to achieve the targets set out in the Paris Agreement, ranking options by their substitution cost” (IRENA, 2018b).

305
Finally we note that in the above mentioned reports and initiatives, only IPCC SR15 consider the V2G solution,12 and none of these include our working hypothesis “to consider a H2FCPowertrain as power generation plant”. 8. Conclusion At the end of this analysis, hydrogen and fuel cells seem not more a Cinderella in the international debates. This low-carbon solution has made a strong comeback in energy portfolio options and today it is considered as one of possible ‘game changer’. This analysis confirmed, in LCOE terms, the economic advantage “to consider a H2FCPowertrain as power generation plant” and explained related possible long-term effects in power generation, but this option has not been considered in the above mentioned reports and initiatives. According to IPCC SR15 in the next few years it will be necessary to start unprecedented changes and to speed up CO2 emissions reduction. For these reasons next few years are probably the most important in our history. So, other analyses seem to be needed in order to well understand the relevance of hydrogen and fuel cells in “1.5°C” perspective and to suitably assess all the economic, financial an geopolitical implications. Considering that over 70% of global energy investments will be governments-driven , at this point, most important thing to do seem to be to well explain to all involved actors, with peculiar attention to policy-makers, all the advantages to use hydrogen and fuel cells and the possibility to utilize H2FCPowertrain as power generation plant. In this way we hope to accelerate even more the introduction of this breakthrough low-carbon solution and to support this new and feasible path to implement the Paris Agreement pursuing efforts to limit the temperature increase to 1.5°C above pre-industrial levels. References13
Austrian Presidency of the Council of the European Union, 2018a: “Informal meeting of energy ministers dedicated to hydrogen and energy storage solutions” and “The Hydrogen Initiative” <https://www.eu2018.at/latest-news/news/09-18-Informal-meeting-of-energy-ministers.html>;
CFCP (California Fuel Cell Partnership), 2018: “The California Fuel Cell Revolution” < https://cafcp.org/sites/default/files/CAFCR.pdf >;
CCC-UK (The Committee on Climate Change, UK), 2018: “Hydrogen in a low-carbon economy” <https://www.theccc.org.uk/publication/hydrogen-in-a-low-carbon-economy/>;
CSIRO (Commonwealth Scientific and Industrial Research Organisation, Australia), 2018: “National Hydrogen Roadmap”, < https://www.csiro.au/en/Do-business/Futures/Reports/Hydrogen-Roadmap >;
DOE, 2016: “Progress and Accomplishments in Hydrogen and Fuel Cells”, <https://energy.gov/sites/prod/files/2017/01/f34/fcto-progress-accomplishments-april-2016.pdf >;
DOE, 2017: “Hydrogen and Fuel Cells Program Record, Fuel Cell System Cost – 2017” <https://www.hydrogen.energy.gov/pdfs/17007_fuel_cell_system_cost_2017.pdf >;
EIA, 2017a: “Levelized Cost and Levelized Avoided Cost of New Generation Resources in the Annual Energy Outlook 2017”, <https://www.eia.gov/outlooks/archive/aeo17/pdf/electricity_generation.pdf >;
EIA, 2017b: “Assumptions to the Annual Energy Outlook 2017”, <https://www.eia.gov/outlooks/aeo/assumptions/pdf/0554(2017).pdf >;
European Commission, 2018a: Press release 28 November 2018 “The Commission calls for a climate neutral Europe by 2050” <http://europa.eu/rapid/press-release_IP-18-6543_en.htm >;
European Commission, 2018b: “Final Report of the High-Level Panel of the European Decarbonisation Pathways Initiative” <https://ec.europa.eu/info/sites/info/files/rec-18-002-
12 According to paragraph 4.3.3.3 Urban transport and urban planning: “in the context of urban smart grids, in which vehicles form part of the storage capacity (Oldenbroek et al., 2017)”, p.332 (IPCC, 2018c). 13 All links accessed between December 2018 and January 2019.

306
decarbonisation_booklet_27112018_0.pdf>; Hydrogen Council, 2017: “Hydrogen scaling up - A sustainable pathway for the global energy
transition”; <http://hydrogencouncil.com/wp-content/uploads/2017/11/Hydrogen-Scaling-up_Hydrogen-Council_2017.compressed.pdf >;
Hydrogen Council, 2018a: “Hydrogen is firmly on the agenda of the Clean Energy Ministerial and Mission Innovation as Hydrogen Council participates for the first time” <http://hydrogencouncil.com/wp-content/uploads/2018/05/CEM_MI_PressRelease_Hydrogen-Council_24052018.pdf >;
Hydrogen Council, 2018b: “Global Hydrogen Leaders Forum” < http://hydrogencouncil.com/global-hydrogen-leaders-forum/ >;
Hydrogen Council, 2018c: “Hydrogen Meets Digital – New opportunities for the energy and mobility system” <http://hydrogencouncil.com/wp-content/uploads/2018/10/Hydrogen-Council-Hydrogen-Meets-Digital-2018.pdf >;
Hydrogen Council, 2018d: “Frequently Asked Questions - What is the Hydrogen Council?” <http://hydrogencouncil.com/faq/>;
IEA, 2018a: “World Energy Outlook 2018”, <https://www.iea.org/weo2018/>; IEA, 2018b: “World Energy Outlook 2018 - Executive Summary”, <
https://webstore.iea.org/download/summary/190?fileName=English-WEO-2018-ES.pdf >; IEA, Cédric Philibert, 2017: “Producing ammonia and fertilizers: new opportunities from renewable”,
updated version dated “1st October 2017”, <https://www.iea.org/media/news/2017/Fertilizer_manufacturing_Renewables_01102017.pdf >;
IEA Hydrogen Technology Collaboration Program (TCP), Mary-Rose de Valladares, 2017: “Global Trends and Outlook for Hydrogen”, <http://ieahydrogen.org/pdfs/Global-Outlook-and-Trends-for-Hydrogen_WEB.aspx >;
IPCC (Intergovernmental Panel on Climate Change), 2018a: Press release 8 October 2018 “Summary for Policymakers of IPCC Special Report on Global Warming of 1.5ºC approved by governments” <https://www.ipcc.ch/site/assets/uploads/2018/11/pr_181008_P48_spm_en.pdf>;
IPCC, 2018b: “Headline Statements from the Summary for Policymakers” <https://www.ipcc.ch/site/assets/uploads/sites/2/2018/07/sr15_headline_statements.pdf>;
IPCC, 2018c: “Global warming of 1.5°C. An IPCC Special Report on the impacts of global warming of 1.5°C above pre-industrial levels and related global greenhouse gas emission pathways, in the context of strengthening the global response to the threat of climate change, sustainable development, and efforts to eradicate poverty” <http://ipcc.ch/report/sr15/>;
IRENA (International Renewable Energy Agency), 2018a: “Global Energy Transformation: A Roadmap to 2050”, < https://www.irena.org/-/media/Files/IRENA/Agency/Publication/2018/Apr/IRENA_Report_GET_2018.pdf>;
IRENA, 2018b: “Hydrogen from Renewable Power - Technology Outlook for the Energy Transition”, <http://irena.org/-/media/Files/IRENA/Agency/Publication/2018/Sep/IRENA_Hydrogen_from_renewable_power_2018.pdf>;
IRENA, 2018c: “About IRENA”, < https://www.irena.org/aboutirena >; METI (Ministry of Economy, Trade and Industry, Japan), 2018a: “Japan Hosts First Hydrogen Energy
Ministerial Meeting” <http://www.meti.go.jp/english/press/2018/1023_007.html >; METI, 2018b: “Tokyo Statement - Chair’s Summary of Hydrogen Energy Ministerial Meeting”
<http://www.meti.go.jp/press/2018/10/20181023011/20181023011-5.pdf >; Mission Innovation, 2018a: “International ministerial meeting demonstrates role of Mission Innovation
in accelerating clean energy revolution” <http://www.mission-innovation.net/mi-3/>; Mission Innovation, 2018b: “Delivering Mission Innovation Action Plan: 2018-2020” <http://mission-
innovation.net/wp-content/uploads/2018/05/MI3-Action-Plan.pdf>; V. Oldenbroek, et al., 2017: “Fuel cell electric vehicle as a power plant: Fully renewable integrated
transport and energy system design and analysis for smart city areas”, International Journal of Hydrogen Energy, <http://dx.doi.org/10.1016/j.ijhydene.2017.01.155>;
M.V. Romeri, 2010: “Considering Hydrogen Fuel Cells Powertrain as Power Generation Plant”, World Electric Vehicles Symposium EVS 25, Shenzhen, Guangdong, China, World Electric Vehicle Journal Volume 4 (2011). Available at: <http://www.evs24.org/wevajournal/php/download.php?f= vol4/WEVA4-4131.pdf >;
M.V. Romeri, 2011: “Hydrogen Fuel Cell Powertrain Levelized Cost of Electricity”, 30th USAEE/IAEE North American Conference, Washington DC USA, USAEE & IAEE Research Paper Series. Available at SSRN: <https://ssrn.com/abstract=2006758> or <http://dx.doi.org/10.2139/ssrn.2006758>;

307
M.V. Romeri, 2011: “The Hydrogen Fuel Cell Vehicles Powertrain Roles in the Copenhagen Accord and Cancun Agreement Perspective”, 2011 Fuel Cell Seminar & Exposition, Orlando FL USA, ECS The Electrochemical Society, ECS Transaction, Volume 42. Available at ECST: <http://ecst.ecsdl.org/content/42/1/59 > or <http://dx.doi.org/ 10.1149/1.4705480>;
M.V. Romeri, 2012: “Consideration about the Hydrogen Fuel Cell Powertrain LCOE”, 3rd IAEE Asian Conference, Kyoto Japan. Available at IEEJ: <http://eneken.ieej.or.jp/3rd_IAEE_Asia/pdf/paper/025p.pdf >;
M.V. Romeri, 2012: “Considering Hydrogen Fuel Cells Powertrain as Power Generation Plant in the Copenhagen Accord and Cancun Agreements Perspective”, International Battery, Hybrid and Fuel Cell Electric Vehicle Symposium EVS 26, Los Angeles CA USA, “26th Electric Vehicle Symposium 2012” proceedings pp. 1424-1430. Available at Electric Drive Transportation Association (EDTA) <https://electricdrive.org/index.php?ht=d/ReleaseDetails/i/30719/pid/27134> and <http://www.proceedings.com/16245.html>;
M.V. Romeri, 2012: “The Hydrogen Fuel Cell Vehicles Powertrain Possible Roles in the Kyoto Protocol Second Commitment Period Perspective in the Pacific Rim Area”, ECS 222nd Meeting “PRIME 2012 Pacific Rim Meeting on Electrochemical and Solid-State Science”, Honolulu HI USA, ECS Transaction 2013, Volume 50. Available at ECST: <http://ecst.ecsdl.org/content/50/45/75> or <http://dx.doi.org/10.1149/05045.0075ecst >;
M.V. Romeri, 2013: “Hydrogen Fuel Cell Vehicles Powertrain Possible Future Roles in a Global Perspective”, 36th Annual IAEE International Conference, Daegu Korea. Available at: <http://www.iaee2013daegu.org/eng/sub14/sub14_01.asp [link no more active]> and IAEE <http://www.iaee.org/en/publications/proceedingssearch.aspx (Author: Romeri) [password request] >;
M.V. Romeri, 2013: “Consideration About the LCOE of Hydrogen Fuel Cell Powertrain in the Italian Context”, EFC2013 Fifth European Fuel Cell Technology & Applications Conference, Rome, Italy. Presentation available at European Fuel Cell:
<http://www.europeanfuelcell.it/presentations/EFC13_presentations/9C/EFC13135.pdf >; M.V. Romeri, 2014 “Fuel Cell Vehicles are Close to Commercialization and it’s Time to Think
Hydrogen Fuel Cell Powertrain as Power Plant. Consideration about Germany, UK and Italy in EU Context”, 14th IAEE European Energy Conference, Rome Italy. Available at: <http://www.iaee2014europe.it/pages/october30.html [link no more active]> and IAEE <http://www.iaee.org/en/publications/proceedingssearch.aspx (Author: Romeri) [password request] >;
M.V. Romeri, 2014: “Considering Hydrogen Fuel Cell Powertrain as Power Plant in the Three Main Automaker Asian Countries: South Korea, Japan and China”, 4th IAEE Asian Conference, Beijing China, Available at: <http://iaeeasia.csp.escience.cn/dct/page/70056 [link no more active]> and IAEE <http://www.iaee.org/en/publications/proceedingssearch.aspx (Author: Romeri) [password request] >;
M.V. Romeri, 2015: “Hydrogen and Fuel Cell: A Cinderella or a Disruptive Low-Carbon Solution?”, 2015 Fuel Cell Seminar & Energy Exposition, Los Angeles CA, USA, ECS Transaction 2016, Volume 71. Available at ECST: <http://ecst.ecsdl.org/content/71/1/227> or <http://dx.doi.org/10.1149/07101.0227ecst>;
M.V. Romeri, 2017: “Considering Hydrogen Fuel Cells Powertrain as Power Generation Plant – 2017 review” 2nd AIEE Energy Symposium, Rome, Italy, “2nd AIEE Energy Symposium Conference Proceedings” pp. 254-260. Available at: <http://www.aieeconference2017rome.eu/documents/Rome-Proceedings.pdf>. Presentation available at: <http://www.aieeconference2017rome.eu/files/ROMERI.pdf >;
UNFCCC (United Nations Framework Convention on Climate Change), 2015: “Paris Agreement”, <https://unfccc.int/files/meetings/paris_nov_2015/application/pdf/paris_agreement_english_.pdf >;
WEC (World Energy Council) Netherlands, 2018: “Bringing North Sea Energy Ashore Efficiently”, <https://www.worldenergy.org/wp-content/uploads/2018/01/WEC-brochure_Online-offshore.pdf >.

308
VALUING THE IMPACT ON NETWORK RELIABILITY OF RESIDENTIAL BATTERY STORAGE Damian Shaw-Williams, Connie Susilawati, Queensland University of Technology Introduction The relationship of Distribution Network Service Providers (DNSP) and households is changing. As households have shown a willingness to invest in photovoltaics it is impacting operations and the role of Low Voltage (LV) networks with households now able to be self-sufficient for periods of the day. The model of network pricing and management is being challenged as the generation capacity in suburban areas increases. Australian households have lead the world in the adoption of photovoltaics (PV) with over 1.8 million [1] households investing in solar generation. This rise was initiated by subsidy schemes as a part of a policy response to Climate Change, accelerated by rising network, and falling PV unit, costs despite these incentives being subsequently wound back[2]. Further, the steady rise of retail energy costs, with a 63% rise since 2007 [3] primarily due to network spending, have put energy affordability high on the political agenda. Much research has looked at the challenges to network operation and management presented by moving to higher penetrations of PV on distribution networks [4-8]. The increasing availability of batteries for residential storage potentially presents a means of meeting these challenges whilst providing further opportunities for network efficiencies [9]. Reliability, affordability and, less consistently in Australia, the decarbonization of energy systems are the regulatory frameworks applied to energy networks. The criticality of each of these priorities and the importance of energy supply has seen shifts in prioritization by regulators over time as they seek to meet multiple objectives. Networks constitute a fixed asset of over $AUD 22 billion in the state of Queensland [10]; network spending is prioritised through standards of reliability at forecast maximum demand conditions. Reliability is monitored under the Minimum Service Standards (MSS) covering duration and frequency of interruptions of electricity distribution outages. To date economic valuations of the impact of household PV have focussed on relatively narrow views of its impact. This, we believe, is symptomatic of the gap that exists between the perspective of network operators and households with the majority of research focussed at either end of this spectrum. This is something we have sought to address through our previous research in developing a wider view of the impact of households on networks [11, 12], it is the purpose of this paper to develop the reliability measure further. Using as a case study a region of South East Queensland, covered by Energex Ltd. a DNSP with 1.3 million residential customers, we will examine the value of reliability changes resulting from household investment decisions. The focus of this study will be on the duration of outages as measured by System Average Interruption Duration Index (SAIDI) metric and additionally the planning prioritization metric of Value of Customer Reliability (VCR) [13]. Methodology This analysis will be based on a highly granular techno-economic multi-household simulation model [11]. Due to the stochastic nature of temperature, weather and household demand profiles a Monte Carlo based simulation model will be constructed in a series of modules and an economic evaluation undertaken. The economic evaluation will seek to ascribe a value to measures of self-sufficiency afforded by reserved storage as well as the impact on DNSPs reliability measures. This study will evaluate the impact of householder investment in energy infrastructure on the commonly used System Average Interruption Duration Index (SAIDI) metric and value the change in reliability through Loss of Load Probability (LOLP) and Value

309
of Customer Reliability (VCR) [13]. Using postcode level housing data, publicly available from Energex Ltd, as shown in Table 4, the analysis of the test area will be extrapolated, and results analyzed.
Table 4 - Postcode area housing and energy inputs
Postcode 4051
Residential Count 12346
Business Count 804
Mixed Count 8
Residential Energy Consumption (kWh) 58,602,029
Business Energy Consumption (kWh) 72,532,664
Unit Count 4976
Solar PV Count 1840
Source: Energex Ltd. [14] 2.1 System Average Interruption Duration Index (SAIDI) For the purposes of this study we will be considering the impact on the duration of potential outages and how they may be impacted through the adoption of PV & BESS. SAIDI is a widely used metric of network reliability and current figures used for this study are shown in Table 5. The calculation is performed for each feeder type, and exempted of certain events such as severe weather or at police direction, is given by:
SAIDI =
(1)
Table 5 - Energex SAIDI performance (minutes)
CBD feeders Urban feeders Short rural feeders
2013-14 3.56 74.86 232.87
2014-15 3.70 90.81 263.36
2015-16 4.68 76.67 258.09
2016-17 3.84 76.26 520.83
Source: Department of Energy and Water Supply [15]
2.2 Loss of Load Probability
∑ 0 (2) Where SOCend is per period net of load and battery balance.

310
2.3 Value of Customer Reliability The VCR is a value in $ per kWh that customers are deemed to being willing to pay for the reliable supply of electricity in the Australian National Energy Market (NEM). It is a value used by network planners in prioritising capital and maintenance works. The VCR values given in Table 6 were developed through extensive sector surveys with a review to update values conducted in 2014 [13]
Table 6 - Value of Customer Reliability in $AUD 2014
Customer class
Residential Agriculture Commercial Industrial Direct connect
customers
Aggregate NEM value
VCR 25.95 47.67 44.72 44.06 6.05 33.46 Source: AEMO VCR Final Report 2014 p.2
2.4 Modelling Due to the stochastic nature of temperature, weather and household demand profiles a Monte Carlo based simulation model will be constructed in a series of modules and an economic evaluation undertaken. The economic evaluation will seek to ascribe a value to measures of self-sufficiency afforded by reserved storage as well as the impact on DNSP reliability measures. The model will be constructed in MATLAB and consist of weather, price and demand simulation, PV generation and BESS operation and Reliability modules as shown in in Errore. L'origine riferimento non è stata trovata..
Figure 3- Model architecture
2.4.1 PV generation To simulate PV generation a regression analysis of the relationship of level of Total Sky Cover (TSC) to extra-terrestrial irradiation and the resulting Global irradiation for the region was undertaken. This analysis forms the key inputs to simulate multiple scenarios of solar resource based on simulated TSC and a deterministic model of local solar resource and PV generation

311
using estimation formulae provided by Duffie et al.[16] as outlined in more detail in our previous works [11]. 2.4.2 Battery (BESS) operation model The battery operation module will be based on a charging from PV generation only regime based on the manufacturer specifications for the Tesla Powerwall [17].
Figure 4 -. Battery operation process flow.
Where SOC = battery State of Charge, FrGr = grid imports, ToGr = grid exports.

312
Results and discussion Simulations were run for 200 weather and demand scenarios and the results analysed. The changes to test area energy profile are shown Table 7. There are dramatic reductions in energy served and particularly peak period energy. As the total battery capacity increases for an area it will be the charging operations of the batteries that will have the greatest impact on network loading and thus provides the greatest opportunities for management of network loading by network operators in collaboration with households.
Table 7 – Ener gy profile by scenario
Annual Aggregates Baseline 10% 25% 50% PV installed kW - 70.0 185.0 375.0 BESS installed kWh - 189.0 499.5 1,012.5 Max Demand kW 387.9 355.9 304.9 229.4 PV generation MWh - 109.9 290.5 588.9 Peak period energy MWh 613.4 518.6 364.6 110.5 Off Peak period energy MWh 210.7 195.4 168.7 124.1 Peak Energy % 74% 73% 68% 47% Total Energy Served MWh 824.1 714.1 533.3 234.6 Total Energy Serve d % 13% 35% 72%
The two primary determinants of network spending are area maximum demand and reliability standards. As shown in Figure 5 the addition of PV and batteries results in a steady reduction in maximum demand. There are additionally significant network benefits from reducing demand at network peak conditions through potentially deferring network augmentation spending. Our prior research has looked at the issue of deferred network spending in more detail, nevertheless it is important to consider the wider economic benefits that may accrue to networks from private investment in energy infrastructure. It is fundamental to network efficiency that actions that result in costs, or benefits, to the network and should be priced, or incentivised, accordingly.
Figure 5 - Maximum demand by scenario
0
100
200
300
400
500
600
0:30
1:30
2:30
3:30
4:30
5:30
6:30
7:30
8:30
9:30
10:30
11:30
12:30
13:30
14:30
15:30
16:30
17:30
18:30
19:30
20:30
21:30
22:30
23:30
kW
MaxBaseline 10% Scenario 25% Scenario 50% Scenario

313
In order to evaluate the impact on reliability of an area the Energex average duration SAIDI figure for 2016/17 is used to baseline the analysis. Considering only PV and battery installations on fully detached residential houses the impact on the area (including units and businesses) can be considered by penetration level. The household simulations were run and a test for self-sufficiency of households was made i.e. periods where demand could be met from either PV or battery reserves and expressed as the total minutes exposed for the year as shown in Figure 6. Given the standardised kit sizing demand is the primary determinant of exposure. Given the range of household loads simulated 58% have reduced their minutes exposed to an outage to zero.
Figure 6 - Minutes exposed to outage by household
Extrapolating the data to the postcode area under consideration while keeping unit and business data constant the effect of the reliability improvements across all customers is apparent, with reductions in average duration of 10% at the 25% scenario. It should be noted that the current penetration of PV in the area is currently 26.09%, as at May 2018 (again assuming detached houses only), and it is feasible, given the appetite for PV, that there is a similar appetite for batteries as capital costs reduce. The question that we ask is whether the benefits that would accrue to DNSPs in terms of reliability alone sufficient to warrant incentivising the earlier adoption of batteries. As one of the key metrics upon which DNSP reliability is regulated is SAIDI any improvements that arise due to independent customer behaviour warrants the aligning of incentives. Particularly so given that improvements in reliability, under the Service Target Performance Incentive Scheme (STPIS) incentive program for network operators can result in the recovery of additional revenue from customers of up to 5%. It would be ironic indeed if network supporting behaviour by households, albeit undertaken for private economic reasons, should be subsequently punished through higher network charges; an impact that would be felt most keenly by those households unable to undertake the necessary investment in infrastructure to minimise their cost exposure. In terms of the impact on localised SAIDI the test area is extrapolated for postcode 4051 area. Considering only fully detached houses for the area, if those premises currently with PV as at May 2018 (26%) were to install batteries at Tesla Powerwall specifications it would result in a
0
1000
2000
3000
4000
5000
6000
7000
8000
0 20 40 60 80 100 120 140 160
Minutes/year

314
reduction in SAIDI of 14%. This is a significant factor for network operators, and indicative of the potential that action at the householder level can play in strengthening networks.
Table 8 - SAIDI postcode area 4051
0% 10% 25% 50% House 562,044 505,839 421,533 281,022 Unit 379,475 379,475 379,475 379,475 Busine ss 61,314 61,314 61,314 61,314 Total minutes 1,002,832 946,628 862,321 721,810 SAIDI_local 76.21 71.94 65.54 54.86 % reduction 5.6% 14.0% 28.0%
In valuing the impacts on reliability of householder action comparisons are made at each penetration level against the benchmark. The NPV per household of combined PV and batteries is calculated and aggregated for the area. A NPV of 0 means that funding and equity costs are met, and that the investment should proceed. Figure 7 Shows the relationship between household demand (given standardised kit sizing) and NPV results. The degree of self-consumption is the primary driver of value for households; energy arbitrage, given retail pricing conditions and low level of Feed-in-tariffs (FiT), does not contribute significantly compared to the maximising the use of PV generation. Further, given the varying demand levels some households export a significant proportion of their PV generation, an evaluation of the potential to support local area demand is not considered in this research. In more detail 4,400 kWh is the cross over point for profitability for households to undertake the investment in PV and BESS. The increase in value at higher load levels is tempered by the higher utilisation rates of batteries resulting in more replacements as warranty cycle-life conditions are met.

315
Figure 7 - NPV results by demand
The value of the increase in reliability is evaluated through the calculation of Loss of Load Probability is impacted through the ability of batteries to operate as islanded in the case of an outage. The Value of Customer Reliability is applied to the delta with a baseline 10% probability outage rate. The combination of 5 KW PV and 13.5kWh BESS is sufficient to reduce the load at risk to zero for 86 out of the 148 households in the test area.
Table 9 -Value of reliability outcomes
10% 25% 50%Capex $ 245,000 $ 647,500 $ 1,312,500PV+BESS NPV savings $ 2,218 $ 31,163 $ 132,048Value of energy not served (wholesale $) $ 6,738 $ 17,809 $ 36,183% of Base line wholesale energy cost 13.7% 36.1% 73.3%Value of energy not served (Retail $) $ 30,364 $ 54,781 $ 110,642% of Base line retail energy cost 14.1% 25.5% 51.4%LOLP delta 0.0966 0.2518 0.5071VCR of reliability improvement $ 222,437 $ 580,037 $ 1,168,154
Conclusion One of the key obligations of network operators is reliability of the network. The nature of the networks themselves are changing as households are investing in energy infrastructure and becoming prosuming participants in networks. The challenge for network operators is to establish collaborative approaches to unlock the potentially large gains in network capital efficiency, and reliability, that is on offer through moving to a ‘thicker’ more decentralized network. Narrow views on the economic impact of PV and BESS in households have missed a broader perspective that includes the economic impacts on networks. This study shows that reliability improvements can be a significant contributor to the cost benefit analysis of PV and storage incorporation and serves to inform policy regarding moving to higher levels of PV generation and the decarbonization of energy networks. Without a collaborative approach between network operators and prosuming households many opportunities for network efficiencies will be missed. Households following individually determined charging schemes will have positive impacts on network resilience, however, greater capacity will be left on the table by network operators without proactive incentive schemes.
References [1] Australian Energy Regulator, State of the Energy Market 2017, 2017. [2] CSIRO, Modelling the Future Grid Forum scenarios, (2013). [3] ACCC, Retail Electricity Pricing Inquiry, in: A.C.a.C. Commission (Ed.) Australian Competition and
Consumer Commission, Canberra, Australia, 2017. [4] M.J.E. Alam, K.M. Muttaqi, D. Sutanto, Mitigation of Rooftop Solar PV Impacts and Evening Peak
Support by Managing Available Capacity of Distributed Energy Storage Systems, IEEE Transactions on Power Systems 28(4) (2013) 3874-3884.
[5] C.T. Gaunt, E. Namanya, R. Herman, Voltage modelling of LV feeders with dispersed generation: Limits of penetration of randomly connected photovoltaic generation, Electric Power Systems Research 143 (2017) 1-6.

316
[6] K. Ishikawa, H. Taniguchi, H. Suzuki, Y. Ota, Y. Mizuno, Fundamental Study of Voltage Stability in a Power System with Large Penetration of Photovoltaic Generation Considering Induction Motor Dynamics, Electrical Engineering in Japan 193(4) (2015) 25-37.
[7] R. Tonkoski, D. Turcotte, T.H.M. El-Fouly, Impact of High PV Penetration on Voltage Profiles in Residential Neighborhoods, IEEE Transactions on Sustainable Energy 3(3) (2012) 518-527.
[8] R. Yan, T.K. Saha, Investigation of Voltage Stability for Residential Customers Due to High Photovoltaic Penetrations, IEEE Transactions on Power Systems 27(2) (2012) 651-662.
[9] N.-K.C. Nair, N. Garimella, Battery energy storage systems: Assessment for small-scale renewable energy integration, Energy & Buildings 42(11) (2010) 2124-2130.
[10] Energy Queensland Ltd., Energy Queensland Limited Annual Financial Statements 2016/17, Energy Queensland Limited, Brisbane Australia, 2017.
[11] D. Shaw-Williams, C. Susilawati, G. Walker, Value of residential investment in photovoltaics and batteries in networks: A techno-economic analysis, Energies 11(4) (2018) Article number 1022.
[12] D. Shaw-Williams, C. Susilawati, G. Walker, J. Varendorf, Evaluating the potential of retrofitting existing housing stock in decarbonising the energy sector in Australia: a techno-economic analysis. Manuscript submitted for publication, ((2018)).
[13] AEMO, Value of Customer Reliability Review, Australian Energy Market Operator, Melbourne, Australia, 2014.
[14] Energex Ltd, Energy Consumption Data, in: Energex Ltd (Ed.) Brisbane Australia, 2018. [15] Department of Energy and Water Suppy, Performance against minimum service standards (MSS) by
Energex and Ergon Energy for the 2016-17 financial year, in: D.o.E.a.W. Suppy (Ed.) Queensland Government, Brisbane Australia, 2017, p. 2.
[16] J.A. Duffie, W.A. Beckman, Solar engineering of thermal processes, John Wiley & Sons, Hoboken, New Jersey, 2013.
[17] Tesla_Motors, Tesla Motors Powerwall, 2017. http://www.teslamotors.com/powerwall. (Accessed 20 February 2017).

A PROPOSAL FOR ASSESSING THE EFFICIENCY OF WIND POWER SYSTEMS IN EUROPE: A GENERALIZED DIRECTIONAL DISTANCE FUNCTION APPROACH Carla Henriques1,2*, Patrícia Pereira da Silva2,3,4, Nuno Figueiredo2
1Polytechnic Institute of Coimbra - ISCAC, Portugal, 2INESC Coimbra – Portugal 3University of Coimbra, Faculty of Economics, Portugal Abstract We propose a modelling framework which combines the use of panel models with data envelopment analysis (DEA) to assess the efficiency performance of wind power (WP) systems in seventeen European countries. The analysis included both energy and non-energy inputs and outputs as well as separable and non-separable factors. Results indicate that in the period of 2009 to 2016 the only countries where WP systems consistently remain efficient are Denmark, Germany, Spain and Portugal. The countries more frequently classified as non-efficient are France, Greece and Italy. While in the case of France, the overcapacity of WP systems is the main driver of bad performance, in the other countries, the continuous change and adaption of the support schemes might have a significant role on these results. Overall, it can be ascertained that countries which are more often classified as WP efficient adopted feed-in-tariffs (FiT) at an early stage of WP deployment. Finally, it can be concluded that, except for 2012 and 2013, the majority of the countries were operating their WP systems efficiently. KEYWORDS: Wind power systems in Europe, data envelopment analysis, directional distance function approach
1. Introduction
At the end of 2017, the European Union (EU) installed a total WP capacity of 15.6 Gigawatts (GW), remaining the second major contributor for power generation in the EU [1]. WP was responsible for the generation of 336 TWh in 2017, being responsible for about 11.6% of the EU’s electricity demand [1]. It is broadly recognized that Wind power (WP) systems in Europe are an efficient driver for curbing greenhouse gas (GHG) emissions, also providing an important contribution for reducing energy dependency. Presently, the electricity power sector is one of the largest contributors to GHG emissions and the need arises to foster the investment on renewable energy power systems. The 21st Conference of the Parties (COP21) to the United Nations Framework Convention on Climate Change, that took place in December of 2015, in Paris, has resulted on an ambitious climate deal, setting impressive long-term goals that will help limit potential temperature rises (to keep the maximum global average temperature increase as close as possible to 1.5 °C), also providing possible investors with clear hints that high-carbon assets will no longer be viable in the long-run. In fact, this climate deal might be regarded as a landmark that will have inevitable repercussions on the EU Climate and Energy Policy, delivering new prospects for the WP energy industry. Since electricity utilities have to supply electricity to customers, manage the production process efficiently, ensuring profit at the same time, the efficiency performance of electric utilities has been a central topic of research [2]. There is a wide panoply of available methodologies in scientific literature that can be used to cope with the efficiency assessment of electricity utilities. In this context, DEA is a nonparametric1 approach which has been broadly accepted and used with this purpose because
1 Nonparametric models are not restricted to any single functional form, just assuming that certain regularity axioms are verified (e.g., monotonicity and concavity).
317

318
of its flexibility, thus providing help with the identification of possible sources of inefficiency offering managers the chance of studying ways to overcome them. The use of DEA in the assessment of energy and environmental performance has been particularly proficuous since the beginning of 2000. In a review conducted by [3] more than 407 DEA papers related to energy were counted, mainly focusing on the efficiency assessment of electricity, energy efficiency and energy savings. Table 1 provides a brief review of the recent application of DEA models to the electricity sector. Usually, the majority of DEA models therein studied were applied to the overall electricity power generation sector and do not reconcile both energy and non-energy inputs and outputs. Additionally, the only two studies which specifically consider the efficiency assessment in Europe present outdated data. Furthermore, because of the rising role of renewable electricity sources on electricity power generation, the use of the DEA approach should explicitly address the efficiency measurement of renewable electricity power generation. Finally, since WP systems are currently thriving in the EU, becoming one of the most important electricity power generators, the evaluation of their efficiency should be a major concern [4]. In this framework the novelty of our proposal is twofold: 1) it suggests the use of the generalized directional distance function approach to obtain the comprehensive efficiency assessment of WP systems in 17 EU countries; 2) it couples both energy and non-energy inputs and outputs. In the next section, the DEA methodology which will be followed to appraise WP systems in Europe is described. In Section 3, the main assumptions regarding data collection are stated. Section 4 presents a discussion of the main results obtained. Finally, in Section 5 the main conclusions are presented followed by the suggestion of future work developments. 2. The methodological approach In the next sections, a brief description of the non-oriented DEA model that will be used is provided and the methodology followed to select the inputs and outputs that will be subsequently used to instantiate the DEA model is described. 2.1. The generalized directional distance function approach In order to obtain a generalized measure of technical inefficiency which considers all slacks in input and output constraints, [21] suggested the directional slacks-based inefficiency (SBI) measure through the inclusion of the directional distance function technology into the Slacks-Based Measure (SBM) [22] modelling formulation. This measure allows obtaining the same information provided by the SBM model as long as the directional vectors for inputs and outputs are considered to be equal to the corresponding input and output vectors. More recently, [23] also suggested a generalization of the SBM measure based on the directional distance function, where the optimization problem is based on the sum of the directional distance function being able to express how much inputs have excessively been used and how much shortage of outputs have been produced regarding their efficiency level. The directional distance function aiming to increase the outputs and decrease the inputs directionally can be defined as:

Table 1. DEA models applied to the electricity sector
Brief description Region/Country Inputs Outputs Model Reference Proposes the use of two different approaches applied to assess the efficiency of 24 power plants in a European country. 1) measures technical efficiency (as the relation of the desirable outputs to the inputs) and measures ecological efficiency (as the relation of the desirable outputs to the undesirable outputs) separately. 2) treats pollutants as the inputs in the sense that the aim is to increase desirable outputs and decrease pollutants and inputs. .
24 power plants in an European country
Total costs. Electricity generation; Dust; NOx and SO2 emissions.
Charnes, Cooper and Rhodes (CCR) model.
[5]
Assesses the environmental efficiency of the electricity power industry of the United States (USA)
USA (1990 - 2006).
CO2 emissions; Electricity and Losses.
Fossil fuel utilization. CCR and an environmental index.
[6]
Suggests a DEA approach to appraise the overall efficiency of US electric utilities in the presence of both desirable and undesirable outputs.
USA (1996 - 2000).
Power capacity and Fuel consumption.
Non fossil power generation; Fossil power generation; NOx and SO2 emissions.
Hybrid Slack Based Measure (SBM).
[7]
Proposes the application of a DEA model to assess the unified (operational and environmental) efficiency of Japanese fossil fuel power generation firms.
Japan (2005-2008).
Power capacity and number of employees. Electricity generation and CO2 emissions.
Range-Adjusted Measure (RAM);
[8]
Appraises the eco-efficiency regarding electricity generation and grid corporations
China (2002-2009).
Capital; Equipment; Fuel consumption; Labor; Auxiliary power and on-grid electricity.
Electricity generation and Consumed electricity.
A two-stage environmental network DEA model.
[9]
Assess energy and CO2 emission performance of electricity generation from over one hundred countries.
126 OECD and non-OECD countries (2005).
Fuel consumption. Electricity generation; CO2 emissions.
A non-radial direction distance function (DDF).
[10]
Suggests a new use of the Malmquist index to measure a frontier shift among different periods.
OECD (1999–2009). Installed capacity of fuel, nuclear, hydro and other renewables.
Electricity generation and CO2 emissions.
Malmquist Index [11]
Measures the environmental efficiency of the electricity power industry
16 cities in the region of Yangtze River Delta (2000 -2010)
Installed capacity and coal consumption.
Power output; SO2 emissions; Soot emissions; Waste water emissions; Solid waste emissions
DDF considering constant and variable returns to scale.
[12]
Studies the relationship between fossil fuel consumption and the environmental regulation of
China (2007-2009).
Installed capacity; Labor; total coal and gas Power generated; SO2 and NOx emissions; and
SBM. [13]
319

320
Brief description Region/Country Inputs Outputs Model Reference China's thermal power generation. soot emissions.
Performs the energy efficiency analysis of Korean power companies
Korea (2007-2011).
Capital; Labor and Energy consumption
Total turnover and GHG emissions.
SBM. [14]
Assesses efficiency analysis of electricity and heat generation.
25 EU member states (2000-2007).
Primary Energy; Installed capacity; Labor.
Electricity and Derived Heat; CO2 emissions; and Radioactivity.
DDF; SBM. [15]
Introduces a method to overcome the infeasibility problem of mixed periods.
Iran (2003 - 2010) Installed capacity and Fuel consumption.
Electricity generation; SO2, NOx and COx emissions; Operational availability; Deviation from generation plan.
An SBM and Malmquist-Luenberger index in the presence of undesirable outputs.
[16]
Assesses the eco-efficiency change of thermal power plants (Steam, Gas and Combined Cycle) in Iran.
Iran (2003-2010) Installed capacity; Fuel consumption.
Electricity generation; SO2, NOx and COx emissions; Operational availability; Deviation from generation plan.
An SBM and Malmquist-Luenberger index in the presence of undesirable outputs.
[17]
Analyses the environmental performance and provides the benchmarks for the thermal power firms in China
30 thermal power firms in China (2010)
Production time; Coal consumption. Total industrial output value; Solid waste
An integrated Enhanced Russell measure model
[18]
Assesses the environmental performance of the electricity mix of 27 European economies.
27 top European economies
Acidification potential; Climate change; Eutrophication potential; Freshwater aquatic eco-toxicity; Freshwater sediment eco-toxicity; Human toxicity; Ionising radiation; Land use; Malodorous air; Marine aquatic eco-toxicity; Marine sediment; Photochemical oxidation; Resources antimony; Stratospheric ozone; Terrestrial eco-toxicity.
Production of 1 kW. CCR. [19]
Assesses the environmental efficiency of the electricity sector in the USA.
USA (2001, 2002 and 2003).
Total energy transmission and Total operating costs.
Utilization of net capacity; CO2 , SO2 and NOx emissions.
CCR, BBC and SBM. [20]

: , ∈ where the non-zero vector , establishes the “directions” in which inputs and outputs are scaled, and the technology reference set satisfies the assumptions
, : canproduce of constant returns to scale (CRS), with strong disposability of inputs and outputs [24]. Given two vectors , … , and , … , , the DEA piecewise reference technology can be obtained as:
, :∑ , r = 1,…, s, ∑ , i = 1,…, m,
0, 1,… , }, (1) In what regards the reference technology T considered in (1), traditionally, for each DMU under assessment, DMUo, the directional distance function can be obtained by solving the following LP problem1: max s.t. ∑ , r = 1,…, s, ∑ , i = 1,…, m,
0 (j) (2) where measures simultaneously the maximum enlargement of outputs and reduction of inputs that remain technically feasible and can serve as a measure of technical inefficiency. If 0, then DMUo operates on the frontier of T with technical efficiency. If 0, then DMUo operates inside the frontier of T and it is inefficient. Finally, the parameter indicates the level by which DMUo has to reduce its i-th input to become efficient. Analogously, the parameter provides information on the level by which DMUo has to enlarge its r-th output in order to become efficient. If , = ( , ), i.e., the direction is set to account for the observed data, corresponds to the potential proportional variation in outputs and inputs. Nevertheless, this approach does not account for inefficiencies associated with non-zero slacks and it eventually has the problem of miss specifying some evaluated DMUs as efficient units [24]. The efficiency measurement obtained in (2) expands all desirable outputs and undesirable inputs and contracts all desirable inputs and undesirable outputs by the same rate, . Nevertheless, there is no guarantee that the proportional contraction rate for desirable input/output factors and expansion rate for undesirable input/output factors must be equal. Therefore, by considering the Weighted Russell Directional Distance Model (WRDDM) suggested by [24], the formulation of (2) can be generalized and adapted to individual expansion and contraction scales as follows: max ∑ ∑ )
s.t. ∑ , r ,
∑ , i , ∑ = 1, 0 (j), (3) where r and i are the indexes that designate the outputs and inputs, respectively; the vectors of inputs and outputs of DMUo are given as and , is the individual inefficiency measure for each output and is the individual inefficiency measure for each input and all variables are nonnegative except for . The coefficients and may be regarded as the given priorities associated with the outputs and inputs, and their sum should be one. On the other
1 According to [42] under the weakly disposable technology assumption the evaluation of efficiency in terms of VRS technology, goes beyond the imposition of the additional constraint ∑ = 1 in (23).
321

322
hand, the inefficiencies of each corresponding output and input are also specified to allow assigning different priorities to each of it and their sums are also assumed to be one, i.e.: ∑ = 1 and ∑ = 1. In this case, it is necessary that the directional vectors are measured according to the same measurement units as the original vectors of inputs and outputs in order to add and . Finally, quite often, it might happen that an output is strongly connected (i.e. non-separable) to a specific input. In this case, the non-separable outputs/inputs need a specific treatment. Since if the direction vectors are considered equal to the observed inputs and outputs, the directional distance function is identical to a radial model, problem (3) can thus be slightly modified to: max ∑ ∑ +
s.t. ∑ , r O
∑ , i , ∑ , r O,
∑ , i , ∑ = 1, 0 (j), (4) where all SO/SI and NSO/NSI are the indexes that designate the presence of separable and non-separable outputs/inputs, respectively; the vectors of non-separable inputs and outputs of DMUo are given as and , correspondingly. The coefficient may be regarded as the given priorities associated with non-separable factors. In order to rank the efficient DMUs, the following super-efficiency model should be solved [25]: max ∑ ∑ +
s.t. ∑ , r O,
∑ , i , ∑ , r O,
∑ , i , ∑ = 1, 0 (j), (5) Finally, the reference set of the inefficient DMUo is obtained by solving the following LP problem, considering that ∗ , ∗ and ∗ are obtained in the optimal solution to (4): max∑ ∑ , r O O and i I I s.t. ∑ ∗ , r O,
∑ ∗ , i, i ,
∑ ∗ , r O,
∑ ∗ , i , ∑ = 1, 0 (j),
0 (∀ ), 0 ∀ , (6) Let ( ∗, ∗,∗ , ∗, ∗, ∗) be the optimal solution to (6). Consider the reference set of the inefficient DMUo as follows: Eo ={ j: ∗ 0, j=1, …, n}. The point of the efficient frontier which can be viewed as a target DMU for the WRDDM -inefficient DMUo is given by: ( , ) = (∑ ∗ , ∑ ∗ .

323
2.2. Selection of inputs and outputs One of DEA’s drawbacks is that it does not provide a means to select the inputs and outputs that should be considered for the assessment of each DMU. However, the efficiency score attained for each DMU is highly dependent on this selection procedure [26]. In this case, if the number of inputs and outputs is considerably big, the dimensionality of the production space will increase and proportionally the discriminatory power of DEA will decrease [27]. Hence, one of the greatest challenges in a DEA model formulation is the identification of the truly significant input and output variables. Although the available literature on the selection of these particular inputs and outputs is not prolific, there are several approaches that can be used to deal with this particular problem [26]. In our case, since we wanted to combine energy and non-energy input and output factors in our assessment, we have started our analysis by selecting two non-energy inputs and outputs considered in [14], i.e. labour (as input) and turnover (as output). Additionally, according to the contributions of previous research [4] plant capacity should be regarded in terms of inputs, and the actual amount of produced electricity in terms of output. This led to the choice of both energy and non-energy inputs, i.e. the total WP generation capacity (in megawatts: MW) and the number of employees (in number of persons). In the case of energy outputs, the net WP electricity generation (in thousand tonnes of oil equivalent: 103 toe) has been considered, while for the non-energy outputs the turnover (in million Euros: M€) was used. 3. Data Data on installed capacity and electricity generation were obtained, respectively, from the BP statistical review of world energy 2018 [29] and the energy balances made available from Eurostat [30] – Figures 1 and 2. The number of employees and the turnover obtainable in the WP industry were gathered from EurObserv'ER [31] – Figures 3 and 4. Finally, according to data availability, only 17 countries (and thus 17 DMUs) were considered in our assessment which was carried out across the period of 2009 to 20162. Table 2 provides information on the descriptive statistics regarding the inputs and outputs considered.
Source: BP statistical review
Figure -. WP Installed capacity in 17 EU countries (MW)
2 For the year 2014 data were not available regarding the number of employees and turnover; therefore, for the sake of consistency this year was omitted from our assessment.
0
10,000
20,000
30,000
40,000
50,000
60,000
2009 2010 2011 2012 2013 2015 2016

324
Source: Eurostat
Figure 2- WP generation in 17 EU countries (103 toe)
Source: EurObserv'ER
Figure 3- Employment (number of persons)
0
1,000
2,000
3,000
4,000
5,000
6,000
7,000
8,000
2009 2010 2011 2012 2013 2015 2016
020,00040,00060,00080,000
100,000120,000140,000160,000180,000
2009 2010 2011 2012 2013 2015 2016

325
Source: EurObserv'ER
Figure 4 -Turnover (M€)
Table 2 - Descriptive statistics of the inputs and outputs (2009-2016)
Capacity Employment
Maximum Minimum Average Maximum Minimum Average
2009 25,732 117 4,409 102,100 100 14,159
2010 26,903 169 4,876 96,100 1,500 14,681
2011 28,712 178 5,436 101,100 1,600 15,724
2012 30,979 268 6,167 121,800 500 17,253
2013 33,477 428 6,780 137,800 250 17,703
2015 44,541 660 8,207 155,200 500 18,118
2016 49,534 660 8,905 121,700 600 17,794
Power Generation Turnover
Maximum Minimum Maximum Minimum Maximum Minimum
2009 3,323 1 3,323 1 3,323 1
2010 3,807 25 3,807 25 3,807 25
2011 4,203 41 4,203 41 4,203 41
2012 4,357 43 4,357 43 4,357 43
2013 4,785 67 4,785 67 4,785 67
2015 6,811 125 6,811 125 6,811 125
2016 6,758 123 6,758 123 6,758 123
Source: Author’s own calculations
0
5,000
10,000
15,000
20,000
25,000
2009 2010 2011 2012 2013 2015 2016

326
4. Discussion of results The study involved applying models (4) and (5) to the 17 DMUs under evaluation. Table 3 depicts the overall efficiency scores (1 ) (obtained with the super-efficiency model) throughout the period of 2009 to 2016. Based on the results obtained it can be concluded that, except for 2012 and 2013 (the period particularly impacted by the economic crisis), the majority of countries were operating their WP systems efficiently (59% in average). The countries which are always classified as efficient in the time horizon herein analysed are Denmark (4nd and 3rd place in 2009 and 2016, respectively), Portugal (8th place in both years), Germany (went from the 7th place in 2009 to the 2nd place in 2016) and Spain (went from the 5th place in 2009 to the 4th place in 2016). The input and output characteristics of these countries are highlighted in Figures 1 to 4. Denmark’s geographical characteristics led this country to reach substantial shares of wind energy contribution in its electricity demand from 2009 to 2016 (the largest share of the EU, achieving 44% in 2016 [32]). In addition, due to propitiate weather conditions of Danish wind farm locations, but also because of low variable and fixed costs, Danish operators have low operation and maintenance costs when compared with other countries’ operators [33]. These facts might help explain why out of these four countries Denmark is the one more often selected as a benchmark (7 and 12 times in 2009 and 2016, respectively). In the case of Portugal, the good efficiency scores obtained might be related to the early adoption of a FiT mechanism in this country. Moreover, Portuguese WP operators are mainly owned by multinational companies and major economic groups [34]. Germany and Spain are two major players of WP systems in the EU with contrasting characteristics. While in Germany wind farms are usually controlled by small operators with limited assets, in Spain the majority of wind turbines are mainly owned by large operators. Regarding the Bulgarian WP systems, they became efficient as of 2010. Since May 2012, the connection to the grid of renewable plants with a preliminary grid connection contract was postponed to 2016. Because of that, no additional installed capacity was obtained since 2014 (see Figure 1). Furthermore, as of mid-March 2014, the distribution system companies had to limit the maximum power generation of all WP and photovoltaic plants by 60% [35]. Therefore, efficiency of WP systems might be related to the fact that between 2015 and 2016 the power generation level had an increase, and that, in spite of the reduction of WP’s turnover, this country occupied the last position in terms of employees assigned to this activity sector. When considering the case of Belgium, the WP systems attain the efficiency status only in 2015 and 2016. In Belgium the power plant developer assumes the costs of the grid connection to the onshore substation, although these costs are partially subsidized by 33% of the investment up to a maximum of 25 M€ [35]. Furthermore, the subsidy encompasses five years (by providing 20% each year). The fact that Belgium occupies the 15th position among the countries responsible for job creation in WP in 2016 might be regarded as the main driver of efficiency – see Figure 3. In Austria there was a sound implementation of WP systems in the early 2000s due to an encouraging regulatory framework [36]. However, in 2006 there was a downturn that slowed down the progress of new installations. However, this setting had a shift with the amendment introduced in 2010 by offering adapted tariffs and extending the payment period. The changes operated on the regulatory framework might help explain the WP systems efficiency in 2010 and 2011. Additionally, the drastic reduction of the number of employees from 2015 to 2016 from 3,000 to 1,700 might be one of the main reasons that help explain the efficiency status of this country in 2016. In Sweden, analogously to other countries, the favorable results in terms of implementation obtained during the 2000s decade were hampered with several regulatory downturns (e.g.

327
eliminating FiT for new projects) adopted in 2012 [36]. This might help explain why efficiency was only obtained in the two last years of the period of analysis. Additionally, the huge increase of the installed capacity that took place in 2014 (1,050 MW) had its full impacts on the following years. In the early stages of WP deployment, Poland, like Italy, Romania and the UK, adopted quota systems, providing a support level which clearly exceeded the average generation cost, resulting in a higher burden for end-consumers. Therefore, it is not surprising that WP systems in Poland were efficient from 2011 to 2013. However, on the 20th of February of 2015 the Polish parliament enacted the Act on Renewable Energy Sources (RES), which was afterwards amended. From then on, the WP industry in Poland underwent a huge crisis, because of the oversupply of green certificates, which was aggravated with the adoption of the Wind Farm Act on the 20th of May of 2016, hindering the possibility of future deployment of WP systems based on more efficient wind turbines, also substantially increasing the property taxes of wind turbines. In 2016, eight countries should perform several adjustments on their inputs and outputs in order to become efficient regarding their peers – Figures 5 to 8. Regarding France which occupies the 11th place of the ranking, results suggest that the French WP sector seems to be over dimensioned. In order to become efficient, its WP installed capacity should be cut from 11,670 MW to 9,451 MW (19%) and WP’s turnover should increase from 2,790 M€ to 3,038 M€ (9%). The French benchmark countries are Denmark (=0.46), Spain (=0.21) and Sweden (=0.33). From the results obtained, it seems that France is not benefitting from its WP installed capacity level in 2016 (the same conclusion is drawn for the entire time horizon). These results are mainly explained by the huge increase of WP generation capacity from 2009 to 2016 (985 MW in average per year). Finland which is the 10th country of the ranking in terms of efficiency, is well dimensioned in terms of installed capacity, but it has to increase power generation from 264 to 300 TOE (14%) and improve WP’s turnover from 520 to 569 M€ (9%) compared to its peers (Denmark (=0.10), Bulgaria (=0.66) and Belgium (=0.24)). The fact that both 2015 and 2016 were record years in terms of new WP installed capacity (370 MW and 570 MW, respectively) in this country, might help explain these outcomes. In the case of Greece, which assumes the 15th place of the ranking, a mild increase of power generation from 443 to 468 TOE (6%) should be attained. However, the critical factor that influence the bad performance of WP systems in this country is the lack of turnover, that requires an improvement from 300 M€ to 674 M€ (125%). The benchmark countries for WP systems in Greece are Belgium (=0.81), Bulgaria (=0.12) and Denmark (=0.07). Greece’s efficiency classification is not entirely surprising, because of the financial crisis that caused many wind farm project delays over the last years [37]. Furthermore, in 2012, a levy was also enforced on the gross income of all operating renewable energy projects [35], substantially reducing the turnover in this sector. The Irish WP system occupies the 14th place of the ranking. In this country a slight increase of power generation is required (from 529 to 559 TOE, i.e. 6%). However, the indicator that places the major burden on WP’s efficiency is the recovery of WP’s turnover from 440 M€ to 780 M€ (77%). Ireland’s benchmark countries are Belgium (=0.88), Denmark (=0.07) and Sweden (=0.05). In Italy, the only factors that do not require any adjustments in order to become efficient are the number of employees and WP generation. Nonetheless, the Italian WP sector is over dimensioned, requiring a reduction of installed capacity from 9,257 MW to 7,701 MW (17%). A substantial increase of turnover from 950 M€ to 1,157 € (22%) is also a prerequisite. In 2015, the imminent end of the FiT scheme speeded the timeline of numerous projects in order to obtain funding while it was still possible [38]. Since the cash flows are usually lower in the starting year of investments, the rapid increase of WP installed capacity in 2015 might help

328
explain the negative impact on turnover in 2016. In addition, the previous years of 2009-2013 were also marked by a persistent recession caused by fiscal austerity and stringent credit requirements [39], eventually influencing the turnover achieved in the WP sector in that period. In 2016, Italy’s peers were Denmark (=0.01), Spain (=0.07) and Sweden (=0.92). In Austria there was a sound implementation of WP systems in the early 2000s due to an encouraging regulatory framework [36]. However, in 2006 there was a downturn that slowed down the progress of new installations. However, this setting had a shift with the amendment introduced in 2010 by offering adapted tariffs and extending the payment period. The changes operated on the regulatory framework might help explain the WP systems efficiency in 2010 and 2011. Additionally, the drastic reduction of the number of employees from 2015 to 2016 from 3,000 to 1,700 might be one of the main reasons that help explain the efficiency status of this country in 2016. In Sweden, analogously to other countries, the favorable results in terms of implementation obtained during the 2000s decade were hampered with several regulatory downturns (e.g. eliminating FiT for new projects) adopted in 2012 [36]. This might help explain why efficiency was only obtained in the two last years of the period of analysis. Additionally, the huge increase of the installed capacity that took place in 2014 (1,050 MW) had its full impacts on the following years. In the early stages of WP deployment, Poland, like Italy, Romania and the UK, adopted quota systems, providing a support level which clearly exceeded the average generation cost, resulting in a higher burden for end-consumers. Therefore, it is not surprising that WP systems in Poland were efficient from 2011 to 2013. However, on the 20th of February of 2015 the Polish parliament enacted the Act on Renewable Energy Sources (RES), which was afterwards amended. From then on, the WP industry in Poland underwent a huge crisis, because of the oversupply of green certificates, which was aggravated with the adoption of the Wind Farm Act on the 20th of May of 2016, hindering the possibility of future deployment of WP systems based on more efficient wind turbines, also substantially increasing the property taxes of wind turbines. In 2016, eight countries should perform several adjustments on their inputs and outputs in order to become efficient regarding their peers – Figures 5 to 8. Regarding France which occupies the 11th place of the ranking, results suggest that the French WP sector seems to be over dimensioned. In order to become efficient, its WP installed capacity should be cut from 11,670 MW to 9,451 MW (19%) and WP’s turnover should increase from 2,790 M€ to 3,038 M€ (9%). The French benchmark countries are Denmark (=0.46), Spain (=0.21) and Sweden (=0.33). From the results obtained, it seems that France is not benefitting from its WP installed capacity level in 2016 (the same conclusion is drawn for the entire time horizon). These results are mainly explained by the huge increase of WP generation capacity from 2009 to 2016 (985 MW in average per year). Finland which is the 10th country of the ranking in terms of efficiency, is well dimensioned in terms of installed capacity, but it has to increase power generation from 264 to 300 TOE (14%) and improve WP’s turnover from 520 to 569 M€ (9%) compared to its peers (Denmark (=0.10), Bulgaria (=0.66) and Belgium (=0.24)). The fact that both 2015 and 2016 were record years in terms of new WP installed capacity (370 MW and 570 MW, respectively) in this country, might help explain these outcomes. In the case of Greece, which assumes the 15th place of the ranking, a mild increase of power generation from 443 to 468 TOE (6%) should be attained. However, the critical factor that influence the bad performance of WP systems in this country is the lack of turnover, that requires an improvement from 300 M€ to 674 M€ (125%). The benchmark countries for WP systems in Greece are Belgium (=0.81), Bulgaria (=0.12) and Denmark (=0.07). Greece’s efficiency classification is not entirely surprising, because of the financial crisis that caused many wind farm project delays over the last years [37].

Table 3 - Overall efficiency scores per year
2009 2010 2011 2012 2013 2015 2016
DMU Nº of times
as Ref.
Efficiency Score
Rank Nº of times
as Ref.
Efficiency Score
Rank Nº of times
as Ref.
Efficiency Score
Rank Nº of times
as Ref.
Efficiency Score
Rank Nº of times
as Ref.
Efficiency Score
Rank Nº of times
as Ref.
Efficiency Score
Rank Nº of times
as Ref.
Efficiency Score
Rank
AT 0 0.05 13 2 1.00 11 2 1.01 11 0 0.68 13 0 0.68 13 0 0.86 12 1 1.01 8 BE 0 -0.61 16 0 0.54 16 0 0.48 17 0 0.82 12 0 0.86 11 7 1.03 7 6 1.03 6 BG 0 -0.89 17 1 1.01 10 2 1.10 5 7 1.24 2 8 2.25 1 6 2.12 1 7 2.20 1 DK 7 1.19 4 7 1.14 5 12 1.13 3 12 1.21 3 11 1.19 2 8 1.19 3 12 1.13 3 FI 9 1.46 2 3 1.54 1 3 1.66 1 2 1.35 1 1 1.19 2 0 0.99 10 0 0.94 10 FR 0 0.39 11 0 0.70 12 0 0.49 16 0 0.48 15 0 0.40 14 0 0.93 11 0 0.93 11 DE 1 1.06 7 1 1.05 8 2 1.07 7 2 1.04 6 1 1.14 6 2 1.31 2 1 1.30 2 GR 0 -0.25 14 5 1.08 6 0 0.75 13 0 0.53 14 0 0.31 15 0 0.64 15 0 0.67 15 IE 4 1.03 9 0 0.69 13 4 1.06 8 0 0.28 16 0 0.30 16 3 1.00 8 0 0.79 14 IT 0 0.14 12 0 0.67 14 0 0.58 15 0 -0.23 17 0 -0.93 17 0 0.82 14 0 0.90 12 NL 6 1.23 3 2 1.02 9 2 1.03 9 0 0.87 10 0 0.89 9 0 0.86 12 0 0.84 13 PL 0 -0.53 15 0 0.30 17 6 1.20 2 6 1.01 8 9 1.10 7 0 0.52 16 0 0.57 16 PT 2 1.04 8 4 1.07 7 1 1.02 10 11 1.17 4 11 1.15 5 1 1.00 8 2 1.01 8 RO 2 3.65 1 6 1.39 2 1 1.00 12 1 1.02 7 0 0.88 10 0 0.43 17 0 0.43 17 SP 2 1.11 5 3 1.15 3 4 1.13 3 5 1.15 5 4 1.17 4 4 1.10 5 4 1.11 4 SE 0 0.81 10 0 0.57 15 0 0.75 13 0 0.87 10 0 0.83 12 8 1.12 4 9 1.10 5 UK 9 1.09 6 8 1.15 3 7 1.08 6 0 0.89 9 1 1.05 8 5 1.05 6 2 1.03 6
329

Furthermore, in 2012, a levy was also enforced on the gross income of all operating renewable energy projects [35], substantially reducing the turnover in this sector. The Irish WP system occupies the 14th place of the ranking. In this country a slight increase of power generation is required (from 529 to 559 TOE, i.e. 6%). However, the indicator that places the major burden on WP’s efficiency is the recovery of WP’s turnover from 440 M€ to 780 M€ (77%). Ireland’s benchmark countries are Belgium (=0.88), Denmark (=0.07) and Sweden (=0.05). In Italy, the only factors that do not require any adjustments in order to become efficient are the number of employees and WP generation. Nonetheless, the Italian WP sector is over dimensioned, requiring a reduction of installed capacity from 9,257 MW to 7,701 MW (17%). A substantial increase of turnover from 950 M€ to 1,157 € (22%) is also a prerequisite. In 2015, the imminent end of the FiT scheme speeded the timeline of numerous projects in order to obtain funding while it was still possible [38]. Since the cash flows are usually lower in the starting year of investments, the rapid increase of WP installed capacity in 2015 might help explain the negative impact on turnover in 2016. In addition, the previous years of 2009-2013 were also marked by a persistent recession caused by fiscal austerity and stringent credit requirements [39], eventually influencing the turnover achieved in the WP sector in that period. In 2016, Italy’s peers were Denmark (=0.01), Spain (=0.07) and Sweden (=0.92).
Figure 5- Real installed capacity vs projection of non-efficient countries
0
2,000
4,000
6,000
8,000
10,000
12,000
14,000
0
2,000
4,000
6,000
8,000
10,000
12,000
14,000
Proj
ectio
ns
Inst
alle
d ca
paci
ty
2009 2010 2011 2012 2013 2015 2016
2009 2010 2011 2012 2013 2015 2016
330

331
Figure 6 - Real employment vs projection of non-efficient countries
Figure 7 - Real power generation vs projection of non-efficient countries
05,00010,00015,00020,00025,00030,00035,00040,00045,000
05,000
10,00015,00020,00025,00030,00035,00040,00045,000
Proj
ectio
ns
Empl
oyee
s
2009 2010 2011 2012 2013 2015 2016
2009 2010 2011 2012 2013 2015 2016
02004006008001,0001,2001,4001,6001,8002,000
0200400600800
1,0001,2001,4001,6001,8002,000
Proj
ectio
ns
Pow
er G
ener
atio
n
2009 2010 2011 2012 2013 2015 2016
2009 2010 2011 2012 2013 2015 2016
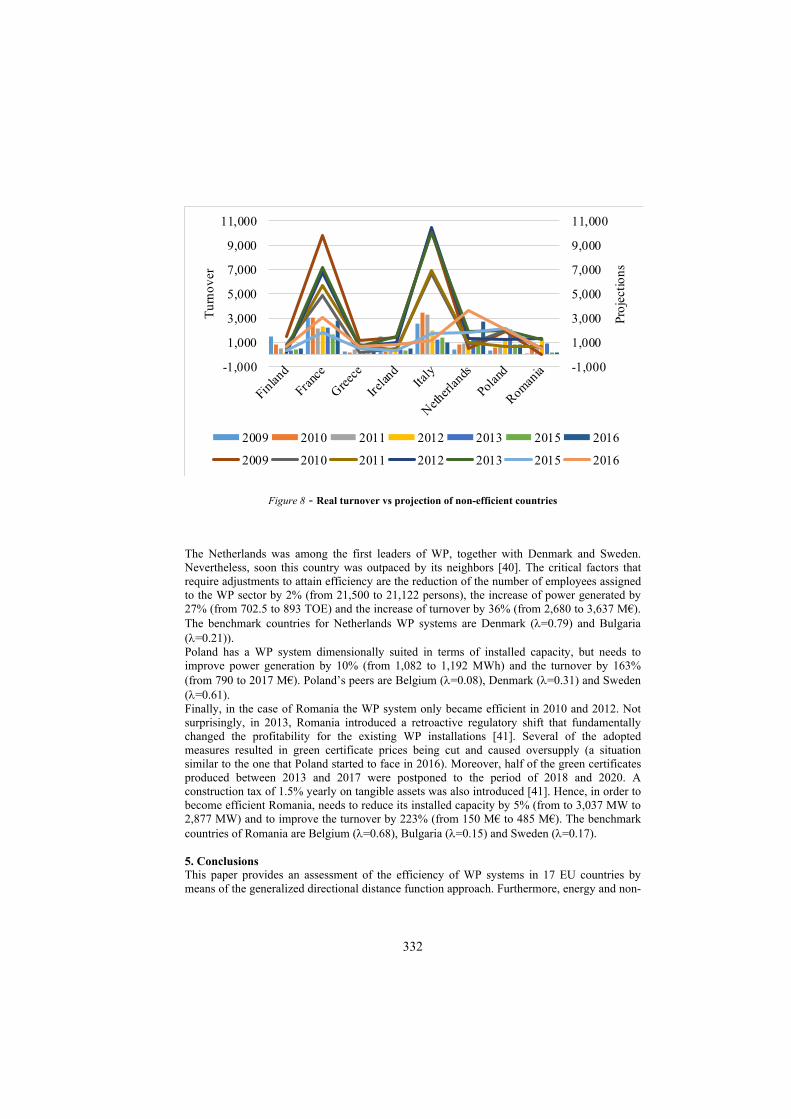
332
Figure 8 - Real turnover vs projection of non-efficient countries
The Netherlands was among the first leaders of WP, together with Denmark and Sweden. Nevertheless, soon this country was outpaced by its neighbors [40]. The critical factors that require adjustments to attain efficiency are the reduction of the number of employees assigned to the WP sector by 2% (from 21,500 to 21,122 persons), the increase of power generated by 27% (from 702.5 to 893 TOE) and the increase of turnover by 36% (from 2,680 to 3,637 M€). The benchmark countries for Netherlands WP systems are Denmark (=0.79) and Bulgaria (=0.21)). Poland has a WP system dimensionally suited in terms of installed capacity, but needs to improve power generation by 10% (from 1,082 to 1,192 MWh) and the turnover by 163% (from 790 to 2017 M€). Poland’s peers are Belgium (=0.08), Denmark (=0.31) and Sweden (=0.61). Finally, in the case of Romania the WP system only became efficient in 2010 and 2012. Not surprisingly, in 2013, Romania introduced a retroactive regulatory shift that fundamentally changed the profitability for the existing WP installations [41]. Several of the adopted measures resulted in green certificate prices being cut and caused oversupply (a situation similar to the one that Poland started to face in 2016). Moreover, half of the green certificates produced between 2013 and 2017 were postponed to the period of 2018 and 2020. A construction tax of 1.5% yearly on tangible assets was also introduced [41]. Hence, in order to become efficient Romania, needs to reduce its installed capacity by 5% (from to 3,037 MW to 2,877 MW) and to improve the turnover by 223% (from 150 M€ to 485 M€). The benchmark countries of Romania are Belgium (=0.68), Bulgaria (=0.15) and Sweden (=0.17). 5. Conclusions This paper provides an assessment of the efficiency of WP systems in 17 EU countries by means of the generalized directional distance function approach. Furthermore, energy and non-
-1,000
1,000
3,000
5,000
7,000
9,000
11,000
-1,000
1,000
3,000
5,000
7,000
9,000
11,000
Proj
ectio
ns
Tur
nove
r
2009 2010 2011 2012 2013 2015 2016
2009 2010 2011 2012 2013 2015 2016

333
energy inputs and outputs were used in this analysis, which proved to be significant for the evaluation performed within the period that goes from 2009 to 2016. Denmark, Portugal, Germany and Spain are the leading countries in terms of efficiency status nomination. Nevertheless, WP systems deployment in these countries stands on an uncertain footing. Although in Germany the annual WP installed capacity is still growing, in Denmark, Spain and the UK it is reducing [32]. This decrease is mainly influenced by a shift in political motivations (particularly in Spain), shortage of sites for wind farm location, specifically in Denmark, and problems with public approval as for instance in the UK [33]. After crosschecking our results with the regulatory framework of WP systems in Europe, it was also possible to conclude that the continuous change and adaption of the support schemes in some countries might have a prevalent influence on the efficiency scores obtained for each country, in particular, in those that had strong budgetary constraints (either due to the financial crises or to bad designed support schemes), like Romania, Italy and Greece. The record countries in terms of the number of times classified as non-efficient are France, Greece and Italy. In the case of France, the non-efficiency scores of its WP systems are mainly related the large increase of WP installed capacity per year from 2009 to 2016, which led to the overcapacity of WP systems in this country. Overall, it can be concluded that except from the UK (a major WP player) which has a quota system, the countries which are more frequently classified as WP efficient adopted FiT at an early stage of WP deployment. In general, it can be established that except from 2012 and 2013, the period particularly impacted with the economic crisis, the majority of these countries had efficient WP systems in this period of analysis. Nevertheless, with the regulatory framework of some countries still undergoing a downturn, it might be expected that in the future the WP efficiency statuses of some of these countries might cease to exist. Finally, it is worth mentioning that future work is currently under way in order to encompass other type of inputs and outputs in WP assessment, namely the average annual wind speed (as a non-controllable input); the average rated power by country (as a controllable input) and the bad outputs regarding the manufacturing stage of the additional installed capacity in each year by means of the IO approach. Acknowledgements This work has been supported by the Portuguese Foundation for Science and Technology (FCT) under project grant UID/Multi/00308/2019. References [1] WindEurope, “Wind in power 2017,” no. February, pp. 1–12, 2018. [2] T. Jamasb and M. Pollitt, “Benchmarking and regulation: International electricity experience,” Util.
Policy, vol. 9, no. 3, pp. 107–130, 2001. [3] T. Sueyoshi and M. Goto, Environmental assessment on energy and sustainability by data
envelopment analysis. John Wiley & Sons., 2018. [4] D. Maradin and L. Cerović, “Possibilities of Applying the DEA Method in the Assessment of
Efficiency of Companies in the Electric Power Industry: Review of Wind Energy Companies,” Int. J. Energy Econ. Policy, vol. 4, no. 3, pp. 320–326, 2014.
[5] P. J. Korhonen and M. Luptacik, “Eco-efficiency analysis of power plants: An extension of data envelopment analysis,” in European Journal of Operational Research, 2004, vol. 154, no. 2, pp. 437–446.
[6] A. Y. Vaninsky, “Environmental efficiency of electric power industry of the United States: A data envelopment analysis approach,” World Acad. Sci. Eng. Technol., 2009.
[7] K. Tone and M. Tsutsui, “Applying an Efficiency Measure of Desirable and Undesirable Outputs in DEA to U.S. Electric Utilities,” J. Cent. Cathedra, vol. 4, no. 2, pp. 236–249, 2011.
[8] T. Sueyoshi and M. Goto, “DEA approach for unified efficiency measurement: Assessment of Japanese fossil fuel power generation,” Energy Econ., vol. 33, no. 2, pp. 292–303, 2011.

334
[9] X. Bai-Chen, F. Ying, and Q. Qian-Qian, “Does generation form influence environmental efficiency performance? An analysis of China’s power system,” Appl. Energy, 2012.
[10]P. Zhou, B. W. Ang, and H. Wang, “Energy and CO 2 emission performance in electricity generation: A non-radial directional distance function approach,” Eur. J. Oper. Res., vol. 221, no. 3, pp. 625–635, 2012.
[11]T. Sueyoshi and M. Goto, “DEA environmental assessment in a time horizon: Malmquist index on fuel mix, electricity and CO2 of industrial nations,” Energy Econ., 2013.
[12]Y. Tao and S. Zhang, “Environmental efficiency of electric power industry in the Yangtze River Delta,” Math. Comput. Model., 2013.
[13]G. B. Bi, W. Song, P. Zhou, and L. Liang, “Does environmental regulation affect energy efficiency in China’s thermal power generationα Empirical evidence from a slacks-based DEA model,” Energy Policy, 2014.
[14]N. Zhang and J. D. Kim, “Measuring sustainability by energy efficiency analysis for Korean Power Companies: A sequential slacks-based efficiency measure,” Sustain., 2014.
[15]R. Gómez-Calvet, D. Conesa, A. R. Gómez-Calvet, and E. Tortosa-Ausina, “Energy efficiency in the European Union: What can be learned from the joint application of directional distance functions and slacks-based measures?,” Appl. Energy, 2014.
[16]B. Arabi, S. Munisamy, and A. Emrouznejad, “A new slacks-based measure of Malmquist-Luenberger index in the presence of undesirable outputs,” Omega (United Kingdom), 2015.
[17]S. Munisamy and B. Arabi, “Eco-efficiency change in power plants: Using a slacks-based measure for the meta-frontier Malmquist-Luenberger productivity index,” J. Clean. Prod., 2015.
[18]J. Wu, B. Xiong, Q. An, Q. Zhu, and L. Liang, “Measuring the performance of thermal power firms in China via fuzzy Enhanced Russell measure model with undesirable outputs,” J. Clean. Prod., 2015.
[19]A. Ewertowska, A. Galán-Martín, G. Guillén-Gosálbez, J. Gavaldá, and L. Jiménez, “Assessment of the environmental efficiency of the electricity mix of the top European economies via data envelopment analysis,” J. Clean. Prod., 2016.
[20]G. E. Halkos and M. L. Polemis, “The impact of economic growth on environmental efficiency of the electricity sector: A hybrid window DEA methodology for the USA,” J. Environ. Manage., 2018.
[21]H. Fukuyama and W. L. Weber, “Socio-Economic Planning Sciences A directional slacks-based measure of technical inefficiency,” Socioecon. Plann. Sci., vol. 43, no. 4, pp. 274–287, 2009.
[22]K. Tone, “On Returns to Scale under Weight Restrictions in Data Envelopment Analysis,” J. Product. Anal., vol. 16, no. 1, pp. 31–47, 2001.
[23]R. Färe and S. Grosskopf, “Directional distance functions and slacks-based measures of efficiency: Some clarifications,” Eur. J. Oper. Res., vol. 206, no. 3, p. 702, 2010.
[24]P.-C. Chen, M.-M. Yu, C.-C. Chang, S.-H. Hsu, and S. Managi, “Nonradial Directional Performance Measurement with Undesirable Outputs: An Application to OECD and Non-OECD Countries,” Int. J. Inf. Technol. Decis. Mak., vol. 14, no. 03, pp. 481–520, 2015.
[25]W. W. Cooper, L. M. Seiford, and K. Tone, Data Envelopment Analysis. 2007. [26]N. R. Nataraja and A. L. Johnson, “Guidelines for using variable selection techniques in data
envelopment analysis,” Eur. J. Oper. Res., vol. 215, no. 3, pp. 662–669, 2011. [27]T Subramanyam, “Selection of Input-Output Variables in Data Envelopment Analysis - Indian
Commercial Banks,” Int. J. Comput. Math. Sci., vol. 5, no. 6, pp. 51–57, 2016. [28]Q. Li and J. S. Racine, “Nonparametric Econometrics : Theory and Practice Princeton University Press
( 2007 ),” Theory Pract., 2007. [29]“https://www.bp.com/.” . [30]“http://ec.europa.eu/eurostat/web/energy/data/energy-balances.” . [31]“https://www.eurobserv-er.org/.” . [32]Wind Europe, “Wind in power 2016 European Statistics,” Wind Eur., no. February, pp. 1–24, 2016. [33]L. Ziegler, E. Gonzalez, T. Rubert, U. Smolka, and J. J. Melero, “Lifetime extension of onshore wind
turbines: A review covering Germany, Spain, Denmark, and the UK,” Renew. Sustain. Energy Rev., vol. 82, no. January 2017, pp. 1261–1271, 2018.
[34]I. Peña, I. Azevedo, and L. A. F. Marcelino Ferreira, “Lessons from wind policy in Portugal,” Energy Policy, vol. 103, pp. 193–202, 2017.
[35]J. S. González and R. Lacal-Arántegui, “A review of regulatory framework for wind energy in European Union countries: Current state and expected developments,” Renewable and Sustainable Energy Reviews, vol. 56. pp. 588–602, 2016.
[36]J. Schallenberg-Rodriguez, “Renewable electricity support systems: Are feed-in systems taking the lead?,” Renewable and Sustainable Energy Reviews, vol. 76. pp. 1422–1439, 2017.

335
[37]V. Mytilinou, A. J. Kolios, and G. Di Lorenzo, “A comparative multi-disciplinary policy review in wind energy developments in Europe,” Int. J. Sustain. Energy, vol. 36, no. 8, pp. 754–774, 2017.
[38]A. Orrell, N. F Foster, S. L Morris, and J. S Homer, “2016 Distributed Wind Market Report,” no. August, p. 48, 2017.
[39]International Energy Agency IEA, “Energy Policies of IEA Countries: Italy 2016 Review,” Int. Energy Agency, p. 214, 2016.
[40]International Energy Agency, “Energy policies of IEA countries: The Netherlands, 2014 review,” Paris Washington, D.C. Organ. Econ. Co-operation Dev., no. October, p. 116, 2014.
[41]G. Dragomir, A. Şerban, G. NǍstase, and A. I. Brezeanu, “Wind energy in Romania: A review from 2009 to 2016,” Renewable and Sustainable Energy Reviews, vol. 64. pp. 129–143, 2016.
[42]T. Kuosmanen, “Weak disposability in nonparametric production analysis with undesirable outputs,” Am. J. Agric. Econ., vol. 87, no. 4, pp. 1077–1082, 2005.

336
DETERMINANTS OF VOLATILITY SMILE: THE CASE OF CRUDE OIL OPTIONS
Vesa-Heikki Soini, Sindre Lorentzen, University of Stavanger, Norway
Abstract This paper studies the determinants of WTI crude oil call option prices with a special emphasis on the relationship between implied volatility and moneyness. Our first-stage regression estimates a quadratic approximation of implied volatility as a function of moneyness, while our second-stage regression investigates correlations between the estimated parameters and a list of explanatory variables. The first-stage regressions show a positive coefficient on the quadratic term, suggesting that the market exhibits ‘Implied Volatility Smile’ and hence violates the Black-Scholes predictions. The main results of our paper concern the determinants of these violations. We find that the curvature of implied volatility as a function of moneyness is: (i) positively and significantly correlated with basis and hedging pressure of the underlying crude oil futures contract (ii) positively and significantly correlated with various measures of transaction costs on the options market.
Introduction
Oil is the most important commodity in the world. The effect of oil prices spills over to other industries in the economy, since oil is used as fuel for transportation and as an input to plastic production. In the modern era, an increasingly large amount of oil-related trading happens in the derivatives market. Despite the economic importance of trading in crude oil options, there is very little research on their pricing. This paper aims to fill that gap. Based on the Black-Scholes model and its assumptions, all options on the same underlying asset and with the same time to maturity should have the same implied volatility regardless of the strike price. However, in practice implied volatility is consistently found to change with the degree of moneyness, often in the form of `Implied Volatility Smiles'. Since implied volatility is directly linked to pricing of options, deviations from constant implied volatility can tell us a lot about the determinants of options prices. Previous research has devoted very little attention to identifying the underlying drivers of the relationship between implied volatility and moneyness. Apart from the study of Pena et al (1999) on Spanish stock index options, the determinants of volatility smiles have been left unexplored in the literature. Figure 1 – Different type of relationships between implied volatility and moneyness

337
While the presence of volatility smiles is a well-established stylized fact for some options, to our knowledge there is no prior research on volatility smiles in the crude oil market. Moreover, the relationship between implied volatility and moneyness differs significantly across various markets. In the U.S. equity market, implied volatility was relatively constant across various levels of moneyness until the Crash of 1987. Afterwards, however, implied volatility started to show a downward sloping pattern. Regarding other markets, currency and commodity markets typically exhibit a proper volatility smile, as shown in Panel (a) of Figure 1. The aim of this paper is to empirically investigate the relationship between implied volatility and moneyness to study the determinants of WTI crude oil options prices. We tackle this task by running a a two-stage regression analysis. In the first stage, we estimate a second-order Taylor approximation of implied volatility as a function of moneyness separately for each date and maturity class in the sample. In the second stage, we analyze correlations between the estimated parameters and several variables that we believe to be important for options prices. As previous research has not studied volatility smiles for crude oil, we first test if volatility smiles are present in this market. While the use of quadratic approximation of the functional form may seem restrictive, we show that this specification fits the data surprisingly well. Estimating the model for each date and maturity class gives an average R2 of 0.957. The average estimated parameters are 0.93 for the constant term, -1.44 for the linear term and 0.78 for the quadratic term. The fact that the last term is positive suggest that the crude oil options market tends to exhibit a volatility smile. The main empirical result of the paper is that the curvature of implied volatility as a function of moneyness is positively and significantly correlated with the basis and hedging pressure of the underlying crude oil futures contract. That is, the implied volatility curves tend to be flatter when either the basis is low or commercial hedgers are net long. This result is new in the literature and not present in for example Pena et al (1999). The result also suggests that the return distribution of the underlying has a key role in explaining volatility smiles, which contrasts with the net buying pressure explanation of Bollen and Whaley (2004) and the transaction cost explanation discussed in Longstaff (1995), Dumas et al (1998) and Pena et al (1999). We believe that the theoretical reason behind our main result is that crude oil futures return distribution tends to exhibit fatter tails and more skew during times of high basis and high hedging pressure. Empirically, a high level of either of these variables is associated with a higher kurtosis in the historical return distribution. Therefore, our analysis suggests that the shape of implied volatility function is inherently affected by the return distribution of the underlying. Fatter tails during times of high basis can be attributed to the theory of storage (Deaton and Laroque (1992,1996), Working (1949)). According to this theory, a higher basis is associated with lower inventories and a greater likelihood of price spikes. This mechanism
338
increases both skewness and kurtosis, and can therefore explain the volatility smile. Liu et al (2011) report empirical support for this mechanism and relate it to the convenience yield of the underlying futures contract. Another important finding of this paper is that the curvature of implied volatility as a function of moneyness is positively correlated with the low-frequency Abdi and Ranaldo (2017) high-low spread estimator and negatively correlated with the traded volume of options. We regard these two variables as proxies for transaction costs. On the contrary, traded volume of the underlying futures contracts, Monday dummy or days to maturity do not have much explanatory power for the volatility smile.
Data
The main data consists of settlement prices of WTI (West Texas Intermediate) crude oil call options traded at the New York Merchantile Exchange (NYMEX) between May 13, 2008 and May 31, 2016. We restrict attention to contract maturities ranging from 1-month to 12-months, as trading in longer maturity contracts is more rare which affects price formation. The underlying crude oil futures contracts are for delivery at Cushing, OK. The data set is purchased from Commodity Research Bureau (See http://www.crbtrader.com/ for details on how to order the data.). Crude oil options have maturities ranging from one month to 12 months. In practice, the contracts correspond roughly to how many months are left until maturity, plus around 20 days set by the regulations of NYMEX. The Black-Scholes implied volatilities are computed separately for each observation. For this purpose we use prices of the underlying crude oil futures from the CRB. Moreover, computing the implied volatilities requires a proxy for the risk-free interest rate. For this purpose we use the market yield on U.S. Treasury securities at 1-year constant maturity which is quoted on investment basis (these data are available at the federal Reserve website https://www.federalreserve.gov/releases/h15/data.htm). Our raw dataset consists of 1 208 866 observations with positive open interest. However, we only analyze options with a positive trading volume on a given day, as prices may otherwise not be informative of the current market situation. Furthermore, there are some observations for which the empirical implied volatility equation is not satisfied for any positive value of implied volatility. We discard such observations. Overall, we are left with 305 212 observations with a positive trading volume and a well-defined measure of implied volatility.
Explanatory Variables
Our Stage 2 regression uses several explanatory variables that are listed in Table 1.
Table 1 – List of explanatory variables
Variable Description
Spread Mean bid-ask spread for given date and maturity
Option Volume Total trading volume of options for given date and maturity
Basis Percentage basis for the underlying crude oil future
HP Index of hedging pressure for the underlying crude oil future
Future Volume Total trading volume of the underlying future for a given day and maturity
Monday Dummy variable for mondays
DTM Days to maturity

339
According to one hypothesis, the deviation from the Black-Scholes postulated constant relationship between implied volatility and moneyness stems from the presence of transaction costs. Transaction costs include components such as bid-ask spread, opportunity cost and price impact. We utilize the Abdi and Ranaldo (2017) spread estimator, which captures the bid-ask spread and price impact component. Many spread estimators have been suggested throughout the literature. The Abdi and Ranaldo (2017) estimator is utilized in this paper as it is based on low frequency data and therefore more feasible to implement. Ex ante, the presence of transaction costs is expected to cause an increase in implied volatility, i.e. the curvature of the volatility smile should increase with spread. The size of the spread is driven by many components. For instance, spreads provide compensation for adverse selection to liquidity providers (dealers and limit orders). The probability of adverse selection is generally higher on Mondays because there has not been sufficient amount of time for the process of price discovery to eliminate information asymmetry accrued during the non-trading days of the week. In other words, a Monday dummy is expected to have the same effect on the curvature of the volatility smile as the spread. Option trading volume can be considered as an indicator of liquidity as markets with more trading activity are generally more liquid. In contrast to spreads, which are measures of illiquidity, option trading volume is expected to have a negative effect on the curvature of the volatility smile. Basis is the percentage difference between crude oil spot price and futures price. Even though basis is often defined as an absolute difference, we normalize by futures price in order to make the numbers comparable over time. The basis is an important variable. If spot price follows a Martingale process, our definition of basis corresponds to expected hold-to-maturity returns from the underlying futures contract. As pointed out by Alquist and Kilian (2010we) and related literature, historically no-change forecasts have indeed been better predictors of crude oil price than most forecasts based on futures price data in a Mean Squared Prediction Error (MPSE) sense. The index of hedging pressure aims to capture the relative numbers of commercial hedgers in the market. This variable is important because commercial hedgers are believed to pay a risk premium to speculators in order to fix the price. This should have direct consequences on the distribution of futures returns. Days-to-maturity (DTM) and futures trading volume are added as control variables.
Regressions
Stage 1 The aim of this paper is to identify and study potential determinants of volatility smiles related to WTI crude oil option contracts. It is important to keep in mind that the smile, or potentially a smirk, is not directly a variable - it is a functional form. Hence, our econometric approach is implemented through two stages. First, we begin by regressing implied volatility σt on moneyness F/K. Second, based on the obtained regression model, we regress each of the obtained β-coefficients from the first stage on a set of explanatory variables believed to be of importance. More formally, Stage 1 regression estimates the following equation separately for each maturity class and valuation date:

340
We chose to use this specification through an extensive experimentation with various functional forms. The interpretation of the estimated β-coefficients is straightforward and the specification can be treated as a second-order Taylor approximation for a more complex functional form. We regress implied volatility on moneyness to our various sub-samples of data. Each sub-sample is constructed by pooling observations with the same valuation date and the same maturity date conditional on having a positive amount of trades. With these restrictions, a total of 12965 sub-samples are constructed. The sub-samples are further divided into twelve different categories based on how many months before the contracts expires. The regression results are reported in Table 1. For instance, there are 906 sub-samples of contracts with one month until expiration. Based on these 906 sub-samples, the average number of observations per sub-sample is 36.49 with a standard deviation of 14.57. Further, we obtain an average estimate of 1.22 for the constant term, -1.94for the linear term and 0.84 for the squared term. The average R2 is 0.95. Across the twelve categories, the constant term is ranging from 0.58 to 1.22, where the estimate seems to generally be higher the closer the contract is to maturity. The coefficient of the linear term ranges from -1.94 to -0.76 and the squared term ranges from 0.48 to 0.84. The number of sub-samples and the average number observations in the sub-samples tend to decrease as time until expiration increases. Nevertheless, the average R2 is high in all cases.
Sub-Samples
l 1.22(10.27) -1.94(20.28) 0.84(10.02) 0.95 36.49(14.57) 906
2 1.10(2.60) -1.72(5.17) 0.83(2.58) 0.93 47.07(16.34) 1891
3 1.05(0.75) -1.68(1.69) 0.88(0.90) 0.92 37.97(16.52) 1852
4 1.01(0.70) -1.63(1.55) 0.90(0.82 ) 0.95 24.37(13.33) 1780
5 0.92(0.63) -1.46(1.40) 0.83(0.74) 0.97 14.38(9.82) 1690
6 0.83(0.74) -1.29(1.63) 0.75(0.86) 0.98 9.63(6.87) 1454
7 0.76(0.52) -1.13(1.26) 0.67(0.72 ) 0.98 8.35(6.41) 1068
8 0.69(0.47) -1.02(1.09) 0.61(0.59) 0.98 7.47(5.57) 733
9 0.66(0.36) -0.95(0.86) 0.58(0.48) 0.98 7.57(5.08) 527
10 0.63(0.35) -0.91(0.84) 0.56(0.46) 0.98 8.00(5.39) 414
11 0.60(0.53) -0.85(1.13) 0,52(0.59) 0.97 7.44(4.86) 349
12 0.58(0.33) -0.76(0.76) 0.48(0.41) 0.99 6.77(4.43) 301
Empirical results regressing implied volatility (σt) on both linear and square term moneyness (F / K):
For sub-samples with the given number of months before maturity, the average values of β–coefficients, explanatory power (R2), average number of observations (N) in the sub-samplesand number of sub-samples are reported. Standard deviations for eache statistic are reported in parenthesis.

341
Stage 2 To identify potential determinants of the volatility smile, we regress each of the estimated coefficients from Stage 1 regressions on a set of proposed explanatory variables. The Stage 2 regressions thus reads as
Our list of explanatory variables xjt is in Table 1.
Interpretation of Stage 2 regression results is subject to two complexities. First, we are dealing with functional forms rather than individual observations. Second, the options contracts vary by maturity and there is no theoretical reason to believe that all maturities behave similarly. To address these complexities in more detail, we start with a couple of remarks. Functional Form We approximate the implied volatility function with a second-order polynomial. The approximation satisfies the following two rules: 1. Given β1 and β2, an increase in β0 shifts the whole implied volatility function upwards. 2. Given β0 and β1, an increase in β2 increases the curvature of the implied volatility
function. If β2>0, the function open upwards, otherwise it opens downwards. These two rules suggests that for our purposes, determinants of β0 and β2 are the most interesting. Changes in β1 primarily shift the curve sideways. Maturity of Option Contracts We report pooled results for maturities between 3-month and 12-months. The only data restriction is that we require a positive volume of trade for at least three levels of moneyness each day in order for an observation to be included. The reason for discarding 1-month and 2-month contracts is due to the observation that these contracts behave very differently from all other maturities. It is likely that the reasons for trading these short-term contracts are very different from reasons for trading longer maturity contracts. Moreover, the results seem very consistent across maturities for the longer maturity contracts. Therefore, our principal interest is to investigate results for maturities ranging from 3-month to 12-month contracts. The Stage 2 regression results are in Table 2: Table 2 - Stage 2 regression results. *** means statistical significance at 1% significance level and **
means statistical significance at 5% significance level.
Dependent Variable β0 β1 β2
Constant 0.89 *** �1.15 *** 0.63 *** Bid_Ask 1.82 *** �4.53 *** 2.43 *** Option vol 0.01 ** �0.01 0.00 Basis 1.14 *** �4.42 *** 2.69 *** HP 2.58 *** �6.68 *** 3.46 *** Future vol 0.00 �0.02 0.01 * Monday dummy �0.01 0.03 �0.02 DTM 0.00 *** 0.00 *** 0.00 *** Obs 7306 7306 7306 R�squared 0.36 0.46 0.46

342
We now proceed with interpreting the results. Table 2 shows that the main determinants for the average level of implied volatility are bid-ask spread (coefficient 1.82), basis (coefficient 1.14) and hedging pressure (coefficient 2.58). All these variables are statistically very significant and have the expected sign. Perhaps the fact that high transaction costs are associated with higher implied volatility is the most surprising result here. Less surprisingly, a high basis or a net short position commercial hedgers is associated with a higher average level of implied volatility. The last three explanatory variables in Table 2 seem to be less correlated with implied volatility. The last column of Table 2 contains the main results of this paper. We note that bid-ask spread is positive and statistically significant. Hence high transaction costs are associated with a higher degree of curvature in the implied volatility function. However, even more consistent and statistically significant pattern is observed with basis and hedging pressure. The conclusion is that implied volatility function tends to smile more during times of a high basis or a net short position of commercial hedgers in the underlying futures contract. On the other hand, the last three variables in the last column of Table 2 do not show a very consistent pattern.
Conclusions
The main objective of this paper is twofold. First, we attempt to capture the relationship between implied volatility and moneyness (here defined as the ratio between futures prices and strike price) for WTI crude oil call options traded on NYMEX between May 13, 2008 and May 31, 2016. Second, conditional on a given functional form describing the relationship, we investigate several potential determinants of the β-coefficients. We find that a second-order equation is sufficient to adequately capture the relationship. More elaborate model fitting with multivariate fractional polynomials yields a marginally better fit. The increase in explanatory power, however, does arguably not justify the decrease in parsimony. Inspection of the predicted values of implied volatility reveals that volatility smiles, reverse skew (smirk), forward skew and frowns are present to varying degrees depending on the time to maturity. When regressing the β-coefficients of the second-order equation on various candidate explanatory variables, we find a significant correlation between the shape of implied volatility functions and basis and hedging pressure. The volatility function tends to be flatter when either basis is low or commercial hedgers are net long. We believe that the reason for this pattern is that the underlying asset distribution exhibits more kurtosis during times of high basis or high hedging pressure. Secondly, we find that the Abdi and Ranaldo (2017) spread estimator and option trading volume are also important determinants of the shape of the implied volatility function. Variables such as futures trading volume, days-to-maturity and weekend effect proxied through a dummy variable for Mondays appears to not have a significant effect. References Abdi, F. and A. Ranaldo (2017). A simple estimation of bid-ask spreads from daily close, high, and low
prices. The Review of Financial Studies 30 (12), 4437–4480. Alquist, R. and L. Kilian (2010). What do we learn from the price of crude oil futures? Journal of Applied
Econometrics 25 (4), 539–573. Bollen, N. P. and R. E. Whaley (2004). Does net buying pressure affect the shape of implied volatility
functions? The Journal of Finance 59 (2), 711–753. Deaton, A. and G. Laroque (1992). On the behaviour of commodity prices. The Review of Economic
Studies 59 (1), 1–23. Deaton, A. and G. Laroque (1996). Competitive storage and commodity price dynamics. Journal of
Political Economy 104 (5), 896–923.

343
Dumas, B., J. Fleming, and R. E. Whaley (1998). Implied volatility functions: Empirical tests. The Journal of Finance 53 (6), 2059–2106.
Liu, P. and K. Tang (2011). The stochastic behavior of commodity prices with heteroskedasticity in the convenience yield. Journal of Empirical Finance18 (2), 211–224.
Longstaff, F. A. (1995). Option pricing and the martingale restriction. The Review of Financial Studies 8 (4), 1091–1124.
Pena, I., G. Rubio, and G. Serna (1999). Why do we smile? on the determinants of the implied volatility function. Journal of Banking & Finance 23 (8), 1151– 1179.
Working, H. (1949). The theory of price of storage. The American Economic Review 39 (6), 1254–1262.

SMART METERS IN SWEDEN- LESSONS LEARNED AND NEW REGULATIONS Yalin Huang, Elin Grahn, Carl Johan Wallnerström, Lena Jaakonantti, Tommy Johansson, Swedish Energy Markets Inspectorate, Sweden Summary Sweden was one of the first countries in Europe to roll out smart meters. The first regulation regarding smart meters was adopted in 2003, which required monthly metering for small consumers and hourly metering for larger consumers by 2009. This led to the roll-out of the first generation of smart meters in Sweden. The functionality of smart meters has since then evolved from automatic reading of data once a month to more frequent data measuring and remote control. Based on the lessons learned from the first roll-out of smart meters and on the development of functionality of smart meters, the national regulatory authority for energy in Sweden (Ei) has developed new regulations on minimum functional requirements for smart meters. In Sweden smart meters are owned by the distribution system operators (DSOs). Varying functionalities of smart meters between different DSOs endanger the consumers’ right to be treated equally. It is important that consumers have equal possibilities to e.g. utilise services from energy suppliers or energy service providers. Therefore, minimum functional requirements for smart meters need to be defined. In 2013, Ei evaluated the impact on market participants of the first roll-out of smart meters in Sweden. The availability of hourly price contracts, the number of consumers who reacted to the electricity price and the competition among different metering service providers were studied. Based on the results of Ei’s study and the development of functionality of smart meters, Ei submitted a report to the Swedish Government in 2015 suggesting that minimum functional requirements for smart meters should be regulated and presented a preliminary proposal of requirements based on a long-term cost-benefit analysis (CBA). The CBA was performed in accordance with the EU Commission recommendation on preparations for the roll-out of smart metering system. The reference scenario was defined as the smart metering system in Sweden in 2012. For each proposed functional requirement, the costs and the benefits for both the consumers and DSOs were quantified. Sensitivity analysis was then performed to identify critical variables for the positive roll-out conditions. The proposal was open for public consultation and all responses were reviewed by the government office. In 2016 the government concluded that it is necessary to develop minimum functional requirements for smart meters before the roll-out of the next generation. In 2017, Ei was tasked by the Swedish Government to propose new rules concerning minimum functional requirements for smart meters, based on the previous suggestions in 2015. Ei’s study from 2013 showed that lack of hourly price information, lack of knowledge on electricity contract, and lack of standardisation on smart meters were the main reasons that have limited the benefits of using smart meters. After restudying the proposal from 2015 and the outcome of the public consultation, Ei presented a final proposal concerning minimum functional requirements for smart meters to the government in November 2017. The proposed functional requirements focus on both providing more information to consumers to increase their interest in being active and more information to the DSOs to increase their efficiency. Furthermore, the proposal also states that the new functionality should be implemented in a way that protects consumer privacy and data security. The minimum functional requirements, which were then included in the ordinance for metering, calculating and reporting electricity, cover the following areas: 1) Extended measurement, 2) Registration of active energy every hour or fifteen minutes and power outages, 3) Customer interface, 4) Remote collection of
344

345
measured data and power outages, 5) Remote updating of software, settings and control the power of the meter. All the meters in the low voltage network should fulfil these requirements lasted by 2025. Within the next few years, many of the current electricity meters in Sweden will be replaced, as they have reached their economic lifespan. Introducing minimum functional requirements for smart meters will ensure all consumers the same right to the technical solutions and data security, furthermore, it facilitates a fair competition among commercial developers.
1. Introduction
1.1 The electricity market in Sweden
The electric power system in Sweden underwent a major reform in 1996. Since then, generation and trading of electricity are exposed to competition. Network operations, i.e. the transmission and distribution of electricity, are however considered as natural monopoly since it would be both economically and environmentally unreasonable to have competing infrastructures to the same customer. Due to the lack of competition in the transmission and distribution networks, network operators are subject to regulation to promote efficiency and quality of supply and to ensure fair prices for customers. The national regulatory authority (NRA) for energy in Sweden, the Swedish Energy Markets Inspectorate (Ei), monitors whether the network operators comply with existing rules. Ei is tasked to ensure that customers have access to a power distribution system with reasonable and non-discriminatory tariffs, to provide incentives for network operators to operate network cost effectively while maintaining acceptable reliability [1].
1.2 The electric grid in Sweden
There are currently more than 150 distribution system operators (DSOs) and one transmission system operator (TSO) in Sweden. The Swedish TSO, Affärsverket Svenska kraftnät, is owned by the Swedish Government. The TSO owns and operates all parts of the transmission system (in Sweden defined as 220 kV or higher) with a few exceptions. All other entities that operate power systems in Sweden are defined as DSOs. The DSOs are of varying size and ownership structure (state, municipal, private and other), and they each have at least one so-called concession (permission) for the distribution of electricity, either for a defined geographical area or for a specific line. The concession means a privilege with rights, but also comes with several obligations, which are stipulated in the Swedish Electricity Act.
1.3 The electricity regulation revolution in Sweden
From 1996 to 2002, the Swedish DSOs were regulated based on a rate of return (ROR) approach. The revenues of the DSOs were based on their actual costs ex-post. In 2003, the first performance-based tariff regulation was introduced, the so-called network performance assessment model (NPAM). Under the NPAM approach, the revenues of the DSOs were based on the costs of fictive reference networks (more information can be found in [2] and [3]).
In 2005, a severe storm struck Sweden (referred to as Gudrun or Erwin) and caused outages for about 450 000 customers; out of which approximately 100 000 customers had an outage that lasted for longer than four days. This event increased the focus on continuity of supply. In 2006, two legislations entered into force. It implied new mandatory requirements for DSOs,

346
which is to present annual risk and vulnerability analyses with action plans, and to provide compensation for customers with outages longer than 12 hours. From 2011 outages longer than 24 hours are not tolerated by law. At the same time, additional minimum requirements of the reliability of supply were defined by Ei; one example is that more than 11 outages per customer in a year is not tolerated.
In 2012, an ex-ante revenue cap regulation was implemented in Sweden. During the first regulatory period of 2012-2015, the revenue cap of the DSOs was adjusted according to their level of continuity of supply (CoS), which was measured by SAIDI1 and SAIFI2 (more information can be found in [4]). For the second regulatory period of 2016-2019, the CoS incentive scheme was improved, and at the same time a new incentive scheme for the efficient utilization of electricity networks was introduced. The incentive scheme for CoS aims to discourage unreasonable differences in CoS between and within power distribution systems and to tie the interruption cost to the socio-economic cost of outages [4]. The incentive scheme for efficient utilization of networks aims to improve efficiency in network investment and operation [5]. More specifically, it aims to reduce the losses in the network and to even out the load profile to reduce the risk of over dimensioning the capacity of the networks. The incentive schemes are under continuous improvement.
The future development of power systems is characterized by major changes on both the supply and demand side. On the supply side, more power generation from renewable sources, both small- and large-scale, are integrated in the power system. On the demand side, the load characteristics are changing with e.g. micro generation, electric vehicles and more flexible load. The flexibility of loads comes from the combination of demand response program, local energy storage and distributed generation.
The electricity meter is the bridge that communicates the supply side and the demand side. Meters provide consumption data to the demand side that in combination with price signals can be used to activate the flexibility of loads. At the same time meters provide information from the demand side to DSOs and to the electricity market. The development of smart meters will enable the integration of more renewable production and empower the demand side. It also increases the possibilities to evaluate DSOs investments and to evaluate the impact of flexible load. However, with development of data analysis techniques and different needs in the meter market, there are different levels of smartness of smart meters available on the market. For example, some smart meters can offer real-time consumption data and dynamic tariffs to customers. From a regulatory point of view, it is important to continuously and carefully adapt the regulation to accommodate these challenges whilst to foster fair competition for the digital solutions.
1.4 EU rules concerning smart meters
The existing EU Electricity Directive 2009/72/EC [6] includes provisions on smart meters. According to the directive, the introduction of intelligent metering systems within the EU should be based on an economic assessment. The economic assessment should consider all the long-term costs and benefits to the market and the individual consumer and the timeframe to carry out. The objective was to equip at least 80 % of consumers in EU with intelligent metering system by 2020 based on positive impact assessments in each country. The directive
1 System average interruption duration index (SAIDI) = total outage time / number of customers [minutes/customer and year] 2 System average interruption frequency index (SAIFI) = total number of outages / number of costumers [1/customer and year]

347
does not include a detailed definition of intelligent metering systems; however, it is stated that the meters shall assist the active participation of consumers in the electricity supply market. In 2012, intelligent metering systems was defined in the EU Energy Efficiency Directive 2012/27/EU as an electronic system that can measure energy consumption, providing more information than a conventional meter, and can transmit and receive data using a form of electronic communication [7]. On 30 November 2016, the European Commission presented, “Clean energy for all Europeans”, which is a package of legislative proposals to facilitate the clean energy transition [8]. The package covers among other things the topic of electricity market design. The proposal aims at putting consumers at the heart of the energy markets by ensuring that they are empowered and better protected. According to the proposal, minimum functional requirements for smart meters should be set up in line with several principles in the member states. These principles include for example to measure actual electricity consumption and provide easy-to-understand information to the customer on actual time of use, and if the customer requests, to provide metering data via a local standardized communication interface. It also includes to follow security and privacy legislation, to measure injected energy to the grid, to give the customer appropriate advice and information at the time of installation, and to enable final customers to be metered at the same time resolution as the imbalance settlement period in the national market.
2. First generation of smart meters in Sweden A major driver for rolling out smart meters in Sweden was to increase consumer awareness and to reduce energy consumption. Introducing smart meters also improved DSOs’ understanding of the load pattern. Better understanding of the load pattern allows DSOs to better allocate their costs and reduce the risk of over dimensioning of the network capacity. The roll-out of the first generation of smart meters in Sweden took place through two major steps. The first step was the introduction of monthly metering, and the second step was the gradual introduction of hourly metering.
2.1 Monthly metering
Before 2003, nearly all electricity meters in Sweden measure on a yearly basis. The customers received their bills based on the previous year’s consumption, and then received a reconciliation bill for the difference between the previous year’s consumption and the actual consumption [9]. Hourly metering was only required for consumers who had fuses above 200 A or rated power above 135 kW and for producers. In 2003, the Swedish Parliament decided that by 2009 all electricity customers should have monthly billing based on actual consumption. This initiated the roll out of the first generation of smart meters in Sweden. Therefore, since 2003 smart meters have been rolled out gradually. These meters could be automatically read at least every month for consumers and hourly for producers; therefore, they were also referred to as automatic meter reading (AMR) systems. By 2009, nearly all Swedish consumers had smart meters that could be remotely read at least once a month. The DSOs are responsible for the meter reading and data reporting. The costs of the smart meters are included in the DSOs’ asset base in the revenue cap regulation (more information in section 4).
2.2 Hourly metering
In 2006, the fuse limit for which hourly metering was required was lowered to 80 A from 200 A. In fact, most of the meters that were installed for measuring automatically every month can

348
measure every hour as well and can be read remotely. In May 2010, 91% of the meters could register hourly values remotely [10]. In 2012, new rules entered into force which meant that customers who had a fuse below 63 A and subscribe to an hourly-based electricity supply contract had the right to meters that can measure data hourly without extra cost. Customers who did not have hourly-based electricity supply contracts or did not have the hourly metering yet, needed to pay for the hourly metering. When a customer requested an hourly-based contract, the electricity supplier should inform the DSO to install hourly meters and report the hourly metering data. In 2017, a new amendment was made to the legislation. All electricity consumers can now request hourly metering without extra cost. In Sweden, the DSO is responsible for the registration and reporting of values. The DSO is obliged to report values in the common standard electronic data interchange format, upon request from the customer. If the customer has opted for hourly metering, the DSO must make the metering data available online [10]. A timeline of the reform and the status of smart meters in Sweden is shown in Figure 1.
Figure 8 - Timeline of the development of smart meters in Sweden
2.3 Functionalities of the first generation of smart meters
The first generation of smart meters in Sweden fulfils the requirements in the EU Directive 2012/27/EU. However, in terms of functionality of meters, the first-generation smart meters vary significantly. In the early stages of the roll-out, the basic requirement for smart meters was to read the meter hourly for the customers with hourly-based electricity supply contract. There was no requirement on communication or visualization of consumption data. However, most meters are connected to communication systems that can transfer hourly meter values and are capable of two-way communication [10]. Some of the meters are connected to visualization tools to enable the customers to monitor and control their consumption. Some meters are equipped with other platforms to show the real-time price of electricity and their consumption. According to an investigation in 2013 which included about 90% of the household consumers in Sweden, around 66% of the meters in Sweden can send alarm signal to DSOs when there are outages or abnormal voltage levels in the system [13]. Furthermore, around 76% of consumers have access to hourly measurements and around 40% of the meters can measure both input and output energy until 2013 [13]. Many new functions of smart meters are continuously being developed. However, lack of standards for functional
Monthly electricity billings are required for all electricity consumers by the Swedish goverment by 2009.
• 2003‐03
The limit of fuse for hourly metering is decreased from 200 A to 80 A.
• 2006‐07
All electricity consumers have the meters that can measure at least once a month.
• 2009‐07
Hourly metering is implemented for certain electricity consumers with fuse below 63 A.
• 2012‐10
All electricity consumers have the right to have hourly metering wihtout extra costs.
• 2017‐07

349
requirements of smart meters has shown as a barrier for facilitating demand response. Within the coming years many first-generation smart meters need to be replaced since they will reach their economic lifetime.
2.4 Lessons learned from the roll-out of the first-generation smart meters
In 2013, Ei was tasked by the Swedish Government to evaluate the impact of the legislation that enabled certain household consumers to request hourly metering without extra cost [12]. The results showed that very few electricity suppliers offer contracts based on hourly prices. More than 55 suppliers provided hourly price contract according to the investigation in 2013 [12]. Consumers needed to contact the suppliers to find out this information. Therefore, it was found to be difficult to compare offers from different suppliers. Around 10% of the total consumers, which is about 600 000 consumers, have switched supplier between 2012 and 2013 [12]. Furthermore, it was difficult for consumers to understand and evaluate the hourly price contracts. Given the lack of information, it was not surprising that only around 8 600 customers, which is less than 2% of the total customers, had chosen hourly price contracts until October 2013 [12]. However, most of the DSOs stated that their smart meters could measure data hourly. About one million customers had hourly metering. A few suppliers that offered hourly price contracts to consumers also offered equipment or services (e.g. mobile applications that visualize consumption and price) that could help consumers to react to price signals [12]. One reason can be that it takes up to 3 months for the DSO to change a monthly reading meter to hourly read meter, which reduces the interest from consumers to react.
3. Second generation of smart meters in Sweden In 2014, Ei was tasked by the Swedish Government to analyse and suggest functional requirements for the future electricity meters in Sweden [13]. The task included a cost-benefit analysis (CBA) on implementing different functions on smart meters. The CBA was based on the method recommended by the EU commission [14]. In 2015, Ei published recommendations for functional requirements of smart meters in the low voltage networks, which is less than 230 V [15]. In the rest of the paper, we will only discuss the meters in the low voltage networks. Typical customers in the low voltage networks are household customers and small industries. One of the conclusions from the study was that minimum functional requirements should be defined for the second generation of smart meters in Sweden. Functional requirements will facilitate the development of smart grid and establish a base for competition on demand response services. In December 2016, Ei was tasked by the Swedish Government to propose the regulation concerning minimum functional requirements for the next generation of smart meters. In November 2017, Ei presented the report to the Government. Ei has during the work with the report consulted The Swedish Board for Technical Accreditation(Swedac), The Swedish Data Protection Authority, The Swedish Armed Forces and The Swedish Security Service. Market participants in the electricity market (DSOs, manufacturers of smart meters, etc.) were also invited to give their views during the work. The ordinance came into force in September 2018 and Ei was tasked to develop regulations to execute the regulation concerning the minimum functional requirements for smart meters. These requirements should be implemented by 1 January 2025.
3.1 Why functional requirements?
Well defined functional requirements on smart meters are the basis for the further development of smart meters. It ensures that all the electricity consumers, electricity suppliers and service

350
providers have equal opportunities. Some requirements can facilitate the development of energy service markets, for example, information on real-time electricity consumption. With this information, customers can react to the price signal from the markets and can evaluate different energy services. Requirements on providing more real-time information can motivate DSOs to accelerate the journey towards a smarter grid. By providing useful information to network operation the network can be used in a more efficient way. The development of functional requirement on smart meters is also a continuation of the EU recommendations from 2016.
3.2 List of minimum functional requirements
The ordinance defines five functional requirements for smart meters and metering system. The functionalities and its purposes are shortly summarized in Table 10. Some of these functionalities are already implemented in a large share of the meters that are installed in Sweden, for example remote collection of measured data and registration of power interruptions. However, by regulating the functions it makes sure that all the meters and metering system fulfil the requirements. That will ensure that all consumers have the same information and opportunities. The main difference between the future meters and the meters of today is that the future metering systems will be able to handle more and more detailed information that will be accessible to and benefit both the customer and the DSO. Besides the minimum functional requirements, the functionalities shall be implemented in such a way that unauthorized persons shall not get access to information or functionalities in the meters, and consideration must be given to the EU regulations GDPR, General Data Protection Regulation (2016/679). Since more information will be handled by the metering system and more actions will be possible to do remotely, it is important to consider the integrity and security aspects.
Table 10- The minimum functional requirements for smart meters
No.
Functionality Purpose
1 Extended measurement Promote efficient network operation
Facilitate integration of micro production in the network
2 Registration of active energy every hour or fifteen minutes and power outages
Increase the customers’ possibility to be active in the market.
Facilitate for the DSOs to pay compensation to the customer due to outages.
Empower the customer.
3 Customer interface Create conditions for a developed energy services market
Promote demand side flexibility and energy efficiency
Empower the customer.
4 Remote collection of measured data and power outages
Promote efficient collection of data
5 Remote updating software, settings and control the power of the meter
Provide the condition that new functionalities can be introduced in a cost-efficient way.
Avoid expensive field visits.

351
A more detailed description of the functional requirements and the motivation are presented below, together with a reference to the cost-benefit analysis for each requirement. A quantitative analysis for all functional requirements is also represented afterwards. A more comprehensive cost-benefit analysis can be found in [13] 1. Extended measurement The meter shall for every phase be able to measure voltage, current, active and reactive power for both directions. The meter shall also be able to measure and register the total withdrawal and input of energy. This requirement ensures that the DSOs have sufficient information to operate the network efficiently. Electricity consumers can also use this information to evaluate different energy services and to evaluate the possibility to install microgeneration or energy storage. However, these benefits are difficult to quantify. At the same time, the extended measurement data are beneficial only if these data are accessible to customers. Therefore, some of the benefits are analysed in the next functional requirement. Moreover, the benefits depend on the type of consumers. Customers who live in houses are likely to benefit more than those who live in apartments. The costs for implementing this requirement is estimated as 0-30 SEK3 per meter [13]. The benefits from extended measurement are believed to be higher than the costs. 2. Registration of active energy every hour or fifteen minutes and power outages
1) Registration of active energy every hour or fifteen minutes The meter should be able to save the active energy in both directions every hour and be able to convert to every fifteen minutes. This will allow for increased customer awareness of their consumption. The interval of fifteen minutes is adopted from the recommendation from the EU commission. Hourly data or fifteen minutes data is an important condition to develop demand response services and electricity contracts which can send out the right market signals. The benefit of consumers having a better understanding of their consumption and taking actions to reduce its consumption is estimated to be 35 SEK per household per year. This estimation assumes that consumers reduce their consumption by 1% per year in average. The benefit for the DSO is estimated by assuming that the DSO will use the information to provide better services and to reduce the operational cost. The benefit is estimated to be 15 SEK per meter and year. This requirement is also expected to reduce the possibility of over dimensioning the network capacity and to facilitate demand response. However, these potential benefits are more difficult to quantify. To fulfil this requirement, the DSOs need to invest in a better data colleting system and registration system. The cost for investing in such colleting system is estimated to be 23 SEK per meter, while the cost for such registration system is estimated to be 50 – 150 SEK per meter. Nevertheless, there will be the additional operational cost to fulfil this requirement, which is estimated to be 84 SEK per meter per year. To benefit from this requirement, consumers need to change their behaviour. The cost or the value of a consumer to change its behaviour is estimated to be 10 SEK per meter per year. There is also cost for the regulator because contacts from consumers may increase. The estimated cost for the regulator is between 8 000 and 160 000 SEK per year. Given these quantified costs and benefits, registration of active energy for every hour or fifteen minutes has higher costs than benefits. However, it is believed that the costs of the technologies are going to decrease, and the unquantified benefits will contribute to increasing the efficiency in the whole society.
3 10 SEK ~= 0,97 Euro, November, 2018

352
2) Registration of power outages The meter should also be able to register data in the beginning and end of a power outage in one or more phases if the outage lasts three minutes or longer. This requirement gives more accurate information on outages. Therefore, it helps the customers to receive the right amount of compensation for the outage. More accurate information on outages can also help the DSO to monitor the network and eventually improve the reliability. It also helps the regulator to have better supervision on the reliability of the system. These benefits are difficult to quantify. However, this requirement does not imply extra cost for the meters if the function 1 would be in place. 3. Customer interface The meter should be equipped with a customer interface, supported by an open standard, for the customer to be able to take part of the measured values (see function no. 1) in near real time. The interface should only display these information after the customer’s request. The DSO must deactivate the interface when the customer moves out. Furthermore, it is not possible to send information from the customer through the interface. The requirement ensures the customers have access to the near real-time data. This increase the awareness of the customers on their electricity consumption. Electricity consumers can also use this information for decreasing the energy consumption and evaluating different electricity contracts which may lead to change supplier of electricity. The quantified benefit of visualizing the near real-time data lies in that the consumers reduce their consumption. If the reduction is around 5% per household and year, the benefit of having such requirement is about 173 SEK per household and year. The cost for a physical interface on the meter to fulfil the requirement is estimated to be between 20 and 50 SEK per meter. To see all the near real-time data, consumers need to invest in a display which can obtain the information through the interface. The cost of such a display is estimated to be between 200 and 1 000 SEK per meter. There is no other extra cost for the consumers or the regulator if the function 2 is in place. 4. Remote collection of measured data and power outages The DSO should be able to read the measured values (see function no. 1) and the outage information remotely (with remote control). This requirement is to promote efficient data collection. To read the measured values remotely reduces the personal cost. Furthermore, to automatically send the outage information also increases the accuracy of the outage information and reduces the workload of DSOs. In addition, the real-time measured values and the outage information are valuable for the network operation. There is no extra cost for implementing this requirement in the meters. It may increase the cost for the DSOs depending on their communication and reporting system. 5. Remote updating software, settings and control the power of the meter The DSO should be able to update software and change settings of the meter remotely. This requirement aims to reduce the costs for future updates of smart meters. With the development of smart meter, more requirements may be defined, and more security measures may need to be implemented. It also can decrease the operational costs if the field trip can be replaced by remote control. Each trip costs about 300 - 600 SEK. However, many current meters already have this function in place. The DSOs should also be able to turn on and off the power through the meter with remote control. This requirement only applies for meters that are not connected by current transformer. This requirement also aims to decrease the operational cost by avoiding the field trip. This function can be useful for the customers when they move out or in. It can potentially decrease the energy consumption during the moving out and in period.

353
There is no extra cost for implementing remote updating software and settings since most of the meters already have this function in place. The meters that are equipped with current transformer are exempted from this requirement, because it may lead to excessive costs. The cost for enabling turn on/off the meter remotely is estimated to be between 100 and 200 SEK per meter. But most of the existing meter already have such function in place. It is assumed that only 5%-20% of the meters need to be reinvested.
4. The cost of smart meters Ei determines a revenue cap for each DSO for a period of four years at a time. The revenue cap indicates the total amount that the DSO may charge their customers. The purpose of the revenue cap is that DSOs shall obtain reasonable coverage for their costs and reasonable return on the invested capital. The minimum functional requirements may increase the cost for smart meters. Therefore, it is important to consider how costs related to meters are handled in the revenue-cap regulation to facilitate the roll-out of the next generation smart meters. The current Swedish revenue cap regulation is described more in detail in [16]. There are both operating expenses (OPEX) and capital expenses (CAPEX) connected to meters. The OPEX can for example be affected by changes in the costs associated with reading and using meter data. Changing to more advanced meters can both increase and decrease OPEX. On the one hand, more data should be handled. IT security issues, more expensive software, more competence requirements etcetera will increase OPEX. On the other hand, better IT systems, more automation and more information from meter data possibly lead to more efficient operation in the distribution system. The OPEX part in the revenue cap regulation is based on the DSO’s actual historical OPEX with annual efficiency requirements of 1.00-1.82 % per year based on a data envelopment analysis (DEA). Hence, new meters do not change the OPEX part in the revenue cap, which means incentives for the DSOs to reduce its actual OPEX as much as possible. When the DSO invest or re-invest in a new component such as a meter, the CAPEX part of the revenue cap increases. Ei has a norm price list of component categories, so first the DSO must identify which component category that best fits the actual investment. The norm cost is then input to the CAPEX calculation. The CAPEX consists of two parts: return and depreciation. All meters have a regulatory depreciation time of ten years (for most other power system equipment the depreciation time is much longer). So, if the norm price for example is 10 000 SEK (~1 000 EUR), then the DSO would be compensated with 1 000 SEK/year (10 000/10) for ten years. The return part is based on the norm value, the age and the rate of return (a WACC method is used). If the meter in the example is seven years old, it has lost 60 % of its value (6 000 of 10 000 SEK, 1000 SEK/year depreciation for the first six years), which gives an age adjusted value of 4 000 SEK (10 000 – 6*1 000 SEK). The annual return is the equal to WACC*4 000 SEK. To dis-incentivize the DSO to replace well-functioning equipment, the depreciation time can be increased two years for meters (i.e. totally up to 12-year depreciation). The revenue cap regulation also includes incentive schemes based on several indicators for continue of supply, losses and for having a more even load. Smart meters can have indirect impact to help the DSO improve such indicators in a longer perspective. Ei has published papers in English, for example [16], which describe the revenue cap regulation in more details.

354
5. Smart meters in Sweden-- to be continued Sweden have around 5.4 million electricity meters in the low voltage network. The installation of new smart meters is expected to bring benefits both to the DSO and to the customers by for example supporting the development towards a smart grid by providing information that will enable new energy services and demand response. New regulations will be drafted by Ei to ensure the implementation of the minimum functional requirements that are stated in the ordinance. Reference [1] “Benchmarking report on the quality of electricity supply,” 5th CEER , 2011. [2] C. Wallnerström and L. Bertling, “Laws and regulations of Swedish power distribution systems 1996-
2012: learning from novel approaches such as less good experiences,” CIRED Workshop, 2010. [3] M.Larsson, “The network performance assessment model,” Royal Institute of Technology, 2005. [4] E. Grahn, L. Ström, K. Alvehag, C. J. Wallnerström and et.al, “Incentivizing continuity of supply in
Sweden,” 2016 13th International Conference on the European Energy Market (EEM), 2016. [5] G. Wigenborg, L. Öhling, C. Wallnerström and et.al, “Incentive scheme for efficient utilization of
electricity network in Sweden,” 2016 13th International Conference on the European Energy Market (EEM), 2016.
[6] Directive 2009/72/EC, 2009. [7] Directive 2012/27/EU of the European Parliament and of the Council of 25 October 2012 on energy
efficiency. [8] “Clean energy for all Europeans,” [Online]. Available: https://ec.europa.eu/energy/en/topics/energy-
strategy-and-energy-union/clean-energy-all-europeans. [9] [Online]. Available: http://governmentgazette.eu/?p=5540. [10] NordREG, “Common Nordic Metering Methods,” 2014. [11] USmart Consumer, “European smart metering landscape report,” 2016. [12] J. Nillson, J. Leymann and S. Näselius, “Uppföljning av timmätningsreformen (In Swedish),” 2014. [13] D. Norstede, S. Persson and T. Ny, “Funktionskrav på framtidens elmätare (in Swedish),”
Energimarknadsinspektionen, Eskilstuna, 2015. [14] EU, “Commission recommendation of 9 March 2012 on preparations for the roll-out of smart
metering systems (2012/148/EU),” Official Journal of the European Union, 2012. [15] D. Norstedt, S. Persson and T. Ny, “Funktionskrav på framtidens elmätare,” 2015. [16] C. J. Wallnerström, E. Grahn, T. Johansson and et.al, “The regulation of electricity network tariffs in
Sweden from 2016,” SAEE, 2016. [17] T. Solver, “Reliablity in performance-based regulation,” Royal Institute of Technology, 2005. [18] Electricity Act (1997:857) 5 kap. 7a§. [19] Energimarknadsinspektionen, “Smart metering and smart grids,” 2011.

355
ANALYTICAL INDEX

356

357
ANALYTICAL INDEX Abstracts index by Presenter
Ajanovic, Amela On the environmental benignity and the market prospects
of electric vehicles Amela Ajanovic, Reinhard Haas
103
Al-Otaibi, Mohammed The study of the impact of economic and population growth on energy consumption: a statistical approach Hamad M. Mudij, Mohammed AL-Otaibi
111
Alvarez, Cristian Optimality study of uplifts with a primal-dual solution approach for the Convex Hull Pricing problem Cristian Alvarez, Alejandro Angulo, Pablo Escalona
148
Amin, Sakib Can oil based power companies improve the household welfare in Bangladesh economy? a DSGE analysis Sakib Amin, Laura Marsiliani, Thomas Renstrom
109
Argentiero, Amedeo The measurement of unobserved economy through electricity demand Amedeo Argentiero, Simona Bigerna, Maria Chiara D’Errico, Silvia Micheli, Paolo Polinori
34
Arzoyan, Sergey Endogenous energy efficiency improvement of large-scale refurbishment in the Swiss residential building stock Sergey Arzoyan, Quirin Oberpriller, Marc Vielle, Michel Zimmermann
9
Azlina, Abd Aziz Energy demand and economic growth: panel data evidence from developing countries (ASEAN 4) Abd Aziz Azlina, Mahirah Kamaludin, Azilah Hasnisah
107
Bauknecht, Dierk Customer stratification and different concepts of decentralization Dierk Bauknecht, Joß Bracker, Franziska Flachsbarth, Christoph Heinemann, Dominik Seebach, Moritz Vogel
170
Belka, Maria Belt & Road initiative: Challenge or chance for the European energy security? Maria Belka
202
Bergland, Olvar
Dispatch Auction Designs and Arbitrage Strategies for Energy Storage Units Olvar Bergland
133
Bergland, Olvar Revealing Consumption Patterns from Meter Readings: a structural deep machine learning approach Olvar Bergland, Alan Love
151
Bertolini, Marina Playing on two markets: investment evaluation of a biogas – bio-methane power plant in a Smart Grid environment Marina Bertolini, Dimitrios Zormpas
20
Brown, Ryan T. Anticipatory Strategies for Eastern European Natural Gas Security Ryan T. Brown
201
Brown, Ryan T. Areva, EDF, and the Economic Viability of the Closed Fuel Cycle Ryan Timothy Brown
30

358
Burlinson, Andrew Distributed technologies in the energy markets: Welfare effects in legacy networks Andrew Burlinson, Anna Rita Bennato, Monica Giulietti
146
Buso, Marco Competition and Regulation with Smart Grids Marco Buso, Luciano Greco, Marina Bertolini
85
Canevese, Silvia BESS for Primary Frequency Regulation in Support of Thermal Power Plants Silvia Canevese, Antonio Gatti
135
Carrino, Gianluca Plastic to Fuel, an innovative solution for energy security Gianluca Carrino
90
Chamorro, José M. Physical adequacy in power generation: Spain beyond 2020 Luis María Abadie, José Manuel Chamorro
113
Chesser, Michael Fuel Poverty Measurements in America. Who are the Most Vulnerable? Michael Chesser, Jim Hanly, Damien Cassells
88
Concettini, Silvia Assessing the relevance of renewable generation localization through a spot market algorithm simulator: the case of Italy Silvia Concettini, Stanislao Gualdi, Anna Creti
125
de Selliers, Daisy Energy-Materials Nexus for a Low Carbon Energy System Daisy de Selliers, Catalina Spataru
92
Del Manso, Franco Vision 2050 - A pathway for the evolution of the refining industry and liquid fuels Franco Del Manso
116
Del Manso, Franco Impact of Euro 6 diesel passenger cars on urban air quality compliance in Italy Franco Del Manso
187
Dell’Olio Giuseppe
Heat cost allocation: an evaluation of benefits, on the basis of actual operation data Giuseppe Dell’Olio
7
Dimitrova, Monika Corporate renewable energy procurement through PPAs in the United States Matteo di Castelnuovo, Monika Dimitrova
127
Drachal, Krzysztof A comparison of various oil price forecasting methods with a large number of variables Krzysztof Drachal
175
Drożdż, Wojciech Prospects for the development of Polish electromobility Wojciech Drożdż, Jakub Dowejko
195
Ferrari, Giuseppe Towards renewable natural gas Giuseppe Ferrari, Iñigo del Guayo
47
Fumagalli, Elena Low-carbon electricity generation scenarios for Tanzania: implications for the country’s economy and the environment Elena Fumagalli, Matteo Rocco
23
Galdi, Raffaele The impact of electric vehicles on air quality related health costs Gabriele Grea, Raffaele Galdi
100
Gaoui, Adil Adil Gaoui, Brahim LekhlifThe impact of using green hydrogen on African countries’ energy independence
163

359
Giaccaria, Sergio Valuing (in) security of electricity supply: A discrete choice experiment for Estonia, the Netherlands and Portugal Sergio Giaccaria, Alberto Longo, Thijs Bouman, Tilemahos Efthimiadis
44
Haas, Reinhard Heading towards sustainable and democratic electricity system Reinhard Haas, Hans Auer
57
Henriques, Carla Carla Henriques, Patrícia Pereira da Silva, Nuno Figueiredo A proposal for assessing wind power systems in Europe
159
Herbes, Carsten Ready for the next step? The human capital of German renewable energy cooperatives’ management with a view to implementing new business models Carsten Herbes, Benedikt Rilling, Lars Holstenkamp
199
Huang, Yalin Smart meters in Sweden- lessons learned and new regulations Yalin Huang, Elin Grahn
180
Hwang, Sheng-Dih Determined a Reference Price by CO2 Abatement Cost for Window Films Sheng-Dih Hwang, Yu-Ching Huang
185
Ioannidis, Filippos Market design of an energy exchange: the case of Grecce Filippos Ioannidis, Kyriaki Kosmidou, Kostas Andriosopoulos
37
Kampelis, Nikolas Day-ahead demand management at microgrid level using Artificial Neural Network predictions and Genetic Algorithm optimisation Nikolas Kampelis, E. Tsekeri, D. Kolokotsa, K. Kalaitzakis, D. Isidori, C. Cristalli
168
Kangas, Hanna-Liisa Hanna-Liisa Kangas, Kimmo Ollikka, Kim Yukyeong Smart energy transition – technology convergence of renewable energy and ICT sectors
156
Kóczy, László Á. László Á. Kóczy, Dávid Csercsik, Balázs R. Sziklai A risk-based evaluation of European natural gas supply security – The case of Nordstream 2
144
Kokoni, Sophia An econometrics analysis of residential energy demand satisfied by heat pumps: lessons from international experience Sophia Kokoni
35
Kühnbach, Matthias Potentials and limitations of photovoltaic-based cellular energy systems in southern Germany Matthias Kühnbach, Stefan Pisula, Anke Eßer
182
Leite, da Silva André L. Switch and defer options in renewable energy projects: evidences from Brazil André Luis da Silva Leite, Luis Eduardo Nunes, Marcus Vinicius Lima
121
Li, Kun An intra-day analysis of electricity forward premia Kun Li
61
Manolkidis, Sotirios Regulating Energy Markets: The Experience of South Eastern Europe Sotirios Manolkidis
81
Mantulet, Gabin The future of technologies for mobility, a model based approach Gabin Mantulet, Silvana Mima, Adrien Bidaud
189

360
Maria Milousi, Evaluation of environmental and economic feasibility of Renewable Energy Systems; A stochastic life cycle assessment and cost analysis approach Maria Milousi, Manolis Souliotis, Emilios Galariotis, Spiros Papaefthimiou, Georgia Makridou
28
Mayer, Philip Development of dynamic scenarios: Depicting path dependencies and nonlinearities within storylines Philip Mayer, Stefan Vögele, Kristina Govorukha, Dirk Rübbelke
70
Merighi, Carolina Energy Technology, case of electric vehicles, why is it so hard to change course? Carolina Merighi
101
Mikkola, Jani Analysis of Energy System Resilience Under Wicked Socio-Environmental Disruptions – A Framework Jani Mikkola, Liinu Koskela, Peter D. Lund
97
Mima, Silvana China's gas demand in low carbon transition: implications for the international natural gas markets Silvana Mima, Catherine Locatelli, Olga Garanina
189
Moretto, Enrico Hedging rainfall exposure through hybrid financial instruments Silvana Stefani, Gleda Kutrolli, Enrico Moretto, Adeyemi Sonubi, Vanda Tulli
67
Morgenthaler, Simon Synthetic Natural Gas: an Option Complementing Renewable Energy and Supporting Decarbonisation? Simon Morgenthaler, Christopher Ball, Wilhelm Kuckshinrichs
47
Mori, Shunsuke An Assessment of Urban Energy Systems Focusing on the Cooling Energy Demand in Hot Summer Days by an Energy Network Model with 151 Subregions of Tokyo Koto Area Shunsuke Mori, Aya Kishimoto and Satoshi Ohnish
3
Motz, Alessandra The value of security for Swiss residential electricity consumers – a discrete choice analysis Alessandra Motz
32
Neves, Elisabete Financial performance assessment of electricity companies: evidence from Portugal Elisabete Neves, Carla Henriques, João Vilas
72
Olczak, Maria Decarbonising the Gas Sector: is Renewable Gas a Serious Option? Andris Piebalgs, Maria Olczak
51
Olczak, Maria Sector Coupling – the new EU Climate & Energy paradigm? Maria Olczak, Andris Piebalgs
83
Orlandini, Arnaldo Emergence and Consolidation of a Hybrid Paradigm in the European Gas Market: a Computational Simulation Arnaldo Orlandini, Meliyara Consuegra
17
Pavarini, Claudia Rising flexibility needs in the power sector and the growing role of energy storage in the World Energy Outlook Claudia Pavarini
138
Pelagatti, Matteo Trends and long-run relations in electricity prices: why prefiltering is inevitable Matteo Pelagatti, Angelica Gianfreda and Lucia Parisio
34
Petri, Marina Regulation and efficiency: which governance model for energy security after the Winter Package? Marina Petri
197

361
Petrovich, Beatrice Residential solar pv investment: the role of beauty, budget and risk Beatrice Petrovich, Stefanie Lena Hille, Stefano Carattini, Rolf Wüstenhagen, Robert Uberman, Saša Zikoviċ
11
Purica, Ionut
Big data analysis to seek climate change proof and its risk mitigation Ionut Purica
53
Romano, Eliot Real-time Carbon-emissions and consumer responsibility - a marginal approach for an open economy: The case of the Swiss Electricity Consumption Eliot Romano, Pierre Hollmuller, Martin K. Patel
26
Romeri, M. Valentino Consideration about Hydrogen and Fuel Cells in the Paris Agreement 1.5°C Perspective Mario Valentino Romeri
118
Samuel Carrara, Exploring pathways of solar PV learning in integrated assessment models Samuel Carrara, Michela Bevione, Harmen-Sytze de Boer, David Gernaat, Silvana Mima, Robert C. Pietzcker, Massimo Tavoni
41
Scalia, Francesco The energy performance contract (EPC) as an instrument of private public partnership for the energy requalification of public real estate assets Francesco Scalia
76
Schittekatte, Tim Distribution network tariffs and active consumers: a bi-level equilibrium modelling approach Tim Schittekatte, Leonardo Meeus
64
Schittekatte, Tim Limits of traditional distribution network tariff designs and options to move beyond Tim Schittekatte, Leonardo Meeus
172
Schröder, Thomas Value of electricity supply security: a case study for Germany Thomas Schröder
179
Shahzad, Jawad S. H. Time and frequency dynamics of connectedness between renewable energy stocks and crude oil prices Román Ferrer, Syed Jawad Hussain Shahzad, Raquel López, Francisco Jareñ
177
Shaw-Williams, D. Valuing the impact on network reliability of residential battery storage Damian Shaw-Williams, Connie Susilawati
131
Silvestri, Alessandro Current development and future potential of carsharing in Spain: insights from experts and users in-depth interviews Alessandro Silvestri, Sebastien Foudi, Ibon Galarraga
192
Sioshansi, Fereidoon
Behind and beyond the meter: How new BTM service options are disrupting utility business model Fereidoon P. Sioshansi
63
Soini, Vesa Determinants of Volatility Smile: the Case of Crude Oil Options Vesa Soini, Sindre Lorentzen
174
Sorrentino, Nicola Power Cloud: a framework to implement a “nonsumer” community Nicola Sorrentino, Daniele Menniti, Anna Pinnarelli
165

362
Squadrito, Gaetano The hydrogen production from RES impact on energy and fuel
markets Agatino Nicita, Gaetano Maggio, Antonio P.F. Andaloro, Gaetano Squadrito
129
Staffell, Iain Elecxit: The Impact of Barriers to Electricity Trade After Brexit Joachim Geske, Richard Green, Iain Staffell
153
Svec. Martin Division of powers between the EU and its member states: implications for energy security Martin Svec, Masaryk University
78
Sziklai, Balázs R. The geopolitical impact of Nord Stream 2 Balázs R. Sziklai, László Á. Kóczy, Dávid Csercsik
139
Uberman, Robert Development of LNG markets & its impact on valuation of natural gas resources in CEE countries Robert Uberman, Saša Zikoviċ
13
Vainio, Julia
The increase of renewable energy sources will change our energy security landscape – a look on the Baltic Sea Region states Julia Vainio
141
Veenman, Sietske How futures materialize: a case future frame of renewable energythe in Denmark Sietske Veenman, Karl Sperling
122

363
Papers index by Presenter
Dell’Olio Giuseppe
Heat cost allocation: an evaluation of benefits, on the basis of actual operation data Giuseppe Dell’Olio
207
Ferrari, Giuseppe Towards renewable natural gas, regulatory challenges Giuseppe Ferrari, Iñigo del Guayo
210
Henriques, Carla A proposal for assessing wind power systems in Europe Carla Henriques, Patrícia Pereira da Silva, Nuno Figueiredo
317
Huang, Yalin Smart meters in Sweden- lessons learned and new regulations Yalin Huang, Elin Grahn
344
Li, Kun An intra-day analysis of electricity forward premia Kun Li
242
Neves, Elisabete Financial performance assessment of electricity companies: evidence from Portugal Elisabete Neves, Carla Henriques, João Vilas
249
Olczak, Maria Decarbonising the Gas Sector: is Renewable Gas a Serious Option? Andris Piebalgs, Maria Olczak
220
Olczak, Maria Sector Coupling – the new EU Climate & Energy paradigm? Maria Olczak, Andris Piebalgs
285
Romeri, M. Valentino Consideration about Hydrogen and Fuel Cells in the Paris Agreement 1.5°C Perspective Mario Valentino Romeri
294
Scalia, Francesco The energy performance contract (EPC) as an instrument of private public partnership for the energy requalification of public real estate assets Francesco Scalia
271
Shaw-Williams, D. Valuing the impact on network reliability of residential battery storage Damian Shaw-Williams, Connie Susilawati
308
Soini, Vesa Determinants of Volatility Smile: the Case of Crude Oil Options Vesa Soini, Sindre Lorentzen
336

364