MAGNETIC FIELD RECONNECTION FROM FIRST PRINCIPLES TO LATEST RESULTS by Forrest Mozer

The End of the Line for a Brain-Damaged Model of Unilateral Neglect
Michael C. Mozer University of Colorado, Boulder
Peter W. Halligan Rivermead Rehabilitation Centre, Oxford, England
John C. Marshall The Radcliffe Infirmary, Oxford, England
Abstract
For more than a century, it has been known that damage to the right hemisphere of the brain can cause patients to be unaware of the contralesional side of space. This condition, known as unilateral neglect, represents a collection of clini- cally related spatial disorders characterized by the failure in free vision to respond, explore, or orient to stimuli predomi- nantly located on the side of space opposite the damaged hemisphere. Recent studies using the simple task of line bisec- tion, a conventional diagnostic test, have proven surprisingly revealing with respect to the spatial and attentional impair- ments involved in neglect. In line bisection, the patient is asked to mark the midpoint of a thin horizontal lie on a sheet of paper. Neglect patients generally transect far to the right of the center. Extensive studies of line bisection have been con- ducted, manipulating-among other factors-line length, ori- entation, and position. We have simulated the pattern of results using an existing computational model of visual perception and selective attention called MORSEL (Mozer, 1991). MORSEL has already been used to model data in a related disorder, neglect
INTRODUCTION
Neglect
Unilateral neglect or bemi-inattention describes a col- lection of behavioral symptoms in which patients appear to ignore, forget, or turn away from contralesional space (Heilman, Watson, & Valenstein, 1993). Neglect after right-sided lesions is more frequent, long lasting, and severe than after equivalent lesions of the left hemi- sphere. The disorder can compromise visual, auditory, tactile, and olfactory modalities and may involve per- sonal, peripersonal, extrapersonal, and “imaginal” space (Halligan & Marshall, 1993a). Unilateral neglect is far from a unitary phenomenon and has been shown to fractionate into a number of dissociable components in
dyslexia (Mozer & Behrmann, 1990). In this earlier work, MORSEL
was “lesioned” in accordance with the damage we suppose to have occurred in the brains of neglect patients. The same model and lesion can simulate the detailed pattern of perfor- mance on line bisection, including the following observations: (1) no consistent across-subject bias is found in normals; (2) transection displacements are proportional to line length in neglect patients; (3) variability of displacements is proportional to line length, in both normals and patients; (4) position of the lines with respect to the body or the page on which they are drawn has little effect; and (5) for lines drawn at different orientations, displacements are proportional to the cosine of the orientation angle. MORSEL fails to account for one obser- vation: across patients, the variability of displacements for a particular line length is roughly proportional to mean displace- ment. Nonetheless, the overall fit of the model is sufficiently good that we believe MORSEL can be used as a diagnostic tool to characterize the specific nature of a patient’s deficit, and thereby has potential down the line in therapy.
terms of sensory modality, spatial domain, laterality of response, motor output, and stimulus content (Barbieri & De Renzi, 1989). Furthermore, the lateralized behav- iors observed cannot be explained in terms of concomi- tant sensorimotor deficits because neglect is manifested in free vision and under conditions of testing that do not necessarily require the use of motorically impaired limbs. Visual neglect has been repeatedly shown to dou- ble dissociate from hemiplegia, hemianopia, and hemi- anesthesia. Furthermore, the lesions that produce neglect are not restricted to primary sensory or motor cortex.
Unlike many brain-injured patients who rapidly learn to compensate for a visual field deficit or plegia of the upper limb, patients with unilateral neglect often con-
0 1997 Massachusetts Institute of Technology Journal of Cognitive Neuroscience 9:2, pp. I71 - 190
tinue to behave as if one half of space has ceased to exist Computational Model ing of Neglect in any meaningful form (Mesulam, 1985). As a result, patients with neglect commonly collide with objects on the left side of space, fail to eat from the left side of the plate, and may dress only one side of the body. When copying or drawing, patients tend to confine their draw- ings to the right side of the page; the drawings them- selves often include adequate representations of the right side of the object with the left side either entirely omitted or grossly distorted.
A related condition, commonly found in association with recovery from florid neglect, is extinction. In ex- tinction, a patient can report seeing or feeling an object on the side opposite the brain damage when one stimu- lus is presented, but fails to detect the same stimulus when a second stimulus is simultaneously presented to the unaffected side. Extinction is regarded by some re- searchers (e.g., Heilman, Watson, & Valenstein, 1993) as a milder form of neglect that is revealed in the course of partial recovery.
Line Bisect ion
Of all the clinical tests used to diagnose visual neglect, asking the patient to divide a horizontal line at its mid- point is by far the simplest and most widely employed (Bisiach et al., 1983; Bisiach et al., 1976; Halligan & Mar- shall, 1988; Schenkenberg, Bradford, & Ajax, 1980; Tegner & Levander, 1991). As a clinical test, line bisection can be traced back some hundred years to the practice of the first clinicians who documented spatial asymmetries of perception in patients with unilateral brain damage (Axenfeld, 1915; Poppelreuter, 1917).
Typically in a line bisection task, patients are shown a thin line centered on a sheet of paper, which is centered with respect to the midsaggital plane. They are in- structed to mark the midpoint of the line with a rapid, ballistic movement. Patients with left-sided neglect be- have as if they have failed to notice the full left extent of the line, generally transecting the line far to the right of center. Performance can be quantified by measuring the transection displacement, the deviation of the pa- tient’s mark from the true center. We follow the conven- tion that a positive displacement is a shift to the right of center, indicating left neglect; a negative displacement is a shift to the left of center, indicating right neglect.
Halligan and Marshall have studied line bisection, ex- tensively manipulating line length (Halligan & Marshall, 1988, 1989c; Marshall & Hagan, l989,199Oa), orienta- tion (Burnett-Stuart, Halligan, & Marshall, 1991; Halligan & Marshall, 1993b; Marshall & Halligan, 1990b), position (Halligan & Marshall, 1989b; Marshall & Halligan, 1990a), and the context in which the line is embedded (Halligan, Manning, & Marshall, 1991; Halligan & Marshall, 1989a, 1991a; Manning, Halligan, & Marshall, 1990). All of these variables have been shown to have reliable effects on the measured severity of neglect.
We have replicated the pattern of results of neglect patients on the line bisection task in a computational model of two-dimensional object recognition and spatial attention (Mozer, 1991). The model, called MORSEL, was originally developed with two objectives in mind: (1) to build a computational mechanism that could analyze complex scenes consisting of multiple visual stimuli pre- sented simultaneously, and (2) to account for a broad spectrum of psychological data, including perceptual errors that arise when several stimuli appear simultane- ously in the visual field, facilitatory effects of context and redundant information, and attentional phenomena. The architecture and details of MORSEL arose from constraints imposed by these two objectives.
Mozer and Behrmann (1 990) “lesioned” MORSEL in ac- cordance with the damage that was hypothesized to occur in the brains of neglect patients. The lesioned model was then used to simulate some puzzling aspects of the performance of patients with neglect dyslexia-a reading disorder associated with neglect. For example, MORSEL could account for the data of Behrmann et al. (1990) indicating that patients, when shown a pair of words such as cow and sun, would generally report only the word on the right-a form of extinction. However, when the two words were related in that they could be combined to form a lexical item, e.g., cow and boy, extinction was less likely.
In the present work, we have used MORSEL, along with the lesion proposed in the earlier neglect modeling work, to simulate a set of findings on the line bisection task. The model, with no extensions or parameter adjust- ment, is successful in explaining a wide variety of effects. Interestingly, MORSEL makes an incorrect prediction for one minor aspect of the data, revealing a probable flaw in the model-most likely a technical, not conceptual, flaw. Nonetheless, the model makes interesting and test- able predictions, and has the potential to be used as a diagnostic tool to better characterize the specific nature of a patient’s deficit.
DESCRIPTION OF MORSEL
At this point, readers might wish for a detailed descrip tion of the data that we model. We ask the reader’s indulgence, however, and begin with an overview of MORSEL. Following this overview, we can then present the data side-by-side with simulation experiments. Readers who are not fully motivated now may wish first to skim the “Data and Simulation Accounts” section to get a sense for the results.
Input to MORSEL
MORSEL was designed primarily to model letter and word perception. In contrast to earlier models of word percep-
Volume 3, Number 2 I72 Journal of Cognitive Neuroscience
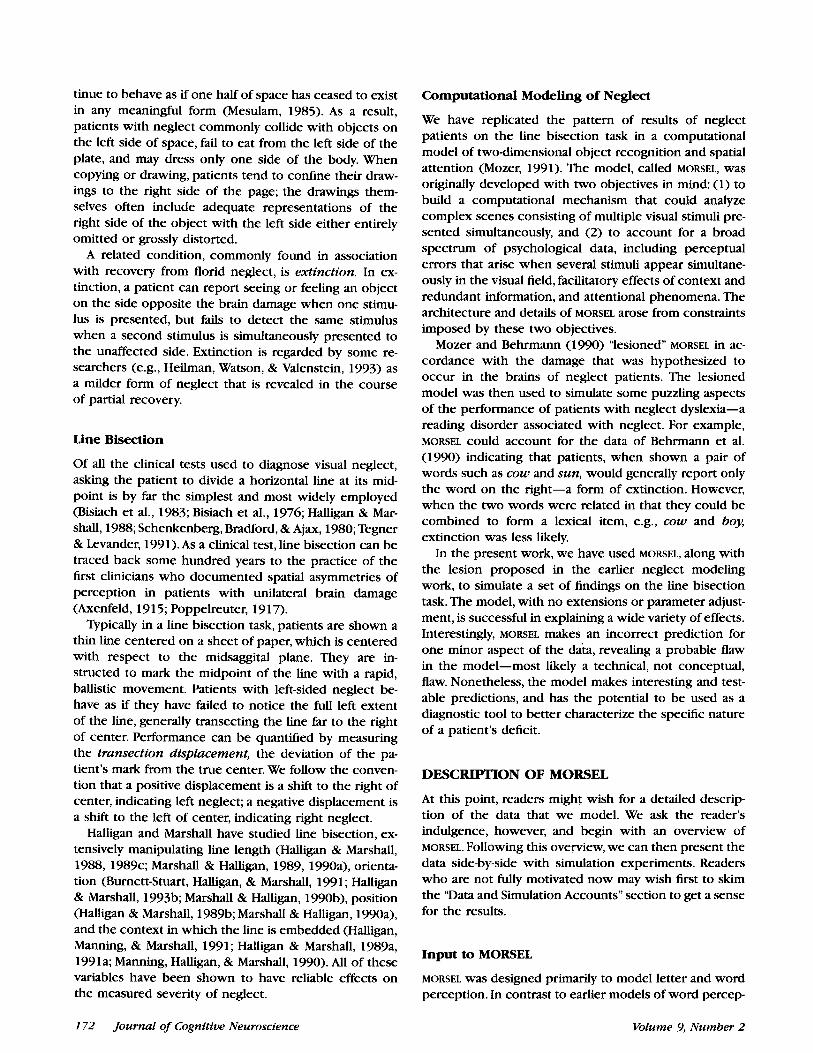
tion (e.g., McClelland & Rumelhart, 19Sl), MORSEL has the capability of processing several items simultaneously. MORSEL has a visual field or retina on which stimuli are presented. The retina is a 36 x 36 array of cells. In each cell is a set of five feature detectors. These detectors register, or become active in response to, the presence of certain features in their region of the retina. Four of the detectors register oriented lines and the fifth detec- tor registers the termination of a line. Figure 1 shows a sample input to MORSEL representing the phrase BAD ARTIST. Each letter produces a 3 x 3 pattern of activity on the retina. (Note that we show only as many rows of the retina as are necessary in our figures.)
This primitive activity pattern is interpreted by a con- nectionist network called BLIRNET, which attempts to ident@ the letters and words appearing on the retina.
P i g w e 1. The top m y shows the set of active feature detectors for a sample input, the phrase BAD ARTIST, presented on MORSEL'S ret. ina. The arrays below show activity by detector type. Each character in an array represents the activity of a single detector. The symbols -, /, 1, and \ correspond to the Oo, 45". 90". 135" line detectors, and the symbol o corresponds to line terminator detectors. A darkened symbol indicates that the detector is active.
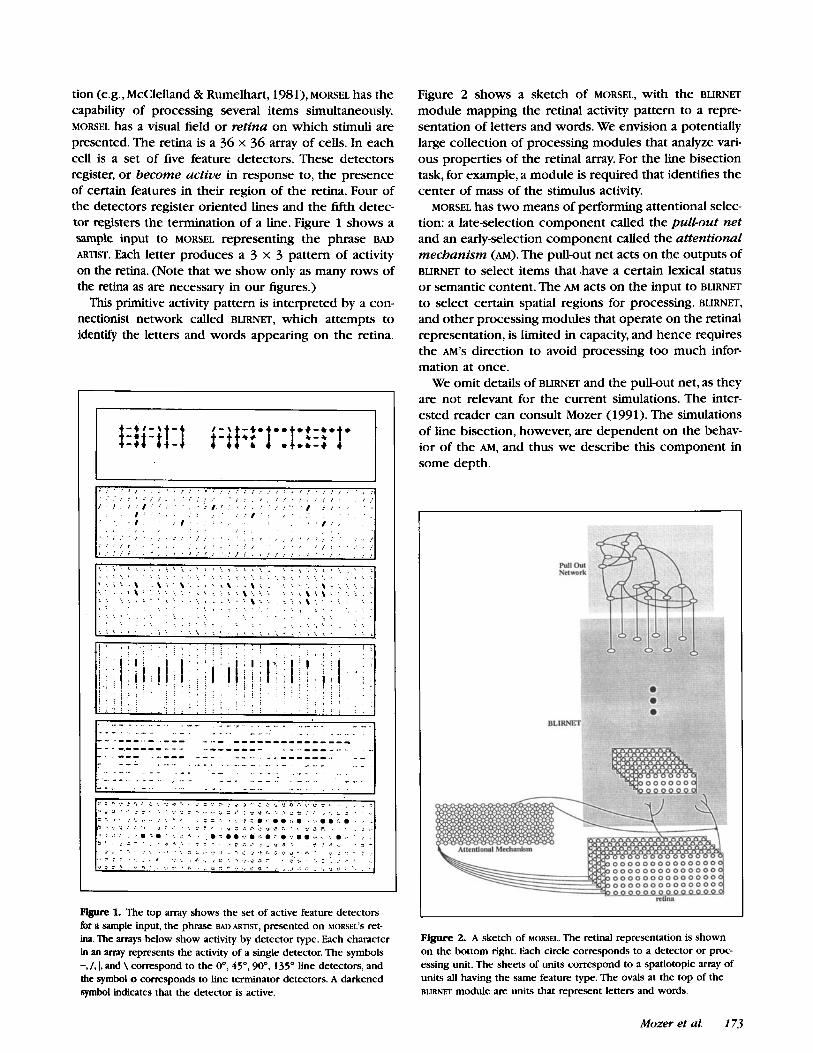
Figure 2 shows a sketch of MORSEL, with the BURNET module mapping the retinal activity pattern to a repre- sentation of letters and words. We envision a potentially large collection of processing modules that analyze vari- ous properties of the retinal array. For the line bisection task, for example, a module is required that identifies the center of mass of the stimulus activity.
MORSEL has two means of performing attentional selec- tion: a late-selection component called the pull-out net and an early-selection component called the attentional mechanism (AM). The pull-out net acts on the outputs of BLIRNET to select items that .have a certain lexical status or semantic content. The AM acts on the input to BURNET to select certain spatial regions for processing. BURNET, and other processing modules that operate on the retinal representation, is limited in capacity, and hence requires the AM'S direction to avoid processing too much infor- mation at once.
We omit details of BLIRNET and the pull-out net, as they are not relevant for the current simulations. The inter- ested reader can consult Mozer (1991). The simulations of line bisection, however, are dependent on the behav- ior of the AM, and thus we describe this component in some depth.
Figure 2. A sketch of MORSEL. The retinal representation is shown on the bottom right. Each circle corresponds to a detector or proc- essing unit. The sheets of units correspond to a spatiotopic m y of units all having the same feature type. The ovals at the top of the BURNET module are units that represent letters and words.
Mozer et al. 173

The Attentional Mechanism
The AM receives advice about where to focus from vari- ous sources, resolves conflicting suggestions, and then constructs a “spotlight” centered on the selected region of the retina. The attentional spotlight serves to enhance the activation of input features within its bounds relative to those outside. This causes preferential treatment in BURNET and other processing modules. However, the AM
does not act as an all-or-none filter. Information from unattended regions of the retina undergoes some de- gree of analysis by BLIRNET and other processing mod- ules. This partial processing of unattended information distinguishes the AM from other early-selection filtering mechanisms that have been proposed (e.g., Koch & Ullman, 1985; LaBerge & Brown, 1989), although this is not relevant in the current work.
The AM receives input about where to focus from two sources. First, attention can be guided in a bottom-up manner by stimulus information so as to bias selection toward locations where stimuli are actually present. The connections in Figure 2 from the retina into the AM
provide this input. Second, higher-levels of cognition can supply topdown control on the basis of task demands. For instance, if the task instructions are to report the left item in a multi-item display first, selection can be biased toward the left portion of the display initially; if the instructions are to read a page of text, a scanning mecha- nism can bias selection toward the topleft corner in- itially, and then advance left to right, top to bottom. (Butter, 1987 argues for a similar distinction between “reflex” and “voluntary” control of attention in humans.)
As shown in Figure 2, the AM is a set of units in one-to-one correspondence with the retinotopic feature maps serving as input to BURNIT. Activity in an AM unit indicates that attention is focused on the corresponding retinal location and serves to gate the flow of activity from the retina into BLIRNET and other processing mod- ules. Specifically, the activity level of a unit in a given location in the retinotopic array is transmitted to the processing modules with a probability that is monotoni- cally related to the activity of the AM unit in the corre- sponding array location. However, the AM serves only to bias processing: it does not absolutely inhibit activations from unattended regions, but these activations are trans- mitted with a lower probability.
Each unit in the AM gets bottom-up input from the detectors in the corresponding location in all of the feature maps, as well as an unspecified topdown input. The dynamics of the AM generate a single, contiguous region of activity over the retinotopic array, with a bias toward locations indicated by bottom-up and topdown inputs. Details of the AM selection process are provided in Appendix 1. Figure 3 shows an example of the AM in operation. Two blobs of activity are presented to the AM
via its external inputs, and the AM settles on the left blob.‘
Figure 3. An example of the AM selecting a single location. The top panel shows the external input to the AM, arranged in a twtdimen- sional grid. The area of each white square is proportional to the mag- nitude of the external input to that location on the grid; the black dots indicate AM grid locations that receive no input. The lower five panels show activity in the AM as it settles over time. The anta of each white square in these figures is proportional to the activity of the AM unit in the homologous position of the array. “Iteration” re- fers to the number of discrete time steps that have transpired.
Damaging MORSEL To Produce Neglect
To model data from neglect dyslexia, Mozer and Behrmann (1990) proposed a particular form of lesion to the model-damaging the bottom-up connections to the AM from the retinal feature arrays. The damage is graded monotonically, most severe at the left extreme of the retina and least severe at the right (assuming a right hemisphere lesion, as we will throughout this article). Figure 4 depicts the damaged connections into the AM. The graded damage is important; Mozer and Behrmann achieved what might be interpreted as object-based ne- glect via the graded damage. Complete destruction of the connections in the left field and fully intact connec- tions in the right field would yield a qualitatively differ- ent sort of behavior. It is also important to contrast this proposal for lesioning the model with two alternatives. First, one might damage the visual recognition system (BURNET) itself. However, this would lead to blindness, and is inconsistent with the view of neglect as an atten- tional phenomenon and with the neuroanatomical lesion
I74 Journal of Cognitive Neuroscience Volume 9, Number 2

I I
Figure 4. A sketch of the AM and some of its inputs from MORSEL'S
retina. Each detector on the retina connects to the homologous unit in the AM. In neglect, we propose that there is graded damage to these connections, causing retinal detectors to be less effective in ac- tivating the AM. The damage is depicted by the fainter connections t@ ward the left side of the field.
sites that give rise to neglect. Second, one might lesion the AM directly, either changing the activation dynamics or connectivity of the units such that damaged units integrated activity more slowly or had a weakened influence on the activity of other units. We conjecture that these types of lesions would yield a behavioral effect similar to the proposed lesion for the simulation studies reported in this article.
The damage affects the probability that features pre- sent on the retina are detected by the AM. To the extent that features in a given location are not detected, the AM
will fail to focus attention at that location. Note that this is not a "perceptual" deficit, in the sense that if somehow attention can be mustered, features will be analyzed normally by BLIRNET and other processing modules.
Mozer and Behrmann (1990) showed that this form of damage was compatible with early, peripheral effects observed in neglect dyslexia because the disruption di- rectly affects a low-level representation. However, the damage was also compatible with late, higher-order ef- fects in neglect dyslexia by virtue of the fact that the pull-out net is able to reconstruct elements of a string- via lexical and semantic knowledge-that are attenuated by the AM.
MODELING LINE BISECTION
Line bisection is a simple cognitive task; it does not require visual object recognition and does not invoke higher-order knowledge. For this reason, much of MORSEL, which deals with shape recognition and the topdown influence of semantic and lexical knowledge, is irrele- vant. Only the early-selection attentional system-the AM-is pertinent. Thus, in terms of MORSEL, line bisection is an extremely pure and primitive cognitive task.
In brief, we model the line bisection task by present- ing the line stimulus on the retina, allowing the AM to settle, and then supposing a motor process that places
the transection point at the center of the attended re- gion. We assume that the motor process thus veridically bisects the attended region; there is no motor neglect or motor bias.
S t i m u l i
Figure 5 shows the representation we constructed for a line stimulus appearing on MORSEL'S retina. The line is made up of two rows of horizontal segments with ter- minators at the extremities.2
The number of features active in a given cell of MOR- SEL'S retina determines the amount of input fed to the corresponding cell of the AM. Figure 6 shows the exter- nal input to the unlesioned AM for line stimuli of varying lengths, and Figure 7 shows the external input €or line stimuli of various orientations.
To establish a correspondence between distances on the retina and physical distances in the world, we arbi- trarily assume that each cell of the retina corresponds to an 8.47 mm (= 1/3 in) distance in the stimulus display. Consequently, the line lengths of 3 to 33 cells, depicted in Figure 6, correspond to stimulus lines of 25 to 279 mm.
k S i O l l h g MORSEL
All parameters and details of MORSEL-including connec- tion strengths, interconnectivity patterns, and time con- stants-were left unchanged from the earlier work of Mozer (1991) and Mozer and Behrmann (1990). How-
I, 1
. . . . .. ~ _. . I "., - - . . , " ......,, ; . . . . . . . - * . , " . . . . I . . . . . _ )
Figure 5. The pattern of feature activity produced by a line on MOR-
SEL'S retina.
Mozer et al. I75

Figure 6. External input to the unlesioned AM for line stimuli of varying lengths. The size of a white square is proportional to the magnitude of the external input. The black dots indicate AM grid loca- tions that receive no external input. Because both horizontal and ter- minator detectors are active at the endpoints of a line, external input is twice as large at the endpoint locations. Note that a feature at a given location on the retina provides input not just to the corre- sponding location on the AM but also provides a small amount of in- put to adjacent locations. This spillover results in the halo around the stimulus locations.
ever, MORSEL has several remaining degrees of freedom that relate to the nature of the attentional deficit, which presumably differs from patient to patient.
Specifically, four parameters determine a function re- lating the horizontal position of a feature on MORSEL’S retina to the probability that the feature wiU be tmsmit- ted to the corresponding cell of the AM. This function is shown in Figure 8. It is a piecewise linear curve with a flat segment, followed by a segment with positive slope,
Figure 7. External input to the unlesioned AM for line stimuli of various orientations.
curve represents the left edge of the retina, the right extreme of the curve represents the right edge of the retina. The probability that the AM will register a feature is low in the left field, and it is monotonically non-
followed by another flat segment. The left extreme of the decreasing further to the right.
Figure 8. The transmission probability curve representing the damage to the attentional system is MORSEL. This function relates the position of a fea- ture on MORSEL’S retina to the probability that the feature will be detected by the corre- sponding cell of the m.The function is for a left neglect patient; the probability that the AM will register a feature is low in the left field, and it is monotonically nondecreas ing further to the right.
transmlsslon probablllty
’ I =twation .. . . . . . . . . . . . . . . . . . . . . . . . . . . . . . . . . . . . . . .. . . . . . . . . . . ..... . . . . . . . . . . . . . . .. . . probability I
ien fixation right retinal position satuktion position
Volume 9, Number 2 I76 Journal of Cognitive Neuroscience
The curve is characterized by four parameters: (1) the probability of feature transmission on the right end of the retina (saturation probability), (2 ) the horizontal position on the retina where the probability reaches asymptote (saturation position), (3) the minimum trans- mission probability (minimum probability), and (4) the slope of the curve (gradient). Mozer and Behrmann (1990) used this same general type of curve, without the explicit parameterization, in their earlier neglect simula- tions. The basic notion of an attentional gradient is due to Kinsbourne (1993). The parameterization of the curve allows a variety of transmission functions, including forms corresponding to normals (e.g., a minimum prob- ability close to 1 and a gradient of O) , a homogeneous slope across the entire field (e.g., a shallow gradient and a saturation position at the far right edge), and a sharp discontinuity at the hemifield crossing (a very large gradient and a saturation position just to the right of fixation).
This curve representing damage is cleaner and sharper than one would expect from a biological system. Mini- mally, it should be curvilinear with no discontinuities in slope. However, minor changes to the form of the curve have little effect on the model’s behavior, and the para- meterization of curve is quite flexible in that it allows a wide variety of possible forms of damage.
It turns out that the behavior of the AM is robust over various transmission probability curves, except when extreme values of the parameters are selected. Interest- ingly, some sets of parameters do lead to odd and incor- rect predictions. This does not invalidate MORSEL, but rather places constraints on the range of parameter val- ues and their interrelationships that can occur in pa- tients. This in itself is a useful contribution of the modeling effort. We say more about this issue below.
Rather than picking a single set of parameters some- what arbitrarily, the simulations reported below ex- plored a collection of parameter sets. Because each patient presumably has a slightly different form of deficit, and because we are modeling mean performance across patients, it seems sensible to construct an ensemble of lesioned models, each with a slightly different transmis- sion probability curve. Our ensemble was formed by considering saturation probabilities of .9 or 1.0, gradi- ents of .01 or .02, saturation positions of 50%, 75%, or 100% from the left edge of the retina, and minimum probabilities of .2 or .4. The Cartesian product of these parameter values was formed, yielding 24 different trans- mission probability curves.
In most of our simulations, we modeled 10 replica- tions of each of the 24 transmission probability curves, yielding a total of 240 simulated patients. The results reported below are means over these simulated patients. Except where otherwise noted, we ran 10 trials per simulated patient per condition. This is the amount of data collected on real patients in the corresponding studies.
Methodology
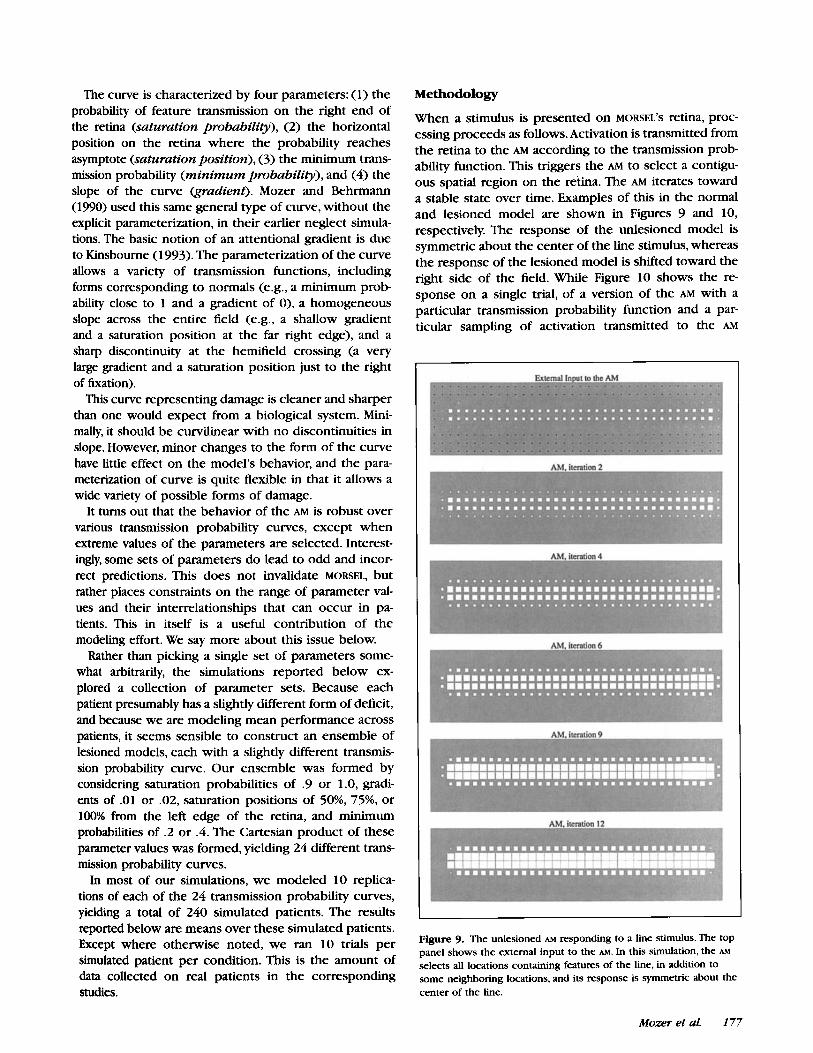
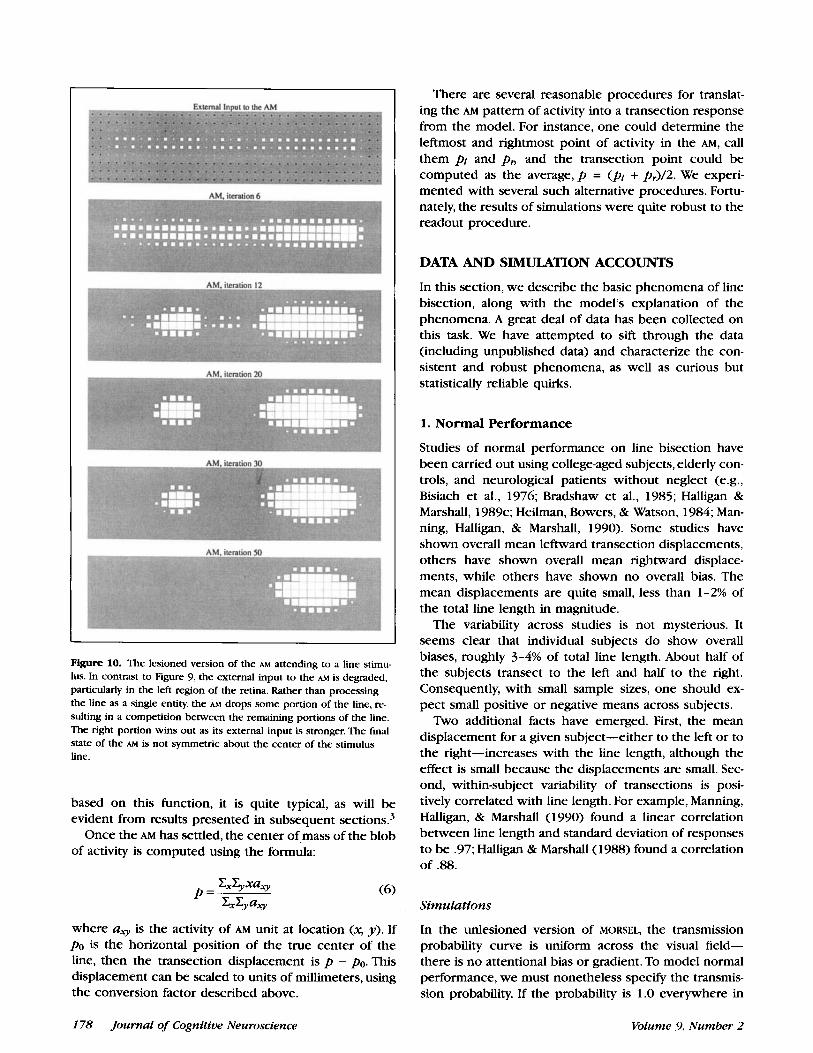
When a stimulus is presented on MORSEL’S retina, proc- essing proceeds as follows. Activation is transmitted from the retina to the AM according to the transmission prob- ability function. This triggers the AM to select a contigu- ous spatial region on the retina. The AM iterates toward a stable state over time. Examples of this in the normal and lesioned model are shown in Figures 9 and 10, respectively. The response of the unlesioned model is symmetric about the center of the line stimulus, whereas the response of the lesioned model is shifted toward the right side of the field. While Figure 10 shows the re- sponse on a single trial, of a version of the AM with a particular transmission probability function and a par- ticular sampling of activation transmitted to the AM
Figure 9. The unlesioned MI responding to a line stimulus. The top panel shows the external input to the MI. In this simulation, the MI
selects all locations containing features of the l i e , in addition to some neighboring locations, and its response is symmetric about the center of the line.
Mozer et al. 177
There are several reasonable procedures for translat- ing the AM pattern of activity into a transection response from the model. For instance, one could determine the leftmost and rightmost point of activity in the AM, call them PI and pn and the transection point could be computed as the average, p = (PI + pr)/2. We experi- mented with several such alternative procedures. Fortu- nately, the results of simulations were quite robust to the readout procedure.
DATA AND SIMULATION ACCOUNTS
In this section, we describe the basic phenomena of line bisection, along with the model's explanation of the phenomena. A great deal of data has been collected on this task. We have attempted to sift through the data (including unpublished data) and characterize the con- sistent and robust phenomena, as well as curious but statistically reliable quirks.
Figure 10. The lesioned version of the AM attending to a line stimu- lus. In contrast to Figure 9, the external input to the AM is degraded, particularly in the left region of the retina. Rather than processing the line as a single entity, the AM drops some portion of the line, re- sulting in a competition between the remaining portions of the line. The right portion wins out as its external input is stronger. The final state of the AM is not symmetric about the center of the stimulus line.
based on this function, it is quite typical, as will be evident from results presented in subsequent sectiom3
Once the AM has settled, the center of mass of the blob of activity is computed using the formula:
where aq is the activity of AM unit at location (x, y). If PO is the horizontal position of the true center of the line, then the transection displacement is p - PO. This displacement can be scaled to units of millimeters, using the conversion factor described above.
1. Normal Performance
Studies of normal performance on line bisection have been carried out using college-aged subjects, elderly con- trols, and neurological patients without neglect (e.g., Bisiach et al., 1976; Bradshaw et al., 1985; Halligan & Marshall, 1989~; Heilman, Bowers, & Watson, 1984; Man- ning, Halligan, & Marshall, 1990). Some studies have shown overall mean leftward transection displacements, others have shown overall mean rightward displace- ments, while others have shown no overall bias. The mean displacements are quite small, less than 1-2'36 of the total line length in magnitude.
The variability across studies is not mysterious. It seems clear that individual subjects do show overall biases, roughly 3-4% of total line length. About half of the subjects transect to the left and half to the right. Consequently, with small sample sizes, one should ex- pect small positive or negative means across subjects. Two additional facts have emerged. First, the mean
displacement for a given subject-either to the left or to the right-increases with the line length, although the effect is small because the displacements are small. Sec- ond, within-subject variability of transections is posi- tively correlated with line length. For example, Manning, Halligan, & Marshall (1990) found a linear correlation between line length and standard deviation of responses to be .97; Halligan & Marshall (1988) found a correlation of .88.
Simulations
In the unlesioned version of MORSEL, the transmission probability curve is uniform across the visual field- there is no attentional bias or gradient. To model normal performance, we must nonetheless specify the transmis- sion probability. If the probability is 1.0 everywhere in
178 Journal of Cognitive Neuroscience Volume 9, Number 2
the field, then the model will always select all features of the line (see Fig. 9) and will thus always bisect the line correctly. Some noise must be introduced into per- formance to model the variability among normals. One way to do this would be to assume noise in the motor response process, but it is also possible to introduce noise in perception by setting the transmission prob- ability to, say, .9 uniformly across the field. (Mozer, 1991 also used a transmission probability of .9 to model nor- mals.)
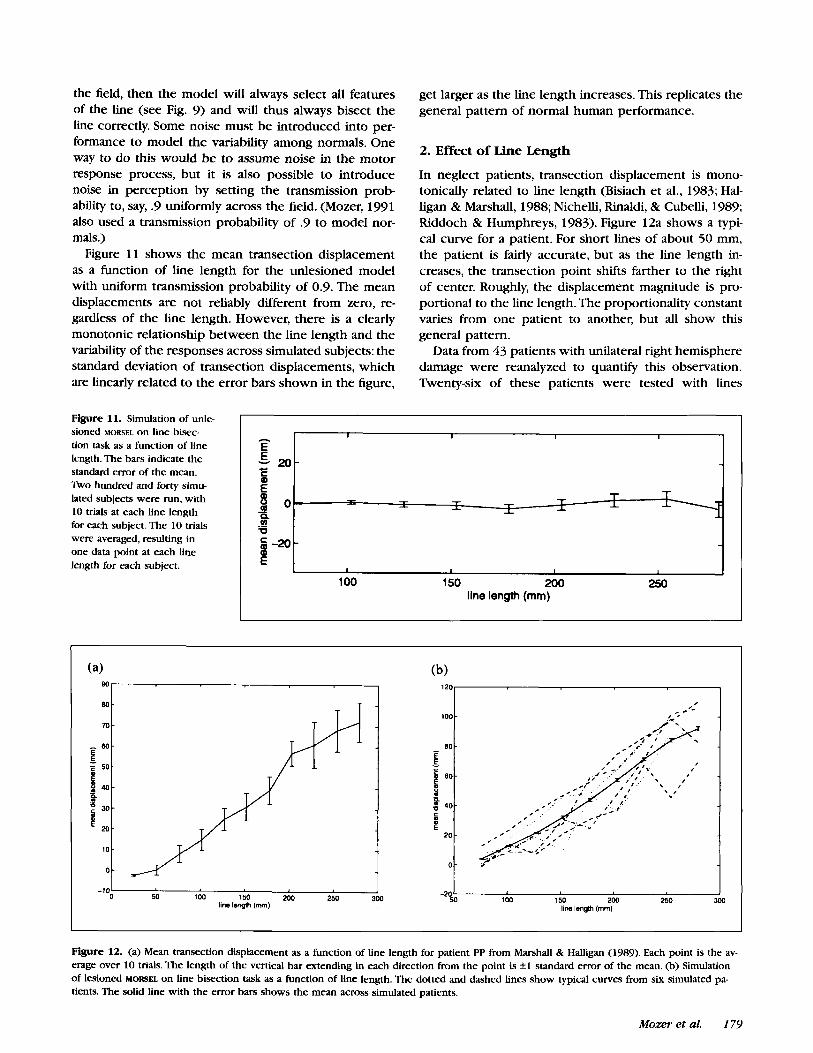
Figure 11 shows the mean transection displacement as a function of line length for the unlesioned model with uniform transmission probability of 0.9. The mean displacements are not reliably different from zero, re- gardless of the line length. However, there is a clearly monotonic relationship between the line length and the variability of the responses across simulated subjects: the standard deviation of transection displacements, which are linearly related to the error bars shown in the figure,
A
E E - 20- c c i! 0 0 3 5-20- a
E
Figure 11. Simulation of unle- sioned MORSEL on line bisec- tion task as a function of line length. The bars indicate the standard error of the mean. ' h o hundred and forty simu- lated subjects were run, with 10 trials at each line length for each subject. The 10 trials were averaged, resulting in one data point at each line length for each subject.
I I I I
T r - -.- T T & -L T I I
get larger as the line length increases. This replicates the general pattern of normal human performance.
E S-"t
2. Effect of Line Length
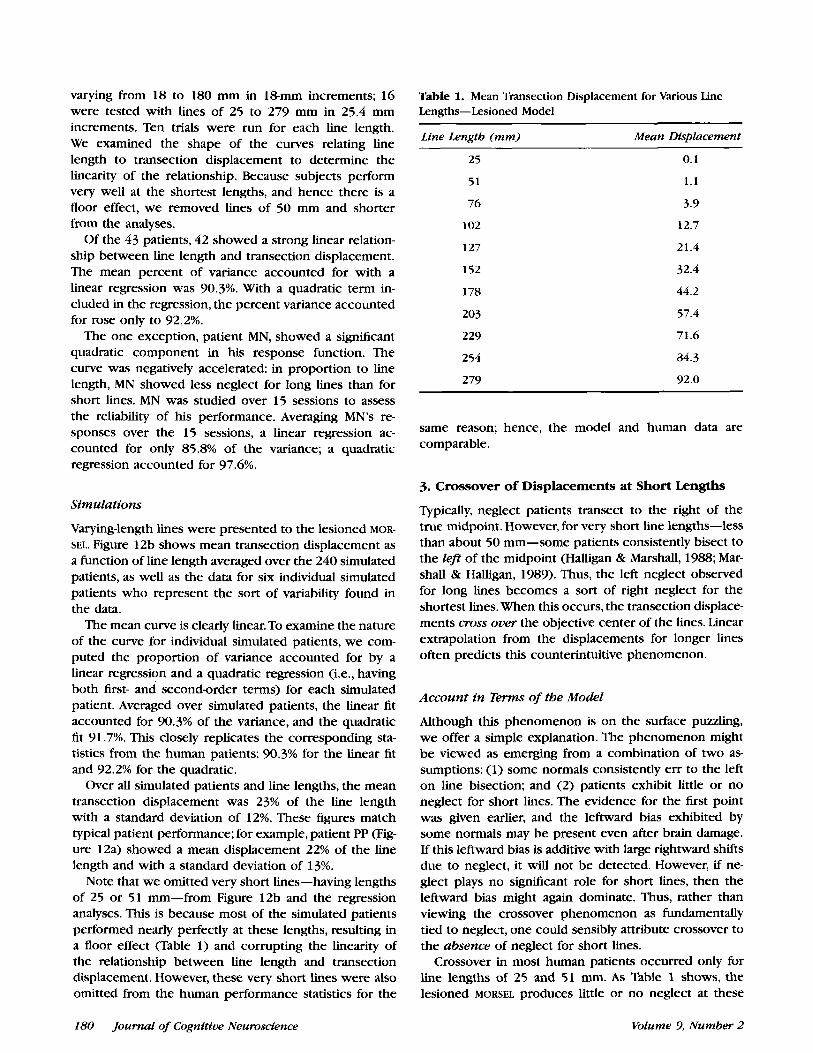
In neglect patients, transection displacement is mono- tonically related to line length (Bisiach et al., 1983; Hal- ligan & Marshall, 1988; Nichelli, Rinaldi, & Cubelli, 1989; Riddoch & Humphreys, 1983). Figure 12a shows a typi- cal curve for a patient. For short lines of about 50 mm, the patient is fairly accurate, but as the line length in- creases, the transection point shifts farther to the right of center. Roughly, the displacement magnitude is pro- portional to the line length. The proportionality constant varies from one patient to another, but all show this general pattern.
Data from 43 patients with unilateral right hemisphere damage were reanalyzed to quantlfy this observation. 'Ibventy-six of these patients were tested with lines
8 0 -
70
- P E H 40-
z 30- E 20-
- 5 0 -
P
10
0 -
-
-
g 3 a
1 I I I
100 150 200 250 line length (mm)
J 50 100 150 200 250 300
-10;
line lsqth (mm) 100 150 200 250 300
-20 50
line lmpm (mm)
Figure 12. (a) Mean transection displacement as a function of line length for patient PP from Marshall & Halligan (1989). Each point is the av- erage over 10 trials. The length of the vertical bar extending in each direction from the point is +1 standard error of the mean. (b) Simulation of lesioned MORSEL on line bisection task as a function of line length. The dotted and dashed lines show typical curves from six simulated pa- tients. The solid line with the error bars shows the mean across simulated patients.
Mozer et al. I79
varying from 18 to 180 mm in l&mm increments; 16 were tested with lines of 25 to 279 mm in 25.4 mm increments. Ten trials were run for each line length. We examined the shape of the curves relating line length to transection displacement to determine the linearity of the relationship. Because subjects perform very well at the shortest lengths, and hence there is a floor effect, we removed lines of 50 mm and shorter from the analyses.
Of the 43 patients, 42 showed a strong linear relation- ship between line length and transection displacement. The mean percent of variance accounted for with a linear regression was 90.3%. With a quadratic term in- cluded in the regression, the percent variance accounted for rose only to 92.2%.
The one exception, patient MN, showed a significant quadratic component in his response function. The curve was negatively accelerated: in proportion to line length, MN showed less neglect for long lines than for short lines. MN was studied over 15 sessions to assess the reliability of his performance. Averaging MN’s re- sponses over the 15 sessions, a linear regression ac- counted for only 85.8% of the variance; a quadratic regression accounted for 97.6%.
Simulations
Varying-length lines were presented to the lesioned MOR- SEL. Figure 12b shows mean transection displacement as a b c t i o n of line length averaged over the 240 simulated patients, as well as the data for six individual simulated patients who represent the sort of variability found in the data.
The mean curve is clearly linear. To examine the nature of the curve for individual simulated patients, we com- puted the proportion of variance accounted for by a linear regression and a quadratic regression (i.e., having both first- and second-order terms) for each simulated patient. Averaged over simulated patients, the linear fit accounted for 90.3% of the variance, and the quadratic fit 91.7%. This closely replicates the corresponding sta- tistics from the human patients: 90.3% for the linear fit and 92.2% for the quadratic.
Over all simulated patients and line lengths, the mean transection displacement was 23% of the line length with a standard deviation of 12%. These figures match typical patient performance; for example, patient PP (Fig- ure 12a) showed a mean displacement 22% of the line length and with a standard deviation of 13%.
Note that we omitted very short lines-having lengths of 25 or 51 mm-from Figure 12b and the regression analyses. This is because most of the simulated patients performed nearly perfectly at these lengths, resulting in a floor effect (Table 1) and corrupting the linearity of the relationship between line length and transection displacement. However, these very short lines were also omitted from the human performance statistics for the
Table 1. Mean Transection Displacement for Various Line Lengths-Lesioned Model
Line Length (mm) Mean Displacement
25
51
76
102
127
152
178
203
229
254
279
0.1
1 . 1
3.9
12.7
21.4
32.4
44.2
57.4
71.6
84.3
92.0
same reason; hence, the model and human data are comparable.
3. Crossover of Displacements at Short Lengths
“ypically, neglect patients transect to the right of the true midpoint. However, for very short line lengths-less than about 50 mm-some patients consistently bisect to the left of the midpoint (Halligan & Marshall, 1988; Mar- shall & Halligan, 1989). Thus, the left neglect observed for long lines becomes a sort of right neglect for the shortest lines. When this occurs, the transection displace- ments moss ouer the objective center of the lines. Linear extrapolation from the displacements for longer lines often predicts this counterintuitive phenomenon.
Account in Terms of the Model
Although this phenomenon is on the surface puzzling, we offer a simple explanation. The phenomenon might be viewed as emerging from a combination of two as- sumptions: (1) some normals consistently err to the left on line bisection; and (2) patients exhibit little or no neglect for short lines. The evidence for the first point was given earlier, and the leftward bias exhibited by some normals may be present even after brain damage. If this leftward bias is additive with large rightward shifts due to neglect, it will not be detected. However, if ne- glect plays no sigmficant role for short lines, then the leftward bias might again dominate. Thus, rather than viewing the crossover phenomenon as fundamentally tied to neglect, one could sensibly attribute crossover to the absence of neglect for short lines.
Crossover in most human patients occurred only for line lengths of 25 and 51 mm. As Table 1 shows, the lesioned MORSEL produces little or no neglect at these
180 Journal of Cognitive Neuroscience Volume 9, Number 2
line lengths, allowing even a slight leftward bias to push the responses to the left of the midpoint.
To quantlfy this argument, consider the combination of two independent influences on performance: left ne- glect which causes deviations to the right of the mid- point that are proportional to line length, and a fixed bias to deviate to the left of the midpoint for all line lengths. One can express this mathematically as
d = .5nl- b
where d is the observed transection displacement, 1 is the line length, n quantifies the severity of neglect (0 = none, 1 = complete), and b is the fixed leftward bias. When the line length is sufficiently short, the contribu- tion of the first term will be overwhelmed by the fixed leftward bias, and the displacement will end up negative, i.e., to the left of the midpoint.
Note that we make no assumptions concerning what system or systems produce the leftward bias. It is unre- lated to brain damage, as normals exhibit these same biases. It could stem from perceptual, motor, or perhaps even spatial reasoning systems.
4. Response Variation as a Function of Line Length
At each line length, experimenters typically collect mul- tiple responses from patients. The responses are aver- aged to factor out some sources of variability in performance. However, this variability is itself interesting. One can quantlfy the variability as the standard deviation of transection displacements over the trials for a given line length. This standard deviation tends to be propor-
tional to line length. For example, patient AL was tested over six sessions and correlations between standard de- viations and line length ranged from .55 to .89 (Halligan & Marshall, 1991b). Patients DF, MN, CC, BS, TB, EF, TR, and TM, reported in Halligan and Marshall (1993b), had correlations of .88, .94, .64, 36, .89, 9 2 , .92, and .92, respectively. Patient PP’s correlation was .93 (Marshall & Halligan, 1989; see Figure 12a). Patients PB (Halligan & Marshall, 1988), JH, and PS (Halligan & Marshall, 1989c) showed correlations of 234, .84, and .76, respectively.
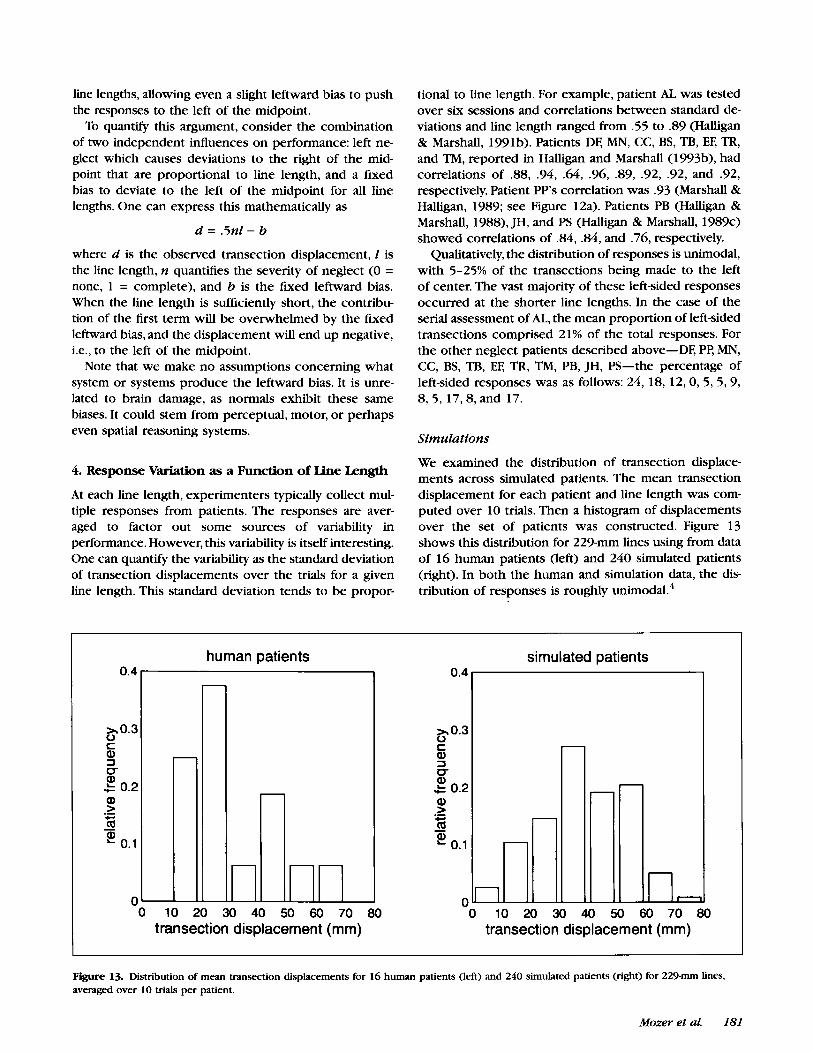
Qualitatively, the distribution of responses is unimodal, with 5-25% of the transections being made to the left of center. The vast majority of these left-sided responses occurred at the shorter line lengths. In the case of the serial assessment of AL, the mean proportion of left-sided transections comprised 21% of the total responses. For the other neglect patients described above-DF, PP, MN, CC, BS, TB, EE TR, TM, PB, JH, PS-the percentage of left-sided responses was as follows: 24, 18, 12,0,5, 5,9, 8, 5, 17,8, and 17.
Simulations
We examined the distribution of transection displace- ments across simulated patients. The mean transection displacement for each patient and line length was com- puted over 10 trials. Then a histogram of displacements over the set of patients was constructed. Figure 13 shows this distribution for 229-mm lines using from data of 16 human patients (left) and 240 simulated patients (right),. In both the human and simulation data, the dis- tribution of responses is roughly unimodaL4
human patients I 0.4 0.4 I
)r 0.3 0 c a, 3 U a, t 0.2
simulated patients
0 10 20 30 40 50 60 70 80 0 10 20 30 40 50 60 70 80 transection displacement (mm) transection displacement (mm)
Figure 13. Distribution of mean transection displacements for 16 human patients (left) and 240 simulated patients (right) for 2 2 9 m lines, averaged over 10 trials per patient.
Mozer et al. 181

The correlation coefficient between line length and standard deviation of transection displacements was computed for each simulated patient. Line lengths of 25 and 51 mm were included in these simulations because they were also used to compute the human patient correlations.
A mean correlation of .58 was obtained for the 240 simulated patients. This is perhaps lower than the corre- lations reported for humans (in the range .55-.95), but clearly nonzero and of the correct sign.5
5. Response Variation as a Function of Displacement
In the previous section, we characterized the variability of responses as a function of the length of lines. One can also consider the variability of responses as a function of mean displacement, for a given line length. Roughly, the standard deviation of transection displacements is proportional to the displacement: if a subject accurately bisects a line on average, then the variation from one attempt to the next will tend to be small; however, if the subject makes large rightward displacements, then the variability is generally larger. To quantify this effect, we reanalyzed the data of 20 patients transecting 180-mm lines, with 10 trials per patient. The correlation between mean displacement and standard deviation of the dis- placements was .5 1.
Simulations
For a particular line length, we examined the relation between a simulated patient's mean transection displace- ment and the variability of the responses that consti- tuted this mean. While the human patients showed a positive correlation, the simulated patients showed ex-
actly the opposite pattern. For example, with 177-mm lines, the correlation was -.84, indicating that patients who produced larger displacements tended to show less variability in their responses. MORSEL thus fails to model this aspect of the data.
While it would be extremely difficult to point to a specific component of MORSEL that is responsible for this failure, it is possible to describe a general characteristic that the model appears to possess, and how this charac- teristic is responsible for producing the observed simu- lation data.
Neglect in MORSEL corresponds to the failure of fea- tures registered on the retina to be detected by the AM,
specifically features of the left side of the stimulus. The severity of neglect will be related to the degree to which the AM fails to detect the presence of these features. This is depicted schematically in the two graphs of Figure 14. Both graphs show the expected transection displace- ment as a function of the proportion of features on the left side of the retina that are successfully transmitted to the AM. When all features are transmitted, there will be no neglect, and the transection displacement will be zero; when the AM fails to detect features on the left side of the retina, transection displacements will be large. Thus, there should be a monotonic relationship between feature transmission probability and transection displace- ments. However, the relationship can be either nega- tively or positively accelerated, corresponding to the left and right curves in the figure, respectively.
For a particular lesion to MORSEL, the exact set and number of features transmitted to the AM on any trial will vary. This is because the operation of feature transmis- sion is based on probability (see Fig. 8). Consequently, a particular lesion will produce a range of different values along the x-axis of the curves in Figure 14, as depicted by the two dotted vertical lines. This range in feature
proportion of features transmitted to the AM
proportion of features transmitted to the AM
Figure 14. ' h o possible curves relating the expected transection displacement as a function of the proportion of features on the left side of the retina that are successfully transmitted to the MI. The larger this proportion is, the less neglect should be expected.
Volume 9, Number 2 182 Journal of Cognitive Neuroscience

transmission rates will result in a range of transmission displacements, as depicted by the two dotted horizontal lines in Figure 8. One can clearly see in Figure 14 that with the curve on the left, larger transection displace- ments will occur with smaller variability, whereas with the curve on the right, larger transection displacements will occur with larger variability. The curve on the left corresponds to the behavior of the model; the curve on the right is what is required to fit the patient data.
While these curves are descriptive, translating them into a computation mechanism is not simple. The curve on the left emerges from the dynamics of the m.‘The difference between the curves-the sign of their second derivatives-is subtle indeed, and it will be a challenge to develop a revised version of the AM dynamics that achieves the desired behavior.
6. Effect of Stimulus Position
In the studies described above, stimulus lines were pre- sented centered on a sheet of paper, which was also centered with respect to the midsaggital plane. One patient, PS, was studied not only in this condition, but also with a set of lines whose left endpoints all were anchored 1.5 nun from the left edge of the sheet of paper, and with another set whose right endpoints all were anchored 1.5 mm from the right edge of the sheet of paper (Marshall & Halligan, 199Oa). Let us call these three conditions the centered, left-aligned, and right- aligned presentations. A variety of line lengths were tested, ranging from 12.5 mm to 279 mm in length. Note that the full extent of right-aligned lines 127 mm and shorter were entirely within right hemispace, and like- wise for short left-aligned lines lying in the left hemispace.
Figure 15(a) shows PS’s performance for centered, left-aligned, and right-aligned stimuli. In all three condi- tions, transection displacements are linearly related to line length. The average magnitude of neglect is no greater for left-aligned than for centered stimuli; right- aligned stimuli appear to produce less neglect. The slope of the linear relationship between line length and mean displacement can also be used as a measure of the severity of neglect; the larger the slope, the larger the displacement as a fraction of line length. The slopes for the three presentation conditions are shown in Table 2. All three of these slopes are quite large relative to slopes obtained for normals, which are in the neighborhood of .03. Although there appears to be somewhat less neglect for the right-aligned presentations by this measure, one cannot ascertain the statistical reliability of this conclu- sion from the one patient’s data.’
If neglect occurs with respect to a reference frame that is centered on the sheet of paper or centered on the body midline, one would expect relatively severe neglect for left-aligned stimuli and relatively mild neglect for right-aligned stimuli. The support for this pattern of results is not strong. Instead, the data appears to provide
evidence for neglect that occurs with respect to the reference frame of the stimulus itself.
Simulations
In the simulation experiments reported thus far, stimulus lines were centered on MORSEL’S retina. Here, we add two conditions: lines whose endpoints are anchored either to the left or to the right side of the retina. Short lines thus lie entirely in one hemifield or the other, and the longer the line, the farther it extends into the opposite hemifield.
Figure 16 shows the transection displacement as a function of line length averaged over the 240 simulated patients, for centered, left-aligned, and right-aligned con- ditions. The centered-condition data are the same as those in Figure 12(b). The clear result is that the place- ment of the lines makes little difference in the pattern of neglect. Although the transmission probability varies as a function of absolute position of the stimulus, what appears to be critical to the AM’S performance is the relative strength of the left and right extremes of a stimulus line. Thus, the AM produces object-centered ne- glect-neglect with respect to the left and right ends of the object-rather than retinotopic neglect-neglect with respect to the position on the retina. This behavior of the model is somewhat unintuitive because the deficit itself is retinotopic. Mozer and Behrmann (1990) simi- larly found that the retinal position of a stimulus word in the damaged MORSEL had a relatively minor influence on reading performance.
This simulation result is consistent with the data ob- tained from PS, the only human patient who has been studied in these conditions in two important respects as shown in Figure 15(a). First, there is severe neglect in all three conditions. Second, the slope of the functions in all three conditions are of the same order of magnitude, and are an order of magnitude larger than those obtained for normals. Because the simulation data represents a mean over 240 patients, whereas the human data are those of a single patient, a precise fit should not be expected. However, it is not difficult to find individual simulated patients whose data shows a remarkably simi- lar pattern to that of PS; see Fig. 15(b).
Table 2. Linear Regression Coefficient for Different Line Placement Conditions
Left-aligned Centered Rigbt-aligned
Patient PS ,369 .406 ,299
Simulated patients .479 ,455 ,449
7. Effect of Stimulus Orientation
In the studies described above, lines were presented hori- zontally on the page and horizontally with respect to the
Mozer et al. 183

... !'
,
Figure 15. (a) Mean transection displacement as a function of line length for centered, left-aligned, and right-aligned stimulus presentations for patient PS, from Marshall & Halligan (1990a). (b) Mean transection displacement as a function of line length for centered, left-aligned, and right- aligned stimulus presentations for one simulated patient. The transmission probability curve of this patient is characterized by a saturation probability of .9, a saturation position at the right edge of the retina, a gradient of .02, and a minimum transmission probability of .4. Other simulated patients with these parameters showed a similar pattern of results, indicating a systematic relationship between the parameters and the observed performance.
Figure 16. Mean transection displacement produced by simulations of lesioned MORSEL as a function of line length for centered, left-aligned, and right-aligned stimulus presentations.
loo'
- - - left aligned right aligned . . . . . . . .
/ 1 I 1 I 1
loo 150 200 250 300 line length (mm)
patient. Marshall and Halligan (1990b) and Burnett-Stuart, Halligan, & Marshall (1991) have explored performance as a function of stimulus orientation. Patients were pre- sented with stimulus lines of a fixed length (180 mm) drawn at various orientations on the paper.
Figure 17(a) shows the mean transection displace- ment as a function of orientation for one patient for whom a large corpus of data was collected. Positive displacements are to the right of center, regardless of orientation. The angle 0' is horizontal; the angles 90' and
184 Journal of Cognitive Neuroscience Volume 9, Number 2

20 . . , , , . , , . , . 1
(b) m . . . . . . . . . . . . .
.. . . I . .- .
\ I \
I ,
W .
50-
- 1 0 ' * * " ' " ' * ' - 9 0 - 7 5 4 4 5 3 0 - 1 5 0 15 30 45 W 75 90
Inn odmwm (dogmom)
Figure 17. (a) Mean transection displacement as a function of line orientation for patient MN, from Marshall & Halligan (1990b). Each point is the average over 60 trials. The vertical bars indicate f l standard error of the mean. (b) Simulation of lesioned MORSEL on line bisection task as a function of line orientation. The dotted and dashed lines show curves from three simulated patients. The solid line with the error bars shows the mean across simulated patients.
-90" are vertical.' This particular patient shows relatively mild neglect; his transection displacements for horizon- tal lines are about one-third as large as are typically observed. Nonetheless, it is worth presenting this data because it clearly shows the pattern of results confirmed with statistical analyses: transection displacements are linearly related to the cosine of the orientation. That is, the severity of neglect is determined by the length of the projection of the line onto the horizontal axis (Burnett-Stuart et al., 1991).
Let us formalize this characterization of the results. The data obviously cannot be modeled by a straight line; it appears that a quadratic or cosine fit is necessary. Nonetheless, one can ask whether the data can be mod- eled by a piecewise linear function. That is, suppose we examine the data for orientations 0-90". In the Burnett- Stuart et al. (1991) study of six patients, the fraction of the variance accounted for by a linear fit of these data is only 74.1%, whereas a cosine fit accounts for 88.8% of the variance.
Interpreting the data is complicated somewhat by the fact that for some patients, neglect is not entirely a function of lateral extent, but also altitudinal extent (But- ter et al., 1989; Rapcsak, Chino, & Heilman, 1988). For these patients, one can conceptualize the axis of the attentional deficit as lying not along the horizontal, but rotated slightly clockwise (resulting in both left and upper-field neglect) or slightly counterclockwise (result- ing in both left and lower field-neglect). Accordingly, for oriented lines, neglect is a function of the cosine of the angle, but there is a constant phase shift that reflects the fundamental axis of the def i~i t .~
Simulations
Stimuli used in this simulation experiment were fixed- length lines, corresponding to 180-mm lines viewed by human patients, at five orientations: Oo, 30", 45", 60°, and 90" (Fig. 7). Because of quantization effects on MORSEL'S retina, it was tricky to generate the nonhorizontal and nonvertical lines. We matched the diagonal lines on the total number of input features and the average number of neighbors for each feature, which are the factors that seem to most affect the AM response.
Each of the 240 simulated patients was presented with 10 trials of each of the five different line orientations, and the mean transection displacement at each orienta- tion was computed. Figure 17(b) shows the transection displacement as a function of line orientation. The dotted and dashed curves show typical responses of individual simulated patients, and the solid curve is the mean of the group, with error bars indicating the spread of the distribution.
Because the response of MORSEL for -x" lines must necessarily mirror the response for x" lines, the figure has been extended to include the orientations between -90" and 0". Clearly, the mean displacement curve is bowed, nomonotonic in line orientation, and has the general shape of a cosine function.
For each simulated patient, we performed a linear and cosine regression to determine which type of curve best fits the individual's data for line orientations between 0" and 90". The mean percent of variance accounted for in the two regression analyses is presented in Table 3. As it did for the human patients, the cosine regression yielded
Mozer et al. 185
Table 3. Percent of Variance Accounted for in Oriented Line Simulation
Linear Cosine Regression Regression
Human patients (n = 6) 74% 89%
Simulated patients (n = 240) 65% 72%
a reliably better fit for the simulated patients (F(1,239) = 74, p < 0.001). The explanation for this finding is simple: as we observed earlier, the critical factor in de- termining the severity of neglect in MORSEL is the differ- ence in the transmission probability between the left and right ends of the stimuli. For oriented lines of a fixed length, this difference is monotonically related to the length of the projection of the stimulus line onto the horizontal axis, which in turn is proportional to the cosine of the line orientation.
One discrepancy between simulations and humans is that the simulated patients seem to show somewhat more variance in their responses than do the humans, which leads to slightly worse fits for both the linear and cosine regressions, as well as a weaker difference be- tween the two. A partial explanation for this discrepancy may have to do with quantization effects on MORSEL'S
retina. In our preliminary simulation studies, we found that the responses of MORSEL were sensitive to small changes in the stimulus-induced activity pattern on the retina. A finer quantization of the retinal array should make the activity of any individual cell less critical and might reduce response variability. Another partial expla- nation for the discrepancy is the fact that the human experiments used 22.5" and 67.5" lines whereas the simulation used 30" and 60" lines. It was much simpler to construct 30" and 60" lines on MORSEL'S retina due to quantization effects, but this created a uniform spacing of orientations, which may have masked differences be- tween linear and cosine regressions.
We could model the performance of patients whose deficit was not strictly along the horizontal axis. This would be easy to do by rotating the attentional gradient on the map of the AM, corresponding to the sort of gradient that we suppose for these patients.
DISCUSSION
MORSEL is an existing computational model whose archi- tecture, dynamics, and parameters have been specified in earlier simulation studies. Even the form of the dam- age that occurs in unilateral neglect is dictated by earlier modeling work. Thus, MORSEL was not in any way de- signed to account for the line bisection data modeled here. MORSEL makes strong predictions and the data were reexamined to determine whether the model and data were consistent.
We have shown that MORSEL can achieve a remarkable fit to the data. MORSEL can model the following phenom- ena: (1) no consistent across-subject bias is found in normals; (2) transection displacements are proportional to line length in neglect patients; (3) variability of dis- placements is proportional to line length, in both nor- mals and patients; (4) position of the lines with respect to the body or the page on which they are drawn has little effect; and (5) for lines drawn at different orienta- tions, displacements are proportional to the cosine of the orientation angle. MORSEL also fails to account for one observation: across patients, the variability of displace- ments for a particular line length is roughly proportional to mean displacement.
What have we learned from this modeling exercise? It has been valuable for a variety of reasons, on which we elaborate.
In determining what data to model, we were forced to reexamine and reanalyze the patient data, combining results across multiple studies, separating robust and reliable patterns from quirks in individual patient per- formance. Prior to this effort, the main phenomena related to line bisection had never been distilled and summarized. We thus have a better understanding of the data. MORSEL is able to provide a comprehensive account of the varied corpus of data in a unified framework. We have pointed to essential properties of the model that are responsible for the observed effects. Phenomena that could be seen as puzzling without a theoretical framework-such as the finding that neglect is related to the total line length, despite the fact that the patient does not apprehend the entire line-have straightfor- ward, mechanical explanations in terms of the model. MORSEL has been able to explain a large collection of new data with almost no additional assumptions or mechanisms. This increases our confidence in the cor- rectness and importance of the model, and gives us further motivation to continue expanding the breadth and coverage of MORSEL.
The one phenomenon that MORSEL mispredicts-the relation between the mean and variability of transec- tion displacements-points to a possible problem with the model. We suspect that fixing this problem involves a fairly minor change to the dynamics of the AM, but it is difficult to determine at this point; making any change to the model requires verification that the change does not affect the model's behavior on any other data. However, we are confident that the change can be made without repercussion, as no other data previously modeled depends on the aspect of the AM
that we have pointed to as the culprit of the mispre- diction. Indeed, whether or not the effort of fixing the model is warranted depends on whether we expect to run across data in the future that will require this correction. At this point, we suspect not.
186 Journal of Cognitive Neuroscience Volume 9, Number 2
MORSEL provides an accurate portrayal of the average performance of groups of patients, yet it also possesses the flexibility-via the transmission probability curve that specifies the nature of the attentional deficit-to model individual differences. If we have confidence in the model's validity, we can use it prescriptively to characterize the attentional dejicit of individual pa- tients in terms of their transmission probability curves. We have done this in one case above to show that the stimulus-position effects observed for patient PS (left- aligned and centered stimuli producing comparable neglect, while right-aligned stimuli producing less) could be modeled by the selection of a particular transmission probability curve. We can do a similar sort of exploration in the model's parameter space to try to understand the behavior of the only patient of 43 studied who shows a significant quadratic component in his performance on varying-length lines. Thus, MORSEL
could well be used as a diagnostic tool to characterize the specific nature of a patient's deficit.
A related and important application of MORSEL is in characterizing the sort of attentional deficits that are possible following brain damage. Exploring the mod- el's parameter space, we have found that certain trans- mission probability curves yield patterns of data that are quite bizarre and have never been observed in patients, and thus are unlikely to occur in nature. Figure 18 shows two examples of this which result from shallow attentional gradients lying over just a
Figure 18. Simulation of le- sioned MORSEL on line bisec- tion task as a function of line length. The two lines show performance for two different transmission probability curves. The solid line-which corresponds to a saturation probability of .9, gradient of .01, saturation position on the right edge of the retina, and a minimum probability of .8- shows no neglect except for the longest lines. The dashed line-which corresponds to a saturation probability of 1.0, a gradient of .01, saturation posi- tion in the center of the ret- ina, and a minimum probability of .S-shows pre portionately less neglect for the longest line length than for the next shorter line length. Neither of these pat- terns are observed in the hu- man patient data, although a much less extreme version of the dashed line is occasionally found.
small portion of the visual field. If we dichotomize the space of transmission probability curves into those that are and are not consistent with the human data, and if we have information about the site of a patient's lesion, we may gain insight into the underlying cortical organization and neural structures that give rise to certain types of deficits but not others. In the course of our modeling efforts, MORSEL has sug- gested experiments that should be run to help settle theoretical issues and to test additional predictions of the model. We are currently exploring the literature to determine if the relevant experiments have been con- ducted, and if not, we plan to conduct them in the future. The experiments will, for example, help disen- tangle perceptual and motor components of neglect, explore line thickness as a manipulation in bisection studies, explore the effects of brief, masked stimulus presentations, and collect more data on the effect of stimulus position and different frames of reference. For the masking studies, MORSEL makes the surprising pre- diction that under some conditions masking could alleviate neglect. In the last set of studies, MORSEL makes the strong prediction that, averaged over many pa- tients, stimulus position should have little effect on performance, although there may be considerable in- dividual differences. Assuming that these predictions are borne out, this may not be the end of the line for MORSEL after all!
"I 0
0 d T
-10' I I I I
line length (mm)
Mozer et al. 187

APPENDIX 1: AM DYNAMICS
The task of the AM is to construct a "spotlight" of activity that highlights a single item appearing on MORSEL'S retina. Defining an item to be a set of features in close proxim- ity, the spotlight should form a contiguous region on the retina consistent with the bottom-up and topdown in- puts to the AM.
In connectionism, the standard method of transform- ing this description of the target behavior of the AM into a network architecture is to view the AM'S task as an optimization problem: To what activity value should each unit in the AM be set in order to best satisfy a number of possibly conflicting constraints? The two pri- mary constraints here are that the AM should focus on locations suggested by the bottom-up and topdown in- puts, and the AM should focus on a single item.
The first step in tackling such an optimization prob- lem is to define a Harmony function (Smolensky, 1986) that computes the goodness of a given pattern of activity over the entire AM (the AM state). This goodness is a scalar quantity indicating how well the AM state satisfies the optimization problem. The maxima of the Harmony function correspond to desired states of the AM.
Given a Harmony function, H, one can ask how the activity of the AM unit at a retinal location (x, y) , denoted a,, should be updated over time to increase Harmony and eventually reach states of maximal Harmony. The simplest rule, called steepest ascent, is to update a, in proportion to the derivative aH/aa,. If 8H/aa, is posi- tive, then increasing aq will increase H; thus a, should be increased. If aH/aa, is negative, then decreasing a, will increase H ; thus a, should be decreased.
Returning to the problem faced by the AM, devising a Harmony function that computes whether the pattern of activity is contiguous is quite difficult. Instead of constructing a function that explicitly rewards contigu- ity, we have combined several heuristics that together generally achieve convex, contiguous patterns of activ- ity." The Harmony function used in the AM is:
where ALL is the set of all retinal locations, extq is the net external (bottom-up and topdown) activity to the AM at location (x, y), NEIGHq is the set of eight locations immediately adjacent to (x,y)-the neighbors, ACTIVE is the set of locations of all units with positive activity, Z is the mean activity of all units with positive activity-
ACTIVE
and p, 8, and y are weighting parameters.
The first term encourages each unit to be consistent with the external bias. The second term encourages each unit to be as close as possible to its neighbors (so that if a unit is off and the neighbors are on, the unit will tend to turn on, and vice versa). The third term encour- ages units below the mean activity in the network to shut off, and units above the mean activity to turn on. The constant gamma serves as a discounting factor: with gamma less than 1, units need not be quite as active as the mean in order to be supported. Instead of using the average activity over all units, it is necessary to compute the average over the active units. Otherwise, the effect of the third term is to limit the total activity in the network, i.e., the number of units that can turn on at once. This is not suitable because we wish to allow large or small spotlights depending on the external input.
The update rule for a, is:
Further, a, is prevented from going outside the range [0,1] by capping activity at these limits."
To explain the activation function intuitively, consider the time course of activation. Initially, the activity of all AM units is reset to zero. Activation then feeds into each unit in proportion to its external bias (first term in the activation function). Units with active neighbors will grow the fastest because of neighborhood support (sec- ond term). As activity progresses, high-support neighbor- hoods will have activity above the mean; they will therefore be pushed even higher, while low-support neighborhoods will experience the opposite tendency (third term).
In all simulations, p was fixed at ' /8 , 8 at '/2, and y at 0.11 times the total external input.
Acknowledgments This research was supported by NSF Presidential Young Inves tigator award IRI-9058450 and grant 90-21 from the James S. McDonnell Foundation to MM, grants from the British Medical Research Council to PH and JM, and an Oxford McDonnell-Pew Centre Travel Grant. Our gracious thanks to Tim Shallice and Alphonso Caramazza for setting up the Trieste meeting that served as the catalyst for this work, and to Lesley Court for facilitating our communications across the Atlantic.
Reprint requests should be sent to Michael C. Mozer, Dept. of Computer Science, Univ. of Colorado at Boulder, ECOT 741 Engineering Center, Campus Box 430, Boulder, CO 803094430. Phone: (303) 492-4103. Email: [email protected]
Notes
1. Mozer and Behrmann (1990) assumed a slight amount'of blurring in the bottom-up input to the AM. Each retinal activa- tion provided input not only to the corresponding location in
188 Journal of Cognitive Neuroscience Volume 9, Number 2
the AM but also to the immediately adjacent locations, with a relative strength of 2%. This small amount of spread is unlikely to affect processing, but we have preserved it to maintain consistency with the original model. 2. The exact representation does not appear to be critical. We also experimented with lines having thicknesses of one and three cells, and the qualitative pattern of results was un- changed. 3. Examining the external input to the AM in Figure 10, one notices that the actual input strength varies from location to location, and some locations to the right of center actually have stronger input than some locations to the left of center. This is because the figure shows a particular sampling from retinal input based on the transmission probability function, rather than the expected input strength, which would increase mono- tonically from left to right. 4. This pattern is clearer for the simulation data, as there are 15 times as many patients composing the distribution. Note also that for the human data, patients were classified as normal if their displacements were less than 10 mm, causing the trun- cation of the distribution at the left end. 5. One parameter of the model that affects this correlation is the settling criterion-the total change in the AM activity pat- tern must drop below this criterion in order for a response to be read out. In the simulations reported here, a criterion of ,0001 was used. If this criterion is increased to ,001, the cor- relation jumps to .75. This is because increasing the criterion terminates the settling process sooner, and the AM response tends to be more dependent on stimulus conditions (e.g., line length) earlier in the settling process. Of course, it is not valid to adjust parameter settings differently for each simulation, and if all other simulations were run again with a settling criterion of ,001, other results would no doubt change. We mention this experiment only to indicate that the magnitude of the effect is sensitive to changes in minor parameter values, not to essen- tial properties of the model. 6. It further does not give the whole story, because it says nothing about why shorter lines result in smaller displace- ments. We could simply relabel the y-axis “relative transection displacement” to deal with this issue, without influencing the discussion above. 7. Indeed, as a rough test, the slopes of the lines formed by consecutive pairs of data points in Figure 15(a) were compared for the centered and right-aligned conditions, yet no reliable difference was found (F(1,7) < 1). 8. Note that xo lines mirrored around the x-axis become -xo lines. 9. The cosine regression computed by Burnett-Stuart et al. (1991) includes a phase shift parameter to model the altitudi- nal component of neglect. 10. We should note that many other Harmony functions would suffice equally well, if not better, than the one presented here. Mozer & Behrmann (1990) experimented with several differ- ent functions, and the qualitative system behavior was unaf- fected by the details of the Harmony function. 11. To follow the objective function exactly, the third term should actually be zero if axu is currently inactive. However, including this term at all times prevents oscillation in the network and does not otherwise appear to affect the quality of the solution.
REFERENCES Axenfeld, D. (191 5). Hemianopische Gesichtsfeldstroungen
nach Schadelschussen. Klin. Monatsble. Angerbeilkd., 55, 126- 143.
Barbieri, C., & De Renzi, E. (1989). Patterns of neglect disso-
Behrmann, M., Moscovitch, M., Black, S. E., & Mozer, M. C. ciation. Bebavioural Neurology, 2, 13-24.
(1990). Perceptual and conceptual mechanisms in neglect dyslexia: ?bvo contrasting case studies. Brain, 113, 1163- 1183.
Bisiach, E., Bulgarelli, C., Sterzi, R., & Vallar, G. (1983). Line bi- section and cognitive plasticity of unilateral neglect of space. Brain and Cognition, 2, 32-38.
Bisiach, E., Capitani, E., Colombo, A., & Spinnler, H. (1 976). Halving a horizontal segment: A study on hemisphere- damaged patients with focal cerebral lesions. Archives Suisses de Neurologie, Neurocbirgurie et de Psycbiatrie, 118, 199-206.
Bradshaw, J. L., Nettleton, N. C., Nathan, G., & Wilson, L. E. (1985). Bisecting rods and lines: Effects of horizontal and vertical posture on left side underestimation by normal subjects. Neuropsycbologia, 23, 421-436.
Burnett-Stuart, G., Halligan, I? W., & Marshall, J. C. (1991). A Newtonian model of perceptual distortion in visuo-spatial neglect. NeuroReport, 2, 2 5 5 - 2 57.
Butter, C. M. (1987). Varieties of attention and disturbances of attention: A neuropsychological analysis. In M. Jean- nerod (Ed.), Neuropbysiological and neuropsycbological aspects of spatial neglect (pp. 1-24). Amsterdam: North Holland.
Butter, C. M., Evans, J., Kirsch, N., & Kewans, D. (1989). Altitu- dinal neglect following traumatic brain injury: A case re- port. Cortex, 25, 135-146.
Halligan, I? W., Manning, L., & Marshall, J. C. (1991). Hemi- spheric activation versus spatio-motor cueing in visual ne- glect: A case study. Neuropsycbologia, 29, 165-175.
Halligan, I? W., & Marshall, J. C. (1988). How long is a piece of string? A study of line bisection in a case of visual ne- glect. Cortex, 24, 321-328.
Halligan, I? W., & Marshall, J. C. (1989a). Laterality of motor re- sponse in visuo-spatial neglect: A case study. Neuropsy- cbologia, 27, 1301-1307.
Halligan, I? W., & Marshall, J. C. (1989b). Perceptuwueing and perceptuo-motor compatibility in visuospatial neglect: A single case study. Cognitive Neuropsycbology, 6, 423- 435.
Halligan, I? W., & Marshall, J. C. (1989~). Line bisection in visu- ospatial neglect: Disproof of a conjecture. Cortex, 25, 517- 522.
Halligan, I? W., & Marshall, J. C. (1991a). Left neglect for near but not far space in man. Nature, 350, 498-500.
Halligan, I? W., & Marshall, J. C. (1991b). Recovery and regres sion in visuo-spatial neglect: A case study of learning in line bisection. Brain Injuv, 5, 23-31.
Halligan, I? W., & Marshall, J. C. (1993a). The history and clini- cal presentation of visual neglect. In I. H. Robertson & J. c. Marshall (Fits.), Unilateral neglect: Clinical and experi- mental studies. London: Erlbaum.
Halligan, I? W., & Marshall, J. C. (1993b). The bisection of hori- zontal and radial lines: A case study of normal controls and ten patients with left visuo-spatial neglect. Interna- tional Journal of Neuroscience, 70, 149-169.
Heilman, K. M., Bowers, D., & Watson, R. T. (1984). Pseudo- neglect in a patient with partial callosal disconnection. Brain, 107, 519-532.
Heilman, K. M., Watson, R. T., & Valenstein, E. (1993). Neglect and related disorders. In K. M. Heilman & E. Valenstein (Eds.), Clinical neuropsycbology 2nd ed. (pp. 279-336). New York: Oxford University Press.
Kinsbourne, M. (1993). Orientational bias model of unilateral neglect: Evidence from attentional gradients within hemi- space. In I. H. Robertson & J. C. Marshall (Eds.), Unilateral
Mozer et al. 189
neglect: Clinical and experimental studies. Hove, UK: Erlbaum.
tion: towards the underlying neural circuitry. Human Neu- robiolou, 4, 219-227.
LaBerge, D., & Brown, V (1989). Theory of attentional opera- tions in shape identification. Psychological Review, 96,
Manning, L., Halligan, F! W., & Marshall, J. C. (1990). Individual variation in line bisection: A study of normal subjects with application to the interpretation of visual neglect. Neuro- psychologia, 28, 647-655.
Marshall, J. C., & Halligan, I? W. (1989). When right goes left: An investigation of line bisection in a case of visual ne- glect. Cortex, 25, 503-515.
Marshall, J. C., & Halligan, I? W. (1990a). Line bisection in a case of visual neglect: Psychophysical studies with implica- tions for theory. Cognitive Neuropsycholou, 7, 107-130.
Marshall, J. C., & Halligan, F! W. (1990b). The psychophysics of visuo-spatial neglect: A new orientation. Medical Science Research, 18, 429-430.
McClelland, J. L., & Rumelhart, D. E. (1981). An interactive acti- vation model of context effects in letter perception: Part I. An account of basic findings. Psychological Review, 88,
Mesulam, M-M. (1985). Principles of behavioral neurology
Mozer, M. C. (1991). The perception of multiple objects:
Koch, C., & Ullman, S. (1985). Shifts in selective visual atten-
101-124.
375-407.
Philadelphia: E A. Davis.
A connectionist approach. Cambridge, MA: MIT Press/ Bradford Books.
Mozer, M. C., & Behrmann, M. (1990). On the interaction of selective attention and lexical knowledge: A connectionist account of neglect dyslexia. Cognitive Neuroscience, 2,
Nichelli, F?, Rinaldi, M., & Cubelli, R. (1989). Selective spatial attention and length representation in normal subjects and in patients with unilateral spatial neglect. Brain and Cognition, 9, 57.
Poppelreuter, W. (1917). Die Storungan der Niederan und ho- heren Seheistungen durch Nerletzung des Okzipitalhirns. In Die Psychischen Schadigungen durch Kopfschuss in Kreige (1914/1916). Vol. 1. Leipzig: Voss.
Rapcsak, S. Z., Cimino, C. R., & Heilman, K. M. (1988). Altitudi- nal neglect. Neurolou, 38, 277-281.
Riddoch, M. J., & Humphreys, G. W. (1983). The effect of cue- ing on unilateral neglect. Neuropsychologia, 21, 589-599.
Schenkenberg, T., Bradford, D. C., & Ajax, E. T. (1980). Line bi- section and unilateral visual neglect in patients with neuro- logical impairment. Neurolou, 31, 509-517.
Smolensky, F! (1986). Information processing in dynamical sys- tems: Foundations of harmony theory. In D. E. Rumelhart & J. L. McClelland (Eds.), Parallel distributed processing: Explorations in the micmstructure of cognition. Volume I: Foundations (pp. 194-281). Cambridge, MA: MIT PressBradford Books.
properties on visual neglect. Journal of Neurology, Neuro- surgety, and Psychiatty, 54, 882-887.
96-123.
Tegner, R., & Levander, H. (1991). The influence of stimulus
190 Journal of Cognitive Neuroscience Volume 9, Number 2