
The employment impacts of energy conservation · IndEco Strategic Consulting Inc. & Econometric...
60
120 Adelaide Street West Suite 1600 Toronto, Ontario M5H 1T1 T 416-967-7474 F 416-967-1947 www.conservationbureau.on.ca a division of the Ontario Power Authority February 11, 2008 Dear Reader, The Conservation Bureau recently commissioned a study of the potential employment benefits of the energy efficiency and conservation activities needed to meet Ontario’s long-term peak demand reduction target of 6,300 megawatts. The study, titled The Employment Impacts of Energy Conservation, examines the conservation activities identified by the Ontario Power Authority in its 20-year Integrated Power System Plan (IPSP). The estimated employment potential is intended to provide a conservative analysis and therefore does not include energy- efficiency investments not contemplated by the plan. In addition to its independent analysis of Ontario data, The Employment Impacts of Energy Conservation includes a review of the current literature on employment and energy efficiency in North America. Previous assessments of employment and energy efficiency are limited in number and have not been applied to an Ontario context. The study uses a methodology developed by Dr. Atif Kubursi of Econometric Research Limited to assess the macroeconomic impacts of energy efficiency, demand management, fuel switching and customer-based generation in Ontario. This approach estimates the direct, indirect and induced benefits of these economic activities. This methodology is intended to provide a “bird’s-eye view” of the estimated employment potential and there are limitations to the precision that can be achieved in a simulation of this type. The employment figures in the study are presented in “person-years,” which should be interpreted as one person’s uninterrupted, full-time labour for a period of one year (approximately 2,000 hours). One person-year does not necessarily translate into a full-time job for a full year’s time because many jobs are either temporary, part-time or performed on a contractual basis. I hope this study will help provide Ontarians with some assurance that the employment and economic benefits of energy efficiency and conservation are significant and will be sustained well into the future. As we move toward an economy driven by conservation and green energy, I look forward to seeing the results of Ontario’s collective action on energy efficiency in the form of new “green” jobs and more vibrant and healthy communities. Sincerely, Peter Love Chief Energy Conservation Officer
Transcript of The employment impacts of energy conservation · IndEco Strategic Consulting Inc. & Econometric...

120 Adelaide Street West Suite 1600 Toronto, Ontario M5H 1T1
T 416-967-7474 F 416-967-1947 www.conservationbureau.on.ca a division of the Ontario Power Authority
February 11, 2008 Dear Reader, The Conservation Bureau recently commissioned a study of the potential employment benefits of the energy efficiency and conservation activities needed to meet Ontario’s long-term peak demand reduction target of 6,300 megawatts. The study, titled The Employment Impacts of Energy Conservation, examines the conservation activities identified by the Ontario Power Authority in its 20-year Integrated Power System Plan (IPSP). The estimated employment potential is intended to provide a conservative analysis and therefore does not include energy-efficiency investments not contemplated by the plan. In addition to its independent analysis of Ontario data, The Employment Impacts of Energy Conservation includes a review of the current literature on employment and energy efficiency in North America. Previous assessments of employment and energy efficiency are limited in number and have not been applied to an Ontario context. The study uses a methodology developed by Dr. Atif Kubursi of Econometric Research Limited to assess the macroeconomic impacts of energy efficiency, demand management, fuel switching and customer-based generation in Ontario. This approach estimates the direct, indirect and induced benefits of these economic activities. This methodology is intended to provide a “bird’s-eye view” of the estimated employment potential and there are limitations to the precision that can be achieved in a simulation of this type. The employment figures in the study are presented in “person-years,” which should be interpreted as one person’s uninterrupted, full-time labour for a period of one year (approximately 2,000 hours). One person-year does not necessarily translate into a full-time job for a full year’s time because many jobs are either temporary, part-time or performed on a contractual basis. I hope this study will help provide Ontarians with some assurance that the employment and economic benefits of energy efficiency and conservation are significant and will be sustained well into the future. As we move toward an economy driven by conservation and green energy, I look forward to seeing the results of Ontario’s collective action on energy efficiency in the form of new “green” jobs and more vibrant and healthy communities. Sincerely,
Peter Love Chief Energy Conservation Officer


The employment impacts of energy conservation
&
Econometric Research Ltd.

The employment impacts of energy conservation: An analysis of current literature and a macroeconomic
assessment for Ontario
&
Econometric Research Limited

This document was prepared for the Ontario Power Authority by IndEco Strategic Consulting Inc and Econometric Research Limited For additional information about this document, please contact: IndEco Strategic Consulting Inc. 77 Mowat Avenue, Suite 412 Toronto, ON, Canada M6K 3E3 Tel: 416 532-4333 E-mail: [email protected] ©2008 IndEco Strategic Consulting Inc All rights reserved. No part of this document may be reproduced, stored in a retrieval system, or transmitted, in any form or by any means, electronic, mechanical, photocopying, recording or otherwise, without the written permission of IndEco Strategic Consulting Inc. IndEco report A8469 11 December 2008
ii
The employment impacts of energy conservation

iii
IndEco Strategic Consulting Inc. & Econometric Research Ltd.
Contents
Executive summary............................................................................................................ v
1 Introduction.............................................................................................................1
1.1 Required components of an accurate assessment of the employment impacts of energy conservation ....................................................................................................1 1.2 Approach of the report.......................................................................................2
2 Literature review .....................................................................................................3
2.1 Renewable energy and energy efficiency: Economic drivers for the 21st century 3 2.2 The size of the U.S. energy efficiency market: Generating a more complete picture.........................................................................................................................6 2.3 The new mother lode: The potential for more efficient electricity use in the southwest ....................................................................................................................9 2.4 Current and potential green jobs in the economy.............................................13 2.5 Green jobs: Towards decent work in a sustainable low-carbon world..............15 2.6 New York Energy Smart Program Report..........................................................15 2.7 Conclusions.....................................................................................................16
3 Comparative economic impacts of conservation and demand management programs in Ontario ........................................................................................................20
3.1 Economic impact analysis and methodology ...................................................24 3.2 The economic impact model ...........................................................................25 3.3 The economic impacts of the energy efficiency program .................................25 3.4 The Economic impacts of the demand management programs.........................30 3.5 The economic impacts of fuel switching programs...........................................34 3.6 The economic impacts of the customer based generation program ..................38 3.7 The economic impacts of the aggregate energy conservation programs............42 3.8 Conclusion ......................................................................................................45
4 Limitations of the analysis and next steps ..............................................................46
Appendix A. Employment impacts of energy efficiency by sector..............................48


v
IndEco Strategic Consulting Inc. & Econometric Research Ltd.
Executive summary
The relationship between energy conservation and employment are analysed. Through a critical review of the recent literature on the subject, it is found that many of the current estimates are unreliable due to limitations in the reviewed methodologies. The limited number of the assessments that do use reliable methodologies analyse the issue in the context of U.S states and consequently cannot be applied to an assessment for Ontario.
In order to address this gap in the literature, a macroeconomic assessment of the effects of energy conservation is presented. The assessment finds that the planned energy conservation programs of the Ontario Integrated Power System Plan will result in a net increase in employment, salaries and wages, and government revenue.


1
IndEco Strategic Consulting Inc. & Econometric Research Ltd.
1 Introduction
The significance of energy conservation in Ontario is demonstrated through the recent incorporation of conservation targets in the province’s integrated power system plan. The implications of decisions made within the province’s energy system are undoubtedly significant to the lives’ of residents of the province. It is well established that energy conservation results in savings that are invested elsewhere in the economy resulting in employment growth.
The need for understanding the interdependent relationship between this market shift and employment patterns has been approached by several recent studies. With widely differential results, it is immediately clear that the methodologies employed in at least some of these studies are questionable. Further, comprehensive analyses for Canada or Ontario are not currently available, forcing a comparison to reports written for the United States. If any of these results or methodologies is to be used to develop an understanding of the employment impacts of energy conservation in Ontario, the methodologies must be critically assessed, and the requirements for a meaningful application to Ontario developed and applied.
1.1 Required components of an accurate assessment of the employment impacts of energy conservation
Certain applications of energy conservation exist in concise portions of the market (for example, energy service companies). Activity within these portions of the marketplace can be easily assigned to energy conservation. Much of energy conservation, however, is practised within larger industries that are not wholly dedicated to energy conservation (e.g. energy efficient appliances). The problem of assigning industry data to energy conservation in these sectors becomes more complex. In order to avoid the misallocation of non-energy conservation related activity to energy conservation, a rigorous separation of energy conservation activity from traditional activity must be applied.
Also critical to an accurate assessment of the problem is recognising that transactions relating to energy conservation, like any other transaction, take place in a complex marketplace with multiple and interdependent sectors. Energy conservation cannot be analysed in an isolated manner, but must be considered within the existing marketplace. The positive and negative employment effects in the broader marketplace entails an analysis beyond the specific industry applying energy conservation.

2
The employment impacts of energy conservation
1.2 Approach of the report
The approach of this report entails two major assessment categories. The first of these is a literature review of recent reports on employment resulting or expecting to result from energy conservation. This discussion includes an analysis of six recently issued reports. The methodologies of each of these reports are discussed and critically analysed. Information and insight gathered from the literature review are used to conclude on the accuracy and applicability of the estimates provided by the reviewed literature.
The second major component of the report provides a macroeconomic assessment of the employment impacts of energy conservation on Ontario. The assessment addresses the issues raised in the literature review by providing a more holistic analysis specific to the province. Using data from the Integrated Power System Plan and a well-defined and documented methodology, the analysis provides a detailed comparison of the economic effects of the conservation and demand management programs of Ontario.

3
IndEco Strategic Consulting Inc. & Econometric Research Ltd.
2 Literature review
The literature review discusses six reports relating to energy conservation and employment. The reports were selected under the criteria that the report: estimates employment resulting from energy conservation, is a recent publication, is publicly available and is conducted for regions within Canada or the United States. The reports that satisfying the above criteria and that are reviewed in this chapter are:
• Renewable energy and energy efficiency: Economic drivers for the 21st century by Management Information Services Inc.
• The size of the U.S. energy efficiency market: Generating a more complete picture by the American Council for an Energy-efficient Economy
• The new mother lode: The potential for more efficient electricity use in the southwest by the Southwest Energy Efficiency Project
• Current and potential jobs in the economy by Global Insight
• Green jobs: Towards decent work in a sustainable low-carbon world by the United Nations Environment Programme
• New York Energy Smart program report by the New York State Energy Research and Development Authority.
For each report, we consider its scope and methodology, review the results reported, and offer an assessment of the methodology.
2.1 Renewable energy and energy efficiency: Economic drivers for the 21st century
Methodology
The 2007 report “Renewable energy and energy efficiency: Economic drivers for the 21st century” written by Management Information Services Inc. for the American Solar Energy Society (ASES) aims to establish a 2006 baseline for employment in the renewable energy and energy efficiency industries of the U.S. It also estimates future employment

4
The employment impacts of energy conservation
numbers for these industries in 2030. Energy efficiency initiatives for electricity, heating and transportation were all included in the analysis.
The definition of the energy efficiency industry was broken down into three major categories: the private sector, government programs and trade and professional associations and non-governmental organizations (NGOs).
Energy efficiency within the private sector included full industries that are wholly dedicated to energy efficiency (i.e. insulation, energy service companies and recycling and reuse industries) and energy efficiency related portions of industries that are not wholly dedicated to energy efficiency. In the latter group of the private sector, the energy efficiency portions of private industries were defined as:
Vehicles with 10% or higher mpg rating than CAFE mileage
Lighting, appliances, windows and doors with EnergyStar ratings
Industrial products and machinery with EnergyStar ratings
Construction defined as energy efficient through the assistance of national and state energy efficiency rating organizations such as the U.S Green Building Council
The report also stated that it “used similar methods [to those listed above] to derive energy efficiency components of the other industries and sectors included” (p27) within the private sector.
Using the penetration rate of the energy efficient version of a product within an entire market, the amount of spending spent on the energy efficient product was taken to be proportional to its penetration in the product category. For example, the ratio between energy efficient ovens and total number of ovens would be applied to the total spending in ovens to arrive at a value for the investment in energy efficient ovens.
Estimates relating to government programs included:
The federal energy efficiency budget
A portion of the federal climate change budget
All of state energy efficiency budgets

5
IndEco Strategic Consulting Inc. & Econometric Research Ltd.
Local government energy efficiency spending estimated using the ratio that local government spending is approximately 75% as large as state government spending
In the final category included in the assessment, the total size of trade and professional associations and NGOs dedicated to energy efficiency were included in the energy efficiency industry.
In its forecast, the ASES report compares three scenarios: the base case, a moderate scenario and an advanced scenario. The stated assumptions of each of these scenarios include:
The base case assumes current US standards, laws, and regulations are followed and unchanged up until 2030.
The moderate scenario assumes “various moderate, incremental (above the base case) federal and state RE&EE initiatives are put in place during next two decades” (p33) and that 15% of electricity in the US is sourced from renewable energy sources by 2030.
The advanced scenario assumes 30% of electricity in the US is sourced from renewable energy sources by 2030. The report states that the advanced scenario “indicates what is possible using current or impending technologies and includes what may be realistically feasible both economically and technologically in such a scenario” and “will require different policies to encourage success” (p34-35).
The report does not explicitly explain how the authors determine the employment numbers in its forecasts. Through following the case study, it seems that the authors estimate employment distribution within the “typical types of firms” (ASES, p41) identified and then apply a multiplier proportional to the predicted total size of that industry in the U.S.
Results
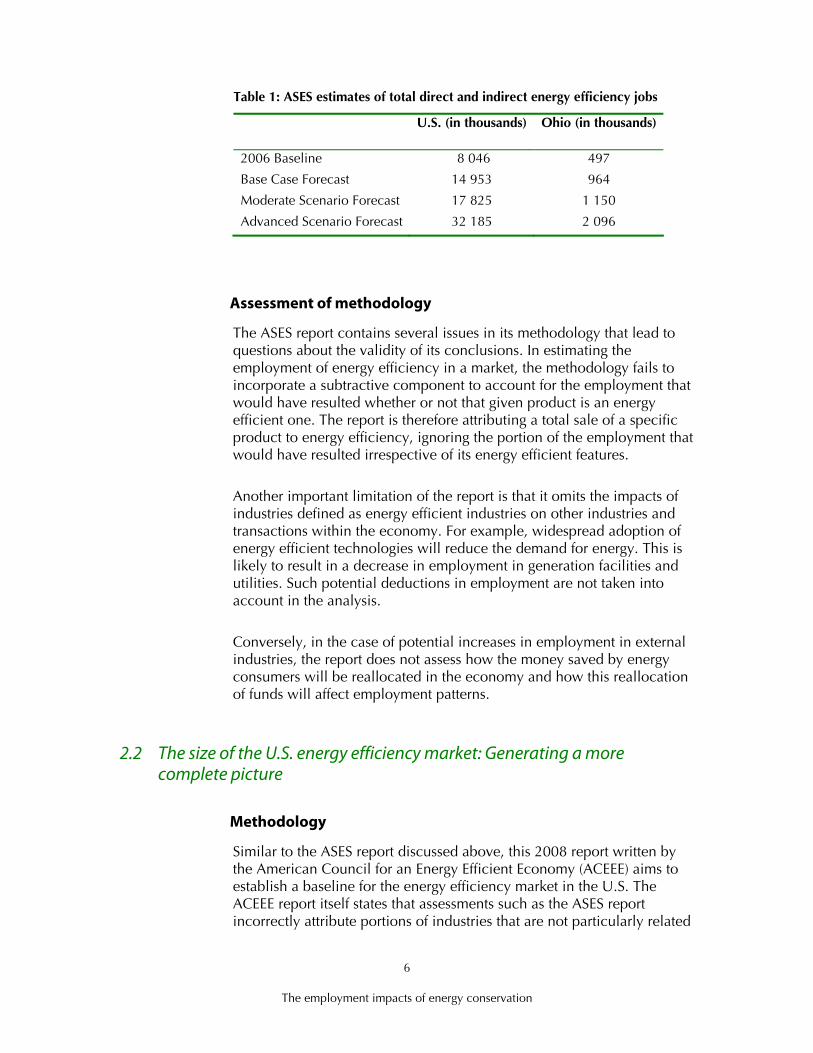
The results of the report are summarized in Table 1 below. Distinct reporting for direct and indirect employment in the energy efficiency industry was only provided for the 2006 baseline. For the U.S. 3 498 000 of the jobs are attributed to direct employment. For the Ohio baseline, 205 780 of the reported jobs were attributed to direct employment.
6
The employment impacts of energy conservation
Table 1: ASES estimates of total direct and indirect energy efficiency jobs
U.S. (in thousands) Ohio (in thousands)
2006 Baseline 8 046 497
Base Case Forecast 14 953 964
Moderate Scenario Forecast 17 825 1 150
Advanced Scenario Forecast 32 185 2 096
Assessment of methodology
The ASES report contains several issues in its methodology that lead to questions about the validity of its conclusions. In estimating the employment of energy efficiency in a market, the methodology fails to incorporate a subtractive component to account for the employment that would have resulted whether or not that given product is an energy efficient one. The report is therefore attributing a total sale of a specific product to energy efficiency, ignoring the portion of the employment that would have resulted irrespective of its energy efficient features.
Another important limitation of the report is that it omits the impacts of industries defined as energy efficient industries on other industries and transactions within the economy. For example, widespread adoption of energy efficient technologies will reduce the demand for energy. This is likely to result in a decrease in employment in generation facilities and utilities. Such potential deductions in employment are not taken into account in the analysis.
Conversely, in the case of potential increases in employment in external industries, the report does not assess how the money saved by energy consumers will be reallocated in the economy and how this reallocation of funds will affect employment patterns.
2.2 The size of the U.S. energy efficiency market: Generating a more complete picture
Methodology
Similar to the ASES report discussed above, this 2008 report written by the American Council for an Energy Efficient Economy (ACEEE) aims to establish a baseline for the energy efficiency market in the U.S. The ACEEE report itself states that assessments such as the ASES report incorrectly attribute portions of industries that are not particularly related

7
IndEco Strategic Consulting Inc. & Econometric Research Ltd.
to energy efficiency to the energy efficiency industry. The ACEEE report aims to provide a more accurate analysis by addressing this issue.
In order to address this issue, ACEEE differentiates between the investment required for creating a product meant for its basic application, to the incremental portion of the investment that makes the product an energy efficient one. Taking the example of an oven once again, the base investment would be what is needed to manufacture an oven and the incremental portion of the investment would be the added cost of making the same oven an energy efficient one. The authors call this incremental cost the “efficiency investment premium.” The analysis was broken down into six sector areas: residential buildings, commercial buildings, appliances and electronics, industry, transportation, and utilities.
Investment data were taken from a multitude of sources including:
Online stores
Delphi surveys of industry experts
The Energy Information Administration Annual Energy Outlook
EnergyStar sales data
Department of Energy technology programs
Energy Information Administration surveys
Estimates of employment were made using the ratio between jobs and industrial output in each sector. The jobs/output ratios were derived from the IMPLAN database – a system that contains comprehensive economic modelling data for the U.S. by region. Similar to the concept of the efficiency investment premium, the authors use an “efficiency premium related jobs” category to separate and identify the jobs created strictly as a result of the changes in processes and/or products that make the product more energy efficient. Efficiency premium related jobs within each industry were calculated using the investment efficiency premium in its jobs to output ratio. The estimates include “primary” as well as “secondary” jobs in each sector area, which are not explicitly defined. The report does not provide results separately for primary and secondary employment consequent to energy efficiency investments, but uses a weighted average to give one employment number for each sector. The assigned weights are 0.7 and 0.3 for primary and secondary employment respectively.

8
The employment impacts of energy conservation
Results
The investment and corresponding employment by sector are summarized in Table 2. The results separate the number of jobs in an industry as a whole (“total efficiency-related jobs”) and those strictly related to energy efficiency initiatives (“efficiency premium related jobs”). The former category would therefore be the estimates that should be compared to the ASES report, while the latter presents results specifically from the analyzed energy efficiency initiatives.
Table 2: Investment and associated implied energy savings estimates (Modified from Management Information Services Inc. 2007) Total efficiency
investment ($billion)
Efficiency investment premium ($billion)
Total efficiency-related jobs (thousands)
Efficiency premium related jobs (thousands)
Residential 39 5.85 316 47.4
Commercial 51 7.73 302 45.2
Industrial 43 10.13 372 44.7
Transportation 32 4.8 351 52.7
Utilities n.a. n.a. 151 22.7
ENERGY STAR 88 13.26 139 20.8
Total 253 41.77 1 630 233.5
Assessment of report
The ACEEE report presents a more accurate analysis than the ASES report of the employment effects of specific energy efficiency industries by carefully not attributing the investment in a product or service wholly to its energy efficient features. However, this report does not resolve the issue of taking into account the effects the defined industries have on the economy as a whole.
Although the employment impacts resulting from the investments made to incorporate energy efficiency upgrades in utilities are calculated in the report, the impacts of the decreased energy use are not taken into account. The employment increases cited under the utilities sector refer to jobs created through the implementation of more energy efficient processes or technologies in a utility, rather than a holistic analysis of the impact of energy efficiency on utilities. According to the report’s methodology, which bases employment impacts in an industry on the amount of investment made in the industry, investment decreases from lower customer bills would decrease employment in the utility sector. Again, this reduction in energy demand would likely have negative

9
IndEco Strategic Consulting Inc. & Econometric Research Ltd.
effects on the employment numbers in sectors of the economy responsible for electricity generation and energy supply.
Taken beyond the energy industry, and into a region-wide economic analysis, the resulting reallocation of money saved through energy savings are not considered. Once the distribution and reallocation of investments within the energy industry is holistically analyzed, the resulting net monetary savings will enter other sectors of the economy. This will consequentially increase investments in other sectors, and again, using a given jobs/output ratio, will increase the number of jobs in that sector.
2.3 The new mother lode: The potential for more efficient electricity use in the southwest
Methodology
A 2002 report by the Southwest Energy Efficiency Project (SWEEP) assesses the impact that more energy efficient electricity practices in six southern states would have on the economy. The states included are: Arizona, Colorado, Nevada, New Mexico, Utah and Wyoming. Using the IMPLAN input-output model, predicted changes in energy expenditures are matched with the respective employment multiplier in the database. The report defines a job as employment that provides “sufficient wages to employ one person full-time for one year” (p4-2). In order to assess the net employment impacts, employment forecasts for a “high efficiency” scenario are compared to a base case scenario. The period over which employment impacts are analyzed is from 1997 to 2020.
Region wide energy use by sector in the baseline year was: 56 940 GWh for the residential sector, 65 810 GWh for the commercial sector, 53 393 GWh for the industrial sector and 176 143 GWh in total. The base case scenario assumes that demand in each of these sectors will increase annually by 2.4 %, 3.5 % and 1.6 % in the residential, commercial and industrial sectors respectively with an overall demand increase of 2.6% per annum. It is also assumed that renewable energy policies will be maintained over the analysis period without any introduction of new initiatives, resulting in 29 TWh of renewable electricity generation by 2020. The base case scenario predicts an increased reliance on natural gas followed by a larger reliance on coal as gas prices are expected to rise and those for coal to decrease.
The high efficiency scenario assumes that demand grows at rates of 0.92%, 1.20%, -0.32% and 0.69% per annum for the residential, commercial, industrial sectors, and overall respectively. The 2020

10
The employment impacts of energy conservation
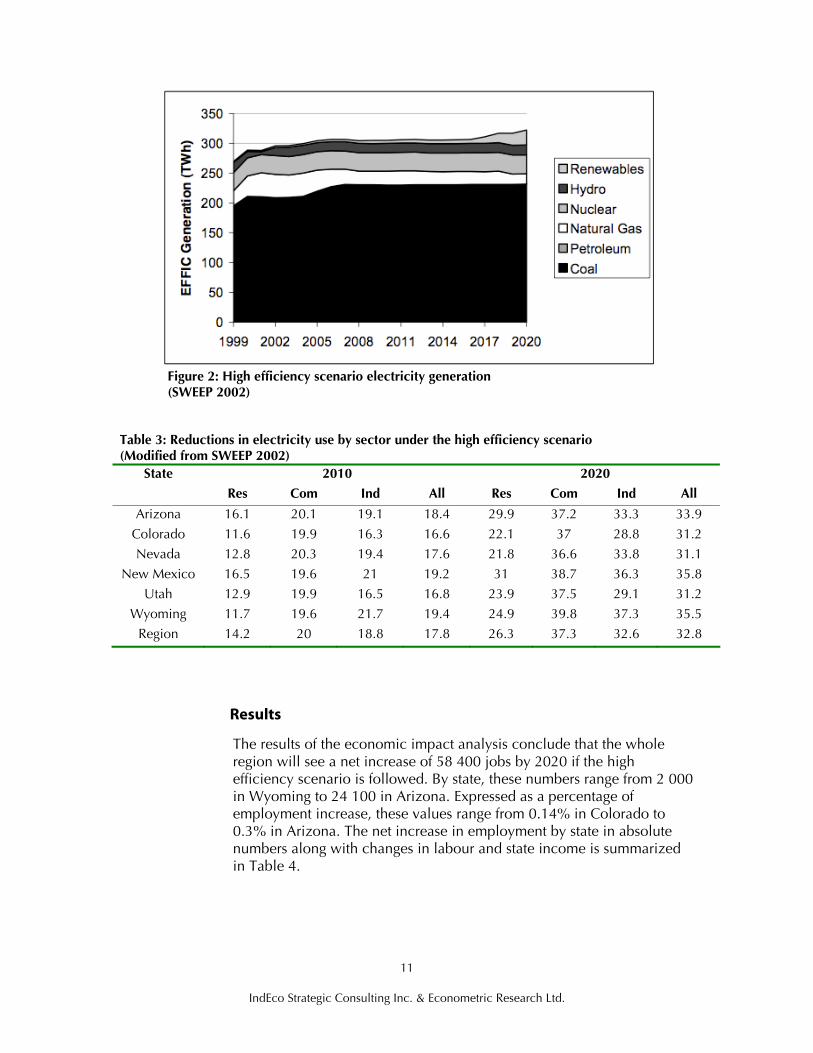
forecast predicts that in absolute terms, coal production decreases while hydro and nuclear remain constant. The energy supply mix forecasts for the base case scenario and high efficiency scenario are shown in Figure 1 and Figure 2 respectively. Table 3 shows the savings that would be accrued under the high efficiency scenario at milestone years 2010 and 2020.
Other assumptions of the high efficiency scenario include:
Electricity prices remain at 1999 levels.
85% of energy efficiency investments will be spent within the state analyzed.
Labour productivity in manufacturing increases by one percent per year.
Roughly 40% of investment upgrades would be financed through bank loans with an average 10 percent nominal interest rate over a five-year period.
Other important aspects of the methodology are that electricity bill savings are accounted for only up to 2020 and that the assessment omits productivity benefits that may stem from investments in efficiency.
Figure 1: Base case electricity generation (SWEEP 2002)
11
IndEco Strategic Consulting Inc. & Econometric Research Ltd.
Figure 2: High efficiency scenario electricity generation (SWEEP 2002)
Table 3: Reductions in electricity use by sector under the high efficiency scenario (Modified from SWEEP 2002)
State 2010 2020
Res Com Ind All Res Com Ind All
Arizona 16.1 20.1 19.1 18.4 29.9 37.2 33.3 33.9
Colorado 11.6 19.9 16.3 16.6 22.1 37 28.8 31.2
Nevada 12.8 20.3 19.4 17.6 21.8 36.6 33.8 31.1
New Mexico 16.5 19.6 21 19.2 31 38.7 36.3 35.8
Utah 12.9 19.9 16.5 16.8 23.9 37.5 29.1 31.2
Wyoming 11.7 19.6 21.7 19.4 24.9 39.8 37.3 35.5
Region 14.2 20 18.8 17.8 26.3 37.3 32.6 32.8
Results
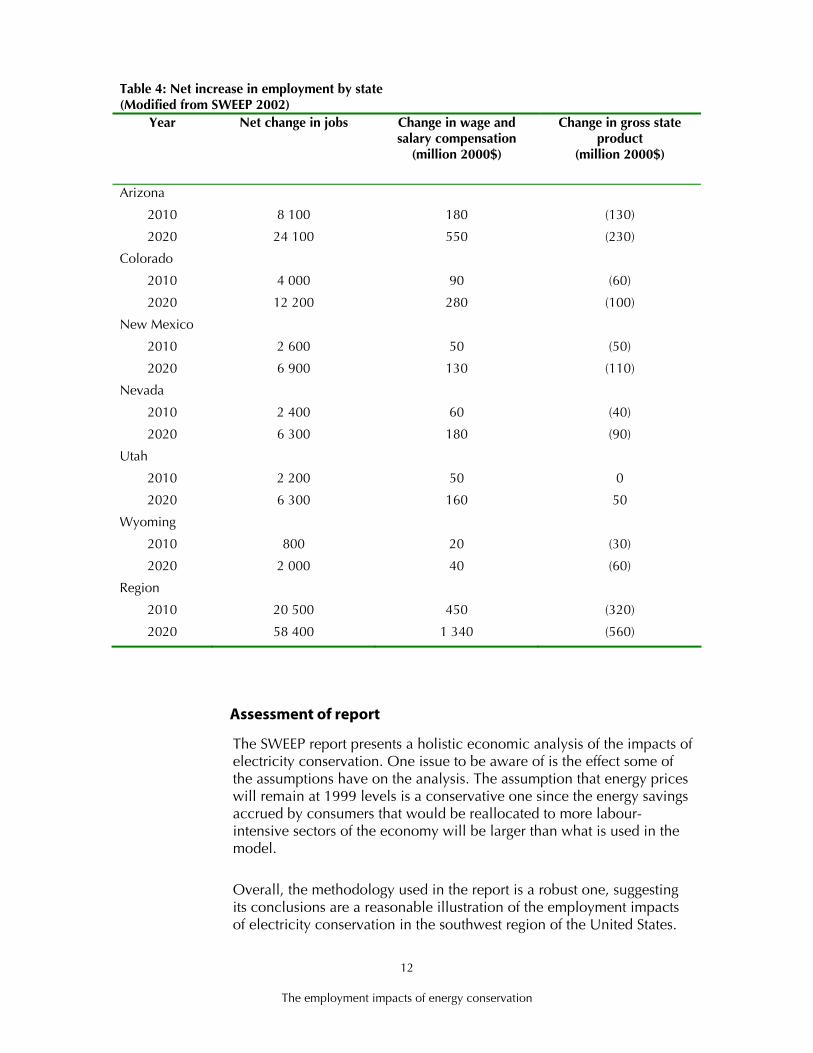
The results of the economic impact analysis conclude that the whole region will see a net increase of 58 400 jobs by 2020 if the high efficiency scenario is followed. By state, these numbers range from 2 000 in Wyoming to 24 100 in Arizona. Expressed as a percentage of employment increase, these values range from 0.14% in Colorado to 0.3% in Arizona. The net increase in employment by state in absolute numbers along with changes in labour and state income is summarized in Table 4.
12
The employment impacts of energy conservation
Table 4: Net increase in employment by state (Modified from SWEEP 2002)
Year Net change in jobs Change in wage and salary compensation
(million 2000$)
Change in gross state product
(million 2000$)
Arizona
2010 8 100 180 (130)
2020 24 100 550 (230)
Colorado
2010 4 000 90 (60)
2020 12 200 280 (100)
New Mexico
2010 2 600 50 (50)
2020 6 900 130 (110)
Nevada
2010 2 400 60 (40)
2020 6 300 180 (90)
Utah
2010 2 200 50 0
2020 6 300 160 50
Wyoming
2010 800 20 (30)
2020 2 000 40 (60)
Region
2010 20 500 450 (320)
2020 58 400 1 340 (560)
Assessment of report
The SWEEP report presents a holistic economic analysis of the impacts of electricity conservation. One issue to be aware of is the effect some of the assumptions have on the analysis. The assumption that energy prices will remain at 1999 levels is a conservative one since the energy savings accrued by consumers that would be reallocated to more labour-intensive sectors of the economy will be larger than what is used in the model.
Overall, the methodology used in the report is a robust one, suggesting its conclusions are a reasonable illustration of the employment impacts of electricity conservation in the southwest region of the United States.

13
IndEco Strategic Consulting Inc. & Econometric Research Ltd.
Given differences between the analyzed states and Ontario, the employment estimates in this report are not readily transferable to the Ontario context. Beyond variances in populations and social contexts, this precaution must be considered due to the differences in the economic structure, in which will require different application of economic multipliers to the province’s expenditures. For example, this would make it important to differentiate the employment impacts of reallocating expenditures from coal to energy efficiency from reallocating expenditures from nuclear power to energy efficiency.
2.4 Current and potential green jobs in the economy
Methodology
The 2008 Global Insight report written for the United States Conference of Mayors and the Mayors Climate Protection Center forecasts the number of green jobs that will be developed in the U.S. by the year 2038. The forecasts are conducted for three separate categories: renewable power generation, residential and commercial retrofits and renewable transportation.
The direct employment impacts derived from industry specific data are followed by an assessment of the indirect employment growth expected in each category which assumes that one indirect job is created for every two direct jobs. The assessment of employment impacts resulting from residential and commercial retrofits is the only category that concerns energy efficiency, and will therefore form the focus of the report’s review.
The projections assume that a 35% reduction of energy use will be achieved over the next 3 decades in existing residential and commercial buildings. These savings are expected to occur in equal increments of 1.2% per year. Using 2008 energy use data for the baseline, these savings represent 32 000 GWh/a.
In order to assess the impact of these energy savings on the workforce, Global Insight derives coefficients using data from the ACEEE report. It uses ACEEE results of predicted energy savings in each sector and the number of efficiency-related jobs in the respective sectors to develop a ratio between the amount of energy saved and the resulting number of jobs. Global Insight then applied these ratios to the predicted energy savings in each respective sector to estimate the employment impacts of the energy efficiency initiatives.

14
The employment impacts of energy conservation
Results
Global Insight’s analysis predicts that the if the above energy savings are realized through residential and commercial retrofits, it would create a total of 81 000 direct jobs. Of these jobs, 36 000 would be a result of retrofits in the residential sector, and 45 000 in the commercial sector.
By applying its one indirect for every two direct jobs assumption, the report estimates that the 40 500 indirect jobs in the engineering, legal and research and consulting industry would be created as a result of the retrofits. This gives a total of 121 500 direct and indirect jobs.
Assessment
The results presented in the Global Insight’s report are limited to the retrofit industry and therefore provide limited insight on the potential impacts of energy efficiency. Further, the analysis does not assess the impacts of energy efficiency on other sectors of the economy, as is the case in some of the previously discussed literature.
Within its derivation of ACEEE employment estimates, the methodology presents some important issues. First, a simple calculation shows that the ratio that Global Insight derived from the ACEEE report uses the values for the “total efficiency-related jobs” rather than the “efficiency premium related jobs.” Consequently, the estimates made in the Global Insight report are representative of employment created by the efficiency features of a product in addition to the employment irrespective of its energy efficiency features.
A second misapplication of the ACEEE estimates concerns the differentiation between direct and indirect jobs. As discussed in section 2.2, the ACEEE assessment aggregates direct and indirect jobs in its reported numbers using a weighted average. Global Insight, however, treats the ratio derived from these numbers as representative of direct jobs only. The weighted average would partially take into account indirect employment, making a full indirect additive component to the final number partly redundant.
Finally, the Global Insight report states that the ratio derived from the ACEEE numbers represent a relationship between the amount of electricity saved and jobs created, but since the ACEEE assessment also considers non-electric energy savings, this is not actually the case.

15
IndEco Strategic Consulting Inc. & Econometric Research Ltd.
2.5 Green jobs: Towards decent work in a sustainable low-carbon world
A 2008 report released by the United Nations Environment Programme (UNEP) cites the employment potential of environmental industries in various countries by drawing on several externally prepared reports. UNEP references the assessments conducted by ASES and the Hewlett Foundation Energy series in sections 2.1 and 2.4 respectively. In addition to these accounts of employment resulting from energy efficiency, UNEP references an assessment conducted for the US Midwest which predicts that reducing one percent of natural gas and electricity consumption will lead to 30 000 new jobs. The methodology for the assessment conducted on the US Midwest is proprietary and can therefore not be analyzed. The other results presented in the UNEP report are specific to certain initiatives such as US Department of Energy estimates on clothes washers, water heaters, and fluorescent lamp ballasts, and the report has not provided with the assessment methodology, therefore providing limited insight.
2.6 New York Energy Smart Program Report
Methodology
Annual reports of the New York Energy Smart program include an assessment of the employment that has resulted and is expected to result from the program. The New York Energy Smart program has a wide scope that includes market transformation programs, installation of energy efficient products and technologies in residential, commercial and industrial applications, peak shifting, low-income specific energy efficiency programs and research and development programs. The program, and therefore the cited employment impacts are not strictly a result of electricity savings, but also include energy savings from natural gas and oil heating. The evaluation report includes a macroeconomic analysis of the programs using a state-wide input output model. In order to determine the net changes in employment as a result of the program, the result compares the impacts of the planned program expenditures to a base case that forecasts employment when the program is not implemented. The base case assumes that the systems benefit charge to ratepayers which funds the program’s implementation is not applied, resulting in:
Increased disposable income for residential customers
Increased retained earnings for businesses
Increased purchases of electricity, natural gas and oil

16
The employment impacts of energy conservation
The total planned expenditures over the 13 years of program implementation are set at $1.87 billion. The predicted energy savings over the 13 year program period and the years following implementation up until 2027 are not provided in the report. The cumulative annual energy savings resulting from the program up to and including 2006 are stated to be 2 458.7 GWh. Without a breakdown of the assumed savings, it is unclear what specific assumptions are used in the macroeconomic analysis. Jobs are presented as annual averages and include full time and part time employment.
Results
The macroeconomic assessment in the Energy Smart program evaluation predicts that an average of 8 612 jobs will be created and sustained over the 29 year period from the program commencement in 1999 to 2027. Of these jobs, 7 800 are expected to occur during the program’s implementation period (1999-2012), and 9 300 in the years following program implementation (2013-2027).
Table 5 summarizes the macroeconomic effects of the program.
Table 5: Summary of macroeconomic results of Energy Smart Program (Modified from NYSERDA 2006) Economic variable
Program implementation years
(1999-2012)
Years following program implementation
(2013-2027)
Annual average over 29-year analysis period
(1999-2027)
Net job growth 7 807 9 362 8 612
Labour income 361 000 000 283 000 000 321 000 000
Total output 573 000 000 346 000 000 456 000 000
Value Added 271 000 000 154 000 000 211 000 000
Assessment of report
The Energy Smart Program evaluation presents a holistic analysis of the employment effects of energy efficiency promotion. Due to limited available information on expenditures and long-term forecasts of energy savings associated with these programs, it is difficult to apply the information contained in this evaluation to other energy reduction goals and variant expenditure allocation within energy efficiency programs.
2.7 Conclusions
A summary of the literature review is presented in Table 6.

17
IndEco Strategic Consulting Inc. & Econometric Research Ltd.
Table 6: Summary of literature review
Report Methodology Results Comments
Renewable Energy and Energy Efficiency: Economic Drivers for the 21st Century American Solar Energy Society - 2007
• Associates portion of an industry that sells energy efficient services/products to the energy efficiency industry
• Includes transportation and heating
• Total employment in 2006 of 8 046 000 (3 498 000 direct, 4 548 000 indirect) for US
• Total employment in 2006 of 496 535 (205 780 direct, 290 755 indirect) for Ohio
• Advanced scenario forecasts for 2030 are 32 185 000 in the U.S and 2 096 000 in Ohio
• Attributes entire product to energy efficiency without taking into account what the employment effects would be if it were produced as an energy inefficient product
• Does not take into account reduced employment from reduced generation
• Does not take into account reallocation of money saved from lower energy expenditures
The Size of the U.S Energy Efficiency Market: Generating a More Complete Picture
American Council for an Energy Efficient Economy - 2008
• Considers incremental investment required to make products/services energy efficient
• Includes heating and transportation
• Transportation estimates provided separately
• Total efficiency premium related jobs in 2004 of 233 500 in the US
• By subtracting the transportation sector, resulting employment is 210 800 in the US
• Does not take into account reduced employment from reduced generation
• Does not take into account reallocation of money saved from lower energy expenditures
The New Mother Lode. The Potential for More Efficient Electricity use in the Southwest
Southwest Energy Efficiency Project - 2002
• Uses input/output model to forecast the future impacts of reducing electricity generation and increasing energy efficiency investments under a high efficiency scenario
• Analysis conducted on: Arizona, Colorado, Nevada, New Mexico, Utah and Wyoming
• Only considers impacts from electricity
• A job is defined as full-time employment for one person for one year
• Net increase of 58 400 jobs by 2020 in the whole region
• By state, these numbers range from 2 000 in Wyoming to 24 100 in Arizona
• In percentage, state numbers
• Overall a robust analysis
• Different energy supply mix than Ontario means the economic multipliers will be different in the Ontario context

Report Methodology Resul Comments ts range from 0.14% increase in Colorado to 0.3% increase in Arizona
Current and Potential Green Jobs in the Economy Global Insight - 2008
• Uses ratios derived from ACEEE report to forecast future employment associated with specified energy reductions
• Energy efficiency in commercial and residential buildings assessed only
• Includes heating
• Predicts the creation of a total of 81 000 direct jobs in the US by 2038
• Predicts the creation of a total of 40 500 indirect jobs in the US by 2038
• Since this assessment uses ACEEE results, it contains the same issues found in the ACEEE report
• Also treats the ratios derived from ACEEE results as direct employment when it is actually a weighted average between direct and indirect employment
Green Jobs: Towards decent work in a sustainable, low-carbon world
WorldWatch Institute - 2008
• References other reports, does not make unique estimates.
• The referenced reports include ASES and ACEEE reports
• Methodologies for other reports not provided
New York Energy Smart Program Evaluation and Status Report New York State Energy Research and Development Authority - 2006
• Uses input/output model to forecast employment effects of Energy Smart program on the state of New York
• Includes natural gas and oil heating
• Employment numbers presented as annual averages and include full time and part time employment
• 8 612 jobs will be created and sustained over the program period from 1999 to 2012 and sustained through to 2027
• Robust methodology
• Does not provide energy saving and generation reallocation assumptions, assessment therefore cannot be compared to other contexts
18
The employment impacts of energy conservation

19
IndEco Strategic Consulting Inc. & Econometric Research Ltd.
A small variety of recent assessments on the employment impacts of energy efficiency in North America are currently available. Although illustrative of the growing place of energy efficiency in the market, many of these assessments do not take a comprehensive look at the issue. In some cases, the reports incorrectly attribute entire industries to energy efficiency rather than the increment in market size or investment particularly due to energy efficient factors. Within the literature review, only two of the analyses provide a comprehensive look at the employment impacts of energy efficiency using macroeconomic analysis.
The analysis conducted by SWEEP presents a robust analysis of the potential employment impacts of energy efficiency. Due to variances in energy infrastructure and the economic structure between southwest U.S and Ontario, the evaluation is illustrative of the potential macroeconomic impacts of energy efficiency, but cannot be used to infer employment resulting from energy efficiency in Ontario.
In the case of the NYSERDA evaluation report, the assumptions used in the analysis are not provided, and as a result cannot be assessed for applicability to the Ontario context. Further, the report is restricted to the assessment of a state energy conservation program.
An outstanding issue present in the literature is the wide inconsistency, and in many cases lack of a definition of what constitutes a “job,” making comparisons of available results difficult.
In order to provide reasonable estimates of employment for the purpose of the present report, a regionally-specific full macroeconomic analysis is required. This analysis should consider the economy wide additive as well as subtractive impacts of energy conservation. This would require a rigorous definition of energy efficiency, more refined energy savings estimates, and a specific definition of employment.

20
The employment impacts of energy conservation
3 Comparative economic impacts of conservation and demand management programs in Ontario
The assessment of conservation and demand management (CDM) activities requires the analysis of the likely impacts of such activities on energy use and on the economy at large. Indeed, the primary objective of conservation is the saving of energy and the preservation of wealth and natural resources. This objective is desirable and significant by itself. These activities, however, have spill-over effects on other sectors of the economy and these cannot and need not be ignored.
In most energy policy studies, the energy sector is typically viewed in isolation from the remainder of the economy, and the analysis is performed without consideration of broader impacts. The employment structure and level or other macroeconomic indicators are taken as given – as though they are not affected by the energy sector. This is not satisfactory, for there is a considerable two-way interdependence with the remainder of the economy as discussed in the previous chapters.
As a rough measure of the benefit or cost of a given energy activity or policy, it is often sufficient to calculate the impact upon aggregate output (Gross Provincial Product (GPP)) and employment. These have been calculated for four broad energy conservation program areas.
The direct savings of energy or the substitution of more available or cheaper types of energy for the less available or more expensive types are identified as the primary benefits of the conservation activities and are referred to as the net avoided costs in the calculations below (See Table 7 and Figure 3).

21
IndEco Strategic Consulting Inc. & Econometric Research Ltd.
Table 7: Avoided costs, equipment and program costs of conservation programs in millions of 2007 dollars (IPSP 2007) Energy
Efficiency Demand
Management Fuel
Switching Customer
Based Generation
Total
Total Avoided Cost $16 281 $2 978 $4 487 $2 617 $26 362
Incremental Equipment Costs
$3 509 $605 $1 078 $2 144 $7 337
Program Costs $1 210 $465 $422 $21 $2 118
Replacement Fuel Costs
N/A N/A $357 N/A $357
Incremental Energy Costs
N/A N/A N/A $80 $80
Net Avoided Cost $11 561 $1 907 $2 630 $372 $16 470
Energy EfficiencyDemand
Management Fuel SwitchingCustomer Based
Generation
Equipment and Program Costs
Net Avoided Cost
Total Avoided Cost
$0
$2,000
$4,000
$6,000
$8,000
$10,000
$12,000
$14,000
$16,000
$18,000
Mill
ions
of 2
007
Dol
lars
Figure 3: Avoided costs, equipment and program costs
The four CDM program areas in the Integrated Power System Plan (IPSP) are: energy efficiency, demand management, fuel switching and customer based generation. The net avoided cost which is the difference between energy cost savings and the cost of equipment and programs to
22
The employment impacts of energy conservation
attain these savings are calculated in 2007 dollars over a 20 year period from 2007 to 2027. In another section of the IPSP these savings (avoided costs) are expressed appropriately in net present values as a dollar today is not equivalent to a dollar a year from now. An appropriate financial discount rate (4%) is used to discount future dollars into present dollars. This discounting is not appropriate where expenditures are the drivers of economic activity as in impact analysis of the type that will be used in this section.
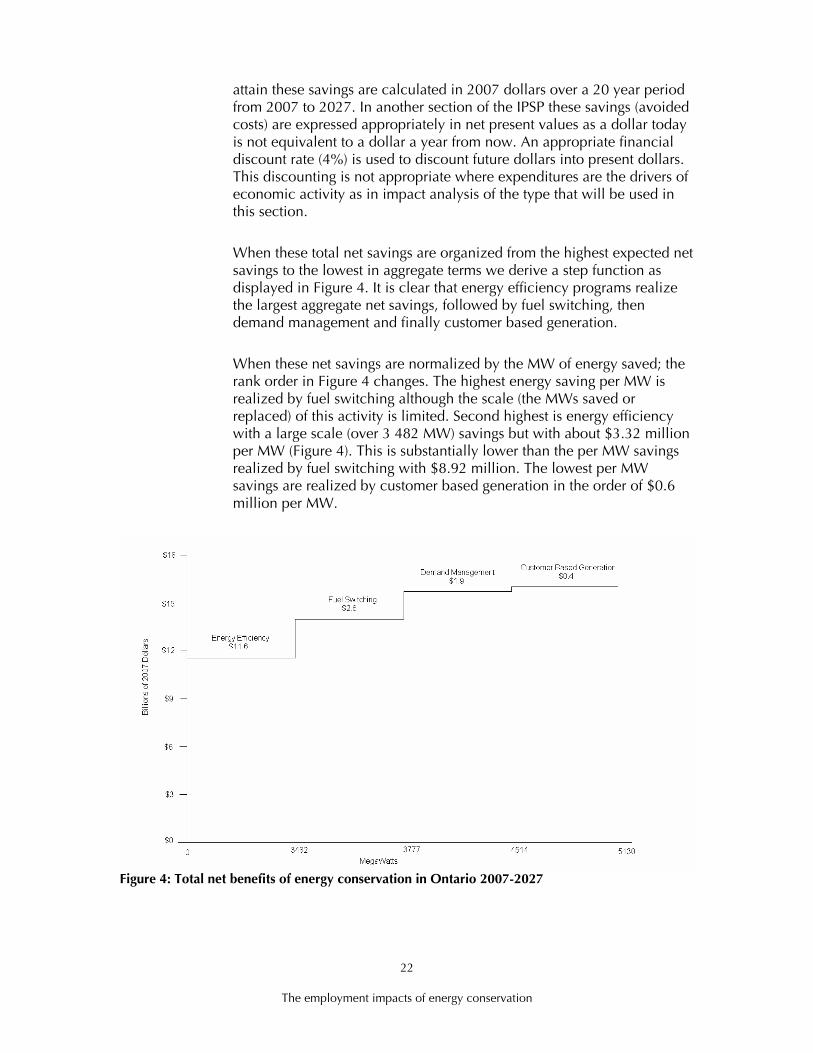
When these total net savings are organized from the highest expected net savings to the lowest in aggregate terms we derive a step function as displayed in Figure 4. It is clear that energy efficiency programs realize the largest aggregate net savings, followed by fuel switching, then demand management and finally customer based generation.
When these net savings are normalized by the MW of energy saved; the rank order in Figure 4 changes. The highest energy saving per MW is realized by fuel switching although the scale (the MWs saved or replaced) of this activity is limited. Second highest is energy efficiency with a large scale (over 3 482 MW) savings but with about $3.32 million per MW (Figure 4). This is substantially lower than the per MW savings realized by fuel switching with $8.92 million. The lowest per MW savings are realized by customer based generation in the order of $0.6 million per MW.
Figure 4: Total net benefits of energy conservation in Ontario 2007-2027

23
IndEco Strategic Consulting Inc. & Econometric Research Ltd.
Figure 5: Net benefit per MW of energy conservation in Ontario 2007-2027
The impact on production, employment and government revenues are identified as the secondary benefits or costs of the conservation alternatives. An important finding of our analysis is that CDM activities in Ontario will have positive impacts on employment and other macroeconomic indicators. This result is counter intuitive in the sense that reducing the operation of a given activity results in added economic performance. These added economic benefits derive from the savings that reduced production releases to the various sectors of the economy which in turn re-spend them on other goods and services. When consumers do not spend on electricity they can spend the saved money on other consumer bundles and when businesses do not spend on electricity they can distribute the saved costs to share holders as dividends to be spent by households, or businesses can spend it directly on expansion of their capital stock. The economy benefits when the savings reduce economic activity by less than the added activities generated by the expenditure of the savings by the various sectors realizing them.
We have developed a general equilibrium multi-sectoral model of the Ontario economy which captures the strong interactions between the energy sector and other sectors of the economy. This model is applied to assess the net economic impact of the four energy conservation alternatives.

24
The employment impacts of energy conservation
3.1 Economic impact analysis and methodology
A dollar spent on a conservation activity or program on wages and supplies circulates and re-circulates within the economy, multiplying the effects of the original expenditures on overall economic activity. This process is referred to as the economic multiplier effect. It operates at several levels:
The initial expenditures of the outfitters on wages and materials are generally referred to as the direct costs of the program and their effects are referred to as the initial (direct) effects.
Subsequent purchases by suppliers of materials and services to sustain the original and derivative expenditures are called the indirect effects.
The induced effects emerge when workers in the sectors stimulated by initial and indirect expenditures spend their additional incomes on consumer goods and services.
Some of the key terms and definitions are presented below to assist the reader in interpreting the results of the economic impact analysis:
Initial expenditures – This figure indicates the amount of expenditures directly made by the program. It is these expenditures that drive the results.
Value Added (Gross Provincial Income) – This figure represents net output generated by the initial expenditures in the province. It is typically the sum of wages, rent interest and profits in addition to indirect business taxes and depreciation minus subsidies.
Employment – This refers to the total person years (full-time equivalent jobs) generated by the program and its sustaining activities.
Taxes – Our impact system generates a large number of taxes (income taxes, GST, liquor and tobacco taxes, etc.) each of which is linked with the level of government receiving it. For example, the Federal government receives the proceeds from the GST tax, the Provincial government receives the PST tax and the Local government receives the property and business tax.
Imports – These represent the goods and services acquired from outside the province to sustain the activities of the conservation programs. They essentially represent leakages from the province.

25
IndEco Strategic Consulting Inc. & Econometric Research Ltd.
Multipliers – These are summary measures that represent the division of the total impacts (direct, indirect and induced) by the initial expenditures. For example, the income multiplier associated with energy efficiency programs is calculated by dividing the total income (value added) impact by the initial expenditures. The only exception is that of the employment multiplier where total employment is divided by direct employment in order to preserve the common units.
Economic impact analysis is a useful mathematical tool capable of quantifying the patterns and magnitudes of interdependence among sectors and activities. It is predicated on two fundamental propositions.
First, regardless of the inherent value of primary activities such as conservation of natural resources and the environment, to the extent that activity involves the use of scarce resources they generate economic consequences that can be measured and compared.
Second, economic impacts are only partially captured by assessing direct expenditures. Inasmuch as the economy is a complex whole of interdependent and interacting activities, there are some significant indirect and induced impacts associated with the direct expenditures. These indirect and induced impacts can often be larger than the direct impacts.
3.2 The economic impact model
The impact model used here is a special application of ERL’s generic model Regional Impact Model (RIM). It is a unique model that captures the economic impact of expenditures at the local level (counties or economic regions), the provincial level (Ontario) and the national level. The model is based on a novel technology that integrates input-output analysis and location theory. The system has already been applied to the study of several projects in Ontario, Alberta, Quebec, New Brunswick and at the national level. A short list can be accessed at ERL’s website (www.econometricresearchlimited.com).
3.3 The economic impacts of the energy efficiency program
Each CDM area generates savings that are treated as two separate activities. First, a negative (decline) expenditure arising from reducing generation is counted and second, a positive expenditure of equivalent magnitude is assumed to represent the savings realized on lower consumption of electricity. The latter trigger increases in consumption of other goods and services. But the savings in electricity would not arise

26
The employment impacts of energy conservation
without sustaining programs and expenditures on equipment and products. The program expenditures will be treated as a positive impulse on the economy. An equivalent negative is introduced to take into account that an uplift charge, applied as a global adjustment by the Independent Electricity System Operator (IESO) will be used to finance these programs and incentives, and customers may incur equipment costs beyond what is covered by the incentives. The net impacts in the tables and figures below are typically the net addition of the positive impulses and the negative impulses. More specifically in the case of energy efficiency, the impact results in that shown in Table 8; which represents the negative consequences of scaling back the production of energy to the tune of $16 281 million from 2007 to 2027, the positive impacts that arise from spending these $16 281 million savings on other goods and services, the positive impacts that accrue on spending of $4 719 million on program and incremental equipment and finally the decline in expenditures on other goods and services by the same amount as consumers and businesses ultimately have to pay for these programs and equipment.

27
IndEco Strategic Consulting Inc. & Econometric Research Ltd.
Table 8: Net impacts of energy efficiency (millions of 2007 dollars)
Generation Reduction
Increased Expenditures
Program Expenditures
Reduced Expenditures
Net Impacts
Initial Expenditure $(16 281) $16 281 $4 719 $(4 719) $0 Value Added Direct $(12 160) $9 359 $2 708 $(2 715) $(2 808) Indirect & Induced $(5 424) $7 675 $1 932 $(2 226) $1 957 Total $(17 584) $17 034 $4 640 $(4 941) $(851) Multiplier 1.08 1.16 0.98 1.16 N/A Gross Output Direct $(16 281) $16 281 $4 719 $(4 719) $0 Indirect & Induced $(15 771) $18 899 $5 361 $(5 483) $3 006 Total $(32 052) $33 638 $10 080 $(9 759) $1 907 Multiplier 1.97 2.28 2.14 2.28 N/A Wages & Salaries Direct $(5 468) $6 002 $1 619 $(1 741) $412 Indirect & Induced $(3 716) $4 670 $1 201 $(1 355) $800 Total $(9 184) $10 672 $2 820 $(3 096) $1 212 Employment (person-years) Direct (69 892) 109 250 22 259 (31 693) 29 924 Indirect & Induced (129 843) 143 968 38 683 (41 764) 11 043 Total (199 735) 253 217 60 942 (73 457) 40 967 Multiplier 2.86 2.32 2.74 2.32 1.37 Taxes Federal $(2 521) $2 999 $832 $(870) $440 Provincial $(1 652) $2 034 $524 $(566) $340 Local $0 $436 $95 $0 $531 Total $(4 173) $5 469 $1 451 $(1 436) $1 311 Imports From Other Provinces $(2 240) $2 716 $977 $(787) $666 From Other Countries $(1 102) $1 283 $349 $(373) $157 Total $(3 342) $3 999 $1 326 $(1 160) $823
It is quite natural to end up with a few net overall impacts of the entire energy efficiency program. These are heavily concentrated in value added. Utilities tend to display high value added per unit of output given their high interest payments, rent and wages. Invariably, however, all other net impacts are positive. The most notable positive impact is on the employment level. About 41 000 person year employment will be gained on account of this conservation program. This is not surprising given that energy generation is typically capital intensive whereas general consumption expenditures are labour intensive given the high share of services in these expenditures. More surprisingly are the positive net gains in all taxes and in the revenues of all three levels of government and the positive gains in wages and salaries (Table 8 and Figures 6, 7 and 8).
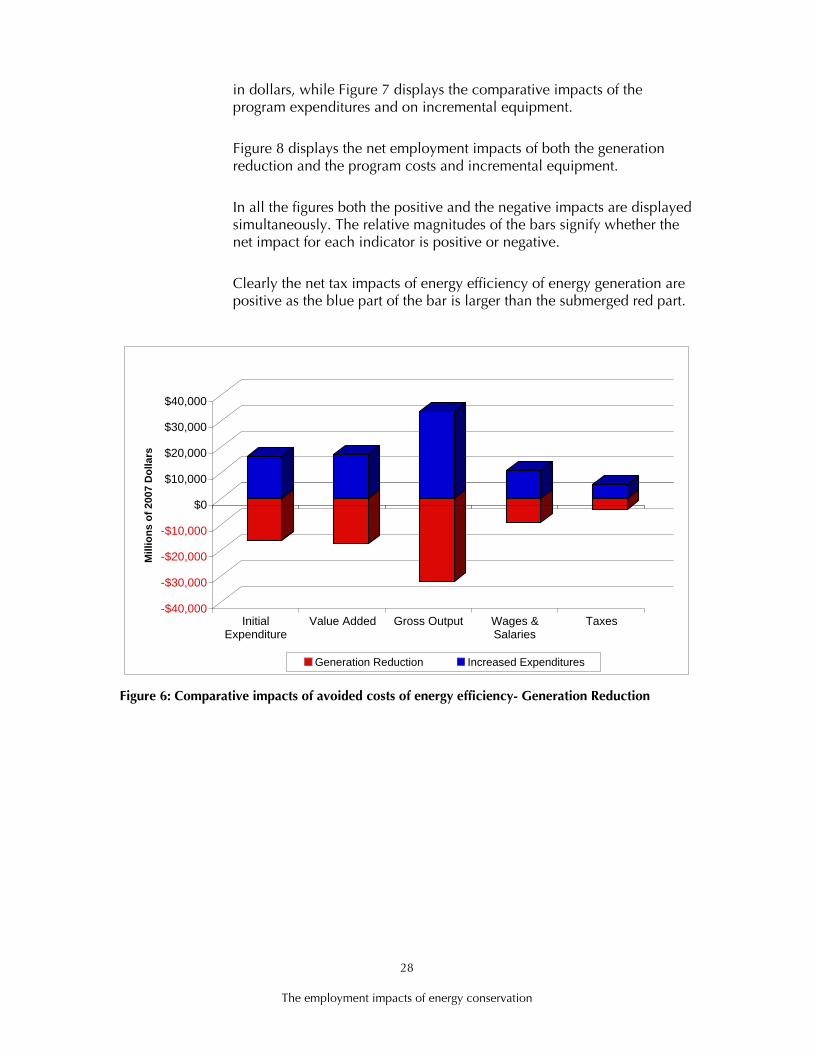
Figure 6 displays the comparative impacts of the avoided costs activities associated with generation reduction, but only those that are expressed
28
The employment impacts of energy conservation
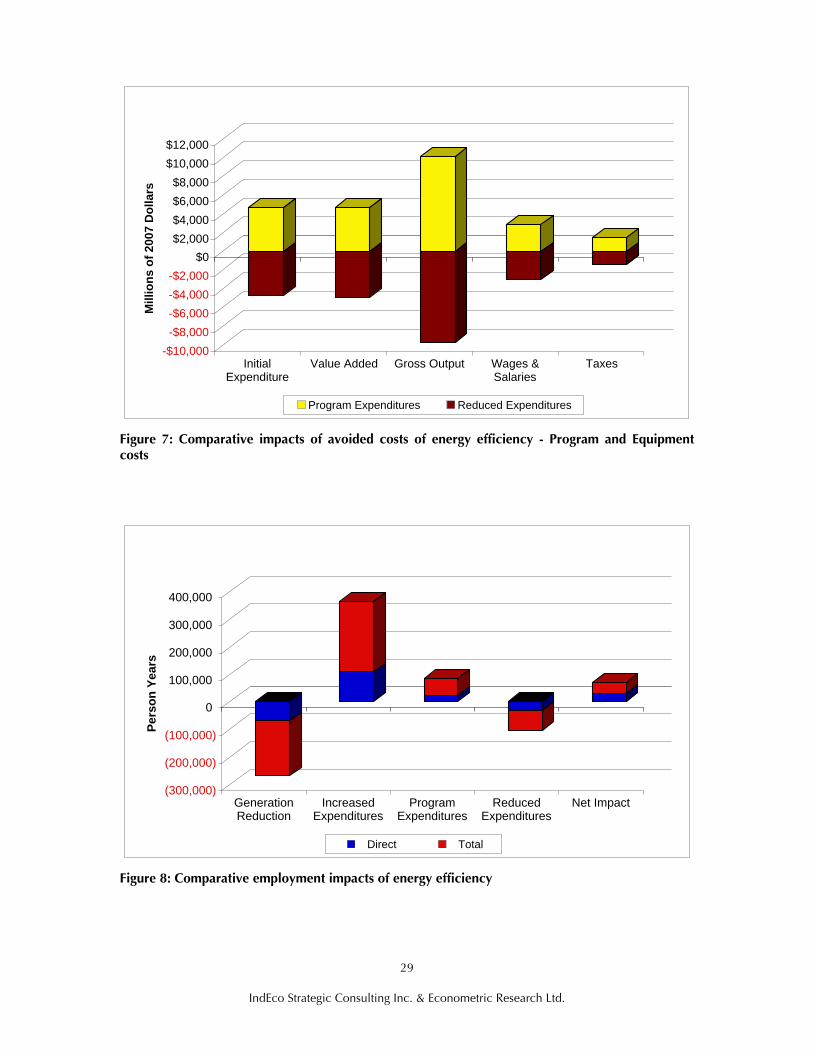
in dollars, while Figure 7 displays the comparative impacts of the program expenditures and on incremental equipment.
Figure 8 displays the net employment impacts of both the generation reduction and the program costs and incremental equipment.
In all the figures both the positive and the negative impacts are displayed simultaneously. The relative magnitudes of the bars signify whether the net impact for each indicator is positive or negative.
Clearly the net tax impacts of energy efficiency of energy generation are positive as the blue part of the bar is larger than the submerged red part.
-$40,000
-$30,000
-$20,000
-$10,000
$0
$10,000
$20,000
$30,000
$40,000
Mill
ions
of 2
007
Dol
lars
InitialExpenditure
Value Added Gross Output Wages &Salaries
Taxes
Generation Reduction Increased Expenditures
Figure 6: Comparative impacts of avoided costs of energy efficiency- Generation Reduction
29
IndEco Strategic Consulting Inc. & Econometric Research Ltd.
-$10,000-$8,000-$6,000-$4,000-$2,000
$0$2,000$4,000$6,000$8,000
$10,000$12,000
Mill
ions
of 2
007
Dol
lars
InitialExpenditure
Value Added Gross Output Wages &Salaries
Taxes
Program Expenditures Reduced Expenditures
Figure 7: Comparative impacts of avoided costs of energy efficiency - Program and Equipment costs
(300,000)
(200,000)
(100,000)
0
100,000
200,000
300,000
400,000
Pers
on Y
ears
GenerationReduction
IncreasedExpenditures
ProgramExpenditures
ReducedExpenditures
Net Impact
Direct Total
Figure 8: Comparative employment impacts of energy efficiency

30
The employment impacts of energy conservation
3.4 The Economic impacts of the demand management programs
Generation reductions are estimated under demand management programs to decline by $2 978 million. Expenditures on demand management programs are expected to exceed $1 070 million between 2007 and 2027. All values are expressed in 2007 constant dollars (Table 9).
Again, the impacts of demand management programs are positive. The reduction of generation releases resources to consumers and business and when these resources are spent their impacts are larger than the declines caused by reducing peak generation.

31
IndEco Strategic Consulting Inc. & Econometric Research Ltd.
Table 9: The net impacts of demand management (millions of 2007 dollars)
Generation Reduction
Increased Expenditures
Program Expenditures
Reduced Expenditures
Net Impacts
Initial Expenditure $(2 978) $2 978 $1 070 $(1 070) $0 Value Added Direct $(2 225) $1 713 $632 $(616) $(496) Indirect & Induced $(992) $1 405 $488 $(505) $396 Total $(3 217) $3 118 $1 120 $(1 121) $(100) Multiplier 1.08 1.16 1.05 1.16 N/A Gross Output Direct $(2 978) $2 978 $1 070 $(1 070) $0 Indirect & Induced $(2 885) $3 459 $1 287 $(1 244) $617 Total $(5 863) $6 157 $2 357 $(2 214) $437 Multiplier 1.97 2.28 2.20 2.28 N/A Wages & Salaries Direct $(1 000) $1 098 $396 $(395) $99 Indirect & Induced $(680) $855 $302 $(307) $170 Total $(1 680) $1 953 $698 $(702) $269 Employment (person-years) Direct (12 784) 20 008 5 424 (7 207) 5 440 Indirect & Induced (23 747) 26 348 9 685 (9 467) 2 819 Total (36 532) 46 355 15 109 (16 674) 8 259 Multiplier 2.86 2.32 2.79 2.31 1.52 Taxes Federal $(460) $549 $203 $(198) $94 Provincial $(302) $372 $132 $(128) $74 Local $0 $80 $26 $0 $106 Total $(762) $1 001 $361 $(326) $274 Imports From Other Provinces $(409) $497 $217 $(179) $126 From Other Countries $(202) $235 $83 $(85) $31 Total $(611) $732 $300 $(264) $157

32
The employment impacts of energy conservation
-$6,000
-$4,000
-$2,000
$0
$2,000
$4,000
$6,000
$8,000M
illio
ns o
f 200
7 D
olla
rs
InitialExpenditure
Value Added Gross Output Wages &Salaries
Taxes
Generation Reduction Increased Expenditures
Figure 9: Comparative impacts of avoided costs of demand management - Generation Reduction

33
IndEco Strategic Consulting Inc. & Econometric Research Ltd.
-$2,500
-$2,000
-$1,500
-$1,000
-$500
$0
$500
$1,000
$1,500
$2,000
$2,500M
illio
ns o
f 200
7 D
olla
rs
InitialExpenditure
Value Added Gross Output Wages &Salaries
Taxes
Program Expenditures Reduced Expenditures
Figure 10: Comparative impacts of avoided costs of demand management - Program and Equipment Costs
(60,000)
(40,000)
(20,000)
0
20,000
40,000
60,000
80,000
Pers
on Y
ears
GenerationReduction
IncreasedExpenditures
ProgramExpenditures
ReducedExpenditures
Net Impact
Direct Total
Figure 11: Comparative employment impacts of demand management

34
The employment impacts of energy conservation
Substantial gains in employment are registered. A total of 8 259 person years are gained on the demand management program (Table 9 and Figure 11). Wages and salaries also show positive gains of over $269 million over the entire period.
Equally impressive are the positive net impacts displayed for tax revenues of the three levels of government exceeding $274 million generated by the demand management program. The employment impacts are quite revealing. The aggregate net impact is positive but the variations within the two components of the program are revealing (Figure 9).
3.5 The economic impacts of fuel switching programs
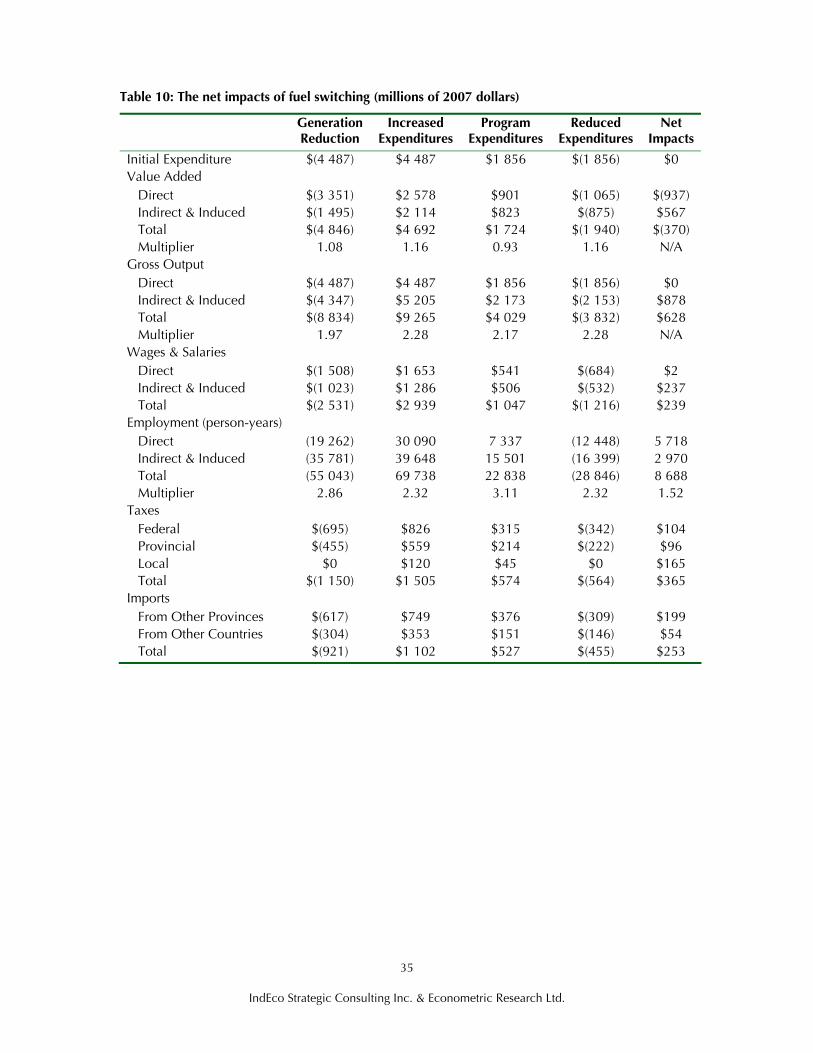
Fuel switching programs have far reaching consequences. These programs entail meeting energy needs otherwise met with electricity by using other fuels, principally natural gas. It is this thermodynamic efficiency in the use of fuel directly that anchors the economic impacts of this option and makes it meaningful and relevant. The net impacts are made of the following components. There are numerous benefits for the scale of fuel switching outlined in the IPSP.
First, there is the $4 487 million generation reduction from the expensive source and the expenditure of $1 856 on the substitute fuel. The combined net impacts are positive and almost equivalent to those from demand management programs that are more expensive (Table 10). The net impacts show positive employment gains of over 8 688 person years over the 20 year period. Wages and salaries are also higher under fuel switching by about $239 million. Again the three levels of government show positive gains in their revenues, with the local governments showing the highest net gains (Figure 12, Figure 13, and Figure 14). The total government gains exceed $365 million.
35
IndEco Strategic Consulting Inc. & Econometric Research Ltd.
Table 10: The net impacts of fuel switching (millions of 2007 dollars)
Generation Reduction
Increased Expenditures
Program Expenditures
Reduced Expenditures
Net Impacts
Initial Expenditure $(4 487) $4 487 $1 856 $(1 856) $0 Value Added Direct $(3 351) $2 578 $901 $(1 065) $(937) Indirect & Induced $(1 495) $2 114 $823 $(875) $567 Total $(4 846) $4 692 $1 724 $(1 940) $(370) Multiplier 1.08 1.16 0.93 1.16 N/A Gross Output Direct $(4 487) $4 487 $1 856 $(1 856) $0 Indirect & Induced $(4 347) $5 205 $2 173 $(2 153) $878 Total $(8 834) $9 265 $4 029 $(3 832) $628 Multiplier 1.97 2.28 2.17 2.28 N/A Wages & Salaries Direct $(1 508) $1 653 $541 $(684) $2 Indirect & Induced $(1 023) $1 286 $506 $(532) $237 Total $(2 531) $2 939 $1 047 $(1 216) $239 Employment (person-years) Direct (19 262) 30 090 7 337 (12 448) 5 718 Indirect & Induced (35 781) 39 648 15 501 (16 399) 2 970 Total (55 043) 69 738 22 838 (28 846) 8 688 Multiplier 2.86 2.32 3.11 2.32 1.52 Taxes Federal $(695) $826 $315 $(342) $104 Provincial $(455) $559 $214 $(222) $96 Local $0 $120 $45 $0 $165 Total $(1 150) $1 505 $574 $(564) $365 Imports From Other Provinces $(617) $749 $376 $(309) $199 From Other Countries $(304) $353 $151 $(146) $54 Total $(921) $1 102 $527 $(455) $253

36
The employment impacts of energy conservation
-$10,000
-$8,000
-$6,000
-$4,000
-$2,000
$0
$2,000
$4,000
$6,000
$8,000
$10,000M
illio
ns o
f 200
7 D
olla
rs
InitialExpenditure
Value Added Gross Output Wages &Salaries
Taxes
Generation Reduction Increased Expenditures
Figure 12: Comparative impacts of avoided costs of fuel switching - Generation Reduction

37
IndEco Strategic Consulting Inc. & Econometric Research Ltd.
-$4,000
-$3,000
-$2,000
-$1,000
$0
$1,000
$2,000
$3,000
$4,000
$5,000M
illio
ns o
f 200
7 D
olla
rs
InitialExpenditure
Value Added Gross Output Wages &Salaries
Taxes
Program Expenditures Reduced Expenditures
Figure 13: Comparative impacts of avoided costs of fuel switching - Program and Equipment Costs
(80,000)
(60,000)
(40,000)
(20,000)
0
20,000
40,000
60,000
80,000
100,000
Pers
on Y
ears
GenerationReduction
IncreasedExpenditures
ProgramExpenditures
ReducedExpenditures
Net Impact
Direct Total
Figure 14: Comparative employment impacts of fuel switching

38
The employment impacts of energy conservation
The picture that emerges from Figure 12, Figure 13, and Figure 14 is telling. The fuel efficiency programs result in solid if not substantial gains. Fuel switching programs at the scale envisaged in the IPSP pay in almost all aggregate economic indicators. The comparative impacts show larger impacts from expenditures of avoided cost than in the case of program expenditures but the differences in the generation impacts more than compensate for the limited net impacts of program expenditures. This is particularly the case in regards to the employment impacts as is clear in Figure 14, but the total net impacts are positive for all indicators except those of value added.
3.6 The economic impacts of the customer based generation program
Customer based generation is perhaps the closest to the system generation costs and therefore limited gains could be expected from this CDM program area. This is borne out in the data in Table 6 and in Table 10.
Generation savings are estimated to be about $2 617 million but program and equipment and other costs are almost equal to these savings with about $2 245. When the comparative impacts are estimated using the alternative expenditures their values are not impressive. This may also be the result of the fact that the Utility sector in the Ontario Input Output tables is an aggregate of many different modes of generation. We are not able to look at the differences in impacts that arise within this activity as modes of production change. It could very well be the case that employment intensities of wind mills are higher than nuclear facilities per MW generated, but this information is not currently available.
The overall net impacts are mixed. They are negative for value added and employment but positive for gross output and taxes. In this case the primary value of this conservation program is in the net avoided cost as the difference between what would it realize in energy generation reduction and the increase in program costs to attain these generation savings. The economic impacts sustained by the expenditures of the saving realized on generation reduction fall short of the differences in the net impacts of program expenditures.

39
IndEco Strategic Consulting Inc. & Econometric Research Ltd.
Table 11: The net impacts of customer based generation (in millions of 2007 dollars)
Generation Reduction
Increased Expenditures
Program Expenditures
Reduced Expenditures
Net Impacts
Initial Expenditure $(2 617) $2 617 $2 245 $(2 245) $0 Value Added Direct $(1 954) $1 505 $1 252 $(1 289) $(486) Indirect & Induced $(873) $1 234 $773 $(1 055) $79 Total $(2 827) $2 739 $2 025 $(2 344) $(407) Multiplier 1.08 1.16 0.90 1.16 N/A Gross Output Direct $(2 617) $2 617 $2 245 $(2 245) $0 Indirect & Induced $(2 535) $3 040 $2 337 $(2 599) $243 Total $(5 152) $5 411 $4 582 $(4 627) $214 Multiplier 1.97 2.28 2.04 2.28 N/A Wages & Salaries Direct $(879) $965 $688 $(826) $(52) Indirect & Induced $(597) $752 $488 $(642) $1 Total $(1 476) $1 717 $1 176 $(1 468) $(51) Employment (person-years) Direct (11 234) 17 565 9 500 (15 011) 820 Indirect & Induced (20 869) 23 153 15 820 (19 804) (1 700) Total (32 103) 40 718 25 320 (34 816) (881) Multiplier 2.86 2.32 2.67 2.32 N/A Taxes Federal $(405) $482 $352 $(413) $16 Provincial $(266) $327 $211 $(269) $3 Local $0 $70 $34 $0 $104 Total $(671) $879 $597 $(682) $123 Imports From Other Provinces $(359) $437 $474 $(373) $179 From Other Countries $(178) $206 $153 $(177) $4 Total $(537) $643 $627 $(550) $183

40
The employment impacts of energy conservation
-$6,000
-$4,000
-$2,000
$0
$2,000
$4,000
$6,000
Mill
ions
of 2
007
Dol
lars
InitialExpenditure
Value Added Gross Output Wages &Salaries
Taxes
Generation Reduction Increased Expenditures
Figure 15: Comparative impacts of avoided costs of customer based generation - Generation Reduction

41
IndEco Strategic Consulting Inc. & Econometric Research Ltd.
-$5,000
-$4,000
-$3,000
-$2,000
-$1,000
$0
$1,000
$2,000
$3,000
$4,000
$5,000M
illio
ns o
f 200
7 D
olla
rs
InitialExpenditure
Value Added Gross Output Wages &Salaries
Taxes
Program Expenditures Reduced Expenditures
Figure 16: Comparative impacts of avoided costs of customer based generation - Program and Equipment Costs
(60,000)
(40,000)
(20,000)
0
20,000
40,000
60,000
Pers
on Y
ears
GenerationReduction
IncreasedExpenditures
ProgramExpenditures
ReducedExpenditures
Net Impact
Direct Total
Figure 17: Comparative employment impacts of customer based generation

42
The employment impacts of energy conservation
3.7 The economic impacts of the aggregate energy conservation programs
When all the CDM programs are aggregated for an overall estimate of the impact of CDM in Ontario a bright picture emerges. There are substantial gains realized that translate into higher employment levels, larger wages and salaries and higher revenues for all three levels of government. Total sales in the economy are higher but unfortunately value added (income) is lower (see Table 12 and Figures 16 and 17). A total of $26 362 is the aggregate avoided cost in 2007 dollars for the 20 year period that span 2007 and 2027. This avoided cost did not emerge out of nowhere. Major investment in equipment and many programs were devised to attain these savings as was discussed earlier. The economic impacts of generation reductions are surely negative. It is only when the savings realized by the different sectors are spent that countervailing impacts are generated. The sum total of the four vectors of change is the net impact realized on any single program area. The four vectors include a negative vector displaying generation reduction, a positive vector displays the impact of increased consumer and business expenditures, another positive vector displaying the expenditures on machinery and equipment and program costs and a negative vector of reduced expenditures of businesses and consumers that are assumed to bear ultimately the final costs of these programs.
The four CDM areas’ net impacts are represented in Table 12 that also displays the final aggregate net impact.
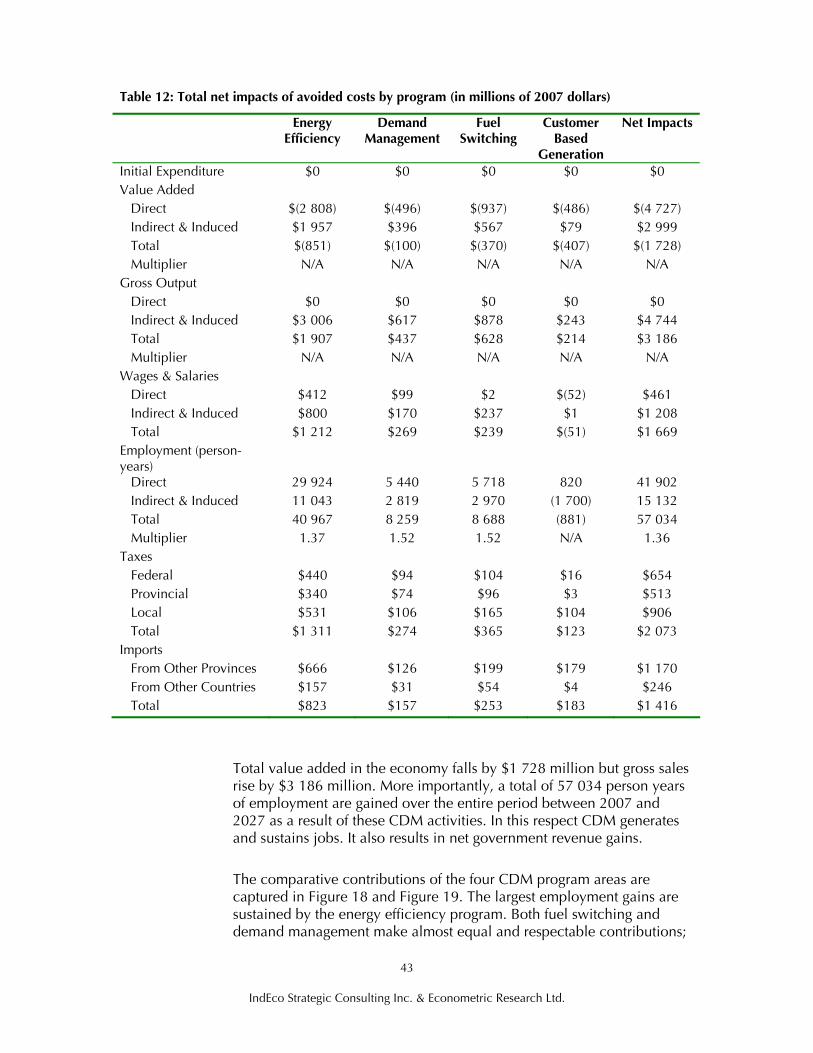
43
IndEco Strategic Consulting Inc. & Econometric Research Ltd.
Table 12: Total net impacts of avoided costs by program (in millions of 2007 dollars)
Energy Efficiency
Demand Management
Fuel Switching
Customer Based
Generation
Net Impacts
Initial Expenditure $0 $0 $0 $0 $0 Value Added Direct $(2 808) $(496) $(937) $(486) $(4 727) Indirect & Induced $1 957 $396 $567 $79 $2 999 Total $(851) $(100) $(370) $(407) $(1 728) Multiplier N/A N/A N/A N/A N/A Gross Output Direct $0 $0 $0 $0 $0 Indirect & Induced $3 006 $617 $878 $243 $4 744 Total $1 907 $437 $628 $214 $3 186 Multiplier N/A N/A N/A N/A N/A Wages & Salaries Direct $412 $99 $2 $(52) $461 Indirect & Induced $800 $170 $237 $1 $1 208 Total $1 212 $269 $239 $(51) $1 669 Employment (person-years)
Direct 29 924 5 440 5 718 820 41 902 Indirect & Induced 11 043 2 819 2 970 (1 700) 15 132 Total 40 967 8 259 8 688 (881) 57 034 Multiplier 1.37 1.52 1.52 N/A 1.36 Taxes Federal $440 $94 $104 $16 $654 Provincial $340 $74 $96 $3 $513 Local $531 $106 $165 $104 $906 Total $1 311 $274 $365 $123 $2 073 Imports From Other Provinces $666 $126 $199 $179 $1 170 From Other Countries $157 $31 $54 $4 $246 Total $823 $157 $253 $183 $1 416
Total value added in the economy falls by $1 728 million but gross sales rise by $3 186 million. More importantly, a total of 57 034 person years of employment are gained over the entire period between 2007 and 2027 as a result of these CDM activities. In this respect CDM generates and sustains jobs. It also results in net government revenue gains.
The comparative contributions of the four CDM program areas are captured in Figure 18 and Figure 19. The largest employment gains are sustained by the energy efficiency program. Both fuel switching and demand management make almost equal and respectable contributions;
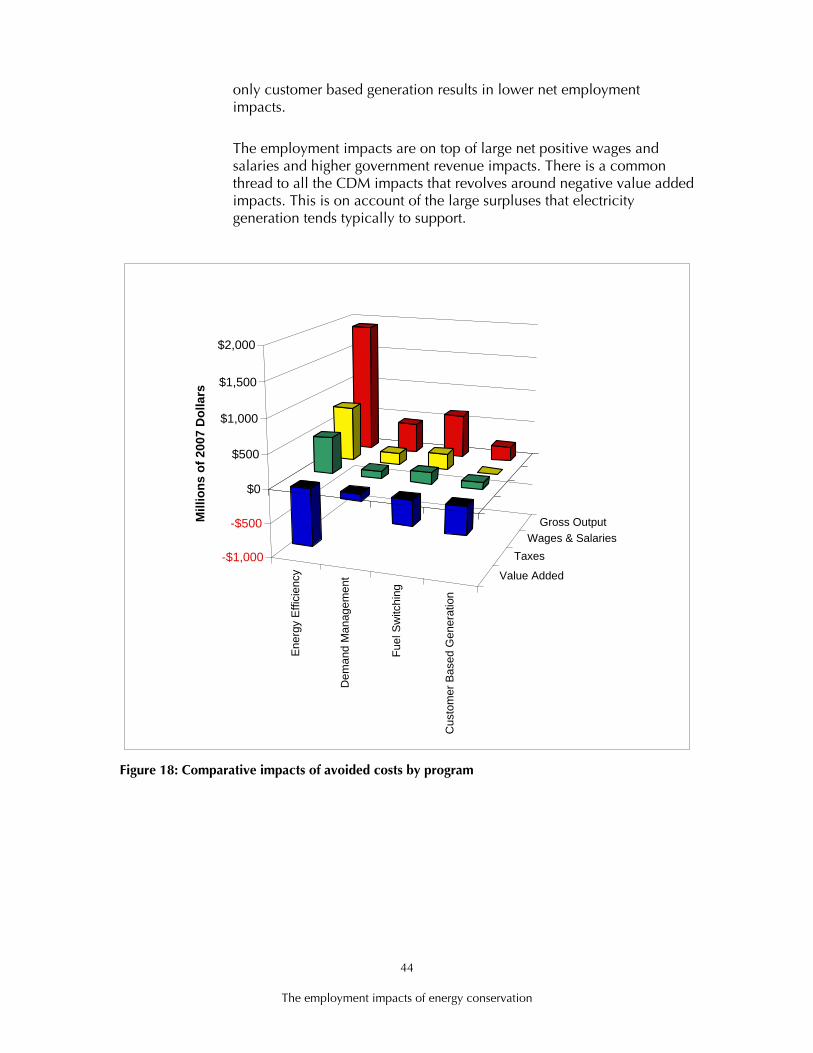
44
The employment impacts of energy conservation
only customer based generation results in lower net employment impacts.
The employment impacts are on top of large net positive wages and salaries and higher government revenue impacts. There is a common thread to all the CDM impacts that revolves around negative value added impacts. This is on account of the large surpluses that electricity generation tends typically to support.
Ener
gy E
ffici
ency
Dem
and
Man
agem
ent
Fuel
Sw
itchi
ng
Cus
tom
er B
ased
Gen
erat
ion
Value Added
TaxesWages & Salaries
Gross Output
-$1,000
-$500
$0
$500
$1,000
$1,500
$2,000
Mill
ions
of 2
007
Dol
lars
Figure 18: Comparative impacts of avoided costs by program

45
IndEco Strategic Consulting Inc. & Econometric Research Ltd.
EnergyEfficiency Demand
Management Fuel SwitchingCustomer
BasedGeneration
Direct
Total(5,000)
0
5,000
10,000
15,000
20,000
25,000
30,000
35,000
40,000
45,000
Pers
on Y
ears
Figure 19: Comparative employment impacts of avoided costs by program
3.8 Conclusion
This report is based on a unique assessment of net avoided costs of four pillar Conservation and Demand Management program areas. These include energy efficiency with a net avoided cost of $11.6 billion, demand management programs with about $2 billion, fuel switching with over $2.6 billion and customer based generation with $372 million. In total the system would save over 5120 MW of energy and the total aggregate net avoided costs exceed $16.4 billion. All valuations are in constant 2007 dollars and cover the net avoided costs over the period 2007 and 2027.
The economy of Ontario does not only reap these energy savings and the associated reduction in pollution and greenhouse gases, it is also expected that Ontario will gain significant employment increases and higher wages and salaries. The energy savings release funds that can be used by consumers and businesses on consumption and investment. Governments would also fare well under these programs as the energy conservation is also expected to result in higher government revenues. These added revenues add up to a total of $2 billion.

46
The employment impacts of energy conservation
4 Limitations of the analysis and next steps
The present report uncovers some of the major limitations of analyses of the relationship between energy conservation and employment. Estimates of complex economic interactions must be carefully reviewed to properly assess employment impacts that may be associated with conservation activities. The literature review identified concerns with the methodologies adopted in some of the analyses of energy conservation and employment, it was not clear that the results could be applied to Ontario because of different socio-economic circumstances or both. To address these concerns, a macroeconomic assessment for Ontario was developed to provide a deeper understanding of the issue.
To the extent that models are a simplification of reality, they cannot comprehensively and completely represent the underlying reality. The limitations of the model developed for the purpose of this report must be conveyed so that the results may be taken in a realistic manner, and the requirements for increased precision outlined.
Due to limitations in readily available data, the net benefit of energy conservation within each of the four OPA defined categories of energy conservation were taken at an overall value. Each of these categories actually consists of various initiatives, each with a different dollar value of benefit per energy saved, different mixes of labour and capital, and therefore different economic implications. By taking an average value for the ratio between dollar benefit and energy saved for each category, the analysis does not capture possible differences in the portfolio of initiatives taken within each of the categories. For example, customer based generation could incorporate the use of one of several available technologies (e.g. solar photovoltaic panels, wind turbines or biomass), each of which has unique economic implications. The result of various adoption rates for the different technologies would result in a different economic effect for each aggregated selection.
Current linear production and consumption relationships are assumed to prevail and are allowed limited behavioural responses. Furthermore, the model assumes that the supply of output is perfectly price elastic since stocks are not represented and capacity constraints not recognised.
Another limitation of the analysis is the restriction to investment and savings outlined in the IPSP. Initiatives and investments in energy conservation outside of that outlined in the IPSP are likely to occur and will have additional economic implications. Without incorporating the effects of these other activities, the model is insulated from the

47
IndEco Strategic Consulting Inc. & Econometric Research Ltd.
employment effects of electricity and non-electric energy savings external to the plan.
In order to improve the presented model, each of the four conservation categories could be further refined to better reflect the variation in the economic implications within them. Second, a dynamic model with nonlinear relationships and marginal coefficients replacing average coefficients would substantially improve the precision of the analysis. Third, to the extent that they can be specified, estimates of energy conservation activities external to the IPSP could be added in order to increase the scope of the analysis.

48
The employment impacts of energy conservation
Appendix A. Employment impacts of energy efficiency by sector
Net employment impacts of energy efficiency by sector (in person years of employment)
Sector
Agriculture 1,892 Fishing & Hunting 197 Logging 94 Mining 3,113 Food & Beverages 496 Rubber & Plastic 210 Primary Textile 99 Clothing Industries 664 Wood Industries 313 Furniture 65 Paper & applied P. 138 Printing & Publish. 42 Primary Metals 1,874 Metal Fabricating 1,565 Machinery & Equip. 7,716 Transport Equipment 1,995 Electrical Products 5,519 Non-Metal. Minerals 701 Petroleum Products 209 Chemicals & Chem. P. 370 Other Manufacturing 2,593 Construction 4,290 Transp. & Storage 8,289 Communic. & Utilities -38,734 Trade 23,587 Finance, Ins., Real Est. 3,896 Business & Comp. Serv. 6,564 Edu. & Health Services 9,138 Accommodation Services 2,124 Other Services -6,848 Operating Office -4,163 Travel & Marketing 1,383 Transportation Margins 1,415 Initial 161 Total 40,967


specializing in industrial ecology and strategic management
providing environmental and energy consulting to private, public and non-governmental organizations
IndEco Strategic Consulting Inc
77 Mowat Avenue Suite 412 Toronto ON M6K 3E3
416 532 4333 [email protected] indeco.com