Exporting for Growth UK Trade & Investment’s Role Presented by Rob Lewtas.

Journal of Service Science and Management, 2017, 10, 447-463 http://www.scirp.org/journal/jssm
ISSN Online: 1940-9907 ISSN Print: 1940-9893
DOI: 10.4236/jssm.2017.105036 Oct. 31, 2017 447 Journal of Service Science and Management
The Empirical Study of the Education Investment’s Influences on the Industrial Structure Rationalization in Hainan Province
Dan Yu1, Shasha Gao2*, Lin Shen3
School of Economics and Management, Hainan University, Haikou, China
Abstract Hainan’s development level of economics and education captures much atten-tion, which is the youngest province, the largest special economic zone and construction base of international tourism island in China. With the imple-mentation of our country’s policy of industrial structure adjustment, the in-dustrial structure’s optimization and upgrading in economic development al-so becomes one of the focuses in scholarly research. The thesis combines re-levant industrial structure areas in education and economic development. And from the view of financial investment, it firstly studies the education in-vestment’s influences on the industrial structure rationalization in Hainan Province by employing VAR model and its application.
Keywords Hainan Province, Education Investment, Industrial Structure Rationalization, VAR Model
1. Introduction
Hainan is the largest special economic zone and construction base of interna-tional tourism island in our country, which should make emphasis on its devel-opment of industrial structure rationalization. Education is the foundation stone of national revival, and also the motive power and source of economic develop-ment. The studies capture much attention in people from every part of society, which research on the education influences of industrial structure rationaliza-tion in economic development in Hainan. The thesis combines relevant areas of industrial structure in education and economic development, and makes re-searches from view of financial investment.
How to cite this paper: Yu, D., Gao, S.S. and Shen, L. (2017) The Empirical Study of the Education Investment’s Influences on the Industrial Structure Rationalization in Hainan Province. Journal of Service Science and Management, 10, 447-463. https://doi.org/10.4236/jssm.2017.105036 Received: September 20, 2017 Accepted: October 28, 2017 Published: October 31, 2017 Copyright © 2017 by authors and Scientific Research Publishing Inc. This work is licensed under the Creative Commons Attribution International License (CC BY 4.0). http://creativecommons.org/licenses/by/4.0/
Open Access

D. Yu et al.
DOI: 10.4236/jssm.2017.105036 448 Journal of Service Science and Management
2. Concept Definition 2.1. Education Investment
At present, the total education investment can be classified into financial educa-tion investment and non-financial education investment. And financial educa-tion investment is the most significant investment channel in education invest-ment, which covers the most majority in the total education investment. And the relevant data is easy to get. Therefore, the thesis takes financial education in-vestment as education investment in Hainan, and studies its education invest-ment’s influences on the industrial structure rationalization.
2.2. The Industrial Structure Rationalization
The adjustment and optimization of industrial structure is the core of modern economic development. And the industrial structure rationalization is the sig-nificant element of the adjustment and optimization of industrial structure. At present, the main index to measure the industrial structure rationalization is deviational range of industrial structure in academic circles. The computing formula is:
3
11i
i i
GDP GDPPLL L=
= −∑
In the formula, PL is deviational range of industrial structure. GDPi and Li are respectively the output value and the employed of industrial i, and GDP and L are respectively the quantity of output value and the employed. iGDP GDP is the industrial structure, iL L is the employment structure, the degree of PL and its variation can reflect relevant industry’s industrial structure, the balance of employment structure and the absorption or exclusion of labour force. If it is greater than zero and becomes smaller and smaller gradually, we can be indi-cated that the relationship between industrial structure and employment struc-ture is not isostatic. The industry has the capacity of absorbing labour and the later will inflow the industry. While with the influx of labour force between in-dustries, the industry structure and employment structure will incline to be ba-lanced. And if PL is smaller than zero, we can be indicated that the employment structure and industry structure are not balanced. The industry has surplus labor and the motivation of going out. Only when PL = 0, industry structure and em-ployment structure couples well and they are totally balanced.
3. Literature Review 3.1. Research on the Rationalization of Industrial Structure and
Economic Growth
Such research is currently focused on these two ways, namely the evaluation of the industrial structure rationalization measures and its impact on economic growth. Firstly, on the aspect of the evaluation measure of rationalization of in-dustrial structure, Hu Baojian (2010) evaluates the rationalization of the indus-

D. Yu et al.
DOI: 10.4236/jssm.2017.105036 449 Journal of Service Science and Management
trial structure of Yan’an based on Shift-Share Model. It is found that economic development is heavily dependent on the secondary industry. Industrial agglo-meration should be actively promoted. And the industrial clusters and modern resource-based industry should be developed [1]. From qualitative and quantita-tive point of view, Wang Linsheng and other scholars (2011) introduce various evaluation methods. But the reality of our country or other parts is not be stu-died [2]. Ma Lifang (2011) estimates the degree of the rationalization of indus-trial structure by employing ordering model in Zhejiang province. It is raised that economic development should focus on the basic position of the primary industry, promoting agricultural modernization and meanwhile grasping the pillar industries [3]. Li Xinzhan and other scholars (2012) constructs the indus-trial structure deviation model of Liaoning Province. It is proposed that the proportion of investment in the tertiary industry should be increased, and the tertiary industry should be actively supported, laying a good foundation for the sustainable development of economy in Liaoning Province [4]. By selecting the industrial structure deviation of the three industries and comparing the eco-nomic index of the labor rate, Guo Fei and other scholars (2013) evaluate the industrial structure of Hejin City. It is found that the secondary industry is the mainstay of Hejin City. The promoting role of the secondary industry and the tertiary industry should be vigorously developed [5]. Secondly, with regard to the impact of rationalization of industrial structure on economic growth, Zhou Mingsheng (2013) experimentally studies the impact of China’s industrial struc-ture on economic growth from 1978 to 2011. And it is found that rationalization of industrial structure promotes economic growth while economic growth does not significantly improve the level of rationalization of industrial structure [6]. Through the deviation of industrial structure, Chen Xi and other scholars (2014) studies the impact of the rationalization of industrial structure on economic growth. And it is found that there is a different direction between them in dif-ferent periods [7]. Wang Huijuan (2015) also believes that when the economic growth rate is relatively low, the irrational industrial structure can still promote economic growth. But once the economic growth rate is accelerated, structural unreasonable will be highlighted and then hinder the continued growth of the economy [8].
3.2. Research on Education Investment
The study of education investment and economic growth in China is relatively more. This paper mainly focuses on the relationship between education invest-ment and economic growth and the contribution of education investment to economic growth. First of all, in the relationship between education investment and economic growth, most scholars believe that education investment has a positive effect on economic growth. Zhang Jin and other scholars (2008) pro-vides an empirical analysis of the relationship between education investment and economic growth in China. The analysis shows that education investment does

D. Yu et al.
DOI: 10.4236/jssm.2017.105036 450 Journal of Service Science and Management
have a strong impetus [9]. Zhou Zuojie and other scholars (2011) analyzes the data of education investment and economic growth in China from 1952 to 2008 based on the non-linear cointegration model. It is considered that when they have long-term equilibrium relations, they have non-linear and non-continuous characteristics [10]. Wu Yutong (2014) suggests that there are significant coin-tegration relationship and mutual Granger Causality between financial educa-tion investment and economic development in China. And it is found that the response of economic growth to education investment will become more and more obvious after a period of lag [11]. Some scholars also thinks that the rela-tionship between education investment and economic growth is not significant or there is a negative correlation. By using the proportion of education expense expenditure that accounts for fiscal expenditure and GDP, Wang Rong (2008) provides an empirical study of the methods of education expenditure in China’s provinces. And it is found that there is a negative correlation between public education expenditure and economic development level [12]. Li Jialu and other scholars (2012) analyzes the equilibrium and causality between education ex-penditure and economic growth in China. It is found that there is a long-term equilibrium and one-way causality between them. And there is not causal rela-tionship of feedback contacts. And it is denied that education expenditure is a strong exogenous for economic growth [13]. Secondly, on the contribution of education investment to economic growth, there is no conclusive conclusion on its research. And the contribution of education investment to economic growth measured by different research methods is different. Zhang Zhang and other scholars (2011) establishes a simple OLS (regression model) to by the data on education expenditure and GDP in China from 1992 to 2007. It is found that the contribution rate of education investment to economic growth is 0.77% [14]. Wu Feifei and other scholars (2012) employ the error correction model to em-pirically study the economic data between GDP and education investment in China from 1978 to 2009. The results show that the elasticity coefficient of edu-cation investment to China’s GDP is 8.79% [15].
3.3. Research on the Rationalization of Education Investment and Industrial Structure
At present, there are relatively few studies on such issues in China. Through the empirical analysis of relevant data in education investment and industrial struc-ture over the past three decades of reform and opening up in China, Ma Yue (2012) finds that compared with other factors, education investment can not only make the industrial structure tend to rational development, but also can promote the industrial structure advanced [16]. Chen Hongling (2013) employs the panel data of 12 provinces in western China to analyze and finds that the improvement of education level is helpful to the optimization and adjustment of industrial structure, and that the allocation of education resources should be compatible with the regional industrial structure [17]. Jiao Qingxia (2014) stu-dies the impact of China’s education investment on the rationalization of indus-

D. Yu et al.
DOI: 10.4236/jssm.2017.105036 451 Journal of Service Science and Management
trial structure by using the data from 1991-2011 and vector autoregressive (VAR) model. It is found that education investment has a positive effect on the rationalization of China’s industrial structure, while its contribution rate is rela-tively low [18].
Through the above literature research, it is found that study of the education investment in Hainan Province and the rationalization of the industrial structure is almost blank. This area is not conducive to the liberal arts in Hainan Province and the development of industrial structure rationalization. On the basis of the above research, this paper will study the contribution degree of education in-vestment to the rationalization of industrial structure in Hainan Province. And relevant policy suggestions for the optimization and upgrading of industrial structure in Hainan Province will be provided.
4. The Status Quo of Education Investment and Industrial Structure in Haina
4.1. The Status of Education Investment The Absolute Scale of Education Investment From Table 1, it can be analyzed that since 1994, the education financial in-vestment in Hainan is increased year by year in general. And it is increased from 960 million yuan in 1994 to 20.003 billion yuan in 2014, namely the average an-nual growth rate is 16.23%. In order to make data be more reasonable, this thesis employs CPI base year in 1993 to adjust the education investment over the years. Compared to the previous data, although the increase range of education in-vestment is steadier, but according to the calculation results it, it still increases Table 1. Hainan’s investment in education and its increase. Unit: One hundred million yuan, %.
Year Education Investment
Education
Investment (1993 = 100)
Growth Rate
Year Education Investment
Education Investment
(1993 = 100)
Growth Rate
1993 8.50 8.50 - 2004 24.82 16.57 19.33
1994 9.60 7.58 12.94 2005 31.42 20.67 26.59
1995 10.69 7.43 11.35 2006 39.22 25.42 24.82
1996 9.75 6.50 -8.79 2007 55.06 33.99 40.39
1997 9.80 6.48 0.51 2008 68.70 39.67 24.77
1998 12.35 8.39 26.02 2009 91.10 52.97 32.61
1999 14.29 9.88 15.71 2010 115.45 64.05 26.73
2000 14.63 10.00 2.38 2011 139.75 73.08 21.05
2001 17.28 12.00 18.11 2012 176.63 89.50 26.39
2002 19.52 13.62 12.96 2013 189.29 93.31 7.17
2003 20.80 14.50 6.56 2014 200.03 96.28 5.67
The above data is sorted out from Hainan Statistical Yearbook, China Education Finance Statical Yearbook and the survey data from the Education Department in Hainan Province.

D. Yu et al.
DOI: 10.4236/jssm.2017.105036 452 Journal of Service Science and Management
with the speed of 12% every year. And it is inseparable with the rapid develop-ment of economy and the government’s high attention to education in Hainan.
4.2. The Relative Scale of Education Investment 4.2.1. Education Investment’s Proportion in GDP The education investment’s proportion in GDP can reflect the government’s emphasis on education. Table 2 shows: From 1993 to 2014, the proportion of education investment in GDP in Hainan was declining in some years, but over-all, it shows an upward trend. The proportion of education investment in GDP rises from 3.26% in 1993 to 5.71% in 2014. The proportion of Hainan’s educa-tion investment in GDP has achieved the goal of 4% in 2007. If the adequacy of education can be judged by this index, the education investment in Hainan Province is sufficient. However, this index does not take into account the reality of education in Hainan Province. On one hand, the establishment of Hainan Province is the latest and its development of education starts late with poor foundation and heavy education burden. And it is not enough that education investment only accounts for 4% in GDP. On the other hand, the level of eco-nomic development in Hainan Province is relatively backward. And the smaller GDP will also increase the education investment proportion in GDP.
4.2.2. The Proportion of Budgetary Expenditure on Education in Financial Expenditure
The proportion of budgetary expenditure on education in financial expenditure can be used to reflect the budget for the development of education in govern- Table 2. The proportion of Hainan’s various education expenditures in GDP from 1993 to 2014. Unit: One hundred million yuan, %.
Year Education Investment
GDP
Education Investment’s Proportion
in GDP
Year Education Investment
GDP
Education Investment’s Proportion in
GDP
1993 8.50 260.41 3.26 2004 24.82 819.66 3.03
1994 9.60 331.98 2.89 2005 31.42 918.75 3.42
1995 10.69 363.25 2.94 2006 39.22 1065.67 3.68
1996 9.75 389.68 2.50 2007 55.06 1254.17 4.39
1997 9.80 411.16 2.38 2008 68.70 1503.06 4.57
1998 12.35 442.13 2.79 2009 91.10 1654.21 5.51
1999 14.29 476.67 3.00 2010 115.45 2064.5 5.59
2000 14.63 526.82 2.78 2011 139.75 2522.66 5.54
2001 17.28 579.17 2.98 2012 176.63 2855.54 6.19
2002 19.52 642.73 3.04 2013 189.29 3146.46 6.02
2003 20.80 713.96 2.91 2014 200.03 3500.72 5.71
Data Source: Sorted out from Hainan Statistical Yearbook, China Education Finance Statical Yearbook and the survey data from the Education Department in Hainan Province.
D. Yu et al.
DOI: 10.4236/jssm.2017.105036 453 Journal of Service Science and Management
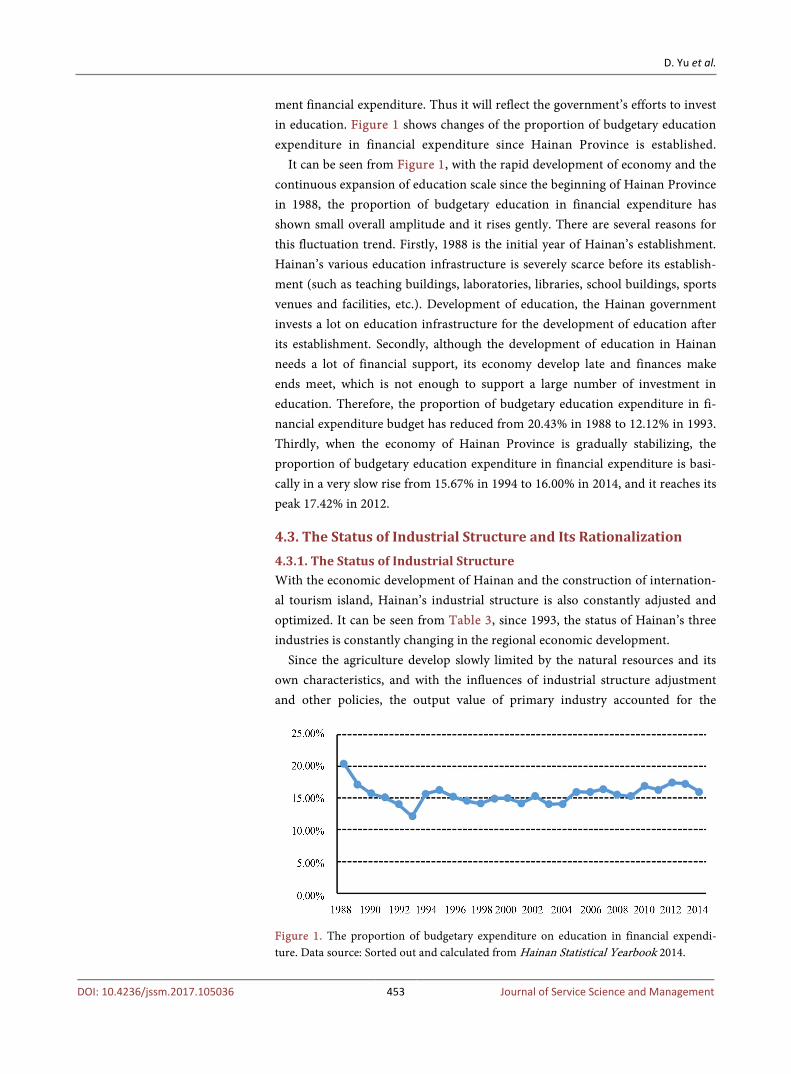
ment financial expenditure. Thus it will reflect the government’s efforts to invest in education. Figure 1 shows changes of the proportion of budgetary education expenditure in financial expenditure since Hainan Province is established.
It can be seen from Figure 1, with the rapid development of economy and the continuous expansion of education scale since the beginning of Hainan Province in 1988, the proportion of budgetary education in financial expenditure has shown small overall amplitude and it rises gently. There are several reasons for this fluctuation trend. Firstly, 1988 is the initial year of Hainan’s establishment. Hainan’s various education infrastructure is severely scarce before its establish-ment (such as teaching buildings, laboratories, libraries, school buildings, sports venues and facilities, etc.). Development of education, the Hainan government invests a lot on education infrastructure for the development of education after its establishment. Secondly, although the development of education in Hainan needs a lot of financial support, its economy develop late and finances make ends meet, which is not enough to support a large number of investment in education. Therefore, the proportion of budgetary education expenditure in fi-nancial expenditure budget has reduced from 20.43% in 1988 to 12.12% in 1993. Thirdly, when the economy of Hainan Province is gradually stabilizing, the proportion of budgetary education expenditure in financial expenditure is basi-cally in a very slow rise from 15.67% in 1994 to 16.00% in 2014, and it reaches its peak 17.42% in 2012.
4.3. The Status of Industrial Structure and Its Rationalization 4.3.1. The Status of Industrial Structure With the economic development of Hainan and the construction of internation-al tourism island, Hainan’s industrial structure is also constantly adjusted and optimized. It can be seen from Table 3, since 1993, the status of Hainan’s three industries is constantly changing in the regional economic development.
Since the agriculture develop slowly limited by the natural resources and its own characteristics, and with the influences of industrial structure adjustment and other policies, the output value of primary industry accounted for the
Figure 1. The proportion of budgetary expenditure on education in financial expendi-ture. Data source: Sorted out and calculated from Hainan Statistical Yearbook 2014.

D. Yu et al.
DOI: 10.4236/jssm.2017.105036 454 Journal of Service Science and Management
Table 3. The proportion of Hainan’s three industries from 1993-2014. Unit: %.
Year Primary Industry
Secondary Industry
Tertiary Industry
Year Primary Industry
Secondary Industry
Tertiary Industry
1993 29.5 25.4 45.1 2004 34.0 25.1 40.9
1994 32.0 25.1 42.9 2005 32.7 26.2 41.1
1995 35.5 21.6 42.9 2006 30.4 29.0 40.7
1996 36.2 20.9 42.9 2007 28.8 29.0 42.2
1997 36.1 20.2 43.7 2008 29.0 28.2 42.8
1998 35.3 20.7 44.0 2009 27.9 26.8 45.3
1999 36.2 20.1 43.7 2010 26.1 27.7 46.2
2000 36.4 19.8 43.8 2011 26.1 28.3 45.6
2001 34.0 23.1 42.9 2012 24.9 28.2 46.9
2002 34.7 23.1 42.2 2013 23.4 27.7 48.9
2003 34.2 24.6 41.2 2014 23.1 25.0 51.9
Data source: Hainan Statistical Yearbook 2014.
proportion of GDP shows a trend of rising firstly and then declining. The de-velopment of the secondary industry and the tertiary industry begins to be taken seriously. The output value of the secondary industry is increasing continuously, but its proportion of GDP does not change a lot, basically maintaining at about 25%. While its adjustment trend is still relatively significant. The tertiary indus-try’s role in the economic development of Hainan is always relatively prominent. And the proportion of tertiary industry output value in Hainan’s GDP is rela-tively high, and the proportion of output value in GDP slowly declines from 45.1% in 1993 to 42.8% in 2009. It starts to rise in 2009 and reaches to 51.9% in 2014, with the speed of increasing 1.5 percentage points every year in those six years. This trend is mainly affected by the construction and development of Hainan international tourism island, the second industry development trend and industrial structure’s optimization and upgrading in Hainan.
4.3.2. The Status of Industrial Structure Rationalization It can be seen from Table 4, in general, the deviation degree of industrial struc-ture in Hainan shows a trend of fluctuate declining. The total deviation declines from 2.95 in 1993, which declines about 36% in recent 22 years. It indicates that the industrial structure in Hainan is constantly developing to the direction of ra-tionalization and is in the continuous optimization and upgrading.
First of all, the structural deviation of the primary industry has always been negative, which indicates that in the primary industry has been a large number of surplus labor, and the industrial structure and employment structure are in-compatible. There are two mainly reasons: On one hand, compared with the second and tertiary industries, the labor productivity of primary industry in-creases slowly. Although its output value is constantly growing over the years,

D. Yu et al.
DOI: 10.4236/jssm.2017.105036 455 Journal of Service Science and Management
Table 4. The deviation of three industrial structures in Hainan from 1993 to 2014. Unit: %.
Year Employment Structure
The Deviation of Three Industrial Structures The Total
Deviation Primary Industry
Secondary Industry
Tertiary Industry
Primary Industry
Secondary Industry
Tertiary Industry
1993 62.66 11.55 25.79 −0.53 1.20 0.75 2.48
1994 60.95 11.95 27.10 −0.47 1.10 0.58 2.16
1995 60.96 11.68 27.36 −0.42 0.85 0.57 1.83
1996 60.45 11.83 27.72 −0.40 0.77 0.55 1.72
1997 59.21 11.34 29.45 −0.39 0.78 0.48 1.66
1998 60.75 9.97 29.28 −0.42 1.08 0.50 2.00
1999 60.84 9.65 29.51 −0.40 1.08 0.48 1.97
2000 60.84 9.37 29.79 −0.40 1.11 0.47 1.99
2001 60.21 9.38 30.42 −0.44 1.46 0.41 2.31
2002 58.76 9.50 31.74 −0.41 1.43 0.33 2.17
2003 58.47 9.83 31.70 −0.42 1.50 0.30 2.22
2004 57.78 10.09 32.13 −0.41 1.49 0.27 2.17
2005 56.67 10.37 32.96 −0.42 1.53 0.25 2.20
2006 56.23 10.55 33.22 −0.46 1.75 0.23 2.43
2007 55.71 10.85 33.44 −0.48 1.67 0.26 2.42
2008 54.18 11.22 34.60 −0.46 1.51 0.24 2.22
2009 53.14 11.36 35.50 −0.47 1.36 0.28 2.11
2010 50.37 11.90 37.73 −0.48 1.33 0.22 2.03
2011 48.99 11.92 39.09 −0.47 1.37 0.17 2.01
2012 47.69 12.23 40.07 −0.48 1.31 0.17 1.95
2013 43.23 12.68 44.09 −0.46 1.18 0.11 1.62
2014 42.56 12.65 44.79 −0.46 0.98 0.16 1.60
Data source: Sorted out and calculated from Hainan Statistical Yearbook 2014.
the proportion of output value is constantly decreasing. On the other hand, al-though the rural surplus labor force constantly flows to the secondary and ter-tiary industries, in today’s era of knowledge, technology and economy, the rural population’s education level is relatively low, thus there are some difficulties when they transfer to the secondary and tertiary industries.
Secondly, in the past twenty-two years, the structural deviation of the second-ary industry has been positive and relatively large, indicating that the employ-ment of the secondary industry is obviously insufficient, and the secondary in-dustry has the ability to absorb the surplus labor force. However, the structural deviation of the secondary industry changes greatly from 1.20 in 1993 to 0.78 in 1997, then rises to 1.75 in 2006 and finally declines from 1.75 in 2006 to 0.98 in

D. Yu et al.
DOI: 10.4236/jssm.2017.105036 456 Journal of Service Science and Management
2014. It indicates that Hainan’s industry structural adjustment has a greater im-pact on the structure of the secondary industry, making the structural deviation index of the secondary industry constantly change. In recent years, the structural deviation of the secondary industry has shown a downward trend.
Finally, the deviation degree of the tertiary industry has been positive and shows a trend of decreasing year by year, dropping from 0.75 in 1993 to 0.11 in 2013 and decreasing about 80%. It indicates during the past two decades, the employment in tertiary industry is not enough. A large number of labors flow into the tertiary industry and it has the ability to absorb the labor force. And it is inseparable with the development of the tertiary industry in Hainan Province, the adjustment of industrial structure policy and the construction of interna-tional tourism island.
5. Empirical Analysis on the Influences of Financial Education Investment on the Rationalization of Industrial Structure
5.1. The Construction of the Model and the Selection of Variables
In order to study the measurement relationship between investment in educa-tion and rationalization of industrial structure in Hainan Province, this paper introduces the control variable investment in fixed assets, constructing the vec-tor autoregressive (VAR) model between investment in education, investment in fixed assets and rationalization of industrial structure in Hainan Province, to study their relationship of dynamic changes. The model is constructed as fol-lows:
( )1
1, 2, ,p
t i t i ti
y y c t Tε−=
= Π + + =∑
In the above model, yt is the column vector of industrial structure rationaliza-tion, education input and fixed asset investment, ∏i is the coefficient matrix, c is the intercept term, εt is the matrix of random error, t is time, i is the lag period, and p is the optimal lag period.
This paper chooses the reduction of industrial structure deviation index in Hainan Province to measure the rationalization of its industrial structure, which is calculated from Hainan Statistical Yearbook. It takes financial education in-vestment in Hainan Province as the education investment. And its data comes from China Education Funds Statistical Yearbook and the survey results of The Education Department of Hainan Province. And it takes the society’s total in-vestment in fixed assets over the years as investment in fixed assets in Hainan Province. The data source is Hainan Statistical Yearbook 2015. Based on the availability of data, the time series data of each variable from 1993 to 2014 are selected as samples. In order to eliminate the impact of inflation, the original data is processed by choosing the price index. As the statistics of fixed asset in-vestment price index in Hainan Province began in 2000, and taking into account the availability of data, so the national fixed asset investment price index in the
D. Yu et al.
DOI: 10.4236/jssm.2017.105036 457 Journal of Service Science and Management
base period of 1993 is converted. The education investment in 1993 is taken as the base period of the consumer price index (CPI) to reduce. In order to reduce the volatility of data and heteroscedasticity, after rising, the natural logarithm of the data will be calculated. And the processed variables are recorded as LnE and LnK. Since the relative number of industrial structure deviation index has no heteroscedasticity and nonparability phenomena, it is directly recorded as a va-riable ΔPL.
5.2. The Stability Test
In order to avoid the “pseudo-regression” or “false regression” phenomena in econometric model analysis caused by the analysis of the unstable time series data, the method of ADF unit root is used to test the stability of each variable.
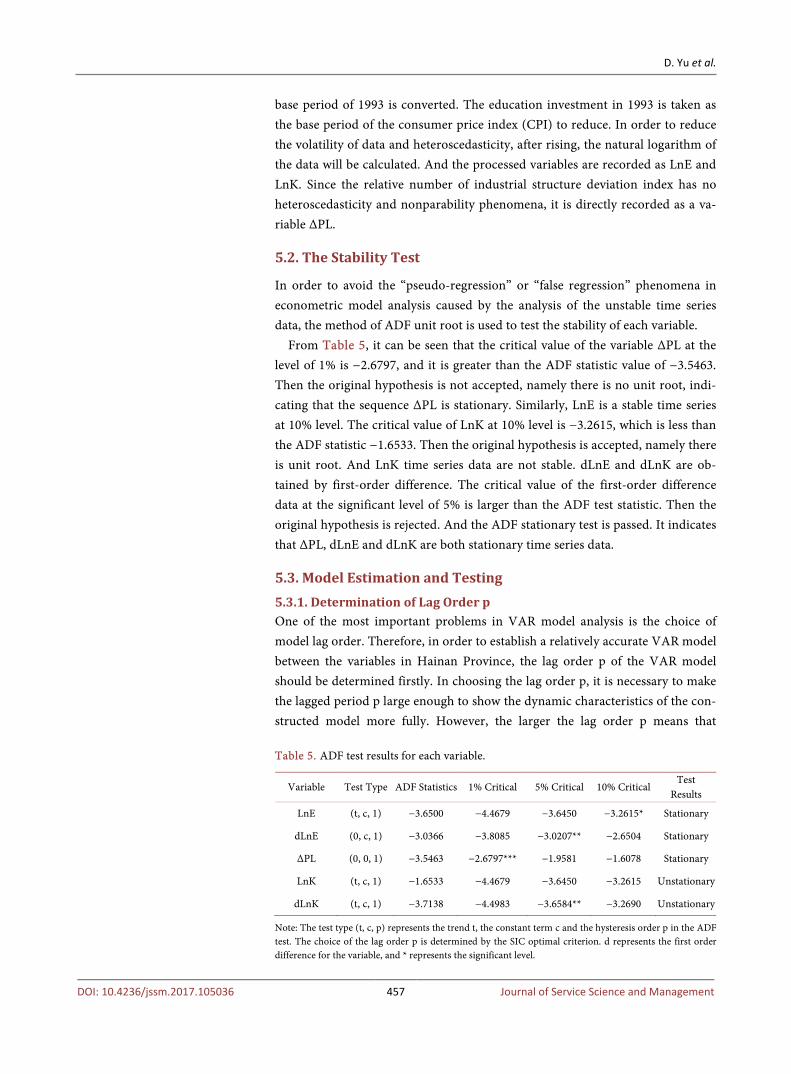
From Table 5, it can be seen that the critical value of the variable ΔPL at the level of 1% is −2.6797, and it is greater than the ADF statistic value of −3.5463. Then the original hypothesis is not accepted, namely there is no unit root, indi-cating that the sequence ΔPL is stationary. Similarly, LnE is a stable time series at 10% level. The critical value of LnK at 10% level is −3.2615, which is less than the ADF statistic −1.6533. Then the original hypothesis is accepted, namely there is unit root. And LnK time series data are not stable. dLnE and dLnK are ob-tained by first-order difference. The critical value of the first-order difference data at the significant level of 5% is larger than the ADF test statistic. Then the original hypothesis is rejected. And the ADF stationary test is passed. It indicates that ΔPL, dLnE and dLnK are both stationary time series data.
5.3. Model Estimation and Testing 5.3.1. Determination of Lag Order p One of the most important problems in VAR model analysis is the choice of model lag order. Therefore, in order to establish a relatively accurate VAR model between the variables in Hainan Province, the lag order p of the VAR model should be determined firstly. In choosing the lag order p, it is necessary to make the lagged period p large enough to show the dynamic characteristics of the con-structed model more fully. However, the larger the lag order p means that Table 5. ADF test results for each variable.
Variable Test Type ADF Statistics 1% Critical 5% Critical 10% Critical Test
Results
LnE (t, c, 1) −3.6500 −4.4679 −3.6450 −3.2615* Stationary
dLnE (0, c, 1) −3.0366 −3.8085 −3.0207** −2.6504 Stationary
∆PL (0, 0, 1) −3.5463 −2.6797*** −1.9581 −1.6078 Stationary
LnK (t, c, 1) −1.6533 −4.4679 −3.6450 −3.2615 Unstationary
dLnK (t, c, 1) −3.7138 −4.4983 −3.6584** −3.2690 Unstationary
Note: The test type (t, c, p) represents the trend t, the constant term c and the hysteresis order p in the ADF test. The choice of the lag order p is determined by the SIC optimal criterion. d represents the first order difference for the variable, and * represents the significant level.

D. Yu et al.
DOI: 10.4236/jssm.2017.105036 458 Journal of Service Science and Management
the more parameters to be estimated. The degree of freedom is relatively less. On the other hand, if the selected lag p is too small, the dynamic characteristics of the model can not be well reflected. And the degree of autocorrelation of the er-ror term will be very serious, leading to the non-uniformity of the estimated pa-rameters, and then directly influencing the validity of parameters.
It can be seen from Table 6, that the optimal lag of the VAR model between fiscal investment and economic growth in Hainan is 3, and the five criteria for HQ, LR, AIC, SC and FPE are tested at the optimal value. Therefore, the VAR model optimal lag of each variable in Hainan is selected as 3.
5.3.2. Model Estimation and Testing Through the determination of the stability test and the model lag order P, it can be seen that LnE, ΔPL and LnK time series are the first order single order se-quences, namely the first order difference data is stationary. So the relationship of the investment in education, fixed assets investment and industrial structure rationalization in Hainan Province satisfies the requirements for establishing a VAR (3). Eviws9.0 was used to import the variables data of Hainan Province and model estimates. The results are as follows:
( ) ( ) ( )( ) ( ) ( )
( ) ( ) ( )
DLNE 1.2391*DLNE 1 0.0766*DLNE 2 0.1281*DLNE 3
1.2518*DLNK 1 0.5428*DLNK 2 0.2362*DLNK 3
0.2617* PL 1 0.5619* PL 2 0.3228* PL 3 0.0933
= − − − + −
− − + − − −
− ∆ − − ∆ − + ∆ − +
( ) ( ) ( )( ) ( ) ( )
( ) ( ) ( )
PL 1.9571*DLNE 1 0.7305*DLNE 2 0.9456*DLNE 3
3.1154*DLNK 1 1.9496*DLNK 2 0.3134*DLNK 3
0.7855* PL 1 0.8695* PL 2 1.1149* PL 3 0.1581
∆ = − − − − −
− − + − − −
− ∆ − − ∆ − + ∆ − +
( ) ( ) ( )( ) ( ) ( )
( ) ( ) ( )
DLNK 0.5290*DLNE 1 0.0606*DLNE 2 0.5444*DLNE 3
0.1594*DLNK 1 0.2977*DLNK 2 0.0625*DLNK 3
0.2976* PL 1 0.0728* PL 2 0.0276* PL 3 0.0073
= − − − + −
+ − − − + −
− ∆ − + ∆ − − ∆ − +
The goodness of the three equations is respectively 0.62%, 0.87% and 0.75%. And most of the t values are about 2. It indicates that the model estimation structure is relatively accurate. After the VAR (3) model is established, the valid-ity of the model is tested to determine whether the model is in a stable state. And only when the model is at a steady state level, it is a valid model. According to Table 6. Verification results of vector autoregressive optimal lag.
Lag LogL LR FPE AIC SC HQ
0 47.2307 NA 1.47E−06 −4.9145 −4.7661 −4.8941
1 62.1319 23.1797 7.82E−07 −5.5702 −4.9766 −5.4884
2 67.9150 7.0681 1.24E−06 −5.2128 −4.1740 −5.0695
3 94.6888 23.7989* 2.32e−07* −7.1876* −5.7037* −6.9830*
Note: * represents the optimal lag order chosen by each criterion.

D. Yu et al.
DOI: 10.4236/jssm.2017.105036 459 Journal of Service Science and Management
Figure 2, the all reciprocal of the AR feature polynomial roots of the VAR (3) model are not more than 1, and they are in the same unit circle, and then the model is stable. Therefore, the impulse response function and variance decom-position can be provided on the basis of the VAR (3) model.
5.4. Impulse Response Function Analysis
The change or impact of an endogenous variable in the vector autoregressive model will not only affect itself, but also influence the change of other endogen-ous variables through the dynamic structure of the model. And the impulse re-sponse function is used to describe the changes trajectory of these effects. In the following section, and by means of impulse response function, Eviews 9 will be applied to study and analyze the influences of a positive impact on the rationali-zation of industrial structure in Hainan Province, and the impact is produced by investment in education and fixed assets investment in Hainan. The impulse re-sponse curve is shown in Figure 3. The horizontal axis represents hysteresis pe-riod number of the impact, and the vertical axis represents the response of Hai-nan’s economic growth.
It can be clearly seen from the impulse response curve Figure 3. First of all, from Figure 1 the response curve of industrial structure on their
own impact, it can be seen that when the rationalization of industrial structure in Hainan Province is positively impacted by a standard deviation new informa-tion, it will immediately produce a positive response. And the response will reach its maximum value in the first period and then become negative response in the second period. And in the third period, after it changes back to the posi-tive response, the influences of industrial structure rationalization changes on their own gradually become smaller. After several fluctuations, it tends to 0 fi-nally, namely the impact on their own is basically eliminated. Therefore the
Figure 2. VAR (3) model stability test results.
-1.5
-1.0
-0.5
0.0
0.5
1.0
1.5
-1.5 -1.0 -0.5 0.0 0.5 1.0 1.5
Inverse Roots of AR Characteristic Polynomial

D. Yu et al.
DOI: 10.4236/jssm.2017.105036 460 Journal of Service Science and Management
Figure 3. Impulse response curve. rationalization of industrial structure changes on their own impact is not sus-tainable.
Secondly, from Figure 2 the industrial structure’s response curve on the im-pact of investment in education, it can be seen that when the investment in Hai-nan Province is positively impacted by a standard deviation new information, the response of the rationalization of Hainan’s industrial structure is 0 in the first period. But from the second period, there is negative response and it be-comes smaller gradually. And it produces the positive response. It repeats and gradually weakens with the passage of time, and finally tends to 0. This indicates that the change of education investment makes the rationalization of Hainan industrial structure have a more fluctuating response, and the appropriate in-crease in investment in education can promote the rationalization of industrial structure.
Thirdly, from Figure 3 the response curve of the industrial structure to the impact of investment in fixed assets, it can be seen that when the fixed asset in-vestment is positively impacted by a standard deviation new information, the ra-tionalization of the industrial structure is 0 in the first period. In the second pe-riod, there is positive response and it reaches its maximum, and then the positive effect gradually becomes smaller. And it basically tends to be 0 after the 6th pe-riod. Therefore, the effect of the fixed asset investment on the rationalization of industrial structure in Hainan is very limited. The fixed assets should be em-ployed carefully to adjust the rationalization of industrial structure development.
5.5. Analysis of Variance Decomposition
In the above section, the paper analyzes the influence of education investment, investments fixed assets on the rationalization of industrial structure in Hainan Province. In order to analyze the degree of influence on the rationalization of

D. Yu et al.
DOI: 10.4236/jssm.2017.105036 461 Journal of Service Science and Management
industrial structure, in the following section, by means of variance decomposi-tion and from the aspects of its process of industrial structure deviation reduc-tion in Hainan, the contribution of different perturbations to the rationalization of the industrial structure is analyzed. Table 7 shows the variance decomposi-tion process of the deviation index reduction of industrial structure in Hainan Province.
From Table 7, it can be seen that in the process of rationalization of industrial structure in Hainan Province, the contribution of rationalization of industrial structure in the first period is 100%, and then it decrease gradually to 26.92% in the 20th period. The fixed asset investment’s contribution on the rationalization of the industrial structure increases from 40.07% in the second period to 46.75% in the fourth period, and then it falls to 34.12% in the eighth period and rises slightly. And the contribution of education investment to the industrial structure of Hainan Province increases from 17.15% in the second period to 38.40% in the 20th period, and finally stabilizes at about 38%. It can be seen that in the change of rationalization of industrial structure in Hainan Province, the investment in fixed assets is the first to make a greater contribution, while its effect is short. The contribution of education investment to structural rationalization is conti-nuous and finally exceeds the contribution of investment in fixed assets.
6. Conclusions
In order to analyze education investment’s influences on the Industrial Structure Rationalization in Hainan Province, this thesis firstly summarizes the relevant concepts and literatures, and then introduces the current situation of education investment, industrial structure and its rationalization in Hainan Province. Se-condly, the author employs the VAR model and its application to demonstrate the influences of education investment on the rationalization of industrial structure in Hainan. Through the above research, the basic conclusions can be Table 7. Decomposition result of variance decomposition of industrial structure devia-tion index in Hainan Province.
Period ∆PL DLNE DLNK Period ∆PL DLNE DLNK
1 100 0 0 11 27.7836 37.1807 35.0358
2 42.7835 17.1502 40.0663 12 27.8104 37.1655 35.0241
3 39.8437 16.0305 44.1258 13 27.1799 37.8502 34.9699
4 35.7243 17.5255 46.7502 14 27.1599 37.9026 34.9375
5 29.0688 32.9695 37.9617 15 26.9943 38.3537 34.6520
6 29.5225 34.7802 35.6973 16 26.9507 38.4740 34.5753
7 28.5647 36.9600 34.4752 17 26.9818 38.4168 34.6014
8 28.3456 37.5313 34.1231 18 26.9687 38.4517 34.5797
9 28.1070 37.1636 34.7294 19 26.9233 38.4035 34.6733
10 28.4074 36.9439 34.6487 20 26.9224 38.4006 34.6770

D. Yu et al.
DOI: 10.4236/jssm.2017.105036 462 Journal of Service Science and Management
drawn. First of all, the structures of three industries are upgrading. With the econom-
ic development, Hainan’s industrial structure is constantly changing. This is mainly manifested as: The proportion of the output value of the primary indus-try begins to decline, which has declined to 23.4%. The proportion of the sec-ondary industry output value has begun to rise, which basically maintained at 25% or more nearly ten years. The proportion of tertiary industry also begins to improve, and up to 2014, the proportion has reached 51.9%. The proportion of the three industries has changed from the original tertiary, primary, and sec-ondary industry to two the present tertiary, secondary and primary industry. And the industrial structure is constantly upgrading. While compared with the developed countries, the development of the three industries in Hainan is still unbalanced. There is still a lot of room for improvement in the industrial struc-ture.
Secondly, the trend of industrial structure rationalization is more obvious. With the construction of Hainan international tourism island and economic development, the upgrading of the industrial structure has been improved, and the rationalization of industrial structure has also been improved. The degree of deviation between Hainan’s industrial structure and employment structure is constantly decreasing. And the total deviation of the industrial structure from 2.48 in 1993 dropped to 1.59 in 2014, which decreases nearly 36% in re-cent 22 years. It indicates that Hainan’s industrial structure is constantly up-grading.
Finally, the influences of education investment on the optimization and up-grading of industrial structure is more obvious than that of fixed assets. The human capital formed in education investment can not only continuously in-crease the proportion of secondary industry and tertiary industry, promoting the industrial structure to the direction of upgrading, and also it will help the flow of labor force among three industries. Therefore, the gap between industrial struc-ture and employment structure will become smaller. And the industrial structure will constantly develop to the direction of rationalization.
In conclusion, this paper analyzes the relationship between investment in education and the rationalization of industrial structure in Hainan Province. And then from theoretical and empirical perspectives, it employs the data sam-ples and empirical analysis tools in recent years to demonstrate that education investment in Hainan Province is conducive to promoting the upgrading of in-dustrial structure. And then appropriate policy recommendations to speed up the optimization and upgrading of industrial structure in Hainan Province will be provided.
This paper does not study the education investment of cities and counties in Hainan Province. And it lacks a comparison of education investment between cities and counties in Hainan Province, which can also be a direction for future research.

D. Yu et al.
DOI: 10.4236/jssm.2017.105036 463 Journal of Service Science and Management
References [1] Hu, B.J., Cai, Z.L. and Guo, L.H. (2010) Analysis of Industrial Structure Rationali-
zation Based on Deviation-Share Model. Journal of Northwest A & F University (Social Science Edition), No. 2, 45-50.
[2] Wang, L.S. and Mei, H.C. (2011) Research on the Industrial Structure Rationaliza-tion Evaluation System. Industrial Technology Economy, No. 4, 77-83.
[3] Ma, L.F. (2011) Measurement and Analysis on the Level of Industrial Structure Ra-tionalization. Urban Studies, No. 6, 19-21.
[4] Li, X.Z., Song, H.M. and Zheng, X. (2012) Analysis of Industrial Structure Rationa-lization in Liaoning Province. Journal of Shenyang University of Technology, No. 2, 35-37.
[5] Guo, F. and Zheng, G.Z. (2013) Ealuation and Adjustment Measures of Industrial Structure Rationalization in He Jin City. Journal of Shanxi Normal University (Natural Science Edition), No. 2, 108-111.
[6] Zhou, M.S. (2013) Analysis of the Economic Growth Effect on the Industrial Struc-ture Rationalization. Learning and Exploration, No. 10, 111-115.
[7] Chen, X. and Mu, H.z. (2014) Research on China’s Industrial Structure Rationaliza-tion and Its Relationship with Economic Growth. Economic Research Reference, No. 46, 20-29.
[8] Wang, H.J. (2015) Analysis of the Impact of Industrial Structure Optimization on China’s Economic Growth and Economic Fluctuation. Industrial Economics, No. 3, 43-44.
[9] Zhang, J. and Guo, P. (2008) Empirical Research on the Relationship between Edu-cation Investment and China’s Economic Growth. Shijiazhuang Railway Institute, No. 2, 28-31.
[10] Zhou, Z.J. and Zhao, X.C. (2011) Analysis on the Nonlinear Cointegration Rela-tionship of China’s Education Investment and Economic Growth. Finance Re-search, No. 4, 59-63.
[11] Wu, Y. (2014) Analysis on the Relationship between Financial Education Invest-ment and Economic Growth. Finance & Economy, No. 11, 153-155.
[12] Wang, R. and Yang, J. (2008) Empirical Study on Financial Expenditure Behavior of Local Government Education in China. Journal of Peking University, No. 4, 128-137.
[13] Li, J. (2012) Equilibrium Relationship between Education Spending and Economic Growth. Advances in Applied Economics & Finance, 2.
[14] Zhang, Z., Li, C. and Peng, M. (2011) Empirical Analysis on Education Funding In-vestment’s Contribution to Economic Growth. Science and Education, 6, 3-4.
[15] Wu, F. and Zhou, L. (2012) Empirical Study on the Impact of Education Investment on Economic Growth in China. Contemporary Economy, 10, 140-141.
[16] Ma, Y. (2012) Research on China’s Education, Economic Development Method and Financial Security. Finance Office of Finance Branch of the Ministry of Finance, No. 5.
[17] Chen, H., Shan, D. and Liu, K. (2013) Empirical Study on the Relationship between Education Hierarchy and Economic Development in the Western Region-Based on the Empirical Test of the Panel Data of Western 12 Provinces. Modern Education Management, 1, 42-46.
[18] Jiao, Q. (2014) Education Financial Investment and Economic Development. Eco-nomic Management Press, 188-207.