The empirical literature on inequality focused more on ...
70
econstor Make Your Publications Visible. A Service of zbw Leibniz-Informationszentrum Wirtschaft Leibniz Information Centre for Economics Reyes, Celia M.; Mina, Christian D.; Asis, Ronina D. Working Paper Inequality of opportunities among ethnic groups in the Philippines WIDER Working Paper, No. 2017/154 Provided in Cooperation with: United Nations University (UNU), World Institute for Development Economics Research (WIDER) Suggested Citation: Reyes, Celia M.; Mina, Christian D.; Asis, Ronina D. (2017) : Inequality of opportunities among ethnic groups in the Philippines, WIDER Working Paper, No. 2017/154, ISBN 978-92-9256-380-6, The United Nations University World Institute for Development Economics Research (UNU-WIDER), Helsinki, http://dx.doi.org/10.35188/UNU-WIDER/2017/380-6 This Version is available at: http://hdl.handle.net/10419/189999 Standard-Nutzungsbedingungen: Die Dokumente auf EconStor dürfen zu eigenen wissenschaftlichen Zwecken und zum Privatgebrauch gespeichert und kopiert werden. Sie dürfen die Dokumente nicht für öffentliche oder kommerzielle Zwecke vervielfältigen, öffentlich ausstellen, öffentlich zugänglich machen, vertreiben oder anderweitig nutzen. Sofern die Verfasser die Dokumente unter Open-Content-Lizenzen (insbesondere CC-Lizenzen) zur Verfügung gestellt haben sollten, gelten abweichend von diesen Nutzungsbedingungen die in der dort genannten Lizenz gewährten Nutzungsrechte. Terms of use: Documents in EconStor may be saved and copied for your personal and scholarly purposes. You are not to copy documents for public or commercial purposes, to exhibit the documents publicly, to make them publicly available on the internet, or to distribute or otherwise use the documents in public. If the documents have been made available under an Open Content Licence (especially Creative Commons Licences), you may exercise further usage rights as specified in the indicated licence. www.econstor.eu
Transcript of The empirical literature on inequality focused more on ...

econstorMake Your Publications Visible.
A Service of
zbwLeibniz-InformationszentrumWirtschaftLeibniz Information Centrefor Economics
Reyes, Celia M.; Mina, Christian D.; Asis, Ronina D.
Working Paper
Inequality of opportunities among ethnic groups inthe Philippines
WIDER Working Paper, No. 2017/154
Provided in Cooperation with:United Nations University (UNU), World Institute for Development Economics Research(WIDER)
Suggested Citation: Reyes, Celia M.; Mina, Christian D.; Asis, Ronina D. (2017) : Inequality ofopportunities among ethnic groups in the Philippines, WIDER Working Paper, No. 2017/154,ISBN 978-92-9256-380-6, The United Nations University World Institute for DevelopmentEconomics Research (UNU-WIDER), Helsinki,http://dx.doi.org/10.35188/UNU-WIDER/2017/380-6
This Version is available at:http://hdl.handle.net/10419/189999
Standard-Nutzungsbedingungen:
Die Dokumente auf EconStor dürfen zu eigenen wissenschaftlichenZwecken und zum Privatgebrauch gespeichert und kopiert werden.
Sie dürfen die Dokumente nicht für öffentliche oder kommerzielleZwecke vervielfältigen, öffentlich ausstellen, öffentlich zugänglichmachen, vertreiben oder anderweitig nutzen.
Sofern die Verfasser die Dokumente unter Open-Content-Lizenzen(insbesondere CC-Lizenzen) zur Verfügung gestellt haben sollten,gelten abweichend von diesen Nutzungsbedingungen die in der dortgenannten Lizenz gewährten Nutzungsrechte.
Terms of use:
Documents in EconStor may be saved and copied for yourpersonal and scholarly purposes.
You are not to copy documents for public or commercialpurposes, to exhibit the documents publicly, to make thempublicly available on the internet, or to distribute or otherwiseuse the documents in public.
If the documents have been made available under an OpenContent Licence (especially Creative Commons Licences), youmay exercise further usage rights as specified in the indicatedlicence.
www.econstor.eu
WIDER Working Paper 2017/154
Inequality of opportunities among ethnic groups in the Philippines
Celia M. Reyes, Christian D. Mina, and Ronina D. Asis*
July 2017

* All authors: the Philippine Institute for Development Studies, Quezon City, the Philippines; corresponding author: Celia M. Reyes [email protected]
This study has been prepared within the UNU-WIDER project on ‘The politics of group-based inequality—measurement, implications, and possibilities for change’, which is part of a larger research project on ‘Disadvantaged groups and social mobility’.
Copyright © UNU-WIDER 2017
Information and requests: [email protected]
ISSN 1798-7237 ISBN 978-92-9256-380-6
Typescript prepared by the Authors and Anna-Mari Vesterinen.
The United Nations University World Institute for Development Economics Research provides economic analysis and policy advice with the aim of promoting sustainable and equitable development. The Institute began operations in 1985 in Helsinki, Finland, as the first research and training centre of the United Nations University. Today it is a unique blend of think tank, research institute, and UN agency—providing a range of services from policy advice to governments as well as freely available original research.
The Institute is funded through income from an endowment fund with additional contributions to its work programme from Denmark, Finland, Sweden, and the United Kingdom.
Katajanokanlaituri 6 B, 00160 Helsinki, Finland
The views expressed in this paper are those of the author(s), and do not necessarily reflect the views of the Institute or the United Nations University, nor the programme/project donors.
Abstract: This paper contributes to the scant body of literature on inequalities among and within ethnic groups in the Philippines by examining both the vertical and horizontal measures in terms of opportunities in accessing basic services such as education, electricity, safe water, and sanitation. The study also provides a glimpse of the patterns of inequality in Mindanao. The results show that there are significant inequalities in opportunities in accessing basic services within and among ethnic groups in the Philippines. Muslims (particularly indigenous people) are the worst-off ethnic groups while the non-indigenous/non-Muslim groups are the better-off groups. Disparities in terms of literacy rate and access to electricity and sanitation between ethnic groups, however, appear to be narrowing between 2000 and 2010.
Keywords: ethnic group, horizontal inequality, indigenous people, inequality of opportunities, Mindanao, Philippines JELs: J15, I24, Z13, C13 Acknowledgements: The authors acknowledge the excellent research assistance provided by Maria Blesila D. Mondez and Arkin A. Arboneda, Senior Research Specialist and Research Analyst II, respectively. The authors are also grateful for the assistance extended by the National Commission on Indigenous People (NCIP) in coming up with the major ethnic group classification and for sharing some relevant materials and the Philippine Statistics Authority (PSA) for the census data sets.

1
1 Introduction
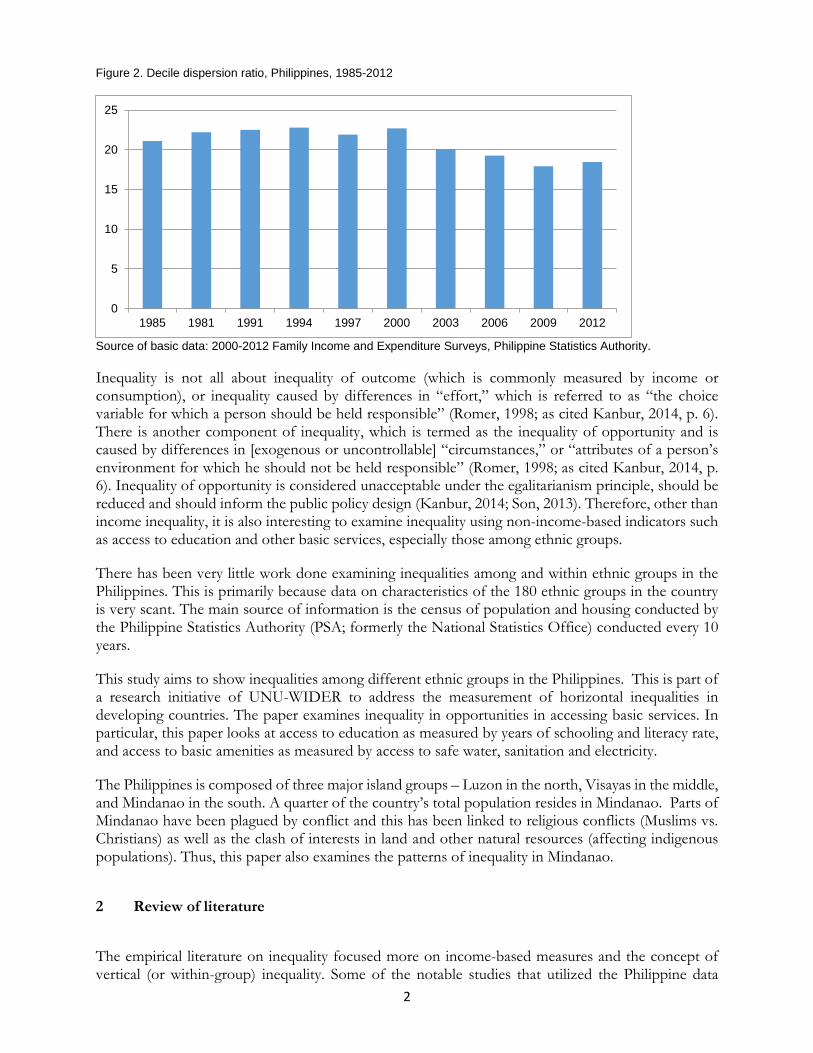
Income inequality has continued to persist even in Asian economic giants1 like Singapore and China albeit considerable reduction in absolute poverty. For the past two decades, income inequality in the East Asian region2 has risen by over 20 percent, which largely contributed to persistence of poverty in the region (NEAT, 2015). In the case of the Philippines, income inequality has been following a generally downward trend since 1998. After reaching its peak at 0.5183 in 1997 (during the height of the Asian Financial crisis), the Gini coefficient had consistently been going down from 0.5045 in 2000 to 0.4714 in 2012—the lowest point so far during the covered period of 1991-2012 (Figure 1). This downward trend largely reflects the income distribution in urban areas. On the other hand, income distribution in rural areas has been on the rise since 1991. Periods of rising inequality in rural areas are 1994-1997 and 2009-2012. Arguably, this can be attributed to the bias towards urban and coastal areas but against rural and inland regions due to emergence of new economic opportunities brought by technological change, globalization and market-oriented reforms (Yap, 2013). Decile dispersion ratio has also not significantly reduced for almost three decades. Income of the richest decile has remained around 20 times of the income of the poorest decile (Figure 2). As a result, the poverty situation in the country has not significantly improved and geographical disparity still exists.
Figure 1. Gini coefficient, Philippines, 1991-2012, by area
Source: Reyes et al. (2012).
1 Mukhopadhaya et al. (2011) tagged China and India as the Asian demographic and economic giants, while Li and Xu (2016) considered Singapore as one of the four Asian economic giants, together with Hong Kong, Taiwan and South Korea. 2 ASEAN+3 countries, composed of Brunei Darussalam, Cambodia, China, Indonesia, Japan, Republic of Korea, Laos, Malaysia, Myanmar, Philippines, Singapore, Thailand, and Viet Nam.
0.4803 0.4735
0.51830.5045
0.4871 0.48370.4743 0.4714
0.47360.4602
0.48500.4782 0.4513 0.4496 0.4462 0.4476
0.3941 0.3942
0.4190 0.4255 0.4288 0.4296 0.42780.4471
0.350.370.390.410.430.450.470.490.510.530.55
1991 1994 1997 2000 2003 2006 2009 2012
All Areas Urban Rural
2
Figure 2. Decile dispersion ratio, Philippines, 1985-2012
Source of basic data: 2000-2012 Family Income and Expenditure Surveys, Philippine Statistics Authority.
Inequality is not all about inequality of outcome (which is commonly measured by income or consumption), or inequality caused by differences in “effort,” which is referred to as “the choice variable for which a person should be held responsible” (Romer, 1998; as cited Kanbur, 2014, p. 6). There is another component of inequality, which is termed as the inequality of opportunity and is caused by differences in [exogenous or uncontrollable] “circumstances,” or “attributes of a person’s environment for which he should not be held responsible” (Romer, 1998; as cited Kanbur, 2014, p. 6). Inequality of opportunity is considered unacceptable under the egalitarianism principle, should be reduced and should inform the public policy design (Kanbur, 2014; Son, 2013). Therefore, other than income inequality, it is also interesting to examine inequality using non-income-based indicators such as access to education and other basic services, especially those among ethnic groups.
There has been very little work done examining inequalities among and within ethnic groups in the Philippines. This is primarily because data on characteristics of the 180 ethnic groups in the country is very scant. The main source of information is the census of population and housing conducted by the Philippine Statistics Authority (PSA; formerly the National Statistics Office) conducted every 10 years.
This study aims to show inequalities among different ethnic groups in the Philippines. This is part of a research initiative of UNU-WIDER to address the measurement of horizontal inequalities in developing countries. The paper examines inequality in opportunities in accessing basic services. In particular, this paper looks at access to education as measured by years of schooling and literacy rate, and access to basic amenities as measured by access to safe water, sanitation and electricity.
The Philippines is composed of three major island groups – Luzon in the north, Visayas in the middle, and Mindanao in the south. A quarter of the country’s total population resides in Mindanao. Parts of Mindanao have been plagued by conflict and this has been linked to religious conflicts (Muslims vs. Christians) as well as the clash of interests in land and other natural resources (affecting indigenous populations). Thus, this paper also examines the patterns of inequality in Mindanao.
2 Review of literature
The empirical literature on inequality focused more on income-based measures and the concept of vertical (or within-group) inequality. Some of the notable studies that utilized the Philippine data
0
5
10
15
20
25
1985 1981 1991 1994 1997 2000 2003 2006 2009 2012
3
include Kanbur and Zhuang (2013) and Balisacan and Fuwa (2004). Kanbur and Zhuang (2013) noted that the national-level income inequality has inched up due to urbanization and rising rural inequality. Balisacan and Fuwa (2004), on the other hand, argued that the national-level income inequality is largely due to income differences within the region. Regional differences, or the so-called spatial inequality, account only for a small component of inequality. The study also mentioned that there had been income convergence among provinces probably due to human capital stock and land distribution, among others.
Horizontal inequality among different ethnic groups in terms of non-income-based indicators has not yet been explored much in the literature. A few studies that tackled topics related to this include those of Stewart et al. (2010), McDoom and Gisselquist (2015), Lindquist (2011), and Selway (2011), among others.
Some studies focused on the measurement and monitoring of horizontal inequality. Stewart et al. (2010) proposed a methodology of measuring and monitoring the horizontal inequality and demonstrated it using longitudinal income data from South Africa and census data from Indonesia. The study concluded that group-weighted coefficient of variation, group-weighted Gini and group-weighted Theil’s index are all suitable measures of horizontal inequality. An earlier study by Stewart (2009) defined horizontal inequality and illustrated its presence using the 1995 inter-censal survey data from Indonesia. The results suggest that political as well as cultural status inequality (which leads to violent unrest) exists in countries where Muslims form a minority. In countries where Muslims form a majority, on the other hand, economic inequalities are compensated for by political power and cultural status. It also provided evidence on the international links across Muslim groups. Selway (2011), on the other hand, introduced the concepts of crosscuttingness and cross-fractionalization. In relation to this, Abanes et al. (2014) examined the relationship between ethno-religious categorization, identification and social distance by testing the mediation of out-group trust using the Philippine data. The study randomly surveyed university students in Metro Manila and Autonomous Region in Muslim Mindanao (ARMM). The study revealed that there are significant differences by ethno-religious categorization on social distance. In addition, it has been found that people who strongly identify with their religion tend to maintain social distance with religious out-groups, and this can be explained by out-group trust. McDoom and Gisselquist (2015) estimated various measures of ethno-religious divisions (e.g., horizontal inequality, fractionalization, crosscuttingness) for Mindanao using the 2000 and 2010 individual-level census data for the Philippines. The analyses suggest that horizontal inequalities between ethnic groups can explain the nexus between ethnic divisions and ethnic civil war as well as that between ethnic divisions and less provision of public goods.
Some studies specifically estimated inequality of opportunity. Son (2013) presented a measure of inequality of opportunity—the Human Opportunity Index (HOI)—using household-level survey data from seven developing countries, including the Philippines. Findings of the study include: (1) inequality in terms of primary school attendance is higher than that of secondary school attendance; (2) main factors affecting inequality of opportunity for education are per capita household expenditure, location and education of household head; (3) inequalities in terms of access to basic infrastructure services like safe water, electricity and sanitation are lower; and, (4) main factor affecting inequality of opportunity in terms of access to safe water and sanitation is per capita household expenditure. Marrero and Rodriguez (2012) measured inequality of opportunity and compared the estimates across European countries. The study also identified the set of characteristics with causal effect on inequality of opportunity. Using the 2005 cross-sectional data for 26 European countries, the study revealed that countries with low inequalities are Nordic, continental and some Eastern countries while countries with high inequalities are the Mediterranean, Atlantic and other Eastern countries. It has also been found that total social protection expenditure, dropping out from school, reaching secondary level education, as well as development and labor market variables negatively
4
correlate with inequality of opportunity. Singh (2012) also estimated inequality of opportunity in earnings and consumption expenditure for different aged-based cohorts in India using both parametric and nonparametric approaches. Nonparametric approach revealed that inequality of opportunity in earnings is lower in rural areas than in urban areas, and significant factors affecting inequality includes absence of high paying jobs in rural areas and limited choices regarding decisions about their children due to infrastructural constraints in rural areas. Results from the parametric approach include the following: (1) father's education and occupational status have positive effect on earnings and consumption expenditure; (2) father's education has higher maximum opportunity share in earnings inequality in urban areas than in rural areas; and, (3) opportunity shares of circumstances are relatively larger in rural areas. Moreover, Ferreira and Gignoux (2011), on the other hand, introduced the absolute and relative versions of the lower-bound index of inequality of opportunity. The study noted that inequality of opportunity ratios are higher for consumption than for income while inequality of opportunity levels are generally lower for consumption and for income. Opportunity deprivation is also found to be strongly correlated with ethnicity, region and family background.
There are also studies that looked into possible relationship between conflicts and inequality. Using pooled cross-section data on European countries, Lindquist (2011) found that horizontal inequality (in terms of access to education) can significantly predict the occurrence of ethnic and civil conflict. Caprioli (2005) examined the impact of gender inequality on the probability of intrastate conflict using PRIO/Uppsala data set of internal conflict. The study found that higher levels of gender inequality within a state has higher probability of experiencing internal conflict. In addition, presence and number of at-risk minorities, transitional polities and prior conflict increase the probability of internal conflict. Vinck (2011) is one of the local studies that looked into the violent conflicts in Central Mindanao. Based on a series of interviews conducted in selected areas in mainland Mindanao, the study found that violent conflict in Central Mindanao has caused mass displacement between 2000 and 2010. Another local study is Edillon (2005), which examined the determinants of incidence of armed conflicts in the Philippines using the time-series data on armed conflicts for the period 1972-2004. Some of the key findings of the study include the following: (1) the most significant determinant of incidence of conflict is government’s policy on peace and income redistribution; (2) deprivation in access to water is a considered as a major cause of conflict; (3) minoritization and average permanent income are positively correlated with incidence of conflict.
3 Methodology
3.1 Data
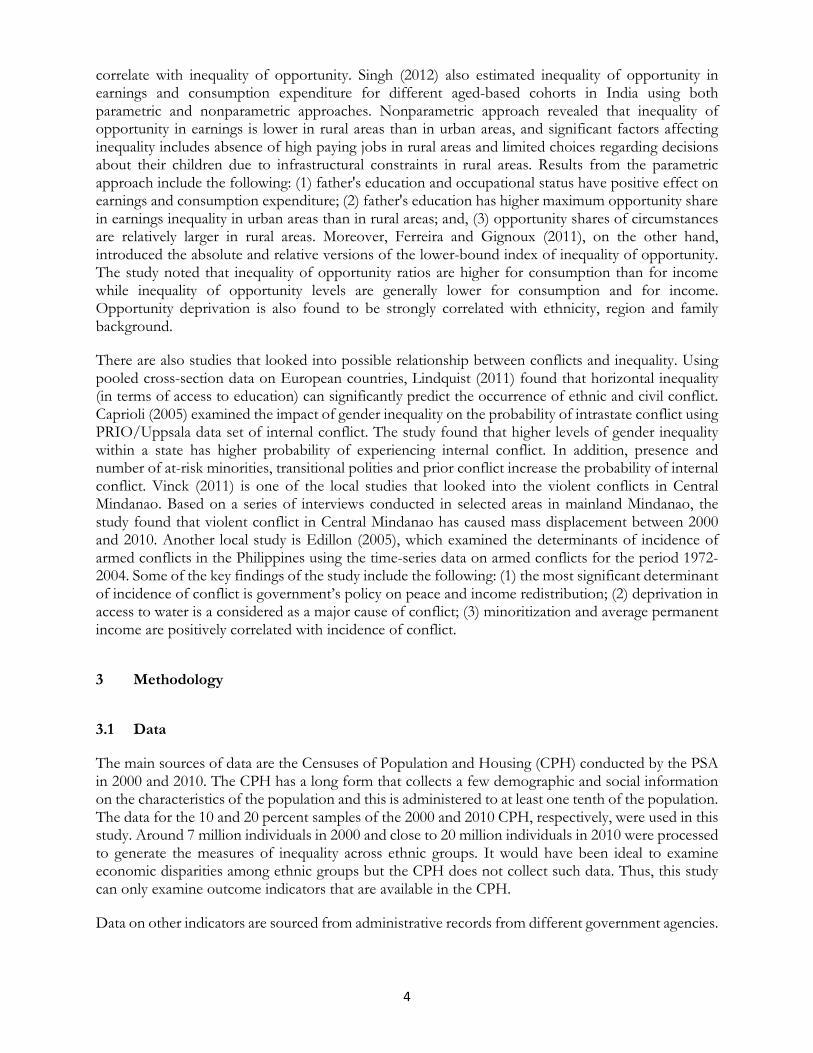
The main sources of data are the Censuses of Population and Housing (CPH) conducted by the PSA in 2000 and 2010. The CPH has a long form that collects a few demographic and social information on the characteristics of the population and this is administered to at least one tenth of the population. The data for the 10 and 20 percent samples of the 2000 and 2010 CPH, respectively, were used in this study. Around 7 million individuals in 2000 and close to 20 million individuals in 2010 were processed to generate the measures of inequality across ethnic groups. It would have been ideal to examine economic disparities among ethnic groups but the CPH does not collect such data. Thus, this study can only examine outcome indicators that are available in the CPH.
Data on other indicators are sourced from administrative records from different government agencies.
5
3.2 Variables
Outcome variables
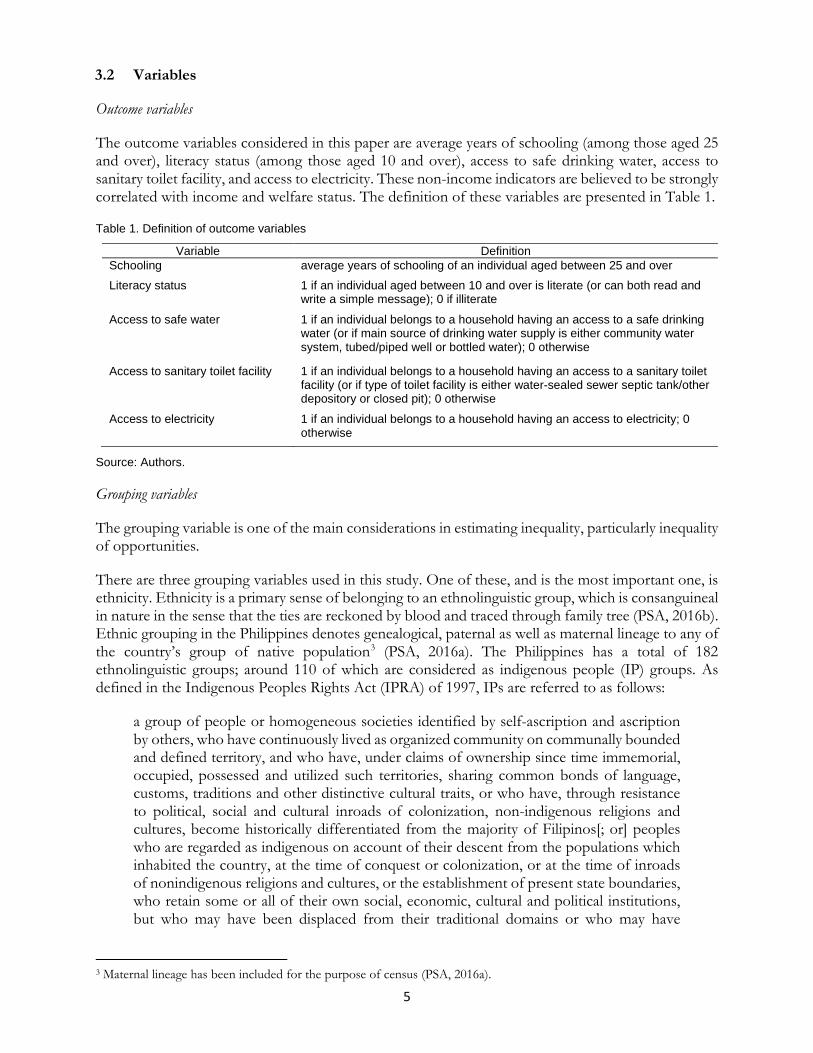
The outcome variables considered in this paper are average years of schooling (among those aged 25 and over), literacy status (among those aged 10 and over), access to safe drinking water, access to sanitary toilet facility, and access to electricity. These non-income indicators are believed to be strongly correlated with income and welfare status. The definition of these variables are presented in Table 1.
Table 1. Definition of outcome variables
Variable Definition Schooling average years of schooling of an individual aged between 25 and over Literacy status 1 if an individual aged between 10 and over is literate (or can both read and
write a simple message); 0 if illiterate
Access to safe water 1 if an individual belongs to a household having an access to a safe drinking water (or if main source of drinking water supply is either community water system, tubed/piped well or bottled water); 0 otherwise
Access to sanitary toilet facility 1 if an individual belongs to a household having an access to a sanitary toilet facility (or if type of toilet facility is either water-sealed sewer septic tank/other depository or closed pit); 0 otherwise
Access to electricity 1 if an individual belongs to a household having an access to electricity; 0 otherwise
Source: Authors.
Grouping variables
The grouping variable is one of the main considerations in estimating inequality, particularly inequality of opportunities.
There are three grouping variables used in this study. One of these, and is the most important one, is ethnicity. Ethnicity is a primary sense of belonging to an ethnolinguistic group, which is consanguineal in nature in the sense that the ties are reckoned by blood and traced through family tree (PSA, 2016b). Ethnic grouping in the Philippines denotes genealogical, paternal as well as maternal lineage to any of the country’s group of native population3 (PSA, 2016a). The Philippines has a total of 182 ethnolinguistic groups; around 110 of which are considered as indigenous people (IP) groups. As defined in the Indigenous Peoples Rights Act (IPRA) of 1997, IPs are referred to as follows:
a group of people or homogeneous societies identified by self-ascription and ascription by others, who have continuously lived as organized community on communally bounded and defined territory, and who have, under claims of ownership since time immemorial, occupied, possessed and utilized such territories, sharing common bonds of language, customs, traditions and other distinctive cultural traits, or who have, through resistance to political, social and cultural inroads of colonization, non-indigenous religions and cultures, become historically differentiated from the majority of Filipinos[; or] peoples who are regarded as indigenous on account of their descent from the populations which inhabited the country, at the time of conquest or colonization, or at the time of inroads of nonindigenous religions and cultures, or the establishment of present state boundaries, who retain some or all of their own social, economic, cultural and political institutions, but who may have been displaced from their traditional domains or who may have
3 Maternal lineage has been included for the purpose of census (PSA, 2016a).

6
resettled outside their ancestral domains. (IPRA, Chapter II, Section 3h; as cited in ADB, 2002)
Since there are more than a hundred (i.e., 147 and 182 in 2000 and 2010, respectively) ethnolinguistic groups in the Philippines that are reported in the CPH, the authors decided to create major groups out of these many smaller ethnic groups. Based on the classification used by the NCIP, this study came up with three major ethnic groups, namely: (1) Muslim ethnic groups; (2) Indigenous non-Muslim ethnic groups, or non-Muslim IPs; and, (3) Non-indigenous/non-Muslim ethnic groups, or non-Muslim/non-IPs. The first group is composed of ethnic groups that are Muslims—also known as Moros in other studies; regardless of whether they are IPs or not. It has two sub-groups—the indigenous Muslim ethnic groups and the non-indigenous Muslim ethnic groups. According to the NCIP, the indigenous Muslim ethnic groups are those that embrace the Islamic faith and, at the same time, continue to practice their own culture and tradition as IPs. The non-indigenous Muslim ethnic groups are not classified as IPs by the Office of the Muslim Affairs (OMA) but profess the Islamic faith. In 2010, this group comprised the following small ethnic groups/tribes:
Table 2. List of Muslim ethnic groups
Indigenous Muslim ethnic groups
Non-indigenous Muslim ethnic groups
1. Badjao 2. Iranon/Iranun/Iraynon 3. Jama Mapun 4. Kalagan 5. Kalibugan/Kolibugan 6. Sama Badjao 7. Sama Bangingi 8. Sama Laut 9. Sama/Samal
1. Maguindanao 2. Maranao 3. Palawani 4. Sangil 5. Tausug 6. Yakan
Source: National Commission on Indigenous Peoples (2010).
The second group are non-Muslim ethnic groups that are officially classified by the NCIP as IPs. In 2010, this major group is composed of 142 ethnic groups nationwide. Refer to Appendix A for the complete list.
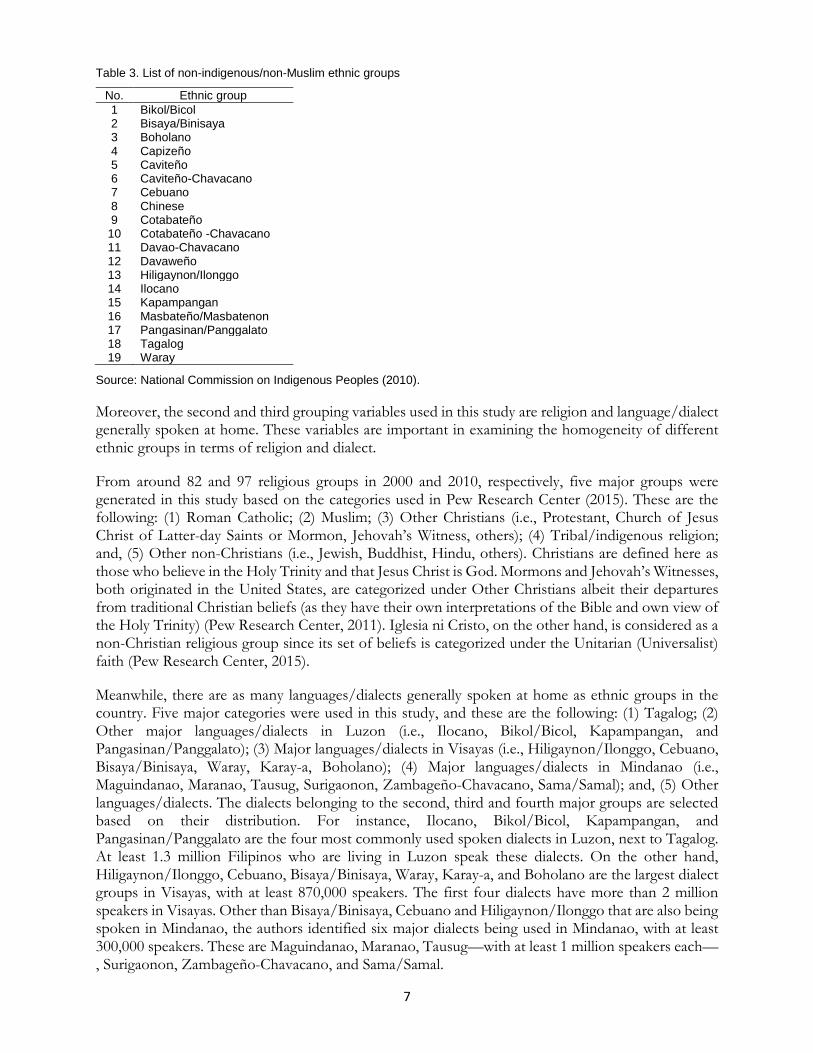
The remaining 19 ethnic groups—labeled as “non-indigenous/non-Muslim ethnic groups” by the authors comprised the third major ethnic group (Table 3). These are those that are neither Muslim ethnic groups nor IPs.
7
Table 3. List of non-indigenous/non-Muslim ethnic groups
No. Ethnic group 1 Bikol/Bicol 2 Bisaya/Binisaya 3 Boholano 4 Capizeño 5 Caviteño 6 Caviteño-Chavacano 7 Cebuano 8 Chinese 9 Cotabateño
10 Cotabateño -Chavacano 11 Davao-Chavacano 12 Davaweño 13 Hiligaynon/Ilonggo 14 Ilocano 15 Kapampangan 16 Masbateño/Masbatenon 17 Pangasinan/Panggalato 18 Tagalog 19 Waray
Source: National Commission on Indigenous Peoples (2010).
Moreover, the second and third grouping variables used in this study are religion and language/dialect generally spoken at home. These variables are important in examining the homogeneity of different ethnic groups in terms of religion and dialect.
From around 82 and 97 religious groups in 2000 and 2010, respectively, five major groups were generated in this study based on the categories used in Pew Research Center (2015). These are the following: (1) Roman Catholic; (2) Muslim; (3) Other Christians (i.e., Protestant, Church of Jesus Christ of Latter-day Saints or Mormon, Jehovah’s Witness, others); (4) Tribal/indigenous religion; and, (5) Other non-Christians (i.e., Jewish, Buddhist, Hindu, others). Christians are defined here as those who believe in the Holy Trinity and that Jesus Christ is God. Mormons and Jehovah’s Witnesses, both originated in the United States, are categorized under Other Christians albeit their departures from traditional Christian beliefs (as they have their own interpretations of the Bible and own view of the Holy Trinity) (Pew Research Center, 2011). Iglesia ni Cristo, on the other hand, is considered as a non-Christian religious group since its set of beliefs is categorized under the Unitarian (Universalist) faith (Pew Research Center, 2015).
Meanwhile, there are as many languages/dialects generally spoken at home as ethnic groups in the country. Five major categories were used in this study, and these are the following: (1) Tagalog; (2) Other major languages/dialects in Luzon (i.e., Ilocano, Bikol/Bicol, Kapampangan, and Pangasinan/Panggalato); (3) Major languages/dialects in Visayas (i.e., Hiligaynon/Ilonggo, Cebuano, Bisaya/Binisaya, Waray, Karay-a, Boholano); (4) Major languages/dialects in Mindanao (i.e., Maguindanao, Maranao, Tausug, Surigaonon, Zambageño-Chavacano, Sama/Samal); and, (5) Other languages/dialects. The dialects belonging to the second, third and fourth major groups are selected based on their distribution. For instance, Ilocano, Bikol/Bicol, Kapampangan, and Pangasinan/Panggalato are the four most commonly used spoken dialects in Luzon, next to Tagalog. At least 1.3 million Filipinos who are living in Luzon speak these dialects. On the other hand, Hiligaynon/Ilonggo, Cebuano, Bisaya/Binisaya, Waray, Karay-a, and Boholano are the largest dialect groups in Visayas, with at least 870,000 speakers. The first four dialects have more than 2 million speakers in Visayas. Other than Bisaya/Binisaya, Cebuano and Hiligaynon/Ilonggo that are also being spoken in Mindanao, the authors identified six major dialects being used in Mindanao, with at least 300,000 speakers. These are Maguindanao, Maranao, Tausug—with at least 1 million speakers each—, Surigaonon, Zambageño-Chavacano, and Sama/Samal.

8
3.3 Inequality measures
Different measures of inequality are estimated to determine whether there is an unequal access to basic services across different groups (“between-group”) and across members of each group (“within-group”). The most common of these measures are Gini coefficient, Theil’s index and coefficient of variation4. This study also presents measures of crosscuttingness and cross-fractionalization proposed by Selway (2011) as well as the HOI developed by the World Bank.
Gini coefficient
The Gini coefficient5 is the most commonly used inequality measure. Its values range from 0 to 1, indicating perfect equality and perfect inequality, respectively. This measure can be computed using the following equation:
( )[ ]∑ +−
−+= iyiN
NyNG 1211 2
,
where persons are ranked in ascending order of iy . This measure cannot usually be written as the sum of a term summarizing within-group inequality and a term summarizing between-group inequality.
Consider a population of persons (or households), i = 1, 2, …, n, with outcome variable iy and iw .
Let
Nw
f ii =
,
where
∑= iwN .
[In what follows all sums are over all values of whatever is subscripted.] Arithmetic mean income is y . Suppose there is an exhaustive partition of the population into mutually-exclusive subgroups k =
1, 2, …, K.
Theil’s index
The Theil’s index belongs to the Generalized Entropy class of inequality indices, which is given by the following formula:
= ∑ y
yyy
fGE iii log)1(
.
4 These can be estimated using the following commands in the Stata software: ineqdeco, ginidesc, ainequal, egen_inequal, and iop. The first two commands provide between- and within-group components. The last one is commonly used when the variable of interest is dichotomous or binary. 5 Formulas for Gini coefficient and Theil’s index were mainly sourced from Stata’s help desk on ineqdeco.

9
This index, which ranges from 0 to log n, can be additively decomposed as follows:
)1()1()1( BW GEGEGE += ,
where: )1(WGE is the ‘within-group’ inequality while )1(BGE is the ‘between-group’ inequality. Furthermore,
[ ][ ] )1()1(
)1( kak
akW GEsvGE ∑ −= ,
where
NN
v kk =
is the number of persons in subgroup k divided by the total number of persons (subgroup population
share), and ks is the share of total income held by k’s members (subgroup income share). (Strictly
speaking, kv is the sum of the weights in subgroup k divided by the sum of the weights for the full estimation sample.)
)1(kGE , which is the inequality for subgroup k, is calculated as if the subgroup were a separate population, and )1(BGE is derived assuming every person (or household) within a given subgroup k
received k’s mean income, ky .
Group-weighted coefficient of variation
The group-weighted coefficient of variation (GCOV) is given by the following formula:
( )( ) 21
21
−= ∑
R
rrr yyp
yGCOV
where:
∑=rn
iir
rr y
ny 1
is the group r’s mean value;
R is the number of groups;
rp is group r’s population share;
iry is the quantity of the variable of interest (e.g., years of education) of the ith member of group r
The coefficient of variation is a common measure of regional disparities. GCOV is weighted by the population size of each group, so that changes in the position of small groups get less weight than those of larger groups (Mancini, 2005).
10
Crosscuttingness
Crosscuttingness (CC) was proposed by Selway (2011) and is identified when group i on cleavage x is identically distributed among groups on cleavage y with all other groups on cleavage x. It is based on the normalization of the chi-square statistic given by Cramer (Agresti, 2002) and subtracted from 1, so that higher values imply higher crosscuttingness. The formula is as follows:
( )
nm
EEO
CC
r
i
c
j ij
ijij∑∑= =
−
−=1 1
2
1
where:
O is the observed frequency in the subgroup cell;
E is the expected frequency = (column %)(row %)(total sample size);
n is the sample size;
m is the smaller of either the number of columns minus 1 or the number of rows minus 1
Cross-fractionalization
Meanwhile, Cross-fractionalization (CF) is the extent to which individuals who are in the same group on one cleavage are in different groups on the other cleavage (Selway, 2011) and based on Rae and Taylor’s (1970) measure of crosscuttingness. It is closely related to the Herfindahl index, which gives
the fractionalization score for the groups on cleavage x as ∑=
−n
xxp
1
21 . For two groups, CF is defined
as the sum of the number of pairs that share the same group on the first cleavage but not on the second and the number of pairs that share the same group on the second but not the first, divided by N(N-1), where N is the total number of pairs. The formula is as follows:
∑∑∑ −+===
n
yxxy
n
yy
n
xx pppCF
,
2
1
2
1
2 2
where: xp is the proportion of population at cleavage x;
yp is the proportion of population at cleavage y;
xyp is the proportion of population at both x and y

11
Human opportunity index
The HOI6 measures the contribution of inequality of opportunities by the circumstance variables7 such as socioeconomic and demographic attributes of individuals. The estimation of this measure is discussed below.
First, the following logit model is estimated using the maximum likelihood estimation:
∑+
∑
==
=
=
k
jijj
k
jijj
x
x
ii
e
ezP1
1
1
)(β
β
π
where:
iπ = )( izP is the probability that the ith individual has access to a given opportunity; iz takes the value of 1 if the ith individual has access to an opportunity and 0 otherwise;
ijx is the jth circumstance variable for ith individual;
jβ is the regression coefficient for the jth circumstance variable;
k is the total number of circumstance variables
For this particular inequality measure, the education-related outcome variables used differ from the ones used for other inequality measures. Instead of literacy rate among population aged 10 and over and average years of schooling among population aged 25 and over, access to primary education among children aged 6-11 and access to secondary education among children aged 12-18 were used. The set of circumstance variables used in this study, on the other hand, is similar to that used by Son (2013), except that the urban/rural variable was replaced by dummy variables for the major ethnic groups and the per capita household expenditure by the asset index8. In addition to the asset index and ethnicity dummy variables, other circumstance variables used are sex of the individual, age of household head, sex of household head (1 if male, 0 if female), educational attainment of household head (measured by number of years of schooling), and household size.
The resulting estimate, iπ̂ , refers to the probability of access to a given opportunity that is explained by the circumstance variables. This, together with its mean across all individuals,π , is used in the calculation of the so-called relative mean deviation or dissimilarity matrix, which is presented below.
πππ
−= ∑=
i
n
iiwD ˆ
21
1
6 Information on this, including the technical ones, were drawn from Son (2013). 7 Individuals have no control over these factors. 8 Expenditure data are not available in the 2010 CPH or any rounds of CPH.

12
where:
D measures the degree of inequality of opportunity that is explained by the individual’s circumstances
n is the number of sample individuals
iw is the population weight attached to the ith sample individual
π represents the proportion of the population with access to a given opportunity, and is also called level or coverage
Meanwhile, the human opportunity index (HOI) is estimated as follows:
)1( DHOI −= π
where: (1-D) is interpreted as equity of opportunity
Thus, the HOI is a composite index of two factors, namely: (i) level or coverage, denoted by π ; and, (ii) equity of opportunity, denoted by (1-D).
The Stata ado-file ‘hoi’ was used to compute for the HOIs for the five outcome variables.
3.4 Regression analysis
To establish relationship between armed conflicts and inequality, a regression analysis was employed. Specifically, Poisson regression was employed primarily because the conflict is a count variable. The data used for the analysis are municipal-level ones. In order to avoid the possible endogeneity bias, the period used for the independent variables is four periods earlier than that for the dependent variable. Pairwise correlation statistics was also generated to check which among the independent variables are correlated or not.
The complete description of the variables used in the regression are as follows (see Table 4 for summary):
Armed conflict is defined as the incidence of armed conflicts, bomb/grenade explosions and internally displaced persons within a municipality for the period 2010-2013. The data are sourced from the Office of the Civil Defense (OCD).
The poverty variable refers to the estimated magnitude of poverty at the municipal-level for 2009. This is calculated as the product of the municipal-level poverty incidence in 2009 and municipal-level population data in 2010, assuming that the population figures between 2009 and 2010 did not change significantly. The municipal-level poverty incidence data are sourced from the 2009 small-area estimates generated by the PSA while the municipal-level data on population are sourced from the 2010 population census of the PSA.
Index of inequality measures is the index of Gini’s between-group inequality measures for all the five outcome variables. This is generated using the Principal Components Analysis. Initially, the inequality measures are included in the regression model individually. However, since each of these measures is strongly correlated with one another, based on pairwise correlation coefficients, they were then collectively expressed by an index.
13
Road density is the ratio of total length of road network to land area, expressed in kilometer of road per 100 square kilometer of land area. Road network is defined as the length of national and local roads (all surface types, i.e., concrete, asphalt, gravel, earth), in kilometers. The road network data are sourced from the Road and Bridge Information Application, Department of Public Works and Highways (DPWH). Land area, on the other hand, is based on the 2007 Masterlist certified by the Land Management Bureau (LMB).
The ratio of elementary schools to barangays9 is number of elementary schools situated in the municipality divided by the total number of barangays of that municipality. Schools are any of the following: (i) main/independent and annex; (ii) private and public [either nationally or locally funded], but mostly public; (iii) purely elementary (secondary), or combination of elementary (secondary) and other levels of education (i.e., pre-school; attached to tertiary; secondary (elementary)). The data cover the school year 2009-2010 (specifically June 2009 to March 2010) and are sourced from the Basic Information Education System of the Department of Education (DepEd). The number of barangays, on the other hand, is sourced from the Philippine Statistical Yearbook 2009.
The number of ports is number of ports situated within the municipality in 2009, and is sourced from the Port Management Office of the Philippine Ports Authority (PPA).
Location dummies include dummy variables for Luzon and Visayas, which take the value 1 if the municipality is located in Luzon and Visayas, respectively, and 0 otherwise.
9 A barangay is referred to as the “basic political unit [that] serves as the primary planning and implementing unit of government policies, plans, programs, projects, and activities in the community, and as a forum wherein the collective views of the people may be expressed, crystallized and considered, and where disputes may be amicably settled” (DILG, 2017)
14
Table 4. Definition of variables used in regression analysis
Variable Description Source Armed conflict incidence of armed conflicts from 2010 to 2013 OCD
Poverty estimated magnitude of poverty at the municipality level for 2009 = municipal-level poverty incidence in 2009 × municipal-level population figures in 2010 [Assumption: Population figures from 2009 to 2010 did not change significantly]
PSA (2009 small-area estimates [municipal-level poverty incidence] and 2010 population census [municipal-level population figures])
Index of inequality measures
index of Gini’s between-group inequality measures for years of schooling, literacy rate, access to safe water, access to sanitary toilet facility, and access to electricity
PSA (2010 population census)
Road density ratio of total length of road network to land area (kilometer of road per 100 square kilometer of land area) in 2009
Road and Bridge Information Application, DPWH (road network); LMB (land area)
Ratio of elementary schools to barangays
ratio of elementary schools situated in the municipality to total number of barangays in 2009
Basic Information Education System, DepEd (schools); Philippine Statistical Yearbook, PSA (no. of barangays)
Number of ports number of ports in the municipality in 2009 Port Management Office, PPA
Location dummies Luzon = 1 if the municipality is located in Luzon, 0 otherwise; Visayas = 1 if the municipality is located in Visayas, 0 otherwise; Mindanao = 1 if the municipality is located in Mindanao, 0 otherwise (base category)
PSA (2010 population census)
Source: Authors.
4 Results and discussion
4.1 Basic profile
Population
The Philippine population had grown from 76.3 million in 2000 to 92.1 million in 2010. If we would exclude the samples who did not report their ethnicity or any of the variables used in the analysis, the study population would be around 69.2 million in 2000 and 91 million in 2010. A small percentage (around 5%) of the study population comprised the Muslim ethnic groups (Table 5) while around 8 percent comprised the indigenous non-Muslims. The majority of the Philippine population (around 86-87 percent) are neither IPs nor Muslims. Among the ethnic groups, the Muslims had the highest population growth rate. Between 2000 and 2010, the member population of Muslim ethnic groups had increased by 2 million (64.6%), the non-Muslim IP population by 2.1 million (38.1%) while the non-Muslims/non-IPs by 17.7 million (29.3%).
15
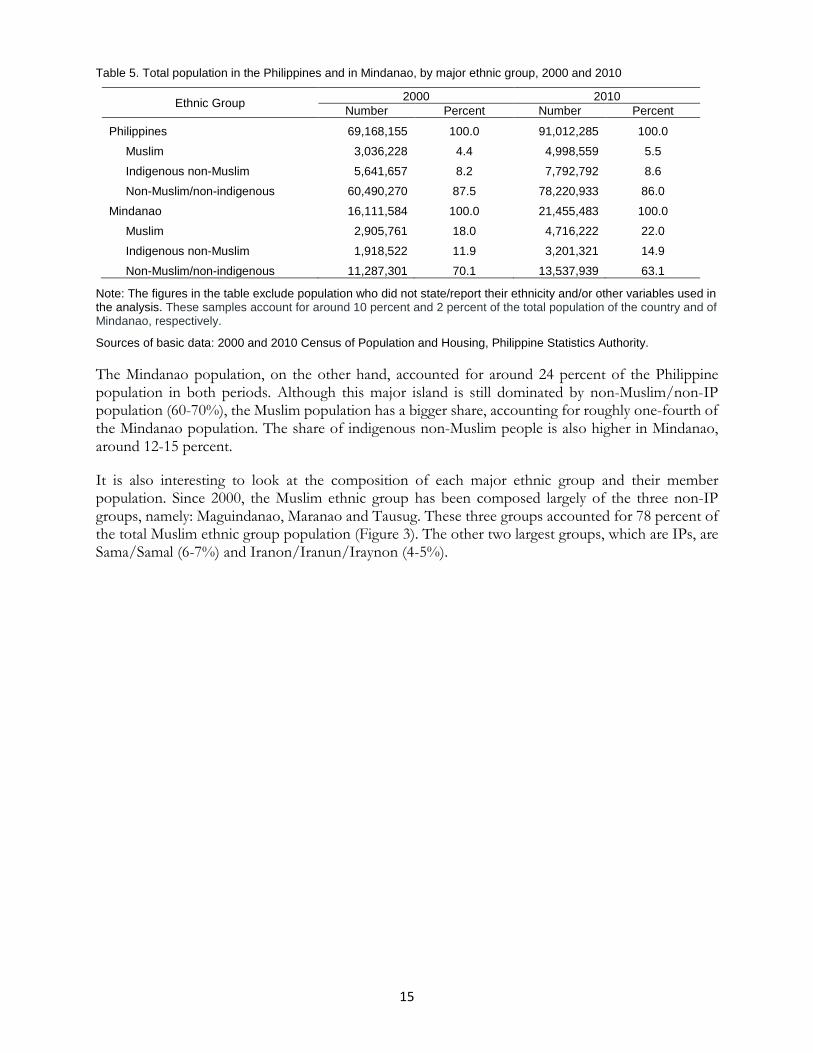
Table 5. Total population in the Philippines and in Mindanao, by major ethnic group, 2000 and 2010
Ethnic Group 2000 2010 Number Percent Number Percent
Philippines 69,168,155 100.0 91,012,285 100.0 Muslim 3,036,228 4.4 4,998,559 5.5 Indigenous non-Muslim 5,641,657 8.2 7,792,792 8.6 Non-Muslim/non-indigenous 60,490,270 87.5 78,220,933 86.0 Mindanao 16,111,584 100.0 21,455,483 100.0 Muslim 2,905,761 18.0 4,716,222 22.0 Indigenous non-Muslim 1,918,522 11.9 3,201,321 14.9 Non-Muslim/non-indigenous 11,287,301 70.1 13,537,939 63.1
Note: The figures in the table exclude population who did not state/report their ethnicity and/or other variables used in the analysis. These samples account for around 10 percent and 2 percent of the total population of the country and of Mindanao, respectively.
Sources of basic data: 2000 and 2010 Census of Population and Housing, Philippine Statistics Authority.
The Mindanao population, on the other hand, accounted for around 24 percent of the Philippine population in both periods. Although this major island is still dominated by non-Muslim/non-IP population (60-70%), the Muslim population has a bigger share, accounting for roughly one-fourth of the Mindanao population. The share of indigenous non-Muslim people is also higher in Mindanao, around 12-15 percent.
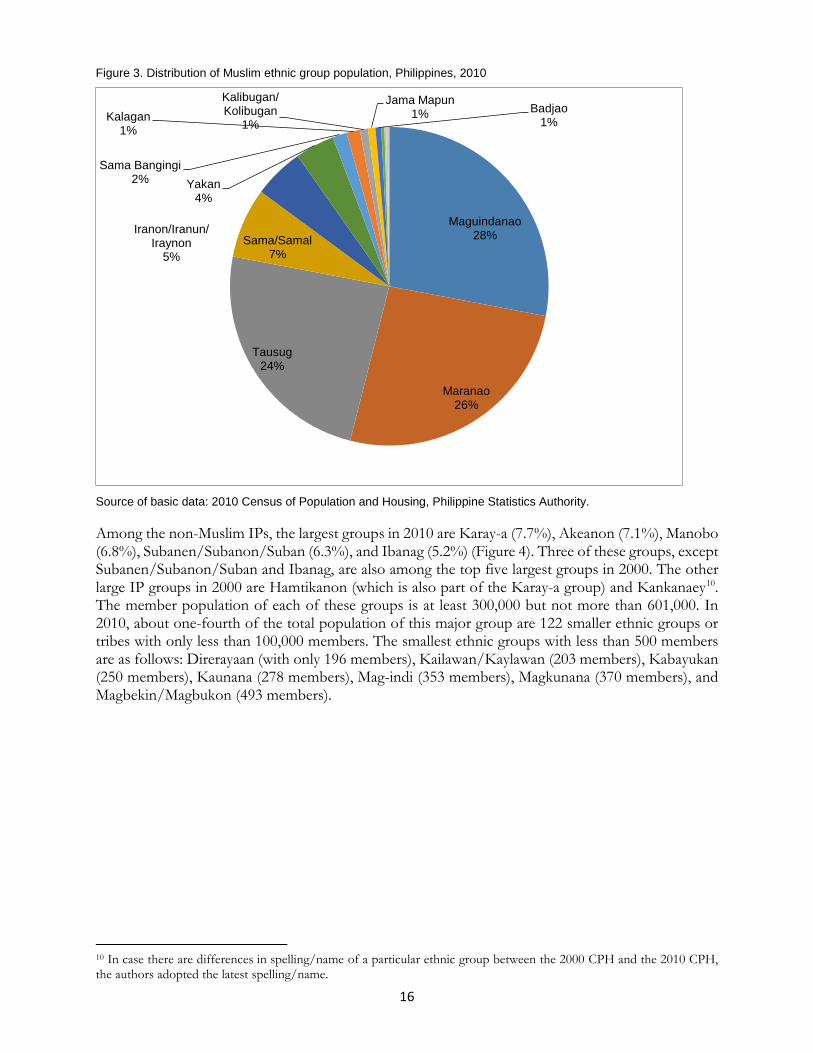
It is also interesting to look at the composition of each major ethnic group and their member population. Since 2000, the Muslim ethnic group has been composed largely of the three non-IP groups, namely: Maguindanao, Maranao and Tausug. These three groups accounted for 78 percent of the total Muslim ethnic group population (Figure 3). The other two largest groups, which are IPs, are Sama/Samal (6-7%) and Iranon/Iranun/Iraynon (4-5%).
16
Figure 3. Distribution of Muslim ethnic group population, Philippines, 2010
Source of basic data: 2010 Census of Population and Housing, Philippine Statistics Authority.
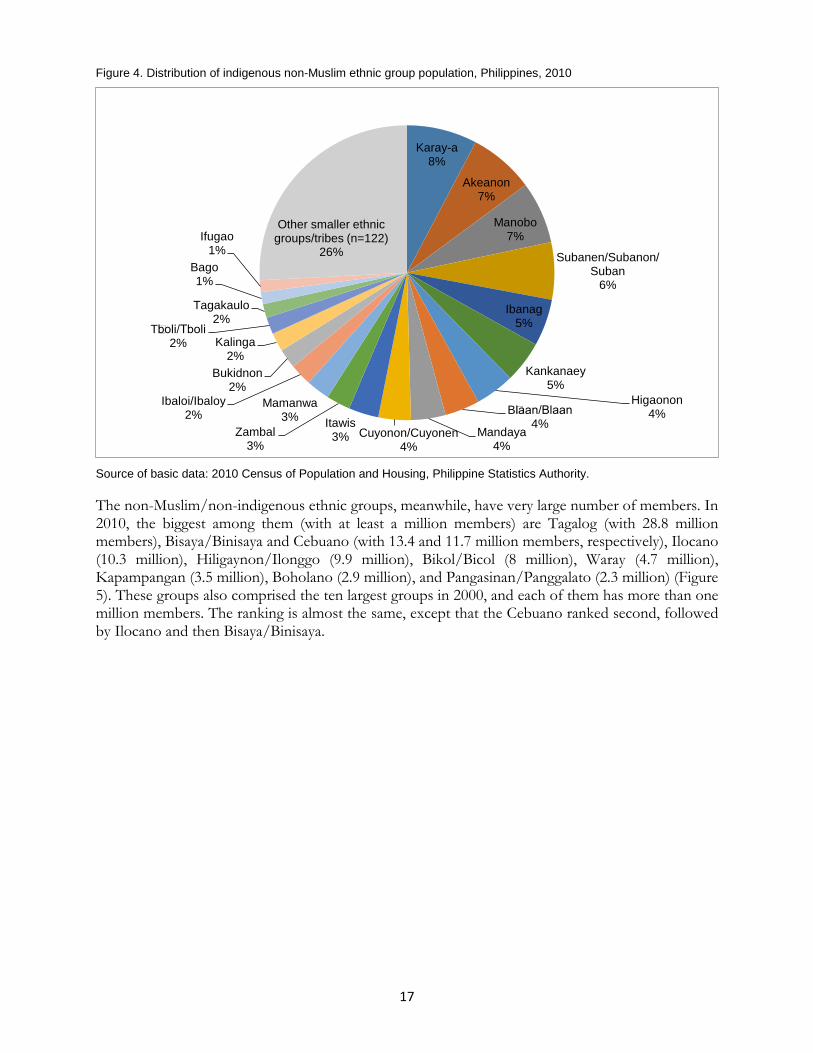
Among the non-Muslim IPs, the largest groups in 2010 are Karay-a (7.7%), Akeanon (7.1%), Manobo (6.8%), Subanen/Subanon/Suban (6.3%), and Ibanag (5.2%) (Figure 4). Three of these groups, except Subanen/Subanon/Suban and Ibanag, are also among the top five largest groups in 2000. The other large IP groups in 2000 are Hamtikanon (which is also part of the Karay-a group) and Kankanaey10. The member population of each of these groups is at least 300,000 but not more than 601,000. In 2010, about one-fourth of the total population of this major group are 122 smaller ethnic groups or tribes with only less than 100,000 members. The smallest ethnic groups with less than 500 members are as follows: Direrayaan (with only 196 members), Kailawan/Kaylawan (203 members), Kabayukan (250 members), Kaunana (278 members), Mag-indi (353 members), Magkunana (370 members), and Magbekin/Magbukon (493 members).
10 In case there are differences in spelling/name of a particular ethnic group between the 2000 CPH and the 2010 CPH, the authors adopted the latest spelling/name.
Maguindanao28%
Maranao26%
Tausug24%
Sama/Samal7%
Iranon/Iranun/Iraynon
5%
Yakan4%
Sama Bangingi2%
Kalagan1%
Kalibugan/Kolibugan
1%
Jama Mapun1% Badjao
1%
17
Figure 4. Distribution of indigenous non-Muslim ethnic group population, Philippines, 2010
Source of basic data: 2010 Census of Population and Housing, Philippine Statistics Authority.
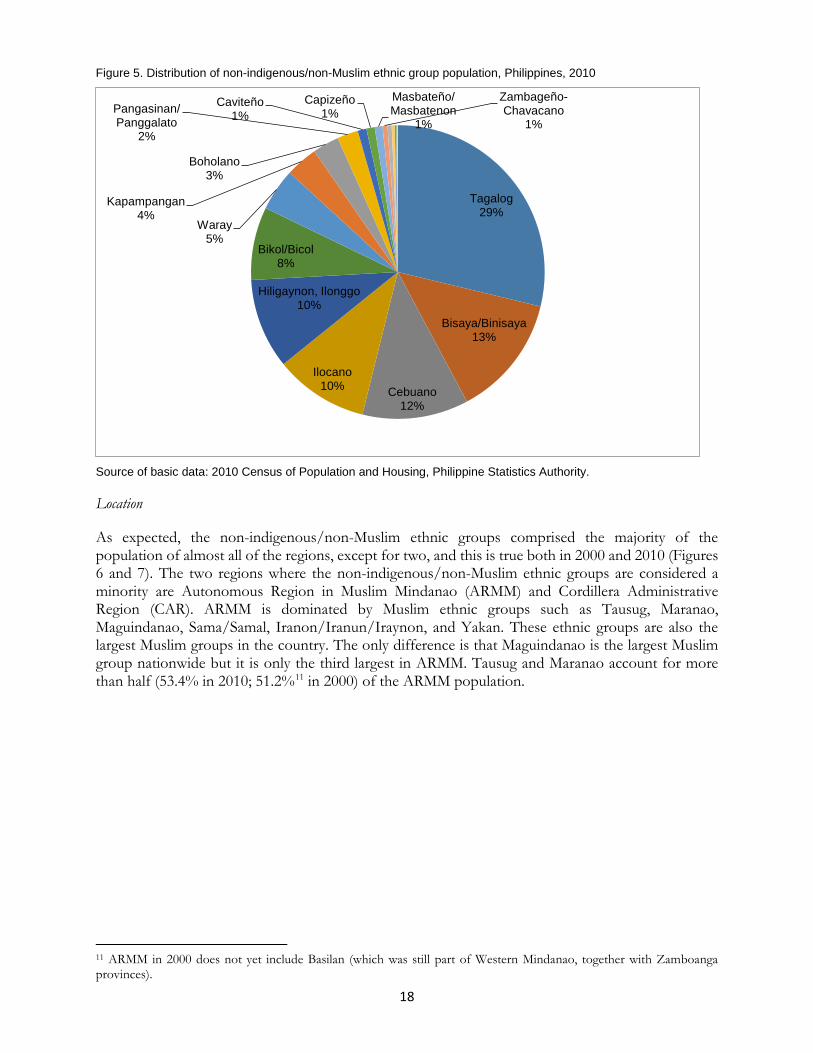
The non-Muslim/non-indigenous ethnic groups, meanwhile, have very large number of members. In 2010, the biggest among them (with at least a million members) are Tagalog (with 28.8 million members), Bisaya/Binisaya and Cebuano (with 13.4 and 11.7 million members, respectively), Ilocano (10.3 million), Hiligaynon/Ilonggo (9.9 million), Bikol/Bicol (8 million), Waray (4.7 million), Kapampangan (3.5 million), Boholano (2.9 million), and Pangasinan/Panggalato (2.3 million) (Figure 5). These groups also comprised the ten largest groups in 2000, and each of them has more than one million members. The ranking is almost the same, except that the Cebuano ranked second, followed by Ilocano and then Bisaya/Binisaya.
Karay-a8%
Akeanon7%
Manobo7%
Subanen/Subanon/Suban
6%
Ibanag5%
Kankanaey5%
Higaonon4%B�laan/Blaan
4%Mandaya
4%Cuyonon/Cuyonen
4%
Itawis3%Zambal
3%
Mamanwa3%
Ibaloi/Ibaloy2%
Bukidnon2%
Kalinga2%
T�boli/Tboli2%
Tagakaulo2%
Bago1%
Ifugao1%
Other smaller ethnic groups/tribes (n=122)
26%
18
Figure 5. Distribution of non-indigenous/non-Muslim ethnic group population, Philippines, 2010
Source of basic data: 2010 Census of Population and Housing, Philippine Statistics Authority.
Location
As expected, the non-indigenous/non-Muslim ethnic groups comprised the majority of the population of almost all of the regions, except for two, and this is true both in 2000 and 2010 (Figures 6 and 7). The two regions where the non-indigenous/non-Muslim ethnic groups are considered a minority are Autonomous Region in Muslim Mindanao (ARMM) and Cordillera Administrative Region (CAR). ARMM is dominated by Muslim ethnic groups such as Tausug, Maranao, Maguindanao, Sama/Samal, Iranon/Iranun/Iraynon, and Yakan. These ethnic groups are also the largest Muslim groups in the country. The only difference is that Maguindanao is the largest Muslim group nationwide but it is only the third largest in ARMM. Tausug and Maranao account for more than half (53.4% in 2010; 51.2%11 in 2000) of the ARMM population.
11 ARMM in 2000 does not yet include Basilan (which was still part of Western Mindanao, together with Zamboanga provinces).
Tagalog29%
Bisaya/Binisaya13%
Cebuano12%
Ilocano10%
Hiligaynon, Ilonggo10%
Bikol/Bicol8%
Waray5%
Kapampangan4%
Boholano3%
Pangasinan/Panggalato
2%
Caviteño1%
Capizeño1%
Masbateño/Masbatenon
1%
Zambageño-Chavacano
1%

19
Figure 6. Distribution of population, Philippines, by major ethnic group and by region, 2010
Source of basic data: 2010 Census of Population and Housing, Philippine Statistics Authority.
Figure 7. Distribution of population, Philippines, by major ethnic group and by region, 2000
Source of basic data: 2000 Census of Population and Housing, Philippine Statistics Authority.
CAR, on the other hand, is inhabited largely by indigenous non-Muslim ethnic groups, which accounted for around two-thirds of the total population. Less than 1 percent of the regional population made up the Muslim ethnic groups while the remaining one-third comprised the non-Muslim/non-IPs. The largest groups in the region, with at least 100,000 members, are Ilocano (which is a non-Muslim/non-IP group, accounting for 25.9% of the regional population in 2010 and 31.7% in 2000), and four IP groups, namely: Kankanaey (17.1% in 2010; 19% in 2000), Kalinga (9.4% in 2010; 9% in 2000), and Ibaloi/Ibaloy (9.1% in 2010; 8.4% in 2000).
0.0
2.0
4.0
6.0
8.0
10.0
12.0
14.0m
illion
Non-Muslim IPs Muslim Non-Muslims/Non-IPs
0.0
2.0
4.0
6.0
8.0
10.0
12.0
milli
on
Non-Muslim IPs Muslim Non-Muslim/Non-IPs

20
Although the majority of their population are non-Muslims/non-IPs, some regions are also home to some members of the Muslim and non-Muslim IP groups. Aside from ARMM, Muslim ethnic groups are also found in other Mindanao regions. In 2010, SOCCSKSARGEN (South Cotabato, Cotabato, Sultan Kudarat, Sarangani, and General Santos)12 (20.7%) and Zamboanga Peninsula (15.6%) ranked second and third, respectively, among the regions with the highest proportion of Muslims, followed by Northern Mindanao (7.5%), Davao (3.8%) and Caraga (0.5%). In 2000, Central Mindanao (26.8%) ranked second to ARMM, followed by Western Mindanao (16.5%), Southern Mindanao (3.4%), Northern Mindanao (0.7%), and Caraga (0.3%). The leading Muslim ethnic groups in these Mindanao regions are: Maguindanao in SOCCSKSARGEN (in 2010) and Central and Southern Mindanao (in 2000); Tausug in Zamboanga Peninsula (in 2010); Maranao in Northern Mindanao (in both 2010 and 2000) and Caraga (in 2000); and Kalagan in Davao (in 2000). There are also Muslims outside Mindanao but they only account for a very small percentage of the total population. For instance, around 2 percent and 0.9 percent of the total population of MIMAROPA (Mindoro [Oriental and Occidental], Marinduque, Romblon, and Palawan)13 and the National Capital Region (NCR), respectively, in 2010 belong to the Muslim ethnic groups. These percentages, however, are relatively higher compared to those in 2000, with only 0.6 percent and 0.4 percent for NCR and Southern Tagalog (both CALABARZON [Cavite, Laguna, Batangas, Rizal, and Quezon]14 and MIMAROPA), respectively. This seems to tell us that these northern regions have become a migration destination for some members of the Muslim ethnic groups.
Some regions also have considerable shares of the indigenous non-Muslim ethnic groups (>10%) to their total population. These are: Cagayan Valley (28% in 2010; 24.2% in 2000); MIMAROPA (23.7% in 2010); Western Visayas (16% in 2010; 22.1% in 2000); Zamboanga Peninsula (13.1% in 2010); Northern Mindanao (15.8% in 2010; 12.6% in 2000); Davao (18.3% in 2010) and SOCCSKSARGEN (15% in 2010), or Southern Mindanao (14.8% in 2000); and, Caraga (26% in 2010; 20.5% in 2000). The largest IP groups in these regions are as follows: Ibanag, Itawis and Ifugao in Cagayan Valley; Cuyonon/Cuyonen, Pala’wan/Palawan-o and Bantoanon in MIMAROPA; Akeanon in Western Visayas; Subanen/Subanon/Suban in Zamboanga Peninsula; Higaonon, Bukidnon and Kamiguin in Northern Mindanao; Mandaya, Manobo and B’laan/Blaan in Davao; B’laan/Blaan, T’boli/Tboli and Manobo in SOCCSKSARGEN; Manono/Ata-Manobo in Central Mindanao (in 2000); and Manobo, Mamanwa, Higaonon, and Mandaya (or Kamayo) in Caraga.
If we look at the provincial-level data, we can see that provinces are inhabited dominantly by specific ethnic groups as these are, apparently, their ancestral domains, or have been the migration destination for some. Muslim ethnic groups are distributed across Mindanao provinces, but the majority of them are located in the western part of the Mindanao island, as shown by Figure 8. In fact, half of the Muslim ethnic group population can be found in four ARMM provinces—Lanao del Sur (16.3%), Maguindanao (14.7%), Sulu (14.1%), and Tawi-Tawi (6.9%). Other provinces with at least 1 percent share of their population belonging to the Muslim ethnic group in 2010 are mostly Mindanao provinces such as Zamboanga provinces, Cotabato, Lanao del Norte, Basilan, Sultan Kudarat, Davao del Sur, South Cotabato, and Sarangani; and, interestingly, Palawan—the only province outside of Mindanao.
12 The acronym stands for the provinces enumerated inside the parenthesis. This is an administrative region in the Philippines, specifically located in south-central Mindanao. 13 The acronym stands for the provinces enumerated inside the parenthesis. This is an administrative region in the Philippines, located in southwestern part of Luzon. 14 The acronym stands for the provinces enumerated inside the bracket. This is an administrative region in the Philippines, located in southern part of Luzon.

21
Figure 8. Distribution of population, Philippines, by major ethnic group and by province, 2010
Indigenous non-Muslim Non-indigenous/non-Muslim Muslim
Source of basic data: 2010 Census of Population and Housing, Philippine Statistics Authority.
What are the largest Muslim ethnic groups in those provinces? Yakan and Tausug, which have the same culture, comprised the majority (75.6%) of the Basilan population, as Yakans15 originated from Basilan. Maranao dominated the inhabitants of Lanao del Sur (93.3% in 2010; 90.3% in 2000). Lake Lanao in northern Mindanao, which make up Lanao del Sur and Lanao del Norte in recent times, has been the traditional home provinces of Maranao (Mednick, 1975; as cited in Eder, 2010). People in Sulu are mostly Tausug (91.3% in 2010; 87.1% in 2000) as Tausug are natives of Jolo, Sulu. Maguindanao and Iranon/Iranun/Iraynon, which are strongly linked based on language and culture (Bara, 2015), comprised the majority (82.4% in 2010; 76.9% in 2000) of the Maguindanao population. Sama/Samal, on the other hand, dominated the Tawi-Tawi population in 2010 (88.2%) while this group, together with Sama Bangingi and Tausug, dominated the inhabitants of the province in 2000 (accounting for 87.3%). Maguindanao, T’boli/Tboli, B’laan/Blaan, and Maranao are among the largest Muslim ethnic groups in other Mindanao provinces. Cotabato is the ancestral land of Maguindanao. Outside Mindanao, specifically in southern Palawan, a small group of Muslims belong to the Sama/Samal and Jama Mapun groups. Jama Mapun are said to be a subgroup of Sama/Samal and, together with Tausug, originated in Mindanao but have considered southern Palawan (specifically Balabac group of islands) as their home and part of their ancestral domain (Eder, 2010).
Non-Muslim IP groups are more scattered compared to the Muslim groups. These are distributed across different areas of the country, particularly in mountainous areas in the north and lowland, forest and coastal areas in the south. In 2010, the provinces with at least 3 percent share of their population (or at least 230,000 people) belonging to the non-Muslim IP groups are as follows: Aklan (6.6%), Antique (6.4%), Benguet (6%), Palawan (5.7%), Davao del Sur (5.2%), Bukidnon (4.8%), Cagayan (4.5%), Isabela (4.3%), and Agusan del Sur (3%). Akeanon comprised the majority (90.8%) of the Aklan population while Karay-a dominated the people in Antique (80.5%). Kankanaey and 15 Basilan inhabitants, during colonial period, were named as Yakan by Spaniards (Bara, 2015).
500 – 1,000,000 1,000,000 – 2,000,000 2,000,000 – 3,000,000 3,000,000 – 4,000,000 4,000,000 – 5,000,000
1 – 200,000 200,000 – 400,000 400,000 – 600,000 600,000 – 800,000 800,000 – 900,000
200 – 100,000 100,000 – 200,000 200,000 – 300,000 300,000 – 400,000 400,000 – 600,000

22
Ibaloi/Ibaloy are the largest IP groups in Benguet, accounting for 50 percent of the provincial population, followed by Applai, Bontok, Kalanguya, Ifugao, and Kalinga. The largest IP groups in Palawan are Cuyonon/Cuyonen, Palawan/Palawan-o, Cagayanen, and Tagbanua. These groups represent 40 percent of the total population in Palawan. In Davao del Sur, non-Muslim IP groups only account for less than 20 percent of the total provincial population; the largest of which are B’laan/Blaan, Tagakaulo, Manobo, and Bagobo. In Bukidnon, Higaonon, Bukidnon, Talaandig, and Manobo make up one-fourth of the provincial population. Although Ilocano comprised the majority of the inhabitants of Cagayan and Isabela, there are a number of IPs living in these provinces. Some of the largest IP groups there (with at least 10,000 members) are Ibanag, Itawis, Yogad, Malaueg, Gaddang, Parananum, and Ifugao. Manobo is the largest group, either as IP or ethnic (in general), in Agusan del Sur.
Non-Muslim/non-IP ethnic groups, on the other hand, are scattered all over the country. The majority of them are located in Luzon, particularly in the central and southern part, as well as in central and western portions of Visayas. The provinces with at least 2 million people who are neither Muslims nor IPs are Metro Manila, Cebu, Cavite, Bulacan, Negros Occidental, Pangasinan, Laguna, Rizal, Batangas, Pampanga, and Iloilo. The majority of Metro Manila residents are Tagalog but the area has already become a favorite migration destination of many Filipinos from different parts of the country. One piece of evidence is that a third of the Metro Manila population are composed of members of the following ethnic groups: Bisayas/Binisaya, Bikol/Bicol, Ilocano, Waray, and Hiligaynon/Ilonggo. CALABARZON provinces, on the other hand, are composed mainly of Tagalog, Bulacan and Pampanga of Tagalog and Kapampangan, and Pangasinan of Pangasinan/Panggalato. Cebu people are almost 100 percent Cebuanos and Bisayas/Binisayas, while people in Negros Occidental and Iloilo are almost all Hiligaynons/Ilonggos.
Educational profile
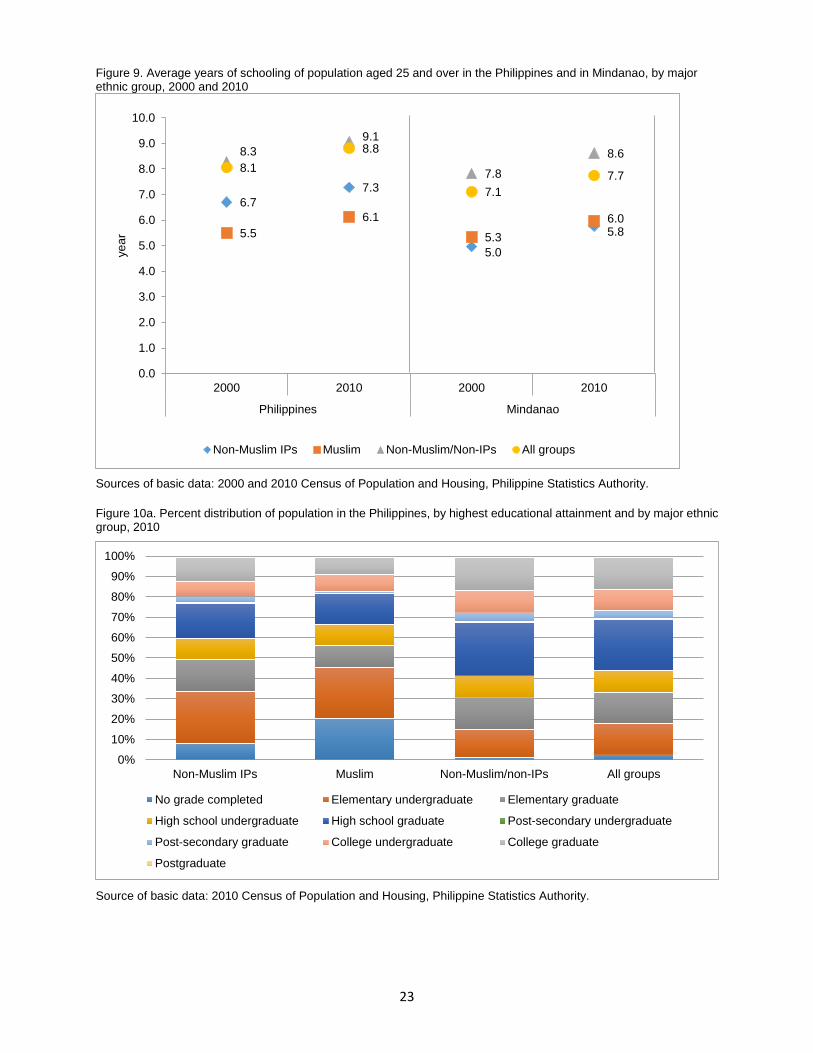
One of the most important socioeconomic attributes that this study aims to look at is the educational profile of Filipinos belonging to different ethnic groups. Figures 9-11 suggest that there had been improvements in the educational profile of Filipinos between 2000 and 2010. The average number of years of schooling of Filipinos aged 25 and over slightly increased (with an increment of less than a year) from 2000 to 2010. This is supported by the drop in the proportion of less-educated16 adults. Literacy rates of Filipinos aged 10 and over increased by 4.8 percentage points during the said period. These trends are true both for the Philippines and for Mindanao, and probably among the outcomes of the education-related programs that had been implemented by the Philippine government before 2010. One of those is the Philippine version of the conditional cash transfer program—the Pantawid Pamilyang Pilipino Program, which aimed at increasing access to basic education among the poorest of the poor households.
16 This group is composed of individuals who are at most high school undergraduates or did not even finish high school.
23
Figure 9. Average years of schooling of population aged 25 and over in the Philippines and in Mindanao, by major ethnic group, 2000 and 2010
Sources of basic data: 2000 and 2010 Census of Population and Housing, Philippine Statistics Authority.
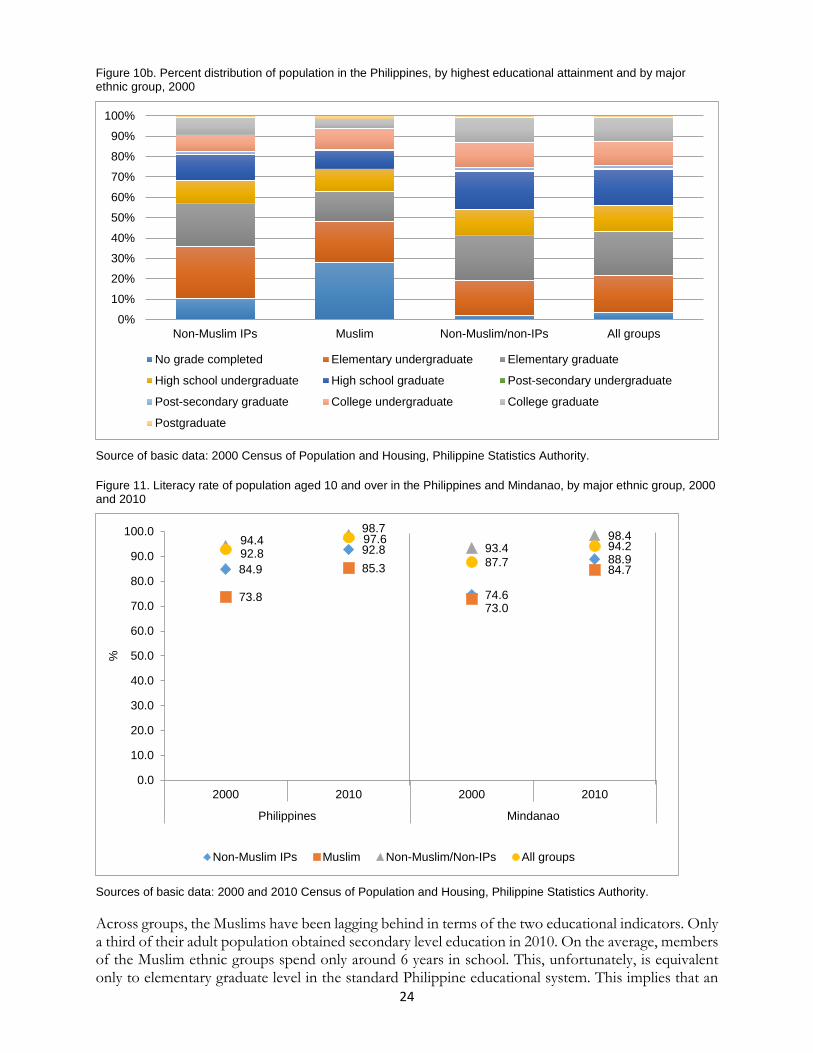
Figure 10a. Percent distribution of population in the Philippines, by highest educational attainment and by major ethnic group, 2010
Source of basic data: 2010 Census of Population and Housing, Philippine Statistics Authority.
6.77.3
5.0
5.85.56.1
5.36.0
8.39.1
7.88.6
8.18.8
7.17.7
0.0
1.0
2.0
3.0
4.0
5.0
6.0
7.0
8.0
9.0
10.0
2000 2010 2000 2010
Philippines Mindanao
year
Non-Muslim IPs Muslim Non-Muslim/Non-IPs All groups
0%10%20%30%40%50%60%70%80%90%
100%
Non-Muslim IPs Muslim Non-Muslim/non-IPs All groups
No grade completed Elementary undergraduate Elementary graduate
High school undergraduate High school graduate Post-secondary undergraduate
Post-secondary graduate College undergraduate College graduate
Postgraduate
24
Figure 10b. Percent distribution of population in the Philippines, by highest educational attainment and by major ethnic group, 2000
Source of basic data: 2000 Census of Population and Housing, Philippine Statistics Authority.
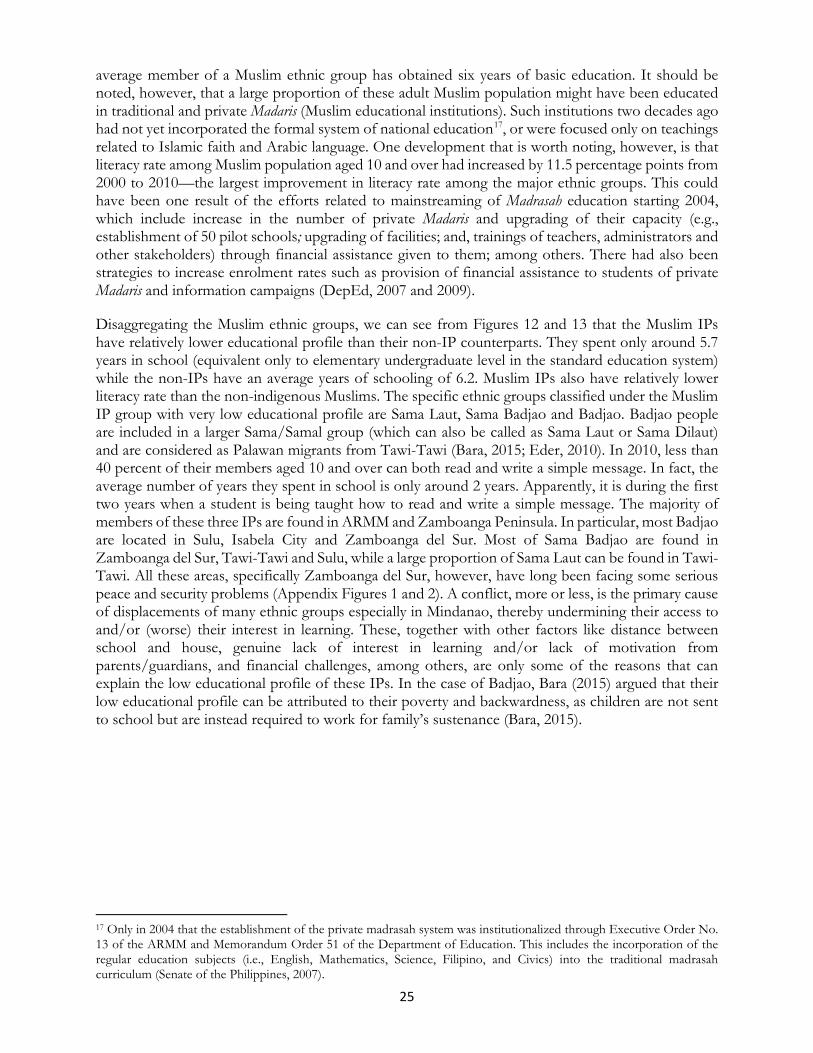
Figure 11. Literacy rate of population aged 10 and over in the Philippines and Mindanao, by major ethnic group, 2000 and 2010
Sources of basic data: 2000 and 2010 Census of Population and Housing, Philippine Statistics Authority.
Across groups, the Muslims have been lagging behind in terms of the two educational indicators. Only a third of their adult population obtained secondary level education in 2010. On the average, members of the Muslim ethnic groups spend only around 6 years in school. This, unfortunately, is equivalent only to elementary graduate level in the standard Philippine educational system. This implies that an
0%10%20%30%40%50%60%70%80%90%
100%
Non-Muslim IPs Muslim Non-Muslim/non-IPs All groups
No grade completed Elementary undergraduate Elementary graduate
High school undergraduate High school graduate Post-secondary undergraduate
Post-secondary graduate College undergraduate College graduate
Postgraduate
84.992.8
74.6
88.9
73.8
85.3
73.0
84.7
94.498.7
93.498.4
92.897.6
87.794.2
0.0
10.0
20.0
30.0
40.0
50.0
60.0
70.0
80.0
90.0
100.0
2000 2010 2000 2010
Philippines Mindanao
%
Non-Muslim IPs Muslim Non-Muslim/Non-IPs All groups
25
average member of a Muslim ethnic group has obtained six years of basic education. It should be noted, however, that a large proportion of these adult Muslim population might have been educated in traditional and private Madaris (Muslim educational institutions). Such institutions two decades ago had not yet incorporated the formal system of national education17, or were focused only on teachings related to Islamic faith and Arabic language. One development that is worth noting, however, is that literacy rate among Muslim population aged 10 and over had increased by 11.5 percentage points from 2000 to 2010—the largest improvement in literacy rate among the major ethnic groups. This could have been one result of the efforts related to mainstreaming of Madrasah education starting 2004, which include increase in the number of private Madaris and upgrading of their capacity (e.g., establishment of 50 pilot schools; upgrading of facilities; and, trainings of teachers, administrators and other stakeholders) through financial assistance given to them; among others. There had also been strategies to increase enrolment rates such as provision of financial assistance to students of private Madaris and information campaigns (DepEd, 2007 and 2009).
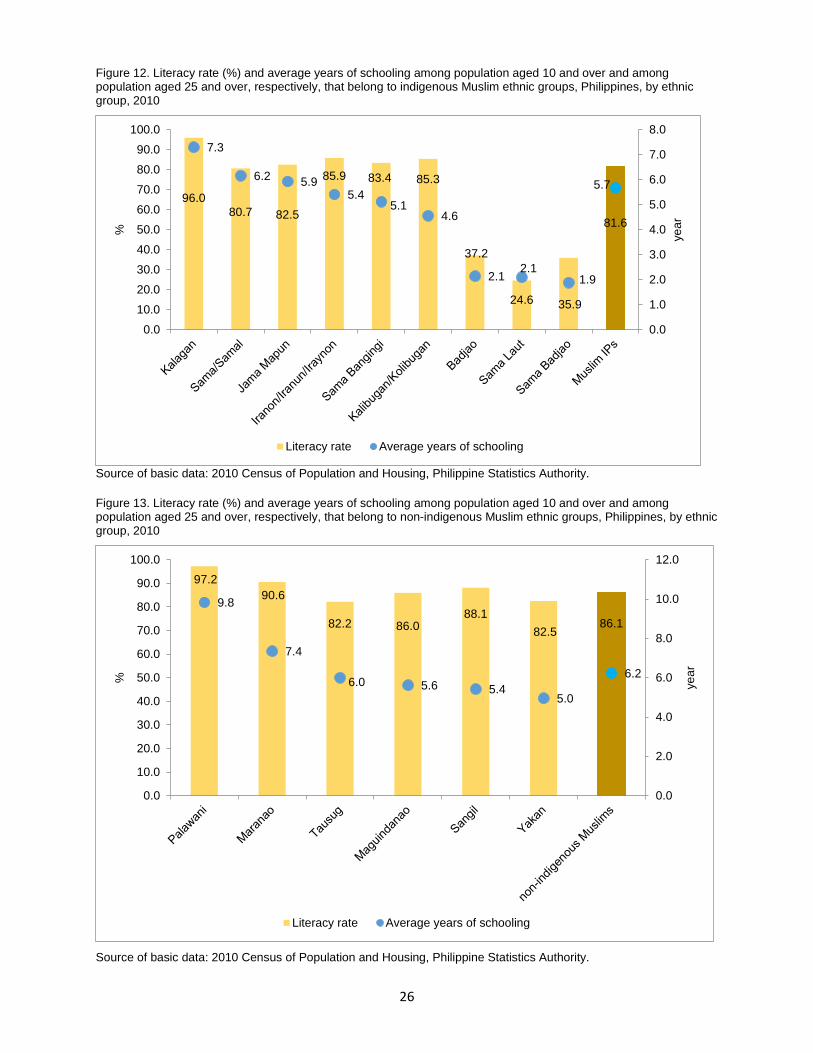
Disaggregating the Muslim ethnic groups, we can see from Figures 12 and 13 that the Muslim IPs have relatively lower educational profile than their non-IP counterparts. They spent only around 5.7 years in school (equivalent only to elementary undergraduate level in the standard education system) while the non-IPs have an average years of schooling of 6.2. Muslim IPs also have relatively lower literacy rate than the non-indigenous Muslims. The specific ethnic groups classified under the Muslim IP group with very low educational profile are Sama Laut, Sama Badjao and Badjao. Badjao people are included in a larger Sama/Samal group (which can also be called as Sama Laut or Sama Dilaut) and are considered as Palawan migrants from Tawi-Tawi (Bara, 2015; Eder, 2010). In 2010, less than 40 percent of their members aged 10 and over can both read and write a simple message. In fact, the average number of years they spent in school is only around 2 years. Apparently, it is during the first two years when a student is being taught how to read and write a simple message. The majority of members of these three IPs are found in ARMM and Zamboanga Peninsula. In particular, most Badjao are located in Sulu, Isabela City and Zamboanga del Sur. Most of Sama Badjao are found in Zamboanga del Sur, Tawi-Tawi and Sulu, while a large proportion of Sama Laut can be found in Tawi-Tawi. All these areas, specifically Zamboanga del Sur, however, have long been facing some serious peace and security problems (Appendix Figures 1 and 2). A conflict, more or less, is the primary cause of displacements of many ethnic groups especially in Mindanao, thereby undermining their access to and/or (worse) their interest in learning. These, together with other factors like distance between school and house, genuine lack of interest in learning and/or lack of motivation from parents/guardians, and financial challenges, among others, are only some of the reasons that can explain the low educational profile of these IPs. In the case of Badjao, Bara (2015) argued that their low educational profile can be attributed to their poverty and backwardness, as children are not sent to school but are instead required to work for family’s sustenance (Bara, 2015).
17 Only in 2004 that the establishment of the private madrasah system was institutionalized through Executive Order No. 13 of the ARMM and Memorandum Order 51 of the Department of Education. This includes the incorporation of the regular education subjects (i.e., English, Mathematics, Science, Filipino, and Civics) into the traditional madrasah curriculum (Senate of the Philippines, 2007).
26
Figure 12. Literacy rate (%) and average years of schooling among population aged 10 and over and among population aged 25 and over, respectively, that belong to indigenous Muslim ethnic groups, Philippines, by ethnic group, 2010
Source of basic data: 2010 Census of Population and Housing, Philippine Statistics Authority.
Figure 13. Literacy rate (%) and average years of schooling among population aged 10 and over and among population aged 25 and over, respectively, that belong to non-indigenous Muslim ethnic groups, Philippines, by ethnic group, 2010
Source of basic data: 2010 Census of Population and Housing, Philippine Statistics Authority.
96.080.7 82.5
85.9 83.4 85.3
37.2
24.6 35.9
81.6
7.3
6.2 5.95.4
5.14.6
2.1 2.11.9
5.7
0.0
1.0
2.0
3.0
4.0
5.0
6.0
7.0
8.0
0.010.020.030.040.050.060.070.080.090.0
100.0
year%
Literacy rate Average years of schooling
97.290.6
82.2 86.088.1
82.586.1
9.8
7.4
6.0 5.6 5.45.0
6.2
0.0
2.0
4.0
6.0
8.0
10.0
12.0
0.0
10.0
20.0
30.0
40.0
50.0
60.0
70.0
80.0
90.0
100.0
year%
Literacy rate Average years of schooling

27
Kalagan, Sama/Samal, Jama Mapun, and Iranon/Iranun/Iraynon, on the other hand, are few of the Muslim IP groups that have better educational profile both in terms of literacy rate and educational attainment. A large proportion of the members of these four groups is literate and has higher educational attainment than those from other groups. An average Kalagan member has finished at least one year of secondary education while an average Sama/Samal member has finished primary education. An average member of a Jama Mapun or an Iranon/Iranun/Iraynon group has almost finished elementary as the group has an average years of schooling of more than 5 years. Kalagan are Davao dwellers, Sama/Samal are in Zamboanga del Sur, Jama Mapun are in Tawi-Tawi and Palawan, while Iranon/Iranun/Iraynon are mostly found in Maguindanao. Essentially, Davao del Sur, Zamboanga del Sur and Palawan are among those provinces with high number of schools, particularly secondary and higher educational institutions (Appendix Figures 1 and 3-5). Many members of the Iranon/Iranun/Iraynon group are said to be highly educated. One of the possible reasons for this is that their professional members (some of whom are government leaders and business owners) aimed at educating their members by running Islamic institutions like mosques and Madaris (Bara, 2015). Sama/Samal people have better educational profile, compared to other Sama sub-groups, primarily because they have higher access to educational institutions since their area of residence has a public school in almost every barangay and has colleges/universities.
In contrast to the Muslim IP groups, literacy rates of members of non-indigenous Muslim ethnic groups are generally high (at least 82%). Palawani and Maranao have higher educational attainment (equivalent to high school graduate and high school undergraduate, respectively) than the rest of the groups. The other groups (specifically Yakan, which has the lowest average years of schooling but with high literacy rate), however, still have better educational profile compared to half of the Muslim IPs. The findings can be largely explained by the availability as well as magnitude of schools within the places of residence of these ethnic groups. Essentially, NCR and Palawan (where most Palawani are located) and Lanao del Sur (the ancestral land of Maranao) have very high number of schools, from primary to tertiary level. In contrast, Basilan, which is home for Yakan, has far less number of schools, particularly secondary and higher-level institutions.
Indigenous non-Muslim ethnic groups have better educational profile than Muslim ethnic groups in general, or when we look at the national figures, but this is not completely true when we limit our samples to only those in Mindanao. Literacy rate among non-Muslim IPs aged 10 and over in 2010 is 92.8 percent, which is higher by around 8 percentage points compared to the 2000 figure and is higher than the literacy rate among Muslims of the same age group. In 2010, out of the 143 non-Muslim IP groups in the country, only three have literacy rate below 50 percent, 87 percent have literacy rate greater than or equal to 75 percent, and one has 100 percent literacy rate in 2010 (Appendix Table 1). The IP group with 100 percent literacy rate is Kailawan/Kaylawan. Other groups with very high literacy rate (99%) include Remontado, Batangan, Eskaya, Agutaynen, Cagayanen, Isoroken, Kamiguin, Isinai, Pan-ayanon, Yogad, Ivatan, and Zambal, among others. On the other hand, the groups with very low literacy rate (<50%) are Langilan (18.3%), Agta-Agay (32.9%) and Mag-anti/Mag-Antsi/Mag-anchi (48.6%).
Non-Muslim IPs also have higher average years of schooling (equivalent to high school undergraduate level) than the Muslim ethnic groups, with only 6 years of schooling (equivalent only to elementary graduate level). Sixty percent of them have average years of schooling equivalent to at least elementary graduate and six groups have average years of schooling equivalent to about high school graduate. The groups whose members are highly educated (with average years of schooling of 10 years, equivalent to high school graduate) include Batangan, Ivatan, Isinai, Illaud, Isoroken, and Belwang. The presence of educational institutions within the community is an important factor in enhancing the educational profile of the population. This is true for the case of Ivatan—the natives of Batanes island. Although Batanes has the lowest number of elementary and secondary schools in 2009, those schools are enough
28
for the small population of the province; enough to maintain a good educational profile (high literacy rate) of the people, including the IPs (Appendix Figures 1 and 6). Moreover, aside from having the lowest literacy rate among the groups, Langilan also take the lead when it comes to very low educational attainment. An average Langilan member has spent only 1.1 years in school. Langilan people, which were once part of the Ata-Manobo tribe, have preserved their tribal traditions and are believed to be living in a backward society (Joshua Project, 2016). Such backwardness might have been the reason for their lower educational profile. Manobo-Dulangan, Mag-anti/Mag-Antsi/Mag-anchi, Alangan, and Buhid are the other few IP groups whose members attended school only for at most two years. The nomadic way of life of Mag-anti/Mag-Antsi/Mag-anchi, an Aeta group from Tarlac, might have contributed to their low educational profile.
These patterns slightly change when we limit our samples to only those in Mindanao. Muslims in Mindanao have relatively lower literacy rate than non-Muslim IPs but they have slightly higher average years of schooling. In particular, in 2010, non-indigenous Muslim ethnic groups have relatively higher years of schooling (6.1 years) than indigenous non-Muslim ethnic groups (5.8). While this is true, indigenous Muslim ethnic groups remained to be at a disadvantaged as their average years of schooling in 5.6 years only.
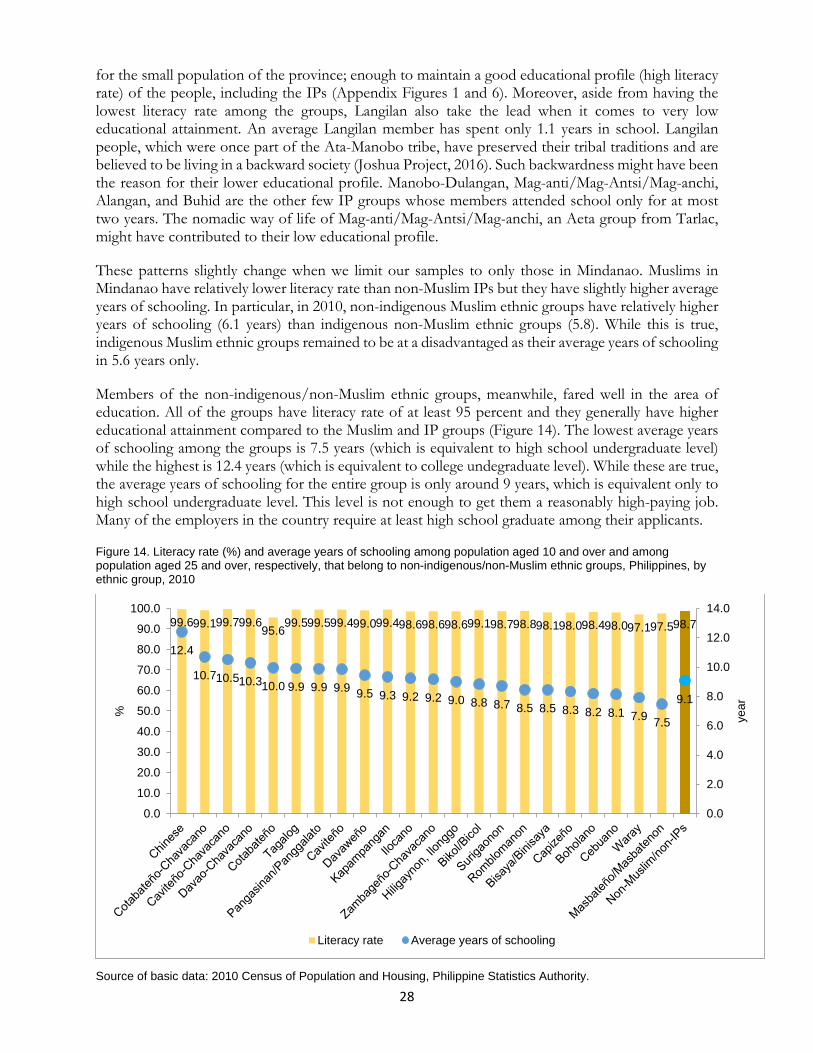
Members of the non-indigenous/non-Muslim ethnic groups, meanwhile, fared well in the area of education. All of the groups have literacy rate of at least 95 percent and they generally have higher educational attainment compared to the Muslim and IP groups (Figure 14). The lowest average years of schooling among the groups is 7.5 years (which is equivalent to high school undergraduate level) while the highest is 12.4 years (which is equivalent to college undegraduate level). While these are true, the average years of schooling for the entire group is only around 9 years, which is equivalent only to high school undergraduate level. This level is not enough to get them a reasonably high-paying job. Many of the employers in the country require at least high school graduate among their applicants.
Figure 14. Literacy rate (%) and average years of schooling among population aged 10 and over and among population aged 25 and over, respectively, that belong to non-indigenous/non-Muslim ethnic groups, Philippines, by ethnic group, 2010
Source of basic data: 2010 Census of Population and Housing, Philippine Statistics Authority.
99.699.199.799.695.699.599.599.499.099.498.698.698.699.198.798.898.198.098.498.097.197.598.7
12.4
10.710.510.310.0 9.9 9.9 9.9 9.5 9.3 9.2 9.2 9.0 8.8 8.7 8.5 8.5 8.3 8.2 8.1 7.9 7.5
9.1
0.0
2.0
4.0
6.0
8.0
10.0
12.0
14.0
0.0
10.0
20.0
30.0
40.0
50.0
60.0
70.0
80.0
90.0
100.0
year%
Literacy rate Average years of schooling
29
When we look at the specific ethnic groups, we can see that Filipino Chinese take the lead in terms of educational attainment. This group seems to value education so much so they motivate their members to obtain higher education. Cotabateño/Chavacano, Caviteño-Chavacano and Davao-Chavacano are some of the groups with remarkable educational profile. The majority of these ethnic groups are located in Mega Manila (NCR and neighboring provinces from CALABARZON and Central Luzon), where most of the leading secondary and higher-educational institutions are concentrated. Masbateño/Masbatenon and Waray, although they have very high literacy rate, have the lowest average years of schooling (less than 8 years) among the non-indigenous/non-Muslim ethnic groups. Apparently, Masbate, Leyte provinces as well as Samar provinces have lower ratio of secondary schools to barangays and a few higher-educational institutions.
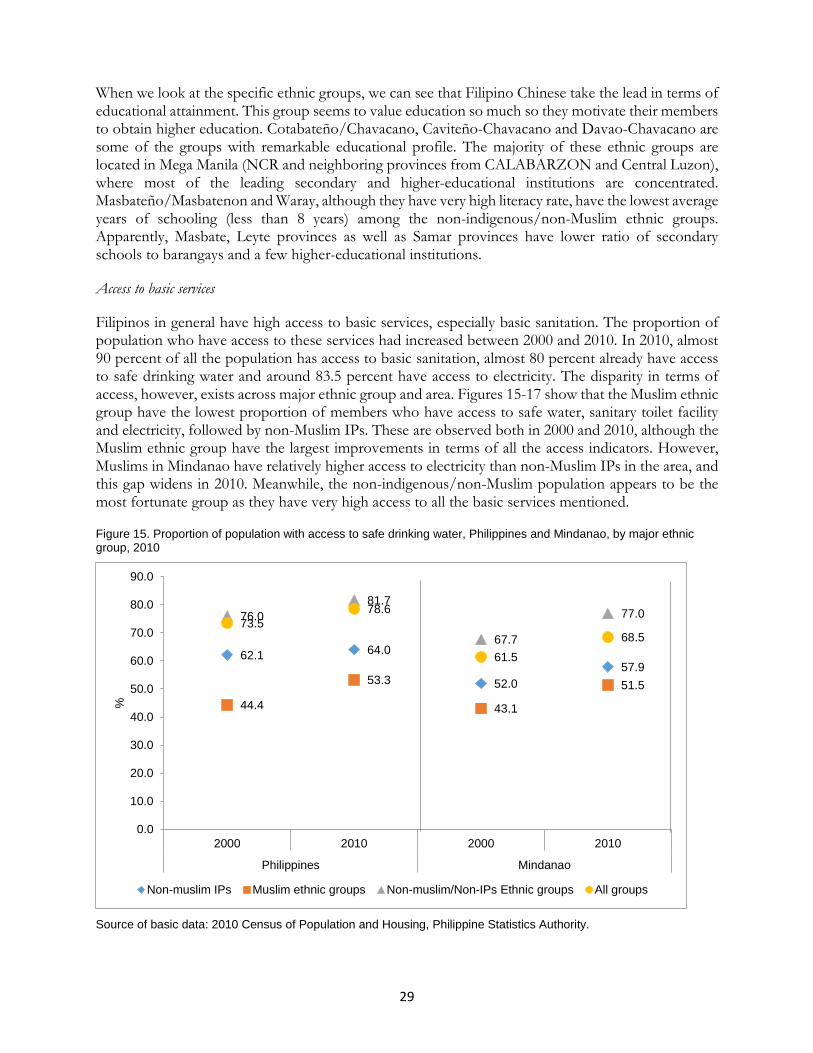
Access to basic services
Filipinos in general have high access to basic services, especially basic sanitation. The proportion of population who have access to these services had increased between 2000 and 2010. In 2010, almost 90 percent of all the population has access to basic sanitation, almost 80 percent already have access to safe drinking water and around 83.5 percent have access to electricity. The disparity in terms of access, however, exists across major ethnic group and area. Figures 15-17 show that the Muslim ethnic group have the lowest proportion of members who have access to safe water, sanitary toilet facility and electricity, followed by non-Muslim IPs. These are observed both in 2000 and 2010, although the Muslim ethnic group have the largest improvements in terms of all the access indicators. However, Muslims in Mindanao have relatively higher access to electricity than non-Muslim IPs in the area, and this gap widens in 2010. Meanwhile, the non-indigenous/non-Muslim population appears to be the most fortunate group as they have very high access to all the basic services mentioned.
Figure 15. Proportion of population with access to safe drinking water, Philippines and Mindanao, by major ethnic group, 2010
Source of basic data: 2010 Census of Population and Housing, Philippine Statistics Authority.
62.1 64.0
52.057.9
44.4
53.3
43.1
51.5
76.081.7
67.7
77.073.5
78.6
61.568.5
0.0
10.0
20.0
30.0
40.0
50.0
60.0
70.0
80.0
90.0
2000 2010 2000 2010
Philippines Mindanao
%
Non-muslim IPs Muslim ethnic groups Non-muslim/Non-IPs Ethnic groups All groups

30
Figure 16. Proportion of population with access to sanitary toilet facility, Philippines and Mindanao, by major ethnic group, 2010
Source of basic data: 2010 Census of Population and Housing, Philippine Statistics Authority.
Figure 17. Proportion of population with access to electricity, Philippines and Mindanao, by major ethnic group, 2010
Source of basic data: 2010 Census of Population and Housing, Philippine Statistics Authority.
If we disaggregate further the Muslim ethnic groups, we can observe that the indigenous groups have lower access to basic services than the non-indigenous ones (Figures 18-19). Roughly half of indigenous Muslim groups have access to these services. The highest of which is access to basic sanitation, with 53.6 percent, while the lowest is access to safe water, with only 43.6 percent. Sama Laut appears to be the worst-off group; with only below 30 percent of their members having access to each of the aforementioned services. This may mean that a large proportion of Sama Laut people do not have access to all these basic services. This finding is not surprising because Tawi-Tawi, where
74.880.3
68.273.8
51.4
63.7
50.3
62.3
83.890.9
80.9
91.6
81.688.5
73.982.5
0.0
10.0
20.0
30.0
40.0
50.0
60.0
70.0
80.0
90.0
100.0
2000 2010 2000 2010
Philippines Mindanao
%
Non-muslim IPs Muslim ethnic groups Non-muslim/Non-IPs Ethnic groups All groups
51.3
63.5
36.7
47.040.8
61.5
39.5
60.2
72.6
86.9
56.8
79.9
69.5
83.5
51.3
70.7
0.0
10.0
20.0
30.0
40.0
50.0
60.0
70.0
80.0
90.0
100.0
2000 2010 2000 2010
Philippines Mindanao
%
Non-muslim IPs Muslim ethnic groups Non-muslim/Non-IPs Ethnic groups All groups

31
most of Sama Laut live, has low access to safe water and sanitary toilet facility (Appendix Figures 1, 7 and 8). In addition, less than half of the members of Sama/Samal, Sama Bangingi and Kalibugan/Kolibugan groups have access to each of those services. Jama Mapun has lower access to safe water and sanitary toilet but has higher access to electricity. This can be explained by the fact that many of the areas in Palawan (where most of Jama Mapun people reside) have stable electricity, which is important for the then flourishing tourism industry of the province (Appendix Figures 1 and 9). It can also be attributed to the project of the Arroyo Administration and the KEPCO Philippines Corporation in 2005, which provided electricity to 35 far-flung areas in the province of Palawan (Palawan Board, 2016). In contrast, Badjao and Sama Badjao have low access to sanitary toilet facility and electricity but with higher access to safe water. Apparently, Sulu has very low access to basic sanitation during that time. Meanwhile, Kalagan is the only indigenous Muslim ethnic group with high access to safe water, basic sanitation and electricity. This finding reflects the fact that Kalagan’s homeland, Davao, performs very well in terms of the said access indicators.
Figure 18. Proportion of population belonging to the indigenous Muslim ethnic groups with access to safe water, sanitary toilet facility and electricity, Philippines, by ethnic group, 2010
Source of basic data: 2010 Census of Population and Housing, Philippine Statistics Authority.
43.6
53.651.7
0.0
10.0
20.0
30.0
40.0
50.0
60.0
70.0
80.0
90.0
%
Safe water Sanitary toilet Electricity
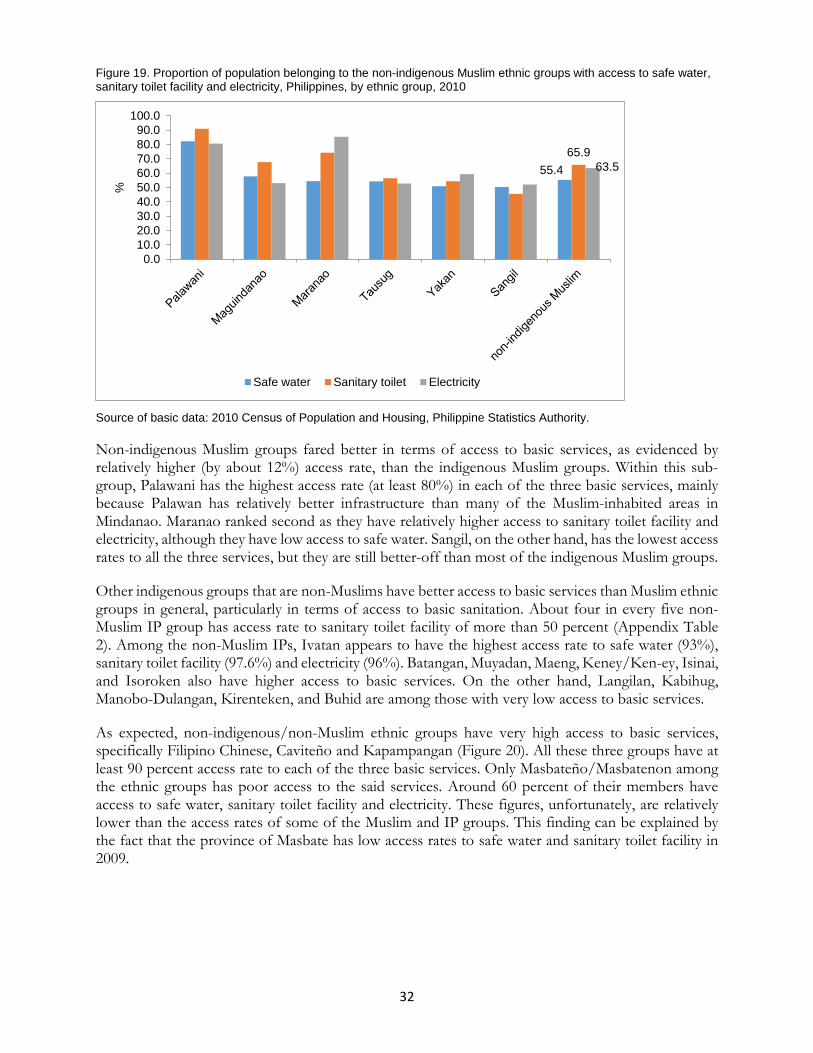
32
Figure 19. Proportion of population belonging to the non-indigenous Muslim ethnic groups with access to safe water, sanitary toilet facility and electricity, Philippines, by ethnic group, 2010
Source of basic data: 2010 Census of Population and Housing, Philippine Statistics Authority.
Non-indigenous Muslim groups fared better in terms of access to basic services, as evidenced by relatively higher (by about 12%) access rate, than the indigenous Muslim groups. Within this sub-group, Palawani has the highest access rate (at least 80%) in each of the three basic services, mainly because Palawan has relatively better infrastructure than many of the Muslim-inhabited areas in Mindanao. Maranao ranked second as they have relatively higher access to sanitary toilet facility and electricity, although they have low access to safe water. Sangil, on the other hand, has the lowest access rates to all the three services, but they are still better-off than most of the indigenous Muslim groups.
Other indigenous groups that are non-Muslims have better access to basic services than Muslim ethnic groups in general, particularly in terms of access to basic sanitation. About four in every five non-Muslim IP group has access rate to sanitary toilet facility of more than 50 percent (Appendix Table 2). Among the non-Muslim IPs, Ivatan appears to have the highest access rate to safe water (93%), sanitary toilet facility (97.6%) and electricity (96%). Batangan, Muyadan, Maeng, Keney/Ken-ey, Isinai, and Isoroken also have higher access to basic services. On the other hand, Langilan, Kabihug, Manobo-Dulangan, Kirenteken, and Buhid are among those with very low access to basic services.
As expected, non-indigenous/non-Muslim ethnic groups have very high access to basic services, specifically Filipino Chinese, Caviteño and Kapampangan (Figure 20). All these three groups have at least 90 percent access rate to each of the three basic services. Only Masbateño/Masbatenon among the ethnic groups has poor access to the said services. Around 60 percent of their members have access to safe water, sanitary toilet facility and electricity. These figures, unfortunately, are relatively lower than the access rates of some of the Muslim and IP groups. This finding can be explained by the fact that the province of Masbate has low access rates to safe water and sanitary toilet facility in 2009.
55.465.9
63.5
0.010.020.030.040.050.060.070.080.090.0
100.0%
Safe water Sanitary toilet Electricity
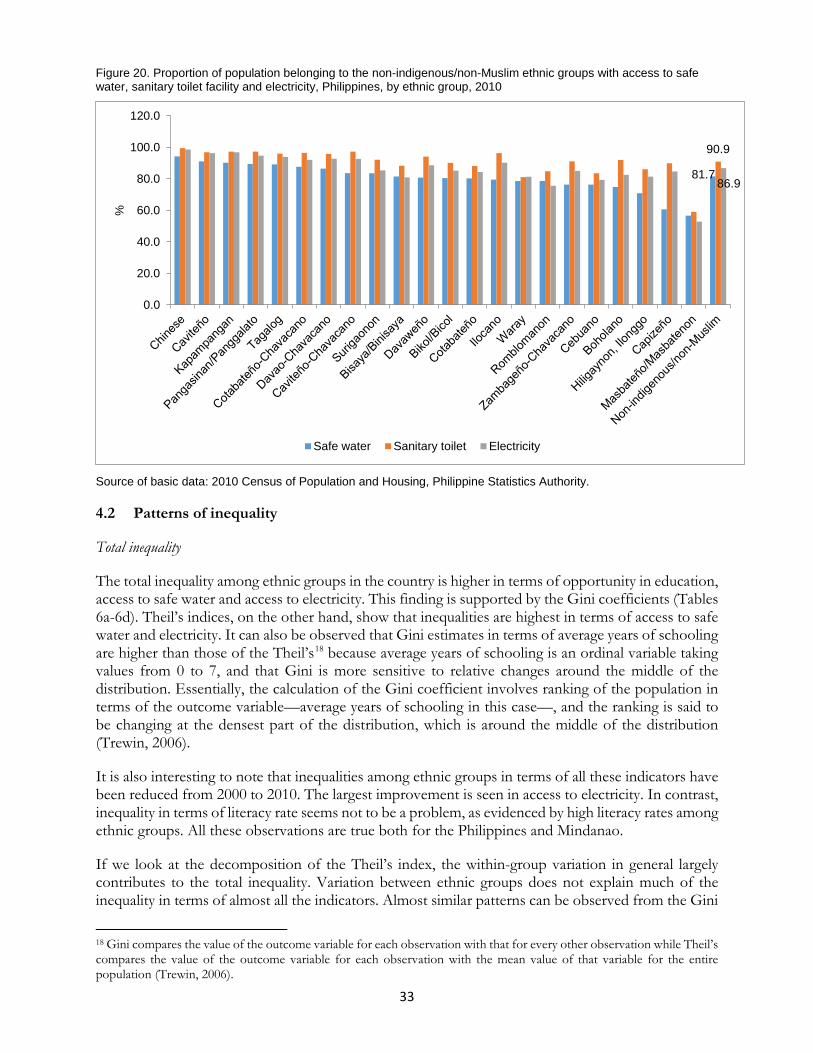
33
Figure 20. Proportion of population belonging to the non-indigenous/non-Muslim ethnic groups with access to safe water, sanitary toilet facility and electricity, Philippines, by ethnic group, 2010
Source of basic data: 2010 Census of Population and Housing, Philippine Statistics Authority.
4.2 Patterns of inequality
Total inequality
The total inequality among ethnic groups in the country is higher in terms of opportunity in education, access to safe water and access to electricity. This finding is supported by the Gini coefficients (Tables 6a-6d). Theil’s indices, on the other hand, show that inequalities are highest in terms of access to safe water and electricity. It can also be observed that Gini estimates in terms of average years of schooling are higher than those of the Theil’s18 because average years of schooling is an ordinal variable taking values from 0 to 7, and that Gini is more sensitive to relative changes around the middle of the distribution. Essentially, the calculation of the Gini coefficient involves ranking of the population in terms of the outcome variable—average years of schooling in this case—, and the ranking is said to be changing at the densest part of the distribution, which is around the middle of the distribution (Trewin, 2006).
It is also interesting to note that inequalities among ethnic groups in terms of all these indicators have been reduced from 2000 to 2010. The largest improvement is seen in access to electricity. In contrast, inequality in terms of literacy rate seems not to be a problem, as evidenced by high literacy rates among ethnic groups. All these observations are true both for the Philippines and Mindanao.
If we look at the decomposition of the Theil’s index, the within-group variation in general largely contributes to the total inequality. Variation between ethnic groups does not explain much of the inequality in terms of almost all the indicators. Almost similar patterns can be observed from the Gini
18 Gini compares the value of the outcome variable for each observation with that for every other observation while Theil’s compares the value of the outcome variable for each observation with the mean value of that variable for the entire population (Trewin, 2006).
81.7
90.9
86.9
0.0
20.0
40.0
60.0
80.0
100.0
120.0%
Safe water Sanitary toilet Electricity
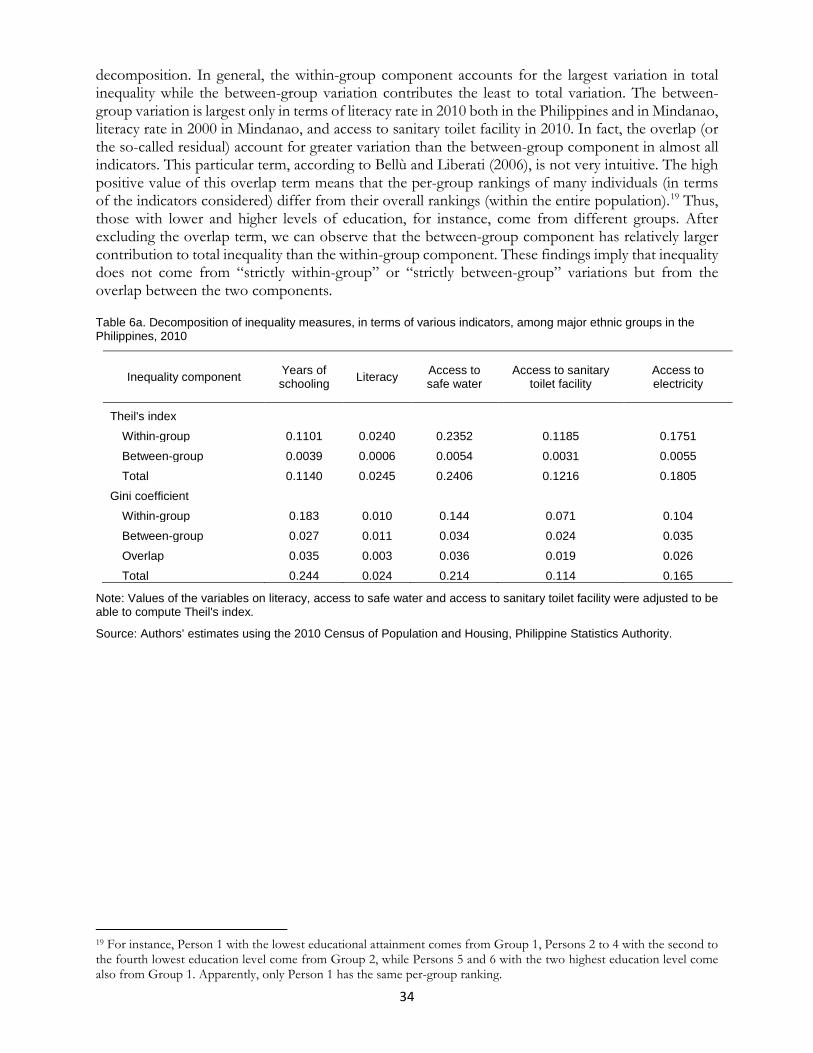
34
decomposition. In general, the within-group component accounts for the largest variation in total inequality while the between-group variation contributes the least to total variation. The between-group variation is largest only in terms of literacy rate in 2010 both in the Philippines and in Mindanao, literacy rate in 2000 in Mindanao, and access to sanitary toilet facility in 2010. In fact, the overlap (or the so-called residual) account for greater variation than the between-group component in almost all indicators. This particular term, according to Bellù and Liberati (2006), is not very intuitive. The high positive value of this overlap term means that the per-group rankings of many individuals (in terms of the indicators considered) differ from their overall rankings (within the entire population).19 Thus, those with lower and higher levels of education, for instance, come from different groups. After excluding the overlap term, we can observe that the between-group component has relatively larger contribution to total inequality than the within-group component. These findings imply that inequality does not come from “strictly within-group” or “strictly between-group” variations but from the overlap between the two components.
Table 6a. Decomposition of inequality measures, in terms of various indicators, among major ethnic groups in the Philippines, 2010
Inequality component Years of schooling Literacy Access to
safe water Access to sanitary
toilet facility Access to electricity
Theil's index
Within-group 0.1101 0.0240 0.2352 0.1185 0.1751 Between-group 0.0039 0.0006 0.0054 0.0031 0.0055 Total 0.1140 0.0245 0.2406 0.1216 0.1805
Gini coefficient Within-group 0.183 0.010 0.144 0.071 0.104 Between-group 0.027 0.011 0.034 0.024 0.035 Overlap 0.035 0.003 0.036 0.019 0.026 Total 0.244 0.024 0.214 0.114 0.165
Note: Values of the variables on literacy, access to safe water and access to sanitary toilet facility were adjusted to be able to compute Theil's index.
Source: Authors’ estimates using the 2010 Census of Population and Housing, Philippine Statistics Authority.
19 For instance, Person 1 with the lowest educational attainment comes from Group 1, Persons 2 to 4 with the second to the fourth lowest education level come from Group 2, while Persons 5 and 6 with the two highest education level come also from Group 1. Apparently, only Person 1 has the same per-group ranking.

35
Table 6b. Decomposition of inequality measures, in terms of various indicators, among major ethnic groups in the Philippines, 2000
Inequality component Years of schooling Literacy Access to
safe water Access to sanitary
toilet facility Access to electricity
Theil's index
Within-group 0.1346 0.0731 0.3013 0.1978 0.3528 Between-group 0.0036 0.0014 0.0055 0.0040 0.0082 Total 0.1382 0.0745 0.3067 0.2018 0.3610
Gini coefficient Within-group 0.210 0.045 0.191 0.129 0.221 Between-group 0.025 0.016 0.031 0.024 0.040 Overlap 0.039 0.011 0.042 0.030 0.043 Total 0.275 0.072 0.264 0.183 0.303
Note: Values of the variables on literacy, access to safe water and access to sanitary toilet facility were adjusted to be able to compute Theil's index.
Source: Authors’ estimates using the 2000 Census of Population and Housing, Philippine Statistics Authority.
Table 6c. Decomposition of inequality measures, in terms of various indicators, among major ethnic groups in Mindanao, 2010
Inequality component Years of schooling Literacy Access to
safe water Access to sanitary
toilet facility Access to electricity
Theil's index
Within-group 0.1667 0.0576 0.3637 0.1806 0.3294 Between-group 0.0142 0.0020 0.0140 0.0117 0.0173 Total 0.1808 0.0595 0.3777 0.1923 0.3466
Gini coefficient Within-group 0.146 0.015 0.129 0.056 0.115 Between-group 0.076 0.030 0.080 0.073 0.088 Overlap 0.085 0.012 0.105 0.045 0.089 Total 0.307 0.057 0.313 0.174 0.292
Note: Values of the variables on literacy, access to safe water and access to sanitary toilet facility were adjusted to be able to compute Theil's index.
Source: Authors’ estimates using the 2010 Census of Population and Housing, Philippine Statistics Authority.

36
Table 6d. Decomposition of inequality measures, in terms of various indicators, among major ethnic groups in Mindanao, 2000
Inequality component Years of schooling Literacy Access to
safe water Access to sanitary
toilet facility Access to electricity
Theil's index
Within-group 0.1892 0.1253 0.4690 0.2854 0.6462 Between-group 0.0146 0.0054 0.0136 0.0135 0.0139 Total 0.2037 0.1306 0.4826 0.2989 0.6601
Gini coefficient Within-group 0.174 0.045 0.192 0.116 0.254 Between-group 0.074 0.046 0.074 0.071 0.075 Overlap 0.081 0.031 0.117 0.071 0.154 Total 0.329 0.123 0.383 0.259 0.484
Note: Values of the variables on literacy, access to safe water and access to sanitary toilet facility were adjusted to be able to compute Theil's index.
Source: Authors’ estimates using the 2000 Census of Population and Housing, Philippine Statistics Authority.
Vertical (within-group) inequality
It is also interesting to examine the patterns of inequality among ethnic groups in terms of the outcome variables considered in this study. Both the Gini and Theil’s sub-group indices in Tables 7a and 7b suggest that within-group inequality (or inequality among the sub-groups within each of the major ethnic groups) measures have been reduced from 2000 to 2010. This is true both for the Philippines and Mindanao. This implies that there had been improvements in the provision of the basic services in general. The efforts of different administrations in terms of implementation of various programs related to education and infrastructure have not been wasted as we look at these inequality measures.

37
Table 7a. Gini sub-group indices for years of schooling, literacy, access to safe water, access to sanitary toilet facility, and access to electricity, Philippines and Mindanao, by year and by ethnic group, 2000 and 2010
Area/Year/Ethnic group Years of schooling Literacy Access to
safe water
Access to sanitary
toilet facility
Access to electricity
Philippines
2010
Muslim 0.4307 0.1468 0.4667 0.3628 0.3854 Indigenous non-Muslim 0.3370 0.0722 0.3598 0.1974 0.3646 Non-indigenous/non-Muslim 0.2261 0.0126 0.1834 0.0905 0.1314
2000 Muslim 0.4791 0.2621 0.5519 0.4820 0.5869 Indigenous non-Muslim 0.3559 0.1510 0.3772 0.2503 0.4843 Non-indigenous/non-Muslim 0.2584 0.0557 0.2392 0.1616 0.2722
Mindanao 2010
Muslim 0.4408 0.1531 0.4853 0.3765 0.3979 Indigenous non-Muslim 0.3927 0.1107 0.4209 0.2621 0.5302 Non-indigenous/non-Muslim 0.2491 0.0161 0.2303 0.0844 0.2006
2000 Muslim 0.4883 0.2696 0.5642 0.4928 0.5992 Indigenous non-Muslim 0.4324 0.2542 0.4772 0.3145 0.6292 Non-indigenous/non-Muslim 0.2741 0.0659 0.3208 0.1888 0.4291
Source of basic data: Authors’ estimates using the 2010 and 2000 Census of Population and Housing, Philippine Statistics Authority.

38
Table 7b. Theil's sub-group indices for years of schooling, literacy, access to safe water, access to sanitary toilet facility, and access to electricity, Philippines and Mindanao, by year and by ethnic group, 2000 and 2010
Area/Year/Ethnic group Years of schooling Literacy Access to
safe water
Access to sanitary
toilet facility
Access to electricity
Philippines
2010
Muslim 0.3619 0.1586 0.6279 0.4502 0.4863 Indigenous non-Muslim 0.2122 0.0749 0.4455 0.2196 0.4530 Non-indigenous/non-Muslim 0.0945 0.0127 0.2024 0.0948 0.1407
2000 Muslim 0.4514 0.3036 0.8017 0.6571 0.8829 Indigenous non-Muslim 0.2377 0.1635 0.4730 0.2878 0.6614 Non-indigenous/non-Muslim 0.1185 0.0572 0.2731 0.1761 0.3173
Mindanao 2010
Muslim 0.3772 0.1660 0.6634 0.4720 0.5068 Indigenous non-Muslim 0.2872 0.1172 0.5457 0.3036 0.7546 Non-indigenous/non-Muslim 0.1108 0.0162 0.2615 0.0881 0.2237
2000 Muslim 0.4682 0.3138 0.8295 0.6781 0.9131 Indigenous non-Muslim 0.3594 0.2929 0.6478 0.3773 0.9909 Non-indigenous/non-Muslim 0.1308 0.0681 0.3864 0.2090 0.5599
Source of basic data: Authors’ estimates using the 2010 and 2000 Census of Population and Housing, Philippine Statistics Authority.
Inequality in terms of access to safe drinking water and years of schooling are the highest while inequality in terms of literacy rate is the lowest. These findings are consistent with those in the previous section in that there is not much variation in the literacy rates across different groups but there are more variations in the average years of schooling as well as access rates of different groups.
Within-group inequality measures for Mindanao are relatively higher than those for the Philippines, especially those for indigenous non-Muslim groups. The large discrepancies between the values of the outcome variables for the Philippines and those for Mindanao are clearly shown in Figures 10-11 and 16-17 as well as in Appendix Tables 1 and 2 This can be explained by the fact that non-Muslim IPs in other parts of the country are relatively better-off than their counterparts in Mindanao.
Within-group inequality is highest for Muslim ethnic groups. In fact, based on the rule-of-thumb for Gini coefficients by Binyan and Link (1998)20, there has been a highly unequal distribution in terms of access to safe water and educational attainment among the Muslims. As noted in the previous section, Muslims in Palawan and areas in Mindanao with adequate number of infrastructure facilities and/or not affected by armed conflicts are found to be better-off than Muslim ethnic groups in areas with poor infrastructure and are affected by armed conflicts. On the other hand, inequality in terms of literacy has not been a problem among Muslim ethnic groups.
20 "A [Gini] coefficient of 0.3 or less indicates substantial equality; 0.3 to 0.4 indicates acceptable normality; and, 0.4 or higher is considered too large. 0.6 or higher is predictive of social unrest." (Binyan and Link, 1998)
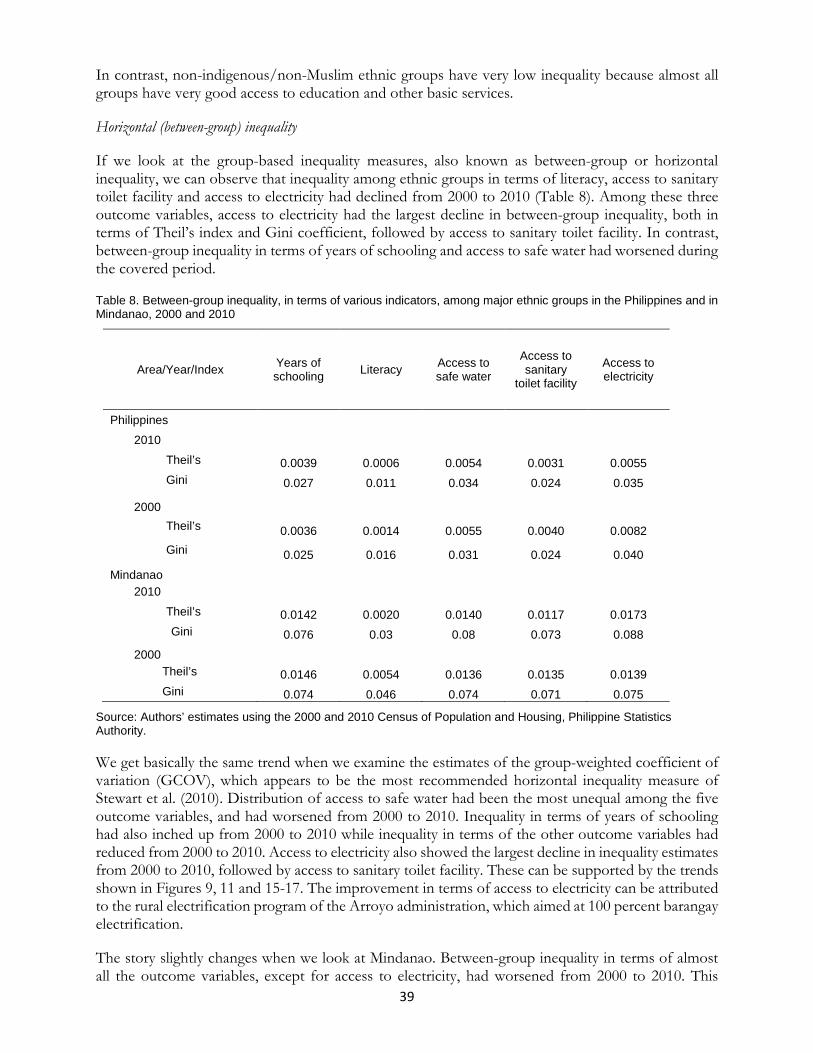
39
In contrast, non-indigenous/non-Muslim ethnic groups have very low inequality because almost all groups have very good access to education and other basic services.
Horizontal (between-group) inequality
If we look at the group-based inequality measures, also known as between-group or horizontal inequality, we can observe that inequality among ethnic groups in terms of literacy, access to sanitary toilet facility and access to electricity had declined from 2000 to 2010 (Table 8). Among these three outcome variables, access to electricity had the largest decline in between-group inequality, both in terms of Theil’s index and Gini coefficient, followed by access to sanitary toilet facility. In contrast, between-group inequality in terms of years of schooling and access to safe water had worsened during the covered period.
Table 8. Between-group inequality, in terms of various indicators, among major ethnic groups in the Philippines and in Mindanao, 2000 and 2010
Area/Year/Index Years of schooling Literacy Access to
safe water
Access to sanitary
toilet facility
Access to electricity
Philippines
2010
Theil’s 0.0039 0.0006 0.0054 0.0031 0.0055 Gini 0.027 0.011 0.034 0.024 0.035
2000 Theil’s 0.0036 0.0014 0.0055 0.0040 0.0082 Gini 0.025 0.016 0.031 0.024 0.040
Mindanao 2010
Theil’s 0.0142 0.0020 0.0140 0.0117 0.0173 Gini 0.076 0.03 0.08 0.073 0.088
2000 Theil’s 0.0146 0.0054 0.0136 0.0135 0.0139 Gini 0.074 0.046 0.074 0.071 0.075
Source: Authors’ estimates using the 2000 and 2010 Census of Population and Housing, Philippine Statistics Authority.
We get basically the same trend when we examine the estimates of the group-weighted coefficient of variation (GCOV), which appears to be the most recommended horizontal inequality measure of Stewart et al. (2010). Distribution of access to safe water had been the most unequal among the five outcome variables, and had worsened from 2000 to 2010. Inequality in terms of years of schooling had also inched up from 2000 to 2010 while inequality in terms of the other outcome variables had reduced from 2000 to 2010. Access to electricity also showed the largest decline in inequality estimates from 2000 to 2010, followed by access to sanitary toilet facility. These can be supported by the trends shown in Figures 9, 11 and 15-17. The improvement in terms of access to electricity can be attributed to the rural electrification program of the Arroyo administration, which aimed at 100 percent barangay electrification.
The story slightly changes when we look at Mindanao. Between-group inequality in terms of almost all the outcome variables, except for access to electricity, had worsened from 2000 to 2010. This
40
finding suggests that only access to electricity had improved, which may be related to the government’s efforts to address the power crisis in Mindanao between 2000 and 2010. Conflicts, particularly those that last longer, which can result in displacements of the population away from their homelands could have contributed to the worsening of distribution of safe water and basic education services among ethnic groups in Mindanao. Interestingly, Ghani (2012) argued that low literacy and school participation rates are a few of the negative effects of decades of conflicts and crisis in Mindanao.
Crosscuttingness and cross-fractionalization
In addition to vertical and horizontal inequality, Selway (2011) proposed two inequality measures that involve other social dimensions (referred to as “cleavages”) such as dialect/language used at home and religion, other than ethnicity or what we call “ethnoliguistic” grouping. The literature noted that ethnic divisions tend to be multidimensional; “based both in multiple ascriptive characteristics such as tribe, race, language, and caste and in more attitudinal characteristics such as class, ideology, and religion (Lane and Ersson, 1994)” (McDoom and Gisselquist, 2015, pp. 5-6). Crosscuttingness measures are said to “estimate the intersection between any two distinct dimensions of social divisions such as ethnicity, language, religion, and culture” (Desmet et al., 2015). For instance, a society is composed of two ethnic groups. Each ethnic group is composed of 50 percent Catholics and 50 percent Muslims. That society is said to have a crosscutting cleavage (McDoom and Gisselquist, 2015, p. 6). On the other hand, if one ethnic group is composed of 100 percent Catholics while the other group is composed of 100 percent Muslims, then that society is said to have a reinforcing cleavage.
The Philippines, as shown in Table 9, is considered as relatively more reinforcing in terms of divisions based on ethnicity and religion while relatively more crosscutting in terms of divisions based on ethnicity and dialect/language typically used at home. This means that the majority of the members of one ethnic group tend to have only one religion (or only a few if not only one). For example, the majority of Tagalog tend to profess Christian faith. If we compare the crosscuttingness estimates in 2000 and 2010, we can argue that the Philippines has become relatively more reinforcing (or less diverse) in terms of ethnicity and religion.
In terms of ethnicity and dialect, we can observe that the Philippines tend to be more crosscutting (or more varied), although the degree has reduced from 2000 to 2010. This means that members of one ethnic group tend to speak different dialects. This is particularly true among those who migrated to other places who, initially, needed to learn the native dialect as a way of adopting to the new environment and then, later, have gotten used to the dialect.
According to Lijphart (1977), “reinforcing cleavages imply deeper division and more conflict[s]” while McDoom and Gisselquist (2015, p. 6) noted that “crosscutting cleavages imply moderate divisions”. As Lipset and Rokkan (1967) argued, “political attitudes and beliefs [in societies with crosscutting cleavages] are expected to be less intense because individuals feel ‘cross-pressured’ or pulled between conflicting forces”.
Cross-fractionalization estimates support the ethnicity-religion and ethnicity-dialect crosscuttingness estimates. Although crosscuttingness and cross-fractionalization are related measures, cross-fractionalization is said to be “more sensitive to the fractionalization (number and relative size of groups) of the individual cleavages” (Selway, 2011, p. 6).

41
Table 9. Crosscuttingness an d cross-fractionalization measures for ethnic, religious and dialect (used at home) cleavages, Philippines and Mindanao, 2000 and 2010
Measure / division Philippines Mindanao 2010 2000 2010 2000
Crosscuttingness Ethnicity and Dialect 0.2911 0.5090 0.3134 0.5932 Ethnicity and Religion 0.2956 0.3103 0.2824 0.2879
Cross-fractionalization Ethnicity and Dialect 0.5073 0.5677 0.1947 0.3459 Ethnicity and Religion 0.2564 0.2734 0.2243 0.2591
Notes: Cleavage refers to social dimension or characteristic. For crosscuttingness, 0 means perfectly reinforcing while 1 means perfectly cross-cutting. In order to compute for Cramer’s V statistics, the original number of ethnic groups (182) was retained but the number of religious groups and dialects were both limited to 10.
Source: Authors’ estimates using the 2000 and 2010 Census of Population and Housing, Philippine Statistics Authority.
Human opportunity index (HOI)
In terms of human opportunity index (HOI), Table 10 shows that the country is doing very well both in terms of provision and equitable distribution of primary education services to children aged 6-11 as evidenced by high HOI values. On the contrary, it has been a challenge for the country to increase access to and ensure equitable distribution of secondary education services among population aged 12-18. These observations confirm what official data on school attendance rates convey. Figure 21 clearly shows that school attendance rates of Filipino children aged 6-11 in general have been very high even before 2010 while school attendance rates of older cohort of children (aged 12-18) have been relatively lower, especially after age 15. One possible reason for this is that secondary education is costlier, both in terms of direct costs such as fees and transportation cost, among others, and opportunity costs (Son, 2013) because older children can already be sent to work to help augment their household income.
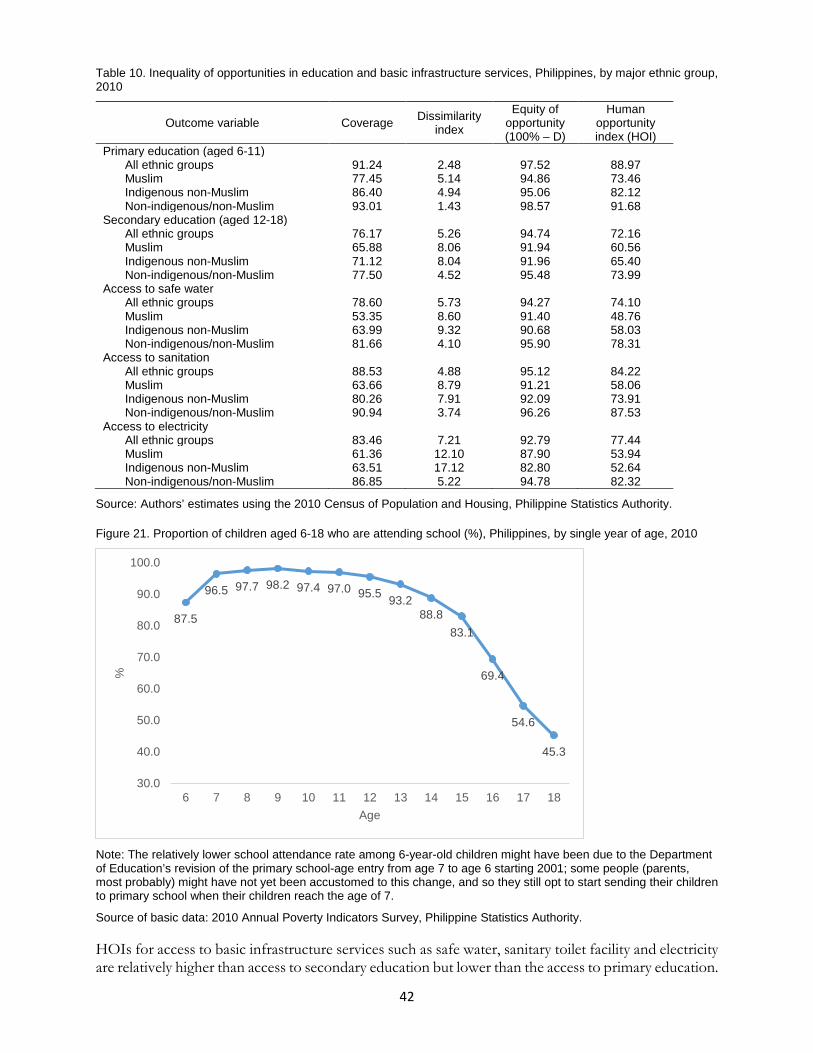
42
Table 10. Inequality of opportunities in education and basic infrastructure services, Philippines, by major ethnic group, 2010
Outcome variable Coverage Dissimilarity index
Equity of opportunity (100% – D)
Human opportunity index (HOI)
Primary education (aged 6-11) All ethnic groups 91.24 2.48 97.52 88.97 Muslim 77.45 5.14 94.86 73.46 Indigenous non-Muslim 86.40 4.94 95.06 82.12 Non-indigenous/non-Muslim 93.01 1.43 98.57 91.68
Secondary education (aged 12-18) All ethnic groups 76.17 5.26 94.74 72.16 Muslim 65.88 8.06 91.94 60.56 Indigenous non-Muslim 71.12 8.04 91.96 65.40 Non-indigenous/non-Muslim 77.50 4.52 95.48 73.99
Access to safe water All ethnic groups 78.60 5.73 94.27 74.10 Muslim 53.35 8.60 91.40 48.76 Indigenous non-Muslim 63.99 9.32 90.68 58.03 Non-indigenous/non-Muslim 81.66 4.10 95.90 78.31
Access to sanitation All ethnic groups 88.53 4.88 95.12 84.22 Muslim 63.66 8.79 91.21 58.06 Indigenous non-Muslim 80.26 7.91 92.09 73.91 Non-indigenous/non-Muslim 90.94 3.74 96.26 87.53
Access to electricity All ethnic groups 83.46 7.21 92.79 77.44 Muslim 61.36 12.10 87.90 53.94 Indigenous non-Muslim 63.51 17.12 82.80 52.64 Non-indigenous/non-Muslim 86.85 5.22 94.78 82.32
Source: Authors’ estimates using the 2010 Census of Population and Housing, Philippine Statistics Authority.
Figure 21. Proportion of children aged 6-18 who are attending school (%), Philippines, by single year of age, 2010
Note: The relatively lower school attendance rate among 6-year-old children might have been due to the Department of Education’s revision of the primary school-age entry from age 7 to age 6 starting 2001; some people (parents, most probably) might have not yet been accustomed to this change, and so they still opt to start sending their children to primary school when their children reach the age of 7.
Source of basic data: 2010 Annual Poverty Indicators Survey, Philippine Statistics Authority.
HOIs for access to basic infrastructure services such as safe water, sanitary toilet facility and electricity are relatively higher than access to secondary education but lower than the access to primary education.
87.5
96.5 97.7 98.2 97.4 97.0 95.5 93.288.8
83.1
69.4
54.6
45.3
30.0
40.0
50.0
60.0
70.0
80.0
90.0
100.0
6 7 8 9 10 11 12 13 14 15 16 17 18
%
Age
43
Among these three basic services, sanitation has the highest HOI value. This implies that a higher proportion of Filipinos have access to sanitary toilet facility and such service is relatively more equally distributed compared to other infrastructure services. It appears, however, that increasing the proportion of population with access to safe water has to be prioritized. The higher dissimilarity index for access to electricity, on the other hand, suggests that distribution of access to electricity appears to be the most unequal among the three infrastructure services although it does not pose a problem at all.
Looking at the indices for different ethnic groups, the patterns observed from the standard inequality measures presented earlier are basically the same. Each of the non-indigenous/non-Muslim ethnic groups has a very high access to primary education. This major group also takes the lead among the three major ethnic groups in terms of coverage and equity of opportunity in other services. On the other hand, Muslim ethnic groups have the lowest and most unequal access to education and infrastructure services. Meanwhile, it can also be noted that access to electricity among Muslim and indigenous non-Muslim ethnic groups has been largely unequal as evidenced by lower values of equity of opportunity. This can be explained by lower electrification rates in upland and remote areas (where many indigenous groups are located) and some areas in Mindanao (where the majority of Muslims can be found).
Since the HOI is a function of coverage and equity (of opportunity), increasing this involves either providing more services to the population (also known as the “scale effect”) or by distributing services more equitably (also known as the “equalization effect”), or both (Rama et al., 2015; Son, 2013). Based on the above results, there is a need to increase the human opportunity indices for access to secondary education and access to all three infrastructure services among Muslim ethnic groups as well as that for access to electricity and safe water among the indigenous non-Muslim groups.
4.3 Conflict-inequality nexus
Data show that the majority of armed conflicts during the period 2010-2014 occurred in Mindanao, particularly in North Cotabato, Maguindanao, Zamboanga del Sur, Basilan, Misamis Oriental, and Sulu. The highest number of armed conflicts was recorded in the provinces of North Cotabato and Maguindanao (Figure 22). This can be attributed to conflicts including violent clan feuds and generalized violence (some of which are related to land ownership disputes and clash of interests in natural resources) across Mindanao, specifically in areas around Liguasan Marsh, during the said period (OCHA, 2015). Disputes over land ownership has historically been considered as the major source of conflicts among ethnic groups in many countries (Baldwin et al., 2007).
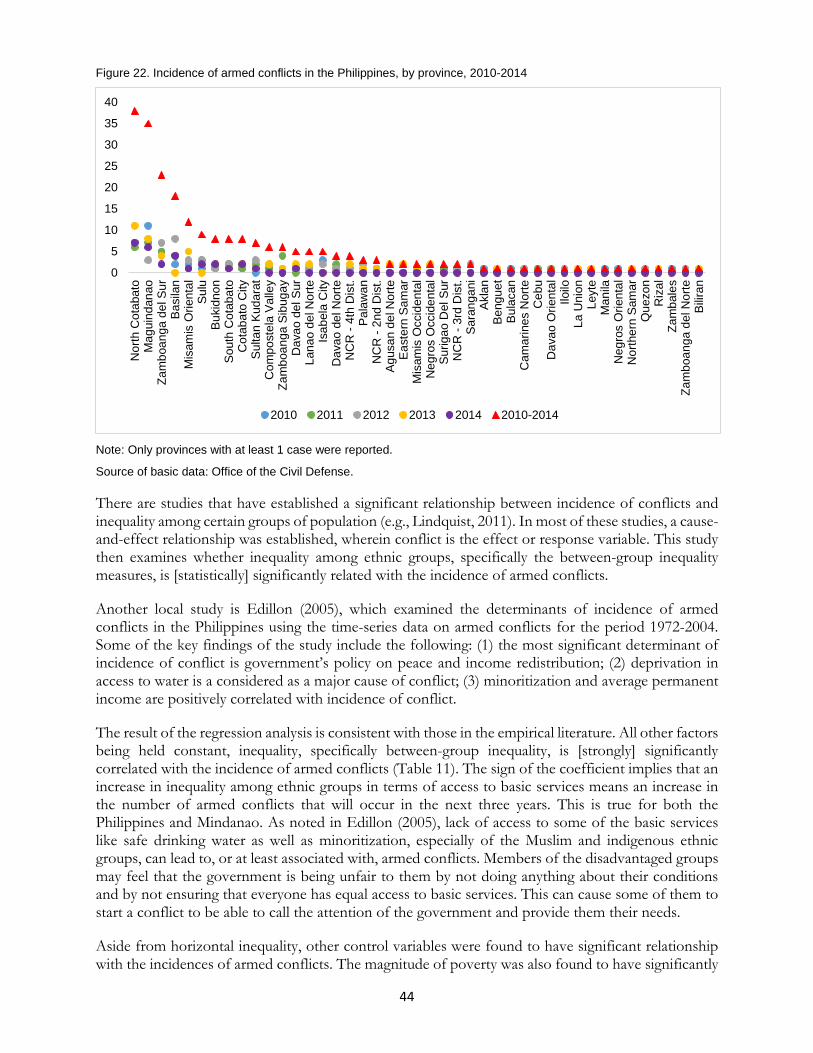
44
Figure 22. Incidence of armed conflicts in the Philippines, by province, 2010-2014
Note: Only provinces with at least 1 case were reported.
Source of basic data: Office of the Civil Defense.
There are studies that have established a significant relationship between incidence of conflicts and inequality among certain groups of population (e.g., Lindquist, 2011). In most of these studies, a cause-and-effect relationship was established, wherein conflict is the effect or response variable. This study then examines whether inequality among ethnic groups, specifically the between-group inequality measures, is [statistically] significantly related with the incidence of armed conflicts.
Another local study is Edillon (2005), which examined the determinants of incidence of armed conflicts in the Philippines using the time-series data on armed conflicts for the period 1972-2004. Some of the key findings of the study include the following: (1) the most significant determinant of incidence of conflict is government’s policy on peace and income redistribution; (2) deprivation in access to water is a considered as a major cause of conflict; (3) minoritization and average permanent income are positively correlated with incidence of conflict.
The result of the regression analysis is consistent with those in the empirical literature. All other factors being held constant, inequality, specifically between-group inequality, is [strongly] significantly correlated with the incidence of armed conflicts (Table 11). The sign of the coefficient implies that an increase in inequality among ethnic groups in terms of access to basic services means an increase in the number of armed conflicts that will occur in the next three years. This is true for both the Philippines and Mindanao. As noted in Edillon (2005), lack of access to some of the basic services like safe drinking water as well as minoritization, especially of the Muslim and indigenous ethnic groups, can lead to, or at least associated with, armed conflicts. Members of the disadvantaged groups may feel that the government is being unfair to them by not doing anything about their conditions and by not ensuring that everyone has equal access to basic services. This can cause some of them to start a conflict to be able to call the attention of the government and provide them their needs.
Aside from horizontal inequality, other control variables were found to have significant relationship with the incidences of armed conflicts. The magnitude of poverty was also found to have significantly
0
5
10
15
20
25
30
35
40
Nor
th C
otab
ato
Mag
uind
anao
Zam
boan
ga d
el S
urBa
sila
nM
isam
is O
rient
alSu
luBu
kidn
onSo
uth
Cot
abat
oC
otab
ato
City
Sulta
n Ku
dara
tC
ompo
stel
a Va
lley
Zam
boan
ga S
ibug
ayD
avao
del
Sur
Lana
o de
l Nor
teIs
abel
a C
ityD
avao
del
Nor
teN
CR
- 4t
h D
ist.
Pala
wan
NC
R -
2nd
Dis
t.Ag
usan
del
Nor
teEa
ster
n Sa
mar
Mis
amis
Occ
iden
tal
Neg
ros
Occ
iden
tal
Surig
ao D
el S
urN
CR
- 3r
d D
ist.
Sara
ngan
iAk
lan
Beng
uet
Bula
can
Cam
arin
es N
orte
Ceb
uD
avao
Orie
ntal
Iloilo
La U
nion
Leyt
eM
anila
Neg
ros
Orie
ntal
Nor
ther
n Sa
mar
Que
zon
Riz
alZa
mba
les
Zam
boan
ga d
el N
orte
Bilir
an
2010 2011 2012 2013 2014 2010-2014
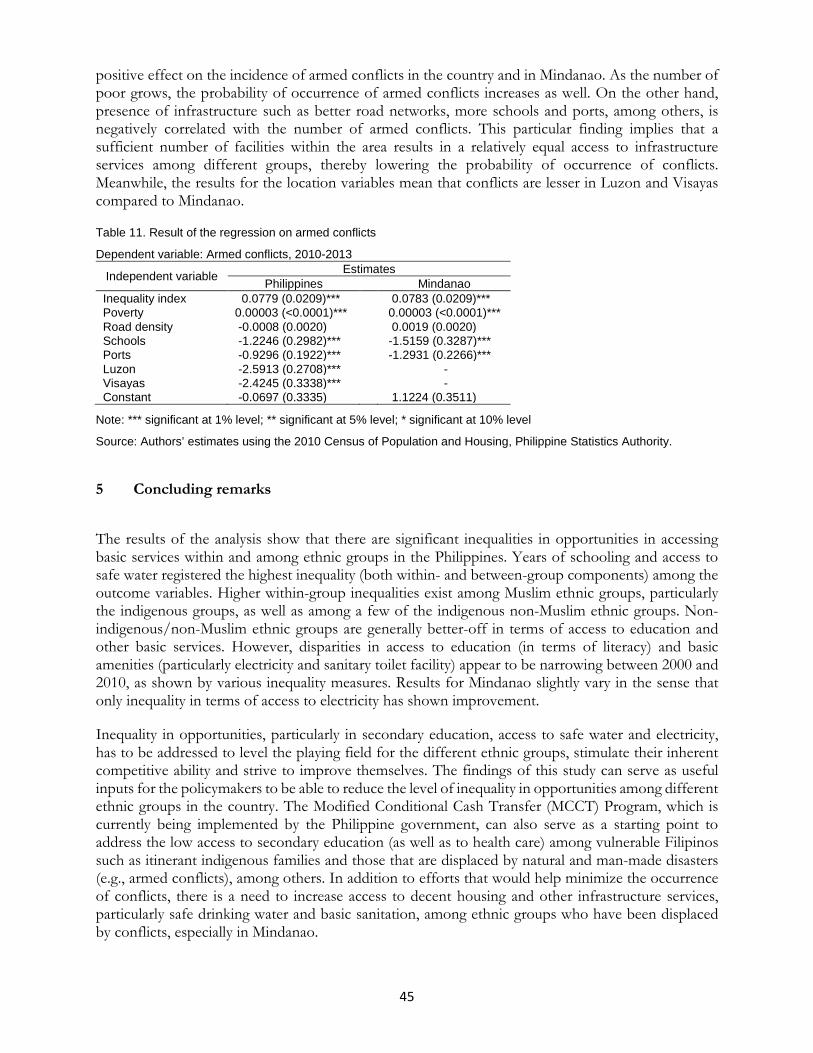
45
positive effect on the incidence of armed conflicts in the country and in Mindanao. As the number of poor grows, the probability of occurrence of armed conflicts increases as well. On the other hand, presence of infrastructure such as better road networks, more schools and ports, among others, is negatively correlated with the number of armed conflicts. This particular finding implies that a sufficient number of facilities within the area results in a relatively equal access to infrastructure services among different groups, thereby lowering the probability of occurrence of conflicts. Meanwhile, the results for the location variables mean that conflicts are lesser in Luzon and Visayas compared to Mindanao.
Table 11. Result of the regression on armed conflicts
Dependent variable: Armed conflicts, 2010-2013
Independent variable Estimates Philippines Mindanao
Inequality index 0.0779 (0.0209)*** 0.0783 (0.0209)*** Poverty 0.00003 (<0.0001)*** 0.00003 (<0.0001)*** Road density -0.0008 (0.0020) 0.0019 (0.0020) Schools -1.2246 (0.2982)*** -1.5159 (0.3287)*** Ports -0.9296 (0.1922)*** -1.2931 (0.2266)*** Luzon -2.5913 (0.2708)*** - Visayas -2.4245 (0.3338)*** - Constant -0.0697 (0.3335) 1.1224 (0.3511)
Note: *** significant at 1% level; ** significant at 5% level; * significant at 10% level
Source: Authors’ estimates using the 2010 Census of Population and Housing, Philippine Statistics Authority.
5 Concluding remarks
The results of the analysis show that there are significant inequalities in opportunities in accessing basic services within and among ethnic groups in the Philippines. Years of schooling and access to safe water registered the highest inequality (both within- and between-group components) among the outcome variables. Higher within-group inequalities exist among Muslim ethnic groups, particularly the indigenous groups, as well as among a few of the indigenous non-Muslim ethnic groups. Non-indigenous/non-Muslim ethnic groups are generally better-off in terms of access to education and other basic services. However, disparities in access to education (in terms of literacy) and basic amenities (particularly electricity and sanitary toilet facility) appear to be narrowing between 2000 and 2010, as shown by various inequality measures. Results for Mindanao slightly vary in the sense that only inequality in terms of access to electricity has shown improvement.
Inequality in opportunities, particularly in secondary education, access to safe water and electricity, has to be addressed to level the playing field for the different ethnic groups, stimulate their inherent competitive ability and strive to improve themselves. The findings of this study can serve as useful inputs for the policymakers to be able to reduce the level of inequality in opportunities among different ethnic groups in the country. The Modified Conditional Cash Transfer (MCCT) Program, which is currently being implemented by the Philippine government, can also serve as a starting point to address the low access to secondary education (as well as to health care) among vulnerable Filipinos such as itinerant indigenous families and those that are displaced by natural and man-made disasters (e.g., armed conflicts), among others. In addition to efforts that would help minimize the occurrence of conflicts, there is a need to increase access to decent housing and other infrastructure services, particularly safe drinking water and basic sanitation, among ethnic groups who have been displaced by conflicts, especially in Mindanao.
46
References Abanes, M.S., P.L.H. Scheepers and C. Sterkens. 2014. Ethno-religious groups, identification, trust
and social distance in the ethno-religiously stratified Philippines. Research in Social Stratification and Mobility 37: 61-75.
Agresti, A. 2002. Categorical data analysis. Wiley series in Probability and Statistics. New York, United States of America: Wiley-Interscience.
Asian Development Bank (ADB). 2002. Indigenous peoples/ethnic minorities and poverty reduction: Philippines. Mandaluyong City, Philippines: Asian Development Bank.
Baldwin, C., C. Chapman and Z. Gray. 2007. Minority rights: the key to conflict prevention. Minority Rights Group International (MRGI) Report. United Kingdom: MRGI.
Balisacan, A.M. and N. Fuwa. 2004. Changes in spatial income inequality in the Philippines: an exploratory analysis. UNU WIDER Research Paper No. 2004/34. Helsinki, Finland: United Nations University: World Institute for Development Economics Research.
Bara, H. 2015. The history of Muslim in the Philippines. http://ncca.gov.ph/subcommissions/subcommission-on-cultural-communities-and-traditional-arts-sccta/central-cultural-communities/the-history-of-the-muslim-in-the-philippines/ (accessed on December 10, 2016).
Bellù, L.G. and P. Liberati. 2006. Policy impacts on inequality: decomposition of income inequality by subgroups. EASYPol Module 052. http://www.fao.org/docs/up/easypol/444/dcmpsng-inqulty_sbgrp_052en.pdf (accessed on May 29, 2016).
Binyan, L. and P. Link. 1998. A great leap backward? The New York Review of Books (October 8, 1998 Issue). http://www.nybooks.com/articles/1998/10/08/a-great-leap-backward/ (accessed on May 28, 2016).
Caprioli, M. 2005. Primed for Violence: The Role of Gender Inequality in Predicting Internal Conflict. International Studies Quarterly 49: 161-178.
Department of Education (DepEd). 2009. “DO 97, s. 2009 - Additional Guidelines on the Renewal for the Grant of Financial Assistance to Recipient Madaris and New Applicants” (published on September 17, 2009). http://www.deped.gov.ph/orders/do-97-s-2009 (accessed on December 9, 2016).
Department of Education (DepEd). 2007. “DO 81, s.2007 - Assistance to Private Madrasah: An Incentive to Adopt the Standard Curriculum as Authorized Under DepED Order No. 51, s. 2004 and Total Mainstreaming of Madrasah Education as a Component of the National System of Basic Education” (published on December 19, 2007). http://www.deped.gov.ph/orders/do-81-s-2007 (accessed on December 9, 2016).
Department of Interior and Local Government (DILG). 2017. Book III: Local Government Units. The Local Government Code of the Philippines. Quezon City, Philippines: DILG. http://www.dilg.gov.ph/PDF_File/reports_resources/dilg-reports-resources-2016120_5e0bb28e41.pdf (accessed on July 5, 2017).
Desmet, K., I. Ortuño-Ortín and R. Wacziarg. 2015. Culture, ethnicity and diversity. NBER Working Paper Series 20989.
Eder, J.F. 2010. Muslim Palawan: diversity and difference on the periphery of Philippine Islam. Philippine Studies 58(3): 407-420. Quezon City, Philippines: Ateneo de Manila University.
Edillon, R.G. 2005. Ideologically motivated conflicts in the Philippines: in search of underlying causes. A background paper submitted to the Human Development Network Foundation, Inc. for the
47
Philippine Human Development Report 2005. http://www.hdn.org.ph/wp-content/uploads/2005_PHDR/2005%20Rosemarie_Edillon.pdf (accessed on November 3, 2016).
Ferreira, F.H.G. and J. Gignoux. 2011. The measurement of inequality of opportunity: theory and an application to Latin America. Review of Income and Wealth. DOI: 10.1111/j.1475-4991.2011.00467.x. http://siteresources.worldbank.org/DEC/Resources/84797-1114437274304/FG1_RIW.pdf (accessed on February 7, 2017).
Ghani, A. 2012. The fight for knowledge: opportunities and risks of educational work in conflict and crisis zones. Plenary debate, 2012 Deutsche Welle Global Media Forum.
Joshua Project. 2016. Manobo, Ata in [the] Philippines. https://joshuaproject.net/people_groups/10472/RP (accessed on December 11, 2016).
Kanbur, R. 2014. Is inequality of opportunity a useful policy construct?. Presentation during the IEA-World Bank Conference on Shared Prosperity and Growth, 10 June 2014. http://kanbur.dyson.cornell.edu/papers/Is%20Inequality%20of%20Opportunity%20a%20Useful%20Policy%20Construct.pdf (accessed February 6, 2017).
Kanbur, R. and J. Zhuang. 2013. Urbanization and inequality in Asia. Asian Development Review 30(1): 131-147.
Lane, J.-E. and S.O. Ersson. 1994. Politics and society in Western Europe (3rd ed.). London, United Kingdom: Sage.
Li, X. and D. Xu. 2016. From trade surplus to the dispute over the exchange rate: quantitative analysis of RMB appreciation. Singapore: World Scientific Publishing Co. Pte. Ltd.
Lijphart, A. 1977. Democracy in plural societies: a comparative exploration. New Haven, Connecticut, United States of America: Yale University Press.
Lindquist, K.M. 2011. Horizontal educational inequalities and civil conflict: the nexus of ethnicity, inequality, and violent conflict. Undergraduate Economic Review 8(1). http://digitalcommons.iwu.edu/uer/vol8/iss1/10 (accessed on February 7, 2017).
Lipset, S.M. and S. Rokkan. 1967. Party systems and voter alignments: cross-national perspectives. New York, United States of America: Free Press.
Mancini, L. 2005. Horizontal Inequality and Communal Violence: Evidence from Indonesian Districts. CRISE Working Paper No. 22. Oxford, United Kingdom: University of Oxford.
Marrero, G.A. and J.G. Rodriguez. 2012. Inequality of Opportunity in Europe. Review of Income and Wealth 58(4): 597-621
McDoom, O.S. and R.M. Gisselquist. 2015. The measurement of ethnic and religious divisions: spatial, temporal, and categorical dimensions with evidence from Mindanao, the Philippines. Social Indicators Research, pp. 1-29. doi: 10.1007/s11205-015-1145-9.
Mednick, M. 1975. Maranao. In Ethnic groups of insulat Southeast Asia, vol. 2: Philippines and Formosa, ed. Frank M. Lebar, 36-29. New Haven, Connecticut, United States of America: Human Relations Area Files Press.
Mukhopadhaya, P., G. Shantakumar, and B. Rao. 2011. Economic growth and income inequality in China, India and Singapore: trends and policy implications. Abingdon, Oxon, United Kingdom: Routledge.
National Commission on Indigenous Peoples (NCIP). 2010. Primer on Census for Indigenous Peoples. Quezon City, Philippines: National Commission on Indigenous Peoples.
48
National Commission on Indigenous Peoples (NCIP). 1998. Indigenous Peoples Rights Acts (R.A. No. 371) Implementing Rules and Regulations. Quezon City, Philippines: National Commission on Indigenous Peoples.
Network of East Asian Think-Tanks (NEAT). 2015. NEAT Working Group on East Asian Poverty Reduction Final Report (July 10, 2015). http://www.ceac.jp/j/pdf/neat/13wg_1.pdf (accessed on November 3, 2016).
United Nations Office for the Coordination of Humanitarian Affairs (OCHA). 2015. Armed conflict in Mindanao continues to displace people. Humanitarian Bulletin Philippines, Issue 2 (February 1 – March 2, 2015). https://mhpss.net/?get=211/OCHAPhilippines-Humanitarian-BulletinNo2_February-2015.pdf (accessed January 31, 2017).
Palawan Board. 2016. Electricity in Palawan – Philippines. http://www.palawanboard.com/electricity.php (accessed on December 11, 2016).
Pew Research Center. 2015. America’s changing religious landscape: Christians decline sharply as share of population; unaffiliated and other faiths continue to grow (May 12, 2015). http://www.pewforum.org/files/2015/05/RLS-08-26-full-report.pdf (accessed on November 5, 2016).
Pew Research Center. 2011. Christian traditions. Global Christianity – A report on the size and distribution of the world’s Christian population. http://www.pewforum.org/2011/12/19/global-christianity-traditions/#defining (accessed on November 7, 2016).
Philippine Statistics Authority. 2016a. 2010 Census of Population and Housing: Definition of terms and concepts. http://www.census.gov.ph/sites/default/files/attachments/hsd/.../Explanatory%20Text.pdf (accessed on May 27, 2016).
Philippine Statistics Authority. 2016b. Philippines – Census of Population and Housing 2000, 10% sample. PSA Data Archive. http://web0.psa.gov.ph/psada/index.php/catalog/54 (accessed on November 4, 2016).
Rae, D.W. and M. Taylor. 1970. The analysis of political cleavages. New Haven, Connecticut, United States of America: Yale University Press.
Rama, M., T. Béteille, Y. Li, P.K. Mitra, and J.L. Newman. 2015. Addressing inequality in South Asia. South Asia Development Matters. Washington, D.C., United States of America: World Bank. Doi: 10.1596/978-1-4648-0022-1.
Reyes, C.M., A.D. Tabuga, R.D. Asis, and M.B.G. Datu. 2012. Poverty and agriculture in the Philippines: trends in income poverty and distribution. PIDS Discussion Paper Series No. 2012-09. Quezon City, Philippines: Philippine Institute for Development Studies.
Romer, J.E. 1998. Equality of opportunity. Cambridge, Massachusetts, United States of America: Harvard University Press.
Selway, J.S. 2011. The measurement of cross-cutting cleavages and other multidimensional cleavage structures. Political Analysis, 19(1): 48-65. doi: 10.1093/pan/mpq036.
Senate of the Philippines. 2007. “Strengthen Madrasah education to promote peace – Recto”. Press release (April 25, 2007). http://www.senate.gov.ph/press_release/2007/0425_recto1.asp (accessed on December 9, 2016).
Singh, A. 2012. Inequality of opportunity in earnings and consumption expenditure: the case of Indian men. Review of Income and Wealth 58(1): 79-106.

49
Son, H.H. 2013. Inequality of human opportunities in developing Asia. Asian Development Review 30 (2): 110-130. http://www.mitpressjournals.org/doi/pdf/10.1162/ADEV_a_00017. (accessed February 6, 2017).
Stewart, F., 2009. A global view of horizontal inequalities: inequalities experienced by Muslims worldwide. MICROCON Research Working Paper 13. Brighton, United Kingdom: MICROCON.
Stewart, F., G. Brown and L. Mancini. 2010. Monitoring and measuring horizontal inequalities. Oxford, United Kingdom: Centre for Research on Inequality, Human Security and Ethnicity.
Trewin, D. 2006. Appendix 3: Gini coefficient and other single statistic summaries of income distribution. Information Paper – Household Expenditure Survey and Survey of Income and Housing: User Guide, 2003-04. http://www.ausstats.abs.gov.au/ausstats/subscriber.nsf/0/5BCF25BEABB47CF3CA25715600159C04/$File/65030_2003-04.pdf (accessed January 30, 2017).
Vinck, P. 2011. Violent conflicts and displacement in Central Mindanao: challenges for recovery and development. World Food Programme. Washington, D.C., United States of America: World Bank.
Yap, J.T. 2013. Addressing inequality in East Asia through regional economic integration. Economic Research Institute for ASEAN and East Asia (ERIA) Research Institute Network Statement No. 3 (May). http://www.pids.gov.ph/files/3rd%20RIN%20Statement%20Final.pdf (accessed on November 3, 2016).
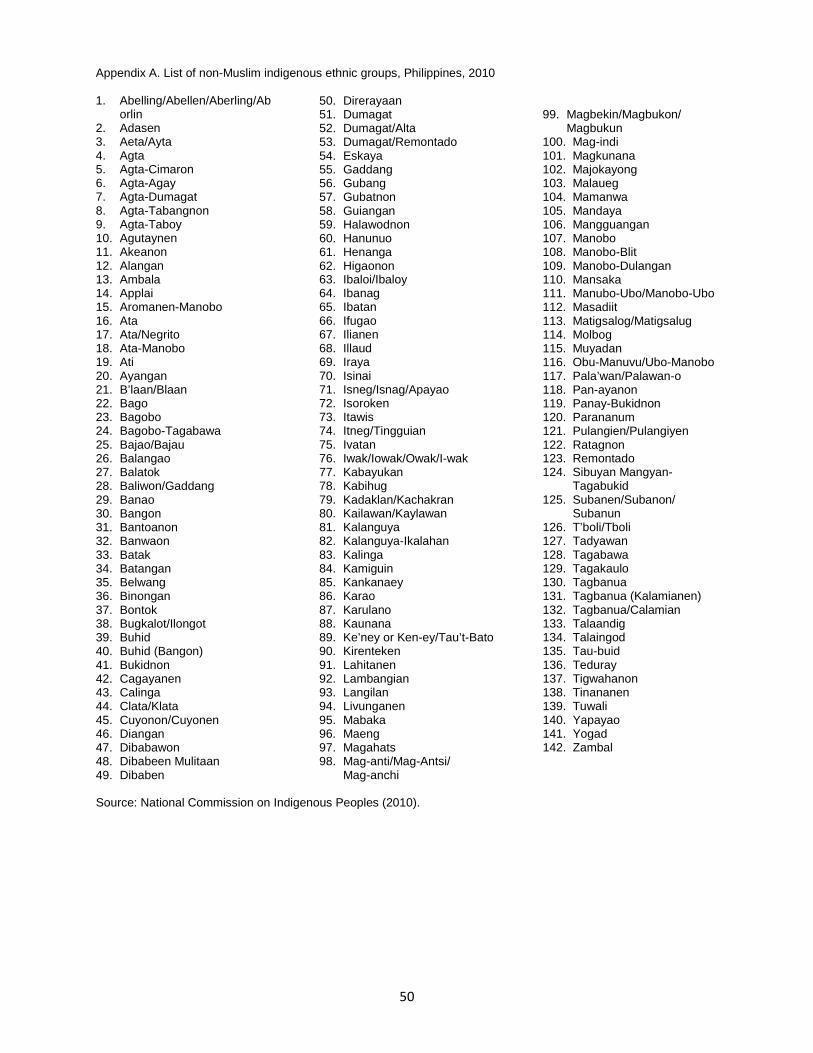
50
Appendix A. List of non-Muslim indigenous ethnic groups, Philippines, 2010 1. Abelling/Abellen/Aberling/Ab
orlin 2. Adasen 3. Aeta/Ayta 4. Agta 5. Agta-Cimaron 6. Agta-Agay 7. Agta-Dumagat 8. Agta-Tabangnon 9. Agta-Taboy 10. Agutaynen 11. Akeanon 12. Alangan 13. Ambala 14. Applai 15. Aromanen-Manobo 16. Ata 17. Ata/Negrito 18. Ata-Manobo 19. Ati 20. Ayangan 21. B’laan/Blaan 22. Bago 23. Bagobo 24. Bagobo-Tagabawa 25. Bajao/Bajau 26. Balangao 27. Balatok 28. Baliwon/Gaddang 29. Banao 30. Bangon 31. Bantoanon 32. Banwaon 33. Batak 34. Batangan 35. Belwang 36. Binongan 37. Bontok 38. Bugkalot/Ilongot 39. Buhid 40. Buhid (Bangon) 41. Bukidnon 42. Cagayanen 43. Calinga 44. Clata/Klata 45. Cuyonon/Cuyonen 46. Diangan 47. Dibabawon 48. Dibabeen Mulitaan 49. Dibaben
50. Direrayaan 51. Dumagat 52. Dumagat/Alta 53. Dumagat/Remontado 54. Eskaya 55. Gaddang 56. Gubang 57. Gubatnon 58. Guiangan 59. Halawodnon 60. Hanunuo 61. Henanga 62. Higaonon 63. Ibaloi/Ibaloy 64. Ibanag 65. Ibatan 66. Ifugao 67. Ilianen 68. Illaud 69. Iraya 70. Isinai 71. Isneg/Isnag/Apayao 72. Isoroken 73. Itawis 74. Itneg/Tingguian 75. Ivatan 76. Iwak/Iowak/Owak/I-wak 77. Kabayukan 78. Kabihug 79. Kadaklan/Kachakran 80. Kailawan/Kaylawan 81. Kalanguya 82. Kalanguya-Ikalahan 83. Kalinga 84. Kamiguin 85. Kankanaey 86. Karao 87. Karulano 88. Kaunana 89. Ke’ney or Ken-ey/Tau’t-Bato 90. Kirenteken 91. Lahitanen 92. Lambangian 93. Langilan 94. Livunganen 95. Mabaka 96. Maeng 97. Magahats 98. Mag-anti/Mag-Antsi/
Mag-anchi
99. Magbekin/Magbukon/
Magbukun 100. Mag-indi 101. Magkunana 102. Majokayong 103. Malaueg 104. Mamanwa 105. Mandaya 106. Mangguangan 107. Manobo 108. Manobo-Blit 109. Manobo-Dulangan 110. Mansaka 111. Manubo-Ubo/Manobo-Ubo 112. Masadiit 113. Matigsalog/Matigsalug 114. Molbog 115. Muyadan 116. Obu-Manuvu/Ubo-Manobo 117. Pala’wan/Palawan-o 118. Pan-ayanon 119. Panay-Bukidnon 120. Parananum 121. Pulangien/Pulangiyen 122. Ratagnon 123. Remontado 124. Sibuyan Mangyan-
Tagabukid 125. Subanen/Subanon/
Subanun 126. T’boli/Tboli 127. Tadyawan 128. Tagabawa 129. Tagakaulo 130. Tagbanua 131. Tagbanua (Kalamianen) 132. Tagbanua/Calamian 133. Talaandig 134. Talaingod 135. Tau-buid 136. Teduray 137. Tigwahanon 138. Tinananen 139. Tuwali 140. Yapayao 141. Yogad 142. Zambal
Source: National Commission on Indigenous Peoples (2010).
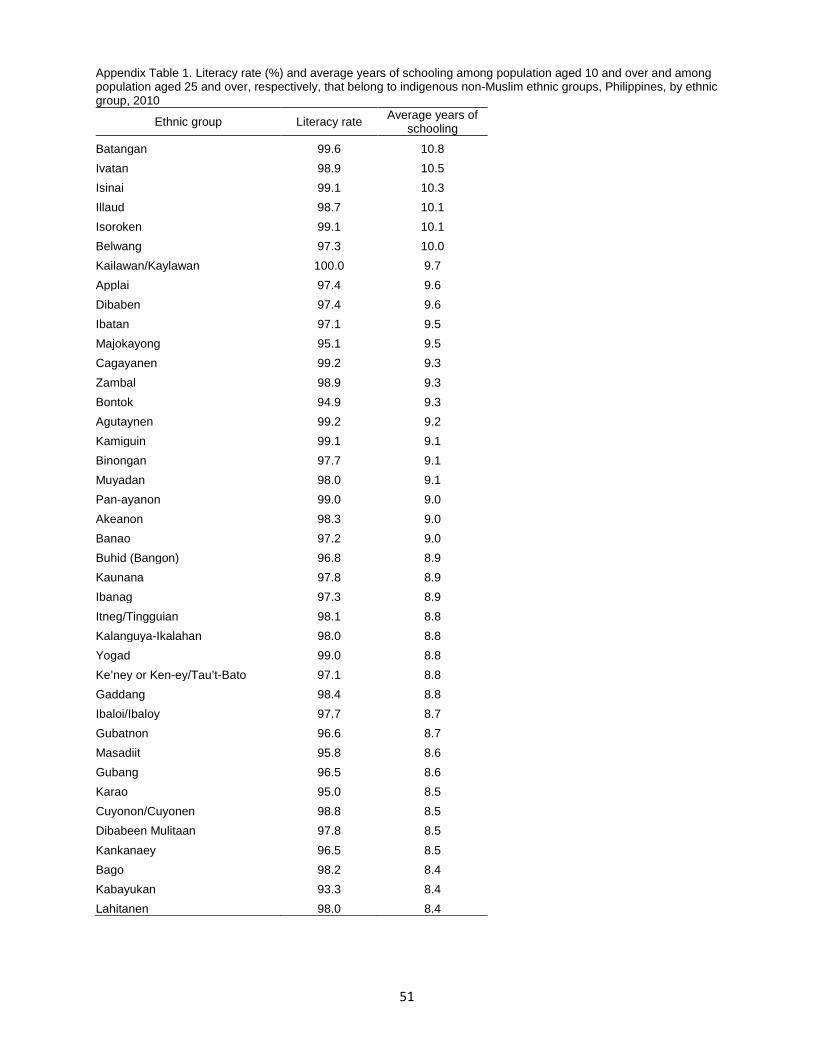
51
Appendix Table 1. Literacy rate (%) and average years of schooling among population aged 10 and over and among population aged 25 and over, respectively, that belong to indigenous non-Muslim ethnic groups, Philippines, by ethnic group, 2010
Ethnic group Literacy rate Average years of schooling
Batangan 99.6 10.8 Ivatan 98.9 10.5 Isinai 99.1 10.3 Illaud 98.7 10.1 Isoroken 99.1 10.1 Belwang 97.3 10.0 Kailawan/Kaylawan 100.0 9.7 Applai 97.4 9.6 Dibaben 97.4 9.6 Ibatan 97.1 9.5 Majokayong 95.1 9.5 Cagayanen 99.2 9.3 Zambal 98.9 9.3 Bontok 94.9 9.3 Agutaynen 99.2 9.2 Kamiguin 99.1 9.1 Binongan 97.7 9.1 Muyadan 98.0 9.1 Pan-ayanon 99.0 9.0 Akeanon 98.3 9.0 Banao 97.2 9.0 Buhid (Bangon) 96.8 8.9 Kaunana 97.8 8.9 Ibanag 97.3 8.9 Itneg/Tingguian 98.1 8.8 Kalanguya-Ikalahan 98.0 8.8 Yogad 99.0 8.8 Ke’ney or Ken-ey/Tau’t-Bato 97.1 8.8 Gaddang 98.4 8.8 Ibaloi/Ibaloy 97.7 8.7 Gubatnon 96.6 8.7 Masadiit 95.8 8.6 Gubang 96.5 8.6 Karao 95.0 8.5 Cuyonon/Cuyonen 98.8 8.5 Dibabeen Mulitaan 97.8 8.5 Kankanaey 96.5 8.5 Bago 98.2 8.4 Kabayukan 93.3 8.4 Lahitanen 98.0 8.4
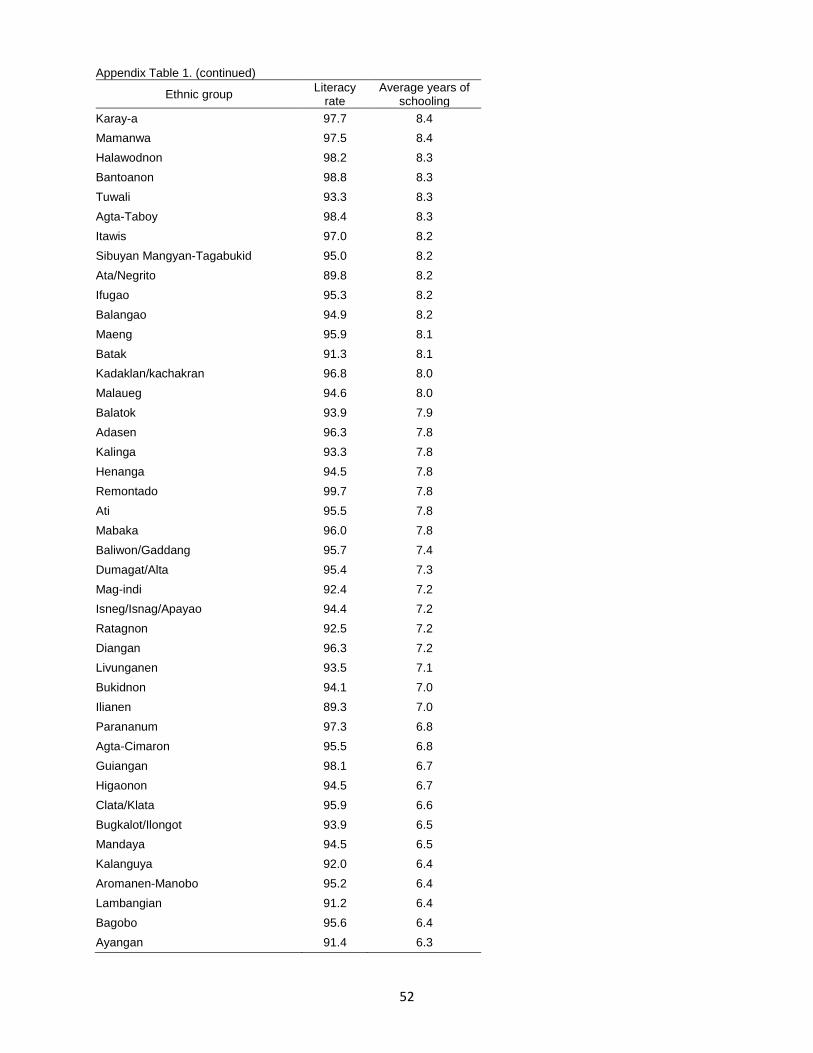
52
Appendix Table 1. (continued)
Ethnic group Literacy rate
Average years of schooling
Karay-a 97.7 8.4 Mamanwa 97.5 8.4 Halawodnon 98.2 8.3 Bantoanon 98.8 8.3 Tuwali 93.3 8.3 Agta-Taboy 98.4 8.3 Itawis 97.0 8.2 Sibuyan Mangyan-Tagabukid 95.0 8.2 Ata/Negrito 89.8 8.2 Ifugao 95.3 8.2 Balangao 94.9 8.2 Maeng 95.9 8.1 Batak 91.3 8.1 Kadaklan/kachakran 96.8 8.0 Malaueg 94.6 8.0 Balatok 93.9 7.9 Adasen 96.3 7.8 Kalinga 93.3 7.8 Henanga 94.5 7.8 Remontado 99.7 7.8 Ati 95.5 7.8 Mabaka 96.0 7.8 Baliwon/Gaddang 95.7 7.4 Dumagat/Alta 95.4 7.3 Mag-indi 92.4 7.2 Isneg/Isnag/Apayao 94.4 7.2 Ratagnon 92.5 7.2 Diangan 96.3 7.2 Livunganen 93.5 7.1 Bukidnon 94.1 7.0 Ilianen 89.3 7.0 Parananum 97.3 6.8 Agta-Cimaron 95.5 6.8 Guiangan 98.1 6.7 Higaonon 94.5 6.7 Clata/Klata 95.9 6.6 Bugkalot/Ilongot 93.9 6.5 Mandaya 94.5 6.5 Kalanguya 92.0 6.4 Aromanen-Manobo 95.2 6.4 Lambangian 91.2 6.4 Bagobo 95.6 6.4 Ayangan 91.4 6.3

53
Appendix Table 1. (continued)
Ethnic group Literacy rate Average years of schooling
Bangon 77.7 6.2 Manubo-Ubo/Manobo-Ubo 92.0 6.1 Tagabawa 95.7 6.1 Bagobo-Tagabawa 93.9 6.1 Yapayao 89.9 6.0 Direrayaan 96.6 6.0 Eskaya 99.2 6.0 Dumagat 85.5 5.8 Iwak/Iowak/Owak/I-wak 90.4 5.7 Manobo 89.0 5.7 Agta-Tabangnon 94.8 5.6 Magkunana 88.8 5.6 Mansaka 94.6 5.6 Tinananen 88.1 5.5 Panay-Bukidnon 89.3 5.5 Tagbanua (Kalamianen) 88.7 5.3 Pulangien/Pulangiyen 84.6 5.3 Agta-Dumagat 81.2 5.2 Talaandig 89.4 5.2 Abelling/Abellen/Aberling/Aborlin 80.7 5.2 Tagbanua 87.2 5.2 Tagbanua/Calamian 91.5 5.1 Calinga 85.2 5.0 Ambala 82.4 4.9 Subanen/Subanon/Subanun 87.2 4.9 Teduray 84.9 4.8 Magbekin/Magbukon/Magbukun 94.9 4.8 Kirenteken 93.1 4.8 Bajao/Bajau 61.5 4.7 Karulano 87.1 4.7 Molbog 85.6 4.6 Mangguangan 87.9 4.6 Dibabawon 90.9 4.6 Obu-Manuvu/Ubo-Manobo 82.2 4.3 Banwaon 79.8 4.2 Pala’wan/Palawan-o 74.3 4.2 Talaingod 60.6 4.1 Agta 68.2 4.1 Magahats 82.2 4.0 Tagakaulo 81.9 3.9 Aeta/Ayta 72.0 3.8 Manobo-Blit 61.3 3.7 B’laan/Blaan 79.3 3.7
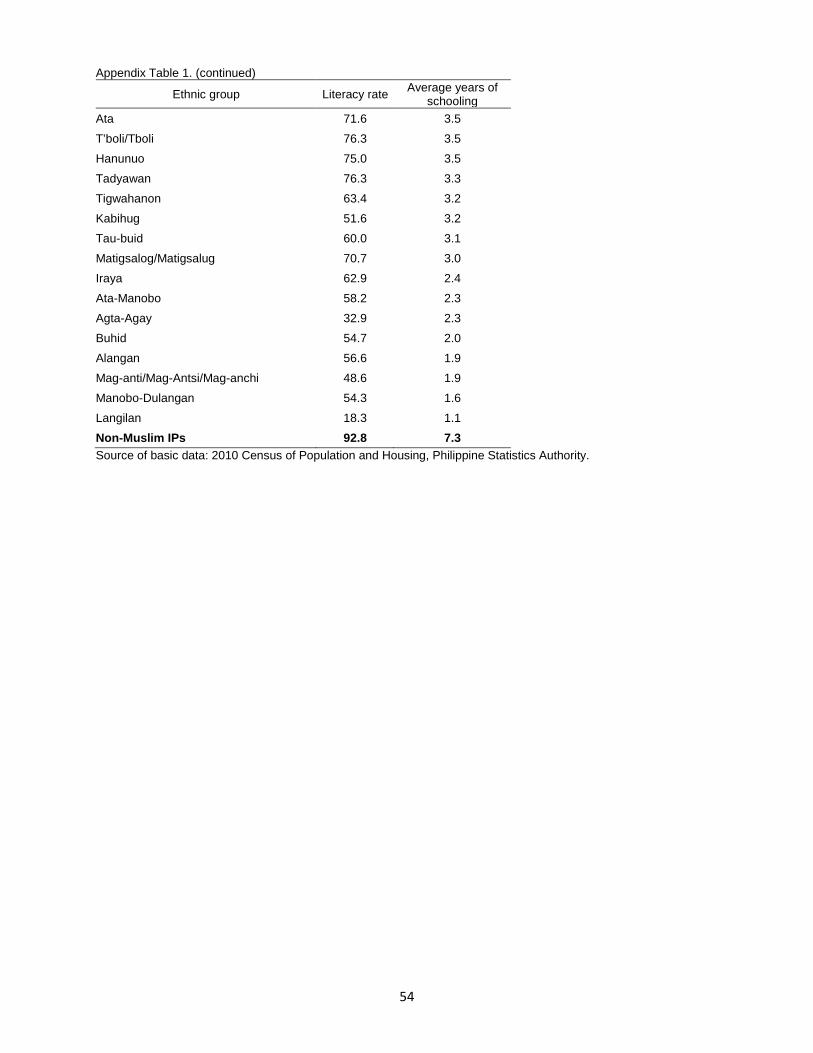
54
Appendix Table 1. (continued)
Ethnic group Literacy rate Average years of schooling
Ata 71.6 3.5 T’boli/Tboli 76.3 3.5 Hanunuo 75.0 3.5 Tadyawan 76.3 3.3 Tigwahanon 63.4 3.2 Kabihug 51.6 3.2 Tau-buid 60.0 3.1 Matigsalog/Matigsalug 70.7 3.0 Iraya 62.9 2.4 Ata-Manobo 58.2 2.3 Agta-Agay 32.9 2.3 Buhid 54.7 2.0 Alangan 56.6 1.9 Mag-anti/Mag-Antsi/Mag-anchi 48.6 1.9 Manobo-Dulangan 54.3 1.6 Langilan 18.3 1.1 Non-Muslim IPs 92.8 7.3 Source of basic data: 2010 Census of Population and Housing, Philippine Statistics Authority.
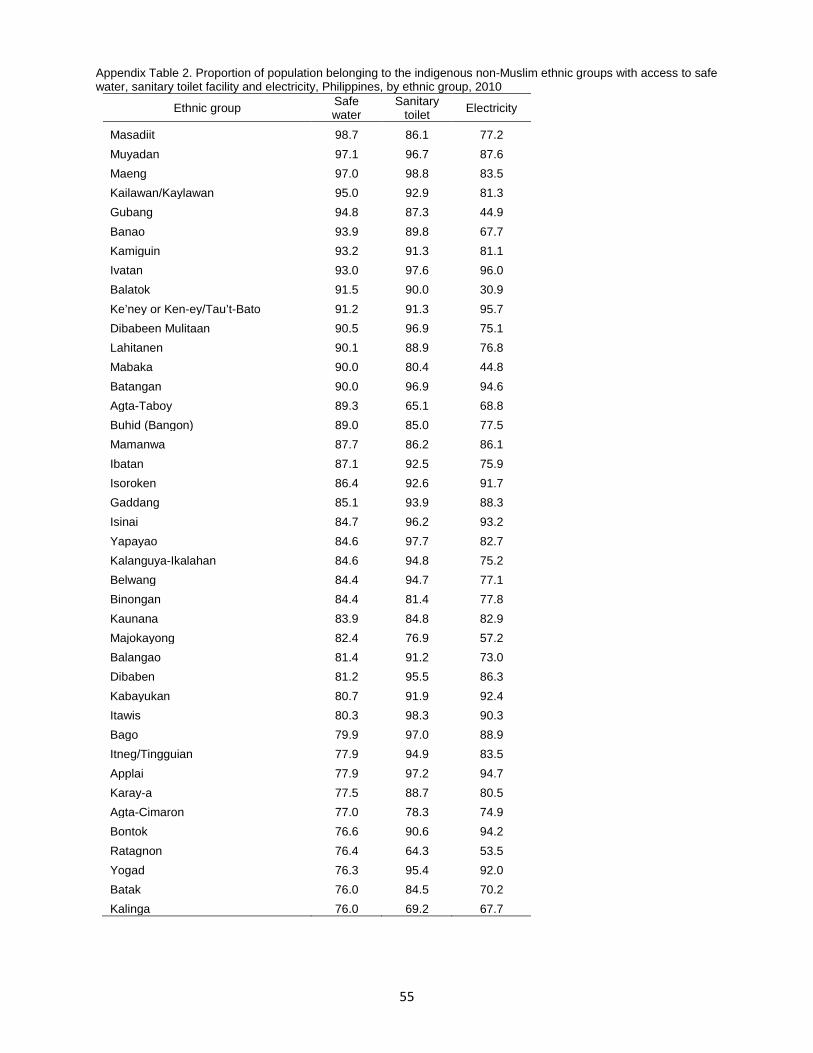
55
Appendix Table 2. Proportion of population belonging to the indigenous non-Muslim ethnic groups with access to safe water, sanitary toilet facility and electricity, Philippines, by ethnic group, 2010
Ethnic group Safe water
Sanitary toilet Electricity
Masadiit 98.7 86.1 77.2 Muyadan 97.1 96.7 87.6 Maeng 97.0 98.8 83.5 Kailawan/Kaylawan 95.0 92.9 81.3 Gubang 94.8 87.3 44.9 Banao 93.9 89.8 67.7 Kamiguin 93.2 91.3 81.1 Ivatan 93.0 97.6 96.0 Balatok 91.5 90.0 30.9 Ke’ney or Ken-ey/Tau’t-Bato 91.2 91.3 95.7 Dibabeen Mulitaan 90.5 96.9 75.1 Lahitanen 90.1 88.9 76.8 Mabaka 90.0 80.4 44.8 Batangan 90.0 96.9 94.6 Agta-Taboy 89.3 65.1 68.8 Buhid (Bangon) 89.0 85.0 77.5 Mamanwa 87.7 86.2 86.1 Ibatan 87.1 92.5 75.9 Isoroken 86.4 92.6 91.7 Gaddang 85.1 93.9 88.3 Isinai 84.7 96.2 93.2 Yapayao 84.6 97.7 82.7 Kalanguya-Ikalahan 84.6 94.8 75.2 Belwang 84.4 94.7 77.1 Binongan 84.4 81.4 77.8 Kaunana 83.9 84.8 82.9 Majokayong 82.4 76.9 57.2 Balangao 81.4 91.2 73.0 Dibaben 81.2 95.5 86.3 Kabayukan 80.7 91.9 92.4 Itawis 80.3 98.3 90.3 Bago 79.9 97.0 88.9 Itneg/Tingguian 77.9 94.9 83.5 Applai 77.9 97.2 94.7 Karay-a 77.5 88.7 80.5 Agta-Cimaron 77.0 78.3 74.9 Bontok 76.6 90.6 94.2 Ratagnon 76.4 64.3 53.5 Yogad 76.3 95.4 92.0 Batak 76.0 84.5 70.2 Kalinga 76.0 69.2 67.7
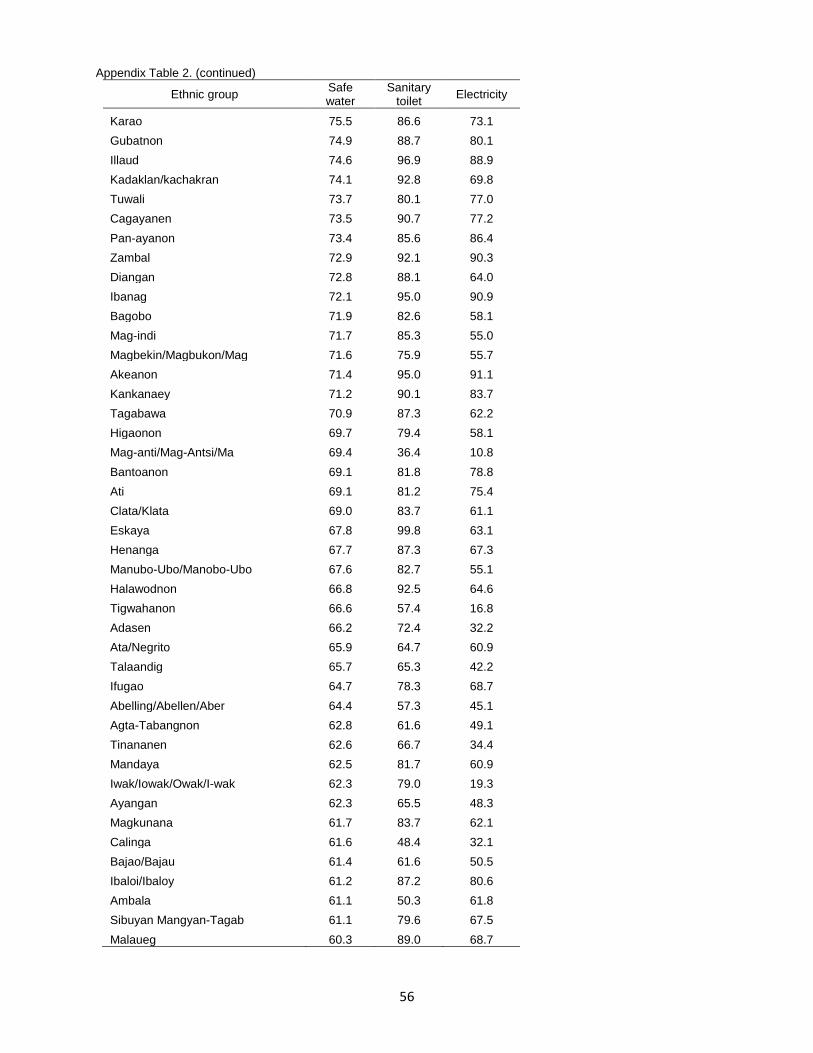
56
Appendix Table 2. (continued)
Ethnic group Safe water
Sanitary toilet Electricity
Karao 75.5 86.6 73.1 Gubatnon 74.9 88.7 80.1 Illaud 74.6 96.9 88.9 Kadaklan/kachakran 74.1 92.8 69.8 Tuwali 73.7 80.1 77.0 Cagayanen 73.5 90.7 77.2 Pan-ayanon 73.4 85.6 86.4 Zambal 72.9 92.1 90.3 Diangan 72.8 88.1 64.0 Ibanag 72.1 95.0 90.9 Bagobo 71.9 82.6 58.1 Mag-indi 71.7 85.3 55.0 Magbekin/Magbukon/Mag 71.6 75.9 55.7 Akeanon 71.4 95.0 91.1 Kankanaey 71.2 90.1 83.7 Tagabawa 70.9 87.3 62.2 Higaonon 69.7 79.4 58.1 Mag-anti/Mag-Antsi/Ma 69.4 36.4 10.8 Bantoanon 69.1 81.8 78.8 Ati 69.1 81.2 75.4 Clata/Klata 69.0 83.7 61.1 Eskaya 67.8 99.8 63.1 Henanga 67.7 87.3 67.3 Manubo-Ubo/Manobo-Ubo 67.6 82.7 55.1 Halawodnon 66.8 92.5 64.6 Tigwahanon 66.6 57.4 16.8 Adasen 66.2 72.4 32.2 Ata/Negrito 65.9 64.7 60.9 Talaandig 65.7 65.3 42.2 Ifugao 64.7 78.3 68.7 Abelling/Abellen/Aber 64.4 57.3 45.1 Agta-Tabangnon 62.8 61.6 49.1 Tinananen 62.6 66.7 34.4 Mandaya 62.5 81.7 60.9 Iwak/Iowak/Owak/I-wak 62.3 79.0 19.3 Ayangan 62.3 65.5 48.3 Magkunana 61.7 83.7 62.1 Calinga 61.6 48.4 32.1 Bajao/Bajau 61.4 61.6 50.5 Ibaloi/Ibaloy 61.2 87.2 80.6 Ambala 61.1 50.3 61.8 Sibuyan Mangyan-Tagab 61.1 79.6 67.5 Malaueg 60.3 89.0 68.7
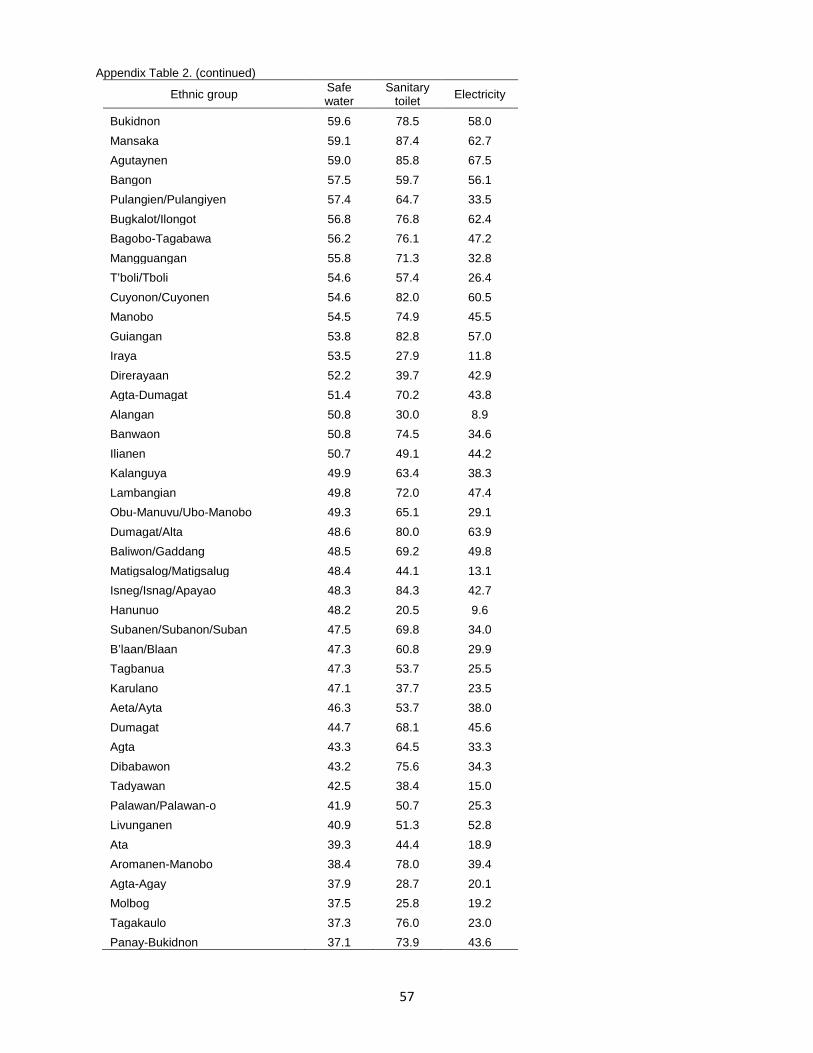
57
Appendix Table 2. (continued)
Ethnic group Safe water
Sanitary toilet Electricity
Bukidnon 59.6 78.5 58.0 Mansaka 59.1 87.4 62.7 Agutaynen 59.0 85.8 67.5 Bangon 57.5 59.7 56.1 Pulangien/Pulangiyen 57.4 64.7 33.5 Bugkalot/Ilongot 56.8 76.8 62.4 Bagobo-Tagabawa 56.2 76.1 47.2 Mangguangan 55.8 71.3 32.8 T’boli/Tboli 54.6 57.4 26.4 Cuyonon/Cuyonen 54.6 82.0 60.5 Manobo 54.5 74.9 45.5 Guiangan 53.8 82.8 57.0 Iraya 53.5 27.9 11.8 Direrayaan 52.2 39.7 42.9 Agta-Dumagat 51.4 70.2 43.8 Alangan 50.8 30.0 8.9 Banwaon 50.8 74.5 34.6 Ilianen 50.7 49.1 44.2 Kalanguya 49.9 63.4 38.3 Lambangian 49.8 72.0 47.4 Obu-Manuvu/Ubo-Manobo 49.3 65.1 29.1 Dumagat/Alta 48.6 80.0 63.9 Baliwon/Gaddang 48.5 69.2 49.8 Matigsalog/Matigsalug 48.4 44.1 13.1 Isneg/Isnag/Apayao 48.3 84.3 42.7 Hanunuo 48.2 20.5 9.6 Subanen/Subanon/Suban 47.5 69.8 34.0 B’laan/Blaan 47.3 60.8 29.9 Tagbanua 47.3 53.7 25.5 Karulano 47.1 37.7 23.5 Aeta/Ayta 46.3 53.7 38.0 Dumagat 44.7 68.1 45.6 Agta 43.3 64.5 33.3 Dibabawon 43.2 75.6 34.3 Tadyawan 42.5 38.4 15.0 Palawan/Palawan-o 41.9 50.7 25.3 Livunganen 40.9 51.3 52.8 Ata 39.3 44.4 18.9 Aromanen-Manobo 38.4 78.0 39.4 Agta-Agay 37.9 28.7 20.1 Molbog 37.5 25.8 19.2 Tagakaulo 37.3 76.0 23.0 Panay-Bukidnon 37.1 73.9 43.6
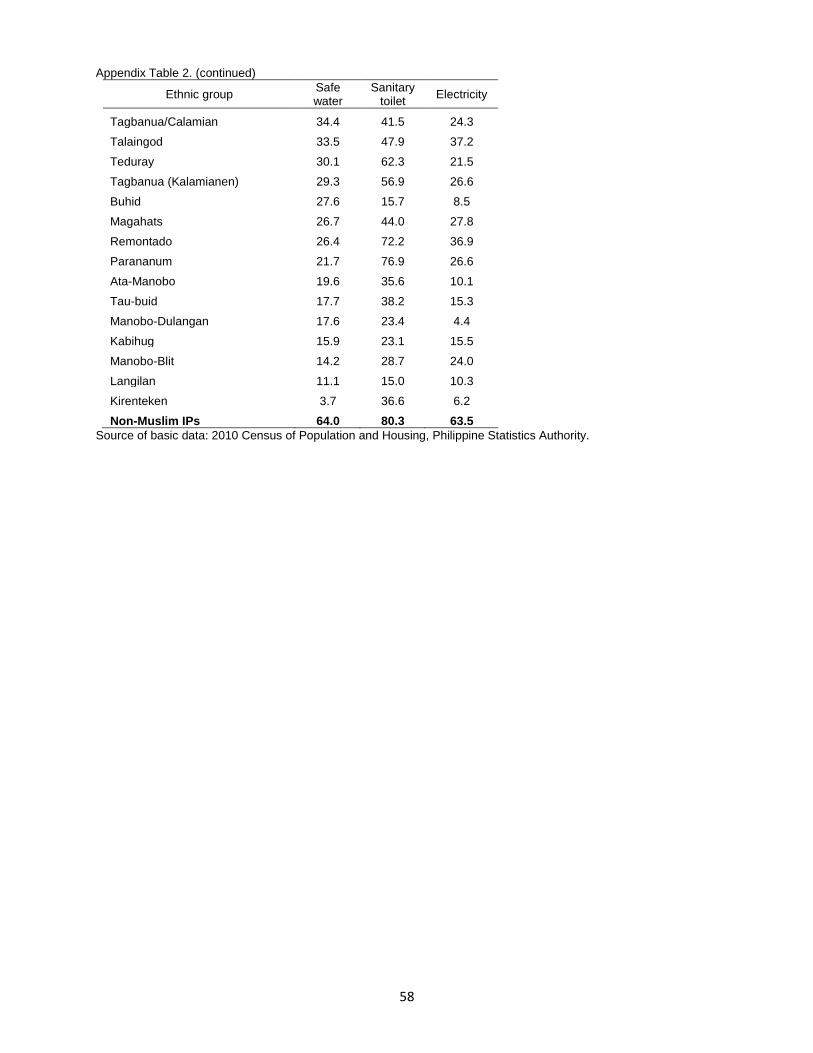
58
Appendix Table 2. (continued)
Ethnic group Safe water
Sanitary toilet Electricity
Tagbanua/Calamian 34.4 41.5 24.3 Talaingod 33.5 47.9 37.2 Teduray 30.1 62.3 21.5 Tagbanua (Kalamianen) 29.3 56.9 26.6 Buhid 27.6 15.7 8.5 Magahats 26.7 44.0 27.8 Remontado 26.4 72.2 36.9 Parananum 21.7 76.9 26.6 Ata-Manobo 19.6 35.6 10.1 Tau-buid 17.7 38.2 15.3 Manobo-Dulangan 17.6 23.4 4.4 Kabihug 15.9 23.1 15.5 Manobo-Blit 14.2 28.7 24.0 Langilan 11.1 15.0 10.3 Kirenteken 3.7 36.6 6.2 Non-Muslim IPs 64.0 80.3 63.5
Source of basic data: 2010 Census of Population and Housing, Philippine Statistics Authority.
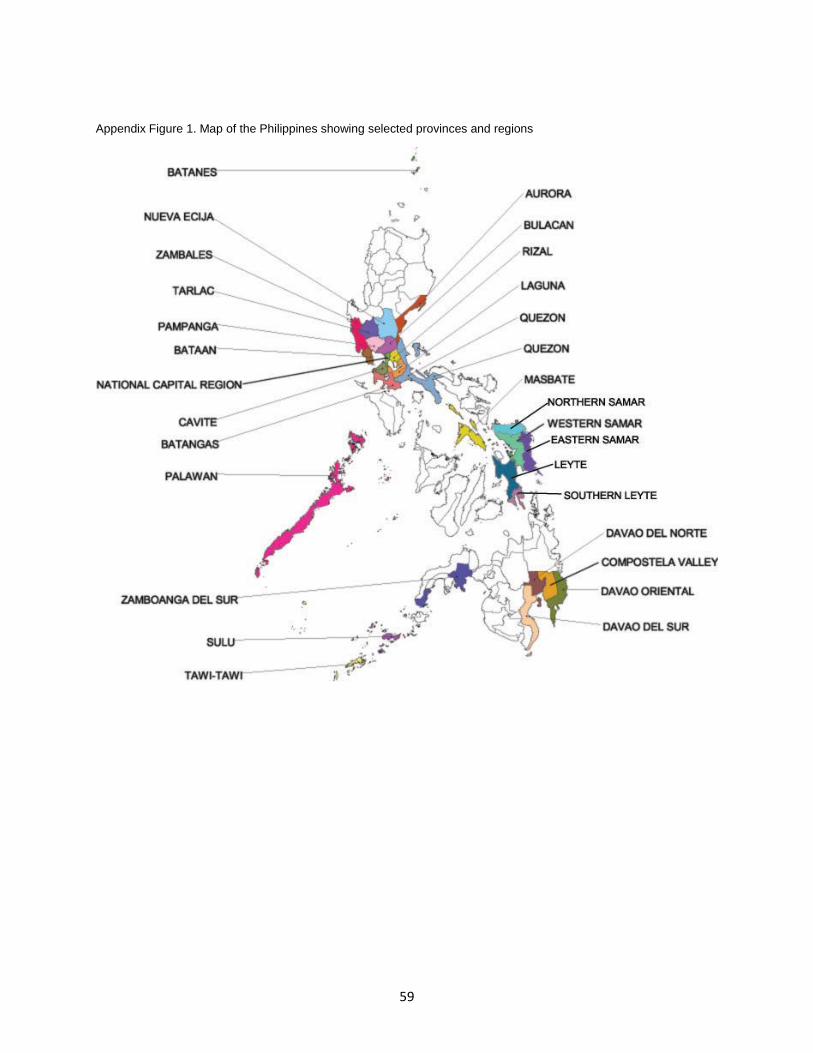
59
Appendix Figure 1. Map of the Philippines showing selected provinces and regions
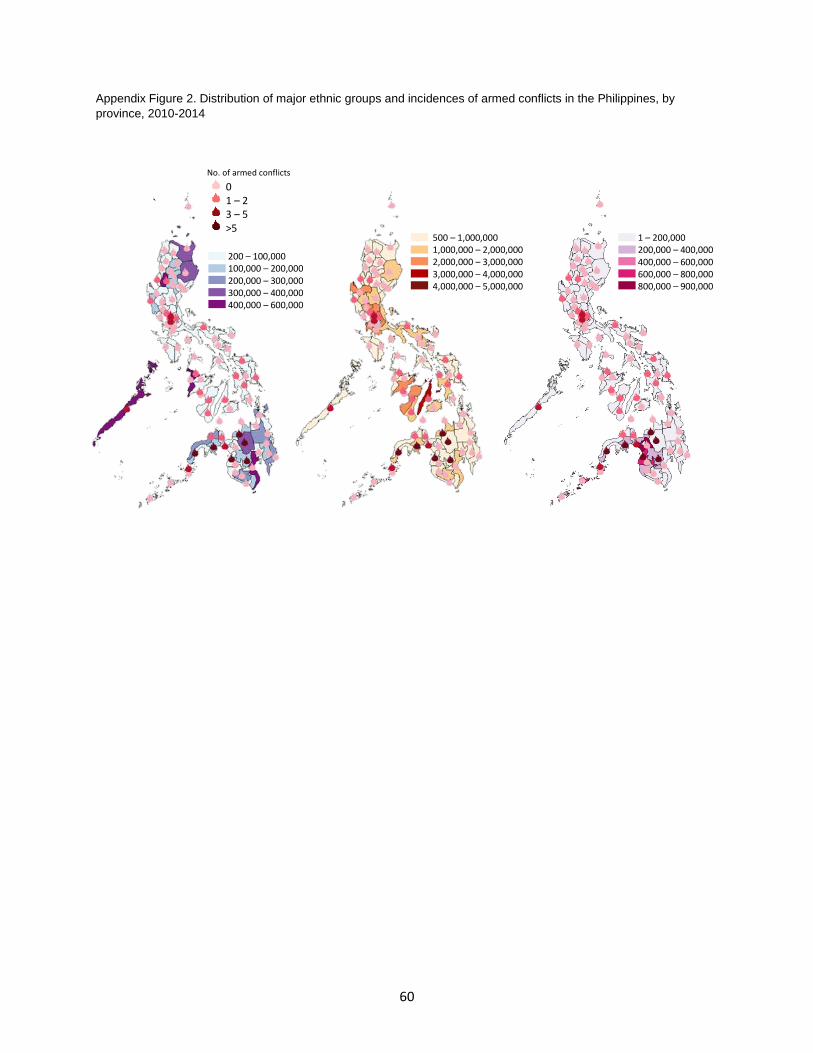
60
Appendix Figure 2. Distribution of major ethnic groups and incidences of armed conflicts in the Philippines, by province, 2010-2014
`
200 – 100,000 100,000 – 200,000200,000 – 300,000300,000 – 400,000400,000 – 600,000
0 1 – 23 – 5>5
No. of armed conflicts
500 – 1,000,000 1,000,000 – 2,000,000 2,000,000 – 3,000,000 3,000,000 – 4,000,000 4,000,000 – 5,000,000
1 – 200,000 200,000 – 400,000400,000 – 600,000600,000 – 800,000800,000 – 900,000

61
Appendix Figure 3. Distribution of primary schools and major ethnic groups in the Philippines, by province, 2009
1 – 300 300 – 600 600 – 900 900 – 1,300
No. of primary schools
500 – 1,000,000 1,000,000 – 2,000,000 2,000,000 – 3,000,000 3,000,000 – 4,000,000 4,000,000 – 5,000,000
1 – 200,000 200,000 – 400,000400,000 – 600,000600,000 – 800,000800,000 – 900,000
200 – 100,000 100,000 – 200,000200,000 – 300,000300,000 – 400,000400,000 – 600,000
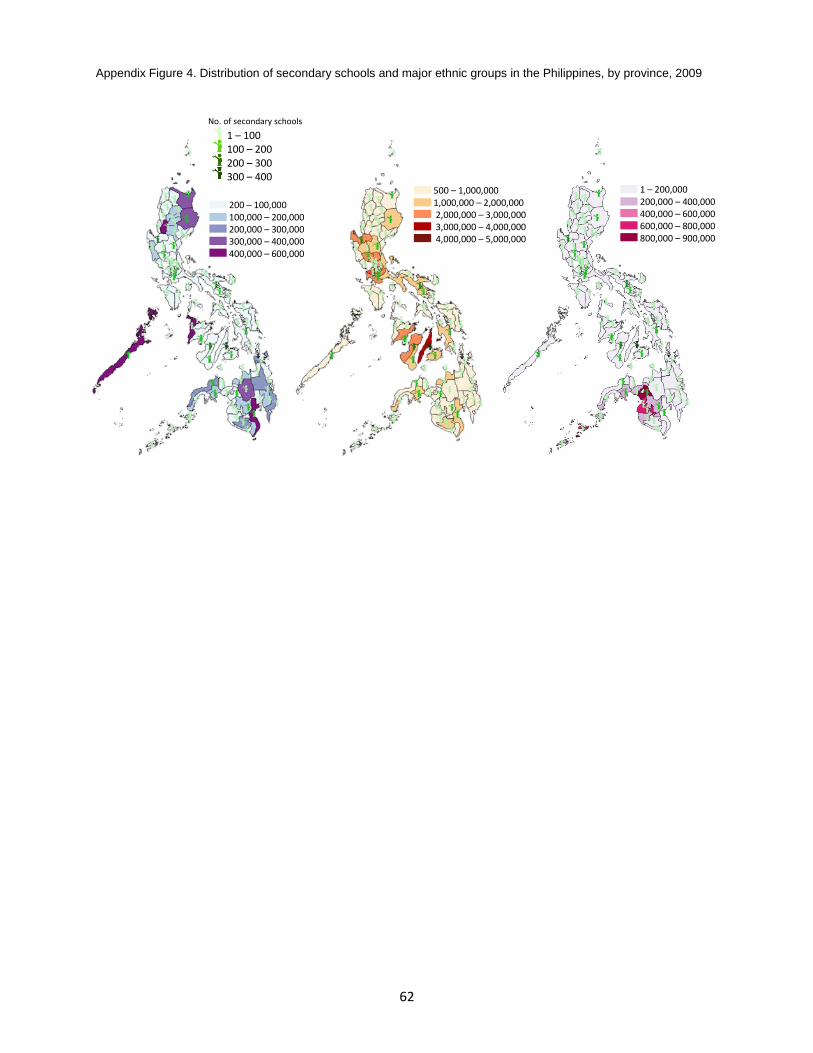
62
Appendix Figure 4. Distribution of secondary schools and major ethnic groups in the Philippines, by province, 2009
200 – 100,000 100,000 – 200,000200,000 – 300,000300,000 – 400,000400,000 – 600,000
1 – 100 100 – 200200 – 300300 – 400
No. of secondary schools
500 – 1,000,000 1,000,000 – 2,000,000 2,000,000 – 3,000,000 3,000,000 – 4,000,000 4,000,000 – 5,000,000
1 – 200,000 200,000 – 400,000400,000 – 600,000600,000 – 800,000800,000 – 900,000

63
Appendix Figure 5. Distribution of tertiary schools and major ethnic groups in the Philippines, by province, 2009
200 – 100,000 100,000 – 200,000200,000 – 300,000300,000 – 400,000400,000 – 600,000
0 1 – 23 – 5>5
No. of tertiary schools
500 – 1,000,000 1,000,000 – 2,000,000 2,000,000 – 3,000,000 3,000,000 – 4,000,000 4,000,000 – 5,000,000
1 – 200,000 200,000 – 400,000400,000 – 600,000600,000 – 800,000800,000 – 900,000
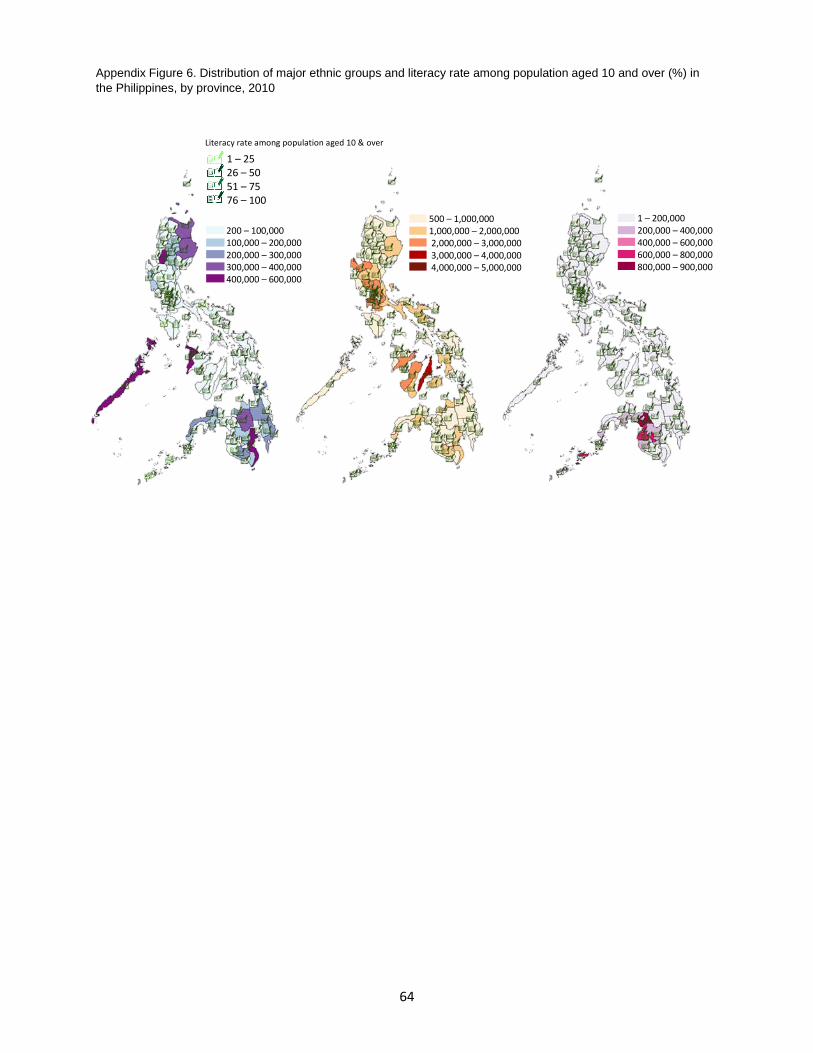
64
Appendix Figure 6. Distribution of major ethnic groups and literacy rate among population aged 10 and over (%) in the Philippines, by province, 2010
200 – 100,000 100,000 – 200,000 200,000 – 300,000 300,000 – 400,000 400,000 – 600,000
1 – 25 26 – 50 51 – 75 76 – 100
Literacy rate among population aged 10 & over
500 – 1,000,000 1,000,000 – 2,000,000 2,000,000 – 3,000,000 3,000,000 – 4,000,000 4,000,000 – 5,000,000
1 – 200,000 200,000 – 400,000 400,000 – 600,000 600,000 – 800,000 800,000 – 900,000

65
Appendix Figure 7. Distribution of population with access to safe water and major ethnic groups in the Philippines, by province, 2010
500 – 1,000,000 1,000,000 – 2,000,000 2,000,000 – 3,000,000 3,000,000 – 4,000,000 4,000,000 – 5,000,000
200 – 100,000 100,000 – 200,000 200,000 – 300,000 300,000 – 400,000 400,000 – 600,000
1 – 25 26 – 50 51 – 75 76 – 100
Magnitude population with access to safe water
1 – 200,000 200,000 – 400,000 400,000 – 600,000 600,000 – 800,000 800,000 – 900,000
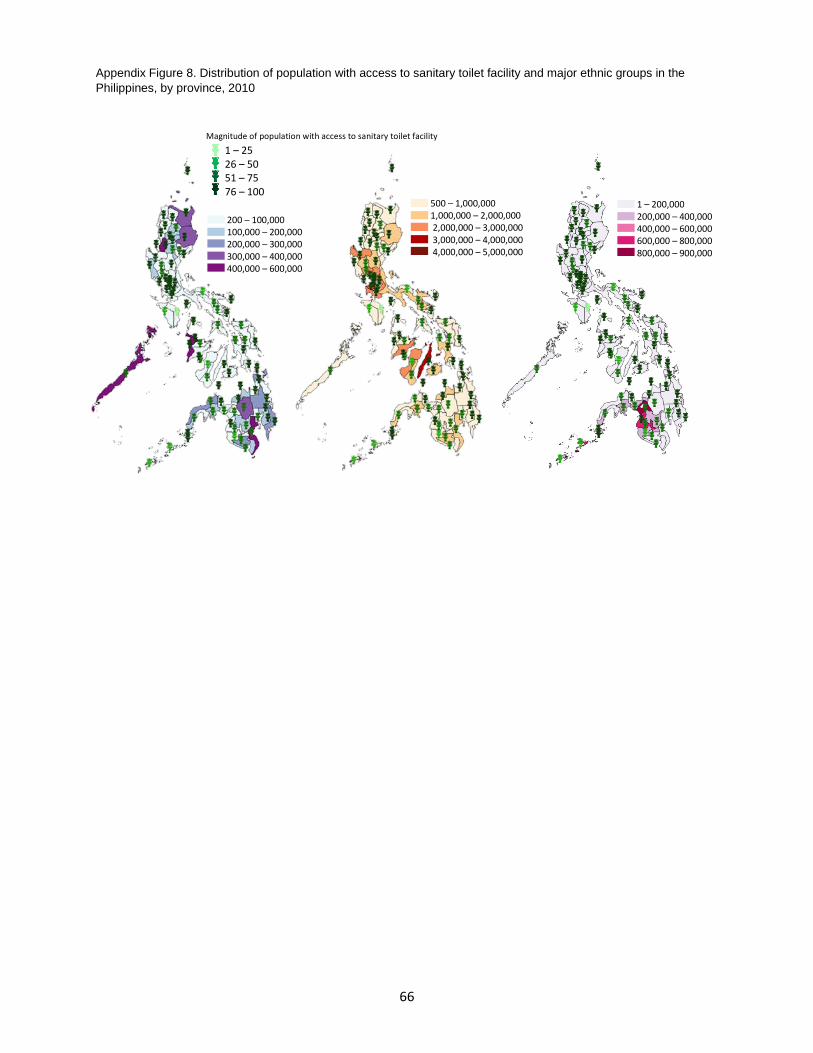
66
Appendix Figure 8. Distribution of population with access to sanitary toilet facility and major ethnic groups in the Philippines, by province, 2010
200 – 100,000 100,000 – 200,000 200,000 – 300,000 300,000 – 400,000 400,000 – 600,000
1 – 25 26 – 50 51 – 75 76 – 100
Magnitude of population with access to sanitary toilet facility
500 – 1,000,000 1,000,000 – 2,000,000 2,000,000 – 3,000,000 3,000,000 – 4,000,000 4,000,000 – 5,000,000
1 – 200,000 200,000 – 400,000 400,000 – 600,000 600,000 – 800,000 800,000 – 900,000
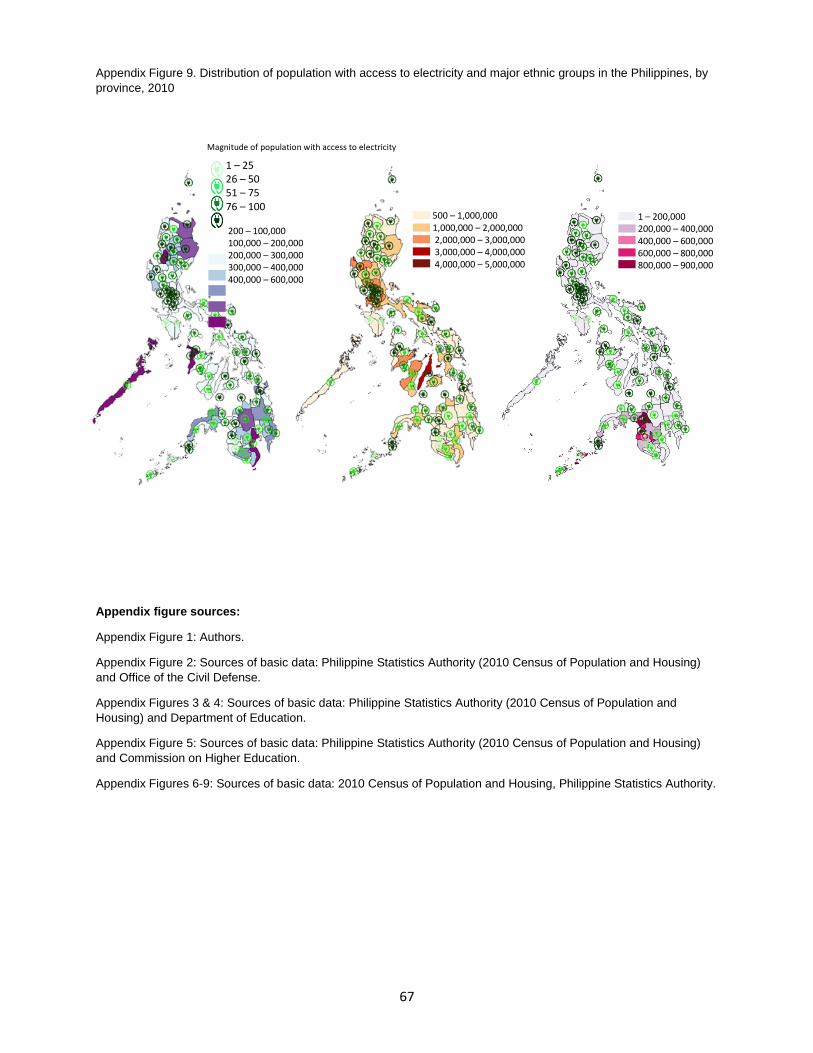
67
Appendix Figure 9. Distribution of population with access to electricity and major ethnic groups in the Philippines, by province, 2010
Appendix figure sources:
Appendix Figure 1: Authors.
Appendix Figure 2: Sources of basic data: Philippine Statistics Authority (2010 Census of Population and Housing) and Office of the Civil Defense.
Appendix Figures 3 & 4: Sources of basic data: Philippine Statistics Authority (2010 Census of Population and Housing) and Department of Education.
Appendix Figure 5: Sources of basic data: Philippine Statistics Authority (2010 Census of Population and Housing) and Commission on Higher Education.
Appendix Figures 6-9: Sources of basic data: 2010 Census of Population and Housing, Philippine Statistics Authority.
200 – 100,000 100,000 – 200,000 200,000 – 300,000 300,000 – 400,000 400,000 – 600,000
1 – 25 26 – 50 51 – 75 76 – 100
Magnitude of population with access to electricity
1 – 200,000 200,000 – 400,000 400,000 – 600,000 600,000 – 800,000 800,000 – 900,000
500 – 1,000,000 1,000,000 – 2,000,000 2,000,000 – 3,000,000 3,000,000 – 4,000,000 4,000,000 – 5,000,000