The Elephant Curve of Global Inequality and Growthsaez/ACPSZ2018AER_Slides.pdf · The Elephant...
27
The Elephant Curve of Global Inequality and Growth Facundo Alvaredo (Paris School of Economics) Lucas Chancel (Paris School of Economics) Thomas Piketty (Paris School of Economics) Emmanuel Saez (UC Berkeley) Gabriel Zucman (UC Berkeley) January 2018 AEA Meetings 1
Transcript of The Elephant Curve of Global Inequality and Growthsaez/ACPSZ2018AER_Slides.pdf · The Elephant...

The Elephant Curve of
Global Inequality and Growth
Facundo Alvaredo (Paris School of Economics)
Lucas Chancel (Paris School of Economics)
Thomas Piketty (Paris School of Economics)
Emmanuel Saez (UC Berkeley)
Gabriel Zucman (UC Berkeley)
January 2018 AEA Meetings
1

WORLDWIDE INCOME INEQUALITY
Income inequality is growing within most countries
But large emerging countries (China, India) are catching upwith advanced economies
Is global income inequality increasing or decreasing?
Hard question to answer due
a) lack of comparable data across countries
b) difficulty of measuring top incomes in surveys
In this paper, we use new consistent data from World Inequal-ity Database (WID) to generate world inequality estimatessince 1980
2

WORLD INEQUALITY DATABASE
WID.world is the most extensive database on the historical
evolution of income and wealth distribution (100+ researchers)
100% transparent, open source, reproducible
Website started in 2011 with historical top income share series
using tax data
New WID.world website launched 1/2017.
3


WID.WORLD KEY NOVELTIES
(a) We cover full distribution (not just the top), we use indi-
vidual adult unit (with equal split of income among couples)
(b) We distribute total National Income (not just fiscal in-
come) ⇒ Brings together analysis of growth and inequality
(c) Emerging countries added (China, India, Brazil, Russia)
(d) Constantly expanding database on the historical evolution
of income and wealth with global coverage goal
(e) Open access, multi-lingual website and visualization tools
(f) Stata and R packages: access our data from Stata com-
mand “wid”5

Top 10% income shares across the world, 2016
0%
10%
20%
30%
40%
50%
60%
70%
37%41%
46% 47%
54% 55% 55%
61%
Middle EastIndiaBrazilSub-Saharan
Africa
US-CanadaRussiaChinaEurope
In 2016, 37% of national income was received by the Top 10% in Europe against 61% in the Middle-East.
Source: WID.world (2017). See wir2018.wid.world for data series and notes.
Sh
are
of
nat
ion
al in
com
e (%
)
37%41%
46% 47%
54% 55% 55%
61%

Top 10% income shares across the world, 1980‒2016
In 2016, 47% of national income was received by the top 10% in US-Canada, compared to 34% in 1980.
Source: WID.world (2017). See wir2018.wid.world for data series and notes.
Russia
China
India
US-Canada
Europe
Sh
are
of
nat
ion
al in
com
e (%
)
20%
30%
40%
50%
60%
20152010200520001995199019851980

Top 10% income shares across the world, 1980‒2016
In 2016, 55% of national income was received by the Top 10% in India, against 31% in 1980.
Source: WID.world (2017). See wir2018.wid.world for data series and notes.
Sh
are
of
nat
ion
al in
com
e (%
)
20%
30%
40%
50%
60%
70%
20152010200520001995199019851980
China
Middle East
Sub-Saharan
Africa
India
Russia
US-Canada
Europe
Brazil

Top 1% income shares across the world, 1980-2016
In 2016, 14% of national income was received by the Top 1% in China.
Source: WID.world (2017). See wir2018.wid.world for data series and notes.
Sh
are
of
nat
ion
al in
com
e (%
)
0%
5%
10%
15%
20%
25%
30%
35%
20152010200520001995199019851980
China
Middle East
Sub-Saharan Africa
India
Russia
US-Canada
Europe
Brazil
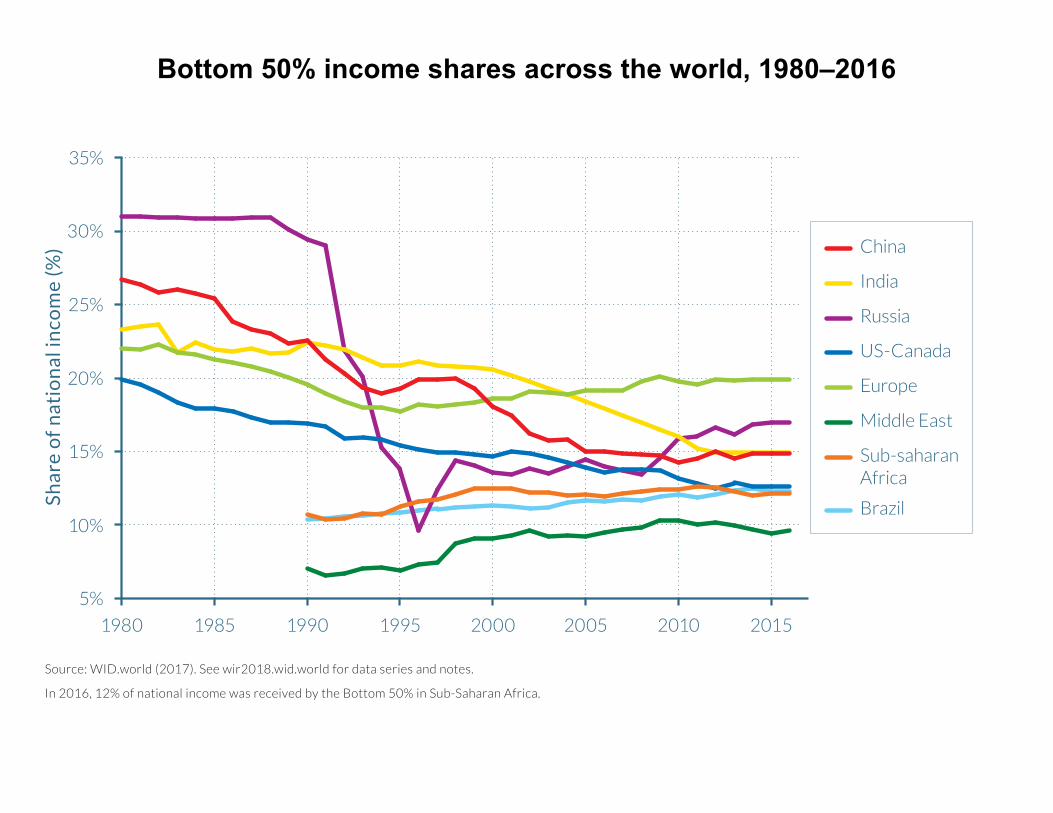
Bottom 50% income shares across the world, 1980‒2016
In 2016, 12% of national income was received by the Bottom 50% in Sub-Saharan Africa.
Source: WID.world (2017). See wir2018.wid.world for data series and notes.
China
Middle East
Brazil
Sub-saharanAfrica
India
Russia
US-Canada
Europe
Sh
are
of
nat
ion
al in
com
e (%
)
5%
10%
15%
20%
25%
30%
35%
20152010200520001995199019851980

Global income growth and inequality, 1980‒2016
Table 2.1.1
Global income growth and inequality, 1980–2016
Total cumulative real growth per adult
Income group China Europe India Russia US-Canada World
Full Population 831% 40% 223% 34% 63% 60%
Bottom 50% 417% 26% 107% -26% 5% 94%
Middle 40% 785% 34% 112% 5% 44% 43%
Top 10% 1 316% 58% 469% 190% 123% 70%
Top 1% 1 920% 72% 857% 686% 206% 101%
Top 0.1% 2 421% 76% 1 295% 2 562% 320% 133%
Top 0.01% 3 112% 87% 2 078% 8 239% 452% 185%
Top 0.001% 3 752% 120% 3 083% 25 269% 629% 235%
Source: WID.world (2017). See wir2018.wid.world for data series and notes.
From 1980 to 2016, the average income of the Bottom 50% in China grew 417%. Income estimates are calculated using 2016 Purchasing Power Parity (PPP)
euros. PPP accounts for differences in the cost of living between countries. Values are net of inflation.
Table 2.1.2
Share of global growth captured by income groups, 1980–2016
Income group China Europe India Russia US-Canada World
Full Population 100% 100% 100% 100% 100% 100%
Bottom 50% 13% 14% 11% -24% 2% 12%
Middle 40% 43% 38% 23% 7% 32% 31%
Top 10% 43% 48% 66% 117% 67% 57%
Top 1% 15% 18% 28% 69% 35% 27%
Top 0.1% 7% 7% 12% 41% 18% 13%
Top 0.01% 4% 3% 5% 20% 9% 7%
Top 0.001% 2% 1% 3% 10% 4% 4%
Source: WID.world (2017). See wir2018.wid.world for data series and notes.
From 1980 to 2016, the Middle 40% in Europe captured 38% of total income growth in the region. Income estimates are calculated using 2016 Purchasing
Power Parity (PPP) euros. PPP accounts for differences in the cost of living between countries. Values are net of inflation.

Share of growth captured by income groups, 1980‒2016
Table 2.1.1
Global income growth and inequality, 1980–2016
Total cumulative real growth per adult
Income group China Europe India Russia US-Canada World
Full Population 831% 40% 223% 34% 63% 60%
Bottom 50% 417% 26% 107% -26% 5% 94%
Middle 40% 785% 34% 112% 5% 44% 43%
Top 10% 1 316% 58% 469% 190% 123% 70%
Top 1% 1 920% 72% 857% 686% 206% 101%
Top 0.1% 2 421% 76% 1 295% 2 562% 320% 133%
Top 0.01% 3 112% 87% 2 078% 8 239% 452% 185%
Top 0.001% 3 752% 120% 3 083% 25 269% 629% 235%
Source: WID.world (2017). See wir2018.wid.world for data series and notes.
From 1980 to 2016, the average income of the Bottom 50% in China grew 417%. Income estimates are calculated using 2016 Purchasing Power Parity (PPP)
euros. PPP accounts for differences in the cost of living between countries. Values are net of inflation.
Table 2.1.2
Share of global growth captured by income groups, 1980–2016
Income group China Europe India Russia US-Canada World
Full Population 100% 100% 100% 100% 100% 100%
Bottom 50% 13% 14% 11% -24% 2% 12%
Middle 40% 43% 38% 23% 7% 32% 31%
Top 10% 43% 48% 66% 117% 67% 57%
Top 1% 15% 18% 28% 69% 35% 27%
Top 0.1% 7% 7% 12% 41% 18% 13%
Top 0.01% 4% 3% 5% 20% 9% 7%
Top 0.001% 2% 1% 3% 10% 4% 4%
Source: WID.world (2017). See wir2018.wid.world for data series and notes.
From 1980 to 2016, the Middle 40% in Europe captured 38% of total income growth in the region. Income estimates are calculated using 2016 Purchasing
Power Parity (PPP) euros. PPP accounts for differences in the cost of living between countries. Values are net of inflation.

KEY RESULTS
Inequality is increasing everywhere but at different speeds
In rich countries, US inequality increases much faster than in
Europe (contrast US vs. France)
Inequality shifts clearly follow policy changes (Reagan in US,
transitions in China/Russia, deregulation in India)
⇒ Globalization and technological progress cannot explain fully
pre-tax incomne inequality: Institutions and policies matter
None of large emerging countries studied meets new Sustain-
able Development Goal target of bottom 40% growing faster
than average
7
0%5%
10%
15%
20%
25%
Inco
me
Shar
e
1980 1985 1990 1995 2000 2005 2010 2015
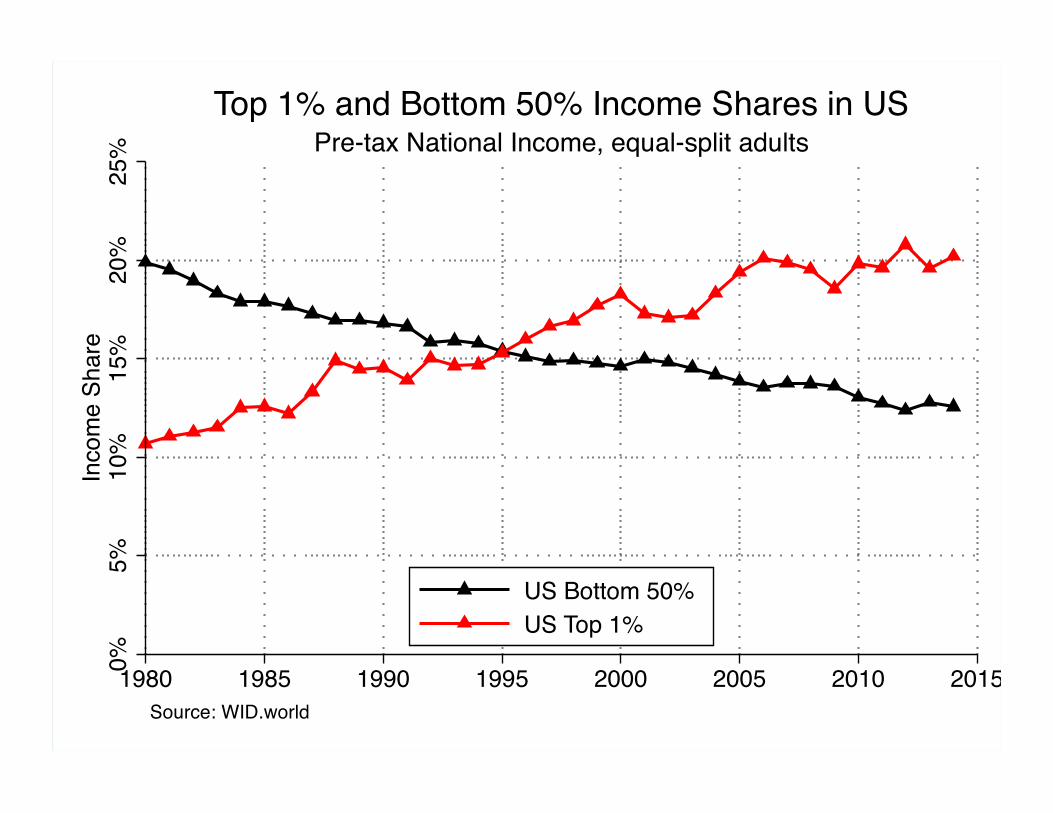
US Bottom 50%US Top 1%
Source: WID.world
Pre-tax National Income, equal-split adultsTop 1% and Bottom 50% Income Shares in US

0%5%
10%
15%
20%
25%
Inco
me
Shar
e
1980 1985 1990 1995 2000 2005 2010 2015
US Bottom 50%US Top 1%France Bottom 50%France Top 1%
Source: WID.world
Pre-tax National Income, equal-split adultsTop 1% and Bottom 50% Income Shares in US and France

WORLD INEQUALITY ESTIMATES
We follow a step-by-step approach towards a consistent globaldistribution of income and wealth
1) We start with countries for which we have DistributionalNational Income series (2/3 of the world population)
2) For other countries, we use information on average nationalincome per adult and assume distribution within country is thesame as other countries in same region
E.g.: we assume that national income in Argentina, Mexico,etc. is distributed as in Brazil
3) For sub-Saharan Africa, we use World Bank surveys withcorrection at the top using fiscal data and National Accounts
4) We pool country distributions using PPP exchange rates(not market exchange rates)
10

Total income growth by percentile in US-Canada and Western Europe, 1980-2016
On the horizontal axis, the world population is divided into a hundred groups of equal population size and sorted in ascending order from left to right, according to each group's income level. The Top 1% group is divided into ten groups, the richest of these groups is also divided into ten groups, and the very top group is again divided into ten groups of equal population size. The vertical axis shows the total income growth of an average individual in each group between 1980 and 2016. For percentile group p99p99.1 (the poorest 10% among the world's richest 1%) growth was 104% between 1980 and 2016. The Top 1% captured 28% of total growth over this period. Income estimates account for differences in the cost of living between countries. Values are net of inflation.
Source: WID.world (2017). See wir2018.wid.world for data series and notes.
0%
100%
200%
300%
400%
500
99.99999.9999.999908070605040302010
Re
al in
com
e gr
ow
th p
er
adu
lt (%
)
Income group (percentile)
Bottom 50% captured 9%
of total growth
Top 1% captured 28% of total growth

Total income growth by percentile in China, India, US-Canada, and Western Europe
On the horizontal axis, the world population is divided into a hundred groups of equal population size and sorted in ascending order from left to right, according to each group's income level. The Top 1% group is divided into ten groups, the richest of these groups is also divided into ten groups, and the very top group is again divided into ten groups of equal population size. The vertical axis shows the total income growth of an average individual in each group between 1980 and 2016. For percentile group p99p99.1 (the poorest 10% among the world's richest 1%), growth was 77% between 1980 and 2016. The Top 1% captured 23% of total growth over this period. Income estimates account for differences in the cost of living between countries. Values are net of inflation.
Source: WID.world (2017). See wir2018.wid.world for data series and notes.
0%
100%
200%
300%
400%
500
99.99999.9999.999908070605040302010
Re
al in
com
e gr
ow
th p
er
adu
lt (%
)
Income group (percentile)
Bottom 50% captured 14% of total growth
Top 1% captured 23% of total growth

Total income growth by percentile across all world regions, 1980-2016
On the horizontal axis, the world population is divided into a hundred groups of equal population size and sorted in ascending order from left to right, according to each group's income level. The Top 1% group is divided into ten groups, the richest of these groups is also divided into ten groups, and the very top group is again divided into ten groups of equal population size. The vertical axis shows the total income growth of an average individual in each group between 1980 and 2016. For percentile group p99p99.1 (the poorest 10% among the world's richest 1%), growth was 74% between 1980 and 2016. The Top 1% captured 27% of total growth over this period. Income estimates account for differences in the cost of living between countries. Values are net of inflation.
Source: WID.world (2017). See wir2018.wid.world for more details.
0%
50%
100%
150%
200%
250%
99.99999.9999.999908070605040302010
Re
al in
com
e gr
ow
th p
er
adu
lt (%
)
Income group (percentile)
Squeezed bottom 90% in the US & Western Europe
Rise of emerging countries
Prosperity of the global 1%
Bottom 50% captured 12% of total growth
Top 1% captured 27% of total growth

Global top 1% and bottom 50% income shares, 1980‒2016
5%
10%
15%
20%
25%
20152010200520001995199019851980
Sh
are
of
glo
bal
inco
me
(%)
In 2016, 22% of global income was received by the Top 1% against 10% for the Bottom 50%. In 1980, 16% of global income was received by the Top 1% against 8% for the Bottom 50%.
Global Top 1%
Global Bottom 50%
Source: WID.world (2017). See wir2018.wid.world for data series and notes.

Global top 1% and bottom 50% income shares: PPP versus market exchange rates
0%
5%
10%
15%
20%
25%
30%
20152010200520001995199019851980
S
har
e o
f gl
ob
al in
com
e (%
)
In 2010, the Top 1% received 24% of global income when measured using Market Exchange Rates (MER). When measured using Purchasing Power Parity (PPP), their share was 21%. Thick lines are measured at PPP values, dashed lines at MER values. Income estimates account for differences in the cost of living between countries. Values are net of inflation.
Global Top 1%
Global Bottom 50%
Purchasing Power Parity
MarketExchange Rate
Source: WID.world (2017). See wir2018.wid.world for data series and notes.

Global top 10% income share: between versus within-country inequality
25%
30%
35%
40%
45%
50%
55%
60%
20152010200520001995199019851980
S
har
e o
f gl
ob
al in
com
e (%
)
In 2010, 53% of the world's income was received by the Top 10%. Assuming perfect equality in average income between countries, the Top 10% would have received 48% of global income.
Global Top 10% share
Global Top 10% share assuming …
… perfect equalitybetween countries
… perfect equalitywithin countries
Source: WID.world (2017). See wir2018.wid.world for data series and notes.

GLOBAL INEQUALITY PROJECTIONS
(a) Growth: UN and OECD produce long-term populationand economic growth forecasts
(b) Distribution: We assume that economic growth per adultfrom 2015-2050 will be distributed across percentiles as in1980-2015: “business as usual” scenario (1)
⇒ Can simulate dynamics of global inequality and growth
We consider two alternative scenarios:
(2) Very unequal growth in every country as the US 1980-2015
(3) Pretty equal growth in every country as the EU 1980-2015
⇒ Inequality has a huge long-term impact on future incomesof bottom 50%
13

Top 1% and bottom 50% shares of global income, 1980–2050
S
har
e o
f gl
ob
al in
com
e (%
)
If all countries follow the inequality trajectory of the US between 1980 and 2016 from 2017 to 2050, the income share of the global Top 1% will reach 28% by 2050. Income share estimates are calculated using Purchasing Power Parity (PPP) euros. PPP accounts for differences in the cost of living between countries. Values are net of inflation.
Source: WID.world (2017). See wir2018.wid.world for data series and notes.
… all countries follow US’s1980–2016 inequality
trend = scenario 2
… all countries follow theirown 1980–2016 inequality
trend = scenario 1
… all countries follow EU1980–2016 inequality
trend = scenario 3
scenario 3
scenario 1
scenario 2
0%
5%
10%
15%
20%
25%
30%
2010200019901980 2050204020302020
Global inequality assuming …
Global Top 1%income share
Global Bottom 50% income share

Global average income versus global 50% average, 1980–2050
An
nu
al in
com
e p
er
adu
lt (€
)
By 2050, the global average income will reach €35 500, compared to €16 000 in 2016. If all countries follow Europe's inequality trajectory between 1980 and 2016, the average income of the Bottom 50% of the world population will be €9 100 by 2050. Income estimates are calculated using Purchasing Power Parity (PPP) euros. For comparison, €1 = $1.3 = ¥4.4 at PPP. PPP accounts for differences in the cost of living between countries. Values account for inflation.
Source: WID.world (2017). See wir2018.wid.world for data series and notes.
€0
€5 000
€10 000
€15 000
€20 000
€25 000
€30 000
€35 000
20502040203020202010200019901980
… any of the scenarios
listed below
… all countries followEU 1980–2016inequality trend
Average income assuming …
… all countries followUS 1980-2016
inequality trend
… all countries prolonge their own 1980–2016
inequality trend
€16 000
€3 100
€9 900
€1 600 €4 500
€6 300
€9 100
€35 500
Bottom 50% average income
Global average income

Global bottom 50% average income, 1980–2050
An
nu
al in
com
e p
er
adu
lt (€
)
If all countries follow the inequality trajectory of Europe between 1980 and 2016, the average income of the Bottom 50% of the world population will be €9 100 by 2050. Income estimates are calculated using Purchasing Power Parity (PPP) euros. For comparison, €1 = $1.3 = ¥4.4 at PPP. PPP accounts for differences in the cost of living between countries. Values are net of inflation.
Source: WID.world (2017). See wir2018.wid.world for data series and notes.
€0
€2 000
€4 000
€6 000
€8 000
€10 000
20502040203020202010200019901980
… all countries followEU 1980–2016inequality trend
Average income assuming …
… all countries followUS 1980-2016
inequality trend
… all countries prolonge their own 1980–2016
inequality trend
Bottom 50% average income
€3 100
€1 600
€9 100
€6 300
€4 500

CONCLUSIONS
WID.world aims at constructing systematic series on inequality
in all countries for research and policy debate use
Our preliminary estimates show that global top 1% captured
twice as much growth as bottom 50% since 1980
Under Business as usual and even with optimistic growth as-
sumptions in the emerging world, global inequality will con-
tinue to rise
Rising inequality is not inevitable: policies can promote equi-
table growth pathways in the coming decades
15


![Does the Lorenz Curve Really Measure Inequality? Another ... 26 may/PAPER_Chateauneuf... · Does the Lorenz Curve Really Measure Inequality? Another Look at Inequality Measurement]](https://static.fdocuments.us/doc/165x107/5a9da3a67f8b9a42488bca02/does-the-lorenz-curve-really-measure-inequality-another-26-maypaperchateauneufdoes.jpg)