The Electrostatic Environment of Mars: Atmospheric Discharges … · The Electrostatic Environment...
26
NASA Kennedy Space Center The Electrostatic Environment of Mars: Atmospheric Discharges Carlos I. Calle, Ph.D. NASA Kennedy Space Center Team: Paul J. Mackey Michael R. Johansen Michael D. Hogue, Ph.D. James Phillips III Rachel E. Cox Department of Aerospace Engineering, University of Maryland Minta Martin Seminar, November 3, 2016 https://ntrs.nasa.gov/search.jsp?R=20160013317 2018-07-31T15:36:52+00:00Z
Transcript of The Electrostatic Environment of Mars: Atmospheric Discharges … · The Electrostatic Environment...
NASA Kennedy Space Center
The Electrostatic Environment of Mars: Atmospheric Discharges
Carlos I. Calle, Ph.D.NASA Kennedy Space Center
Team:
Paul J. MackeyMichael R. Johansen
Michael D. Hogue, Ph.D.James Phillips III
Rachel E. Cox
Department of Aerospace Engineering, University of Maryland
Minta Martin Seminar, November 3, 2016
https://ntrs.nasa.gov/search.jsp?R=20160013317 2018-07-31T15:36:52+00:00Z
NASA Kennedy Space Center
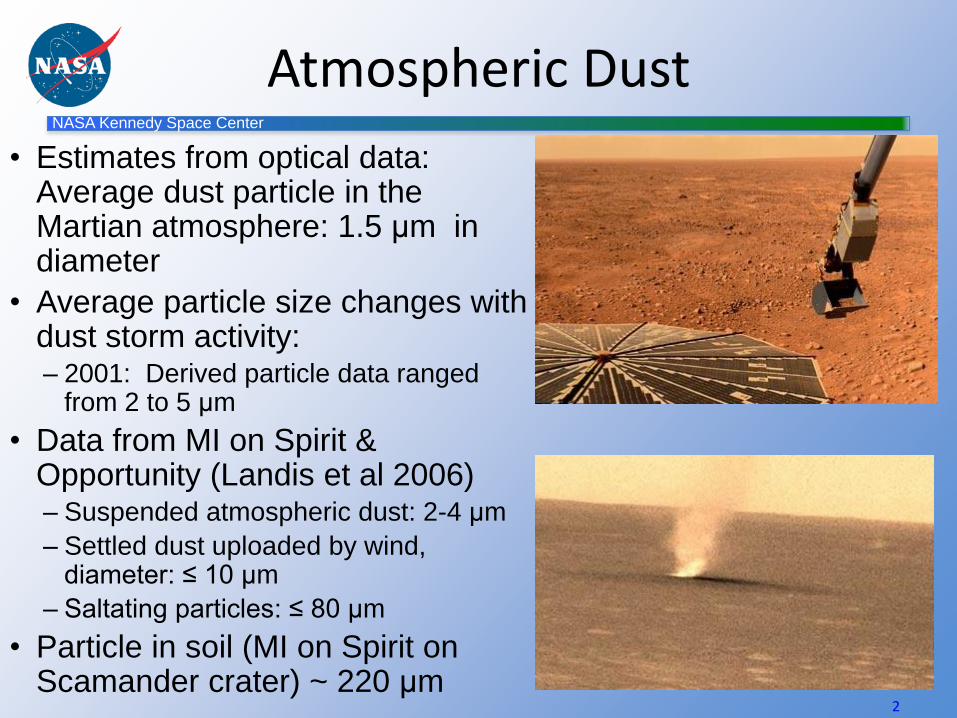
Atmospheric Dust
2
• Estimates from optical data: Average dust particle in the Martian atmosphere: 1.5 μm in diameter
• Average particle size changes with dust storm activity:– 2001: Derived particle data ranged
from 2 to 5 μm
• Data from MI on Spirit & Opportunity (Landis et al 2006)– Suspended atmospheric dust: 2-4 μm
– Settled dust uploaded by wind,diameter: ≤ 10 μm
– Saltating particles: ≤ 80 μm
• Particle in soil (MI on Spirit on Scamander crater) ~ 220 μm
NASA Kennedy Space Center
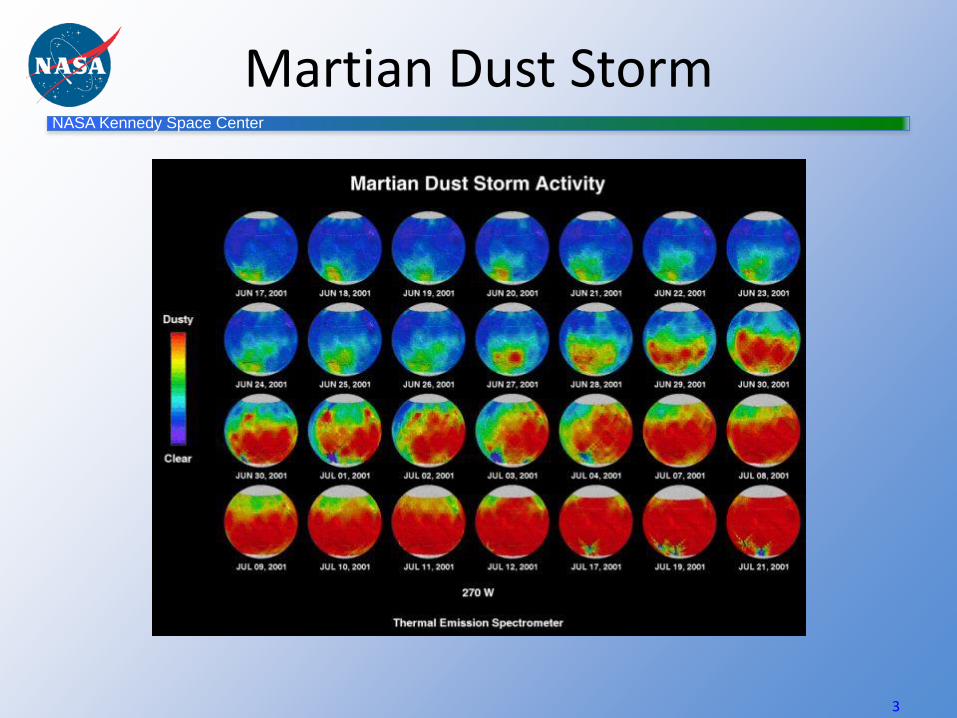
Martian Dust Storm
3
NASA Kennedy Space Center
Dust Devils
4
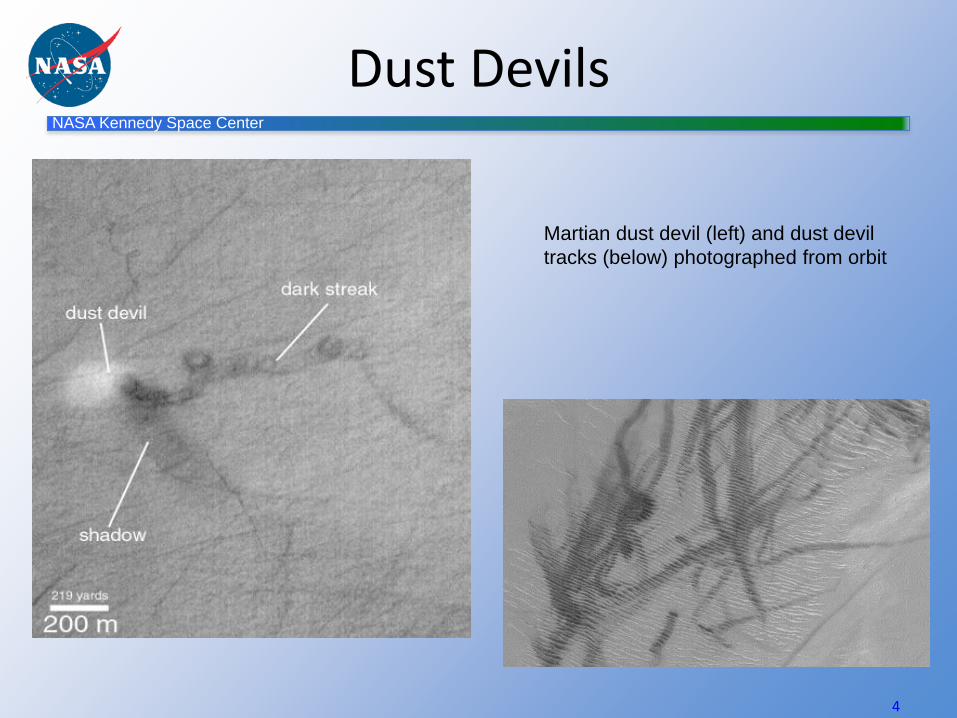
Martian dust devil (left) and dust devil
tracks (below) photographed from orbit
NASA Kennedy Space Center
5
NASA Kennedy Space Center
Opacity of the Atmosphere
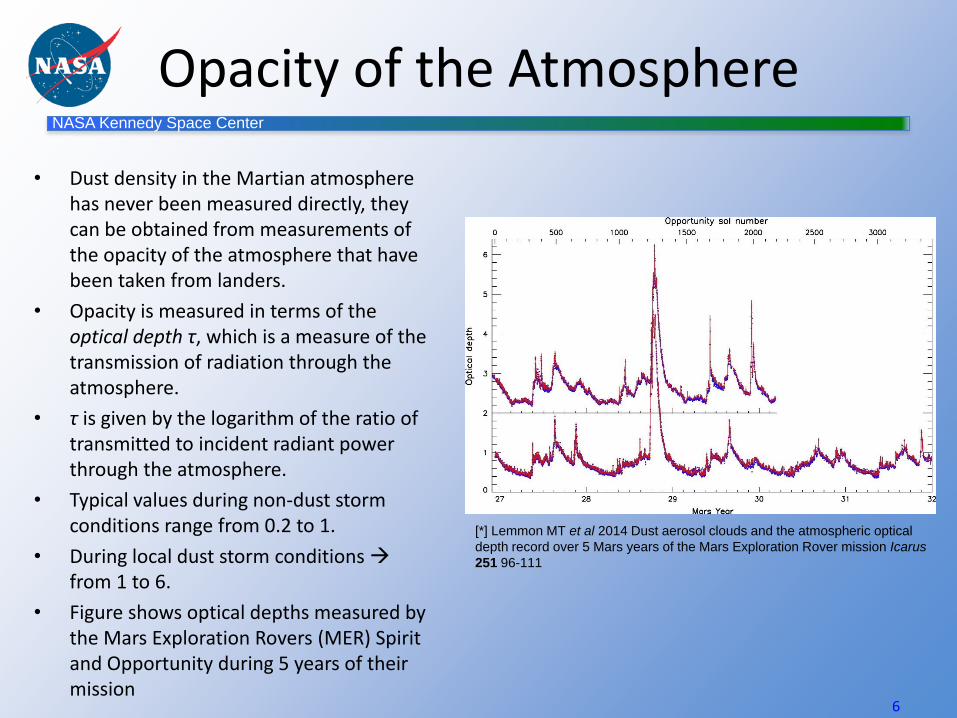
• Dust density in the Martian atmosphere has never been measured directly, they can be obtained from measurements of the opacity of the atmosphere that have been taken from landers.
• Opacity is measured in terms of the optical depth τ, which is a measure of the transmission of radiation through the atmosphere.
• τ is given by the logarithm of the ratio of transmitted to incident radiant power through the atmosphere.
• Typical values during non-dust storm conditions range from 0.2 to 1.
• During local dust storm conditions from 1 to 6.
• Figure shows optical depths measured by the Mars Exploration Rovers (MER) Spirit and Opportunity during 5 years of their mission
6
[*] Lemmon MT et al 2014 Dust aerosol clouds and the atmospheric optical
depth record over 5 Mars years of the Mars Exploration Rover mission Icarus
251 96-111
NASA Kennedy Space Center
Dust Content of the Atmosphere
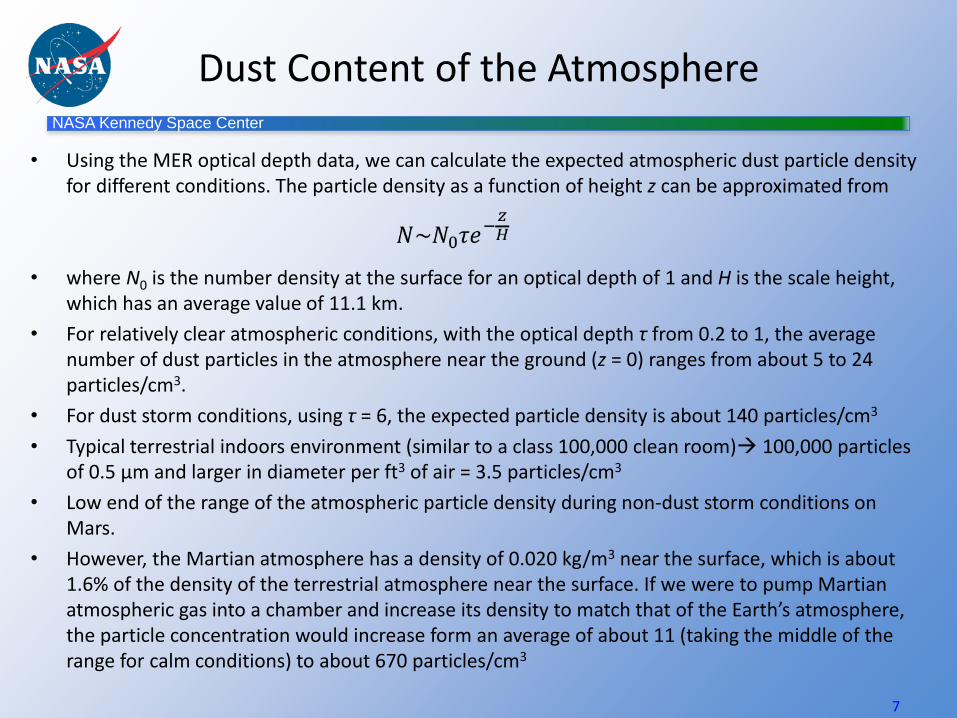
• Using the MER optical depth data, we can calculate the expected atmospheric dust particle density for different conditions. The particle density as a function of height z can be approximated from
• where N0 is the number density at the surface for an optical depth of 1 and H is the scale height, which has an average value of 11.1 km.
• For relatively clear atmospheric conditions, with the optical depth τ from 0.2 to 1, the average number of dust particles in the atmosphere near the ground (z = 0) ranges from about 5 to 24 particles/cm3.
• For dust storm conditions, using τ = 6, the expected particle density is about 140 particles/cm3
• Typical terrestrial indoors environment (similar to a class 100,000 clean room) 100,000 particles of 0.5 µm and larger in diameter per ft3 of air = 3.5 particles/cm3
• Low end of the range of the atmospheric particle density during non-dust storm conditions on Mars.
• However, the Martian atmosphere has a density of 0.020 kg/m3 near the surface, which is about 1.6% of the density of the terrestrial atmosphere near the surface. If we were to pump Martian atmospheric gas into a chamber and increase its density to match that of the Earth’s atmosphere, the particle concentration would increase form an average of about 11 (taking the middle of the range for calm conditions) to about 670 particles/cm3
7
NASA Kennedy Space CenterKennedy Space Center
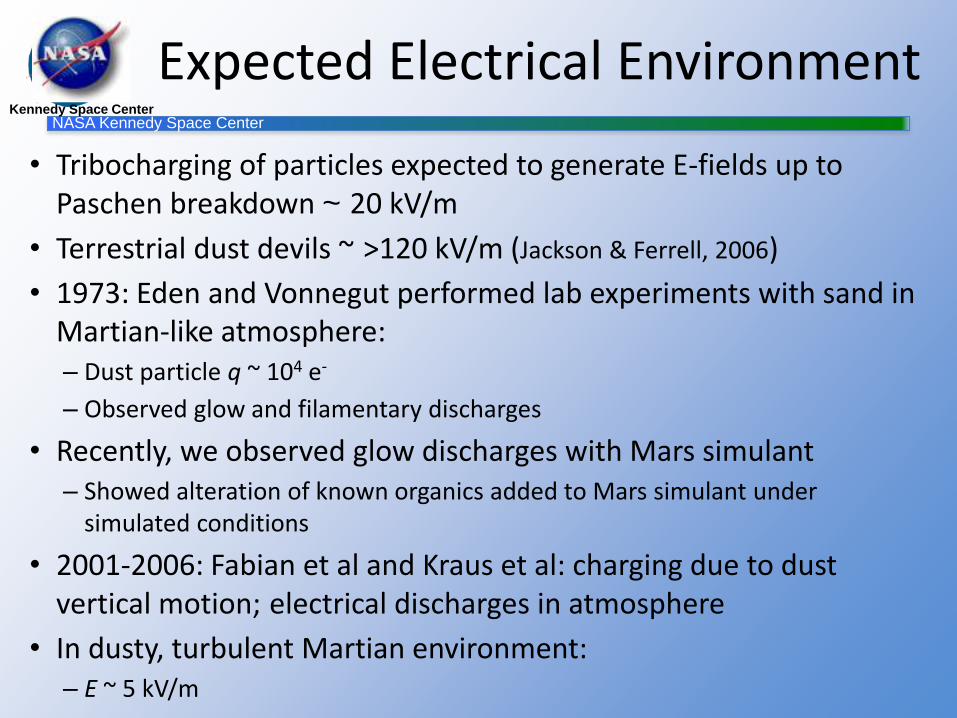
Expected Electrical Environment
• Tribocharging of particles expected to generate E-fields up to Paschen breakdown ~ 20 kV/m
• Terrestrial dust devils ~ >120 kV/m (Jackson & Ferrell, 2006)
• 1973: Eden and Vonnegut performed lab experiments with sand in Martian-like atmosphere:– Dust particle q ~ 104 e-
– Observed glow and filamentary discharges
• Recently, we observed glow discharges with Mars simulant– Showed alteration of known organics added to Mars simulant under
simulated conditions
• 2001-2006: Fabian et al and Kraus et al: charging due to dust vertical motion; electrical discharges in atmosphere
• In dusty, turbulent Martian environment:– E ~ 5 kV/m
NASA Kennedy Space Center
Electrical Discharges on Mars?
• Theoretical studies, laboratory, and terrestrial field experiments atmospheric electrical activity on Mars (lightning or corona discharges) should be abundant
• However, years of direct observation from orbit and ground, including the recent MAVEN mission dedicated to the study of the Martian atmosphere, show no clear evidence of atmospheric electrical discharges.
• Triboelectric charging of dust grains during terrestrial dust storms or dust devils produces positive and negative charged grains
• On Mars, convective instabilities in the atmosphere should stratify similarly produced charged dust grains lighter grains lifted to higher altitudes than more massive grains
• Since smaller particles charge negatively and larger particles charge positively, a macroscopic dipole moment is formed in the atmosphere that can produce an electrical discharges
• Fabian, Krauss and their collaborators demonstrated experimentally in a simulated Martian atmosphere that this type of dust vertical motion can generate electric fields strong enough for electrical discharges to occur [*].
9
*Fabian A Krauss C Sickafoose A Horanyi M and Robertson S 2001
Measurements of electrical discharges in Martian regolith simulant IEEE Trans
Plasma Sci 29 288–291
NASA Kennedy Space Center
• Numerical models of dust electrification during Martian dust storms and dust devils predict that electric fields should have strengths up to the breakdown potential of carbon dioxide at the low atmospheric pressure of Mars
• Combined with experimental values of electron density in the Martian atmosphere, these models yield values of the electrical conductivity of the atmosphere that are several orders of magnitude higher than the values for the terrestrial atmosphere.
• Thus, charge dissipation in the Martian atmosphere would happen in seconds rather than minutes, as is the case for Earth
• Discharge mechanism, however, remains unknown. Whether it takes place violently (lightning) or gently (corona glow) is not known. No direct measurements have ever been made.
• However, there is experimental evidence for glow discharge in laboratory experiments Eden and Vonnegut placed sand particles in a container with carbon dioxide at pressures in the range of the Martian atmospheric pressure and observed a glow as well as filamentary electrical discharges when the container was shaken.
• Our NASA laboratory conducted similar experiments where we were able to observe a visible glow and show that these discharges altered several organics known to exist on Mars.
• In contrast, a recent charging model electric fields cannot reach levels up to breakdown because of charge dissipation in the saltation layer
10
• Farrell W M et al 2003 A simple electrodynamic model of a dust devil Geophysical Research Letters 30 250
• Zhai Y, et al 2006 Quasielectrostatic field analysis and simulation of Martian and terrestrial dust devils J. Geophys. Res. Lett. 35 16
• Eden H F and Vonnegut B 1973 Electrical breakdown caused by dust motion in low-pressure atmospheres: Considerations for Mars Science 180 962
• Hintze P E et al 2010 Alteration of five organic compounds by glow discharge plasma and UV light under simulated Mars conditions Icarus 208 749-757
NASA Kennedy Space Center
• Searches for evidence of electrostatic discharges in the Martian atmosphere have been made with instrumentation aboard orbiting spacecraft.
• In 2009, Ruf and collaborators claimed that they had detected non-thermal electromagnetic emissions during a dust storm.
• Analyses of the modes of these emissions were interpreted to be Schumann Resonances. Some researchers attribute the presence of these resonances to lightning discharges.
• However, subsequent observations in the same electromagnetic region found no evidence of Schumann Resonances during a period that included dust storms.
• Detailed studies of over 5 years of observations by the Mars Advanced Radar for Subsurface and Ionosphere Sounding (MARSIS) yielded no evidence of high frequency radio emissions that would indicate the presence of electrical discharges.
• Moreover, the connection between Schumann Resonances and lightning has not been established yet, with only one research effort indicating it as a possibility
11
• Anderson M M et al 2012 The Allen Telescope Array search for electromagnetic
discharges on Mars Astrophys. J. 744 15
• Ondarkova A et al 2008 Peculiar transient events in the Schumann Resonance
band and their possible explanation J. Atmos. Sol-Terr. Phys. 70 937-946
NASA Kennedy Space Center
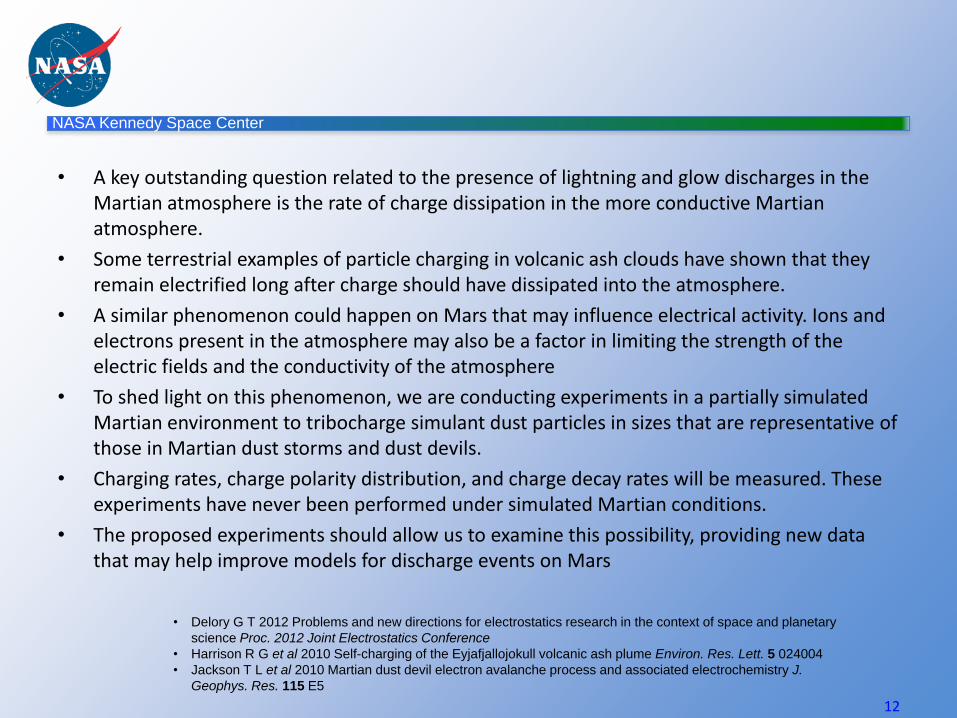
• A key outstanding question related to the presence of lightning and glow discharges in the Martian atmosphere is the rate of charge dissipation in the more conductive Martian atmosphere.
• Some terrestrial examples of particle charging in volcanic ash clouds have shown that they remain electrified long after charge should have dissipated into the atmosphere.
• A similar phenomenon could happen on Mars that may influence electrical activity. Ions and electrons present in the atmosphere may also be a factor in limiting the strength of the electric fields and the conductivity of the atmosphere
• To shed light on this phenomenon, we are conducting experiments in a partially simulated Martian environment to tribocharge simulant dust particles in sizes that are representative of those in Martian dust storms and dust devils.
• Charging rates, charge polarity distribution, and charge decay rates will be measured. These experiments have never been performed under simulated Martian conditions.
• The proposed experiments should allow us to examine this possibility, providing new data that may help improve models for discharge events on Mars
12
• Delory G T 2012 Problems and new directions for electrostatics research in the context of space and planetary
science Proc. 2012 Joint Electrostatics Conference
• Harrison R G et al 2010 Self-charging of the Eyjafjallojokull volcanic ash plume Environ. Res. Lett. 5 024004
• Jackson T L et al 2010 Martian dust devil electron avalanche process and associated electrochemistry J.
Geophys. Res. 115 E5
NASA Kennedy Space Center
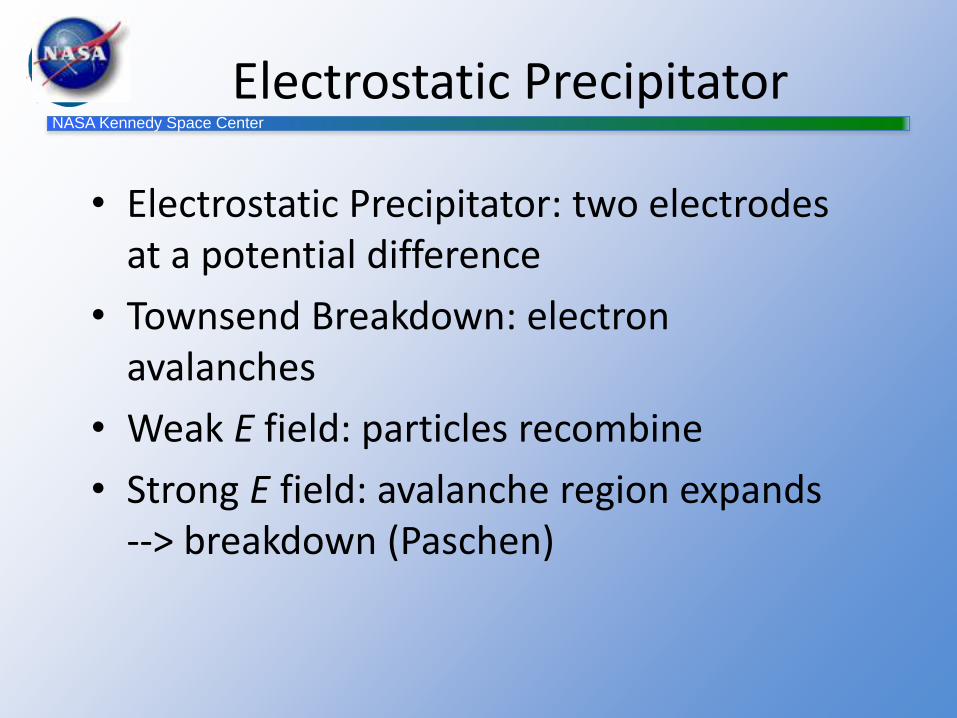
Electrostatic Precipitator
• Electrostatic Precipitator: two electrodes at a potential difference
• Townsend Breakdown: electron avalanches
• Weak E field: particles recombine
• Strong E field: avalanche region expands --> breakdown (Paschen)
NASA Kennedy Space Center
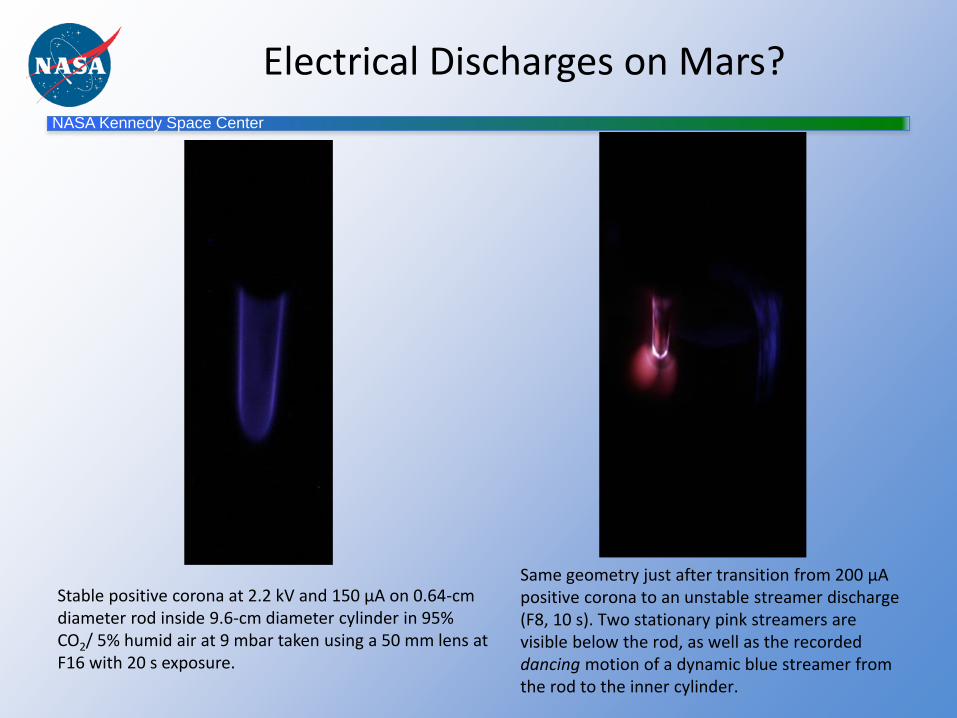
Stable positive corona at 2.2 kV and 150 μA on 0.64-cm diameter rod inside 9.6-cm diameter cylinder in 95% CO2/ 5% humid air at 9 mbar taken using a 50 mm lens at F16 with 20 s exposure.
Same geometry just after transition from 200 μApositive corona to an unstable streamer discharge (F8, 10 s). Two stationary pink streamers are visible below the rod, as well as the recorded dancing motion of a dynamic blue streamer from the rod to the inner cylinder.
Electrical Discharges on Mars?
NASA Kennedy Space CenterKennedy Space Center
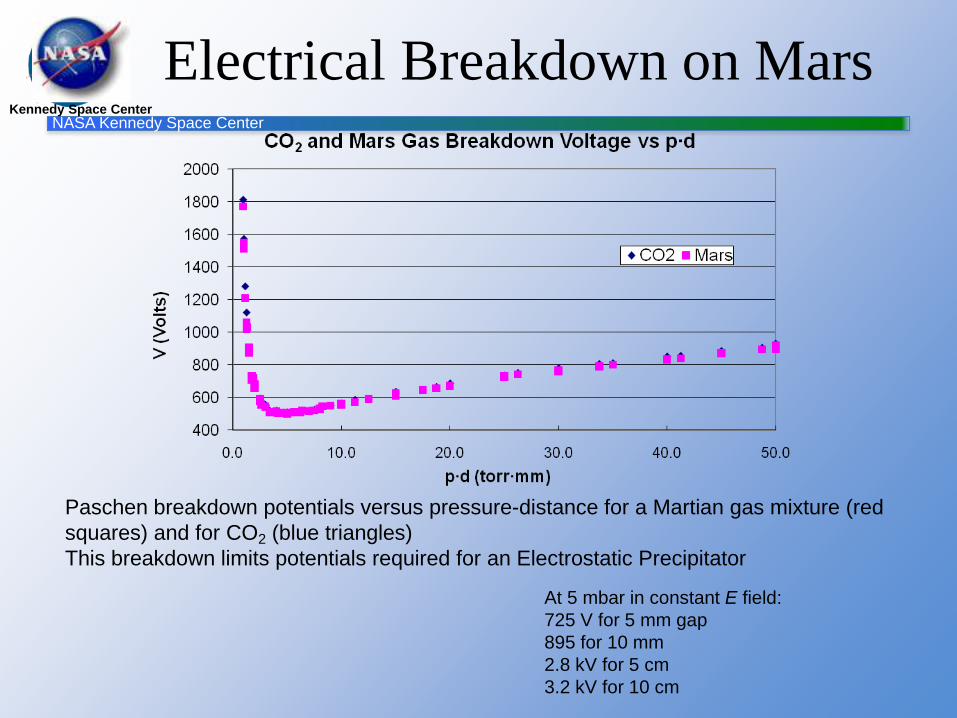
Electrical Breakdown on Mars
Paschen breakdown potentials versus pressure-distance for a Martian gas mixture (red
squares) and for CO2 (blue triangles)
This breakdown limits potentials required for an Electrostatic Precipitator
At 5 mbar in constant E field:
725 V for 5 mm gap
895 for 10 mm
2.8 kV for 5 cm
3.2 kV for 10 cm
NASA Kennedy Space Center
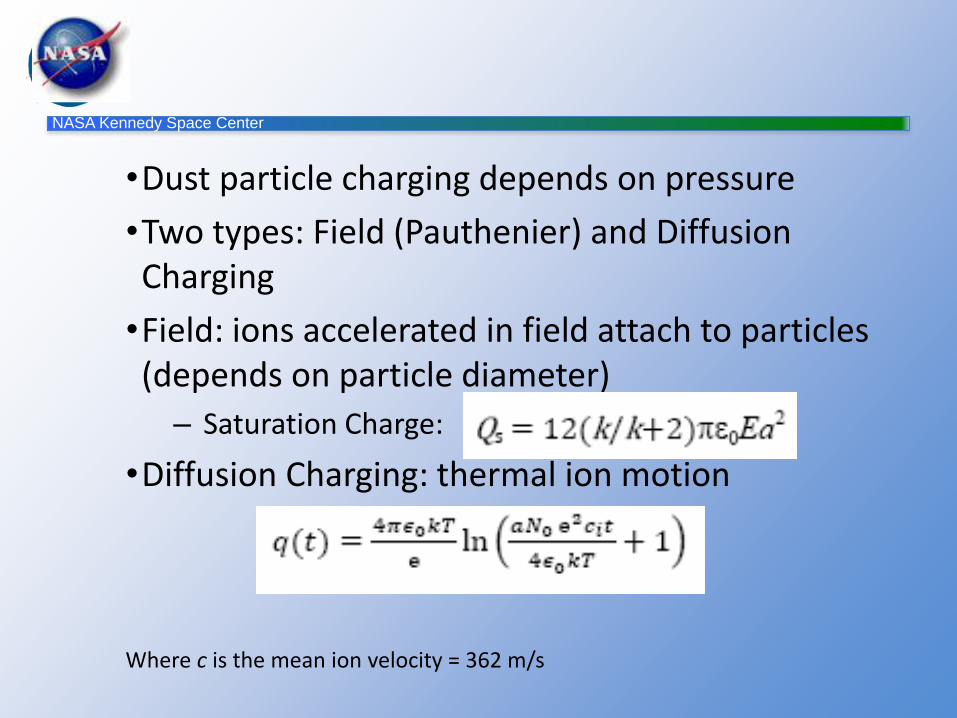
•Dust particle charging depends on pressure
•Two types: Field (Pauthenier) and Diffusion Charging
•Field: ions accelerated in field attach to particles (depends on particle diameter)
– Saturation Charge:
•Diffusion Charging: thermal ion motion
Where c is the mean ion velocity = 362 m/s
NASA Kennedy Space CenterKennedy Space Center
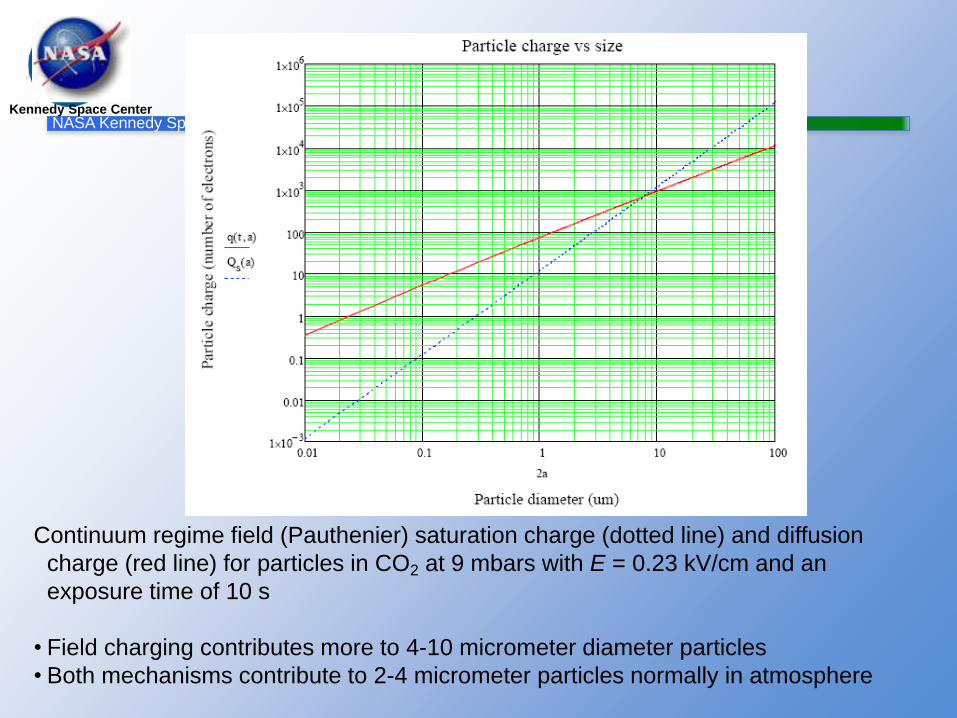
Continuum regime field (Pauthenier) saturation charge (dotted line) and diffusion
charge (red line) for particles in CO2 at 9 mbars with E = 0.23 kV/cm and an
exposure time of 10 s
• Field charging contributes more to 4-10 micrometer diameter particles
• Both mechanisms contribute to 2-4 micrometer particles normally in atmosphere
NASA Kennedy Space CenterKennedy Space Center
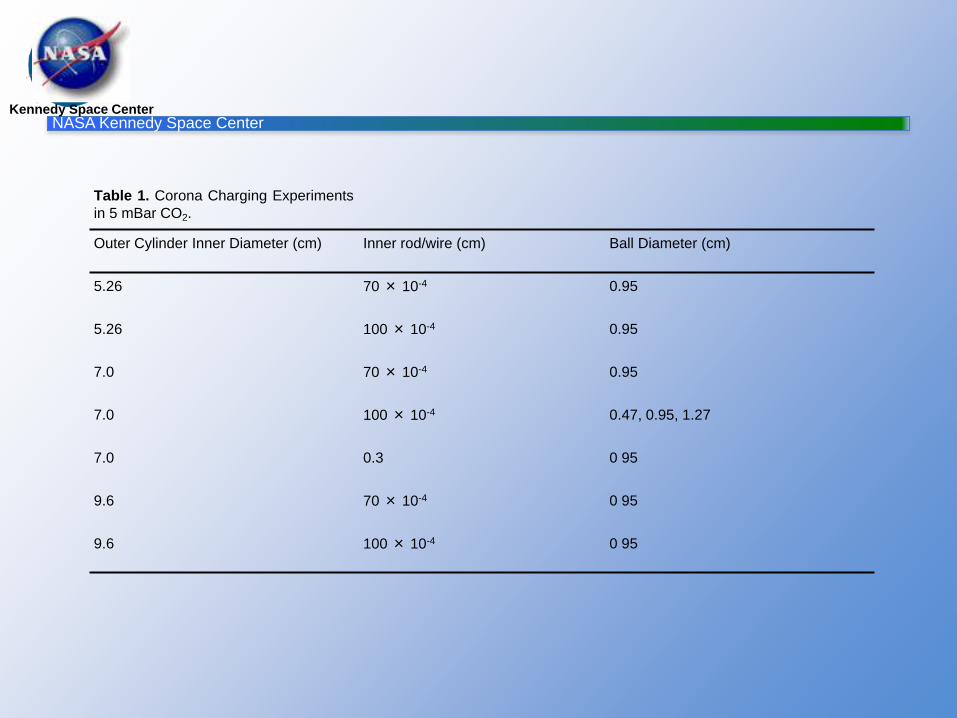
Table 1. Corona Charging Experiments
in 5 mBar CO2.
Outer Cylinder Inner Diameter (cm) Inner rod/wire (cm) Ball Diameter (cm)
5.26 70× 10-4 0.95
5.26 100× 10-4 0.95
7.0 70× 10-4 0.95
7.0 100× 10-4 0.47, 0.95, 1.27
7.0 0.3 0 95
9.6 70× 10-4 0 95
9.6 100× 10-4 0 95
NASA Kennedy Space Center
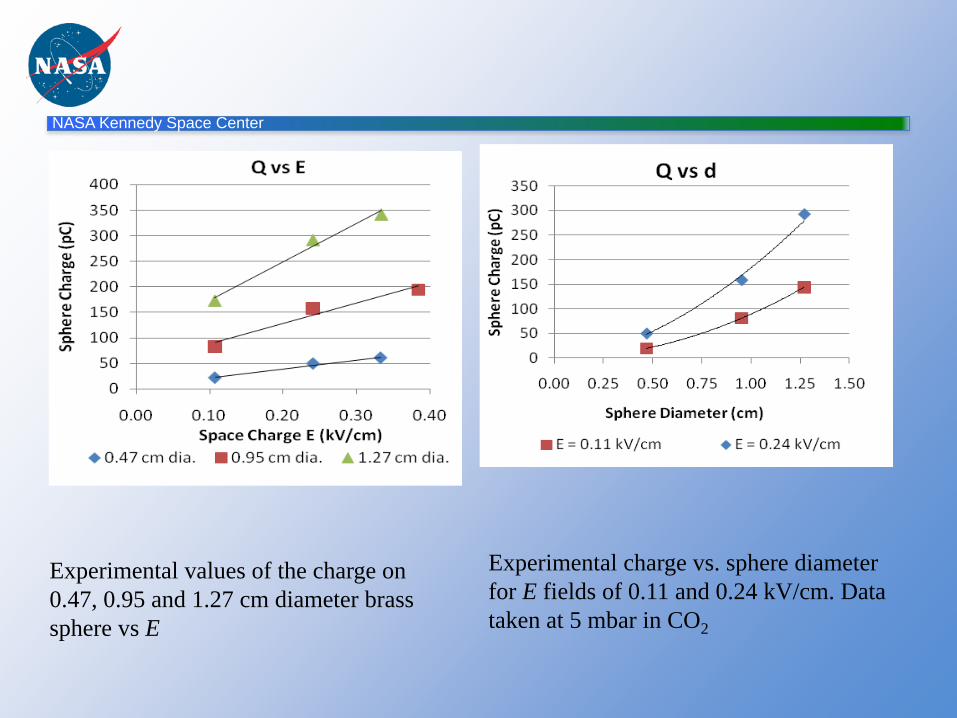
Experimental values of the charge on
0.47, 0.95 and 1.27 cm diameter brass
sphere vs E
Experimental charge vs. sphere diameter
for E fields of 0.11 and 0.24 kV/cm. Data
taken at 5 mbar in CO2
NASA Kennedy Space CenterKennedy Space Center
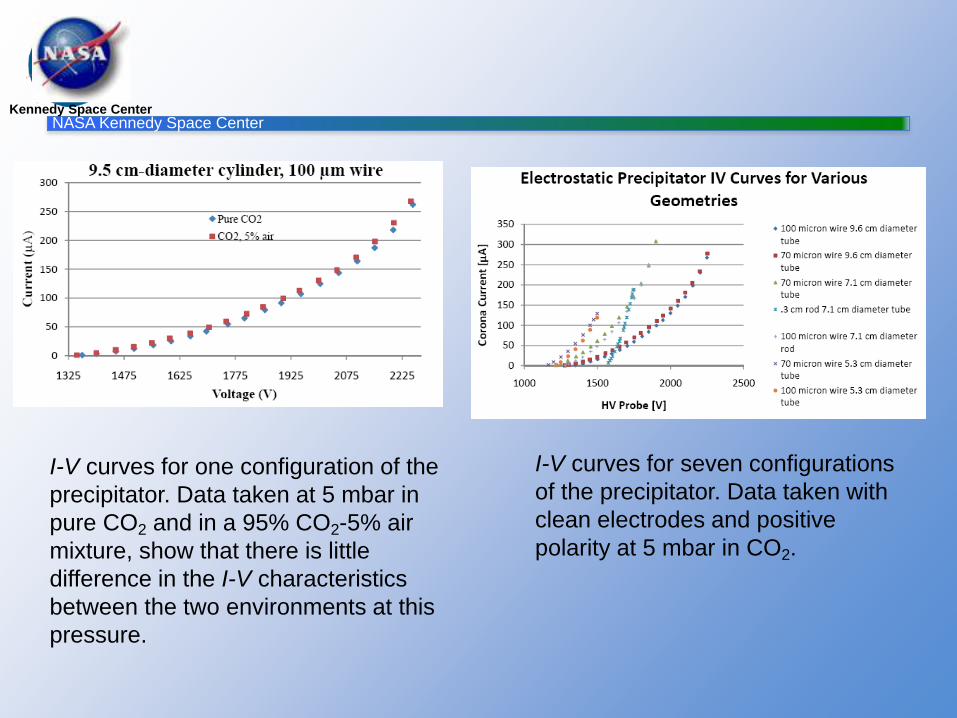
I-V curves for one configuration of the
precipitator. Data taken at 5 mbar in
pure CO2 and in a 95% CO2-5% air
mixture, show that there is little
difference in the I-V characteristics
between the two environments at this
pressure.
I-V curves for seven configurations
of the precipitator. Data taken with
clean electrodes and positive
polarity at 5 mbar in CO2.
NASA Kennedy Space CenterKennedy Space Center
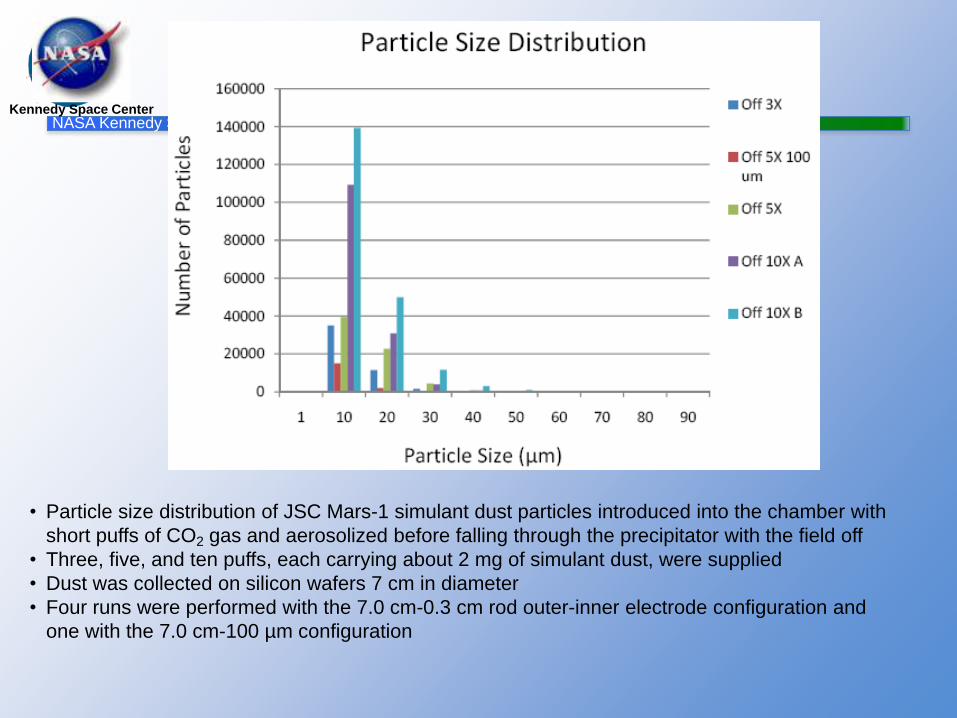
• Particle size distribution of JSC Mars-1 simulant dust particles introduced into the chamber with
short puffs of CO2 gas and aerosolized before falling through the precipitator with the field off
• Three, five, and ten puffs, each carrying about 2 mg of simulant dust, were supplied
• Dust was collected on silicon wafers 7 cm in diameter
• Four runs were performed with the 7.0 cm-0.3 cm rod outer-inner electrode configuration and
one with the 7.0 cm-100 µm configuration
NASA Kennedy Space CenterKennedy Space Center
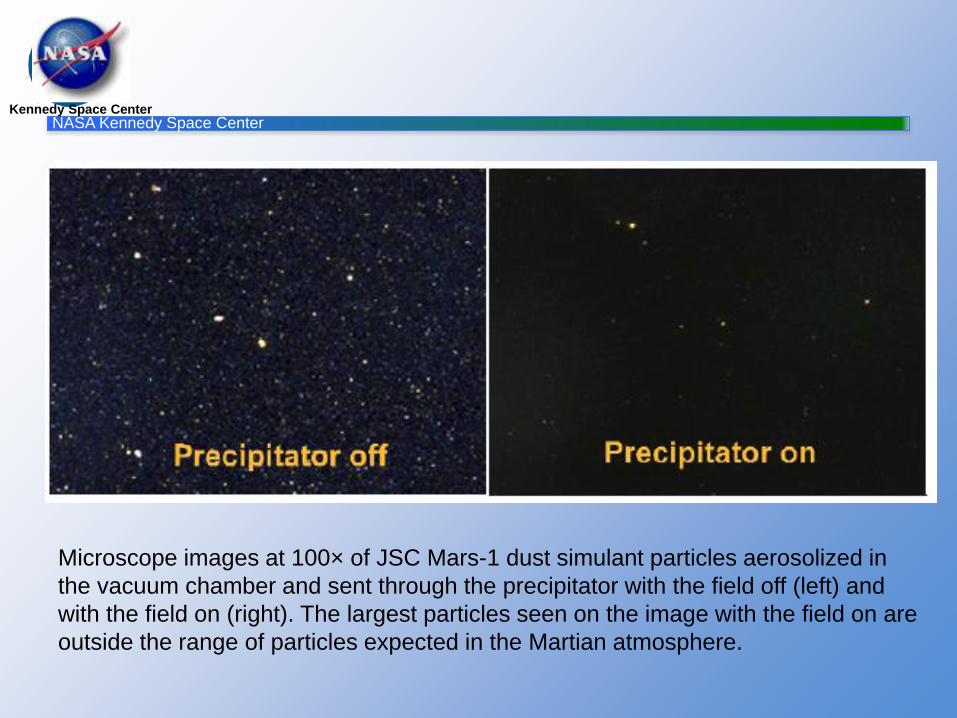
Microscope images at 100× of JSC Mars-1 dust simulant particles aerosolized in
the vacuum chamber and sent through the precipitator with the field off (left) and
with the field on (right). The largest particles seen on the image with the field on are
outside the range of particles expected in the Martian atmosphere.
NASA Kennedy Space CenterKennedy Space Center
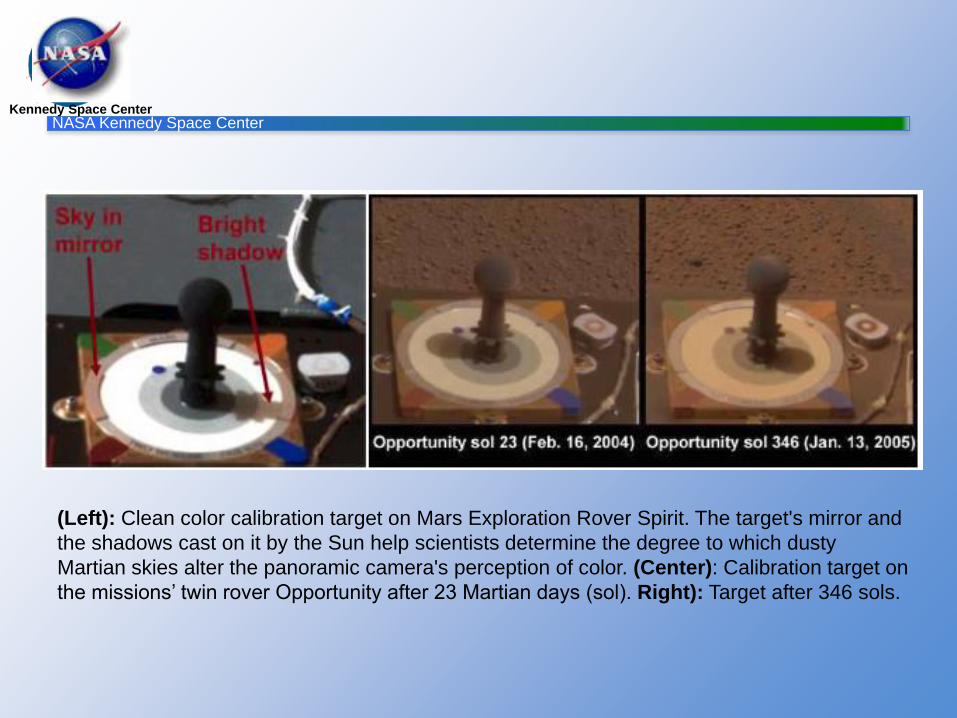
(Left): Clean color calibration target on Mars Exploration Rover Spirit. The target's mirror and
the shadows cast on it by the Sun help scientists determine the degree to which dusty
Martian skies alter the panoramic camera's perception of color. (Center): Calibration target on
the missions’ twin rover Opportunity after 23 Martian days (sol). Right): Target after 346 sols.
NASA Kennedy Space Center
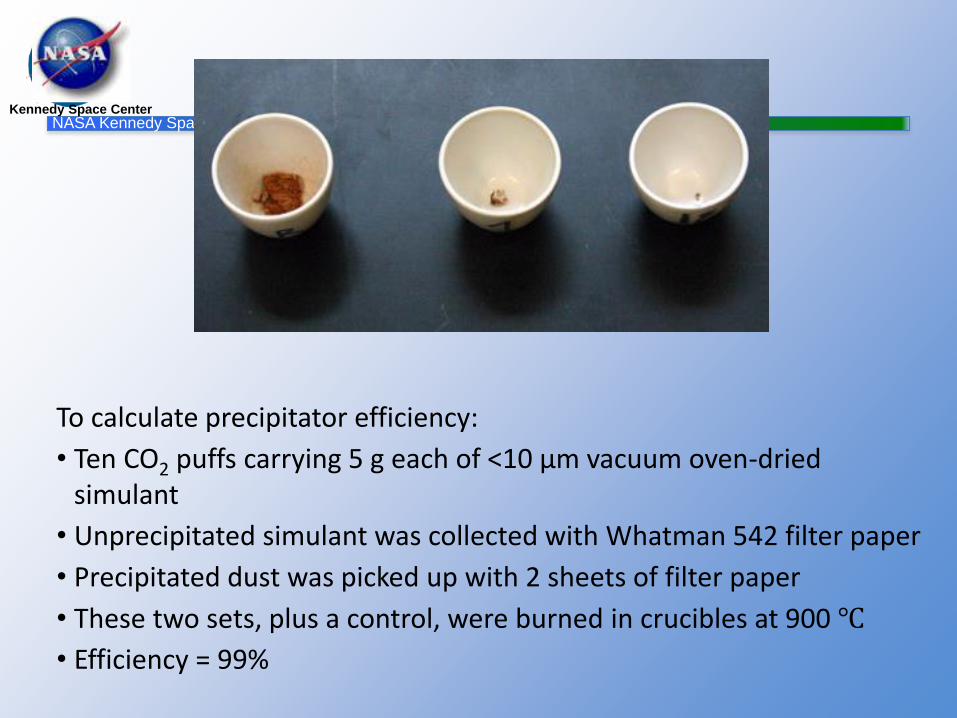
To calculate precipitator efficiency:
• Ten CO2 puffs carrying 5 g each of <10 µm vacuum oven-dried simulant
• Unprecipitated simulant was collected with Whatman 542 filter paper
• Precipitated dust was picked up with 2 sheets of filter paper
• These two sets, plus a control, were burned in crucibles at 900 ℃
• Efficiency = 99%
Kennedy Space Center
NASA Kennedy Space Center
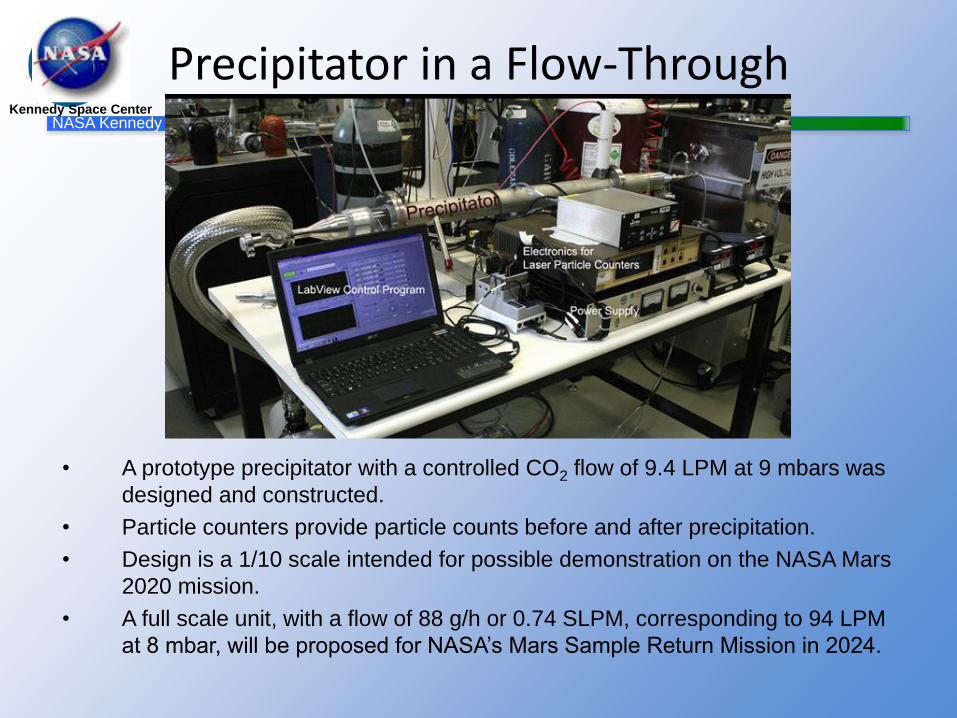
Precipitator in a Flow-Through
• A prototype precipitator with a controlled CO2 flow of 9.4 LPM at 9 mbars was
designed and constructed.
• Particle counters provide particle counts before and after precipitation.
• Design is a 1/10 scale intended for possible demonstration on the NASA Mars
2020 mission.
• A full scale unit, with a flow of 88 g/h or 0.74 SLPM, corresponding to 94 LPM
at 8 mbar, will be proposed for NASA’s Mars Sample Return Mission in 2024.
Kennedy Space Center
NASA Kennedy Space Center
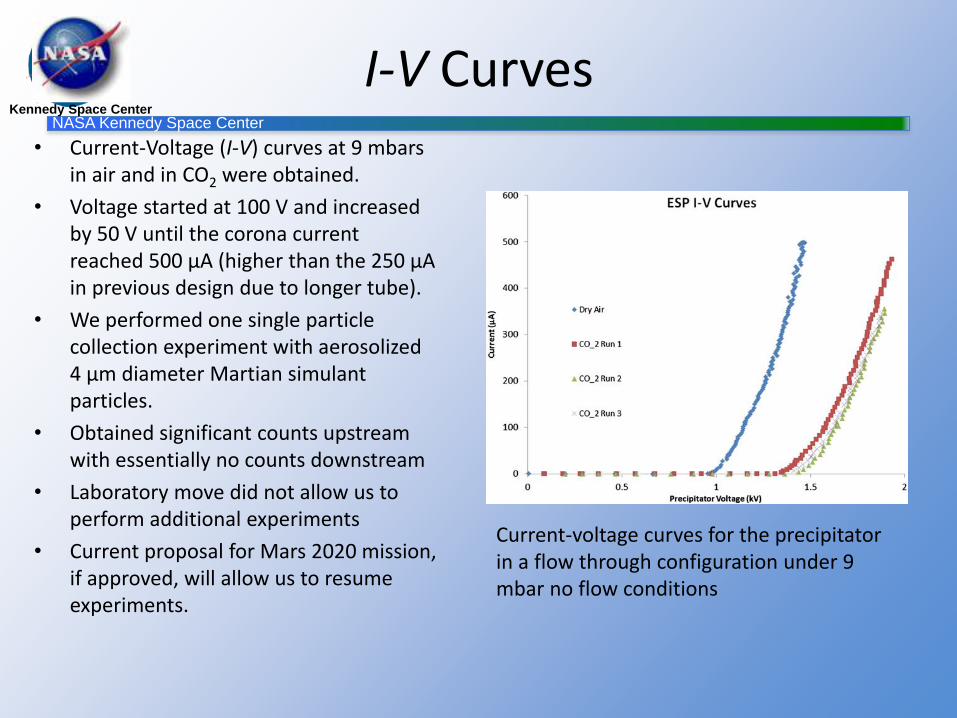
I-V Curves• Current-Voltage (I-V) curves at 9 mbars
in air and in CO2 were obtained.
• Voltage started at 100 V and increased by 50 V until the corona current reached 500 µA (higher than the 250 µA in previous design due to longer tube).
• We performed one single particle collection experiment with aerosolized 4 µm diameter Martian simulant particles.
• Obtained significant counts upstream with essentially no counts downstream
• Laboratory move did not allow us to perform additional experiments
• Current proposal for Mars 2020 mission, if approved, will allow us to resume experiments.
Current-voltage curves for the precipitator in a flow through configuration under 9 mbar no flow conditions
Kennedy Space Center

![The Electrostatic Environments of Mars and the … Electrostatic Environments of Mars and the Moon ... [3,4]. The nightside Debye sheath, ... Eden and Vonnegut observed a glow as well](https://static.fdocuments.us/doc/165x107/5aefed2f7f8b9ac62b8e09d6/the-electrostatic-environments-of-mars-and-the-electrostatic-environments-of.jpg)