Convert your car to electric, homemade electric car conversion, converting to electric car
Upload
nguyenthienCategory
view
213download
0
NOVEMBER 2, 2017
The Electric Car Tipping Point
Research highlights

2 Copyri
ght
© 2
017 b
y T
he B
ost
on C
onsu
ltin
g G
roup,
Inc.
All r
ights
rese
rved.
This research underlies our fourth report on automotive propulsion and electric car adoption (out soon)
Focus
areas
• Potential of ICE
technologies
• Consumer perspective
• Updated volume forecasts
• Go-to-market challenges
• Carbon-cost tradeoffs
• Total costs of ownership
(TCO)
• Volume forecasts
• Battery technology and
industry overview
• Battery cost analysis
• Total costs of ownership
(TCO) revisited
• Evolution of battery costs
• Total costs of ownership by
powertrain
• Impact of shared mobility
• 2030 volume forecast
2009 2010 2011 2017
The Electric Car Tipping Point

Copyri
ght
© 2
017 b
y T
he B
ost
on C
onsu
ltin
g G
roup,
Inc.
All r
ights
rese
rved.
3
Battery costs have been declining at a rapid pace since 2009, at ~20% annually
We should reach an inflection point for a viable economic proposition for consumers
between 2025 and 2030 without incentives
Until that time, regulation, rather than consumer demand, will still drive the
electrification of cars
Until 2020, advanced internal combustion engines (ICEs) will be sufficient to meet
regulations. After that, electrification will be required
In 2025, most cars will still have an ICE. The average cost per car sold to meet
regulatory requirements will be ~$500 per unit above ICE costs
Electrification will manifest in different ways around the world. In the US, it will be
driven by mild hybrids or 48-volt hybrids (MHEVs) and battery-operated electric
vehicles (BEVs); in the EU and China, by BEVs; and in Japan and the rest of the world,
by mainly full hybrids (HEVs) and MHEVs
The shared economy (taxis and car sharing) will spur HEV and BEV adoption before
individual customers, given higher mileage. Autonomous vehicles will boost shared
mobility and therefore demand for HEVs and BEVs
Globally, we expect the share of electrified vehicles (xEVs) to be ~30% by 2025 and
~50% by 2030. The share of BEVs is projected to be 6% in 2025 and 14% in 2030
Executive summary
Source: BCG analysis

4
Our approach
Energy price
(oil, electricity)
Government
incentives
Battery & ICE tech.
cost/benefit
Regulatory
standards
Regulation-driven
output
Consumer-driven
output
Total miles driven
(mobility, consumer)
OEM economics
(lowest-cost solution)
TCO for consumer
(breakeven expectations)
Battery & ICE tech.
cost/benefit
No
Does consumer output meet
regulation standards?
Yes
Fa
cto
rs a
ffe
cti
ng
co
ns
um
ers
Fa
cto
rs a
ffe
cti
ng
OE
Ms
OutputAnalysisDriver
BCG view of
powertrain
evolution and
xEV market
forecast to 2030
OEM vehicle options
Key

5 Copyri
ght
© 2
017 b
y T
he B
ost
on C
onsu
ltin
g G
roup,
Inc.
All r
ights
rese
rved.
• Starting in 2021, emission of
passenger car fleets in Europe
limited to max. 95g CO2/km
• Starting in 2025, max. 78g CO2/km
• Optimization of combustion engines
reaches economical limits
• CO2 targets in EU and US can be
achieved only with xEV
technologies
200
150
100
0
2120
115
117
95
191817151413
172
127
165
121110
139
Proposed 78
CO2 (g/km)
97
242322 2516
Governments have set aggressive CO2 targets
Today
ChinaEU JapanUSA
Ambitious CO2 targets... ...with strong implications
Note: China limits only include combustion engines (limits lower if alternative drive technologies included); US limits show NHTSA's efficiency standards and do not include credits for low-GWPcooling according to the EPA's GHG standards; regulations apply for passenger carsSources: BCG analysis; ICCT December 2014; AMS – Spagat zwischen Effizienz und Emission, 21.09.2015; EU-Study "CO2-Emissionsreduktion bei Pkw und leichten Nutzfahrzeugen nach 2020"
Alternative drive technologies

6 Copyri
ght
© 2
017 b
y T
he B
ost
on C
onsu
ltin
g G
roup,
Inc.
All r
ights
rese
rved.
ICEs will be sufficient to meet regulations until 2020, not beyond
-1,000
0
-500
500
2025
CAFE credits
-398
2024
-543
Industry CAFE credits (M)
2023
-262
2022
-135
2021
-23
2020
43
2019
46
2018
40
2017
41
2016
123
108 106 104 102 100 98 96 93 91 87
95100106112119125
7881858895
0
50
100
150
Industry CO2 emissions EU (g/CO2)
20252020 2021 20242022 20232016 2017 2018 2019
Proposed
Regulatory requirements
CO2 projected
emissions
US and EU regulation not met after 2020
US
pro
jecti
ons
EU
pro
jecti
ons

7 Copyri
ght
© 2
017 b
y T
he B
ost
on C
onsu
ltin
g G
roup,
Inc.
All r
ights
rese
rved.
Countries have set various ways to incentivize xEV sales
• $7.5K per purchase
of full BEV, credits
are less for PHEV
(~5K), federal tax
credit
• ~$2.5K additional
vary by state
• Up to €4K rebate
for BEV and €3K for
PHEV
• €1B fund for
rebates/chargers
• Up to €6.3K for CO2
20g emissions or
less
• Up to €10K for BEV
when scrapping old
diesel
• BEVs exempt from
purchase tax (up
to 100%) and VAT
• Pay far lower
circulation tax,
pay 50% company
car tax
• Exempt from
parking, ferry,
bridge, toll fees
• ~$17K (RMB ~55K)
national rebate,
RMB 30K for a
PHEV
• Municipal
government
offering
additional RMB
~55K
• License plate
exempt from
charge and xEVs
avoid 6-to 12-
month wait
• Up to $8.5K
subsidy based on
purchase price
and benefit from
ICE alternative
• Exemption from
tonnage,
ownership and
acquisition tax
• Formerly had
subsidy of $700-
$1K on HEVs
USA Germany France Norway China Japan

8 Copyri
ght
© 2
017 b
y T
he B
ost
on C
onsu
ltin
g G
roup,
Inc.
All r
ights
rese
rved.
Global penetration of electrified vehicles has been limited to datexEVs are expected to account for 5% of total production this year
0
85
80
75
60
70
65
90
95
90.4
77.4%
18.8%
2015
71.3
79.2%
2.1%
19.3%76.1%
18.9%
2.4%
0.7%
0.9%
F 2017
91.2
73.7
78.2%
20.3%
2010
86.6
78.1%
19.1%
2014
84.3
79.0%
2013
81.6
2012
78.5
18.3%
78.3%
19.3%
2011
78.8%
18.6%
0.2%
1.0%
0.1%
0.2%
2016
Annual Vehicles Produced (M)
Source: 2017 August IHS Data
MHEVHEVPHEVBEV
Diesel
Gasoline
BEV 0.0% 0.1% 0.1% 0.2% 0.3% 0.4% 0.6% 0.9%
PHEV 0.0% 0.0% 0.1% 0.1% 0.2% 0.3% 0.4% 0.7%
HEV 1.4% 1.3% 2.0% 2.1% 2.2% 1.9% 2.2% 2.4%
MHEV 0.1% 0.0% 0.2% 0.2% 0.1% 0.3% 0.6% 1.0%
Total xEV 1.5% 1.5% 2.4% 2.5% 2.8% 2.9% 3.8% 5.0%
HEV ICEPHEV DieselMHEVBEV

9 Copyri
ght
© 2
017 b
y T
he B
ost
on C
onsu
ltin
g G
roup,
Inc.
All r
ights
rese
rved.
Battery costs for BEVs and PHEVs, however, are declining fastPotential evolution of battery cell costs by 2030
2018
180
150
120
90
0
2030202920282027202620252024202320222021202020192017
173
152
Cell level ($/kWh)
145
159
143
70
9097
106
80
106
120128135128
147
Note: TAR report D segment battery cell cost used at ~65 kWH to 2025
Sources: BCG analysis and forecast; TAR report; JP Morgan Global xEV Components report; UBS Future of Powertrain report; expert interviews; GM annual global conference
LG/GMUBSTAR JP MorganBCG low case projectionsBCG base case projections

Copyri
ght
© 2
017 b
y T
he B
ost
on C
onsu
ltin
g G
roup,
Inc.
All r
ights
rese
rved.
10
Key parameters Cost curve from
$150 per cell to
$90 per cell
$60 a barrel Incentives are
not included
Regulations are
assumed to
remain in place
Battery costs Oil costs
Incentives/
Regulations

11 Copyri
ght
© 2
017 b
y T
he B
ost
on C
onsu
ltin
g G
roup,
Inc.
All r
ights
rese
rved.
Comparison of TCO across powertrains: US 5-year TCOC-segment cost of ownership year-over-year change for different xEVs
Source: BCG analysis
In 2020, purchasing a PHEV will cost consumer
$35,541 over life of 5 years from 2020-2025
In 2027, purchasing a BEV will
cost consumer $30,678 over life
of 5 years from 2027-2032 35,541
191817 3015
40,000
35,000
30,000
25,000
2928272625242322212016
Year
30,678
5-year TCO, C segment ($)
PHEV BEVHEVMHEVICE

12 Copyri
ght
© 2
017 b
y T
he B
ost
on C
onsu
ltin
g G
roup,
Inc.
All r
ights
rese
rved.
Comparison of TCO across powertrains: US 10-year TCOC-segment cost of ownership year-over-year change for different xEVs
41,434
2027202620252024202320222021202020192018201720162015
50,000
45,000
40,000
35,000
30,000
203020292028
35,705
10-year TCO, C segment ($)
Source: BCG analysis
BEVPHEVHEVMHEVICE
In 2020, purchasing a PHEV will cost consumer
$41,434 over life of 10 years from 2020-2030
In 2025, purchasing a BEV will cost consumer
$35,705 over life of 10 years from 2025-2035
13
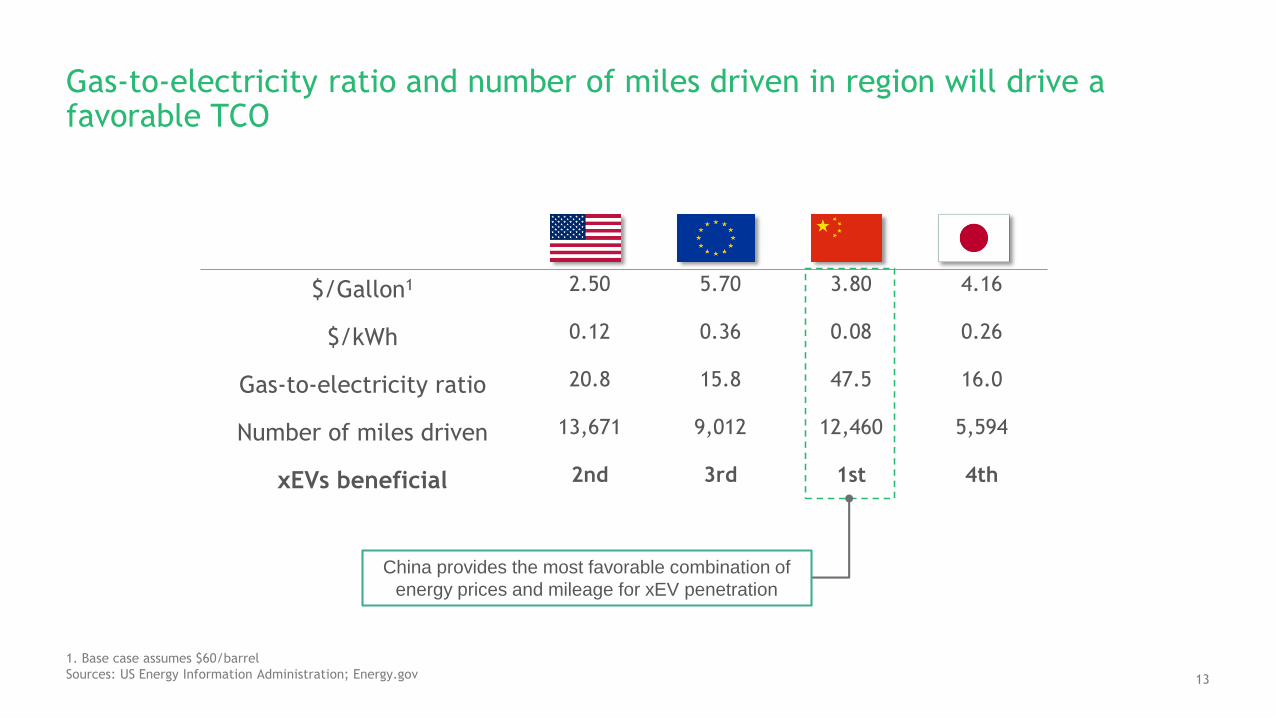
Gas-to-electricity ratio and number of miles driven in region will drive a favorable TCO
$/Gallon1 2.50 5.70 3.80 4.16
$/kWh 0.12 0.36 0.08 0.26
Gas-to-electricity ratio 20.8 15.8 47.5 16.0
Number of miles driven 13,671 9,012 12,460 5,594
xEVs beneficial 2nd 3rd 1st 4th
1. Base case assumes $60/barrel
Sources: US Energy Information Administration; Energy.gov
China provides the most favorable combination of
energy prices and mileage for xEV penetration

14 Copyri
ght
© 2
017 b
y T
he B
ost
on C
onsu
ltin
g G
roup,
Inc.
All r
ights
rese
rved.
Electrified vehicles are increasingly attractive at high mileage rates
2017 payback period, HEV versus ICE (years)1 2017 payback period, BEV versus ICE (years)1
Miles/yr USA China EU
25,000 6 4 3
50,000 3 2 2
75,000 2 2 1
100,000 2 1 1
Miles/yr USA China EU
25,000 11 5 6
50,000 6 3 3
75,000 4 2 2
100,000 3 2 2
1. Based on 2017 prices without incentives
Source: BCG analysis

15 Copyri
ght
© 2
017 b
y T
he B
ost
on C
onsu
ltin
g G
roup,
Inc.
All r
ights
rese
rved.
Cost-per-mile difference will be ~40% for urban shared vehicles in 2030Comparison: 2030 annual cost by category
0.0
0.5
1.0
1.5
1.22
Conventional ICE (10K yearly miles) 2030 Shared Autonomous
Vehicle (HEV)
(60K yearly passenger miles)
0.77
2030 Shared Autonomous
Electric Vehicle (BEV)
(60K yearly passenger miles)1
0.74
-40%
$/passenger mile per category
-37%
Car type and mileage
1. Corresponds to ~90K total miles, when passenger-less miles driven are added
Source: Upcoming BCG report, The Reimagined Car: Shared, Autonomous, and Electric
Cleaning
Tickets
Replacement (covers, mats, etc.)
Fleet Tax
Fleet Markup
Fleet Mgmt.
Data
Battery Replacement
Tires
Taxes/Fees
Software Upgrades
Financing
Fuel/Electric
Maintenance
Insurance
Depreciation
Parking
Copyri
ght
© 2
017 b
y T
he B
ost
on C
onsu
ltin
g G
roup,
Inc.
All r
ights
rese
rved.
16
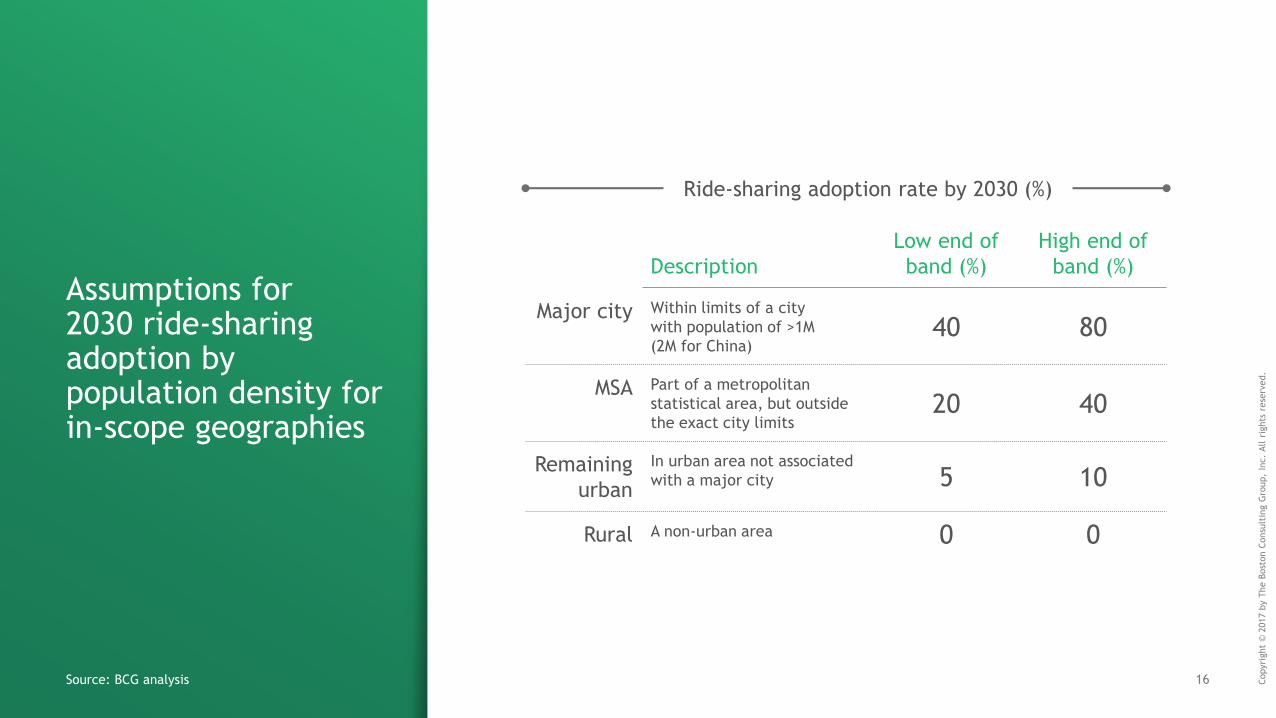
Assumptions for2030 ride-sharing adoption by population density for in-scope geographies
Source: BCG analysis
Description
Low end of
band (%)
High end of
band (%)
Major city Within limits of a city
with population of >1M
(2M for China)40 80
MSA Part of a metropolitan
statistical area, but outside
the exact city limits20 40
Remaining
urban
In urban area not associated
with a major city 5 10
Rural A non-urban area 0 0
Ride-sharing adoption rate by 2030 (%)

17 Copyri
ght
© 2
017 b
y T
he B
ost
on C
onsu
ltin
g G
roup,
Inc.
All r
ights
rese
rved.
Autonomous mobility varies by region and can have a range of outcomes
China Japan EU USA Global
12
5
20
15
10
5
0
30252015
1
4
9
4
20
15
10
5
0
30252015
2
6
2
14
6
20
15
10
5
0
30252015
10
4
19
5
0
30252015
10
15
20
7 8
20
10
0
30252015
15
5 431
Autonomous mobility veh.
as a % of vehicles sold
Autonomous mobility veh.
as a % of vehicles sold
Autonomous mobility veh.
as a % of vehicles sold
Autonomous mobility veh.
as a % of vehicles sold
Autonomous mobility veh.
as a % of vehicles sold
Note: Growth based on 2005-2017 adoption rate of smartphones (used from 2022 onwards)
Source: BCG analysis
High end of band Low end of band

18 Copyri
ght
© 2
017 b
y T
he B
ost
on C
onsu
ltin
g G
roup,
Inc.
All r
ights
rese
rved.
BCG market forecast to 2030 (global view)
100
80
0
90
110
60
70
64%
8%
10%
1%
2016
90
2015
87
13%
3%
7%
2025
105
67%
9%
8%
8%
2%
6%
2024
104
70%
10%
8%
7%
2%
4%
2023
104
2022
102
2021
100
2020
98
78%
14%
2%
3%
1%
1%
2019
96
2018
93
2017
91
76%
Volume (M)
1%
2%
1%
2030
109
47%
5%
15%
13%
6%
14%
2029
108
53%
6%
12%
5%
12%
9%
2028
107
57%
6%
12%
11%
4%
10%
2027
106
61%
7%
11%
10%
3%
8%
2026
105
19%
DieselMHEVHEVPHEVBEV Gasoline
Source: BCG analysis
Regulation-driven Consumer-driven
Mobility impact

19 Copyri
ght
© 2
017 b
y T
he B
ost
on C
onsu
ltin
g G
roup,
Inc.
All r
ights
rese
rved.
US market will see increased growth in MHEVs beginning in 2021; EUR market growth in BEVs will occur between 2023 and 2025
Source: BCG analysis
US
pro
jecti
ons
EU
pro
jecti
ons
15
10
0
20
32%
12%
16%
3%
48%
13%
2024
19
20232022 202520212020 2026
19
58%
2027
36%
1%
2028
2%
1%
2029
Volume (M)
8%
22%
2030
19
6%
21%
7%
11%
2019201820172016
19
2015
18
20
15
10
0
17
2020 2021 2022 2023 2024
8%
1%
10%
16%
3%
63%
17
2025 2026 2027 2029
20%
2%
12%
16%
3%
48%
17
20302028
Volume (M)
4%
91%
0%
3%
1%
1%
2019201820172016
17
2015
17
MHEV DieselHEVPHEVBEV Gasoline

20 Copyri
ght
© 2
017 b
y T
he B
ost
on C
onsu
ltin
g G
roup,
Inc.
All r
ights
rese
rved.
Volume in China will be driven by BEVs and PHEVs; in Japan, by HEVs and MHEVs owing to different driving patterns and OEM focus
Source: BCG analysis
Chin
a
pro
jecti
ons
Japan
pro
jecti
ons
6
0
4
202720262025
5
51%
3%
18%
20%
3%
4%
202420232015 20212020
5
64%
6%
12%
14%
2%
2019
5
Volume (M)
2016
5
2017 2018 2030
5
34%
2%
23%
24%
6%
12%
202920282022
0
35
25
30
20262025
32
81%
1%
5%
4%
6%
202420232022
3%28
Volume (M)
2030
35
55%
1%
2020
11%
7%
10%
17%
20292021 20282027
92%
2%
1%
1%
2%
2019201820172016
25
2015
22
GasolineDieselMHEVHEVPHEVBEV

21 Copyri
ght
© 2
017 b
y T
he B
ost
on C
onsu
ltin
g G
roup,
Inc.
All r
ights
rese
rved.
Incentives and lower battery costs could increase the share of BEVs
Source: BCG analysis
Impact on powertrain technologies Δ to base case
(% of global market 2030)
Base case Sensitivity ICE Diesel MHEV HEV PHEV BEV
High oil price Oil at $60/barrel Oil at $90/barrel (3.4) 0.6 1.0 0.4 0.6 0.9
Low battery
costs
Costs for TAR cost curve:
$90 per cell cost in 2030
Costs follow BCG cost curve:
$70 per cell cost in 2030 (1.5) 0.0 (1.4) 0.0 0.7 2.2
Government
incentives
No subsidies used, pure
economics forecasted
With current subsidies
for each region sustained
to 2030
(6.0) 0.0 (1.4) 0.0 2.5 4.8
Regulatory
rollback
Current CAFE regulations
remain in place in US
US administration reduces
CAFE/GHG regulations 3.4 0.0 (2.7) 0.0 0.0 (0.6)

22 Copyri
ght
© 2
017 b
y T
he B
ost
on C
onsu
ltin
g G
roup,
Inc.
All r
ights
rese
rved.Devise a pricing strategy to
incentivize customers to buy
xEVs to meet regulations
Make or buy new powertrain
modules and components
Manage differentiation in a
BEV environment
Invest in a charging network
Identify the highest areas of
value and key OEMs to
partner with
Manage the profitability of
manufacturing ICE
components
Adjust the level and timing of
investment
Support the development of a
charging infrastructure in
urban centers
Determine the level of incen-
tives to sustain momentum
until a breakeven TCO
Manage the shift in energy
source and the associated
shift in tax revenues
OEMs Suppliers Government
Key implications

23 Copyri
ght
© 2
017 b
y T
he B
ost
on C
onsu
ltin
g G
roup,
Inc.
All r
ights
rese
rved.
Author team and regional experts Selected publications and research
Xavier MosquetSenior partner
BCG Detroit
Hadi Zablit Senior partner
BCG Paris
Aakash Arora Principal
BCG Detroit
Andreas DingerSenior partner
BCG Munich
Gabe Rodriguez-GarrigaProject leader
BCG Detroit
Gang XuPartner
BCG Shanghai
Chris LaChanceProject leader
BCG Detroit
Michelle AndersenPartner
BCG Detroit
Eric GruskinAssociate
BCG Detroit
Kazutoshi TominagaPartner
BCG Tokyo
Making Autonomous Vehicles a Reality:
Lessons from Boston and BeyondA report by BCG and the World Economic Forum
October 2017
Self-Driving Vehicles, Robo-Taxis, and the
Urban Mobility RevolutionA report by BCG and the World Economic Forum
July 2016
Revolution in the Driver’s Seat: The Road
to Autonomous VehiclesA report by BCG
April 2015
To request more information on this research, please contact [email protected].
To request a media interview, please contact Eric
Gregoire at [email protected].
To discuss the findings with a BCG expert, please
contact Irene Perzylo at [email protected].
Revolution Versus Regulation: The Make-
or-Break Questions About Autonomous
VehiclesA report by BCG and the World Economic Forum
September 2015