
The Effects of Welfare-to-Work Program Activities on Labor Market …repec.iza.org/dp1520.pdf ·...
48
IZA DP No. 1520 The Effects of Welfare-to-Work Program Activities on Labor Market Outcomes Andrew Dyke Carolyn J. Heinrich Peter R. Mueser Kenneth R. Troske DISCUSSION PAPER SERIES Forschungsinstitut zur Zukunft der Arbeit Institute for the Study of Labor March 2005
Transcript of The Effects of Welfare-to-Work Program Activities on Labor Market …repec.iza.org/dp1520.pdf ·...

IZA DP No. 1520
The Effects of Welfare-to-WorkProgram Activities on Labor Market Outcomes
Andrew DykeCarolyn J. HeinrichPeter R. MueserKenneth R. Troske
DI
SC
US
SI
ON
P
AP
ER
S
ER
IE
S
Forschungsinstitut
zur Zukunft der Arbeit
Institute for the Study
of Labor
March 2005

The Effects of Welfare-to-Work
Program Activities on Labor Market Outcomes
Andrew Dyke University of North Carolina-Chapel Hill
Carolyn J. Heinrich
LaFollette School of Public Affairs, University of Wisconsin-Madison
Peter R. Mueser University of Missouri-Columbia
and IZA Bonn
Kenneth R. Troske University of Missouri-Columbia
and IZA Bonn
Discussion Paper No. 1520 March 2005
IZA
P.O. Box 7240 53072 Bonn
Germany
Phone: +49-228-3894-0 Fax: +49-228-3894-180
Email: [email protected]
Any opinions expressed here are those of the author(s) and not those of the institute. Research disseminated by IZA may include views on policy, but the institute itself takes no institutional policy positions. The Institute for the Study of Labor (IZA) in Bonn is a local and virtual international research center and a place of communication between science, politics and business. IZA is an independent nonprofit company supported by Deutsche Post World Net. The center is associated with the University of Bonn and offers a stimulating research environment through its research networks, research support, and visitors and doctoral programs. IZA engages in (i) original and internationally competitive research in all fields of labor economics, (ii) development of policy concepts, and (iii) dissemination of research results and concepts to the interested public. IZA Discussion Papers often represent preliminary work and are circulated to encourage discussion. Citation of such a paper should account for its provisional character. A revised version may be available directly from the author.

IZA Discussion Paper No. 1520 March 2005
ABSTRACT
The Effects of Welfare-to-Work Program Activities on Labor Market Outcomes∗
Studies examining the effectiveness of welfare-to-work programs present findings that are mixed and sometimes at odds, in part due to research design, data, and methodological limitations of the studies. We aim to substantially improve on past approaches to estimate program effectiveness by using administrative data on welfare recipients in Missouri and North Carolina to obtain separate estimates of the effects of participating in sub-programs of each state's welfare-to-work program. Using data on all women who entered welfare between the second quarter of 1997 and fourth quarter of 1999 in these states, we follow recipients for sixteen quarters and model their quarterly earnings as a function of demographic characteristics, prior welfare and work experience, the specific types of welfare-to-work programs in which they participate, and time since participation. We focus primarily on three types of subprograms–assessment, job readiness and job search assistance, and more intensive programs designed to augment human capital skills–and use a variety of methods that allow us to compare how common assumptions influence results. In general, we find that the impacts of program participation are negative in the quarters immediately following participation but improve over time, in most cases turning positive in the second year after participation. The results also show that more intensive training is associated with greater initial earnings losses but also greater earnings gains in the long run. JEL Classification: J31 Keywords: evaluation, training, sub-programs, welfare Corresponding author: Kenneth R. Troske Department of Economics 118 Professional Bldg. University of Missouri-Columbia Columbia, MO 65211 USA Email: [email protected] ∗ We would like to thank Seth Sanders, Jeff Smith, Ed Vytlacil, Jennifer Ward-Batts and participants at the 2004 Summer Research Workshop at the Institute for Research on Poverty for helpful comments. Peter Mueser and Kenneth Troske wish to thank Kyung-Seong Jeon for his work in analyzing the data. This work was supported by a grant from the Rockefeller/Russell Sage Future of Work program. Any errors are our own.

1 See recent reviews of this literature by Leahey (2001) and Barnow and Gubits (2002).
1
I. Introduction
Public investments in programs designed to move welfare recipients into the labor market–
commonly known as welfare-to-work programs–are made with the expectation that these
services will increase participants’ employment success both by aiding their search activities and
by improving their general skill levels. Yet a growing number of studies examining the
effectiveness of different state-level programs to help welfare recipients become employed and
exit welfare present mixed and sometimes discrepant findings.1 One reason for these mixed
finding is inadequacies in research design, data, and methodologies for assessing program
effects. Many studies examining welfare-to-work programs treat the program as a single entity,
when in fact, these programs typically consist of a variety of different sub-programs providing
training such as: basic education; job preparation and search assistance; and/or vocational and
on-the-job training. If outcomes differ by sub-program, then the different findings could reflect
different states emphasizing different sub-programs in their overall welfare-to-work program.
Conflicting findings have, in turn, engendered an active debate over whether strategies
designed to provide more intensive training opportunities versus those intended to help welfare
recipients get into jobs quickly–referred to as “work-first” approaches–are more effective in
assuring welfare recipients’ labor market success. In their synthesis of the findings of a large
number of studies on welfare recipient welfare-to-work and training program outcomes, Barnow
and Gubits (2002) report that longer-term, more intensive training strategies appear to be
considerably more effective than short-term, work-first strategies. Alternatively, in their review
of experimental evaluation findings from 20 programs, Bloom and Michalopolous (2001)

2
concluded that the most effective programs combined employment-focused and
education/training strategies, with some flexibility allowed in determining the appropriate mix of
these approaches for a given individual. These conclusions are at least partly at odds with the
welfare reforms of the mid-1990s, which were predicated on the belief that welfare recipients
needed jobs, not education and training, to advance in the labor market (Haskins and Blank,
2001).
In this paper we use administrative data on welfare recipients in the states of Missouri
and North Carolina to obtain separate estimates of the effects of participating in sub-programs of
each state’s welfare-to-work program. Our data consist of all women who enter welfare between
1997:2 and 1999:4. We follow recipients for up to sixteen quarters after they enter welfare and
model their quarterly earnings as a function of demographic characteristics, prior welfare and
work experience, and the specific types of welfare-to-work programs in which they participate.
We divide training into three categories on the basis of the intensity of the activity. First,
we identify those who went through assessment but received no other training. Second, we
consider those who participated in job readiness or job search activities, generally short term
programs that are central to a work-first strategy. Third, we consider those who receive more
intensive training, including basic education, vocational skills training, or other longer-term
programs. The results from this analysis provide a clearer picture of differences in the effects of
the sub-programs in terms of subsequent labor market success than found in previous studies.
The remainder of the paper is as follows. In the next section we provide a brief review of
relevant literature. In section III we describe our data and present the details of our empirical
analysis. In section IV we introduce the various sub-programs that are part of each state’s

3
welfare-to-work program. In section V we present estimates of the effects of the various
activities on the earnings of welfare recipients based on a simple linear model. Section VI
presents results of tests of whether the simple measures properly capture participation, and
section VII examines how the impact of participation differs by subgroup. In section VIII we
conclude.
II. Evaluation of Welfare-to-Work Programs
As recent literature reviews by Leahey (2001) and Barnow and Gubits (2002) point out, broad
areas of disagreement exist concerning the effects of programs designed to increase the
employment, earnings, and probability of exit among women receiving welfare. Barnow and
Gubits (2002) note that one reason for these inconsistent findings is that many studies do not
adequately distinguish between specific types of services or activities. For example, it is
common to see studies group low-cost, job-oriented activities together with the traditionally
more intensive and expensive on-the-job training programs, which essentially muddles the
distinction between a work-first strategy and one intended to increase general human capital.
Some studies are plagued by unreliable records of individuals' participation in specific program
activities. Furthermore, there are always the problems associated with program services or
activities that are not implemented as planned, and this likewise is typically not distinguished in
individual service records.
Any program analysis faces the complication that approaches to aiding welfare recipients
and other disadvantaged groups which focus on building human capital are rarely fully
developed and implemented in welfare-to-work programs (Gueron and Pauly, 1991; Jencks and
2In the GAIN program, Riverside’s emphasis on job search activities contrasted withother county approaches, particularly those of Alameda and Los Angeles, which emphasizedhuman capital development and had more registrants in basic skills activities. Adjusteddifference-in-differences comparisons of Riverside-Alameda and Riverside-Los Angeles showedthat initial differences in program effects (on yearly earnings) were large and in favor ofRiverside; however, these were followed by a substantial and steady decline in Riverside’seffects, leading to better outcomes (i.e., higher employment rates and earnings) in LosAngelesand Alameda than in Riverside in the later years (4-6), albeit not significantly so.
4
Edin, 1992; Friedlander and Burtless, 1995). Even among programs that implement such
strategies, few have collected sufficient longitudinal data to fully assess their effects. Studies
that extend analyses beyond three year tend to reach different conclusions than short-term
assessments; see for example, both the shorter-term and longer-term analyses of the effects of
Riverside, California's GAIN program (Riccio et al., 1994 and Hotz et al., 2001).2 In addition,
Jacobson, LaLonde and Sullivan’s research on displaced workers (1994, 2004), which uses an
eight-year follow-up period, similarly suggests that estimates of participants earnings will be
lower for about two years following a more intensive classroom training activity, but that
subsequent earnings effects turn positive. They conclude that “…when follow-up periods are
relatively short, allowance needs to be made for a transition period... a simple average of the
effects during a short follow-up period will tend to underestimate the true, long-run effects of
retraining” (Jacobson, LaLonde and Sullivan, 2004, p. 22).
An additional and related reason for the divergent findings is that researchers’ definitions
of what constitute longer- versus shorter-term programs differ widely. Some of the “longer-
term,” intensive education and training strategies in current welfare-to-work programs limit
participation to 12 weeks. This contrasts with the earlier Job Opportunities and Basic Skills
(JOBS) and Job Training Partnership Act (JTPA) programs, which generally defined long-term

5
training as lasting six months to two years. In addition, few studies assess the cumulative effects
of multiple, short-term episodes of participation in various types of welfare-to-work or training
program activities.
More generally, this brief discussion suggests that we need better measures of welfare-to-
work and training program activities, as well as a better understanding of what we are
measuring. Our study of the effects of welfare-to-work program activities on the labor market
outcomes of female welfare recipients responds to several shortcomings in the current literature.
First, we examine participation in specific welfare-to-work program activities over a period
when the emphasis on and use of alternative service strategies were changing. With
comprehensive information on the types of services provided and the timing of participation, we
assess the average and cumulative effects of different types of program activities on welfare
recipients' outcomes. We use complete data on the populations of welfare recipients in two
states, facilitating a comparison of program effects across sites using the same approach and
methods of analysis.
III. Data and Method of Analysis
Our analysis examines cash recipients in the Temporary Assistance for Needy Families (TANF)
programs in the states of Missouri and North Carolina. Our data come from records maintained
to administer the states’ welfare programs, providing basic demographic and household
information.
Our examination of employment for welfare recipients relies on earnings data collected
by the states in support of their unemployment insurance programs. Employers report total

3Approximately one in seven jobs held by welfare recipients in Jackson County (thecentral county in the Kansas City metropolitan area) is in Kansas. In St. Louis, the proportion ofindividuals holding jobs in Illinois is much lower, reflecting the relatively poor economy in EastSt. Louis.
4Kornfeld and Bloom (1997) compare experimental (job-training program) earningsimpact estimates calculated using unemployment insurance (UI) data with those based on othermore costly earnings data sources and conclude that UI wage data provide valid estimates for alllow income persons except a small subgroup of male youths with past arrests.
5The payee in a child only case is not a parent and receives payment on behalf of thechildren. Such payees normally do not face work or training requirements, and their incomedoes not count in the calculation of benefits.
6
earnings for each individual in covered employment during each quarter, and we merge this
information with records of welfare recipients. While these data omit self-employment, illegal
or informal employment, and a small number of jobs not covered by unemployment insurance,
the overwhelming majority of employment within each state is included. For welfare recipients
in Missouri, we use employment data collected by the states of Missouri and Kansas, ensuring
employment coverage for welfare recipients in Kansas City, Missouri, who often work in
Kansas.3 For welfare recipients in North Carolina, we use that state’s employment data. Of
course, employment will be understated for individuals who move out of state after leaving
welfare.4 We correct all earnings measures for inflation relative to 1997:2.
We focus on female payees, age 18 but less than 65 years, in single parent households,
excluding “child only” cases.5 We use quarters as our time unit, so that an individual who
receives TANF cash payments at any point during a given quarter is considered a welfare
recipient during that quarter. This approach tends to smooth welfare receipt, eliminating
apparent movements off of welfare that are due to administrative errors and cause a case to be

6Luks and Brady (2003) studied the definition of welfare spells and concluded thatbecause of “administrative churning,” a break of up to three months is necessary in most cases tosay with confidence that a recipient has gone off of welfare.
7We do not have a full 16 quarters of follow-up data for those entering TANF near theend of our entry window.
7
omitted from the files for a month or two.6 We focus on the subset of individuals who are new
entrants into the TANF cash program during the quarters 1997:2 through 1999:4, that is, those
who receive payments during at least one of these quarters but not the prior quarter. We then
follow these individuals for a total of up to 16 quarters, identifying their participation in work
component activities and their earnings during each quarter.7
Our dependent variable is earnings obtained in a specific quarter, and the determinants
include individual characteristics, labor market experience and welfare receipt prior to the
welfare entry that we observe, measures of the local labor market during the current quarter, and
work component participation after entering welfare. Since an individual who enters welfare and
then obtains adequate employment will subsequently be required to move off of welfare, taking
account of welfare exits would be tantamount to controlling for labor market success. We
therefore structure our analysis to predict earnings in the 16 quarters beginning with welfare
entry regardless of whether the individual leaves welfare during that period.
For an individual who leaves welfare for at least one quarter and then returns, we must
decide how each entry onto welfare is to be treated. In the absence of welfare data prior to 1995
in North Carolina, we are not able to identify a “first” entry onto welfare. Eliminating
subsequent welfare entries after the first entry observed would omit later welfare entries but not
earlier ones. We therefore treat each entry onto welfare separately, counting the 16 quarters

8We found that in both Missouri and North Carolina, approximately one in ten quarters inour analysis appears twice, with less than 1 percent of earnings quarters appearing more thantwice.
9We use the term “work component” to refer to the particular components or sub-programs of welfare-to-work program activities.
8
from that entry even if those same quarters are also included in the period following a prior or
subsequent entry.8 The analysis should thus be properly viewed as identifying earnings
outcomes following a particular entry onto welfare. We control for the extent of the welfare
experience in the prior two years, but we do not control for past participation in welfare-to-work
activities or other training. Hence, the estimated impact of welfare-to-work (or work
component9) participation is an incremental impact, indicating the effect beyond whatever
training was received prior to entering welfare. As such, these estimates address the appropriate
policy question of how the “average” welfare recipient’s earnings trajectory is affected by these
welfare-to-work and training program activities.
It is important to recognize that entry onto welfare is selective not only of particular
kinds of individuals but is also selective along a temporal dimension for these individuals. We
focus on female payees in single-parent households, with the obvious implication that a woman
can only enter welfare during a period when she is caring for children without the financial
support of a partner. It must also be a period in which her own earnings are low enough that she
qualifies for TANF payments. For low-skilled individuals who are normally employed, entry
onto welfare will occur in a period where there is an unexpected negative event or circumstance,
that is, a period of unusually “bad luck.” Insofar as such circumstances are not perfectly
correlated over time, subsequent earnings would be expected to increase even in the absence of
9
any government intervention. For this reason, our analysis will control for the time since entry
onto welfare for the individual. This approach accounts for “regression to the mean” and for the
impacts of the TANF program that may not be captured in work component participation.
Perhaps the most important challenge in assessing the impact of participation in work
component programs is that participation is not random. Whether a TANF recipient is required
to participate in a work component activity, and the activity that is recommended, depends on
the circumstances of the recipient. Program rules exempt certain recipients from participation,
such as individuals with very young children. Other exemptions are based on the judgment of the
caseworker, as where an individual is viewed as facing personal obstacles that make it too
difficult to engage in training or employment. There is also an element of personal choice. In
Missouri, individuals who fail to participate in required programs face sanctions that reduce their
payments (generally by about 25 percent) but are permitted to continue receiving these reduced
TANF benefits until the five years of eligibility is exhausted. However, in North Carolina, those
who fail to cooperate can have the full value of their benefit withheld. Equally important, in
both Missouri and North Carolina, individuals who work a minimum number of hours are
exempted from participation in work component activities. As a result, those who participate
may be individuals whose labor market opportunities are particularly limited or who are facing
an extended streak of bad luck.
We attempt to deal with the problem of selection in a number of ways. As noted above,
we control for a variety of personal characteristics, including number and age of children and
recipient educational attainment, in addition to labor market experiences in the two years prior to
entering welfare. We also fit models that control for individual fixed effects. This approach, in
10
essence, obtains estimates of the impact of work component participation by comparing a
recipient’s experience prior to component participation with her subsequent experience. Finally,
in a further attempt to control for selection, we assume that selection into assessment is similar to
selection into the other sub-programs, and we therefore estimate the effects of the other programs
relative to the effect of assessment. If assessment provides very little benefit to
participants–which seems reasonable given the limited time individuals spend in assessment–this
approach should provide accurate estimates of the impacts of job search and intensive training.
The models we estimate make a variety of assumptions about the effects of the program
and the control variables used. In the initial set of models we present, program impacts are
assumed to be the same for all individuals, and the linear structure is assumed to adequately
control for all relevant variables. If impacts of either the program or control variables differ by
subgroup, estimates of program effects may be biased. As a test of the models’ assumptions, we
estimate the model for three groups based on prior employment experience. Our findings
suggest that even if the model’s assumptions are, in fact, violated our basic findings are robust to
these violations.
Matching methods are more general than linear models in that they provide estimates of
program effects that relax several of the assumptions of the linear model. First, these models
recognize that program effects may differ across individuals, explicitly producing estimates that
are averages in the specified population. In addition, it is well-known that linear regression
models of the kind we are using may perform badly when participants and comparison groups
have very different values on control variables. In the extreme case, some of the treated cases
may not have any comparable cases in the comparison sample, and a matching approach allows
11
us to identify such failures of common support. We implement propensity score matching to
determine whether this approach provides different estimates. Since the results of the matching
analysis produce very similar program effect estimates, we present them in abbreviated form in
an appendix.
We also undertook an instrumental variables estimation approach, using variation over
time in the level of participation in training programs across counties as the identifying variable.
However, estimates were frequently implausible, suggesting that the identifying variable was
correlated with unmeasured individual or labor market differences. We therefore do not report
those estimates here.
IV. Work Component Activities
The emphasis on moving welfare recipients to work began to take concrete form in the early
1990s with the implementation of the federal JOBS program, which, for the first time, required
states to provide explicit services to recipients of Aid to Families with Dependent Children
(AFDC). These programs expanded during the decade under federal waivers to states that
allowed modification of the AFDC program and then under the federal reforms that replaced
AFDC with Temporary Assistance for Needy Families (TANF). Nationally, there was
substantial emphasis on the work-first approach, which focused primarily on getting recipients
into jobs and only secondarily on training programs to improve skills. North Carolina explicitly
adopted this strategy, whereas Missouri’s approach was less clear. North Carolina’s TANF
program website describes its approach as “grounded in the ‘work-first’ philosophy,” with a
10 North Carolina TANF website: http://www.joblink.state.nc.us/centers/resources.asp.
11Although case managers are formally required to specify the date when assessment iscompleted, in practice they may frequently fail to enter it. In some cases, this may occur whenindividuals are classified as exempt or are removed from the program for some other reasons.
12
“primary focus on job placement assistance.”10 Under JOBS, Missouri had tended to emphasize
long-term training, and the program was modified in the direction of work-first only in the face
of federal pressure implicit in the TANF rules. Nonetheless, Missouri’s program retained a
greater emphasis on long-term training, and, by 2000, Missouri had managed another policy
turnaround, adopting rules that increased the ability of TANF recipients to engage in long-term
training.
We have classified the various work component activities into six categories that allow
comparability between Missouri and North Carolina. Table 1 provides basic information on the
character of these activities. We present statistics on the duration of each activity and the
number of hours per week of participation normally scheduled. We have calculated duration as
the number of weeks between the date the activity commences and the date when it is completed.
As expected, there are substantial differences between activities in their duration and
intensity, as well as differences between states. The first category, assessment, may include
formal paper-and-pencil testing, as well as development of a “self-sufficiency plan,” which
provides a schedule of activities leading to employment and exit from TANF. In North Carolina,
the numbers in the table show that these activities usually take only around three hours per week
and extend for less than two weeks. In Missouri, both the reported duration and intensity of
assessment activities are greater, but we have evidence that the longer duration is at least partly
due to systematic errors in data entry.11

By statute, assessment can take no more than 30 days, in contrast to a median reportedassessment time of 4.9 weeks. We were told that apparent deviations from the 30-day limit verylikely reflect entry errors.
12In Missouri, caseworkers are instructed to include in the scheduled hours one hour ofstudy for each class hour, so 17 scheduled hours would indicate 8.5 hours of classes per week,more than half-time in most colleges. We suspect that the 42.5 hours per week scheduled inNorth Carolina reflects a more liberal coding for study time.
13
Job search and job readiness training appear to have similar levels of intensity in both
locations, although the upper tail is much higher for Missouri, likely reflecting data errors. The
types of activities defined as “work experience” may differ appreciably across programs.
Nonetheless, the patterns of participation are similar in the two states, again with the exception
of Missouri’s longer upper tail.
The category basic education includes attendance in public schools up through twelfth
grade, and English as a second language training, although the largest category by far is adult
education and literacy programs, such as those preparing individuals for the high school
equivalency diploma. Interestingly, the median number of weeks is slightly greater in North
Carolina than in Missouri, although there are more individuals with very long recorded
involvement in Missouri.
The typical vocational and technical skills training program lasts about nine weeks in
Missouri but only six weeks in North Carolina. In the case of post-secondary education, the
median involvement is about 20 weeks in Missouri but only 14 in North Carolina. Yet, the
number of hours of involvement per week is much higher in North Carolina, with the median
over 40 hours as compared to less than 20 in Missouri, very likely due to differences in coding
practices.12

14
Despite differences in the duration of training, it is worth noting that the median duration
of participation is short in all activities, less than 10 weeks in every category except for post-
secondary education. Differences in duration among recipients in a particular type of activity are
greater in Missouri than in North Carolina, due largely to the longer upper tail in the Missouri
distribution.
In order to avoid problems associated with small numbers of observations, we group
together activities in the bottom four categories as “intensive.” Although there is appreciable
variation among them, in both states median duration is longer for each of these categories than
for assessment, or job readiness and job search. We therefore consider the three categories of
participation as assessment, job readiness or job search, and intensive training. This
classification also allows us to easily compare the effect of participation in work-first activities,
such as job search, with more intensive activities, such as vocational education, that are designed
to enhance participants’ human capital. In a later section we consider how this aggregation
affects our results.
Since a large share of participants enter more than one type of component, it is necessary
to decide how impacts will be gauged in such cases. A simple additive model would assume that
a component contributes to outcomes without regard for whether it is combined with other
components. Such an approach would also require that we decide how individuals who
participate in more than one component within our categories will be treated. In keeping with
our focus on the impact of component intensity, we have identified the type of training by the
highest intensity component that the individual participated in since coming onto welfare. In
particular, a quarter is coded as “assessment only” if the individual received assessment services
15
at some prior point since coming onto welfare but has not received any other work component
services. The “job readiness or job search” category applies to quarters following receipt of such
services; although assessment may have occurred since entering welfare, no intensive services
would have been received. The final category, intensive services, applies to quarters following
the receipt of intensive services, without regard for whether any other services were received.
Hence, the intensive service category includes any effects of other services received by such
individuals, and impact estimates must be interpreted accordingly.
TANF recipients are most likely to participate in work components in the first year after
they enter the program. Table 2 indicates job component participation by quarter since entering
welfare. The sample of cases is limited to those entering welfare in 1997:2-1997:4 in order to
allow us to examine a full 16 quarters of data following entry. The first column of figures
shows that, in Missouri, 10 percent of the sample participates in some component in the entry
quarter, whereas the number for North Carolina is 9 percent.
In both states, the proportion who had participated in at least one component (the sum of
the last four columns) increases to over 20 percent in the quarter following entry. The number
increases somewhat more slowly in successive quarters, exceeding half by the end of our 16-
quarter period. Since most individuals do not enter welfare at the beginning of a quarter, it is
easy to see that the hazard of beginning a first work component (that is the chance per unit time)
must be at its highest in the quarter in which they enter welfare, declining in each quarter after
that. In both states, for those individuals who have participated in at least one work component
activity in the four years after entering TANF, about 80 percent had participated in the first two
years.
16
Of course, the chance of participation declines over time in part because, after several
quarters, a substantial portion of recipients have left welfare. Comparing columns 1 and 2 in the
table, we see that by quarter 3 most of those who had not participated in any component had left
welfare, and, by quarter 11, about 95 percent of those who had not participated had left welfare.
These patterns likely reflect in part the strict work and program participation requirements for
welfare recipients following the 1996 welfare reforms. In turn, it is clear that the welfare exit rate
has an important impact on the pattern of overall participation in work component activities that
we observe, since almost everyone who continues to receive welfare participates within several
years.
Of those participating in a component in their first quarter, in both states more than half
participate in assessment only, while about a quarter in both states are listed as participants in job
search/readiness (these may or may not have participated in assessment). More than twice as
many participants in Missouri (as in North Carolina)–nearly a third of those participating in
some component–participate in an intensive activity in the first quarter. As we look at later
quarters, we see that there is greater involvement in intensive activities in Missouri, but that by
the end of the 16 quarters, most of the difference has disappeared.
Other patterns are quite similar across the two states, although by quarter 15, a
substantially larger share of North Carolina’s recipients have participated in assessment only,
while more Missouri recipients have participated in job search/readiness. It is perhaps useful to
note that in both Missouri and North Carolina, the number of recipients coded as having
participated in assessment remains steady after about the eighth quarter. This implies that
although new participants may be assessed each quarter, an equal number of those who were
17
assessed in prior quarters are receiving other services.
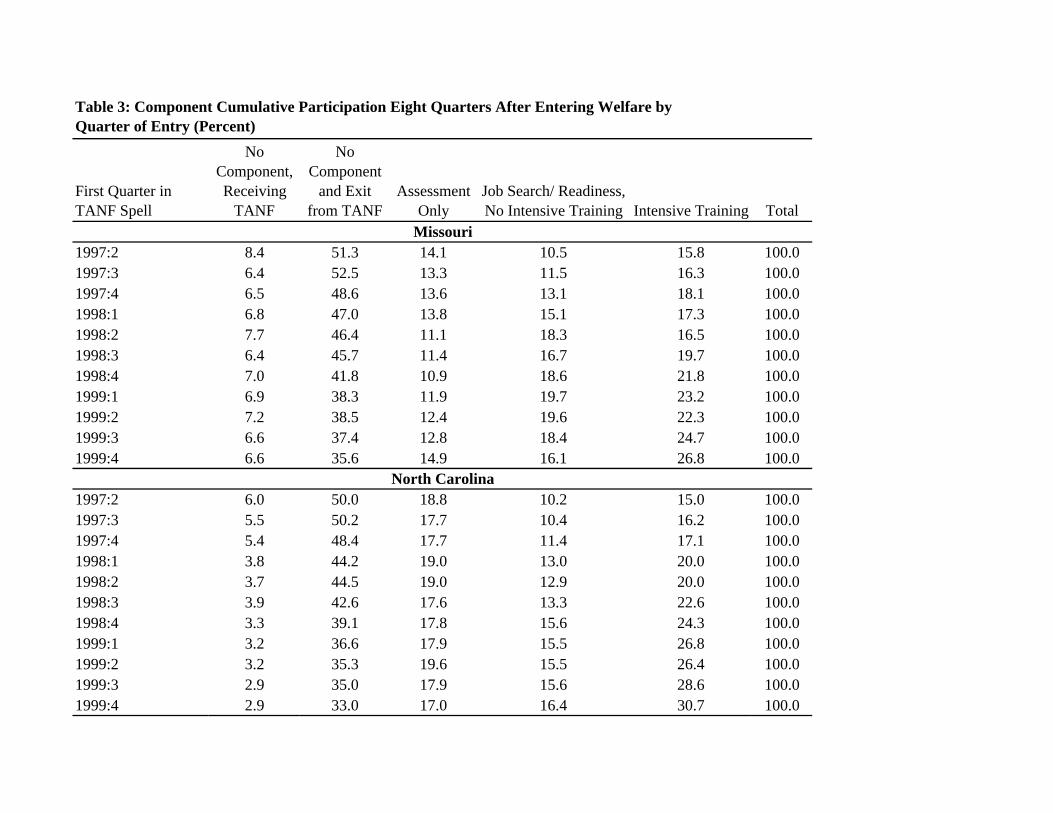
How has participation changed for those entering welfare during the period of our study?
Table 3 examines cumulative participation at the eighth quarter after entering TANF by quarter
of entry. We see in both states that the chance of participation in at least one component has
increased from about 40 percent to over 50 percent. The two more intensive activities show
substantial increases, both increasing by more than 50 percent. The assessment category does
not increase over time. This is a result of the fact that although more individuals are, in fact,
receiving assessment services, the growth in other services hides this. This analysis of work
component participation suggests that the differences in welfare-to-work strategies adopted by
North Carolina and Missouri are primarily rhetorical, and that patterns of participation in the
different activities are not only similar, but changing in similar ways over time.
V. Effects of Work Component Participation
The outcome of interest is the earnings in a quarter for an individual following entry onto TANF.
The total sample size is the number of quarters following welfare entries, and for each of the
models estimated, we correct the standard errors to account for clustering, i.e., the impact of a
common error structure for earnings of a given individual.
Work component participation is captured by two alternative specifications. In the first,
we identify whether an individual participated in any work component activity, with no
distinction according to type of activity. In the second, we distinguish activities according to the
three categories indicated above: assessment; job search and job readiness training; and intensive
activities. As described above, a given quarter is identified by the highest-order activity that the

13Heinrich et al. (2005) find that temporary help services employees have lower earningsthan other welfare recipients but experience faster earnings growth.
18
individual participated in since entering welfare. This assumes that a lower-order activity
influences earnings in quarters after it occurs but only until the individual participates in a
higher-order activity.
For each quarter following participation, we capture length of time since participation
with 16 dummies. This approach allows impacts to differ arbitrarily by time since participation
began, with the coefficient on each dummy providing an estimate of how the quarter’s earnings
are affected by participation. When the activity commences, and in the immediately subsequent
quarters, earnings may be reduced relative to what they would have been in the absence of
participation, since the individual may withdraw from the labor market. Benefits may vary as
well over later quarters as individuals seek employment and obtain job experience.13
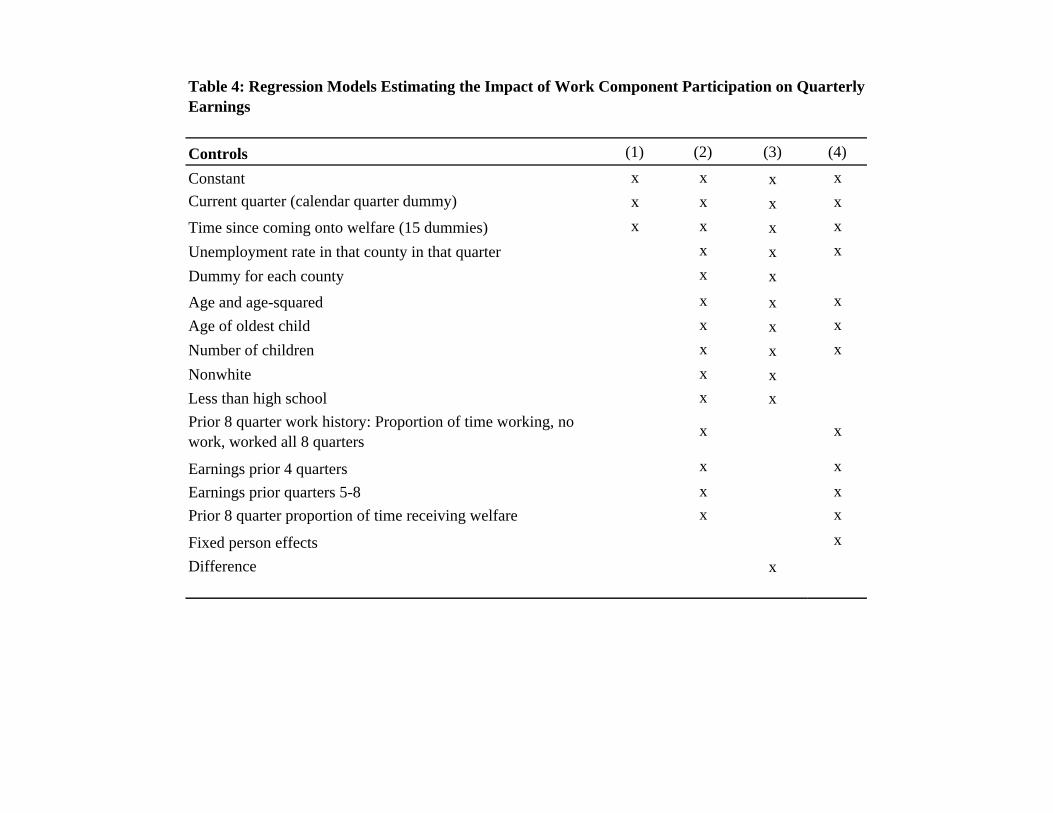
We present results based on the four models described in Table 4. Model 1 controls for
calendar quarter (dummy for each quarter) and time since coming onto welfare (15 dummies).
Model 2 adds controls for individual welfare recipient characteristics, the county unemployment
rate in the quarter, and fixed effects for each county. Model 3 is a difference specification,
where the dependent variable is the difference between earnings in the quarter in question and
the base earnings. In this analysis, the base is the average earnings in the fifth through eighth
quarters prior to entry onto welfare. We choose this period because preliminary tabulations
indicated that it precedes the dip in earnings that accompanies entry onto welfare. Model 4
predicts earnings controlling for individual fixed effects. In this specification, recipient

14Education information on the file is not generally updated during a welfare spell. Changes over time are as likely to reflect coding errors as genuine educational advancement.
19
characteristics that seldom change, such as race and education14 are omitted, as are county
dummies, because very few individuals move between counties.
Figure 1 presents the 16 quarterly impact estimates based on the specification that
considers the effects of participation without differentiating by type of activity. Although there
are obvious differences across models and states, the pattern of results is similar: participation is
associated with an earnings loss in the initial quarter of participation, which grows smaller over
time, ultimately becoming positive in most models. Model 1 shows the largest initial loss and
only in Missouri is there ever any positive increment to earnings, and that only occurs in the last
period. Model 2 produces similar results with a smaller initial loss and positive earnings
occurring sooner. Model 3 suggests that the earnings increment becomes positive in about six to
seven quarters and that the increment continues to grow. In model 4, earnings increments
become positive in the third or fourth period after beginning participation but then quickly level
out and begin to decline towards the end of the data.
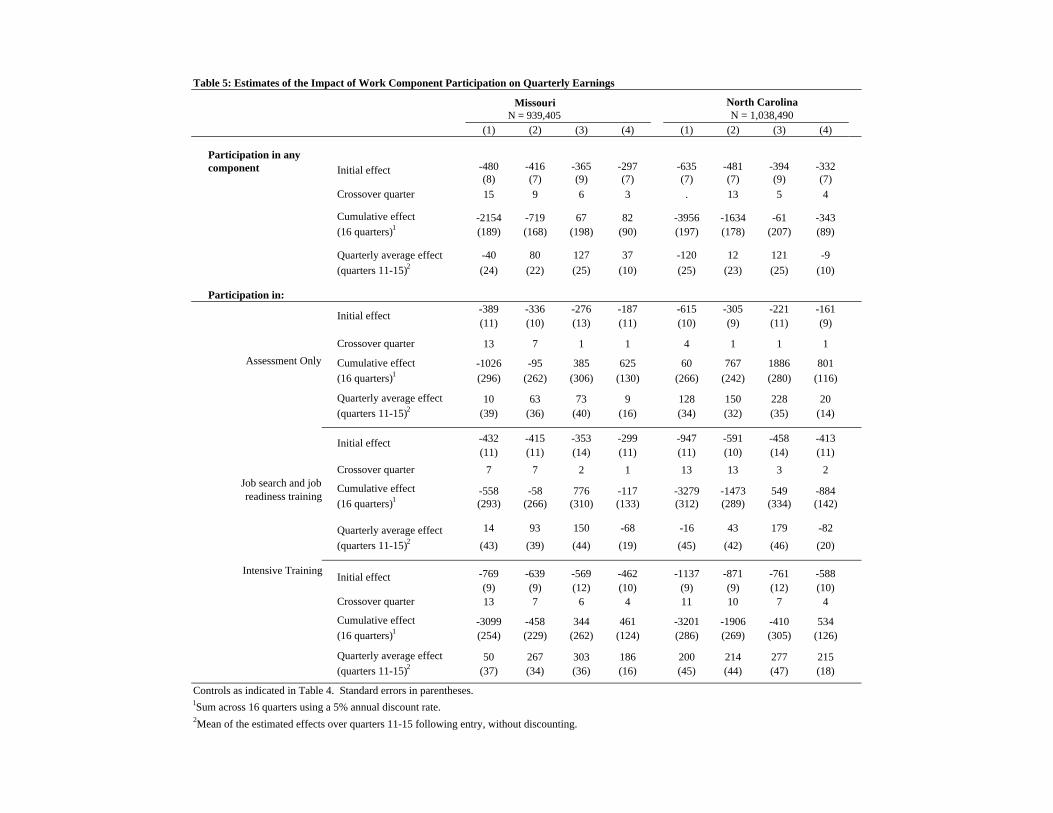
Table 5 presents some basic information about the estimated effects. The top panel
presents effects without differentiating by type of activity. The initial estimates reported in this
table are the effects on earnings in the initial quarter of participation. For Missouri, model 1
implies that earnings are reduced by $480 during the initial quarter of participation, whereas
models 2, 3, and 4 imply somewhat smaller losses. The table also reports the “crossover
quarter,” which is the first quarter with a positive estimated earnings increment, as well as the
sum of the earnings increments over the initial quarter and the 15 subsequent quarters, applying

15 Recall that we count the quarter in which someone first participates in a component asquarter 0. So, for example, if the crossover quarter is quarter 2, this is the second quarter afterthe quarter of initial entry into the program.
20
an annual discount rate of 5 percent.15 Finally, the table also reports the average quarterly effect,
which is computed as the mean increment in earnings over the last five quarters. This will be the
best estimate of the long-run impact of these programs if they provide earnings increments over
many years.
Looking at our estimates of the cumulative effect, we can see that there are substantial
differences across the three models. In both Missouri and North Carolina the estimates from
models 1 and 2 suggest large losses due to participating in these programs, while the estimates
from models 3 and 4 are either insignificantly different from zero or imply much smaller losses.
Our estimates of the average effect also vary across models, although the variation is much
smaller. Model 1 still produces negative estimates of the effect of the program, while model 3
produces significantly positive estimates of approximately $120 per quarter.
These results identify effects that combine all types of program activities, and they will
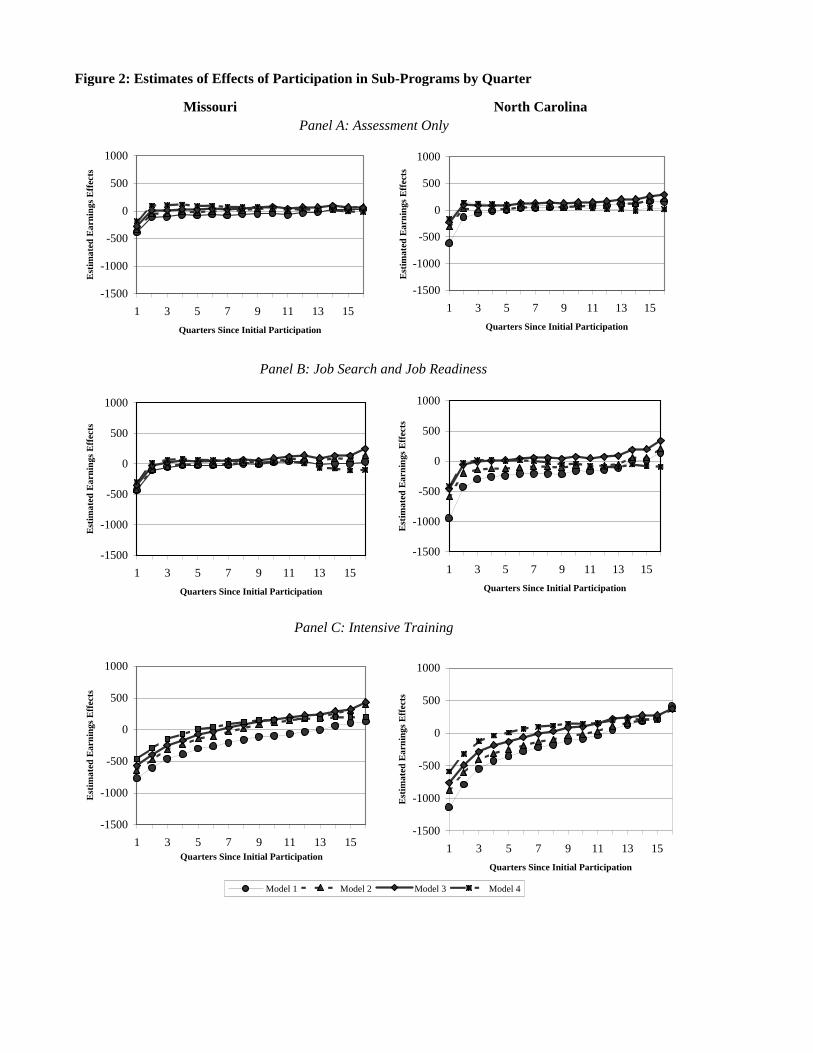
be misleading if outcomes differ by type. Figure 2 shows the effects when the three kinds of
activities are distinguished; the lower section of Table 5 provides summary measures based on
these estimates. It is worth stressing that although these are estimated in a single model, the
three categories of activity are exclusive, with a quarter classified by the highest-order activity
undertaken since entering welfare and the length of time since initial participation in that
activity.
Panel A of Figure 2 shows the effects of assessment only. We see that in both states and
in all models, the initial increment is negative, varying between about $200 and $400. The

21
subsequent effect shifts noticeably, either turning positive (models 2 and 3) or approaching zero
(model 4). Panel B shows that the effect of job search and job readiness training follows a
similar pattern, although the initial increment is larger and the shifts are more dramatic.
However, the estimated impact over the long term for job search and job readiness differs for the
three models. For both Missouri and North Carolina the estimates based on model 4 become
negative in the later quarters. In contrast, the estimates based on models 2 and 3 are positive in
the later quarters.
Panel C of Figure 2 shows that for more intensive activities, the pattern is quite different.
The earnings loss in the initial quarter of the activity is somewhat greater, but most notable is
that the effects shift less dramatically in the quarter after beginning participation. Rather than an
immediate increase, there is a gradual improvement, with the crossover point at least four
quarters after beginning participation. Of course, part of the reason that the earnings decrement
continues beyond the first quarter is that training itself may continue. However, given the
median length of training (most training requires less than one quarter), such an impact will
seldom extend past the quarter immediately following the initial participation quarter. The
estimates therefore suggest, consistent with the Jacobson et al.’s findings (1994), that
participants must undergo some period in the labor market before the benefits of the training
become evident. Perhaps most notable, the figures suggest there is a substantial positive impact
in all models in both states for the final year for which we have data.
Since model 4 controls for person fixed effects, which we expect to be of importance, we
view it as the most credible of these models on a prior grounds. The patterns of impact tend to
support this view. Estimates based on model 4 imply that the effects of intensive activities on
16In an experimental evaluation of the National Jobs Corps program, Mathematical PolicyResearch Inc. tracked the earnings of participants and control group members over a four-yearperiod and estimated that the average earnings gains for Job Corps participants in the last year offollow-up was $1,150 (McConnell and Glazerman, 2001). The estimated lifetime gains toparticipants, assuming a 4 percent discount rate and assuming that this benefit would continueindefinitely, is $31,000, which is $27,000 greater than the estimated gain in the follow-up period.
22
earnings become positive somewhat sooner than implied by the other models. At the same time,
model 4 produces more plausible estimates for long run effects of intensive training. If intensive
training increases earnings by augmenting human capital, we expect the benefits to stabilize after
two or three years as model 4 suggests, in contrast to the apparent continued increases implied
by models 2 and 3.
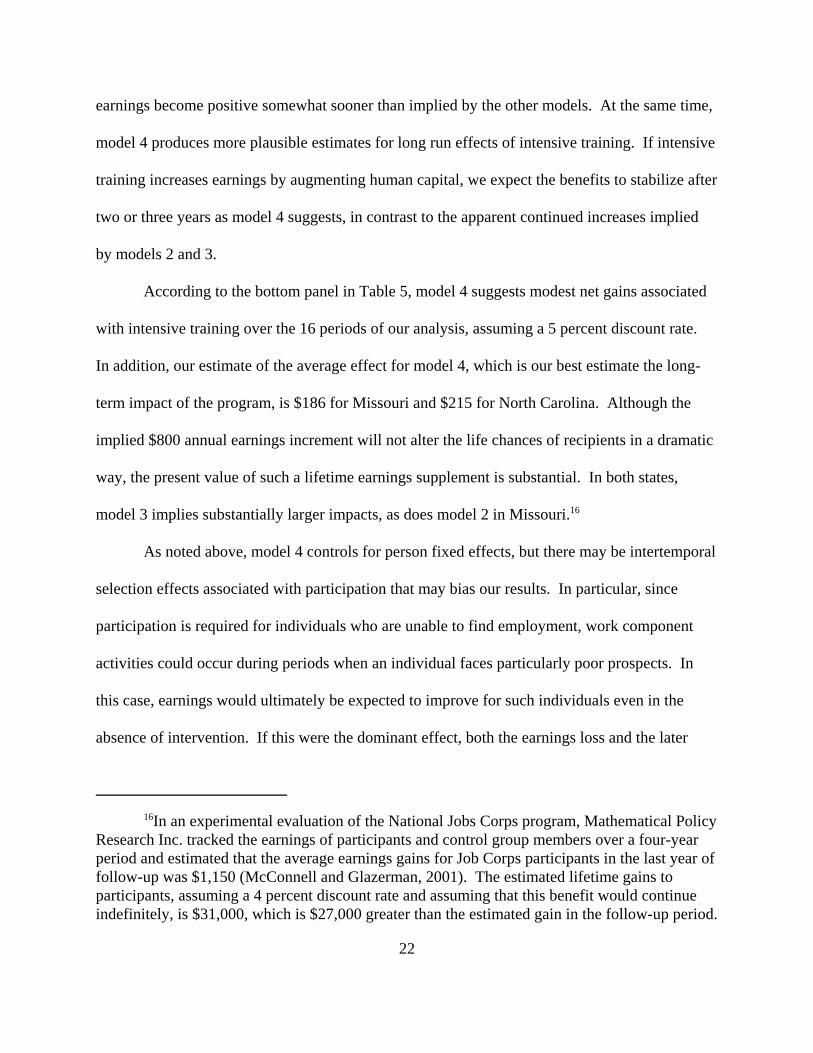
According to the bottom panel in Table 5, model 4 suggests modest net gains associated
with intensive training over the 16 periods of our analysis, assuming a 5 percent discount rate.
In addition, our estimate of the average effect for model 4, which is our best estimate the long-
term impact of the program, is $186 for Missouri and $215 for North Carolina. Although the
implied $800 annual earnings increment will not alter the life chances of recipients in a dramatic
way, the present value of such a lifetime earnings supplement is substantial. In both states,
model 3 implies substantially larger impacts, as does model 2 in Missouri.16
As noted above, model 4 controls for person fixed effects, but there may be intertemporal
selection effects associated with participation that may bias our results. In particular, since
participation is required for individuals who are unable to find employment, work component
activities could occur during periods when an individual faces particularly poor prospects. In
this case, earnings would ultimately be expected to improve for such individuals even in the
absence of intervention. If this were the dominant effect, both the earnings loss and the later

17Not all selection effects are expected to have this impact. Some individuals areexempted from training requirements because they face barriers that make employmentparticularly difficult. As a result, some of those who do not participate in training may actuallyhave inferior immediate employment prospects than participants.
18 In this specification we have dropped all observations prior to the quarter in which anindividual participates in a program. Individuals who never participate in a training program arecompletely dropped from the analysis.
23
improvement could be attributed to selection effects.17
How important is such selection? One indicator may be the estimated impact of
assessment. In both states, assessment involves a very small time investment, and it is unlikely
that such a minimal intervention could have a substantial effect on long-term earnings.
Therefore, our estimates showing an impact of assessment suggest that we may actually be
observing the effects of selection rather than program impact. On the other hand, the impact of
assessment, based on model 4, is both small and not significantly different from zero in the last
five quarters for which we have data, suggesting that selection may not be important in
explaining ultimate earnings.
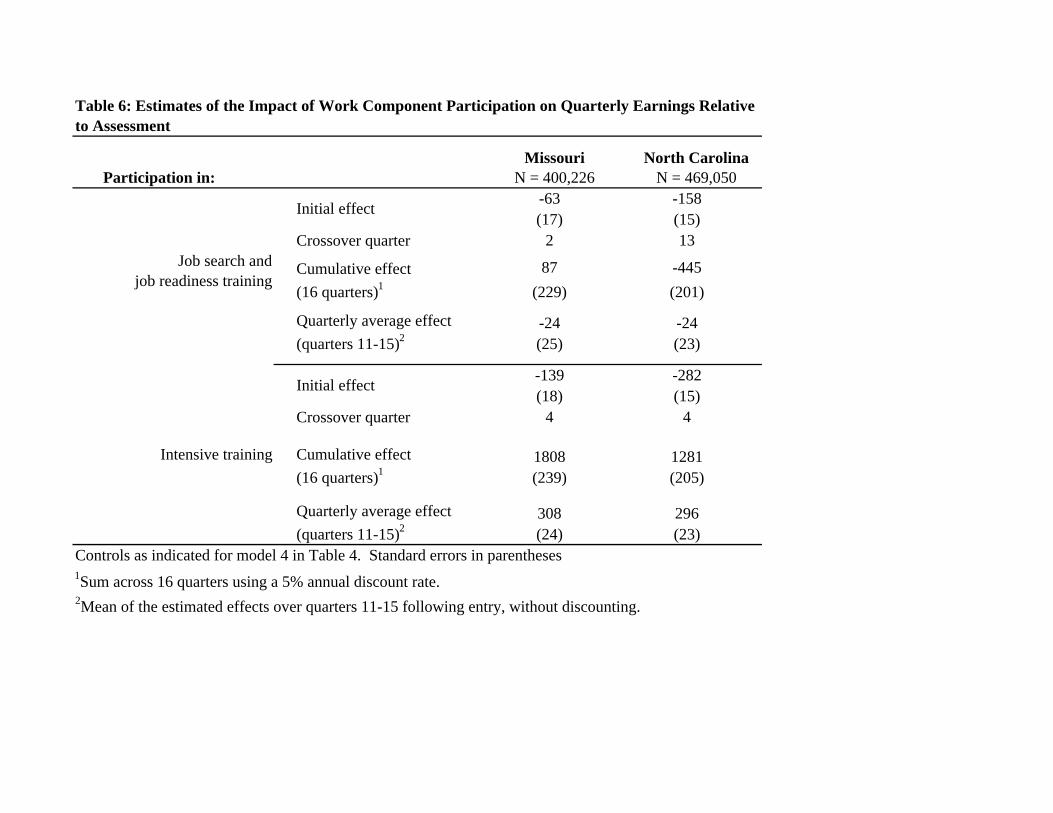
If we assume that selection into assessment is similar to selection into the other
programs, then one correction for selection is to measure the effect of these other programs
relative to the effect of assessment. This is a reasonable correction assuming that assessment has
very little impact on earnings–which seems plausible given what is involved in assessment.
Figure 3 presents our quarterly estimates of the incremental effect on earnings of the job
search/readiness and intensive training programs, based on model 4 where the effect of these
programs is relative to the effect of assessment.18
The top panel of Figure 3 shows that, in both states, the incremental effect of job

24
search/readiness in all but the first two quarters is essentially zero. Given the limited time
individuals spend in these programs, this result is not surprising. The bottom panel reveals a
pattern quite similar to that seen in Figure 2. The impact of intensive training is initially
negative but exhibits a steady increase, becoming positive around the fourth quarter after
entering the program and the growth in impact slowing around the tenth quarter. Table 6
presents some basic information about our estimates. Here we see that in Missouri our estimate
of the total effect of job search/readiness is essentially zero, while in North Carolina it is
negative and significant but much smaller than our previous estimates. In both states, our
estimates of the mean effect in the last five quarters is -$24 and not significant. Our estimate for
the cumulative effect of the intensive training programs for Missouri is approximately $1800,
while for North Carolina it is are approximately $1300. Our estimates of the average quarterly
effect for both states are very similar (approximately $300).
We view these final figures as our best estimate of the impact of job search/readiness and
intensive training on the earnings of workers who participate in these programs. These estimates
suggest that, in the long run, workers who participate in more intensive training programs
experience a larger increase in earnings than workers who participate in programs designed to
more quickly move workers back into the labor market. Our estimates of the total effects of
these programs show that this is true even after taking into account the fact that individuals
participate in the intensive training programs for longer periods of time.
In order to make stronger statements concerning which of these subprograms are more
beneficial to society as a whole, we would need data on the per-person cost of each program.
Unfortunately, these data are not publicly available, and precise cost estimates may not be

19We also present estimates of impacts for job search and job readiness training obtainedin this specification. These estimates are essentially the same as those reported in Table 6,confirming that our specification of control variables is not seriously biased by the aggregationof intensive activities.
25
calculable even with internal agency data, given the lack of detailed record-keeping on program
expenses by activity and/or participant (Heinrich, Marschke and Zhang, 1998). However, we
can say, at least from the perspective of participants, that participating in the more intensive
training programs produces a bigger increment, on average, in quarterly earnings.
VI. Disaggregating Work Component Activities
The specification above provides parsimony at the cost of many assumptions about how
participation in work component activities affects labor market success. In this section, we
investigate the extent to which the grouping of various activities as “intensive” hides important
differences in impact among them. Since we view our fixed-effects specification that measures
impacts of the sub-programs relative to assessment as our most appropriate model, this is the
model we focus on in the rest of the paper.
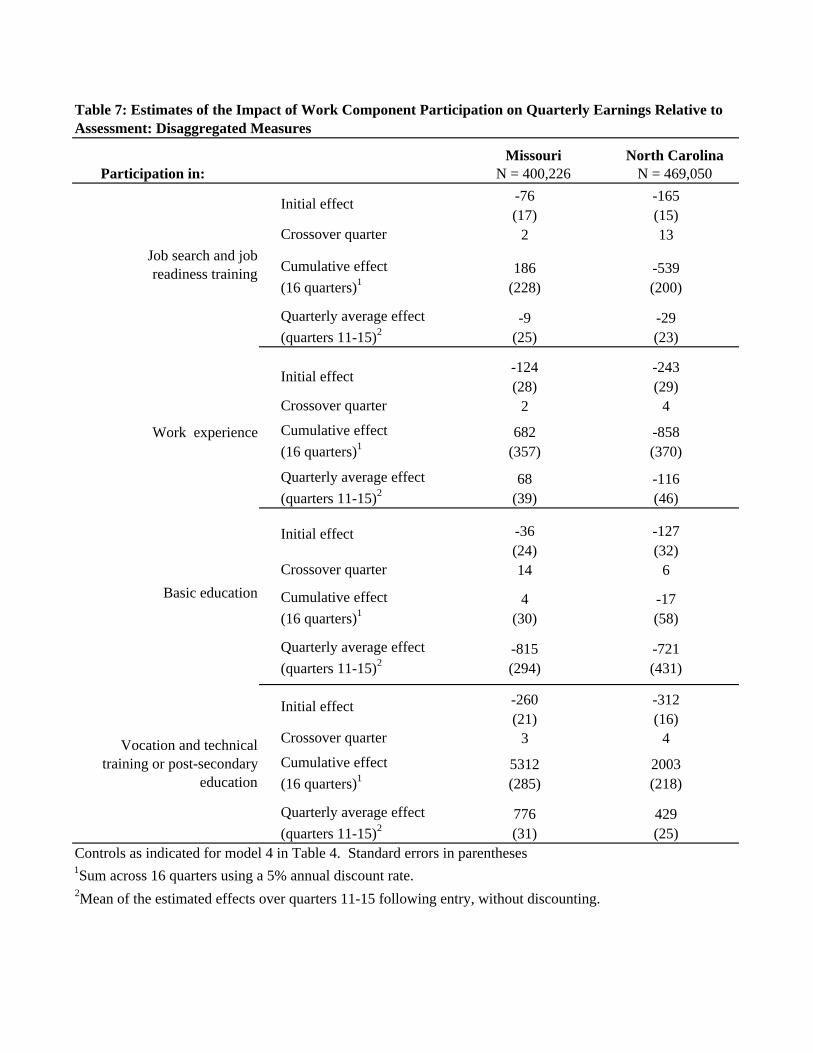
In the above analyses, we have grouped three kinds of activities as “intensive,” reflecting
the greater time investment that they entail: work experience, basic education, and vocational
and technical training or post-secondary education. Table 7 presents statistics where we estimate
separate effects for these three activities.19 Here we use a hierarchical coding system parallel to
that described above, so that in a given quarter, a training activity is coded to identify only the
highest order participation since coming onto welfare. The ordering of these activities
(originally grouped together) continues to be based on approximate intensity: work experience

20In Missouri, the classification of activities changed during our study period. Through1998, there was a separate coding for activities classified as “vocational and technical training”and “post-secondary education,” but after 1998, these were combined. To accommodate thiscoding, we use a combined measure for these activities.
26
the lowest order, followed by basic education, and then vocational and technical training or post-
secondary education.20
In both Missouri and North Carolina, there are important differences in impacts of
intensive activities. For all the disaggregated sub-program activities, it is evident that the initial
earnings decrement associated with participation is smaller in Missouri than in North Carolina,
although the rank order of estimate sizes is the same. In both states, the initial earnings loss is
largest for vocational and technical training/post-secondary education but the cumulative
estimated effect is positive and large. In Missouri, participation in this class of programs
contributes to significant gains in earnings, with program effects turning positive in the third
quarter and implying an average earnings gain of nearly $800 in quarters 11-15. The comparable
estimated average gain resulting from participation in vocational and technical training/post-
secondary education in North Carolina is approximately half as large, but still substantial.
The impacts of participation in basic education and work experience appear quite
different. The crossover to positive returns from training occurs much later for participants in
basic education, and the estimated cumulative effect of participation is negative and large. The
pattern of effects for those who participated in work experience is slightly more negative in
North Carolina and somewhat more favorable in Missouri as compared to basic education.
Overall, it is clear that the impacts of these measures are much smaller–as well as less
beneficial–as compared to vocational and technical training/post-secondary education.

21These percentages are based on examining participation by individuals in the first eightquarters after entering the program. Participation in any of the three intensive categories isconsidered, and an individual may participate in more than one category.
27
These results suggest that most of the positive impacts we observe for this class of
training can be traced to those who participate in vocational and technical training/post-
secondary education. Work experience and basic education imply relatively modest initial costs
and few ultimate benefits. We must conclude that although intensive activities, taken together,
may imply important benefits, not all intensive activities produce comparable market returns. It
appears likely that if marginal individuals can be placed in vocational and technical training, or
post-secondary education, rather than other kinds of training activities, they will experience
greater benefits.
In fact, vocational and technical training/post-secondary education is the most common
of the intensive activities we observe, and it became more important over the period of our study.
Slightly more than a third of intensive activities in Missouri at the beginning of our period were
in this category, increasing to one-half by the end, while the comparable figures in North
Carolina increased from just over three-fifths to nearly 70 percent.21
VII. Effects of Work Component Participation: Comparisons Between Subgroups
All of the models we have fitted assume that the impact of program participation is the same for
all individuals. Of course, two issues are of concern. The first is that if effects differ by
individual characteristics, there may be policy implications for the kinds of individuals who
should be channeled into training. The second is that because the linear model assumes that
effects do not vary across individuals, it may produce biased estimates, which may not even

28
identify average program effects.
In our initial analysis, we conducted simple tests of this assumption by dividing the
sample by education, race and work history in the eight quarters prior to entering welfare. In
Figure 4, we present estimates where we have fitted our models on our sample divided by work
history, since we found these differences most substantial. Table 8 presents summary statistics
for these models. The three groups are those with no earnings or earnings only in one quarter
during that two-year period, those with two to six quarters of earnings, and those with seven or
eight quarters of earnings.
Among participants in North Carolina, there are some differences in our estimates of the
total effect of the program. Those with the most limited work histories experience smaller initial
losses and obtain greater ultimate gains than the other groups as a result of participation in
intensive activities. In effect, the earnings profile is shifted up for these individuals, resulting in
a substantially larger cumulative effect. However, the estimated average quarterly effects differ
much less, so estimates of ultimate benefits are not so discrepant. Other differences across
groups are smaller.
Overall, patterns for the three groups are quite similar. Perhaps most significant,
regardless of any differences, the estimated impacts are larger for intensive training than job
search for all three groups of workers. Our primary conclusion–that intensive training provides
larger benefits to workers than job search or job readiness training–appears robust.
As a further check on the specification of our model we have estimated the effects of
these sub-programs using propensity score matching (See Rosenbaum and Rubin (1983) and
Mueser, Troske, and Gorislavsky (2004)) continuing to use quarters as the unit of analysis.
29
Matching methods can provide valid estimates of the average impact of a program even when
program impacts differ across participants. Matching will also provide valid estimates when the
effects of control variables deviate from the assumptions of the linear model. The disadvantage
of matching is that there is no form of matching corresponding exactly to our fixed-effect model,
which is our preferred specification.
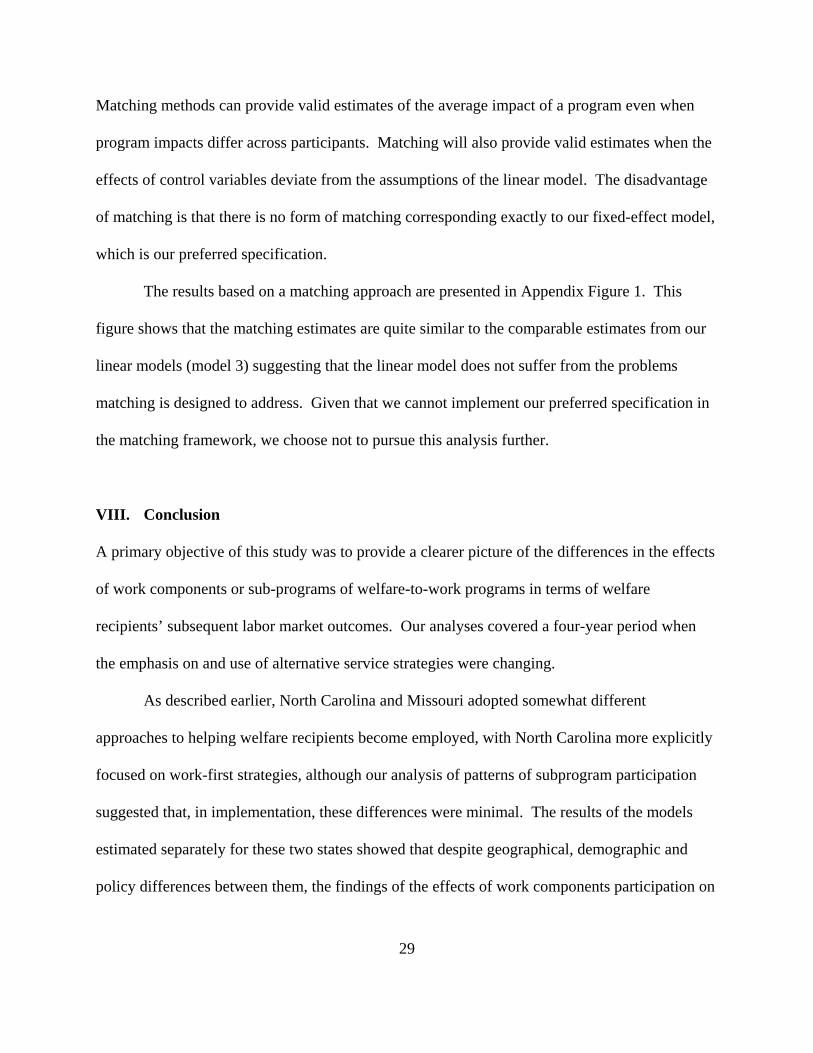
The results based on a matching approach are presented in Appendix Figure 1. This
figure shows that the matching estimates are quite similar to the comparable estimates from our
linear models (model 3) suggesting that the linear model does not suffer from the problems
matching is designed to address. Given that we cannot implement our preferred specification in
the matching framework, we choose not to pursue this analysis further.
VIII. Conclusion
A primary objective of this study was to provide a clearer picture of the differences in the effects
of work components or sub-programs of welfare-to-work programs in terms of welfare
recipients’ subsequent labor market outcomes. Our analyses covered a four-year period when
the emphasis on and use of alternative service strategies were changing.
As described earlier, North Carolina and Missouri adopted somewhat different
approaches to helping welfare recipients become employed, with North Carolina more explicitly
focused on work-first strategies, although our analysis of patterns of subprogram participation
suggested that, in implementation, these differences were minimal. The results of the models
estimated separately for these two states showed that despite geographical, demographic and
policy differences between them, the findings of the effects of work components participation on
30
earnings were remarkably consistent. Generally, the impacts of participation were initially
negative but improved over time, in most cases turning positive by the sixth quarter after
participation. We found that more intensive training was associated with greater initial earnings
losses but also greater gains in the long run.
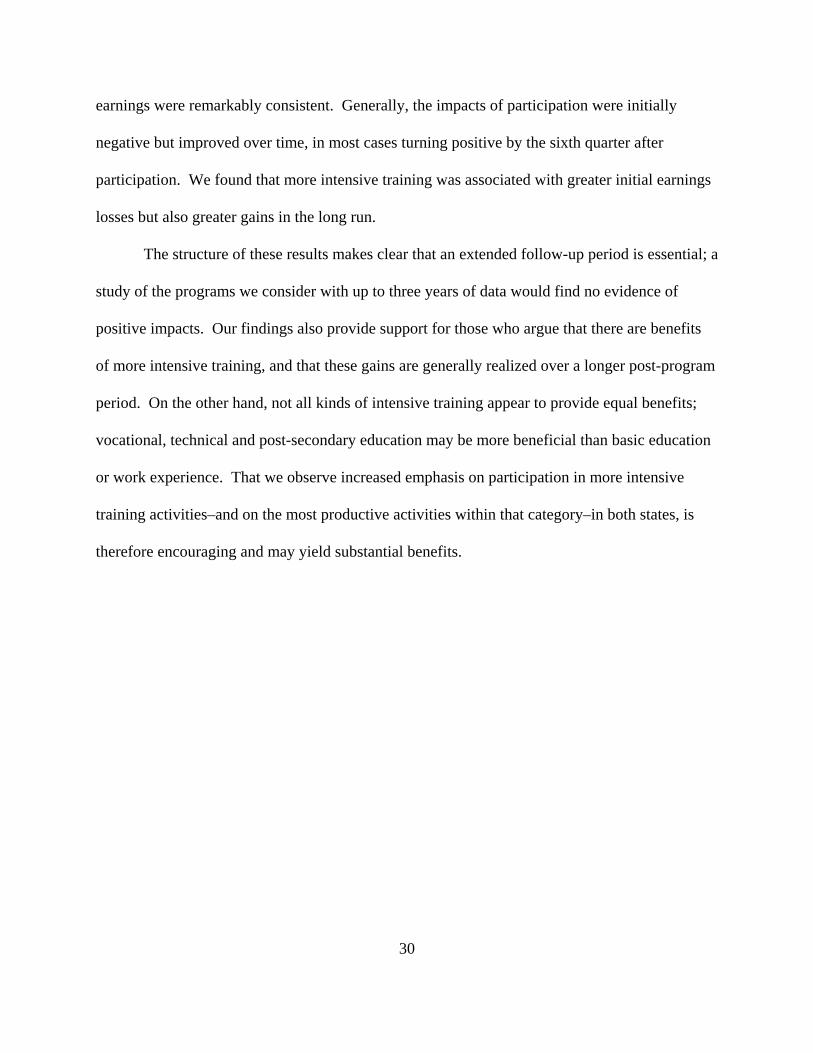
The structure of these results makes clear that an extended follow-up period is essential; a
study of the programs we consider with up to three years of data would find no evidence of
positive impacts. Our findings also provide support for those who argue that there are benefits
of more intensive training, and that these gains are generally realized over a longer post-program
period. On the other hand, not all kinds of intensive training appear to provide equal benefits;
vocational, technical and post-secondary education may be more beneficial than basic education
or work experience. That we observe increased emphasis on participation in more intensive
training activities–and on the most productive activities within that category–in both states, is
therefore encouraging and may yield substantial benefits.
31
References
Barnow, Burt and Daniel B. Gubits. 2002. “Review of Recent Pilot, Demonstration, Researchand Evaluation Initiatives to Assist in the Implementation of Programs Under theWorkforce Investment Act.” Chapter 5 of the Strategic Plan for Pilots, Demonstrations,Research, and Evaluations, 2002-2007, U.S. Department of Labor.
Bloom, Dan and Charles Michalopoulos. 2001. How Welfare and Work Policies AffectEmployment and Income: A Synthesis of Research. New York: ManpowerDemonstration Research Corporation.
Friedlander, Daniel and Gary Burtless. 1995. Five Years After: The Long-Term Effects ofWelfare-to-Work Programs. New York: Russell Sage.
Gueron, Judith and Edward Pauly. 1991. From Welfare to Work. New York: Russell Sage.
Haskins, Ron and Rebecca M. Blank. 2001. “Welfare Reform Reauthorization.” PovertyResearch News 5(6), (see http://www.jcpr.org/newsletters/vol5_no6/index.html).
Heinrich, Carolyn J., Peter Mueser, and Kenneth Troske. 2005. "Welfare to Temporary Work:Implications for Labor Market Outcomes." Review of Economics and Statistics 87(1).
Heinrich, Carolyn J., Gerald Marschke and Annie Zhang. 1998. "Using Administrative Data toEstimate the Cost-Effectiveness of Social Program Services." Technical report, TheUniversity of Chicago.
Hotz, V. Joseph, Guido Imbens and Jacob Klerman. 2001. “The Long-Term Gains from GAIN:A Re-Analysis of the Impacts of the California GAIN Program.” NBER working paper8007, Cambridge, MA.
Jacobson, Louis S., Robert J. LaLonde, and Daniel G. Sullivan. 1994. "The Returns fromClassroom Training for Displaced Workers." Federal Reserve Bank of Chicago WorkingPaper No. 94-27. Chicago, IL.
Jacobson, Louis S., Robert J. LaLonde, and Daniel G. Sullivan. 2004. “Estimating the Returnsto Community College Schooling for Displaced Workers.” IZA discussion paper No.1017, Bonn. Germany.
Jencks, Christopher and Kathryn Edin. 1992. “The Real Welfare Problem.” In RethinkingSocial Policy, Christopher Jencks (ed.). Cambridge, MA: 204-235.
Kornfeld, Robert and Howard S. Bloom, 1997. “Measuring Program Impacts on Earnings andEmployment: Do UI Wage Reports from Employers Agree with Surveys of Individuals?” Working paper, Abt Associates and New York University.

32
Leahey, Erin. 2001. “A Help or Hindrance? The Impact of Job Training on the EmploymentStatus of Disadvantaged Women.” Evaluation Review 25(1): 29-54.
Luks, Samantha and Henry E. Brady. 2003. “Defining Welfare Spells: Coping with Problems ofSurvey Responses and Administrative Data.” Evaluation Review 27(4): 395-420.
McConnell, Sheena and Steven Glazerman. 2001. “National Job Corps Study: The Benefits andCosts of Job Corps.” Report Submitted to U.S. DOL by Mathematica Policy Research,Inc. MRP Ref. No. 8140-530. Washington D.C. (June).
Mueser, Peter, Kenneth Troske and Alexey Gorislavky. 2004. “Using State AdministrativeData to Measure Program Performance.” Unpublished paper, University of Missouri.
Riccio, James, Daniel Friedlander and Stephen Freedman. 1994. GAIN: Benefits, Costs andThree-Year Impacts of a Welfare-to-Work Program. New York: ManpowerDemonstration Research Corporation.
Rosenbaum, P. and D. Rubin. 1983. “The Central Role of the Propensity Score in ObservationalStudies for Causal Effects.” Biometrika 70: 41-55.
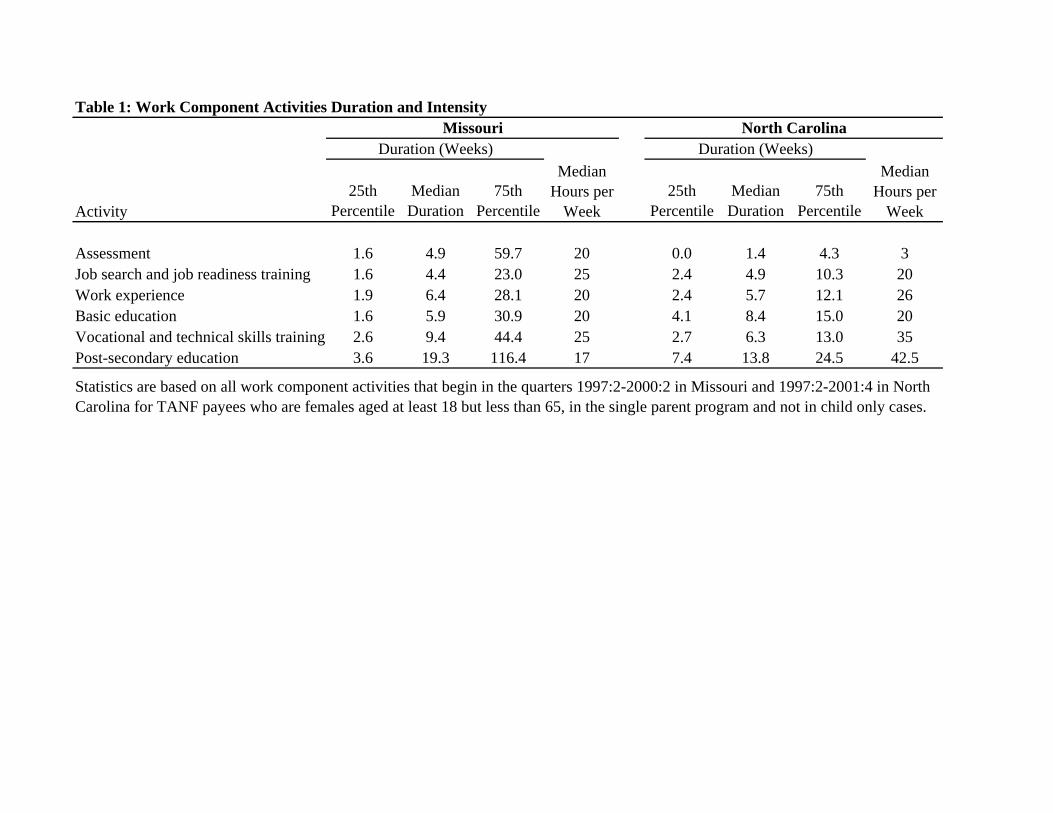
Table 1: Work Component Activities Duration and Intensity
Activity25th
PercentileMedian Duration
75th Percentile
25th Percentile
Median Duration
75th Percentile
Assessment 1.6 4.9 59.7 20 0.0 1.4 4.3 3Job search and job readiness training 1.6 4.4 23.0 25 2.4 4.9 10.3 20Work experience 1.9 6.4 28.1 20 2.4 5.7 12.1 26Basic education 1.6 5.9 30.9 20 4.1 8.4 15.0 20Vocational and technical skills training 2.6 9.4 44.4 25 2.7 6.3 13.0 35Post-secondary education 3.6 19.3 116.4 17 7.4 13.8 24.5 42.5
Statistics are based on all work component activities that begin in the quarters 1997:2-2000:2 in Missouri and 1997:2-2001:4 in North Carolina for TANF payees who are females aged at least 18 but less than 65, in the single parent program and not in child only cases.
Missouri North CarolinaDuration (Weeks)
Median Hours per
Week
Duration (Weeks)Median
Hours per Week
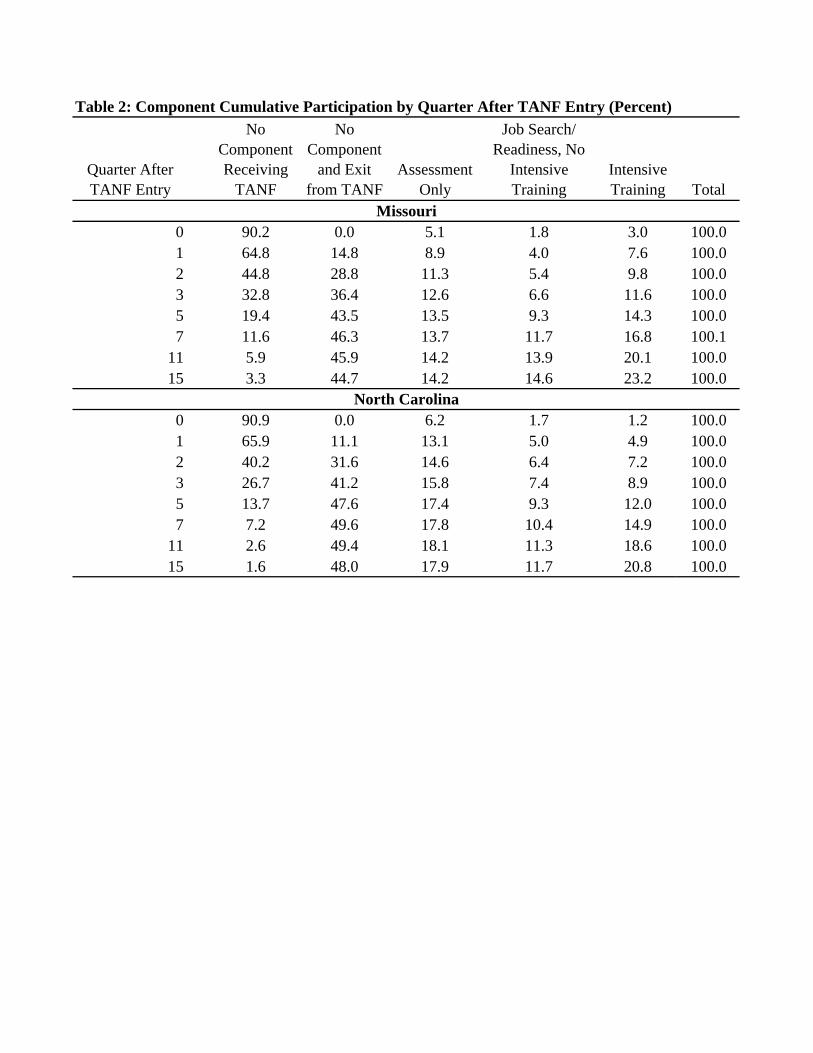
Table 2: Component Cumulative Participation by Quarter After TANF Entry (Percent)
Quarter After TANF Entry
No Component Receiving
TANF
No Component
and Exit from TANF
Assessment Only
Job Search/ Readiness, No
Intensive Training
Intensive Training Total
0 90.2 0.0 5.1 1.8 3.0 100.01 64.8 14.8 8.9 4.0 7.6 100.02 44.8 28.8 11.3 5.4 9.8 100.03 32.8 36.4 12.6 6.6 11.6 100.05 19.4 43.5 13.5 9.3 14.3 100.07 11.6 46.3 13.7 11.7 16.8 100.1
11 5.9 45.9 14.2 13.9 20.1 100.015 3.3 44.7 14.2 14.6 23.2 100.0
0 90.9 0.0 6.2 1.7 1.2 100.01 65.9 11.1 13.1 5.0 4.9 100.02 40.2 31.6 14.6 6.4 7.2 100.03 26.7 41.2 15.8 7.4 8.9 100.05 13.7 47.6 17.4 9.3 12.0 100.07 7.2 49.6 17.8 10.4 14.9 100.0
11 2.6 49.4 18.1 11.3 18.6 100.015 1.6 48.0 17.9 11.7 20.8 100.0
Missouri
North Carolina
First Quarter in TANF Spell
No Component, Receiving
TANF
No Component
and Exit from TANF
Assessment Only
Job Search/ Readiness, No Intensive Training Intensive Training Total
1997:2 8.4 51.3 14.1 10.5 15.8 100.01997:3 6.4 52.5 13.3 11.5 16.3 100.01997:4 6.5 48.6 13.6 13.1 18.1 100.01998:1 6.8 47.0 13.8 15.1 17.3 100.01998:2 7.7 46.4 11.1 18.3 16.5 100.01998:3 6.4 45.7 11.4 16.7 19.7 100.01998:4 7.0 41.8 10.9 18.6 21.8 100.01999:1 6.9 38.3 11.9 19.7 23.2 100.01999:2 7.2 38.5 12.4 19.6 22.3 100.01999:3 6.6 37.4 12.8 18.4 24.7 100.01999:4 6.6 35.6 14.9 16.1 26.8 100.0
1997:2 6.0 50.0 18.8 10.2 15.0 100.01997:3 5.5 50.2 17.7 10.4 16.2 100.01997:4 5.4 48.4 17.7 11.4 17.1 100.01998:1 3.8 44.2 19.0 13.0 20.0 100.01998:2 3.7 44.5 19.0 12.9 20.0 100.01998:3 3.9 42.6 17.6 13.3 22.6 100.01998:4 3.3 39.1 17.8 15.6 24.3 100.01999:1 3.2 36.6 17.9 15.5 26.8 100.01999:2 3.2 35.3 19.6 15.5 26.4 100.01999:3 2.9 35.0 17.9 15.6 28.6 100.01999:4 2.9 33.0 17.0 16.4 30.7 100.0
Table 3: Component Cumulative Participation Eight Quarters After Entering Welfare by Quarter of Entry (Percent)
Missouri
North Carolina
Controls (1) (2) (3) (4)
Constant x x x xx x x xx x x x
x x xx xx x x
Age of oldest child x x xNumber of children x x xNonwhite x x
x x
x x
x xx xx x
x
Difference xFixed person effects
Prior 8 quarter work history: Proportion of time working, no work, worked all 8 quarters
Earnings prior 4 quartersEarnings prior quarters 5-8Prior 8 quarter proportion of time receiving welfare
Unemployment rate in that county in that quarter Dummy for each countyAge and age-squared
Less than high school
Current quarter (calendar quarter dummy)
Time since coming onto welfare (15 dummies)
Table 4: Regression Models Estimating the Impact of Work Component Participation on Quarterly Earnings
(1) (2) (3) (4) (1) (2) (3) (4)
-480 -416 -365 -297 -635 -481 -394 -332(8) (7) (9) (7) (7) (7) (9) (7)
Crossover quarter 15 9 6 3 . 13 5 4
-2154 -719 67 82 -3956 -1634 -61 -343(189) (168) (198) (90) (197) (178) (207) (89)
-40 80 127 37 -120 12 121 -9(24) (22) (25) (10) (25) (23) (25) (10)
Participation in:-389 -336 -276 -187 -615 -305 -221 -161(11) (10) (13) (11) (10) (9) (11) (9)
Crossover quarter 13 7 1 1 4 1 1 1
-1026 -95 385 625 60 767 1886 801(296) (262) (306) (130) (266) (242) (280) (116)
10 63 73 9 128 150 228 20(39) (36) (40) (16) (34) (32) (35) (14)
-432 -415 -353 -299 -947 -591 -458 -413(11) (11) (14) (11) (11) (10) (14) (11)
Crossover quarter 7 7 2 1 13 13 3 2
-558 -58 776 -117 -3279 -1473 549 -884(293) (266) (310) (133) (312) (289) (334) (142)
14 93 150 -68 -16 43 179 -82(43) (39) (44) (19) (45) (42) (46) (20)
Intensive Training -769 -639 -569 -462 -1137 -871 -761 -588(9) (9) (12) (10) (9) (9) (12) (10)
Crossover quarter 13 7 6 4 11 10 7 4
-3099 -458 344 461 -3201 -1906 -410 534(254) (229) (262) (124) (286) (269) (305) (126)
50 267 303 186 200 214 277 215(37) (34) (36) (16) (45) (44) (47) (18)
Controls as indicated in Table 4. Standard errors in parentheses. 1Sum across 16 quarters using a 5% annual discount rate.2Mean of the estimated effects over quarters 11-15 following entry, without discounting.
Cumulative effect (16 quarters)1
Quarterly average effect(quarters 11-15)2
Participation in any component Initial effect
Table 5: Estimates of the Impact of Work Component Participation on Quarterly Earnings
MissouriN = 939,405
North CarolinaN = 1,038,490
Initial effect
Cumulative effect (16 quarters)1
Quarterly average effect(quarters 11-15)2
Assessment Only
Job search and job readiness training
Initial effect
Quarterly average effect(quarters 11-15)2
Quarterly average effect(quarters 11-15)2
Cumulative effect (16 quarters)1
Initial effect
Cumulative effect (16 quarters)1
Participation in:-63 -158(17) (15)
Crossover quarter 2 13
87 -445(229) (201)
-24 -24(25) (23)
-139 -282(18) (15)
Crossover quarter 4 4
1808 1281(239) (205)
308 296(24) (23)
Controls as indicated for model 4 in Table 4. Standard errors in parentheses1Sum across 16 quarters using a 5% annual discount rate.2Mean of the estimated effects over quarters 11-15 following entry, without discounting.
Quarterly average effect(quarters 11-15)2
Cumulative effect (16 quarters)1
Job search andjob readiness training
Intensive training
Initial effect
Quarterly average effect(quarters 11-15)2
Cumulative effect (16 quarters)1
Table 6: Estimates of the Impact of Work Component Participation on Quarterly Earnings Relative to Assessment
MissouriN = 400,226
North CarolinaN = 469,050
Initial effect
Participation in:-76 -165(17) (15)
Crossover quarter 2 13
186 -539(228) (200)
-9 -29(25) (23)
-124 -243(28) (29)
Crossover quarter 2 4
682 -858(357) (370)
68 -116(39) (46)
-36 -127(24) (32)
Crossover quarter 14 6
4 -17(30) (58)
-815 -721(294) (431)
-260 -312(21) (16)
Crossover quarter 3 4
5312 2003(285) (218)
776 429(31) (25)
Controls as indicated for model 4 in Table 4. Standard errors in parentheses1Sum across 16 quarters using a 5% annual discount rate.2Mean of the estimated effects over quarters 11-15 following entry, without discounting.
Quarterly average effect(quarters 11-15)2
Job search and job readiness training
Table 7: Estimates of the Impact of Work Component Participation on Quarterly Earnings Relative to Assessment: Disaggregated Measures
MissouriN = 400,226
North CarolinaN = 469,050
Initial effect
Quarterly average effect(quarters 11-15)2
Cumulative effect (16 quarters)1
Cumulative effect (16 quarters)1
Work experience
Initial effect
Vocation and technical training or post-secondary
education
Basic education
Quarterly average effect(quarters 11-15)2
Cumulative effect (16 quarters)1
Initial effect
Cumulative effect (16 quarters)1
Quarterly average effect(quarters 11-15)2
Initial effect
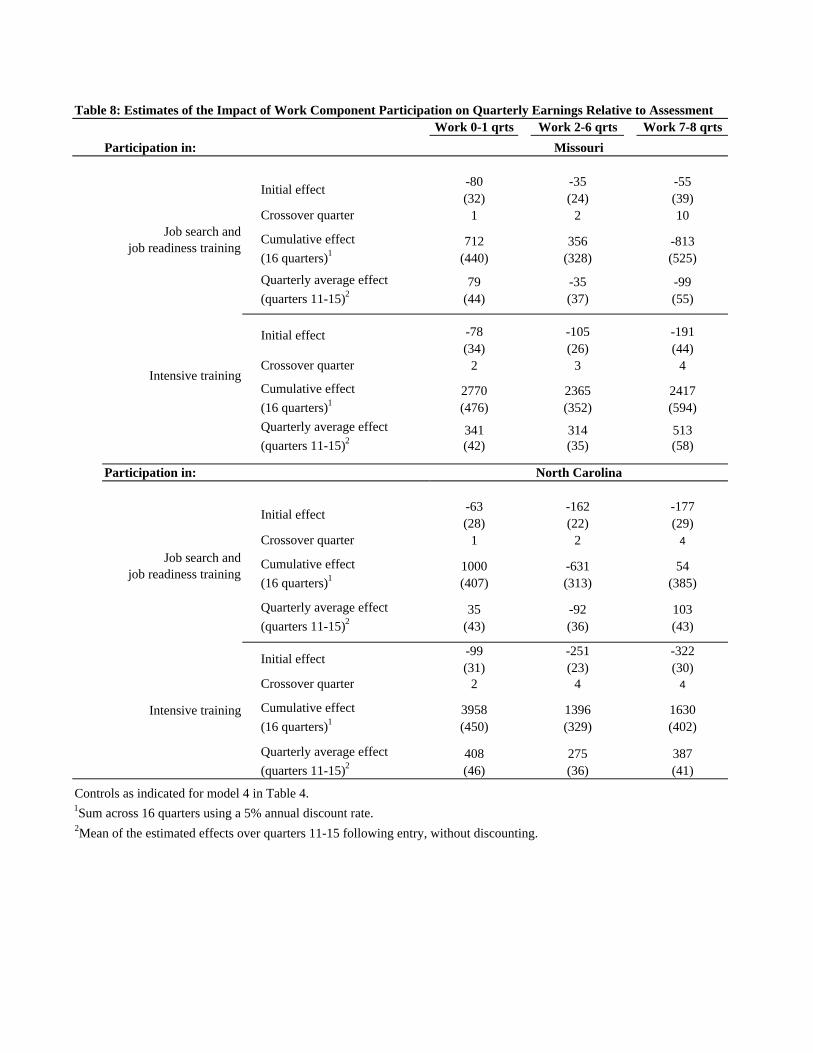
Table 8: Estimates of the Impact of Work Component Participation on Quarterly Earnings Relative to AssessmentWork 0-1 qrts Work 2-6 qrts Work 7-8 qrts
Participation in:
-80 -35 -55(32) (24) (39)
Crossover quarter 1 2 10
712 356 -813(440) (328) (525)
79 -35 -99(44) (37) (55)
-78 -105 -191(34) (26) (44)
Crossover quarter 2 3 4
2770 2365 2417(476) (352) (594)
341 314 513(42) (35) (58)
Participation in:
-63 -162 -177(28) (22) (29)
Crossover quarter 1 2 4
1000 -631 54(407) (313) (385)
35 -92 103(43) (36) (43)
-99 -251 -322(31) (23) (30)
Crossover quarter 2 4 4
3958 1396 1630(450) (329) (402)
408 275 387(46) (36) (41)
Controls as indicated for model 4 in Table 4.1Sum across 16 quarters using a 5% annual discount rate.2Mean of the estimated effects over quarters 11-15 following entry, without discounting.
Job search and job readiness training
Intensive training
Job search and job readiness training
Missouri
Initial effect
Quarterly average effect(quarters 11-15)2
Cumulative effect (16 quarters)1
Initial effect
Quarterly average effect(quarters 11-15)2
Cumulative effect (16 quarters)1
North Carolina
Initial effect
Quarterly average effect(quarters 11-15)2
Cumulative effect (16 quarters)1
Intensive training
Initial effect
Quarterly average effect(quarters 11-15)2
Cumulative effect (16 quarters)1
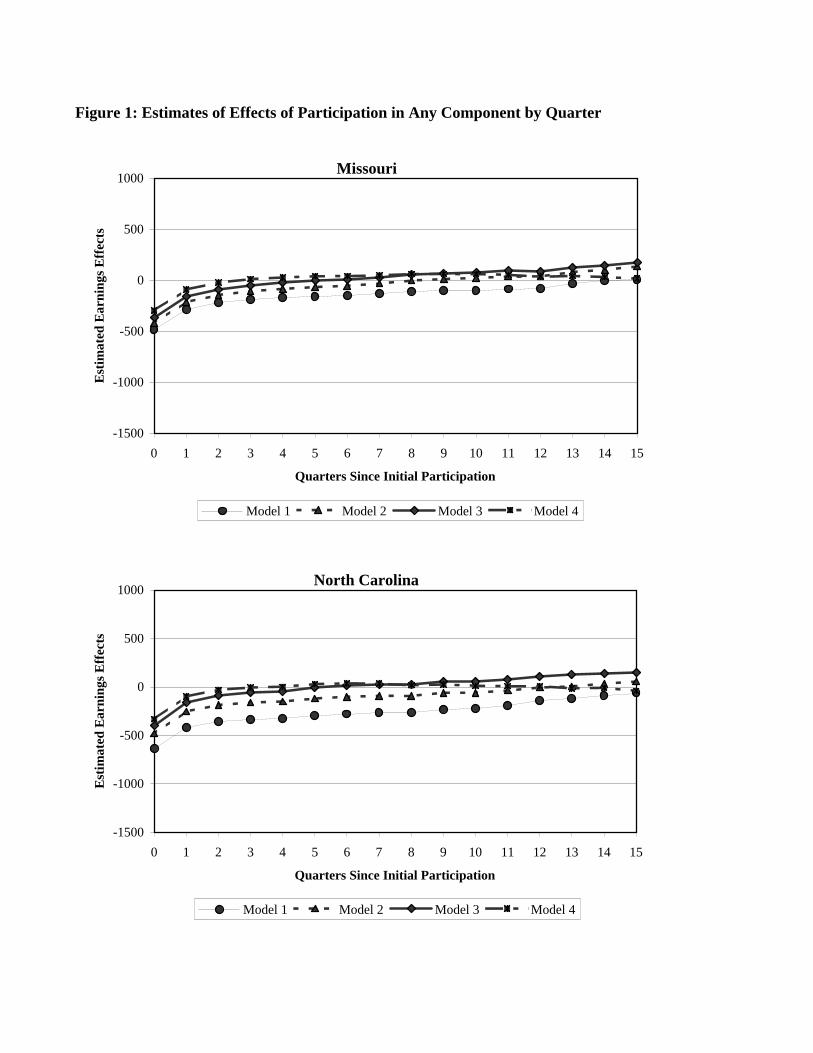
Figure 1: Estimates of Effects of Participation in Any Component by Quarter
Missouri
-1500
-1000
-500
0
500
1000
0 1 2 3 4 5 6 7 8 9 10 11 12 13 14 15
Quarters Since Initial Participation
Est
imat
ed E
arni
ngs E
ffec
ts
Model 1 Model 2 Model 3 Model 4
North Carolina
-1500
-1000
-500
0
500
1000
0 1 2 3 4 5 6 7 8 9 10 11 12 13 14 15
Quarters Since Initial Participation
Est
imat
ed E
arni
ngs E
ffec
ts
Model 1 Model 2 Model 3 Model 4
Panel B: Job Search and Job Readiness
Panel A: Assessment Only
Figure 2: Estimates of Effects of Participation in Sub-Programs by Quarter
Missouri North Carolina
Panel C: Intensive Training
-1500
-1000
-500
0
500
1000
1 3 5 7 9 11 13 15Quarters Since Initial Participation
Est
imat
ed E
arni
ngs E
ffec
ts
-1500
-1000
-500
0
500
1000
1 3 5 7 9 11 13 15Quarters Since Initial Participation
Est
imat
ed E
arni
ngs E
ffec
ts
-1500
-1000
-500
0
500
1000
1 3 5 7 9 11 13 15Quarters Since Initial Participation
Est
imat
ed E
arni
ngs E
ffec
ts
Model 1 Model 2 Model 3 Model 4
-1500
-1000
-500
0
500
1000
1 3 5 7 9 11 13 15Quarters Since Initial Participation
Est
imat
ed E
arni
ngs E
ffec
ts
-1500
-1000
-500
0
500
1000
1 3 5 7 9 11 13 15Quarters Since Initial Participation
Est
imat
ed E
arni
ngs E
ffec
ts
-1500
-1000
-500
0
500
1000
1 3 5 7 9 11 13 15Quarters Since Initial Participation
Est
imat
ed E
arni
ngs E
ffec
ts
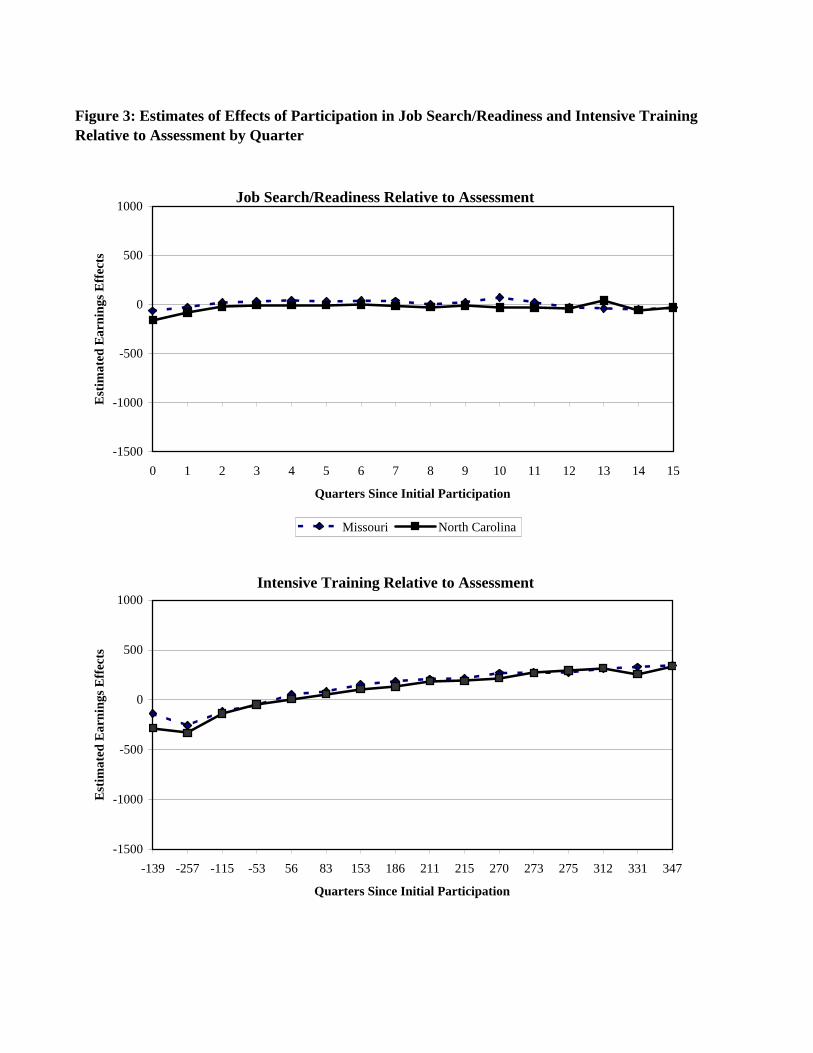
Figure 3: Estimates of Effects of Participation in Job Search/Readiness and Intensive Training Relative to Assessment by Quarter
Job Search/Readiness Relative to Assessment
-1500
-1000
-500
0
500
1000
0 1 2 3 4 5 6 7 8 9 10 11 12 13 14 15
Quarters Since Initial Participation
Est
imat
ed E
arni
ngs E
ffec
ts
Missouri North Carolina
Intensive Training Relative to Assessment
-1500
-1000
-500
0
500
1000
-139 -257 -115 -53 56 83 153 186 211 215 270 273 275 312 331 347
Quarters Since Initial Participation
Est
imat
ed E
arni
ngs E
ffec
ts
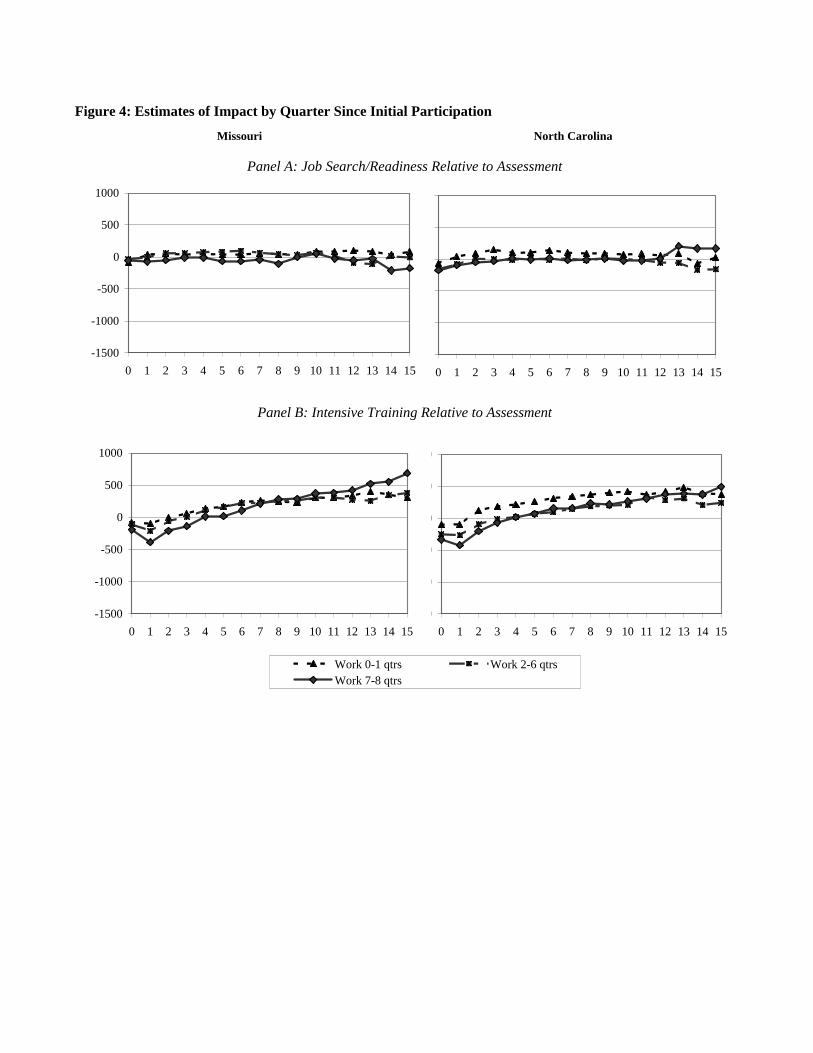
Figure 4: Estimates of Impact by Quarter Since Initial Participation
Panel B: Intensive Training Relative to Assessment
Missouri North Carolina
Panel A: Job Search/Readiness Relative to Assessment
-1500
-1000
-500
0
500
1000
0 1 2 3 4 5 6 7 8 9 10 11 12 13 14 15
Work 0-1 qtrs Work 2-6 qtrsWork 7-8 qtrs
-1500
-1000
-500
0
500
1000
0 1 2 3 4 5 6 7 8 9 10 11 12 13 14 15
-1500
-1000
-500
0
500
1000
0 1 2 3 4 5 6 7 8 9 10 11 12 13 14 15-1500
-1000
-500
0
500
1000
0 1 2 3 4 5 6 7 8 9 10 11 12 13 14 15
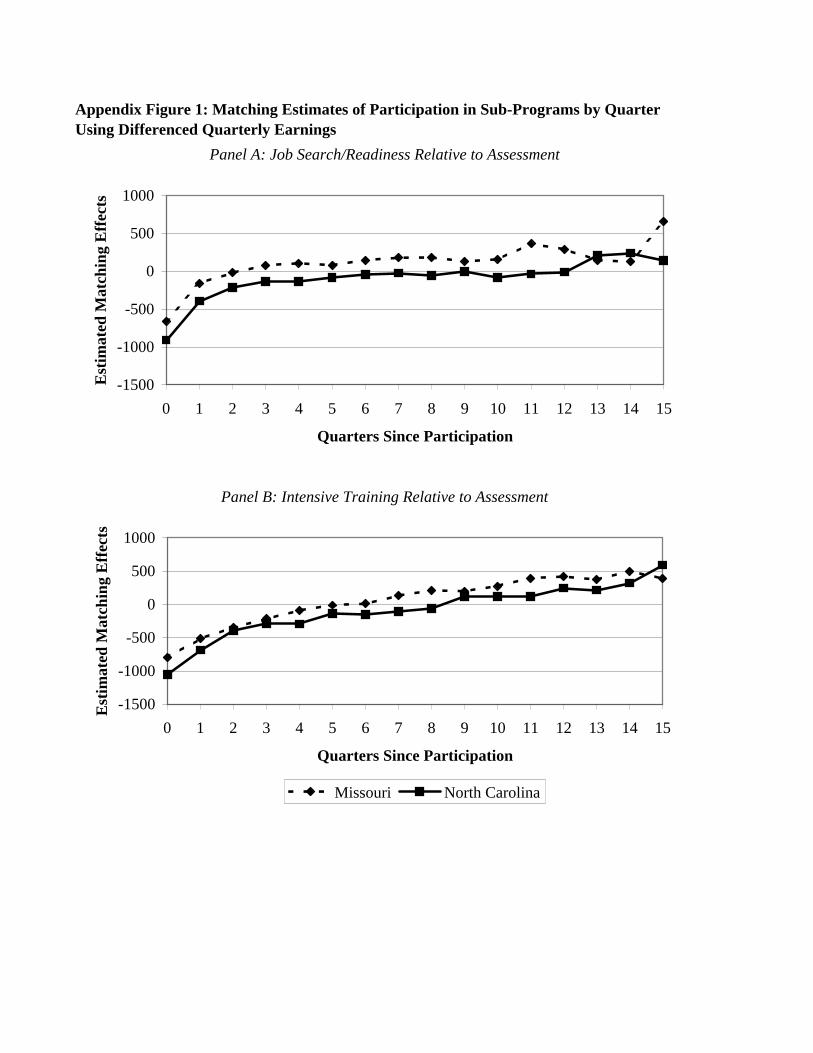
Appendix Figure 1: Matching Estimates of Participation in Sub-Programs by Quarter Using Differenced Quarterly Earnings
Panel A: Job Search/Readiness Relative to Assessment
Panel B: Intensive Training Relative to Assessment
1000
-1500
-1000
-500
0
500
1000
0 1 2 3 4 5 6 7 8 9 10 11 12 13 14 15
Quarters Since Participation
Est
imat
ed M
atch
ing
Eff
ects
-1500
-1000
-500
0
500
1000
0 1 2 3 4 5 6 7 8 9 10 11 12 13 14 15
Quarters Since Participation
Est
imat
ed M
atch
ing
Eff
ects
Missouri North Carolina