The Effects of the Food Stamp Program on Energy...
43
The Effects of the Food Stamp Program on Energy Balance and Obesity Joanna C. Parks, Aaron D. Smith, and Julian M. Alston This draft: April 29, 2011 ABSTRACT The Food Stamp Program (FSP) administered by the U.S. Department of Agriculture (USDA) is the cornerstone of the U.S. federal income and food safety net policy. The FSP has subsidized the food budget for millions of American households for over forty years, spending more than $60 billion per year in recent times. Prior research has demonstrated that eligible women who participate in the FSP are more likely to be overweight or obese than eligible non- participants. This finding raises the concern that the additional income provided by FSP benefits induces participants to eat significantly more calories and gain weight, contributing to the U.S. obesity epidemic. Previous studies of the FSP have yielded mixed results. In this study we develop new conceptual and empirical models linking FSP participation, calorie consumption, physical activity, and weight gain, while controlling for genetic variation, weight history, and other physiological characteristics of individuals. The models enable us to test whether participants gained more weight, ate more calories, or engaged less in physical activity; or if previously omitted variables and individual health characteristics explain the higher prevalence of obesity among female FSP participants. We do not find a positive and significant relationship between FSP participation and weight gain for women. More specifically, we do not find convincing evidence for the hypothesis that FSP participation causes obesity by increasing caloric consumption, decreasing physical activity, or some combination of the two. Our findings suggest that a positive association between FSP and weight exists, but we find no evidence of a causal link from one to the other. The association between weight and FSP probably results from confounding factors that make individuals more likely both to be overweight and to participate in the FSP. JEL Codes: Q18, H53, I12, I18, I38 Key Words: Food Stamp Program (FSP), Supplemental Nutrition Assistance Program (SNAP), obesity, body mass index (BMI), nutrition assistance. Joanna Parks is a PhD candidate, Aaron Smith is an associate professor, and Julian Alston is a professor, all in the Department of Agricultural and Resource Economics at the University of California, Davis. Alston is also Director of the Robert Mondavi Institute Center for Wine Economics at the University of California, Davis, and Smith and Alston are members of the Giannini Foundation of Agricultural Economics. This project was supported by a cooperative grant from the USDA Economic Research Service, Food and Nutrition Research Program, Agreement #58-5000-0-0045. We also gratefully acknowledge financial and indirect support from the University of California Agricultural Issues Center and the Giannini Foundation of Agricultural Economics. We appreciate the many helpful suggestions from Abigail Okrent, Dan Sumner, Jim Wilen, Hilary Hoynes, and Parke Wilde, as well as others who participated in a brownbag seminar. © Copyright 2011 by Joanna C. Parks, Aaron D. Smith, and Julian M. Alston. All rights reserved. Readers may make verbatim copies of this document for non-commercial purposes by any means provided that this copyright notice appears on all such copies. Authors are listed in order of increasing age and weight.
Transcript of The Effects of the Food Stamp Program on Energy...

The Effects of the Food Stamp Program on Energy Balance and Obesity
Joanna C. Parks, Aaron D. Smith, and Julian M. Alston This draft: April 29, 2011
ABSTRACT The Food Stamp Program (FSP) administered by the U.S. Department of Agriculture (USDA) is the cornerstone of the U.S. federal income and food safety net policy. The FSP has subsidized the food budget for millions of American households for over forty years, spending more than $60 billion per year in recent times. Prior research has demonstrated that eligible women who participate in the FSP are more likely to be overweight or obese than eligible non-participants. This finding raises the concern that the additional income provided by FSP benefits induces participants to eat significantly more calories and gain weight, contributing to the U.S. obesity epidemic. Previous studies of the FSP have yielded mixed results. In this study we develop new conceptual and empirical models linking FSP participation, calorie consumption, physical activity, and weight gain, while controlling for genetic variation, weight history, and other physiological characteristics of individuals. The models enable us to test whether participants gained more weight, ate more calories, or engaged less in physical activity; or if previously omitted variables and individual health characteristics explain the higher prevalence of obesity among female FSP participants. We do not find a positive and significant relationship between FSP participation and weight gain for women. More specifically, we do not find convincing evidence for the hypothesis that FSP participation causes obesity by increasing caloric consumption, decreasing physical activity, or some combination of the two. Our findings suggest that a positive association between FSP and weight exists, but we find no evidence of a causal link from one to the other. The association between weight and FSP probably results from confounding factors that make individuals more likely both to be overweight and to participate in the FSP.
JEL Codes: Q18, H53, I12, I18, I38 Key Words: Food Stamp Program (FSP), Supplemental Nutrition Assistance Program (SNAP), obesity, body mass index (BMI), nutrition assistance.
Joanna Parks is a PhD candidate, Aaron Smith is an associate professor, and Julian Alston is a professor, all in the Department of Agricultural and Resource Economics at the University of California, Davis. Alston is also Director of the Robert Mondavi Institute Center for Wine Economics at the University of California, Davis, and Smith and Alston are members of the Giannini Foundation of Agricultural Economics.
This project was supported by a cooperative grant from the USDA Economic Research Service, Food and Nutrition Research Program, Agreement #58-5000-0-0045. We also gratefully acknowledge financial and indirect support from the University of California Agricultural Issues Center and the Giannini Foundation of Agricultural Economics. We appreciate the many helpful suggestions from Abigail Okrent, Dan Sumner, Jim Wilen, Hilary Hoynes, and Parke Wilde, as well as others who participated in a brownbag seminar.
© Copyright 2011 by Joanna C. Parks, Aaron D. Smith, and Julian M. Alston. All rights reserved. Readers may make verbatim copies of this document for non-commercial purposes by any means provided that this copyright notice appears on all such copies. Authors are listed in order of increasing age and weight.

1
1. Introduction
The Food Stamp Program (FSP) administered by the U.S. Department of Agriculture
(USDA) has functioned as the mainstay of U.S. food assistance programs for over forty years.1
In 2010, 40.3 million Americans (13 percent of the population) participated, receiving an average
of $134 per person per month of enrollment. In that year, the USDA delivered nearly 74 percent
of the $92.7 billion spent on food assistance through Food Stamp benefits.2 Over recent decades,
and paralleling the evolution of the FSP, the prevalence of obesity has increased markedly in the
United States. Between 1960 and 2009 the percentage of adults in the United States classified as
overweight or obese (having a body mass index (BMI3
Policy aimed at preventing and reducing obesity has received much more attention and
funding since it became a Presidential priority in 2009 (Levi et al. 2010). Given the scale of the
FSP, and the national spotlight on obesity, the economic and nutritional consequences of the FSP
have been the subject of many studies (Jensen and Wilde 2010). Prior studies have documented
) greater than 25) increased from 41
percent to 68 percent (Flegal 1998; Levi et al. 2010). Many possible causes for the dramatic
increase have been proposed, including the decline in energy expended during work, the decline
in smoking rates, the National School Lunch Program, and agricultural subsidies (Lakdawalla
and Philipson 2002; Nonnemaker et al. 2009; Whitmore-Shanzenbach 2009; Okrent and Alston
2011). Another possible contributing factor is the FSP (Devaney and Moffitt 1991; Gibson
2003; Chen, Yen, and Eastwood 2005; Baum 2007; Ver Ploeg et al. 2007; Meyerhoefer and
Pylypchuk 2008; Ver Ploeg and Ralston 2008; Fan 2010).
1 The Food Stamp Program was renamed the Supplemental Nutrition Assistance Program in October, 2008.
2 Food Stamp Program and total USDA expenditures are taken from Food and Nutrition Services program data, available at: http://www.fns.usda.gov/pd/SNAPsummary.htm and http://www.fns.usda.gov/pd/annual.htm.
3 BMI is calculated as the ratio of weight (kg) to height squared (m2).

2
a statistical association between FSP participation and obesity. For instance, Gibson (2003)
demonstrated that FSP participants are more likely to be overweight or obese than eligible non-
participants. This observation raises the question: Is the additional income provided through
FSP benefits inducing participants to eat significantly more than they would otherwise, and thus
making participants fatter?4
The obesity issue is very complex, with multiple potential contributing factors such that
simple correlation does not establish causation (see Smith, 2009, for a review of the literature
and evidence on the links between poverty, income assistance, and obesity in the United States).
Some evidence suggests that the direction of causation could run from obesity to poverty, and
Previous studies that addressed this question applied a wide variety of methods and
yielded mixed results. Thus, the question remains unanswered; researchers have not identified a
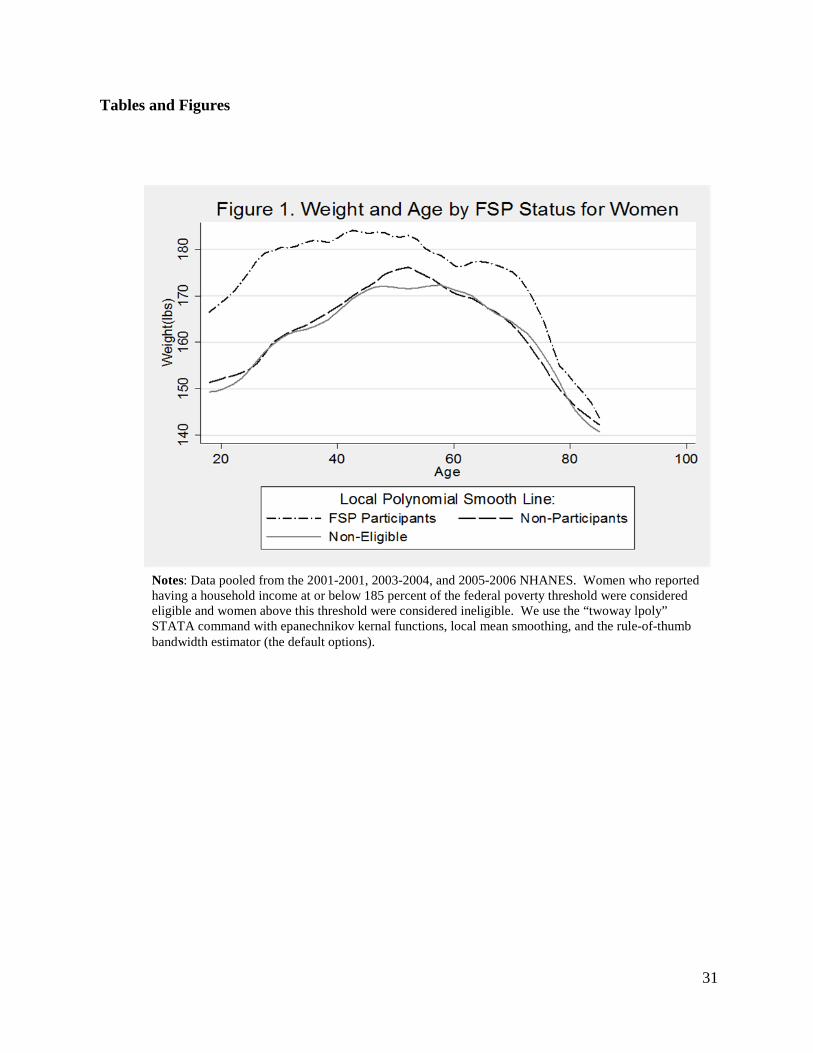
definite causal relationship between obesity and FSP participation. Figure 1 illustrates the large
gap in body weight between women who participated in the FSP and low-income women who
did not participate. The figure plots body weight as a nonparametric function of age for
participants and separately for nonparticipants. We use pooled data from the 2001-2002, 2003-
2004, and 2005-2006 National Health and Nutrition Examination Surveys (NHANES). Food
stamp participants were about 20 pounds heavier than eligible non-participants among 18-40
year-old women during this period. The gap for older women is smaller than for young women;
it averages less than 10 pounds for women over 50. Figure 1 also shows that women with
household income greater than 185 percent of the poverty line had similar weight to eligible non-
participants.
[Figure 1. Weight and Age for Women by FSP Status]
4 Lower-income individuals tend to have less-healthy diets and higher food insecurity, so obesity, malnutrition, and food insufficiency need not be mutually exclusive (Townsend et al., 2001; Schoenborn, Adams, and Barnes, 2002; Drewnowski and Specter, 2004; Doak et al., 2005).

3
thus, from obesity to welfare participation. For instance, Cawley (2004) found that having a high
body weight is associated with significantly lower wage rates for white women.
In this study we model and measure the economic and physiological forces underlying
the links between FSP participation, food consumption, and obesity. That is, we model how the
primary determinants of body weight are driven by the food and leisure consumption choices
made by a utility-maximizing and FSP eligible household. Our study contributes to the literature
in several ways. First, we develop a physiologically consistent model that relates changes in
weight to FSP participation and other factors. Second, we construct models of the two primary
determinants of changes in weight: calorie intake (energy consumption) and physical activity
(energy expenditure). With these two models we test whether FSP participation is associated
with greater calorie consumption, less physical activity, or both. Third, we develop a model of
participation, in which body weight can influence the choice to participate in the FSP. To our
knowledge, no-one else has investigated whether individual propensities for obesity influence the
decision to participate in the FSP. Such an omission may have distorted previous findings.
Lastly, our models include measures of underlying health and psychological conditions and use
data on measured rather than self-reported weight.
This paper is organized as follows. In the next section we state the motivation for this
research and review previous work in the area. In section 3 we outline the conceptual and
theoretical underpinnings, and in section 4 we describe the specifications of the models we use in
the empirical work and the data we employ. In section 5 we discuss the results, and section 6
concludes the paper.

4
2. Background
Obesity is a complex health condition, and much about the causes, consequences, and
underlying mechanisms remains unknown. Many hypotheses about the causes of the “obesity
epidemic” have been suggested. A common thread in many of these hypotheses is the idea that
the widespread availability of relatively inexpensive and unhealthy foods encourages individuals
to over-consume food and, as a consequence, to gain weight. One popular hypothesis is that the
extra income for food afforded by participation in the FSP induces increased caloric intake,
which explains the higher prevalence of obesity among women who participate in the FSP. In
this scenario, we might expect the relatively poorest households, for whom FSP benefits
comprise a larger fraction of total income, to have the greatest increase in food consumption
(Wilde, Troy, and Rogers 2009). In addition, we might expect households with longer
participation spells (e.g., single mothers or elderly households) to increase their consumption
relatively more. In the 1990s over half of participating households exited the FSP within eight
months, suggesting that if FSP participation increases food consumption and causes weight gain,
it has a relatively short window of time to do so for most households (Cody et al. 2005).
Moreover, as Figure 1 shows that a large weight gap exists even for women as young as 18, who
must have participated in the FSP as a adult for only a short time. These arguments raise doubts
about the potential magnitude of any effect of FSP participation on aggregate obesity rates.
Given that taxpayers fund the FSP, a Federally administered entitlement program, the
suggestion that Food Stamps may have contributed to the obesity problem concerns program
administrators and researchers alike. Furthermore, if the FSP promotes obesity, it may also
contribute to the development of other costly health conditions associated with obesity (e.g., type
2 diabetes, heart disease, and some cancers; see Colditz 1992; Flegal et al. 2007; American

5
Diabetes Association 2008; Huang et al. 2009). However, the hypothesis that increasing the
purchasing power of a low-income household would result in negative health outcomes
contradicts the much-studied and well-documented “health-wealth gradient,” that is, the positive
association between measures of socio-economic status and good health.5
Zagorsky and Smith (2009) evaluated the change in the BMIs of individuals who had
ever participated in the FSP, and found that the BMIs of white women increased more during
their FSP participation spell than it did before or after their FSP participation spell. Using the
NLSY79 and applying propensity-score matching techniques to control for pre-participation
weight and other socio-economic and demographic factors, Fan (2010) found that participation
Using both longitudinal and cross sectional data, numerous investigations have
documented the apparent connection between FSP participation or poverty and obesity, reporting
mixed results as to the direction of causation and the magnitude of the effect (see Drewnowski
and Specter 2004, and Smith 2009 for reviews of the literature). Gibson (2003) found a
significantly increased risk of obesity (defined as having a BMI ≥ 30) for low -income women
currently participating in the FSP, and an even larger effect for long-term female FSP
participants. In agreement with Gibson (2003), Chen, Yen, and Eastwood (2005) and Baum
(2007) also found that FSP participation had a positive and significant relationship with BMI and
obesity for women, but not for men. Similarly, Meyerhoefer and Pylypchuk (2008) found that
female FSP participants had a 2.5 percent lower chance of being categorized as normal or
underweight (BMI < 25). Their result has the same sign, but a much smaller magnitude of effect
of FSP participation on obesity than those of similar studies conducted previously (i.e.,
Townsend et al. 2001; Gibson 2003; Chen, Yen and Eastwood 2005).
5 For more on the relationship between socio-economic status and various health outcomes see Adler and Rehkopf (2008), Adler et al. (1994), Deaton (2001), Herd (2010), Matthews and Gallo (2011), and Wilkinson (1996).

6
in the FSP had no significant effect on BMI or obesity among low-income women. The authors
of the studies described above controlled for many individual characteristics including race,
education, gender, marital status, homeownership, state of residence, and household income and
composition.
Another vein of the FSP literature has investigated the links between FSP participation
and the intake of specific nutrients, also with mixed results (Devaney and Moffitt 1991; Butler
and Raymond 1996; Rose, Habicht and Devaney 1998; Wilde, McNamara and Ranney 1999).
While Devaney and Moffitt (1991) and Wilde, McNamara, and Ranney (1999) found positive
and significant effects of FSP participation on the availability or consumption of protein,
calories, total fats, sugars, and several vitamins and nutrients, Butler and Raymond (1996) found
no effect.
Ver Ploeg et al. (2007) found that, in recent years, non-participants have “caught-up” to
FSP participants and that, in the NHANES survey, a “BMI gap” between white female
participants and non-participants was no longer apparent. Similarly, using NHANES I, II, III,
and 1999−2006 surveys, Jolliffe (2010) demonstrated that the low-income population (≤ 130
percent of poverty) has never had a higher prevalence of overweight (BMI ≥ 25) than high-
income individuals. However, low-income individuals who are overweight are more likely to be
severely overweight. Using quantile regression techniques, Jolliffe (2010) modeled the income-
BMI gradient at the BMI weight category cut-offs for underweight (BMI < 18.5), overweight (25
≤ BMI < 30), and obese (BMI ≥ 30). He found that the income-BMI gradient is positive for
underweight individuals and negative for overweight and obese individuals, implying that an
increase in income tends to improve BMI (i.e., move toward the normal range) for individuals at
any point in the BMI distribution. Smith (2009) concluded that links between poverty, public

7
assistance, and obesity run in multiple directions, and that no single public-health policy can
address the obesity problem, especially if we neglect to take into account the potential effects of
non-obesity policies (e.g., the FSP, urban planning, or education standards).
Through the NHANES and other sources, we observe outcomes for obesity, calorie
intake, physical activity, and program participation, but we do not observe the individual choices
and behavior that underlie and determine these outcomes. Prices, income, and preferences
determine whether individuals and households choose to participate in the FSP, engage in regular
physical activity, or eat a balanced diet, and in turn, have an effect on body weight. In this paper
we build on the foundation of prior work on this topic by constructing a more complete
conceptual model of the underlying physiological and behavioral determinants of obesity, from
which we derive corresponding statistical models that allow us to discriminate among alternative
hypotheses. In particular we estimate individual behavioral equations for elements of the
structure, including the choice to participate in the FSP as a potential consequence as well as a
potential cause of obesity. Moreover, unlike some previous studies we use data on actual weight
in addition to self-reported weight.
3. Theoretical and Conceptual Models
This section describes the theoretical and conceptual models we used to investigate the
pathways that link FSP participation and obesity. These include (a) a model of the effect of
participation in the FSP on weight gain, (b) a model of the effect of participation in the FSP on
physical activity and calorie consumption, and (c) a model of the effect of obesity on the
propensity to participate in the FSP.
a. Model of Weight Gain

8
Most of the previous research on the effect of the FSP on obesity investigates the impact
of FSP participation on BMI, omitting many other factors that determine the body weight of an
individual. Furthermore, previous research could not identify whether participants had gained
more weight than non-participants, only if they weighed more for their height (i.e., had a greater
BMI) than non-participants. The question remains, does participation in the FSP result in greater
weight gain, over the course of a spell of participation, than participants would have experienced
otherwise? To test this hypothesis requires a model of the determinants of changes in body
weight that captures the possibility that participation in the FSP is associated with greater weight
gain, all else constant.
On a day-to-day basis the amount of energy stored depends on the amount energy
consumed (EC) relative to energy expended (EE),
( )RMR A TEF AT
ES EC EEEC EE EE EE EE
= −
= − + + + (1)
Total energy expended has four elements. First, RMREE represents the energy expended from the
“resting metabolic rate” (RMR), which is the amount of energy needed to sustain life for a
human at rest.6,7
RMREE
The relative amounts of fat-free-mass (FFM) and fat-mass (FM) largely
determine . Second, AEE represents the energy expended in physical activity and
movement, which is determined primarily by total body weight and the amount of physical
activity. Third, TEFEE represents energy expended during digestion or the “thermic effect of
6 The medical literature generally refers to Equation (1) as the “energy balance” equation.
7 Basal metabolic rate (BMR), resting metabolic rate (RMR), and resting energy expenditure (REE) are often used interchangeably, but BMR has specific measurement criteria. BMR is the amount of energy expended when a person is lying down in a thermo-neutral environment, not moving, has not eaten in 12 hours (i.e., “post absorptive”), and has recently awoken from a full-night sleep (Gropper, Smith and Groff 2009).
9
eating.” Last, ATEE represents the energy expended in adaptive thermogenesis, which is the
energy expended to maintain a normal body temperature (Sherwood 2007).
Energy expenditure from adaptive thermogenesis and the thermic effect of feeding
account for a small fraction total energy expenditure, probably less than 20 percent in most
people. The energy expended sustaining life (i.e., resting metabolism), and energy expended in
physical activity and movement primarily determine total energy expenditure. Thus, in addition
to calorie consumption, factors such as age, gender, physical activity, diet, existing health
conditions (e.g., diabetes or asthma), the relative amounts of FFM and FM, and total body weight
also partially determine weight gain (Sherwood 2007; Gropper, Smith and Groff 2009; Phinney
2009). Individuals gain body weight when daily energy stores are positive for a sustained period
of time:
0 RMR A TEF ATES EI EE EE EE EE> ⇔ − > + + . (2)
Using (2), we define the calorie surplus as
= − RMRCS EC EE . (3)
The calorie surplus roughly measures the difference between energy consumption and basic
energy requirements, and thus, significantly determines the change in energy stores over a period
of time. Therefore, a change in body weight over a given period of time depends on the surplus
of calories (CS), energy expended in physical activity (A), individual characteristics (Z), and
possibly, participation in the FSP:
( ), , ,ES f CS A Z FSP= . (4)
In this equation the variable FSP captures an effect of participation in the FSP on body weight
that is not associated with physical activity, the surplus of calories (which itself may be affected
by FSP participation), or individual characteristics (which are exogenous here). For instance,

10
becoming unemployed may trigger FSP participation and also reduce the opportunity for
weightlifting or other muscle building exercises. A loss of muscle mass will reduce basal
metabolism and cause weight gain even if energy intake and expenditure remain unchanged.
The vector Z captures the effect on ES of individual variation in energy expended during
digestion ( TEFEE ) and adaptive thermogenesis ( ATEE ). In our empirical application, Z also
captures individual variation in the relationship between weight gain and our measured calorie
surplus and activity variables. We include in Z individual characteristics that reflect genetic (e.g.,
race), physiological (e.g., recently having given birth or having a thyroid condition), and
behavioral (e.g., smoking and television viewing time) determinants of body weight, in addition
to several measures of socio-economic status (Feinman and Lieber 1998; Rooney and
Schauberger 2002; Chiolero et al. 2008; Kim 2008; Clark and Dillion 2011; Fraser et al. 2011).
Epidemiological, public health, psychological, and sociological research suggests that socio-
economic status has a significant effect on health outcomes, and posits several pathways by
which socio-economic status affects health. Many of these individual characteristics have not
been controlled for previously. Another contribution of our model is that it controls for both of
the two factors that determine whether an individual has an energy surplus or deficit (i.e., energy
intake and energy expenditure) and does not hold either component constant when determining
energy stores (i.e., body weight).
b. Models of Energy Consumption and Energy Expenditure in Physical Activity
Participation in the FSP could affect obesity if, over the course of a participation spell,
participants (i) consume more energy than they would require to maintain their weight as it was
at the start of their participation spell, and (ii) over-consume in this sense to a greater extent than
if they had not participated. This is the pathway that most of the previous research on the effects

11
of the FSP on obesity has attempted to investigate indirectly, by modeling obesity as a function
of FSP participation. Implicit here is a model of calorie surplus:
( ),CS h FSP Z= , (5)
where the vector Z includes the relevant individual characteristics and other determinants of
energy consumption.
The amount and other characteristics of food eaten in a day are influenced by several
internal and external signals. External cues that affect the intake of food in the short-term
include how the meal looks (portion size and presentation), smells, and tastes (palatability), and
with whom and where one eats (Breifel et al. 1997; McCrory et al. 2000; Spiegelman and Flier
2001, p. 150; Rolls 2007; Wardle 2007). Dietary habits (e.g., set mealtimes), preferences, and
beliefs also play an important role in initiating meals and, thus, total energy intake (Rolls 2007).
Those who suffer from chronic stress (as opposed to acute stress) increase their energy intake,
and more often this increase comes from dietary fats and sweets (Torres and Nowson 2007).
The internal cues that regulate the types and amount of food consumed all act on the
brain to signal hunger and trigger eating or, once eating has begun, to signal satiety and end
eating. The volume, fat content, food variety, and energy density of a meal may all influence
how quickly satiety registers in the brain, and therefore influence energy intake (Jebb 2007;
Rolls 2007; Wardle 2007).
Human physiology and the energy balance equation imply that, if participation in the FSP
contributes to obesity and weight gain, it must do so by increasing energy consumption, reducing
energy expenditure, or both. Above and beyond basic energy requirements (i.e., RMR), total
energy expenditure depends largely on the duration, intensity, and frequency of physical activity
(A). Energy is also expended in job-related and other non-leisure time activities like house- and

12
yard-work, but we do not model this energy expenditure explicitly. In theory, participation in the
FSP could lower the amount of energy an individual expends in physical activity by reducing the
amount of time available for or the utility gained from exercise. That is,
( ),A g FSP Z= , (6)
where the vector Z includes the relevant individual characteristics and other determinants of
energy expenditure, and FSP measures either the length of the FSP participation spell or whether
the individual participated in the past year.
The medical literature suggests that attaining and maintaining a healthy weight over an
extended period of time requires engaging in moderate to vigorous physical activity for 30 to 90
minutes per day (Saris et al. 2003; Slentz et al. 2004). Nearly one in four adults in the U.S. do
not engage in any leisure-time physical activity (Crespo et al. 1996). Strong evidence has shown
that sex, age, income, education and race affect participation in physical activity and exercise
(Trost et al. 2002). Examples of characteristics of the physical environment that create barriers
to physical activity include unsafe neighborhoods, terrain, poor aesthetics, and lack of bike paths
and walking paths (Humpel, Owen and Leslie 2002; Trost et al. 2002). Weather conditions (e.g.,
extreme heat or cold, precipitation, and humidity), season, and hours of daylight also affect
whether adults engage in physical activity (Tucker and Gilliland 2007; Sumukadas et al. 2009).
c. FSP Participation Model
Following Moffitt (1983) and Meyerhoefer and Pylypchuk (2008), we model the decision
to participate in the FSP by an income eligible household as the result of a household utility
maximization process. Household decision-makers maximize utility with respect to food (which
can be transformed into energy consumption and thus, surplus calories) (CS), non-food (NF), and
their current weight status (ES) net of (i) the disutility of unhealthiness or obesity and (ii) the

13
stigma of welfare receipt, given constraints on total household money income (Y) and time (H).
NF consists of other purchased (non-food) goods unrelated to the production of a healthy weight.
The household decision-maker maximizes the net-utility function given by Equation (7),
subject to the budget constraint given by Equation (8), and the time constraint given by Equation
(9).
( ) ( ) ( ), ,max , , , , ;Desired P
F NF HU L CS NF H C ES ES P C S T Z− − − ⋅
(7)
Y EI P FSB= + ⋅ (8)
H W L A= + + (9)
W, L, and A measure the amount of time spent at work, leisure (e.g., sleeping, cooking meals, or
watching television), and doing physical activity, respectively. In this framework 1P = if the
household participates, 0 if not; household and individual characteristics affect ( ), ;PC S T Z ,
which describes the (fixed) disutility of the stigma (S) and transaction costs (T) associated with
participating in the FSP; ( )DesiredC ES ES− represents the disutility associated with feeling
overweight (e.g., social stigma or feeling like an outcast). For simplicity, total income (Y) is
comprised of earned income (EI) and the FSP benefit (FSB).8
8 Some evidence suggests that being obese carries a significant stigma and that this stigma has a lasting effect on education and earnings, especially for women (Gortmaker et al., 1993; Puhl and Brownell, 2001; Baum and Ford, 2004).
The vector Z includes personal
characteristics that influence health and the disutility of participation.
When the household maximizes utility it jointly determines body weight, physical
activity, and food demand. Utility maximization results in functions describing household
demand for food, non-food, labor, and physical activity, as functions of exogenous prices,
income, and other household characteristics, which also determine the FSP participation choice.

14
The decision to participate in the FSP hinges on whether the utility of the eligible household,
when it participates, is greater than its utility when it does not participate. That is, if P∗
(Equation (10)) signifies the net utility from participation,
( ) ( )
( ) ( ) ( ), , , , , , ,
, ;
P P P NP NP NP
P NP P
P U F NF ES EI FSB U F NF ES EI
C S T Z C ES C ES
∗ = −
− + − (10)
then the household participates if 0P∗ > and does not participate otherwise. The superscript
,j P NP= indicates whether the household participates in the FSP.
From Equation (10), changes in earned income (EI), welfare stigma (S), transaction costs
(T), information, and body image will influence the likelihood of participating in the FSP. That
is, reducing EI, S, or T would increase the probability that the household participates. Previous
work suggests that transaction costs tend to be greater for single-parent families, seniors, those
who do not speak English, residents of rural areas, those who work non-traditional hours,
households with two full-time working adults, and those who do not participate in other social
welfare programs (Food and Nutrition Service 1999; Currie and Grogger 2001; Gabor et al.
2002; McKernan and Ratcliffe 2003; Yen 2010). Those with more education, smaller families,
lower unemployment, and more uncertainty about the amount of FSP benefits they would receive
experience a greater disutility of welfare or stigma cost (Moffitt 1983). For female-headed
households, a FSP participation spell decreases in length with increases in the household head’s
current income and with decreases in her uncertainty about future income (Blank and Ruggles
1996). Lastly, the probability that a household will choose to participate increases with increases
in its expected FSP benefit (Food and Nutrition Service 1999; Currie 2004). Applying for
benefits, recertifying FSP eligibility, and possibly increased food preparation and cooking time

15
constitute some of the time costs associated with participation in the FSP, but the same factors
may also have an effect on body weight by changing consumption and meal preparation choices.
4. Empirical Model and Results
We specify regression models based on this theoretical development to quantify the
empirical links and test for the effects of FSP participation on obesity. The outcomes we model
result from the constrained utility maximization choices made by the FSP-eligible household’s
decision-maker. That is, the household decision-maker chooses whether the eligible household
participates in the FSP, which potentially affects food consumption, caloric intake, the amount of
time available for physical activity, and hence, body weight. The model specification, data
details, and estimation results are presented next.
a. Model Specification
Given the available data, in our empirical work we use the change in body weight during the
previous year (∆WT = WTt - WTt-1) as a proxy for the change in energy stores (ES) from
Equations (1) and (4). Similarly, we use an indicator variable that takes a value of one if the
individual reported engaging in vigorous physical activity in the previous 30 days and zero
otherwise, VA, as a proxy for energy expenditure represented in Equation (6).9
1124.0−−= ⋅t
RMR tEE WT
To approximate
calorie surplus, we use the RMR prediction formulas:
(for men) (11)
1121.6−−= ⋅t
RMR tEE WT (for women) (12)
9 The NHANES questionnaire asked: “Over the past 30 days did {you/SP}do any vigorous activities for at least 10 minutes that caused heavy sweating, or large increases in breathing or heart rate? Some examples are running, lap swimming, aerobics, or fast bicycling.” From: http://www.cdc.gov/nchs/data/nhanes/nhanes_03_04/paq_c.pdf.

16
where 1−tWT denotes self-reported weight one year ago in kilograms. That is, we calculate the
minimum energy requirements of individuals in our sample, based on their self-reported weight
one year prior to the medical examination (Gropper, Smith and Groff 2009).10 1tRMREE − Using and
current calorie consumption (the average of the two 24-hour diet recall measurements) we
measure the calorie surplus for each individual as 1−= − tRMRCS EC EE .
The regression model
0 1 2 3 4 ESWT VA CS FSP Z∆ = α +α +α +α +α + ε (13)
represents the physiological processes and energy balance relationship described in Equations (2)
and (4), and relates the change in weight in the past year to an individual’s calorie surplus and
length of FSP participation (or an indicator for participation in the previous 12 months), while
controlling for physical activity, determinants of the amount of energy expended in physical
activity, and other variables that influence energy expenditure, such as age and sedentary
behaviors like watching television.11
10 We also used several other RMR prediction equations including the Mifflin St. Jeor, Oxford, and WHO/FAO/UNU/Schofield prediction equations. The results were qualitatively the same and are available from the authors upon request (Frankenfield, Roth-Yousy and Compher 2005; Henry 2005; Gropper, Smith and Groff 2009). We do not use RMR prediction equations based on FFM and FM because we only ovserve these variables for a subset of our sample. Frankenfield, Roth-Yousy, and Compher (2005) found that the Mifflin St. Jeor equation predicted RMR with less error than the Harris-Benedict, WHO/FAO/UNU/Schofield, or Owen RMR prediction equations. Henry (2005) found that the WHO/FAO/UNU/Schofield often over-estimates RMR, and presented the new Oxford RMR equations.
We estimate (13) both with and without the activity (VA)
and calorie surplus variables (CS). When these variables are excluded, the coefficient α3
measures the total effect of FSP on weight gain holding Z constant. When these variables are
included, the coefficient α3 measures any additional effect of FSP on weight gain apart from that
which occurs through our measured activity and calorie surplus variables.
11 Dietary recall data are notorious for underreporting in total energy intake, and some RMR prediction equations overstate energy requirements, implying that the calculated calorie surplus could be biased down (Breifel et al. 1997; Henry 2005).

17
Equations (14), (15), and (16) are empirical counterparts of the conceptual models of
energy consumption, energy expenditure, and FSP participation described by Equations (5), (6),
and (10).
0 1 2= δ + δ + δ + εECCS FSP Z (14)
0 1 2= β +β +β + εEEVA FSP Z (15)
0 1 2= φ + φ + φ + εt FSPFSP WT Z (16)
The contemporaneous weight variable (WTt) in (16) may be endogenous to FSP if α3 ≠ 0 in (13).
We address this possibility when discussing the empirical results.
In all four regression models the vector Z includes information on genetic variation (age
and race), socio-economic status (marital status, income-to-poverty ratio, and educational
attainment), health behaviors and conditions (smoking, alcohol, thyroid conditions, depression,
serum C-reactive protein, television and computer viewing time, and the number of meals at
restaurants), and employment characteristics (indicators for being employed, ever-worked, and
working full-time). We also tested one specification of Equation (13) that aimed to control for
energy expended in work activities by including indicator variables for employment and
occupation class in the vector of individual characteristics, Z. In Equation (16) the vector Z also
includes an indicator for U.S. citizenship, the number of months at the current job, and
homeownership status. In contrast to previous research, contemporaneous weight WTt in our
model is measured, not self-reported. However, respondents self-reported their body weight one
year ago WTt-1.
b. Data

18
In our main analysis we use data from the 2001-2002, 2003-2004, and 2005-2006
National Health and Nutrition Examination Surveys (NHANESs). The National Center for
Health Statistics (NCHS) and the Centers for Disease Control and Prevention (CDC) conduct the
NHANES. Starting in 1999 the NHANES became a continuous annual survey with publicly
available data released in two-year increments. The NHANES has a complex survey design and
is intended to represent civilian non-institutionalized individuals of all ages living in the United
States. The NHANES contains details on household and individual characteristics, dietary recall
information, lab test results, and physical exam measurements. Of the 38,779 individuals
screened for participation in the 2001-2003 NHANES, 31,509 completed interviews, and 30,070
underwent a physical exam in the mobile examination center (MEC).
We use the sampling weights, masked variance units, and strata provided in the publicly
available 2001-2006 NHANES data, and perform all analysis in STATA-MP 10.0 for Windows.
We restrict the data to non-pregnant women at least age 18 and no older than 70 with non-
missing values for the variables used in our analysis and household income no more than 185
percent of the federal poverty threshold. We choose women with reported household income at
or below 185 percent of the federal poverty threshold because this is the gross income cutoff for
the Special Supplemental Nutrition Program for Women, Infants, and Children (WIC), and
women who participate in WIC automatically qualify to receive FSP benefits as well. This
makes women (especially women less than 40 years of age) at or below this cutoff a reasonable
estimate of the eligible female population. These adjustments leave us with a total of 2,018
observations, 514 of which participated in the FSP. Using the “WTMEC2YR” survey weights
we construct the appropriate weights for the six years of combined data with the formula
(MEC6YR = 1/3*WTMEC2YR) and the tutorial provided by the National Center for Health
19
Statistics (NCHS). Only the 2001-2002 and 2003-2004 NHANESs contain information on
occupation and employment, so we omit the 2005-2006 observations when estimating the FSP
participation decision (Equation (16)). This adjustment leaves 1,342 observations and 333 FSP
participants remained for the participation model. The survey weights used in these analyses
were constructed using the formula (MEC4YR = 1/2*WTMEC2YR).
Table 1 includes summary statistics for the sample data. Consistent with the previous
literature, female participants in our sample are less highly educated or likely to be married, and
more likely to be black, have an infant or young child, smoke cigarettes, or rent their homes.
Participating women experienced approximately three more days of feeling depressed in the
previous month, drank 0.5 more alcoholic drinks per day, and ate fewer meals from restaurants
each week than low-income women who did not participate.
[Table 1. Summary Statistics]
c. Results and Interpretation
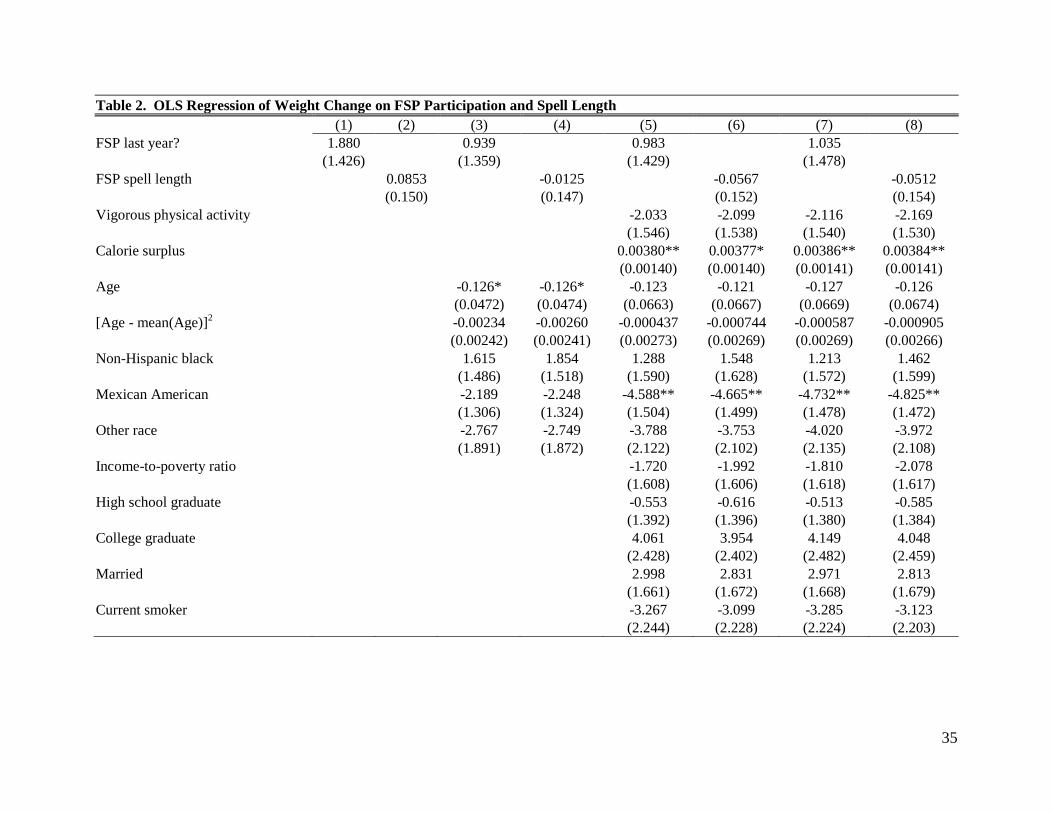
Table 2 displays the results from estimation of the model described by Equation (13) for
low-income women. As can be seen in column 1, when we do not control for any individual
characteristics, we find a positive but statistically insignificant association exists between FSP
participation and weight gain over the previous year.12
12 This coefficient estimate of 1.880 differs from the mean difference of 2.375 in Table 1 because Table 1 presents unweighted summary statistics, whereas our regression estimates use the NHANES survey weights.
Columns 3, 5, and 7 display the results of
the model, adding progressively more individual characteristics. Focusing on column 7, our
results suggest that, all else equal, women who participated in the FSP gained about 1.04 more
pounds in the past year compared with low-income women who did not participate. This
estimate is not statistically significant and has a 95 percent confidence interval of (-1.86, 3.93).
Compared to the model with no controls, the coefficient on FSP participation is halved when we

20
control for race and age only. Adding further controls, including activity and calorie surplus,
makes little difference to the coefficient estimate. Thus, even if we were to take the point
estimate at face value, the one pound greater weight gain of FSP participants does not occur
through increased food consumption or reduced activity.
We find even weaker evidence that the FSP causes obesity when we focus on FSP spell
length (measured in months). Without any controls, we obtain an insignificant coefficient
estimate of 0.085 pounds per month on food stamps; this estimate becomes negative when we
add controls to the model, but it remains statistically insignificant with a 95 percent confidence
interval of (-0.35, 0.25) in column 8. Thus, controlling for age and race and taking the point
estimates at face value, additional months on food stamps are associated with a small weight
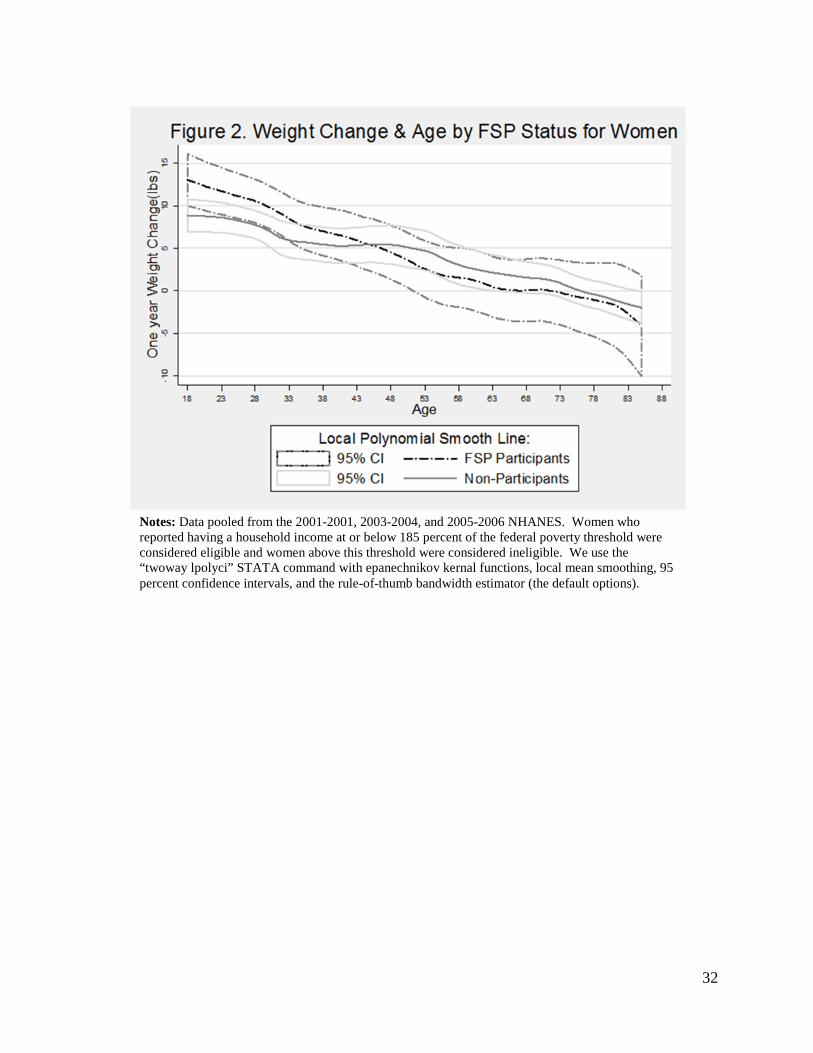
loss. Figure 2 demonstrates these results graphically by plotting one-year weight gain as a
nonparametric function of age as in Figure 1. Across all ages, Figure 2 shows small differences
in weight gain between FSP participants and non-participants. In sum, these regressions reveal
no evidence that FSP participation predicts, let alone causes, weight gain.13
As we would expect, a significant positive relationship exists between the calorie surplus
and weight gain. The coefficients on calorie surplus equal about 0.0038, which suggests that a
calorie surplus of 100 kilocalories per day is associated with a 0.38 pound increase in body
weight over the past year. This coefficient is somewhat smaller than suggested in the medical
literature. Hall et al (2009) suggests the formula
lbs kcal/day 103.466BW EI ∆ = ∆ , which would
imply a coefficient of 0.0097. Our smaller estimate may be caused in part by measurement error
13 When we restricted the data set to include only women for whom we had information on occupation and employment and included indicators for occupation class and whether they worked outside the home, the coefficient on FSP participation decreased to 0.33 (results not shown). Women with a job categorized as “manufacturing,” which likely entails more strenuous activity than occupations in the retail, healthcare, or transportation categories, gained less weight.

21
in our calorie intake variable and in part by behavioral differences that lead people who eat more
calories to also burn more calories in ways that are not controlled for in our model.
Few of the control variables in Table 2 are statistically significant. Women who reported
that they breastfed gained about seven more pounds in the past year than women who did not
breastfeed at the time of the survey. Being married, having a thyroid condition, higher amounts
of C-reactive protein in the blood, and spending more than three hours a day on the computer
were also associated with gaining more weight over the past year.
[Figure 2. Weight Change and Age for Women by FSP Status]
[Table 2. OLS Regression of Weight on FSP Spell Length]
Tables 3 and 4 contain the results from estimation of the models described by Equations
(14) and (15). Our results imply that FSP participation has no significant effect on calorie
surplus, but is negatively associated with vigorous physical activity. Column 1 in Table 3 shows
that FSP participants consume 93.2 fewer calories than eligible non-participants, although this
difference is statistically insignificant. This estimate drops to -63.1 when we add all of the
control variables. The FSP spell length variable is similarly negative and insignificant.
Although Table 4 shows that FSP participation is associated with a reduced likelihood of
vigorous physical exercise, the coefficient estimates are small in magnitude. Using column 7 as
an example, if we multiply the coefficients in Table 4 by the estimated effect of vigorous
physical activity on weight gain from Table 2, we get a prediction of 0.0338*2.116 = 0.0715
pounds per year of weight gain for FSP participation. This estimate is too small to explain the
large differences in average weight shown in Figure 1. Moreover, the coefficient from Table 2
on which it is based is statistically not significantly different from zero. Collectively, the

22
insignificant effects of FSP participation on the change in weight and calorie surplus suggest
there is no causal link from FSP participation to obesity.
[Table 3. OLS Regression of Calorie Surplus on FSP Spell Length]
[Table 4. OLS Regression of Physical Activity on FSP Spell Length]
We conducted several robustness checks of our results. Following Shapiro (2005) and
using data from the 2007-2008 NHANES we also investigated whether the timing of the
disbursement of FSP benefits had any effect on caloric intake, and found no effect.14
To better understand the positive association between weight and FSP participation, we
need to identify the factors that influence participation. To this end, Table 5 contains the results
for the model described by Equation (16). Column 1 shows that the probability of FSP
participation increases by 0.00149 for every pound of body weight. This coefficient provides
another way to view the differences in body weight shown in Figure 1. If this significant
coefficient reflects omitted variable bias, then including those omitted variables in the model
would reduce the coefficient on body weight to zero. When we control for age and race, the
coefficient drops by 39% to 0.00106, and its value remains the same when we add a long list of
control variables. In column 4, we include both current and the one-year lag of body weight.
Because these variables are highly correlated, they are not individually significant, but their sum
has a similar value to the coefficient on weight in column 3.
In addition,
the qualitative results were unchanged when we conducted the analysis without survey weights,
or dropped observations with extreme values for calorie intake.
Consistent with the previous literature, we find that more-educated women and women
with greater job security (as measured by time in the current job) were less likely to participate in
the FSP. We also find that women who ate more meals at restaurants were significantly less 14 These results are omitted for brevity, but are available from the authors upon request.

23
likely to participate in the FSP, perhaps because they had strong preferences for food-away-
from-home, which cannot be purchased with food stamps. Black women, women who smoked,
and women who rented their place of residence were 17.5, 13, and 13 percentage points more
likely to participate, respectively (column 3 of Table 5). Women with children less than five
years of age had an approximately 20 percentage point higher probability of participating.
However, the inclusion of additional determinants of FSP participation did not make the
relationship between current weight and participation insignificant. The coefficient in column 3
implies that for two women with a 20 pound difference in body weight, the heavier woman has a
1.1 percentage point (or 4.4 percent) greater likelihood of choosing to participate in the FSP than
the lighter woman, all else equal.
[Table 5. Linear Probability Model of FSP Participation and Body Weight]
5. Conclusion
Controlling for many individual and household characteristics that affect body weight, we
find no evidence of a positive relationship between FSP participation and weight gain. Likewise,
we find no evidence that participation in the FSP significantly increases calorie consumption, or
that it decreases leisure-time physical activity enough to affect weight. Taken in combination
these results indicate that the causal relationship between the FSP and obesity, if there is one,
does not run from FSP participation to obesity. Rather, the association between weight and FSP
results from confounding factors that make some individuals more likely than others to be
overweight and to participate in the FSP. It is conceivable that characteristics outside of our
dataset that vary geographically could affect whether households participate, along with their

24
dietary patterns, physical activity levels, and social norms with respect to welfare participation
and body image.

25
6. References
Adler, N.E., et al. 1994. "Socioeconomic Status and Health: The Challenge of the Gradient." American Psychologist, 49(1): 15-24.
Adler, N.E. and D.H. Rehkopf. 2008. "U.S. Disparities in Health: Descriptions, Causes, and
Mechanisms." Annual Review of Public Health, 29: 235-252. American Diabetes Association. 2008. "Economic Costs of Diabetes in the U.S. in 2007."
Diabetes Care, 31(3): 596-615. Baum, C. 2007. "The Effects of Food Stamps on Obesity." United States Department of
Agriculture, Economic Research Service, Contractor and Cooperator Report No. 34. Baum, C.L. and W.F. Ford. 2004. "The Wage Effects of Obesity: A Longitudinal Study." Health
Economics, 13: 885-899. Blank, R.M. and P. Ruggles. 1996. "When Do Women Use Aid to Families with Dependent
Children and Food Stamps? The Dynamics of Eligibility Versus Participation " The Journal of Human Resources, 31(1): 57-89.
Breifel, R., et al. 1997. "Dietary Methods Research in the Third National Health and Nutrition
Survey: Underreporting of Energy Intake." American Journal of Clinical Nutrition, 65(Suppl): 1203S-1209S.
Butler, J.S. and J.E. Raymond. 1996. "The Effect of the Food Stamp Program on Nutrient
Intake." Economic Inquiry, 34: 781-798. Cawley, J. 2004. "The Impact of Obesity on Wages." The Journal of Human Resources, 39(2):
451-474. Chen, Z., S.T. Yen and D.B. Eastwood. 2005. "Effects of Food Stamp Participation on Body
Weight and Obesity." American Journal of Agricultural Economics, 87(5): 1167-1173. Chiolero, A., et al. 2008. "Consequences of Smoking for Body Weight, Body Fat Distribution,
and Insulin Resistance." American Journal of Clinical Nutrition, 87(4): 801-809. Clark, M.K. and J.S. Dillion. 2011. "BMI Misclassification, Leptin, C-Reactive Protein, and
Interleukin-6 in Young Women with Differing Levels of Lean and Fat Mass." Obesity Research & Clinical Practice, 5(2): e85-e92.
Cody, S., et al. 2005. "Food Stamp Program Entry and Exit: An Analysis of Participation Trends
in the 1990s." Economic Research Service, USDA, Mathematica Policy Research, Inc. CCR no. 8. http://www.mathematica-mpr.com/publications/pdfs/FSPentryexit.pdf.

26
Colditz, G.A. 1992. "Economic Costs of Obesity." American Journal of Clinical Nutrition, 55: 503s-507s.
Crespo, C.J., et al. 1996. "Leisure-Time Physical Activity Among US Adults." Archives of
Internal Medicine, 156: 93-98. Currie, J. April 2004. "The Take-Up of Social Benefits." The Institute for the Study of Labor
(IZA), IZA Discussion Paper. 1103. Currie, J. and J. Grogger. 2001. "Explaining Recent Declines in Food Stamp Program
Participation." Brookings-Wharton Papers on Urban Affairs: 203-244. Deaton, A. January 2001. "Relative Deprivation, Inequality, and Mortality." NBER, NBER
Working Paper Series No. 8099 http://www.nber.org/papers/w8099. Devaney, B. and R. Moffitt. 1991. "Dietary Effects of the Food Stamp Program." American
Journal of Agricultural Economics, 73(1): 202-211. Doak, C., et al. 2005. "The Dual Burden Household and the Nutrition Transition Paradox."
International Journal of Obesity, 29: 129-136. Drewnowski, A. and S. Specter. 2004. "Poverty and Obesity: The Role of Energy Density and
Energy Costs." American Journal of Clinical Nutrition, 79: 6-16. Fan, M. 2010. "Do Food Stamps Contribute to Obesity in Low-Income Women? Evidence from
the National Longitudinal Survey of Youth 1979." American Journal of Agricultural Economics, 92(4): 1165-1180.
Flegal, K.M., et al. 2007. "Cause-Specific Excess Deaths Associated with Underweight,
Overweight, and Obesity " Journal of the American Medical Association, 298(17): 2028-2037.
Flegal, K.M., et al. 1998. "Overweight and Obesity in the United States: Prevalence and Trends,
1960-1994." International Journal of Obesity, 22: 39-47. Food and Nurtrition Service. 1999. "The Nutrition Safety Net: Help for the Elderly and
Disabled." USDA, http://www.fns.usda.gov/SNAP/public_advocacy/pdfs/elderly_guide.pdf.
Food Security in the United States: Definitions of Hunger and Food Security. 2009. USDA,
http://www.ers.usda.gov/Briefing/FoodSecurity/labels.htm . (March 12, 2010). Frankenfield, D.C., L. Roth-Yousey and C. Compher. 2005. "Comparison of Predictive
Equations for Resting Metabolic Rate in Healthy Nonobese and Obese Adults: A Systematic Review." Journal of the American Dietetic Association, 105(5): 775-789.

27
Feinman, L. and C.S. Lieber. 1998. "Nutrition in Diet and Alcoholism". In Modern Nutrition in Health and Disease, ed. M.E. Shils, J.A. Olson, M. Shike and A.C. Ross: 1395-1418 Baltimore, Maryland, Williams & Wilkins.
Fraser, A., et al. (2011) Associations of Gestational Weight Gain with Maternal Body Mass
Index, Waist Circumference, and Blood Pressure Measured 16 y After Pregnancy: the Avon Longitudinal Study of Parents and Children. American Journal of Clinical Nutrition, doi: 10.3945/ajcn.110.008326.
Gabor, V., et al. 2002. "Seniors' Views of the Food Stamp Program and Ways to Improve
Participation - Focus Group Findings in Washington State " USDA ERS, E-Fan No. 02-012. http://www.ers.usda.gov/publications/efan02012/.
Gibson, D. 2003. "Food Stamp Program Participation is Positively Related to Obesity in Low
Income Women." Journal of Nutrition, 133: 2225-2231. Gortmaker, S.L., et al. 1993. "Social and Economic Consequences of Overweight in
Adolescence and Young Adulthood." The New England Journal of Medicine 329(14): 1008-1012.
Gropper, S.S., J.L. Smith and J.L. Groff, Eds. (2009). Advanced Nutrition and Human
Metabolism. Belmont, CA, WADSWORTH Hall, K.D., et al. 2009. "The Progressive Increase of Food Waste in America and Its
Environmental Impact." PLoS ONE, 4(11): e7940. Henry, C. 2005. "Basal Metabolic Rate Studies in Humans: Measurement and Development of
New Equations." Public Health Nutrition, 8(7A): 1133-1152. Herd, P. 2010. "Education and Health in Late-Life among High School Graduates: Cognitive
versus Psychological Aspects of Human Capital." Journal of Health and Social Behavior 51: 478-496.
Huang, E.S., et al. 2009. "Projecting the Future Diabetes Population Size and Related Costs for
the U.S." Diabetes Care, 32(12): 2225-2229. Humpel, N., N. Owen and E. Leslie. 2002. "Environmental Factors Associated with Adults'
Participation in Physical Activity: A Review." American Journal of Preventive Medicine, 22(3): 188-199.
Jebb, S.A. 2007. "Dietary Determinants of Obesity." Obesity Reviews, 8(Suppl. 1): 93-97. Jensen, H.H. and P. Wilde. 2010. "More Than Just Food: The Diverse Effects of Food Assistance
" Choices: The Magazine of Food, Farm and Resource Issues, 25(3).

28
Jolliffe, D. 2010. "Overweight and Poor? On the Relationship between Income and Body Mass Index." Institute for the Study of Labor (IZA), Bonn, Germany.
Kim, B. 2008. "Thyroid Hormone as a Determinant of Energy Expenditure and the Metabolic
Rate." Thyroid, 18(2): 141-143. Lakdawalla, D. and T. Philipson. May 2002. "The Growth of Obesity and Technological
Change: A Theoretical and Empirical Examination." NBER Working Paper Series, No. 8946.
Levi, J., et al. 2010. "F as in Fat: 2010." Robert Wood Johnson Foundation Trust for America's
Health Matthews, K.A. and L.C. Gallo. 2011. "Psychological Perspectives on Pathways Linking
Socioeconomic Status and Physical Health." Annual Review of Psychology 62(1): 501-530.
McCrory, M.A., et al. 2000. "Dietary Determinants of Energy Intake and Weight Regulation in
Healthy Adults." Nutrition, 130: 276S-279S. McKernan, S.-M. and C. Ratcliffe. 2003. "Employment Factors Influencing Food Stamp
Program Participation." The Urban Institute, Washington, DC. Meyerhoefer, C.D. and Y. Pylypchuk. 2008. "Does Participation in the Food Stamp Program
Increase the Prevalence of Obesity and Health Care Spending? ." American Journal of Agricultural Economics, 90(2): 287-305.
Moffitt, R. 1983. "An Economic Model of Welfare Stigma." American Economic Review, 73(5):
1023-1035. Nonnemaker, J., et al. 2009. "Have Efforts to Reduce Smoking Really Contributed to the Obesity
Epidemic?" Economic Inquiry, 47(2): 366-376. Okrent, A. and J.M. Alston. March 16, 2011. "The Effects of Farm Commodity and Retail Food
Policies on Obesity and Economic Welfare in the United States." UC Davis, Robert Mondavi Institute - Center for Wine Economics Working Paper No. 1101. http://vinecon.ucdavis.edu/spaw2/uploads/files/cwe1101.pdf.
Phinney, S. (2009). Human Energetics: What the Body Stores, How the Body Uses Fuel, and
How We Assess It
. Fall 2009 NPB 132 Lecture, UC Davis.
Puhl, R. and K.D. Brownell. 2001. "Bias, Discrimination, and Obesity." Obesity Research, 9(12): 788-805.
Rolls, E.T. 2007. "Understanding the Mechanisms of Food Intake and Obesity." Obesity
Reviews, 8(Suppl. 1): 67-72.

29
Rooney, B.L. and C.W. Schauberger. 2002. "Excess Pregnancy Weight Gain and Long-Term Obesity: One Decade Later." Obstetrics & Gynecology, 100(2): 245-252.
Rose, D., J.-P. Habicht and B. Devaney. 1998. "Household Participation in the Food Stamp and
WIC Programs Increases the Nutrient Intakes of Preschool Children." Journal of Nutrition, 128(3): 548-555.
Saris, W., et al. 2003. "How Much Physical Activity is Enough to Prevent Unhealthy Weight
Gain? Outcome of the IASO 1st Stock Conference and Consensus Statement." Obesity Reviews, 4: 101-114.
Schoenborn, C.A., P.F. Adams and P.M. Barnes. 2002. "Body Weight Status of Adults: United
States 1997-98." National Center for Health Statistics, Centers for Disease Control and Prevention, Hyattsville, MD.
Sherwood, L. 2007. Human Physiology: From Cells to Systems. Belmont, CA, Thomson. Slentz, C., et al. 2004. "Effects of the Amount of Exercise on Body Weight, Body Composition,
and Measures of Central Obesity." Achives of Internal Medicine, 164: 31-39. Smith, P.K. 2009. Obesity Among Poor Americans: Is Public Assistance the Problem? Nashville,
TN, Vanderbilt University Press. Spiegelman, B.M. and J.S. Flier. 2001. "Obesity and Regulation of Energy Balance." Cell, 104:
531-543. Sumukadas, D., et al. 2009. "Day Length and Weather Conditions Profoundly Affect Physical
Activity Levels in Older Functionally Impaired People." Journal of Epidemiology and Community Health, 63: 305-309.
Torres, S.J. and C.A. Nowson. 2007. "Relationship Between Stress, Eating Behavior, and
Obesity." Nutrition, 23: 887-894. Townsend, M.S., et al. 2001. "Food Insecurity is Positively Related to Overweight in Women."
Journal of Nutrition, 131: 1738-1745. Trost, S.G., et al. 2002. "Correlates of Adults' Participation in Physical Activity: Review and
Update." Medicine & Science in Sports & Exercise, 34(12): 1996-2001. Tucker, P. and J. Gilliland. 2007. "The Effect of Season and Weather on Physical Activity: A
Sytematic Review." Public Health, 121: 909-922. Ver Ploeg, M. and K. Ralston. 2008. "Food Stamps and Obesity: What Do We know?"
Economic Research Service USDA, Economic Information Bulletin Number 34.

30
Ver Ploeg, M., et al. 2007. "The Vanishing Weight Gap: Trends in Obesity Among Adult Food Stamp Participants (US) (1976-2002) " Economics and Human Biology, 5: 20-36.
Wardle, J. 2007. "Eating Behaviour and Obesity." Obesity Reviews, 8(1): 73-75. Whitmore-Shanzenbach, D. 2009. "Do School Lunches Contribute to Childhood Obesity?" The
Journal of Human Resources, 44(3): 684-709. Wilde, P.E., L.M. Troy and B.L. Rogers. 2009. "Food Stamps and Food Spending: An Engel
Function Approach." American Journal of Agricultural Economics, 91(2): 416-430. Wilde, P.E., P.E. McNamara and C.K. Ranney. 1999. "The Effect of Income and Food Programs
on Dietary Quality: A Seemingly Unrelated Regression Analysis with Error Components." American Journal of Agricultural Economics, 81(3): 959-971.
Wilkinson, R.G. 1996. Unhealthy Societies: The Afflictions of Inequality. New York, NY,
Routledge. Yen, S.T. 2010. "The Effects of SNAP and WIC Programs on Nutrient Intakes of Children."
Food Policy, 35: 576-583. Zagorsky, J.L. and P.K. Smith. 2009. "Does the U.S. Food Stamp Program Contribute to Adult
Weight Gain?" Economics and Human Biology, 7: 246-258.
31
Tables and Figures
Notes: Data pooled from the 2001-2001, 2003-2004, and 2005-2006 NHANES. Women who reported having a household income at or below 185 percent of the federal poverty threshold were considered eligible and women above this threshold were considered ineligible. We use the “twoway lpoly” STATA command with epanechnikov kernal functions, local mean smoothing, and the rule-of-thumb bandwidth estimator (the default options).
32
Notes: Data pooled from the 2001-2001, 2003-2004, and 2005-2006 NHANES. Women who reported having a household income at or below 185 percent of the federal poverty threshold were considered eligible and women above this threshold were considered ineligible. We use the “twoway lpolyci” STATA command with epanechnikov kernal functions, local mean smoothing, 95 percent confidence intervals, and the rule-of-thumb bandwidth estimator (the default options).

33
Table 1. Summary Statistics for Low-Income Women Ages 18-70 by FSP Participation
Units FSP Participants
Non-Participants
Difference in Means
Change in weight in past year lbs 7.577
5.202
2.375**
(28.164)
(20.322)
Current weight lbs 179.700
162.651
17.049**
(54.570)
(43.677)
Calorie surplus kcal/day 185.167
284.032
-98.865**
(956.146)
(917.666)
Vigorous physical activity 0/1 0.232
0.295
-0.063**
(0.422)
(0.456)
Age years 37.107
38.674
-1.567*
(14.959)
(17.232)
Black 0/1 0.465
0.231
0.234**
(0.499)
(0.421)
Mexican American 0/1 0.181
0.348
-0.167**
(0.385)
(0.477)
Other race 0/1 0.084
0.088
-0.004
(0.277)
(0.283)
Income-to-poverty ratio continuous 0.778
1.027
-0.249**
(0.425)
(0.490)
High school graduate 0/1 0.255
0.273
-0.018
(0.436)
(0.445)
College graduate 0/1 0.029
0.064
-0.035**
(0.168)
(0.245)
Married 0/1 0.315
0.448
-0.133**
(0.465)
(0.497)
Current smoker 0/1 0.364
0.191
0.173**
(0.482)
(0.393)
Ex-smoker 0/1 0.111
0.103
0.008
(0.314)
(0.304)

34
Table 1 (continued). Summary Statistics for Low-Income Women Ages 18-70 by FSP Participation
Units FSP Participants
Non-Participants
Difference in Means
Alcoholic drinks per day continuous 1.453
0.991
0.463**
(2.952)
(1.638)
# meals per week away-from-home continuous 1.664
2.548
-0.883**
(2.217)
(3.645)
> 3 hours TV/day 0/1 0.656
0.634
0.021
(0.476)
(0.482)
> 3 hours computer/day 0/1 0.720
0.726
-0.006
(0.450)
(0.446)
Youngest child ≤ 1year old 0/1 0.128
0.090
0.039**
(0.335)
(0.286)
Youngest child 1 - 5 years old 0/1 0.220
0.102
0.118**
(0.415)
(0.302)
Currently breastfeeding 0/1 0.027
0.039
-0.011
(0.163)
(0.193)
Needed more emotional support in past year 0/1 0.128
0.100
0.029*
(0.335)
(0.300)
Days in the past month felt depressed 0/1 8.037
4.884
3.153**
(10.680)
(8.476)
US citizen 0/1 0.903
0.765
0.137**
(0.297)
(0.424)
Renter 0/1 0.714
0.483
0.231**
(0.452)
(0.500)
Don't rent or own home 0/1 0.019
0.053
-0.033**
(0.138)
(0.223)
Number of observations 514 1,504 Standard errors in parenthesis, ** p<0.05, * p<0.1.
35
Table 2. OLS Regression of Weight Change on FSP Participation and Spell Length
(1) (2) (3) (4) (5) (6) (7) (8)
FSP last year? 1.880
0.939
0.983
1.035 (1.426)
(1.359)
(1.429)
(1.478)
FSP spell length
0.0853
-0.0125
-0.0567
-0.0512
(0.150)
(0.147)
(0.152)
(0.154)
Vigorous physical activity
-2.033 -2.099 -2.116 -2.169
(1.546) (1.538) (1.540) (1.530)
Calorie surplus
0.00380** 0.00377* 0.00386** 0.00384**
(0.00140) (0.00140) (0.00141) (0.00141)
Age
-0.126* -0.126* -0.123 -0.121 -0.127 -0.126
(0.0472) (0.0474) (0.0663) (0.0667) (0.0669) (0.0674)
[Age - mean(Age)]2
-0.00234 -0.00260 -0.000437 -0.000744 -0.000587 -0.000905
(0.00242) (0.00241) (0.00273) (0.00269) (0.00269) (0.00266)
Non-Hispanic black
1.615 1.854 1.288 1.548 1.213 1.462
(1.486) (1.518) (1.590) (1.628) (1.572) (1.599)
Mexican American
-2.189 -2.248 -4.588** -4.665** -4.732** -4.825**
(1.306) (1.324) (1.504) (1.499) (1.478) (1.472)
Other race
-2.767 -2.749 -3.788 -3.753 -4.020 -3.972
(1.891) (1.872) (2.122) (2.102) (2.135) (2.108)
Income-to-poverty ratio
-1.720 -1.992 -1.810 -2.078
(1.608) (1.606) (1.618) (1.617)
High school graduate
-0.553 -0.616 -0.513 -0.585
(1.392) (1.396) (1.380) (1.384)
College graduate
4.061 3.954 4.149 4.048
(2.428) (2.402) (2.482) (2.459)
Married
2.998 2.831 2.971 2.813
(1.661) (1.672) (1.668) (1.679)
Current smoker
-3.267 -3.099 -3.285 -3.123
(2.244) (2.228) (2.224) (2.203)

36
Table 2 (continued). OLS Regression of Weight Change on FSP Participation and Spell Length
(1) (2) (3) (4) (5) (6) (7) (8)
Alcoholic drinks per day
0.133 0.134 0.127 0.127
(0.617) (0.612) (0.609) (0.604)
# meals per week away-from-home
-0.210 -0.233 -0.236 -0.259
(0.156) (0.155) (0.157) (0.156)
> 3 hours TV/day
-0.996 -1.003 -0.947 -0.861
(0.890) (0.891) (0.908) (0.907)
> 3 hours computer/day
2.181 2.132 2.279 2.308
(1.432) (1.436) (1.537) (1.525)
Youngest child ≤ 1year old
-0.635 -0.267 -1.025 -0.634
(2.281) (2.251) (2.256) (2.218)
Youngest child 1 - 5 years old
-0.422 -0.147 -0.459 -0.191
(1.947) (1.946) (1.970) (1.968)
Currently breastfeeding
7.068** 6.815** 7.350** 7.066**
(2.364) (2.330) (2.360) (2.320)
Needed more emotional support in past year
-0.332 -0.305 -0.436 -0.439
(2.191) (2.175) (2.233) (2.221)
C-reactive protein (biomarker for inflammation)
4.227** 4.277** 4.234** 4.284**
(0.904) (0.903) (0.909) (0.908)
Thyroid condition
1.558 1.609 1.539 1.606
(2.720) (2.709) (2.723) (2.712)
Days in the past month felt depressed
0.0206 0.0277 0.0207 0.0274
(0.0776) (0.0787) (0.0773) (0.0783)
Year fixed effects no no no no no no yes Yes Constant 4.854** 5.166** 10.84** 11.12** 8.570** 9.186** 10.08** 10.65**
(0.657) (0.602) (2.133) (2.182) (2.607) (2.597) (2.985) (2.991)
Observations 2,018 2,018 2,018 2,018 2,018 2,018 2,018 2,018 R-squared 0.001 0.000 0.014 0.014 0.071 0.071 0.072 0.072

37
Table 3. OLS Regression of Calorie Surplus on FSP Participation and Spell Length
(1) (2) (3) (4) (5) (6) (7) (8)
FSP Last Year -93.20
-100.6
-88.55
-63.08
(62.03)
(65.61)
(68.64)
(63.37)
FSP spell length
-10.74
-10.41
-9.564
-7.803
(5.676)
(6.200)
(6.495)
(6.157)
Age
-15.02** -14.97** -11.90** -11.75** -11.13** -10.99**
(1.940) (1.948) (2.372) (2.370) (2.345) (2.334)
[Age - mean(Age)]2
0.109 0.110 0.109 0.106 0.134 0.130
(0.112) (0.115) (0.124) (0.126) (0.123) (0.124)
Non-Hispanic black
-57.42 -63.60 8.877 2.357 22.27 18.92
(62.29) (60.68) (57.11) (54.53) (57.15) (55.28)
Mexican American
81.05 76.74 158.9** 153.7** 185.3** 180.9**
(45.83) (47.15) (46.71) (48.11) (45.39) (46.46)
Other race
17.90 10.98 61.90 54.76 67.97 62.66
(67.68) (67.48) (62.95) (63.35) (59.06) (59.00)
Income to Poverty Ratio
15.79 12.30 24.66 20.32
(51.10) (49.64) (49.59) (48.47)
High school graduate
8.811 6.281 15.89 13.57
(47.36) (47.43) (46.48) (46.74)
College Graduate
69.27 71.28 57.69 58.45
(94.73) (94.01) (93.37) (92.65)
Married
-21.82 -24.69 -23.07 -26.31
(57.05) (56.95) (57.45) (57.12)
Current smoker
138.6* 136.4 142.3* 141.6*
(68.30) (69.81) (64.99) (66.07)

38
Table 3 (continued). OLS Regression of Calorie Surplus on FSP Participation and Spell Length
(1) (2) (3) (4) (5) (6) (7) (8)
Alcoholic drinks per day
21.70 22.06 22.62 22.91
(20.65) (20.55) (20.75) (20.67)
# meals per week away-from-home
18.26* 18.47* 20.13* 20.16*
(8.902) (9.096) (8.771) (8.963)
> 3 hours TV/day
8.280 9.031 -77.25 -77.22
(55.96) (56.09) (61.88) (62.71)
> 3 hours computer/day
-60.27 -60.74 -133.6* -134.7*
(56.95) (57.26) (55.43) (55.35)
Youngest child ≤ 1year old
107.8 115.4 106.4 114.7
(120.2) (119.5) (120.0) (117.8)
Youngest child 1 - 5 years old
57.46 58.42 60.85 63.35
(58.57) (60.14) (58.27) (59.70)
Currently breastfeeding
228.1 227.3 237.8 235.5
(149.8) (149.3) (157.9) (157.0)
Needed more emotional support in past year
83.35 82.73 116.6 116.5
(61.24) (61.36) (60.38) (60.17)
C-Reactive Protein (biomarker for inflammation)
-196.0** -195.5** -194.8** -194.1**
(26.03) (26.11) (24.58) (24.62)
Thyroid condition
-52.52 -54.50 -63.52 -64.78
(108.7) (111.1) (107.3) (109.4)
Days in the last month felt depressed
1.179 1.127 1.422 1.428
(3.367) (3.359) (3.391) (3.384)
Year fixed effect (2003-2004)
107.6* 108.7*
(49.80) (49.01)
Year fixed effect (2001-2002)
263.7** 265.5**
(62.23) (66.92)
Constant 253.2** 250.2** 811.0** 806.2** 629.2** 627.5** 538.6** 539.9**
(34.12) (29.19) (78.77) (76.03) (88.53) (91.36) (96.36) (100.9)
Observations 2,018 2,018 2,018 2,018 2,018 2,018 2,018 2,018 R-squared 0.002 0.002 0.062 0.062 0.110 0.110 0.119 0.119 Standard errors in parentheses, ** p<0.01, * p<0.05.

39
Table 4. Linear Probability Model of Vigorous Physical Activity on FSP Participation and Spell Length
(1) (2) (3) (4) (5) (6) (7) (8)
FSP Last Year -0.0907**
-0.0887**
-0.0422
-0.0329
(0.0294)
(0.0287)
(0.0253)
(0.0271)
FSP spell length
-0.0112**
-0.0104**
-0.00646**
-0.00569*
(0.00254)
(0.00251)
(0.00231)
(0.00247)
Age
-0.00946** -0.00941** -0.0100** -0.00992** -0.00994** -0.00983**
(0.00121) (0.00121) (0.00115) (0.00114) (0.00112) (0.00111)
[Age - mean(Age)]2
0.000236** 0.000234** 0.000202** 0.000196** 0.000204** 0.000198**
(6.06e-05) (6.00e-05) (5.11e-05) (5.07e-05) (5.09e-05) (5.04e-05)
Non-Hispanic black
-0.0319 -0.0353 -0.0558 -0.0567 -0.0544 -0.0544
(0.0321) (0.0322) (0.0318) (0.0312) (0.0311) (0.0305)
Mexican American
-0.0698* -0.0747* -0.0411 -0.0452 -0.0381 -0.0419
(0.0310) (0.0310) (0.0319) (0.0320) (0.0312) (0.0313)
Other race
0.112* 0.105* 0.0803* 0.0763 0.0737 0.0705
(0.0438) (0.0439) (0.0391) (0.0389) (0.0385) (0.0383)
Income to Poverty Ratio
-0.00115 -0.00647 -0.00174 -0.00706
(0.0263) (0.0271) (0.0260) (0.0268)
High school graduate
-0.0362 -0.0385 -0.0326 -0.0348
(0.0298) (0.0296) (0.0295) (0.0294)
College Graduate
0.130* 0.129* 0.129* 0.129*
(0.0517) (0.0520) (0.0515) (0.0517)
Married
-0.0881** -0.0918** -0.0892** -0.0928**
(0.0268) (0.0264) (0.0266) (0.0262)
Current smoker
-0.0721* -0.0715* -0.0712* -0.0701*
(0.0324) (0.0321) (0.0319) (0.0315)

40
Table 4 (continued). Linear Probability Model of Vigorous Physical Activity on FSP Participation and Spell Length
(1) (2) (3) (4) (5) (6) (7) (8)
Alcoholic drinks per day
-0.00388 -0.00366 -0.00375 -0.00356
(0.00493) (0.00495) (0.00474) (0.00476)
# meals per week away-from-home
-0.000829 -0.000983 -0.00117 -0.00136
(0.00429) (0.00425) (0.00419) (0.00416)
> 3 hours TV/day
-0.0106 -0.0102 -0.0338 -0.0329
(0.0309) (0.0310) (0.0326) (0.0328)
> 3 hours computer/day
-0.0987** -0.0995** -0.117** -0.117**
(0.0349) (0.0347) (0.0361) (0.0355)
Youngest child ≤ 1year old
-0.185** -0.176** -0.199** -0.189**
(0.0480) (0.0493) (0.0477) (0.0493)
Youngest child 1 - 5 years old
-0.0722 -0.0684 -0.0722 -0.0681
(0.0467) (0.0454) (0.0462) (0.0450)
Currently breastfeeding
-0.107 -0.110 -0.0930 -0.0970
(0.0682) (0.0692) (0.0682) (0.0694)
Needed more emotional support in past year
-0.0127 -0.0128 -0.00646 -0.00658
(0.0413) (0.0414) (0.0413) (0.0414)
C-Reactive Protein (biomarker for inflammation)
-0.0332** -0.0322** -0.0329** -0.0319**
(0.0104) (0.0104) (0.0106) (0.0105)
Thyroid condition
-0.0305 -0.0310 -0.0343 -0.0346
(0.0495) (0.0491) (0.0496) (0.0492)
Days in the last month felt depressed
-0.00150 -0.00144 -0.00142 -0.00135
(0.00112) (0.00111) (0.00112) (0.00111)
Year fixed effect (2003-2004)
-0.0434 -0.0422
(0.0277) (0.0278)
Year fixed effect (2001-2002)
0.0310 0.0304
(0.0354) (0.0346)
Constant 0.301** 0.299** 0.614** 0.613** 0.845** 0.850** 0.871** 0.876**
(0.0223) (0.0208) (0.0526) (0.0526) (0.0737) (0.0747) (0.0731) (0.0742)
Observations 2,018 2,018 2,018 2,018 2,018 2,018 2,018 2,018 R-squared 0.008 0.011 0.097 0.099 0.173 0.174 0.176 0.177 Standard errors in parentheses, ** p<0.01, * p<0.05

41
Table 5. Determinants of Food Stamp Participation
(1) (2) (3) (4)
Current weight (lbs) 0.00149** 0.00106** 0.00108** 0.000546
(0.000272) (0.000279) (0.000250) (0.000600)
Self-reported weight 1 year ago
0.000617
(0.000610)
Age
-0.000284 0.00317* 0.00308*
(0.00103) (0.00127) (0.00129)
[Age - mean(Age)]2
-0.000174** -0.000153** -0.000153**
(5.05e-05) (4.90e-05) (4.85e-05)
Non-Hispanic black
0.229** 0.175** 0.175**
(0.0539) (0.0454) (0.0451)
Mexican American
-0.0269 0.0574 0.0562
(0.0377) (0.0503) (0.0507)
Other race
0.0647 0.109* 0.108*
(0.0516) (0.0451) (0.0451)
Income-to-poverty ratio
-0.159** -0.160**
(0.0288) (0.0287)
HS Grad
-0.0520 -0.0529*
(0.0258) (0.0251)
College or more
-0.0654 -0.0632
(0.0465) (0.0461)
Married
-0.0766* -0.0738*
(0.0357) (0.0349)
Current smoker
0.130** 0.130**
(0.0317) (0.0317)

42
Table 5 (continued). Determinants of Food Stamp Participation
(1) (2) (3) (4)
Alcoholic drinks per day
0.00507 0.00478
(0.00502) (0.00506)
# meals per week away-from-home
-0.0201** -0.0200**
(0.00416) (0.00410)
> 3 hours TV/day
-0.0728* -0.0733*
(0.0337) (0.0337)
> 3 hours computer/day
-0.0116 -0.0113
(0.0430) (0.0431)
Youngest child ≤ 1year old
0.198** 0.198**
(0.0565) (0.0558)
Youngest child 1 - 5 years old
0.218** 0.218**
(0.0455) (0.0454)
Currently breastfeeding
-0.157* -0.151*
(0.0716) (0.0728)
Needed more emotional support in past year
0.00388 0.00247
(0.0498) (0.0501)
Work full time
0.0410 0.0443
(0.0537) (0.0536)
Months at current job
-0.000800** -0.000791**
(0.000236) (0.000234)
US Citizen?
0.162** 0.163**
(0.0454) (0.0452)
Renter
0.130** 0.132**
(0.0330) (0.0327)
Don't rent or own home
-0.000730 0.00318
(0.0615) (0.0618)
Constant 0.00486 0.0773 -0.0492 -0.0591
(0.0470) (0.0423) (0.0934) (0.0901)
Observations 1,342 1,342 1,342 1,342 R-squared 0.024 0.077 0.255 0.256 Standard errors in parentheses,** p<0.01, * p<0.05.