The Effects of School Reopenings on COVID-19 ... - UCR
86
1 The Effects of School Reopenings on COVID-19 Hospitalizations Douglas N. Harris Engy Ziedan Susan Hassig January 14, 2021 Abstract: We provide the first broad-scale evidence regarding the effect of school reopenings on COVID-19 health outcomes. We specifically focus on COVID-19-related hospitalizations, which directly measure the health outcomes of greatest interest and are not subject to the numerous measurement problems that arise with virus positivity rates and contact tracing. We also address selection bias in school reopening decisions by using panel analysis of weekly school reopening and COVID-19 hospitalization data for almost every county in the nation. In addition to fixed effects and matched difference-in-differences methods, we use teacher bargaining power as an instrumental variable. For counties whose pre-opening total new COVID-19 hospitalization rates were relatively low in the summer months, we find no effect of in-person school reopening on COVID-19 hospitalization rates. For these counties, the estimates are robust to alternative school reopening and hospitalization data sources, the addition of controls for general state social distancing policies and college opening modes, and alternative estimation methods. For counties where total baseline new hospitalizations were relatively high in the summer, the estimates are inconsistent across methods and are therefore inconclusive. Our work contributes to the ongoing debate on teaching modes during the COVID-19 pandemic and the costs and benefits of remote education. Acknowledgements: This research was carried out under the auspices of the National Center for Research on Education Access and Choice (REACH) based at Tulane University, which is supported by the Institute of Education Sciences, U.S. Department of Education, through Grant R305C100025 to The Administrators of the Tulane Educational Fund. The opinions expressed are those of the authors and do not represent views of the Institute, the U.S. Department of Education, Change Healthcare, or any other organization. For their helpful comments, we thank Sarah Cohodes, Austin Denteh, Dan Goldhaber, Michael Hansen, Scott Imberman, Robert Kaestner, Wei Long, Katharine Strunk, Jon Valant, and Jeffrey Wooldridge. We also thank Sumedha Gupta, Chris Marsicano, and Kosali Simon, as well as Burbio, MCH, Change Healthcare, and the COVID-19 research database, a pro-bono cross-industry collaborative https://covid19researchdatabase.org/, for access to data and assistance in data cleaning and coding. Olivia Carr and Daniel Oliver provided invaluable research assistance. All remaining errors are those of the authors. Author Information: Douglas Harris (corresponding author) is professor and chair of economics at Tulane and director of REACH ([email protected]). Engy Ziedan is Tulane assistant professor of economics at Tulane ([email protected]). Susan Hassig is associate professor of epidemiology at Tulane ([email protected]). JEL Codes: H4, I1, I2 Keywords: Pandemics, Education, Health Outcomes
Transcript of The Effects of School Reopenings on COVID-19 ... - UCR
1
The Effects of School Reopenings on COVID-19 Hospitalizations
Douglas N. Harris
Engy Ziedan
Susan Hassig
January 14, 2021
Abstract: We provide the first broad-scale evidence regarding the effect of school reopenings on
COVID-19 health outcomes. We specifically focus on COVID-19-related hospitalizations, which
directly measure the health outcomes of greatest interest and are not subject to the numerous
measurement problems that arise with virus positivity rates and contact tracing. We also address
selection bias in school reopening decisions by using panel analysis of weekly school reopening
and COVID-19 hospitalization data for almost every county in the nation. In addition to fixed
effects and matched difference-in-differences methods, we use teacher bargaining power as an
instrumental variable. For counties whose pre-opening total new COVID-19 hospitalization rates
were relatively low in the summer months, we find no effect of in-person school reopening on
COVID-19 hospitalization rates. For these counties, the estimates are robust to alternative school
reopening and hospitalization data sources, the addition of controls for general state social
distancing policies and college opening modes, and alternative estimation methods. For counties
where total baseline new hospitalizations were relatively high in the summer, the estimates are
inconsistent across methods and are therefore inconclusive. Our work contributes to the ongoing
debate on teaching modes during the COVID-19 pandemic and the costs and benefits of remote
education.
Acknowledgements: This research was carried out under the auspices of the National Center for
Research on Education Access and Choice (REACH) based at Tulane University, which is supported by the Institute
of Education Sciences, U.S. Department of Education, through Grant R305C100025 to The Administrators of the
Tulane Educational Fund. The opinions expressed are those of the authors and do not represent views of the
Institute, the U.S. Department of Education, Change Healthcare, or any other organization. For their helpful
comments, we thank Sarah Cohodes, Austin Denteh, Dan Goldhaber, Michael Hansen, Scott Imberman, Robert
Kaestner, Wei Long, Katharine Strunk, Jon Valant, and Jeffrey Wooldridge. We also thank Sumedha Gupta, Chris
Marsicano, and Kosali Simon, as well as Burbio, MCH, Change Healthcare, and the COVID-19 research database, a
pro-bono cross-industry collaborative https://covid19researchdatabase.org/, for access to data and assistance in data
cleaning and coding. Olivia Carr and Daniel Oliver provided invaluable research assistance. All remaining errors are
those of the authors.
Author Information: Douglas Harris (corresponding author) is professor and chair of economics at Tulane and
director of REACH ([email protected]). Engy Ziedan is Tulane assistant professor of economics at Tulane
([email protected]). Susan Hassig is associate professor of epidemiology at Tulane ([email protected]).
JEL Codes: H4, I1, I2
Keywords: Pandemics, Education, Health Outcomes

2
I. Introduction
Since it began to spread in January, COVID-19 has led to 1.7 million deaths worldwide
and more than 300,000 in the United States. The health crisis has also precipitated substantial
additional economic, social, and health side effects. Economic activity is predicted to decline by
$16 trillion in the U.S. alone (Cutler & Summers, 2020). Bankruptcies, unemployment, and food
insecurity are up (Bauer et al., 2020). Mental health is worsening (Czeisler et al., 2020; Pan et
al., 2020). People are putting off visits to doctors for non-COVID-19 ailments, potentially
creating unintended health consequences (Ziedan et al. 2020; Mehotra et al. 2020, Skinner et al.
2020).
Another significant effect of the virus has been to keep children, adolescents, and
teenagers home from school. By April, more than 1.5 billion children worldwide were no longer
in school and 263 million remain so (UNESCO, 2020). The U.S. has closed a larger share of
school buildings than other developed countries.1 More than two-thirds of U.S. students in large
districts started the school year fully online (Center for Reinventing Public Education, 2020).
While this number gradually dropped to 37 percent, the vast majority of the remainder are still in
some form of hybrid learning.
While closing school buildings has been a reasonable reaction to an uncertain and fluid
pandemic, the school closures are likely to compound the social and economic crisis in the short-
term and the long-term. Remote learning has forced many parents to leave the workforce or work
from home while also supporting their children’s learning. This has reduced labor force
participation and hindered career trajectories, especially among women (Tedeschi, 2020). Even
when their parents are helping with remote learning, children also learn less at home, which will
affect their human capital, future productivity, and broader well-being (Hanushek and
Woessman, 2020). While data collection during the pandemic has been problematic, there are
already signs of learning loss and rising achievement gaps (Bacher-Hicks, Goodman, and
Mulhern, 2020; Chetty et al., 2020; Kuhfeld et al., 2020).2
When children are home, they are also more likely to experience physical abuse. While
the number of reports of abuse have plummeted, this is likely because schools, when operating
in-person, are among the primary reporters of abuse to local government agencies (Mathematica,
2020). There are signs that the declining reports of abuse are masking a significant rise in the
underlying abuse frequency (Schmidt & Natanson, 2020), which might arise as children spend
more time at home with parents who themselves are more likely to be suffering social and
economic hardship. Therefore, as we try to grapple with the possible health costs of reopening
1 https://en.unesco.org/covid19/educationresponse 2 The Kuhfeld et al. (2020) study provides a seemingly more positive picture than the other two listed
above, but the Kuhfeld et al. study also reports a 25 percent drop in the share of students tested in participating schools and a 50 percent drop in the share of schools participating at all. The authors attempt to simulate the effects of the former, but do not address the latter form of selection bias, so their results likely under-state learning losses.

3
schools, it is also important to consider the health and other costs to keeping them closed. Having
children in school in-person has important benefits.
The extent of this trade-off between the costs and benefits of reopening schools depends
on how the virus spreads, the steps that schools take to reopen safely, and the counterfactual
social interactions that occur when schools are closed (e.g., parent “pods” and other non-school,
group-based interaction). Schools are supervised environments whose leaders are usually
actively engaged with public health officials. When students are at home, in contrast, there may
be less supervision, depending on home circumstances. So, while the number of social
interactions is higher in schools, the effect on COVID-19 spread may be offset, at least in part,
by higher safety of those interactions.
Partly for these reasons, some experts have suggested that reopening schools to in-person
instruction would create only limited increase in SARS-CoV2, the virus that leads to COVID-19
and its associated health ailments (e.g., American Association of Pediatrics, 2020; Oster, 2020).
School-age children seem less likely to transmit the virus (Viner et al., 2020) or to suffer
mortality (Laxminarayan et al., 2020). Unfortunately, the idea that it might be safe to reopen
schools is based on limited evidence. The problem is that the data likely miss the vast majority of
infections, especially among children, and even the infections we do observe are a function of
self-selection.3 Also, the rate of COVID-19 testing is likely to change when schools reopen in-
person. First, schools may be more likely open in-person where testing capacity is increasing or
expected to increase in the near future. Also, when schools reopen in-person, students, parents,
and school staff might be more likely to get tested when they first feel sick, in order to protect
the larger number of people with whom they are in contact, increasing the frequency of COVID-
19 testing. These factors make it difficult to determine whether any changes in the positivity rate
after school reopening reflect changes in actual virus transmission or changes in the testing
regimes, which may be unrelated to virus transmission.
Contact tracing is also based on virus testing and therefore suffers from similar
problems.4 A few studies in the U.S. have found limited spread from children (e.g., Hobbs et al.,
2020),5 but a virus “outbreak” is unlikely to be detected given the infrequency of testing. If an
outbreak did become apparent, rare and selective testing makes it difficult to attribute this to
schools as opposed to other places where social interaction occurs. In short, contact tracing might
3 It is unclear how many people have been tested. The CDC has reported 84 million tests (https://www.cdc.gov/coronavirus/2019-ncov/covid-data/covidview/index.html), but an unknown share of these come from the same people receiving multiple tests (e.g., some college students and workers are being tested on a monthly or even weekly basis). Even if each test were from a different person, this would mean only one-quarter of the population has ever been tested. 4 An exception is Sweden where researchers were able to link individual students and teachers to one another, students to their parents, and teachers to their partners/spouses, an elaborate form of contact tracing that is without precedent in the U.S. (Vlachos et al., 2020). These authors also rely on the fact that upper secondary schools remained under remote instruction and lower secondary went back to in-person, creating exogenous variation in social distancing and potential virus exposure. This research suggests that school reopenings did increase SARS-CoV2 spread from students to their parents (odds ratio: 1.15) and from teachers to their partners (odds ratio: 2.01). 5 There are also two additional studies from the UK (Forbes et al., 2020; Ismail et al., 2020).

4
not show when schools are actually spreading the virus; and contact tracing might suggest an
outbreak from schools even when the outbreak sources lay elsewhere.6 In any event, the most
rigorous contact tracing studies fall almost entirely outside the United States.7
A final limitation of analyses based on COVID-19 testing is that they cannot provide
evidence on what ultimately matters: health outcomes. We are left to assume that the effect on
transmission, as reflected in the (imperfect) positivity rates, translates directly into negative
symptoms, but there are good reasons to expect this not to be the case. For example, families
may have more lax social distancing rules for their children if they are unlikely to come in
contact with their grandparents or other older adults, reducing the extent to which the positivity
rate translates into negative health outcomes.
In this study, we provide the first evidence of the effects of school reopenings on health
outcomes, i.e., without relying on the positivity rate. Specifically, we focus on the effects of
school reopenings on rates of hospitalizations for COVID-19-related diagnoses that include
almost all counties in the nation. Our focus on hospitalizations is important because it gets us
much closer to the outcomes of greatest importance--actual sickness. In addition, the validity and
reliability of this measure is not likely to be affected by whether schools reopen. Unlike the
positivity rate, which is likely to change after schools reopen regardless of school spread effects,
hospitals are not likely to change their rate of illness reporting because schools reopen.8
Our specific health outcome measure is the number of hospitalizations that involve a
COVID-19 diagnosis, using two data sources: health insurance claims data provided by the
organization Change Healthcare and recently released data from the U.S. Department of Health
and Human Services (HHS) data from essentially all U.S. hospitals. The former include
diagnosis codes for each individual patient, along with the admission date and other information
that allow us to identify the county of residence of the patient (3-digit zip code of the patient’s
home residence), from January through the end of October, providing ample time for effects to
emerge after school reopenings, even if, as we expect, the hospitalizations are delayed by
transmission time and virus incubation. The new HHS data do not begin until the end of July but
they include more fine-grained 5-digit zip code location data (using the location of the hospital
rather than the patient).
The other key type of data involves the date and form of school reopening. We use data
from three sources—the trade publication Education Week and two private companies, Burbio
6 To be clear, contact tracing can still be a useful tool for schools trying to contain the virus. As we show later, reopening schools is likely to spread the virus when there is more of the virus in the community, regardless of the source. 7 The Viner et al. (2020) meta-analysis included 16 studies, including six from China, three from the U.S., and single studies from various other countries. The study focused on contact tracing studies addressed these concerns by focusing just on those contact tracing studies that involved fairly universal testing and tracing. The results of these more credible studies suggest that the “attack rate” (i.e., the probability of infection when being in contact with an infected person) was consistently lower in children compared with both adolescents, who in turn had lower attack rates than adults (Viner et al., 2020). However, this does not tell us whether schools are spreading the virus. 8 As discussed later, we only study in-patient cases and hospitals might not admit patients when hospitals are already near capacity, but the share of hospitals reaching that capacity has been very low.

5
and MCH Strategic Data—regarding the date and mode of school reopening (fully in-person,
fully remote, and hybrid). Each of these data sources has advantages and disadvantages;
however, they generally yield similar conclusions when we apply the analysis with each one
separately.
We analyze these county-by-week panel data in a generalized difference-in-differences
framework that incorporates both propensity score matching and instrumental variables
estimation. Specifically, we regress the number of COVID-19 hospitalizations on measures of
the instructional mode of school reopening, variables capturing state social distancing guidelines,
college reopening dates and modes, and county-level fixed effects. Both the school reopening
and hospitalizations are at the county-by-week level, allowing us to observe changes in
hospitalizations each week after schools reopened (up to 6 weeks post-treatment).
Even with the above rich set of controls, it is possible that school reopening decisions are
related to unobserved factors that also affect hospitalizations in other ways; therefore, we also
use teacher bargaining power as an instrumental variable (IV) in the fixed effect analyses. School
districts with more bargaining power are less likely to open in person (Hartney & Finger, 2020).
Our results from the first stage IV estimation confirm this. Also, there are few reasons to expect
that teacher unions affect hospitalizations through any other channel, especially not in a way that
coincides with the timing of school reopening.
Using these methods, we see no indication that in-person school reopenings have
increased COVID-19 hospitalizations in the counties below 36-44 new COVID-19
hospitalizations per 100,000 population per week (this is roughly 75 percent of U.S. counties as
of October). Neither the levels nor the trends change in any direction when schools open in this
group, even as far as 6 weeks after schools reopened. In fact, we often see precise estimates
suggesting declines in hospitalizations in these low-baseline COVID-19 counties; and we pass
parallel trends tests from roughly 6 weeks prior to school reopening up to the reopening dates
(with some non-parallel trends in the early summer weeks). The results are also robust to the
inclusion of time-varying state social distancing policies, college reopening timing and mode, the
use of alternative school reopening data sets (Burbio versus MCH), and different estimation
strategies (DD, PSM-DD, FE, FE-IV). Our main results focus on the Change Healthcare data
because of the larger number of periods, but the results are also robust to the use of the new HHS
data.
In the counties with higher pre-opening COVID-19-hospitalization rates, however, the
results are inconclusive. While we still sometimes see evidence of reduced hospitalizations, the
estimates also sometimes suggest the opposite. This possibility of increased hospitalizations is
consistent with the idea that social interaction creates more negative health outcomes when there
is more of the virus to be spread, perhaps despite careful school safety measures. In these cases,
it could still be appropriate to reopen schools, because of the negative effects on students and
parents from keeping schools closed (see above), but there may be more of a trade-off. Opening
schools in these high-COVID-19 locations might spread the virus, but improve other health
outcomes for students and their families in other ways (e.g., reduced abuse and mental illness).

6
Our method is similar to one in Germany (Isphording, Lipfert, & Pestel, 2020), which
found that school reopening reduced SARS-CoV2 transmission. The authors explain that the
drop is possible because schools instituted strict protocols that quarantine students who tested
positive. This threat, combined with strong messages sent by educators to encourage safe
behaviors, may have led students to be more careful in social distancing outside of school,
leading to the net drop in transmissions.9 Also, we have to consider the counterfactual of what
students would have been doing in the absence of going to school in-person. Our study is also
similar to a study using data from Michigan and Washington (Goldhaber et al., 2020). However,
these studies both rely on the positivity rate.
The inadequacies with the positivity rate suggest that additional research is necessary to
provide a complete picture of the effects of school reopening on SARS-CoV2 transmission and
COVID-19 health outcomes. In Section II, we summarize more of what is known about the
factors affecting school reopenings and SARS-CoV2 transmission. Section III describes our data
in more detail. We discuss our identification strategy in section IV and finally, in section V,
present our results. Important considerations for interpreting these findings can be found at the
end of section V and in section VI.
II. Prior Research on School Reopenings and COVID-19
At least two strands of research inform the interpretation of results regarding the effects
of school reopening on COVID-19 transmission. First, we discuss what is known about the
extent and type of school reopenings and the factors affecting these decisions. We also include
information on college reopenings, as these are potential confounders in our analyses. This
discussion also helps us understand the data generating process and identify appropriate
identification strategies.
Second, we consider what is known about how COVID-19 typically spreads in the
population. This is important particularly for determining how we set up and interpret our
econometric model, i.e., how the length of the virus incubation period and development of
symptoms affect the expected lag between school reopenings and hospitalizations.
II.A. School and College Reopening Rates, Modes, and Predictors
Several ongoing data collection efforts focus on analysis of the reopening of urban
schools. The Center for Reinventing Public Education (CRPE, 2020), tracking 106 mostly large
urban districts, shows a gradual decline in the percentage of districts operating with fully remote
instruction. CRPE projected that, by the end of October, 37 percent of schools would be fully
remote (down from 76 on September 7) while the number that are fully or mainly in-person has
9 The study in Germany only covered a three-week post-opening time period (less than half as our study); however, virus transmission and incubation do normally occur within this time frame.

7
stayed relatively steady at 18-19 percent.10 That early-fall period is most relevant to the analysis
that follows, but the numbers have remained fairly stable. As of early January, the Burbio data
for large districts suggest that 42 percent are operating in person.11
Schools vary widely in their approach to reopening. Almost all reports, for example,
indicate that districts allowing students back in-person at all bring back elementary age students
first, and fewer high school students. Reopening decisions have also been driven by state
policies. The states of Arkansas, Florida, Iowa, and Texas have required public schools to give
parents the option for in-person instruction. Rhode Island and some other states have also placed
strong pressure on districts to offer in-person options.
Others have studied the factors affecting state policies as well as more localized school
reopening decisions. Perhaps surprisingly, the COVID-19 positivity rate has not been the
strongest predictor of reopenings; instead, the strongest predictor is the political persuasion of the
local population (Hartney & Finger, 2020; Valant, 2020). School reopening became a polarizing
issue as President Trump and Secretary DeVos pressured schools to reopen in-person. Prehaps as
a result, and even after controlling for other demographic differences, those areas with strong
Trump support were much more likely to offer in-person options (Hartney and Finger, 2020;
Valant, 2020).
Hartney and Finger (2020) also report a positive association between the number of
private schools located in the district and reopening in-person. Private schools were under much
more pressure to reopen because of their nearly complete dependence on tuition revenue; this
might also be why they reopened faster than public schools in the spring (Harris et al., 2020).
Traditional public schools may have worried that they would lose enrollments to private schools
if they opened too slowly.
Teacher union power is another factor and one that figures prominently in the analysis
that follows. The Hartney and Finger (2020) study also concluded there was a role for teacher
unions, but had to base this conclusion on district size as a proxy for union power. This is
problematic given the other ways in which district size might affect school reopening that the
study did not account for. Nevertheless, as we show later, actual data on unionization intensity
reinforces that this was a strong predictor of school reopening mode.
Understanding the factors determining school reopening decisions is important to
estimating their effects on hospitalizations. In particular, we can expect teacher unionization to
have minimal impact on the rate of COVID-19 hospitalization aside from its effects on school
reopening mode. This creates a natural instrumental variable. Political persuasion and the
number of private schools, in contrast, are likely to directly affect hospitalizations, e.g., political
persuasion likely affected mask-wearing and social distancing and private schools, especially
those that reopened in-person, could spread the virus on their own, independent of the opening
10 Similarly, in another survey of the 50 largest districts, the Washington Post reported that 24 districts
reported “in-person classes for large groups of students” and another 11 planned to do so in the forthcoming weeks. https://www.washingtonpost.com/education/school-districts-reopening-coronavirus/2020/10/19/3791c952-0ffb-11eb-8074-0e943a91bf08_story.html 11 Source: Author’s analysis. See more on Burbio data below.
8
decisions of traditional public schools. We discuss our use of teacher unionization as an
instrumental variable later, in section III.
Another factor that could affect SARS-CoV2 transmission and hospitalization is college
reopening. Like private K-12 schools, most colleges (even ostensibly public ones) are heavily
dependent on tuition, fees, and room and board for their financial survival. However, colleges are
apt to spread viruses, especially in residential colleges where students come from a distance and
live in dormitories or other group housing. Students are likely to bring the virus to campus with
them, to spread the virus in dorms and social settings, and then to bring the virus back home
during breaks and vacations. Multiple studies have shown increased COVID-19 positivity of
college-age adults and in the general population living near colleges (Anderson et al., 2020;
Salvatore et al., 2020).
For this reason, it is important to account for the potential effects of in-person opening of
colleges as we consider how school reopenings affect health outcomes. The instrumental
variables method largely addresses this possibility (see below). However, we also test the
validity of our IV estimates by: (a) including time-varying college reopening mode as a covariate
in some of our models; and (b) estimating the first stage of the IV model regression where we
attempt to predict the county’s college reopening mode (hybrid/in-person) using the county’s K-
12 teacher union power.
II.B. SARS-CoV2 Infection and Relation to COVID-19 Hospitalizations
One challenge of the pandemic has been tracking its expansion. We have a number of
tools in use to meet this challenge, but each has distinct shortcomings. To understand this, we
need to start with how SARS-CoV2 progresses in human hosts and the opportunities provided
for detection or diagnosis of the infection.
We all share a vulnerability for infection upon exposure to the virus. When a human is
exposed to any viral pathogen, the immune system reacts by a number of pathways, including
one which produces potential markers of infection, i.e., antibodies. These antibodies have not
been a reliable tool for the identification of persons actively infected with SARS-CoV2.
While the virus is replicating in the human host, it may be unrecognized, and an infected
person can transmit the infection to others. This infectious phase is when viral detection
diagnostic methods become useful and tracking of active human infections is possible. In the
case of SARS-CoV2, the time needed to reach a detectable level of virus in a human host can
range from 1-14 days, with most individuals reaching a detectable viral load around 4-7 days
after an infection event. Recent research indicates that 97 percent of infected persons will have a
detectable viral load by day 11 post-infection (Wiersinga, et al. 2020). While the virus is
replicating, the body’s immune system is mounting its response which will, within roughly 2
weeks, contain the infection, and disrupt further replication as well as the potential for
transmission to others. Given these constraints, timing of viral detection tests is critical to the

9
detection of the active infections which drive expansion of the pandemic, and significantly limits
the accuracy of virus tests in delineating viral expansion in populations (CDC, 2020).
Given the issues with antibody and virus tests, our ability to accurately assess current
levels of actively infected persons is not robust. Implementation of testing efforts is not
consistent across communities, nor even over time within communities. There are many reasons
for this heterogeneity, ranging from availability of test kits and personnel to administer them,
willingness of persons to participate in voluntary testing programs, and support for large-scale
testing efforts by some local and state governments. The selection processes inherent in this
heterogeneity complicates interpretation of test results, expressed as case counts, cases per
population, and/or test positivity (the number of positive tests/tests performed). At any point in
time, we must assume that the cases detected are an underestimate (of unknown magnitude) of
the actual number of persons infected, which provides an incomplete picture of the expansion of
the pandemic.
Another approach is to track clinical, symptomatic disease as a key health outcome. The
SARS-CoV2 virus appears to cause some form of clinical illness (COVID-19) in 60-70 percent
of infected persons, with a substantial percentage of those ill persons experiencing very mild, and
potentially unrecognized or discounted disease, which may not be captured in any medical
interaction (Wiersinga et al., 2020). It is also a lagging indicator, as persons with SARS-CoV2
may develop serious disease requiring hospitalization anywhere from 1-4 weeks post infection
(Wiersinga et al, 2020). Given that symptoms of infection generally occur 4-7 days after exposure,
if school reopening increased infections leading to hospitalizations, we would expect to see a rise
in COVID-19 hospitalizations 2-5 weeks after schools reopened, if schools are spreading the
virus.
Accessing medical care for symptomatic disease, and especially hospitalization for serious
illness, which constitutes an estimated 5-10 percent of SARS-CoV2 infections, appears to be one
of the most stable and reliable measures we have available to track the clinical impact of SARS-
CoV2 (Wiersinga et al., 2020). Persons experiencing shortness of breath, and other debilitating
symptoms will seek care out of necessity, even if they might normally have a variety of barriers
limiting their interaction with healthcare. Since there appears to be less selection bias in
hospitalizations compared with positivity rates and related measures, we focus our analysis on
COVID-19 hospitalizations, allowing for a 2-5 week, or longer, lag to capture the effects of not
only initial infection and disease associated with school opening, but also the effects of
subsequent generations of infection which may be produced.
III. Data
We study the effects of school reopening on hospitalizations for COVID-related
diagnoses at the county level. Three key variables drive the analysis: the timing and mode of
school reopening, teacher unionization (the instrumental variable), and hospitalizations. We
discuss these below in turn.

10
III.A. School Reopening Data
There are three data sets on school reopenings that are at least partially publicly available
that include large national samples of school districts: Education Week, Burbio, and MCH
Strategic Data. All three collected data on the date of reopening and the instructional mode: fully
in-person, fully remote, and hybrid. These data sources have not provided clear definitions about
the precise distinctions between these categories or how they were operationalized.
The trade publication, Education Week, began collecting data on school reopenings from
school websites in the summer for 907 of the nation’s largest districts. This constitutes roughly
seven percent of districts but a much larger share of the nation’s public school students. While
not a random sample, Education Week also sought at least five districts per state, since many
states do not have large districts by national standards. Nevertheless, the relatively small, non-
representative sample is problematic. For this reason, we include Education Week data for some
descriptive analysis, but do not include it in our main analyses.
The private company, Burbio, also collected data from school websites, but from a larger
sample of 1,200 districts, again mostly larger districts. Burbio aggregated these data up to the
county level. The least populous counties, which account for 25 of the student population, are
imputed from other nearby counties. Finally, MCH collected data primarily by calling essentially
all school districts in the United States by phone.12
Table 1 shows the percentage of schools opened in instructional mode, according to each
data source. The figures vary across sources. For example, the percent in-person ranges from 19
percent in MCH to 43 percent in Burbio and the percent remote varies from 24 percent in MCH
to 49 percent in Education Week. This is no doubt partly a function of the differences in samples,
e.g., Education Week’s sample is more heavily urban, which likely explains why more districts
are labeled remote.
The differences in school reopening modes across data sources are also likely partly due
to the ambiguous (and generally undefined) nature of the “hybrid” mode. This category may
include districts where elementary schools reopened partially in-person, but where other schools
remained fully remote; or it might include districts where elementary schools were fully in-
person but secondary schools were fully-remote; and districts where all schools opened to
partially-in-person instruction. Those creating the data could have used different definitions and
coding procedures, which, in any event, are not available. As a further check, note that Burbio
reports 35 percent of districts being fully remote as compared with 42 by the Center for
Reinventing Publication (2020) as of early October.
The three data sources have greater overlap in the opening dates, however. For example,
95 percent of the 907 Education Week districts are listed as having opened in the same week as
the same set in MCH. (The overlap is somewhat lower in the Burbio data.). Nevertheless, given
the differences in definitions and/or coding of instructional mode, we use both Burbio and MCH
12 MCH also did some web scraping (later verified by phone calling) and sent surveys to some districts.

11
in most of the main analyses. (The Education Week data provide too few observations and are
used for diagnostic purposes.)
One challenge in understanding the extent of in-person instruction is that many schools
are allowing students to continue learning remotely even when the schools are officially “fully
in-person.” One of the few studies to differentiate the two is from Michigan where a detailed
analysis of district plans found that 16 percent of districts gave a hybrid option, while only 14
percent were remote only (Education Policy Innovation Collaborative, 2020). Also, 53 percent of
students had an in-person option, but, again, a much smaller share was likely actually attending
in person, especially on a full-time basis. This highlights an important distinction between school
reopening policies regarding instructional modes and actual student experiences.13
None of the three data sources explicitly include charter or private schools. However,
note that nearly half of charter schools are authorized by traditional public school districts and
likely followed the districts reopening plans. Private schools are not obligated to follow district
reopening policies, but these constitute fewer than 10 percent of all elementary and secondary
schools and an even smaller percentage of the U.S. school-age population; therefore, this is
unlikely to affect our results.14
While the Burbio and MCH collected data on a continuous basis and therefore have
information about changes in reopening status, we focus our analysis only on the initial fall
reopening and do not attempt to account for changes in instructional mode over time. This is for
two main reasons. First, the data on the timing of those changes is likely less accurate than the
initial reopening; Burbio and MCH began collecting data before schools reopened and had many
weeks to reach schools and collect data before any changes occurred. However, the situation
became more fluid after the first month or so of the semester and the rate of data collection may
not have kept up with the changes. Second, even if we had more recent data, any subsequent
changes likely involve endogeneity in the dynamics of school reopening that would be difficult
to account for in any empirical analysis.
To test whether the focus on just initial reopening is likely to affect our results, we
created a transition matrix, which shows the percent of districts that initially opened in which
mode in the fall (time t) and the mode shown in the data as of October 10 using MCH data (see
Appendix Table 1). The results suggest that two-thirds of districts were still in the same mode as
13 Given that many schools are offering the option of reopening, surveys of parents might seem to be a better source of the extent of in-person instruction. However, we are not aware of good estimates. Since early August, the U.S. Census has been collecting biweekly survey data on the percentage of students attending school to varying extents. Nationally, as of October 14-26, 82 percent of families report remote instruction. Unfortunately, the Census survey items do not distinguish fully remote learning and hybrid (i.e., the combination of in-person and remote), which is problematic since other evidence suggests that these are the two most common categories. 14 Even aside from the small number of charter and private schools, their omission does not affect the
results if they opened either: (a) in the same fashion as nearby traditional public schools we observe; or (b) they opened differently than traditional public schools but in a way that is similar across counties within states (more on this later). Other data suggest that these schools did open faster in the spring (Harris et al., 2020) and anecdotal evidence suggests they opened in-person more commonly this fall as well
12
of October 10. This reinforces the usefulness of focusing identification just on the initial
reopening period. This is the time period where the data are most accurate and stable and where
we can cleanly identify effects.
The Burbio and MCH data are at the county and district level, respectively. As discussed
below, we can also convert the hospitalization data to the county level (weighting by district
enrollment) therefore the county is the main unit of analysis in the study.15
III.B. Teacher Bargaining Power
For the instrumental variables analyses, we use data on teacher unionization from the
1999-2000 public use Schools and Staffing Survey (SASS) form the National Center for
Education Statistics of the U.S. Department of Education. The SASS is collected on a nationally
representative sample of teachers and administrators periodically. The data include information
for 4,690 school districts, or a bit more than one-third of the total. Like the other education data
in this study, the unionization data are aggregated to the county level; we use the (weighted)
average of the available districts to represent the county as a whole. This yields data for 1,854
counties of the roughly 3,000 counties in the U.S.
There are newer waves of the SASS, but the use of these older data is necessary to allow
the linkage to hospitalization data.16 Some changes in teacher unionization have occurred since
2000 as some states reduced the power of teacher unions; however, there is little reason to expect
that this would affect our results. The 2000-public-use and 2011-restricted-use SASS data sets
are correlated at +0.80 on the teacher bargaining power variables. Later, we discuss robustness
checks that involve dropping states that have had significant statewide changes in collective
bargaining, which has minimal effect on the results.
The SASS reports two types of teacher unionization: collective bargaining and meet and
confer. The former means that the district administration is obligated to bargain with the union,
while the latter means that district administration has volunteered to confer with teachers over
issues similar to those that are the subject of collective bargaining, even though such agreements
are not legally binding as contracts. These two teacher bargaining variables are therefore ordinal,
with collective bargaining at one end, no teacher agreements at the other end, and meet and
confer providing a middle ground of teacher bargaining power.
Some of the variation in teacher bargaining power is at the state level as some states bar
collective bargaining for public employees. However, all but nine states have some meet and
confer districts and, in states where collective bargaining is allowed, the teachers in some
districts have not voted for collective bargaining. This creates variation within states that allows
15 School districts almost always fall within a single county. In some cases, especially in the South, the county and district are coterminous. 16 The restricted use SASS data cannot be moved from the secure computers; the same was true of the hospitalization data. Using the public use SASS allowed us to move the data into the hospitalization files.

13
us to keep all states in the analysis and still use fixed effects, which are helpful for absorbing the
influence of time-invariant factors such as unobserved state policies and political orientation.
Table 2 reports each state’s legal status of unions, the number of total school districts in
the state, the number of districts for which we have SASS bargaining power data, and the shares
of those districts that are labeled as collective bargaining and meet and confer. As expected, we
see zero or near-zero numbers of districts reporting collective bargaining in the states where it is
barred. This reinforces the validity of the data.
One limitation, however, is that only roughly half the states have much variation in
teacher bargaining power, which is necessary to use these variables as instruments where the first
stage includes state fixed effects. Also, the states with the most variation in bargaining power
tend to have small populations and be located in the South and Plains states.17 Since COVID-19
spread is thought to be biologically universal, we do not expect this to influence the general
findings, but the differences in results could reflect effect heterogeneity, which we test for.
III.C. Hospitalization Data
We use two sources of hospitalization data. First, we use medical claims data from
Change Healthcare with approval from the COVID-19 Research Database.18 We also use
nationwide facility-level data from the U.S. Department of Health and Human services (HHS).
Change Healthcare is the nation’s largest claims clearinghouse with a network of 900,000
providers and 5,500 hospitals across the country, processing nearly 55 percent of all commercial
claims (including Medicaid Managed Care and Medicare Advantage, but not Medicare FFS) in
the U.S for nearly 170,000,000 unique individuals. Change Healthcare provided us with de-
identified claims within days after claim processing. We were not provided with all claims in
Change Healthcare’s database. Instead, we received a longitudinal dataset of claims for
individuals ever diagnosed with COVID-19. Specifically, we received all in-patient claims for
any patient ever observed with a COVID-19 diagnosis using the International Classification of
Diseases (ICD) codes: U07.1 and U07.2.19 We observe the entire record for those patients pre-
and post-the COVID-19 diagnosis.
From this subsample, we count only inpatient hospitalizations (including through
emergency rooms) with diagnoses of COVID-19 or COVID-19 related symptoms.20 The
resulting sample is 660,000 COVID-19 hospital admissions to the inpatient setting or the
17 There are 19 states that have between 10 and 90 percent in either the collective bargaining and meet and confer categories. These are (alphabetically): Alabama, Alaska, Arizona, Colorado, Idaho, Kansas, Kentucky, Louisiana, Missouri, Montana, New Mexico, North Dakota, Oklahoma, South Dakota, Tennessee, Utah, Virginia, West Virginia, and Wyoming. 18 https://covid19researchdatabase.org/ 19 We also received outpatient and prescription drugs information, but we do not utilize these data in the current analyses. 20 Specifically, we use codes: using 10 ICD codes (U07xx, R50xx, R05xx, R06xx, J18xx, J17XX, J96XX, J80XX,
J12XX, J20XX, J40XX, J22XX, J98XX, Z03.818, Z20XX, Z11XX. These codes were obtained following CDC covid19 coding guidelines https://www.cdc.gov/nchs/data/icd/COVID-19-guidelines-final.pdf

14
emergency room between January 2020 and October 2020.21 For this group, we observe the
patient’s admission date, discharge date, diagnosis, facility type of admission (inpatient,
outpatient, ER), gender, 3-digit zip code of patient’s residence, year of birth and a de-identified
token that allows us to link the patient’s records over time. (We do not observe information on
race/ethnicity.)
To give an example, consider a patient who tests positive for COVID-19 in March 2020
(ICD -U07xx) and is therefore observed in our subsample. Subsequently, in September 2020, she
was hospitalized for a bladder infection. We do not count this encounter as a COVID-19
hospitalization because bladder infections are not COVID-19-related. Now, consider a patient
who is diagnosed with COVID-19 (ICD U07xx) and subsequently admitted for Acute
Respiratory Distress Syndrome (eg: ICD J80); we count this as a COVID-19 related admission
(even if the inpatient admission did not explicitly state a COVID-19 ICD-10 code).
Since we received data at the 3-digit zip code, we generate county-level data, by
reconfiguring the 3-digit zip code level data to the county level. Specifically, to convert to
counties, the 3-digit zip codes were first converted to five-digit zip codes by distributing the
share of hospitalizations across the appropriate zip codes based on population proportions. This
assumes that the distribution of hospitalizations follows the same distribution as the population.
Zip codes were then converted to counties using a zip code-county crosswalk provided by the
Department of Housing and Urban Development.22
We summarize the trend in COVID-19 hospitalizations in our data in Figure 1A. These
data highlight the steep changes in hospitalizations. The hospitalization rate peeks in week 42
(mid-October) at 15 hospitalizations per 100,000 in the population. While not shown, this trend
reflects a heavily skewed distribution, with most counties having zero hospitalizations and some
have more than a thousand. (As these are per 100,000 in the population, they account for wide
variation in county population size.)
In addition, on Dec 7th, 2020, HHS released nationwide hospitalization data that was
collected by Teletracking (a third-party contractor). This dataset includes capacity reporting from
almost all individual hospitals in 2,200 counties23. Specifically, the data report weekly counts of
confirmed and suspected COVID-19 admissions at the hospital level starting from the week of
July 31st 2020. The term “suspected” is defined as a person who is being managed as though
he/she has COVID-19 because of signs and symptoms suggestive of COVID-19 as described by
CDC’s guidance, but does not have a laboratory positive COVID-19 test result. This may include
patients who have not been tested or those with pending test results and patients with negative
test results.
21 The January 2020 data includes admissions for symptoms related to Covid-19 even if Covid-19 was not explicitly stated at time of admission. 22 This approach has been used before for example when studying the distribution of opioid prescriptions
across counties from 3-digit zip code data from the Drug Enforcement Agency (Kaestner and Ziedan 2020, among others). 23 The HHS data does not include hospitals associated with the Veterans Affairs system or rehabilitation facilities.

15
Figure 1B presents nationwide trends in suspected, confirmed, and total (suspected plus
confirmed) admissions over time from the HHS facility-level data. Until week 42, the number of
hospitalizations for COVID-19 suspected cases surpassed the number of hospitalizations for
COVID-19 confirmed cases. After week 42, the number of hospitalizations per 100k for
confirmed COVID-19 cases surpasses the suspected per 100k admissions. This pattern maybe
due to increases in testing availability and turnaround time. Since the Change Healthcare
COVID-19 admissions are for those with positive COVID-19 tests, the counts per 100k from
Change Healthcare (Figure 1A) are most comparable to the counts of confirmed cases in Figure
1B. Also, the number of hospitalizations (per 100k) at any given time may be higher in the HHS
data because our insured sample, which excludes Medicare Fee for Service patients, is younger
and likely less likely to become symptomatic than the overall population.
Both data sets are useful for purposes of this analysis as they both include large and
consistent samples of institutions (insurers and hospitals, respectively). However, the Change
Healthcare data come with three advantages that lead us to focus on these in our main results.
First, the Change Healthcare data start on January 1st 2020 and provide a longer time series with
which to test for parallel trends. In contrast, the HHS data start on August 1, within four weeks
of the start date of 57 percent of school districts.24
In addition, the Change Healthcare data provide much more detail regarding patient
diagnoses and allow us to define cases ourselves in a standardized way. In contrast, the HHS data
rely on the somewhat amorphous notion of “suspected” cases; more generally, the HHS data rely
more on the reporting discretion of hospitals than the Change Healthcare data.
Finally, the Change Healthcare data map COVID-19 hospitalizations to the residence of
the patient, which is likely closer to the point of virus transmission (from school reopenings or
otherwise). In contrast, the HHS data use the location of the hospital. This could be a particular
issue in rural areas where hospitals may not be located nearby. Also, patients may have to travel
to more distant hospitals when they get sick if nearby ones are already full, or if more distant
hospitals have better health care and public health services generally for COVID-19; this
capacity to deal with the virus could affect the virus’s spread, creating an endogeneity problem.
For these reasons, we rely on the Change Healthcare in most of our analyses.
Even with the richness of the individual-level claims from Change Healthcare, these data
also come with concerns about generalizability, changing samples, and measurement error. As
noted above, one potential problem is school reopenings might affect the insured differently from
the uninsured. Also, the percent of the population insured may have changed as insurance
coverage was dropped as a result of unemployment and the general economic slowdown, which
could occur differentially across counties in ways that are correlated with school reopenings.
That said, one recent report estimated that losses of employer-based coverage will be lower than
some expect across the last three quarters of 2020 because employment losses have been
24 We observed 2,400 counties with school reopening dates in Burbio. Of them, 1,372 (57%) had opened their school district(s) by August 30th 2020. Similarly, of 8,283 school districts in the MCH data 4,762 (57.4%) opened by August 30th, 2020.

16
disproportionately concentrated among workers who did not have access to employer-based
coverage before the pandemic (Karpman & Zuckerman, 2020).25 Also, those who did lose
employer-sponsored insurance are eligible for ACA assistance either through Medicaid or
subsidized marketplace coverage (Kaiser Family Foundation, 2020). Since our data include
Medicaid Managed Care claims cleared by Change Healthcare, we are less concerned with
changes in the proportion of individuals moving from employer-sponsored insurance to
Medicaid coverage. In addition, Medicaid Managed care is a much larger group than Medicaid
Fee for Service (approximately 69 percent of Medicaid insured individuals are in Medicaid
Managed Care26). Further, even unemployment, insurance loss, and the mode of school
reopening were all correlated, this is still unlikely to bias our results unless the decline in
insurance coverage happened to coincide with the precise timing of school reopenings.
A final limitation of the Change Healthcare data is that they have 3-digit zip code (of the
patient), which is less precise than the HHS’s 5-digit zip code (of the hospital). As described
above, some 3-digit zip codes are larger than counties, which required us to make assumptions
about how many occurred in each county, in order to link to the school reopening data.
Overall, we view the Change Healthcare data as valid and reliable for purposes of
understanding the effects of school reopenings. They provide a large and consistent sample
covering half the U.S. population and provide more detail about patient symptoms and
diagnoses, as well as patients’ home addresses. Also, the main limitations noted above seem
likely to introduce only measurement and not bias our results. Nevertheless, we estimate our
main results using both data sets.
III.D. Other Data
While the primary data sources pertain to school reopenings, teacher bargaining power,
and hospitalizations, several other data sources provide useful covariates and allow for additional
diagnostics of the main data sources.
We merged the school reopening data with school district information from the National
Longitudinal School Database (NLSD), which includes all available federal education data from
the Common Core of Data (CCD) and district-level Census data. Most importantly, the NLSD
includes the county in which the school district is located, allowing us to merge the school re-
opening data with the health data (more on this below). In addition, the Census data in the NLSD
allow us to create useful variables for effect heterogeneity analysis.
We use the Device Exposure Index (DEX) from PlaceIQ to measure social distancing.
The DEX index quantifies the exposure of devices to each other within venues. For a smartphone
whose “home” is in a given county, the DEX indicates how many distinct devices also visited in
25 Link here https://www.urban.org/sites/default/files/publication/102552/changes-in-health-insurance-coverage-due-to-the-covid-19-recession_4.pdf 26 https://www.kff.org/medicaid/issue-brief/10-things-to-know-about-medicaid-managed-care/#:~:text=Managed%20care%20plays%20a%20key,the%20fiscal%20implications%20for%20states.

17
any of the commercial venues that the device visited in a given day. Other studies have also used
the DEX to study social mobility and distancing (Couture et al. 2020; Gupta et al. 2020; Painter
and Qiu 2020; Nguyen et al. 2020). To be clear, we use the DEX only to gauge the relationship
between our instrument and social distancing, since school reopenings are not the only factor
affecting distancing and therefore hospitalizations. This variable is only for diagnostic purposes
to better understand the instrumental variable.
We also collected data on general state COVID-19 reopenings. Many states have
responded to the COVID-19 pandemic by enacting a variety of laws and policies related to
limiting the spread of the associated virus and ensuring that healthcare resources are freed to
absorb COVID-19 patients. To characterize state policies, we reviewed the range of policies and
dates of implementation used in prior studies (see Gupta et al. (2020a) and from institutions
tracking multiple sources for state policy dates such as the Urban institute27 and Boston
University.28 To accurately identify the implementation date of a policy and to classify in a
parsimonious way main elements of a state’s policy response, we focused on those that could
potentially affect COVID-19 hospitalizations through social interaction and mobility. Based on
our review, we chose the following policy measures: stay at home orders, non-essential business
closures, non-essential business reopening, restaurant closures, restaurant reopenings, mask
mandates and resumption of religious gatherings. Our list is not exhaustive of all state policies.
For example, we did not include in our models the date the states closed or reopened bars
explicitly, since most restaurants and bars resumed operations within the same week and if not
restaurants reopened first. Appendix Figure 7 summarizes the percent of states that had those
various general opening policies. These stabilized at the time that schools were reopened (see the
33rd week). So, while we control for these policies, there is little reason to think that changes in
state (or local policies) had an influence on the before-and-after periods of greatest relevance in
this analysis.
Finally, we analyzed data on the timing and mode of reopening of colleges from the
College Crisis Initiative (https://collegecrisis.org/). We received college instructional modes for
2,984 colleges. These data cover mostly large higher education institutions in the United States
and identify whether a college opened mostly in-person, hybrid or remotely. Of that sample we
received dates of reopening for 1,430 colleges. These data are similar to the school reopening
data, so we observe the date and mode of reopening. We aggregate this information to the county
level and create a time-varying indicator in our DD models for whether the county has a college
that opened in-person or in hybrid mode at week t. If a county does not have a college present,
and to avoid dropping counties without colleges, we assume that variable is constantly zero in
those cases. We incorporate these data into our models and test the robustness of our estimates
when including college reopening information. We also estimate a “placebo” first stage where
27 https://www.urban.org/policy-centers/health-policy-center/projects/covid-19-resource-tracker-guide-state-and-local-responses 28 https://www.bu.edu/sph/news/articles/2020/tracking-covid-19-policies/

18
we test whether teachers’ K-12 union power can predict college reopening mode (see additional
discussion below).
IV. Econometric Framework
IV.A. Generalized Difference-in-Differences
To estimate the total effect of school reopenings, we begin with a generalized difference-
in-differences event study model. This method is particularly useful in the present context given
the (likely) delay in effects on hospitalizations. Specifically, we estimate:
𝑌𝑐𝑡 = ∑ [𝛼𝑡 ∙ 𝟏(𝑟 = 𝑡) + 𝛽𝑡(𝐼𝑛𝑃𝑒𝑟𝑠𝑜𝑛𝑐𝑟 ∙ 𝟏(𝑟 = 𝑡))]6𝑟=−10 + 𝜃𝑋𝑠𝑡 + 𝜆𝑐 + 𝜏𝑡 + 𝜀𝑐𝑡 (1)
where 𝑌𝑐𝑡is the number of COVID-19 hospitalizations in county c at time/week t. 𝐼𝑛𝑃𝑒𝑟𝑠𝑜𝑛𝑐𝑟 is
the county’s share of students allowed to attend in-person at time t, which is zero prior to
reopening and 0 ≤ 𝐼𝑛𝑃𝑒𝑟𝑠𝑜𝑛𝑐𝑟 ≤ 1 afterwards. This variable combines fully in-person (with a
weight of 1) and hybrid instruction (with a weight of 0.5), under the assumption that hybrid
means that half of students are in the building on any given day (fully remote is coded as zero).
Since the data are initially at the district level, the county-level 𝐼𝑛𝑃𝑒𝑟𝑠𝑜𝑛𝑐𝑟 variable is the
enrollment-weighted average across districts.
The term 𝟏(𝑟 = 𝑡) is an indicator for each week. Equation (1) includes a vector of these
indicators as well as their interactions with 𝐼𝑛𝑃𝑒𝑟𝑠𝑜𝑛𝑐𝑟. The vector of coefficients 𝛽𝑡 are the
“effects” in each week. If there is little selection in instructional mode, then hospitalizations prior
to reopening should not vary systematically with 𝐼𝑛𝑃𝑒𝑟𝑠𝑜𝑛𝑐, and thus 𝛽𝑡 should be close to zero
for all t < 0. Equation (1) also includes county fixed effects 𝜆𝑐 and time fixed effects 𝜏𝑡. (We do
not include state fixed effects explicitly as time-constant state factors are absorbed in the county
fixed effects.) The term 𝜀𝑐𝑡 is a white noise error term.
Estimating the post school reopening 𝛽𝑡via OLS, however, would likely yield biased
estimates of the effects. School districts, as described in section II, decide to open schools in-
person for a variety of political, economic, health, social and other reasons, some of which are
likely unobservable. For example, a district might open because district officials are aware of
new communitywide policies being put in place to improve COVID-19 safety, which might be
implemented at the same time that schools open. In this example, if the additional safety
measures succeed in reducing COVID-19 spread, then the point estimates for 𝛽𝑡would be
downwardly biased because we would falsely attribute to school reopening any reduction in
hospitalizations due to the extra (unobserved) safety precautions. Alternatively, schools might
decide to open because their hospitalizations rates are idiosyncratically low, a form of regression
to the mean, that would upwardly bias the estimates.
The first step we take to address this endogeneity problem is to control for time-varying
factors that we expect to influence hospitalizations, reflected in 𝑋𝑠𝑡in equation (1). This vector

19
primarily includes state policies pertaining to COVID-19, such as the opening of bars and
restaurants, allowing religious gatherings, and mandating mask-wearing. Note, too, that the
county-level fixed effects account for all time-invariant county (and state) characteristics,
including political orientation. In some models, we also add time-varying county-level factors
especially college reopenings. (To address the possibility that factors like political orientation
might also affect the trend in hospitalizations, we also include robustness checks that include
control for week linear trends interacted with pre-opening state characteristics.)
We label equation (1) above as the fixed effects (FE) method because, as in a standard FE
model, the treatment variable 𝐼𝑛𝑃𝑒𝑟𝑠𝑜𝑛𝑐𝑟 is continuous. Another common method is to estimate
a more standard difference-in-differences (DD) event study model, comparing counties that have
any positive share of in-person instruction according to the index where 𝑆𝑜𝑚𝑒𝐼𝑛𝑃𝑒𝑟𝑠𝑜𝑛𝑐𝑟 = 1
when 𝐼𝑛𝑃𝑒𝑟𝑠𝑜𝑛𝑐𝑟 > 0 and zero otherwise. Specifically, we estimate:
𝑌𝑐𝑡 = ∑ [𝛼𝑡 ∙ 𝟏(𝑟 = 𝑡) + 𝛽𝑡(𝑆𝑜𝑚𝑒𝐼𝑛𝑃𝑒𝑟𝑠𝑜𝑛𝑐𝑟 ∙ 𝟏(𝑟 = 𝑡))]6𝑟=−10 + 𝜃𝑋𝑠𝑡 + 𝜆𝑐 + 𝜏𝑡 + 𝜀𝑐𝑡 (2)
Similar to equation (1), 𝑆𝑜𝑚𝑒𝐼𝑛𝑃𝑒𝑟𝑠𝑜𝑛𝑐𝑟 is zero for both control and treatment in the pre-
treatment weeks, so that the 𝛽𝑡 in those weeks reflect the differences between those counties that
eventually have some in person and those that do not. The effect estimates in (1) and (2) have slightly different interpretations. In the FE
equation (1), the post-treatment 𝛽𝑡 is the effect of going from no in-person instruction to
completely in-person instruction, while in the DD equation (2), it is the effect of being in the
treatment group relative to the control group. We therefore expect the latter coefficients to be
smaller in magnitude, though they can be scaled up, multiplying by the inverted treatment group
mean to obtain a similar interpretation. An advantage of the DD analysis over the FE is that it can be readily with propensity
score matching (PSM). It is helpful to couple DD and PSM when the DD by itself does not yield
a parallel trend before schools open. The PSM-DD makes it more plausible that the comparison
and treatment groups would have followed the same pattern in the absence of treatment. This
type of model has been analyzed before in Smith and Todd (2005), Stuart et al. (2014), Bell et al.
(2020), and Friedson et al. (2020).
IV. B. Instrumental Variables
The longitudinal nature of the data allows us to account for time-invariant factors
affecting hospitalizations and the control variables allow us to account for some time-varying
factors, such as state policies and college reopenings. However, they may still be insufficient if
school reopening policy adoption is endogenous with respect to unobserved, time-varying
factors. We therefore also estimate IV versions of the above models that use teacher bargaining
power as the instrument (see section II.C.). We begin with a first stage equation:
20
𝐼𝑛𝑃𝑒𝑟𝑠𝑜𝑛𝑐 = 𝛼 + 𝜙1𝐶𝑜𝑙𝑙𝑒𝑐𝑡𝑖𝑣𝑒𝐵𝑎𝑟𝑔𝑐 + 𝜙2𝑀𝑒𝑒𝑡𝐶𝑜𝑛𝑓𝑒𝑟𝑐 + 𝛾𝑠 + 𝜀𝑐𝑠 (3)
where 𝐼𝑛𝑃𝑒𝑟𝑠𝑜𝑛𝑐 is the share of schools in county c that initially opened in a given instructional
mode, 𝐶𝑜𝑙𝑙𝑒𝑐𝑡𝑖𝑣𝑒𝐵𝑎𝑟𝑔𝑐 is the county’s share of districts with collective bargaining contracts
and 𝑀𝑒𝑒𝑡𝐶𝑜𝑛𝑓𝑒𝑟𝑐 is the county’s share of districts with meet and confer agreements (all three
are enrollment-weighted). The term 𝛾𝑠 is a state fixed effect.
Using a two-stage least squares (2SLS) framework, we predict the teaching mode from
(3) and test that teacher bargaining power really does predict instructional mode. These results
are shown in Table 3. Both teacher bargaining variables clearly predict opening mode, in the
expected way, especially with our index that combines fully in-person and hybrid into a single
index (see the far-right column). We report the F-statistic from a test of joint significance of both
instruments (excluding the state fixed effects). The results are stronger, but still weak, in the
MCH data (F-statistic of 6.38). The instrument is very weak with the Burbio data (F-statistic of
2.14). These results reinforce the prior findings of Hartney and Finger (2020), though we have a
more direct measure of teacher unionization than their study. Given the possible weak
instruments problem (Sawa, 1969; Angrist and Kruger 2001; Chernozhukov and Hansen 2004),
we also report results later for the reduced form equation.
Finally, we use (3) to predict school reopening, yielding the variable 𝐼𝑛𝑃𝑒𝑟𝑠𝑜𝑛̂𝑐𝑟 , and
obtain the IV estimates for the FE model as follows:
𝑌𝑐𝑡 = 𝛼 + ∑ [𝛼𝑡 ∙ 𝟏(𝑟 = 𝑡) + 𝛽𝑡(𝐼𝑛𝑃𝑒𝑟𝑠𝑜𝑛̂𝑐𝑟 ∙ 𝟏(𝑟 = 𝑡))]6
𝑡=−10 ) + 𝜃𝑋𝑠𝑡 + 𝜆𝑐 + 𝜏𝑡 + 𝜀𝑐𝑡 (4)
Note that 𝐼𝑛𝑃𝑒𝑟𝑠𝑜𝑛̂𝑐𝑟 is time-varying in the sense that it is fixed at zero until the time that
schools reopen. This implies further that we are taking the mode of opening as endogenous, but
still assuming the timing of reopening is exogenous. Other data seem to reinforce this
assumption. Prior to the pandemic, almost all schools in the U.S. opened between August 1st and
the days immediately following Labor Day (Desilver, 2019). In Appendix Figure 1, we show that
this was also true in the fall of 2020 during the COVID-19 crisis. In short, the empirical hurdle is
not the endogeneity of when schools opened but how schools opened.
The FE-IV meets the exclusion restriction so long as teacher unionization does not
influence the form of school reopening in ways that coincide with the timing of school reopening.
This last highlighted phrase is important because it shows the benefit of combining IV with panel
analysis. Suppose, for example, that teacher unionization is correlated with county-level non-
education unionization, which, in turn, could affect the reopening and distancing in other kinds
of businesses and organizations.29 For this to bias our estimates the effect of non-schooling
unions would also have to coincide with school reopenings. This seems unlikely given that non-
schooling organizations (private businesses, government agencies, etc.) generally operate
continuously, year-round. Such an effect is not likely to coincide with school reopening, so the
29 This is plausible because, for example, the American Federation of Teachers also represents nurses and other kinds of workers outside the school sector.

21
longitudinal nature of the analysis (specifically controlling for the summer hospitalization rates)
addresses the potential bias.
A greater threat to identification comes from anecdotal evidence that, among those
unionized districts that do open at least partially in-person, unions bargain for stricter social
distancing rules, which could affect the (unobserved) implementation of school reopening. In this
respect, we can think of the mode of reopening as two-dimensional, reflecting both the number
of students (and school staff) in person and the rules associated with within-school interactions.
The instrument might be valid on the first dimension but not the second, which is largely
unobserved. Despite this potential issue, and the possible weak instrument problem, the IV
provides a useful additional check on our results.
Another potential concern is college reopenings, which have received considerable press
attention. This might violate the exclusion restriction assumption in the sense that colleges do
tend to open at roughly the same time as schools. However, this is unlikely to bias our estimates
since it is not obvious that teacher unionization should influence college reopenings. We test
whether teacher union power can predict college opening mode by reestimating the first-stage
equation with college reopening as the dependent variable. Appendix Table 5 presents these
estimates. We find no evidence that teacher union power predicts college opening mode; the F-
statistic is 0.8 and all estimates are insignificant.
We provide further visual evidence for the IV in the appendix. Appendix Figure 2 shows
that teacher bargaining power is largely uncorrelated with baseline (January 2020 to July 2020)
hospitalizations. Also, Appendix Figure 3 shows that the trends in DEX social mobility (see
section III.D.) are parallel in the low- and high-teacher bargaining power counties,30 providing
visual evidence that the exclusion restriction is likely met, i.e., teacher unionization is not
correlated with trends in mobility over time.
30 This is based on the DEX index, which measures the number of cell phones that are near each phone when the phone is away from its “home base.”. The vertical grey bar in the graph indicates the start of COVID-19 precautions and the general economic shutdown. One trend line is for counties with 50 percent or more collective bargaining and the other is for those with less than 50 percent collective bargaining.

22
V. Results
We begin by reporting the FE model from equation (1) using only the Change Healthcare
data and then proceed to the difference-in-differences (DD) and the preferred models: PSM-DD
and the FE- IV model. Note that across all the models, the point estimates are generally
imprecise when we estimate at the week level.31 For this reason, we also estimate models that bin
weeks to increase statistical power while maintaining some flexibility in the functional form.
Specifically, we combine weeks into three periods: far before reopening/early summer (t-10 to t-
5), near reopening/late summer (t-4 to t+1), and the post-reopening period (t+2 to t+6). Our
conclusions are based mainly on these three-period estimates. We report each of these various
specifications first for MCH and then Burbio school reopening data.
For all the models, we also report two functional forms where the dependent variable is
either new hospitalizations per 100,000 county residents or the natural log of total
hospitalizations (log(Y+1) to address zeros). The appropriate model depends on the underlying
structural relationship between school reopenings and hospitalizations, which is not known. As
robustness checks, we also estimate inverse hyperbolic sign (IHS) instead of log(Y+1) and
estimate Poisson regression to address the statistical issues with count data. The results using the
HHS data are reported toward the end.
Before discussing the estimates, we briefly consider whether we have sufficient statistical
power to detect a population level effect. There are roughly 53 million K-12 students and 5
million school staff in the United States. If we add in their immediate family members, then there
are roughly 157 million people directly connected to schools (almost half the U.S. population).32
While it is difficult to identify a specific plausible effect from these numbers, the fact that such a
large share of the population comes in regular contact with schools, students, and school staff
suggests that reopening schools could increase COVID-19 hospitalizations by 50 percent or
more, if schools were active virus spreaders. Below, we compare this with the minimum
detectable effects of the analysis.
31 The imprecision is for several reasons: (a) the dependent variable frequently 0 especially when analyzing the data at the week level; (b) likely measurement error in the treatment variable; (c) the county-level fixed effects (with county clustering); and (d) the IV, which reduces power in itself and, in this case, reduces the sample size. 32 This estimate of the share of the population directly connected to schools accounts for the fact that many students are in the same households with one another. To avoid double-counting, we specifically assume that one-third of the 53 million are siblings of one of the others in that count. Also, note that 69 percent of children are in two-parent households, so the average number of parents in the household for the average student is 1.7. We further assume that the average student has 0.5 non-school-age siblings at home and, finally, that the average school staff member lives in a household with two other non-school people. This yields: (53*0.33*0.5)(1+1.7+0.5)+(53*0.67)(1+1.7+0.5)+(5*3)=28.0+113.6+15=175.8 million.

23
V.A. Fixed Effects and Difference-in-Differences Results
This section focuses on the FE and DD results. We initially report these without the IV or
PSM, respectively, so that we can show later how these adjustments affect the results. The week-
by-week FE and DD results are shown in Figures 2A and 2B. A concern in these figures is the
lack of parallel pre-trends, particularly in the weeks immediately before school reopening. This
is not surprising given the noisiness of the weekly measures and the fact that we would expect
policy decisions regarding instructional modality to be partly driven by the pre-opening COVID-
19 hospitalizations rate. For this reason, we draw no conclusions here and move on to the more
precise three-period estimates.
Half of the three-period estimates, shown in Table 4, still show issues with parallel pre-
trends. Two of the post-opening estimates are positive (one significant) and two are negative, but
these clearly differ between hospitalizations/100k and the log specification, which is suggestive
of effect heterogeneity. Since the effects appear negative in the log specifications, it could be that
the effects are especially small in counties with few total COVID-19 cases, where a small
increase in the total would yield large percentage increases.
Therefore, in Table 5A (MCH) and 5B (Burbio), we break these into four subgroups
based on the pre-opening hospitalization rate from March through July: counties with no more
than one hospitalization/100k at baseline (57 percent of counties) followed by the 58th-75th
percentile, 76th-90th percentile, and greater than the 90th percentile. (We do not use quartiles or
similar equal-sized groups because this would be misleading with our skewed distribution of
baseline hospitalizations and large numbers of zeros at the week level.)
Table 5A and 5B both show that the one positive and significant average treatment effect
estimate (from Table 4) is coming from the counties above the 75th percentile on baseline
hospitalizations. For example, the largest point estimates suggest possible increases in
hospitalization of 3.5 percent (though these are insignificant). This pattern shows up with both
Burbio and MCH and in both the hospitalizations/100k and most of the log specifications.
Stratification on the baseline hospitalizations also largely addresses the pre-trend problem (in all
but three of the 16 subgroup estimates). In short, we see no evidence of increased COVID-19
hospitalizations in the vast majority of counties, but possible increases in counties with high
baseline hospitalization rates.
We also present DD estimates by individual weeks (not binned) for these four subgroups.
Appendix Figures 5A and 5B present the log and per 100k DD-event study estimates using MCH
data while Appendix Figures 5C and 5D does the same using the Burbio data. Again, we find
evidence of balance on pre-trends (especially within 5 weeks prior to reopening and onward) for
counties in the lower 75th percentile of baseline hospitalizations. Counties in the top 25th
percentile of baseline hospitalizations have erratic pre-trends and therefore inconclusive
increases in hospitalization rates.
Another way to address the pre-trends problem is through the PSM-DD (Table 6). This
method eliminates the pre-trend problem even without stratifying, as shown in the top panel. The

24
bottom panels of Table 6 combine stratification with PSM. All eight of the estimates for groups
below the 75th percentile show negative (but insignificant) point estimates. Likewise, all eight of
the estimates are positive above the 75th percentile and three are precisely estimated. The
estimates from MCH for the top groups are statistically significant in the post-reopening period.
For counties in the 75th to 90th percentile, COVID-19 hospitalizations per 100k increased by 2
percent (0.260/13) in the 6 weeks post reopening. Similarly, counties above the 90th percentile
show a 1.8 percent increase in hospitalizations per 100k (1.52/82).
Recall, however, that these models do not account for possible endogeneity based on
time-varying, unobserved factors. For this reason, we turn to instrumental variables estimation.
V.B. Instrumental Variables Results
Following Angrist and Krueger (2001), we first address the weak instruments problem by
reporting reduced form estimates (Sawa, 1969; Angrist and Kruger 2001; Chernozhukov and
Hansen 2004). That is, we estimate the effect of collective bargaining and meet and confer
teacher unions on hospitalizations, replacing the predicted share of in-person learning with the
two teacher union instruments. Note that we are mainly interested here in the direction of these
coefficients and that the expected sign is the reverse of the results above (and the FE-IV below).
If in-person instruction increases hospitalizations, then we should see that more collective
bargaining is negatively related to hospitalizations. (The magnitudes cannot be compared with
the earlier estimates, which are in terms of the share of in-person.)
Figures 3A, 3B, 3C, and 3D report coefficients from the reduced form at the county-by-
week level. In each figure we report two panels, one for collective bargaining and one for meet
and confer. In each panel we report five set of coefficients: one for all counties, and one for each
subgroup by baseline hospitalizations. Figures 3A and 3B report coefficients for log total
hospitalizations and per 100k hospitalizations using the MCH data. Figures 3C and 3D repeat the
analysis except using the Burbio data. We see almost no indications that increased teacher
bargaining reduces hospitalizations (through reduced in-person instruction). However, we see
evidence of non-parallel trends and some unrealistically small standard errors. We therefore turn
again to the binned analyses.
Tables 7A and 7B report the three-period FE-reduced form results for MCH and Burbio
with both logs and hospitalizations per 100k. In Table 7A we report the period coefficients for
collective bargaining only (while also controlling for meet and confer). Of the 40 post period
coefficients, only six are statistically significant and five of those suggest that bargaining power
increases hospitalizations (i.e., in-person school reopenings reduce hospitalizations). These
results are broadly consistent with the DD and FE models where in some instances we found in-
person learning to reduce hospitalizations.
The results are more precise with the collective bargaining results (Table 7A) than with
meet and confer (Table 7B). The results in Table 7A are also precise enough so that we can
interpret our results as precise nulls. In column 1 of Table 7A, the standard error is 0.129 and the

25
mean is 9.46, meaning we can detect an effect larger than 2.7 percent for per 100k
hospitalizations. Similarly, for log total hospitalizations the standard error is 0.026 meaning we
can detect a 5.2 percent change in hospitalizations. These minimum detectable effects are
reasonable in magnitude, especially given that almost half the U.S. population is directly
connected to K-12 schools (see above).
We next proceed to discussing the FE-IV estimates. An advantage of the FE-IV estimates
is the ease of interpretation. The FE-IV coefficient presents the effect of moving from no in-
person teaching to a fully in-person teaching policy. Figures 4A, 4B, C, and 4D report
coefficients from the FE-IV by week. We note that the results have flat pre-trends (up to 10
weeks prior to reopening), except above the 90th percentile, which makes us more cautious about
the results for that group. From the lead coefficients (post school reopening), we see no visual
evidence of increased hospitalizations. Starting from the earliest possible time that
hospitalizations could increase (t+2), the estimates generally decline afterwards and none are
statistically higher than the t=0 or t+1 periods.
Table 8 reports the three-period FE-IV results for MCH and Burbio and with both logs
and hospitalizations/100k. Across all the estimates in Table 8, the only coefficient indicating
increased hospitalizations is with the MCH data with hospitalizations/100k. However, even in
that case, the parallel trends test fails and the pre-trend estimate is larger than the post-opening
coefficient. Using the MCH data, the vast majority of effect estimates are statistically
insignificant and are arguably small in absolute value. When we use the Burbio data, we have
better balance on pre-trends and find no increases in hospitalizations for counties below the 75th
percentile and decreases in hospitalizations above the 75th percentile.
We considered the possibility that our teacher collective bargaining data are somewhat
dated and do not reflect significant changes in union policy over the past decade. Six states
instituted policies aimed at weakening unions between 2011 and 2017 (Marianno & Strunk,
2018).33 We therefore re-ran some of these analyses dropping those states. This yielded very
similar results to the full national sample that we use in our main analyses.
One reason why the results might be less indicative of increased hospitalizations in the
FE-IV, compared with the PSM-DD, is the previously mentioned concern that teacher unions not
only reduce the probability of reopening, but work to improve the safety of reopenings, in order
to protect their members and students, which in turn could reduce the extent of COVID-19
spread and the number of hospitalizations. For this reason, we are cautious in interpreting these
results, by themselves, as evidence that school reopenings do not increase hospitalizations for
any group of counties.34
33 The states with weakened teacher union bargaining power are Indiana, Kentucky, Michigan, Missouri, West Virginia, and Wisconsin. 34 One way to overcome this is to estimate the reduced form effect of teacher union power on
hospitalizations which would encompass both the mechanisms related to opening mode or safety protocols when opening in-person/hybrid instruction. For a sample of all counties (not stratified) we estimated event study reduced form regressions of the effect of teacher unions on hospitalizations and found no statistically significant effect in the pre 10 week period or the post 6 week period. Those estimates are available upon request.

26
The results are consistent, however, for counties up to the 75th percentile of baseline
hospitalizations. These results remain generally consistent across the PSM-DD and FE-IV and
across functional forms (log versus hospitalizations) and data sources (MCH versus Burbio).
None of our estimates with parallel pre-trends suggest any evidence of increased hospitalizations
in the low-baseline-hospitalization rate counties.
V.C. Additional Robustness Checks
This section focuses on three additional robustness checks: switching from Change
Healthcare to HHS data on hospitalizations, adding college reopenings, and switching from OLS
to Poisson (count data) estimation.
We reestimated the main models (DD35 and FE-IV) using the HHS data as shown in
Appendix Figures 8-15. Note that we report slightly different percentiles of the baseline
hospitalization rate because there are somewhat fewer counties with zero hospitalizations in the
HHS data (50 percent versus 57 percent); the groupings are otherwise the same as before. Also,
we report these only as weekly event studies; the limited number of pre-opening weeks make it
more difficult, and less useful, to bin the pre-treatment periods.
The general pattern of results is very similar with the HHS data, relative to the above
analyses with the Change Healthcare data. In only one of 14 graphs (Burbio data and
hospitalizations per 100k below the 50th percentile) do we see any evidence of increased
hospitalizations below the 75th percentile of the baseline hospitalization rate. Also, as before, we
do see multiple graphs where there are signs of increased hospitalizations above the 75th
percentile.
One potential threat to identification is that colleges may open at roughly the same time
as schools and this, in turn, might affect hospitalizations independently of school reopenings.
The FE-IV at least partially addresses this because there is little reason to expect teacher unions
to affect college reopening decisions, especially after accounting for county fixed effects.
(College towns have different political orientations, but this should be time constant.)
We also tested the robustness of the PSM-DD model and the FE-IV model to include
time varying controls for college reopening in in-person or hybrid mode. Appendix Table 4
presents a comparison between our main PSM-DD model in Table 6 and an alternative model
that adds a time varying hybrid/in-person college reopening indicator in the county. Similarly,
Appendix Table 6 presents the main IV estimates in Table 8 for all counties and compares the
point estimates to an alternative model that adds the college reopening time-varying indicator.
These additional PSM-DD and FE-IV results are very similar to what we reported earlier without
college reopenings.
Finally, given the large share of observations with zero COVID-19 hospitalizations, we
also reestimated our main models using count data methods, i.e. Poisson regression. The results,
35 We focus on the DD instead of the PSM-DD because of the difficulty of matching on fewer pre-trend periods. Also, the pre-trends are generally flatter with the HHS data.

27
shown in Appendix Tables 7 and 8, provide qualitatively similar results to the PSM-DD and FE-
IV per 100k estimates to those from a count Poisson regression of total hospitalizations in a
county week.
VI. Conclusions
This study provides the first evidence regarding the effects of in-person school
reopenings on COVID-19 health outcomes. In doing so, it avoids the problems with all past
studies on the topic, which have been forced to rely on virus positive rates that are subject to
infrequent and unsystematic testing. The errors in COVID-19 positivity rates are also
confounded with school reopenings because schools may open because of anticipated,
unobserved changes in public health practices and the frequency of testing may change as a
direct result of school reopenings. COVID-19 hospitalizations do not suffer from these problems
and they focus our attention on what matters most: health outcomes.
Our results suggest that school reopenings have not increased COVID-19
hospitalizations, especially for the 75 percent of counties that had the lowest baseline
hospitalizations this past summer. This conclusion is robust to a wide variety of estimation
methods: Burbio versus MCH data, hospitalizations/100k versus logs, PSM-DD versus FE-IV,
OLS versus Poisson regression, and limited covariates versus extensive ones, including state
social distancing policies and college reopenings.
To develop policy relevant thresholds, we used the HHS data, which reflect the entire
population (not just people with insurance) and reflect the data that public health officials can
access as they advise school leaders. Using these data, we see no effects below 36-44 new
COVID-19 hospitalizations per 100,000 population per week. Also, note that some counties are
much larger than others, which is why we report on a per 100,000 basis. More than 40 U.S.
counties have populations over one million residents and, in these counties, the threshold
involves at least 360-440 new COVID-19 hospitalizations per week.
The results for high-baseline-hospitalization counties are inconclusive because of failed
parallel trends tests and inconsistent results across specifications. There are reasons to expect that
opening schools in-person under such conditions would be more likely to spread the virus and
negative health outcomes because there is more of the virus to spread in those cases. This theory
is consistent, for example, with the findings of Goldhaber et al. (2020). While they were forced
to use the COVID-19 positivity rate, they, too, found that the rate increases in locations where
the baseline rate was relatively high.
The interpretation and policy implications of these results may be less straightforward
than they seem, however. First, recall that most schools that are offering in-person instruction are
also giving families the option of remote instruction and many families are taking advantage of
this. This means that what we are actually estimating is the effect of the policy of sending all
children back in-person, not the effect of actually having all students in school buildings as they
were prior to the crisis. So, even if these results were taken literally, they do not mean that

28
sending all children and teachers back to school in-person, even in low-baseline-hospitalization
counties, would be safe. Rather, what we are capturing is the effect of the policy of allowing all
students to return, with the option to remain remote that many families would evidently opt for.
Second, opening safely and in-person creates considerable difficulty for schools. When
schools are fully in-person, they can operate as before (but with additional safety measures).
When they operate fully remotely, they can send everyone home and use as many online tools as
their Broadband access and technologies allow. But when some students are home and others are
remote at the same time, this creates new problems. Anecdotally, teachers tend to focus on
students who are there in-person, which undermines the remote experience. Also, many teachers
have to stand in front of their computers so that others can see them at home on Zoom, which
undermines the in-person experience. Anecdotally, these challenges have led even more students
to opt out of in-person.
Third, our estimated effects capture both the direct effects of school reopenings
themselves (i.e., getting in a school bus and/or going into a school building and spreading the
virus) and several closely related indirect effects. School reopenings might increase social
interaction among children outside of school (e.g., sleepovers, playdates, and additional shopping
for school clothes that require trips to the mall) and induce more parents to go to work in-person.
As noted with respect to the similar study in Germany (Isphording, Lipfert, & Pestel, 2020),
however, there may also be indirect effects that reduce COVID-19 transmission (e.g., educators
sending stern messages about social distancing and students being more reluctant to engage in
their non-school social interactions in order to avoid exclusion from school activities because of
quarantines). As a practical matter, we cannot separate the direct effects from the indirect effects,
though this is not problematic since we view the total effect as the parameter of interest for
policy purposes; the indirect effects are likely to accompany most forms of school reopening,
especially in the current U.S. policy environment.
Fourth, reopening schools affects different groups in different ways. One of the main
reasons that more schools have not opened in-person (or allowed that option) is that teachers and
other school staff are sometimes in risk categories and have been understandably concerned
about their health. While our hospitalization results do include school staff, we cannot separate
out the effects for this group from the general population. It is theoretically possible that opening
schools increases negative health outcomes for school staff even if not for the general
population. The only scenario we can envision in which this is possible is that school staff spread
the virus to one another, but that students do not spread it amongst themselves. If students were
the main drivers of transmission then it would spread both to school staff and to parents,
resulting in an increase in hospitalizations that we do not see here (in the bottom 75 percent). In
addition, there are different implications across racial groups. African Americans have suffered
disproportionate health consequences. The potential trade-offs across all of these various groups
are important to remember.
The underlying assumption of COVID-19 school decision-making has been that opening
up schools to in-person instruction would benefit students and parents in many ways, but at a

29
cost of spreading the virus and harming teachers and the community as a whole. While we find
evidence that this trade-off exists in counties with already high virus transmission, we do not find
evidence of such a trade-off for the majority of school districts, based on the summer COVID-19
numbers. This is important for policymakers to consider as they make decisions this spring and
in future virus events.

30
References
Andersen, Martin S., Ana I. Bento, Anirban Basu, Chris Marsicano, and Kosali Simon (2020).
College Openings, Mobility, and the Incidence of COVID-19 Cases. medRxiv
doi: https://doi.org/10.1101/2020.09.22.20196048
Bacher-Hicks, Andrew, Joshua Goodman, and Christine Mulhern (2020). What Google Search
Data Reveals About Learning During the Pandemic. Education Next.
https://www.educationnext.org/google-search-data-reveals-about-learning-pandemic/
Bauer, Lauren, Kristen Broady, Wendy Edelberg, and Jimmy O’Donnell (2020). Ten Facts
about COVID-19 and the U.S. Economy. https://www.brookings.edu/research/ten-facts-about-
covid-19-and-the-u-s-
economy/#:~:text=The%20COVID%2D19%20crisis%20also,(U.S.%20Census%20Bureau%202
020a).
Bell, S. A., Klasa, K., Iwashyna, T. J., Norton, E. C., & Davis, M. A. (2020). Long-term
healthcare provider availability following large-scale hurricanes: A difference-in-differences
study. PloS one, 15(11), e0242823.
Center for Reinventing Public Education (2020). Fall 2020: The State of School Reopening.
https://www.crpe.org/current-research/covid-19-school-closures.
Chetty, Raj, John N. Friedman, Nathaniel Hendren, Michael Stepner, and the Opportunity
Insights Team (2020). The Economic Impacts of COVID-19: Evidence from a New Public
Database Built Using Private Sector Data. https://opportunityinsights.org/wp-
content/uploads/2020/05/tracker_paper.pdf
Clarke, D. and Kathya Tapia Schythe (2020). Implementing the Panel Event Study. IZA DP No.
13524. IZA Institute of Labor Economics. http://ftp.iza.org/dp13524.pdf.
Couture, V., J. Dingel, A. Green, J. Handbury, and K. Williams (2020). Location Exposure Index
Based on PlaceIQ Data. https://github.com/COVIDExposureIndices/COVIDExposureIndices/
blob/master/documentation/LEX.pdf
Cutler DM, Summers LH. The COVID-19 Pandemic and the $16 Trillion Virus. JAMA.
2020;324(15):1495–1496. doi:10.1001/jama.2020.19759.

31
Czeisler MÉ , Lane RI, Petrosky E, et al. Mental Health, Substance Use, and Suicidal Ideation
During the COVID-19 Pandemic — United States, June 24–30, 2020. MMWR Morb Mortal
Wkly Rep 2020;69:1049–1057. DOI: http://dx.doi.org/10.15585/mmwr.mm6932a1
Dee, Tegan K. Boehmer, Brendan R. Jackson, Achuyt Bhattarai, Erisa Sula, Jayme P. Coyle,
Elise Caruso, Amanda R. Smith, Rebecca S. Levine, Brittney N. Baack, Roger Mir, Edward R.
Lockhart, Tejpratap S.P. Tiwari, Deborah L. Dee, Tegan K. Boehmer, Brendan R. Jackson,
Achuyt Bhattarai (2020). Recent Increase in COVID-19 Cases Reported Among Adults Aged
18–22 Years — United States, May 31–September 5, 2020. CDC Weekly 69(39);1419–1424
Desilver, D. (2020). ‘Back to School’ means anytime from late July to after Labor Day, depend
on where in the U.S. you live. Pew Research Center. https://www.pewresearch.org/fact-
tank/2019/08/14/back-to-school-dates-u-s/
Education Policy Innovation Collaborative (2020). Instructional Delivery Under
Michigan Districts’ Extended Continuity of Learning Plans. East Lansing, MI: Michigan State
University. https://epicedpolicy.org/wp-content/uploads/2020/11/EPIC-ECOL-Report-
November-2020.pdf.
Forbes, Harriet, Caroline E Morton, Seb Bacon, Helen I McDonald, Caroline Minassian, Jeremy
P Brown, Christopher T Rentsch, Rohini Mathur, Anna Schultze, Nicholas J DeVito, Brian
MacKenna, William J Hulme, Richard Croker, Alex J Walker, Elizabeth J Williamson, Chris
Bates, Amir Mehrkar, Helen J Curtis, David Evans, Kevin Wing, Peter Inglesby, Henry
Drysdale, Angel YS Wong, Jonathan Cockburn, Robert McManus, John Parry, Frank Hester,
Sam Harper, Ian J Douglas, Liam Smeeth, Stephen JW Evans, Krishnan Bhaskaran, Rosalind M
Eggo, Ben Goldacre, Laurie A Tomlinson. Association between living with children and
outcomes from COVID-19: an OpenSAFELY cohort study of 12 million adults in England.
medRxiv doi: https://doi.org/10.1101/2020.11.01.20222315
Friedson, A. I., McNichols, D., Sabia, J. J., & Dave, D. (2020). Shelter‐in‐place orders and
public health: evidence from California during the COVID‐19 pandemic. Journal of Policy
Analysis and Management.
Goldhaber, Dan, Scott Imberman, Katharine Strunk, Bryant Hopkins, Nate Brown, Erica
Harbatkin, and Tara Kilbride (2020). To What Extent Does In-Person Schooling Contribute to
the Spread of COVID-19? Evidence from Michigan and Washington. Michigan State University:
Education Policy Innovation Collaborative. https://epicedpolicy.org/does-in-person-schooling-
contribute-to-the-spread-of-covid-19/

32
Hanushek, Eric A. and Ludger Woessmann (2020). The Economic Impacts of
Learning Losses. Organization for Economic Development and Cooperation.
http://www.oecd.org/education/The-economic-impacts-of-coronavirus-covid-19-learning-
losses.pdf.
Gupta, S., L. Montenovo, T. D. Nguyen, F. L. Rojas, I. M. Schmutte, K. I. Simon, B. A.
Weinberg, and C. Wing (2020). Effects of social distancing policy on labor market outcomes.
NBER Working Paper.
Hartney, Michael and Finger (2020). Politics, Markets, and Pandemics: Public
Education’s Response to COVID-19. EdWorkingPaper 20-304. Brown University: Annenberg
Institute. https://www.edworkingpapers.com/sites/default/files/ai20-304.pdf
Havers FP, Reed C, Lim T, Montgomery JM, Llena JD, et al. (2020). Seroprevalence of
Antibodies to SARS-CoV-2 in 10 Sitesin the United States, March 23-May 12, 2020. JAMA
Intern Med. doi:10.1001/jamainternmed.2020.4130
Hobbs, Charlotte V., Lora M. Martin, Sara S. Kim, Brian M. Kirmse, Lisa Haynie, Sarah
McGraw, Paul Byers, Kathryn G. Taylor, Manish M. Patel, Brendan Flannery. (2020). Factors
Associated with Positive SARS-CoV-2 Test Results in Outpatient Health Facilities and
Emergency Departments Among Children and Adolescents Aged <18 Years — Mississippi,
September–November 2020. CDC Weekly 69(50);1925-1929.
Ismail, Sharif A, Vanessa Saliba, Jamie Lopez Bernal, Mary E Ramsay, Shamez N Ladhani
(2020). SARS-CoV-2 infection and transmission in educational settings: a prospective, cross-
sectional analysis of infection clusters and outbreaks in England
DOI:https://doi.org/10.1016/S1473-3099(20)30882-3
Isphording, Ingo E., Marc Lipfert, and Nico Pestel (2020). School Re-Openings after Summer
Breaks in Germany Did Not Increase SARS-CoV-2 Cases. IZA DP No. 13790.
Karpman, Michael and Stephen Zuckerman (2020). ACA Offers Protection as the COVID-19
Pandemic Erodes Employer Health Insurance Coverage. Washington, DC: Urban Institute.
https://www.urban.org/sites/default/files/103181/aca-offers-protection-as-the-covid-19-
pandemic-erodes-employer-health-insurance-coverage_0.pdf
Kaufman, Brystana G., Rebecca Whitaker, Nirosha Mahendraratnam, Valerie A. Smith, and
Mark B. McClellan (2020). Comparing Associations of State Reopening Strategies with COVID-
19 Burden. Journal of General Internal Medicine.
https://link.springer.com/article/10.1007/s11606-020-06277-0
33
Kuhfeld, Megan, Beth Tarasawa, Angela Johnson, Erik Ruzek, and Karyn Lewis. Learning
during COVID-19: Initial findings on students’ reading and math achievement and growth.
Portland, OR: NWEA. https://www.nwea.org/research/publication/learning-during-covid-19-
initial-findings-on-students-reading-and-math-achievement-and-growth/
Laxminarayan, Ramanan, Brian Wahl, Shankar Reddy Dudala, K. Gopal, Chandra Mohan, S.
Neelima, K. S. Jawahar Reddy, J. Radhakrishnan, Joseph A. Lewnard (2020). Epidemiology and
transmission dynamics of COVID-19 in two Indian states. Science 370(6517).
Mathematica (2020). Using Data to Identify Changes in Child Welfare Referrals and Screening
in the Era of COVID-19. https://www.mathematica.org/events/using-data-to-assess-changes-in-
child-welfare-screenings-and-referrals-in-the-era-of-covid-19
McDermott, Daniel, Cynthia Cox, Robin Rudowitz, and Rachel Garfield (2020). How Has the
Pandemic Affected Health Coverage in the U.S.? Kaiser Family Foundation.
https://www.kff.org/policy-watch/how-has-the-pandemic-affected-health-coverage-in-the-u-s/
Neelima, S., K. S. Jawahar Reddy, J. Radhakrishnan, and Joseph A. Lewnard (2020).
Epidemiology and transmission dynamics of COVID-19 in two Indian states. Science 370, 691–
697.
Neidhofer, Claudio and Guido Neidhofer (2020). The Effectiveness of School Closures and
Other Pre-Lockdown COVID-19 Mitigation Strategies in Argentina, Italy, and South Korea.
Working paper.
Nguyen, T. D., S. Gupta, M. Andersen, A. Bento, K. I. Simon, and C. Wing (2020). Impacts of
state reopening policy on human mobility. NBER Working Paper .
Oster, E. (2020). Schools Aren’t Superspreaders. The Atlantic.
https://www.theatlantic.com/ideas/archive/2020/10/schools-arent-superspreaders/616669/
Painter, M. and T. Qiu (2020). Political beliefs affect compliance with covid-19 social distancing
orders. Available at SSRN 3569098 .
Pan, Kuan-Yu, Almar A L Kok, Merijn Eikelenboom, Melany Horsfall, Frederike Jörg, Rob A
Luteijn, Didi Rhebergen, Patricia van Oppen, Erik J Giltay*, Brenda W J H Penninx* (2020).
The mental health impact of the COVID-19 pandemic on people with and without depressive,
anxiety, or obsessive-compulsive disorders: a longitudinal study of three Dutch case-control
cohorts. The Lancet. https://doi.org/10.1016/S2215-0366(20)30491-0.

34
Salvatore, Phillip P., Erisa Sula, Jayme P. Coyle, Elise Caruso, Amanda R. Smith, Rebecca S.
Levine, Brittney N. Baack, Roger Mir, Edward R. Lockhart, Tejpratap S.P. Tiwari; Deborah L.
Marianno, B. & Strunk. K. (2018) After Janus. Education Next 18(4).
Schmidt, Samantha and Hannah Natanson (2020). With kids stuck at home, ER doctors see more
severe cases of child abuse. Washington Post.
https://www.washingtonpost.com/education/2020/04/30/child-abuse-reports-coronavirus/
Smith, J.A., & Todd, P. E. (2005). Does matching overcome LaLonde's critique of
nonexperimental estimators?. Journal of econometrics, 125(1-2), 305-353.
Stuart, E. A., Huskamp, H. A., Duckworth, K., Simmons, J., Song, Z., Chernew, M. E., & Barry,
C. L. (2014). Using propensity scores in difference-in-differences models to estimate the effects
of a policy change. Health Services and Outcomes Research Methodology, 14(4), 166-182.
Tedeschi, Ernie (2020). The Mystery of How Many Mothers Have Left Work Because of School
Closings. New York Times. October 29. https://www.nytimes.com/2020/10/29/upshot/mothers-
leaving-jobs-pandemic.html
UNESCO (2020). One in every five children, adolescents and youth is out of school worldwide.
https://en.unesco.org/news/one-every-five-children-adolescents-and-youth-out-school-
worldwide#:~:text=According%20to%20data%20from%20the,over%20the%20past%20five%20
years.
U.S. Census Bureau (2020). Household Pulse Survey.
https://www.census.gov/data/tables/2020/demo/hhp/hhp17.html
U.S. Center for Disease Control. Overview of Testing for SARS-CoV2 (COVID-19). Updated
Oct 21, 2020 https://www.cdc.gov/coronavirus/2019-ncov/hcp/testing-overview.html#previous
accessed 12/1/2020.
Valant, Jon (2020). School reopening plans linked to politics rather than public health.
Washington, DC: Brookings Institution. https://www.brookings.edu/blog/brown-center-
chalkboard/2020/07/29/school-reopening-plans-linked-to-politics-rather-than-public-health/
Viner, Russell M., Oliver T. Mytton, Chris Bonell, G. J. Melendez-Torres, Joseph Ward, Lee
Hudson, Claire Waddington, James Thomas, Simon Russell, Fiona van der Klis, Archana
Koirala, Shamez Ladhani, Jasmina Panovska-Griffiths, Nicholas G. Davies, Robert Booy,
Rosalind M. Eggo (2020). Susceptibility to SARS-CoV-2 Infection Among Children and
Adolescents Compared With Adults: A Systematic Review and Meta-analysis. JAMA Pediatrics.
35
Vlachos, Jonas and Edvin Herteg°ard, Helena Svaleryd (2020). School closures and SARS-CoV-
2. Evidence from Sweden’s partial school closure. Working paper.
https://doi.org/10.1101/2020.10.13.20211359.
Wiersinga WJ, Rhodes A, Cheng AC, Peacock SJ, Prescott HC. Pathophysiology, Transmission,
Diagnosis, and Treatment of Coronavirus Disease 2019 (COVID-19): A Review. JAMA. 2020;
324(8):782–793. doi:10.1001/jama.2020.12839 JAMA. Published online May 6, 2020.
doi:10.1001/jama.2020.8259 https://jamanetwork.com/journals/jama/fullarticle/2768391
Williamson, E.J., Walker, A.J., Bhaskaran, K. et al. Factors associated with COVID-19-related
death using OpenSAFELY. Nature 584, 430–436 (2020). https://doi.org/10.1038/s41586-020-
2521-4
Ziedan, Engy, Kosali I. Simon & Coady Wing (2020). Effects of State COVID-19 Closure
Policy on NON-COVID-19 Health Care Utilization. NBER Working Paper 27621. Cambridge,
MA; National Bureau of Economic Research

Table 1 Percent in Districts in each Instructional Mode by Source
Notes: These data reflect the percentage of districts reporting each mode of instruction at the start of the
school year. For Education Week and MCH, the data were provided at the district level and we report
them this way (unweighted by enrollment size). For Burbio, the data were provided at the county level
and the figures reflect the percent of students.
Source In-Person Remote Hybrid Other Undecided
MCH 19.13% 24.10% 54.70% 2.06% -
EdWeek 24.15% 48.73% 27.12% - -
Burbio 42.51% 34.48% 22.82% - 0.19%

Table 2 Collective Bargaining Descriptive Statistics
State State
Bargaining
Legal Status
#
Total
Districts
# Districts w/
Bargaining
Info
% Collective
Bargaining
% Meet and
Confer
Alabama illegal 138 85 1.18 17.65
Alaska required 54 39 89.74 7.69
Arizona illegal 664 82 3.66 56.10
Arkansas permissible 278 90 4.44 4.44
California required 1096 248 93.95 2.42
Colorado permissible 186 75 33.33 29.33
Connecticut required 199 64 98.44 0.00
Delaware required 43 15 93.33 6.67
District of Columbia required 61 1 100.00 0.00
Florida required 73 48 97.92 2.08
Georgia illegal 212 91 0.00 3.30
Hawaii required 1 1 100.00 0.00
Idaho required 159 70 71.43 20.00
Illinois required 952 122 96.72 0.00
Indiana required 409 106 99.06 0.94
Iowa required 333 108 98.15 0.93
Kansas required 289 111 73.87 20.72
Kentucky permissible 176 88 10.23 12.50
Louisiana permissible 200 56 10.71 1.79
Maine required 209 61 96.72 1.64
Maryland required 25 17 100.00 0.00
Massachusetts required 407 92 98.91 0.00
Michigan required 889 140 97.86 1.43
Minnesota required 528 110 94.55 4.55
Mississippi permissible 156 94 0.00 2.13
Missouri required 565 116 2.59 33.62
Montana required 400 111 84.68 3.60
Nebraska required 270 78 91.03 8.97
Nevada required 20 14 92.86 7.14
New Hampshire required 189 65 96.92 3.08
New Jersey required 676 125 99.20 0.80
New Mexico required 150 52 38.46 3.85
New York required 1042 165 98.79 0.61
North Carolina illegal 293 71 0.00 2.82
North Dakota permissible 223 77 64.94 19.48
Ohio required 1009 129 96.90 0.00
Oklahoma required 543 200 41.50 8.50
Oregon required 199 77 97.40 2.60
Pennsylvania required 754 126 98.41 1.59
Rhode Island required 60 26 100.00 0.00
South Carolina illegal 98 53 0.00 0.00
South Dakota required 152 85 61.18 23.53
Tennessee permissible* 147 79 67.09 7.59
Texas illegal 1203 276 0.36 4.35
Utah permissible 154 32 40.63 50.00
Vermont required 187 49 95.92 2.04

Virginia illegal 205 71 0.00 15.49
Washington required 319 111 98.20 1.80
West Virginia permissible 56 47 0.00 10.64
Wisconsin required 447 131 95.42 2.29
Wyoming permissible 61 39 12.82 28.21
Notes: These data describe teacher bargaining power by state. “State Bargaining Legal Status” comes
from the National Council for Teacher Quality (https://www.nctq.org/contract-
database/collectiveBargaining) which has several options: “required” means districts must collectively
bargain when teachers vote to do so; “permissible” means that districts may choose to collectively bargain
if teachers vote for it; and “illegal” means that collective bargaining is not allowed. (Tennessee is
distinctive with its “collaborative conferencing” and we place this in the permissible category.) The last
two columns come from the 2000 public-use Schools and Staffing Survey from the U.S. Department of
Education. “% Collective bargaining” is the percent of districts that report in the SASS that they
collectively bargain, meaning there is a legally binding contract (unweighted by enrollment size) and “%
Meet and confer” is the percent of districts that report meet and confer arrangement, which are not
contracts and are more akin to Memoranda of Understanding (MOU).

Table 3 – First Stage Estimates of the Effect of Unions on School Opening Modality
Notes – The level of observation is the county. Table 3 reports estimates of equation (3), a regression of
the share of students in online only, in person only, or hybrid/in-person combined on two measures of
teacher unionization (see notes to Table 2 for details). Hybrid/in-person is defined as the share of students
in-person + 0.5 times the share of students in hybrid. Panel A uses school reopening data from MCH.
Panel B.uses school reopening data from Burbio. All regressions include state fixed effects and county
population weights. We report the p-value and F-statistic of joint significance of both union coefficients
(excluding state fixed effects). Standard errors of estimates are constructed using robust-cluster methods
allowing for non-independence of observations within a county. ** indicates 0.01 < p-value <=0.05, ***
indicates 0.001< p-value <=0.01.
Panel A. MCH
Online
(1)
In Person
(2)
Hybrid/In person
(3)
Share of Collective Bargaining Union 0.180** -0.112*** -0.121***
(0.074) (0.028) (0.040)
Share of Meet and Confer Union 0.196** -0.0757*** -0.131***
(0.084) (0.028) (0.046)
P-value for Joint Significance 0.011 0.000 0.001
F-statistic for Joint Significance 4.49 8.47 6.38
Mean Dep Variable 0.165 0.201 0.473
Number of Obsv. (counties) 1827 1827 1827
adj. R-sq 0.434 0.173 0.327
Panel B. Burbio
Online
(1)
In Person
(2)
Hybrid/In person
(3)
Share of Collective Bargaining Union 0.151*** -0.054 -0.104**
(0.053) (0.054) (0.052)
Share of Meet and Confer Union 0.069 0.022 -0.0234
(0.064) (0.0518) (0.054)
P-value for Joint Significance 0.015 0.473 0.117
F-statistic for Joint Significance 4.23 0.75 2.14
Mean Dep Variable 0.371 0.375 0.502
Number of Obsv. (counties) 1725 1725 1725
adj. R-sq 0.496 0.363 0.426

Table 4 – Difference in Differences and Fixed Effects Estimates of the Hybrid/In-Person Teaching on Covid19 Hospitalizations (January to
October 2020)
Notes – The regression only includes the 10 weeks prior to school reopening and the 6 weeks after school reopening for each county. We divide
this period into 3 groups: period 1 (weeks -10 to -5), period 2 (weeks -4 to +1) is the omitted category, and period 3 (weeks +2 to +6). The unit of
observation is the county-week. All regressions include state fixed effects, county fixed effects, calendar week fixed effects and controls for state
time varying covid-19 policies. Standard errors are clustered by county and all estimates are weighted by the county population. ** indicates 0.01
< p-value <=0.05, *** indicates 0.001< p-value <=0.01
Per 100K Hospitalizations Log Total Hospitalizations
MCH
FE MCH
DD
Burbio
FE
Burbio
DD
MCH
FE MCH
DD
Burbio
FE
Burbio
DD
Share In-Person/Hybrid x T-10 to T-5 -0.986* -0.0401 -0.823* -0.354* -0.0091 -0.114*** -0.0354 -0.0170
(0.429) (0.195) (0.335) (0.164) (0.0412) (0.0322) (0.0209) (0.0187)
Share In-Person/Hybrid x T+2 to T+6 0.207 0.420** 0.148 0.146 -0.0128 -0.0254 -0.0172 -0.0113
(0.240) (0.147) (0.162) (0.111) (0.0273) (0.0263) (0.0216) (0.0192)
Mean Dependent Var 7.88 7.88 8.62 8.62
Number of Observations 51575 51575 61860 61860 51575 51575 61860 61860

Table 5A– Difference in Differences Estimates the Hybrid/In-Person Teaching on Covid19 Hospitalizations (January to October 2020) by
Baseline Hospitalizations (March to July 2020) MCH
Notes – The regression only includes the 10 weeks prior to school reopening and the 6 weeks after school reopening for each county. We divide this period into 3
groups: period 1 (weeks -10 to -5), period 2 (weeks -4 to +1) is the omitted category, and period 3 (weeks +2 to +6). The unit of observation is the county-week.
All regressions include state fixed effects, county fixed effects, calendar week fixed effects and controls for state time varying covid-19 policies. Standard errors
are clustered by county and all estimates are weighted by the county population. For each outcome variable, log hospitalizations or per 100k hospitalizations, we
present estimates for 5 samples. First, we show estimates for all counties which instruction modality information. Second, we present estimates for counties in the
bottom 57th percentile, 58th to 75th percentile, 75th to 90th and 90th plus of baseline log hospitalizations (March 2020 to July 2020). ** indicates 0.01 < p-value
<=0.05, *** indicates 0.001< p-value <=0.01
Per 100K Hospitalizations Log Total Hospitalizations
All <57th 58th to
75th
75th to
90th
>90th All <57th 58th to
75th
75th to
90th
>90th
Share In-Person/Hybrid x
T-10 to T-5 -0.0401 0.015 0.082 0.294 2.080* -0.114*** 0.0003 -0.011 -0.014 0.051
(0.195) (0.009) (0.065) (0.196) (0.907) (0.0322) (0.0005) (0.032) (0.046) (0.047)
Share In-Person/Hybrid x
T+2 to T+6 0.420** -0.006 0.021 0.374** 1.348* -0.0254 -0.0002 -0.012 0.036 0.035
(0.147) (0.003) (0.041) (0.116) (0.519) (0.0263) (0.0002) (0.021) (0.038) (0.049)
Mean Dependent Var 7.88 0.42 0.54 14.54 61.29
Number of Observations 51575 29528 14756 8043 4062 51575 29528 14756 8043 4062

Table 5B – Difference in Differences the Hybrid/In-Person Teaching on Covid19 Hospitalizations (January to October 2020) by Baseline
Hospitalizations (March to July 2020) Burbio
Notes: See notes to Table 5A. This table is the same except we use the Burbio data to identify school reopenings. ** indicates 0.01 < p-value
<=0.05, *** indicates 0.001< p-value <=0.01
Per 100K Hospitalizations Log Total Hospitalizations
All <57th 58th to
75th
75th to 90th >90th All <57th 58th to
75th
75th to
90th
>90th
Share In-Person/Hybrid x T-
10 to T-5 -0.354* 0.002 0.031 -0.653*** -0.303 -0.017 0.0002 -0.002 -0.104* -0.030
(0.164) (0.008) (0.036) (0.176) (0.817) (0.019) (0.0003) (0.002) (0.041) (0.037)
Share In-Person/Hybrid x
T+2 to T+6 0.146 -0.002 -0.014 0.150 0.415 -0.011 -0.0004 0.001 0.032 -0.042
(0.111) (0.002) (0.012) (0.143) (0.376) (0.019) (0.00003) (0.003) (0.040) (0.050)
Mean Dependent Var 8.62 0.61 0.94 12.88 86.54
Number of Observations 61860 36190 10991 9646 5033 61860 36190 10991 9646 5033

Table 6 – Propensity Score Matching Difference in Differences Estimates of the Hybrid/In-Person Teaching on Covid19 Hospitalizations (January
to October 2020)
Per 100K Log Total Hospitalizations
Panel A. All Counties MCH Burbio MCH Burbio
Share In-Person/Hybrid x T-10 to T-5 -0.078 -0.250 -0.063 0.012
(0.252) (0.229) (0.035) (0.024)
Share In-Person/Hybrid x T+2 to T+6 0.295 0.133 -0.019 -0.005
(0.187) (0.114) (0.028) (0.016)
Mean Dependent Var 7.24 9.79
Number of Observations 51,274 59,452 51,274 59,452
Panel B: <57th Percentile MCH Burbio MCH Burbio
Share In-Person/Hybrid x T-10 to T-5 0.0133 -0.001 0.001 0.0001
(0.007) (0.005) (0.0004) (0.0005)
Share In-Person/Hybrid x T+2 to T+6 -0.010* -0.005 -0.0005 -0.0001
(0.005) (0.004) (0.0003) (0.0001)
Mean Dependent Var 0.411 1.11
Number of Observations 29,939 35,135 29,939 35,135
Panel C: 58th – 75th Percentile MCH Burbio MCH Burbio
Share In-Person/Hybrid x T-10 to T-5 0.026 0.018 -0.001 0.003
(0.031) (0.053) (0.005) (0.003)

Share In-Person/Hybrid x T+2 to T+6 -0.006 -0.049 -0.002 -0.002
(0.015) (0.029) (0.003) (0.002)
Mean Dependent Var 1.512 0.75
Number of Observations 3,494 11,252 3,494 11,252

Notes – The regression only includes the 10 weeks prior to school reopening and the 6 weeks after school reopening for each county. We divide
this period into 3 groups: period 1 (weeks -10 to -5), period 2 (weeks -4 to +1) is the omitted category, and period 3 (weeks +2 to +6). The unit of
observation is the county-week. We first estimate propensity scores using a one period logistic regression. We then weight the DD regression by
the interaction of the county population and the inverse probability weight (IPW). All regressions include state fixed effects, county fixed effects,
calendar week fixed effects and controls for state time varying covid-19 policies. Standard errors are clustered by county and all estimates are
weighted by the county population. For each outcome variable, log hospitalizations or per 100k hospitalizations, we present estimates for 5
samples. First, we show estimates for all counties which instruction modality information. Second, we present estimates for counties in the bottom
57th percentile, 58th to 75th percentile, 75th to 90th and 90th plus of baseline log hospitalizations (March 2020 to July 2020). ** indicates 0.01 <
p-value <=0.05, *** indicates 0.001< p-value <=0.01
Panel D: 76th - 90th Percentile MCH Burbio MCH Burbio
Share In-Person/Hybrid x T-10 to T-5 -0.015 -0.319 -0.061 -0.051
(0.136) (0.185) (0.040) (0.053)
Share In-Person/Hybrid x T+2 to T+6 0.263** 0.281 0.079* 0.039
(0.086) (0.159) (0.035) (0.038)
Mean Dependent Var 13.52 14.61
Number of Observations 6,481 8,313 6,481 8,313
Panel E: > 90th Percentile MCH Burbio MCH Burbio
Share In-Person/Hybrid x T-10 to T-5 1.385 -0.724 0.048 0.024
(1.311) (0.808) (0.043) (0.046)
Share In-Person/Hybrid x T+2 to T+6 1.513* 0.648 0.005 0.007
(0.690) (0.423) (0.047) (0.056)
Mean Dependent Var 82.58 81.63
Number of Observations 4,594 4,738 4,594 4,738
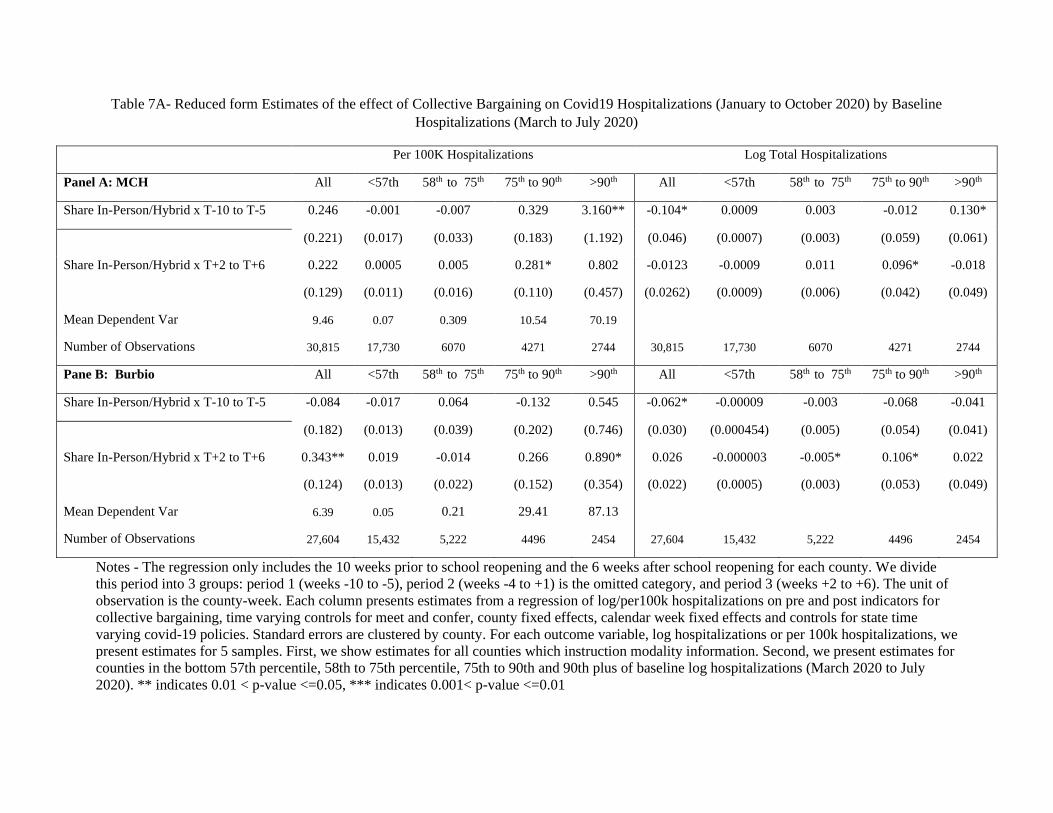
Table 7A- Reduced form Estimates of the effect of Collective Bargaining on Covid19 Hospitalizations (January to October 2020) by Baseline
Hospitalizations (March to July 2020)
Notes - The regression only includes the 10 weeks prior to school reopening and the 6 weeks after school reopening for each county. We divide
this period into 3 groups: period 1 (weeks -10 to -5), period 2 (weeks -4 to +1) is the omitted category, and period 3 (weeks +2 to +6). The unit of
observation is the county-week. Each column presents estimates from a regression of log/per100k hospitalizations on pre and post indicators for
collective bargaining, time varying controls for meet and confer, county fixed effects, calendar week fixed effects and controls for state time
varying covid-19 policies. Standard errors are clustered by county. For each outcome variable, log hospitalizations or per 100k hospitalizations, we
present estimates for 5 samples. First, we show estimates for all counties which instruction modality information. Second, we present estimates for
counties in the bottom 57th percentile, 58th to 75th percentile, 75th to 90th and 90th plus of baseline log hospitalizations (March 2020 to July
2020). ** indicates 0.01 < p-value <=0.05, *** indicates 0.001< p-value <=0.01
Per 100K Hospitalizations Log Total Hospitalizations
Panel A: MCH All <57th 58th to 75th 75th to 90th >90th All <57th 58th to 75th 75th to 90th >90th
Share In-Person/Hybrid x T-10 to T-5 0.246 -0.001 -0.007 0.329 3.160** -0.104* 0.0009 0.003 -0.012 0.130*
(0.221) (0.017) (0.033) (0.183) (1.192) (0.046) (0.0007) (0.003) (0.059) (0.061)
Share In-Person/Hybrid x T+2 to T+6 0.222 0.0005 0.005 0.281* 0.802 -0.0123 -0.0009 0.011 0.096* -0.018
(0.129) (0.011) (0.016) (0.110) (0.457) (0.0262) (0.0009) (0.006) (0.042) (0.049)
Mean Dependent Var 9.46 0.07 0.309 10.54 70.19
Number of Observations 30,815 17,730 6070 4271 2744 30,815 17,730 6070 4271 2744
Pane B: Burbio All <57th 58th to 75th 75th to 90th >90th All <57th 58th to 75th 75th to 90th >90th
Share In-Person/Hybrid x T-10 to T-5 -0.084 -0.017 0.064 -0.132 0.545 -0.062* -0.00009 -0.003 -0.068 -0.041
(0.182) (0.013) (0.039) (0.202) (0.746) (0.030) (0.000454) (0.005) (0.054) (0.041)
Share In-Person/Hybrid x T+2 to T+6 0.343** 0.019 -0.014 0.266 0.890* 0.026 -0.000003 -0.005* 0.106* 0.022
(0.124) (0.013) (0.022) (0.152) (0.354) (0.022) (0.0005) (0.003) (0.053) (0.049)
Mean Dependent Var 6.39 0.05 0.21 29.41 87.13
Number of Observations 27,604 15,432 5,222 4496 2454 27,604 15,432 5,222 4496 2454

Table 7B- Reduced form Estimates of the effect of Meet and Confer on Covid19 Hospitalizations (January to October 2020) by Baseline
Hospitalizations (March to July 2020)
Notes - The regression only includes the 10 weeks prior to school reopening and the 6 weeks after school reopening for each county. We divide
this period into 3 groups: period 1 (weeks -10 to -5), period 2 (weeks -4 to +1) is the omitted category, and period 3 (weeks +2 to +6). The unit of
observation is the county-week. Each column presents estimates from a regression of log/per100k hospitalizations on pre and post indicators for
meet and confer, time varying controls for collective bargiing, county fixed effects, calendar week fixed effects and controls for state time varying
covid-19 policies. Standard errors are clustered by county. For each outcome variable, log hospitalizations or per 100k hospitalizations, we present
estimates for 5 samples. First, we show estimates for all counties which instruction modality information. Second, we present estimates for
counties in the bottom 57th percentile, 58th to 75th percentile, 75th to 90th and 90th plus of baseline log hospitalizations (March 2020 to July
2020). ** indicates 0.01 < p-value <=0.05, *** indicates 0.001< p-value <=0.01
Per 100K Hospitalizations Log Total Hospitalizations
Panel A: MCH All <57th 58th to 75th 75th to 90th >90th All <57th 58th to 75th 75th to 90th >90th
Share In-Person/Hybrid x T-10 to T-5 -0.906 -0.089 -0.019 0.463 -1.372 -0.133 -0.00008 0.004 -0.028 -0.149
(0.838) (0.048) (0.059) (0.281) (2.733) (0.093) (0.001) (0.003) (0.071) (0.076)
Share In-Person/Hybrid x T+2 to T+6 -1.072 0.058 0.111 0.017 -2.791 -0.069 -0.002 0.004 0.009 -0.172*
(0.747) (0.037) (0.061) (0.180) (2.169) (0.063) (0.002) (0.004) (0.106) (0.076)
Mean Dependent Var 9.46 0.07 0.309 10.54 70.19
Number of Observations 30,815 17,730 6070 4271 2744 30,815 17,730 6070 4271 2744
Pane B: Burbio All <57th 58th to 75th 75th to 90th >90th All <57th 58th to 75th 75th to 90th >90th
Share In-Person/Hybrid x T-10 to T-5 0.111 -0.007 -0.007 0.150 -1.694 0.042 0.0006 0.004 -0.093 0.008
(0.283) (0.015) (0.067) (0.212) (1.017) (0.043) (0.001) (0.003) (0.087) (0.069)
Share In-Person/Hybrid x T+2 to T+6 -0.147 0.041 0.024 -0.057 -1.338 -0.009 -0.003 0.0004 -0.012 -0.071
(0.191) (0.033) (0.019) (0.242) (0.766) (0.024) (0.002) (0.001) (0.064) (0.056)
Mean Dependent Var 6.39 0.05 0.21 29.41 87.13
Number of Observations 27,604 15,432 5,222 4496 2454 27,604 15,432 5,222 4496 2454

Table 8 – IV Estimates of the Hybrid/In-Person Teaching on Covid19 Hospitalizations (January to October 2020) by Baseline Hospitalizations
(March to July 2020)
Notes – The regression only includes the 10 weeks prior to school reopening and the 6 weeks after school reopening for each county. We divide
this period into 3 groups: period 1 (weeks -10 to -5), period 2 (weeks -4 to +1) is the omitted category, and period 3 (weeks +2 to +6). The unit of
observation is the county-week. The first stage is estimated from a one-period county level model of share in hybrid/in person on share of teachers
in collective bargaining and share of teachers in meet and confer unions, and state fixed effects (see first stage in Table 3). Accordingly, the second
stage estimates the effect of predicted share of students in hybrid/in person X post-school reopening periods on hospitalizations, county fixed
effects, calendar week fixed effects and controls for state time varying covid-19 policies. Standard errors are clustered by county and obtained for
the aggregate effect using block bootstrap (500 replications). For each outcome variable, log hospitalizations or per 100k hospitalizations, we
present estimates for 5 samples. First, we show estimates for all counties which instruction modality information. Second, we present estimates for
counties in the bottom 57th percentile, 58th to 75th percentile, 75th to 90th and 90th plus of baseline log hospitalizations (March 2020 to July
2020). ** indicates 0.01 < p-value <=0.05, *** indicates 0.001< p-value <=0.01
Per 100K Hospitalizations Log Total Hospitalizations
Panel A: MCH All <57th 58th to 75th 75th to 90th >90th All <57th 58th to 75th 75th to 90th >90th
Share In-Person/Hybrid x T-10 to T-5 -0.180
(0.687)
-0.003
(0.005)
0.128
(0.125)
-0.085
(0.508)
8.618***
(2.197)
-0.184***
(0.072)
-0.0001
(0.0003)
0.007
(0.010)
0.131
(0.168)
-0.005
(0.124)
Share In-Person/Hybrid x T+2 to T+6 0.329
(0.539)
0.002
(0.004)
0.058
(0.072)
0.191
(0.455)
5.767***
(1.718)
-0.207**
(0.084)
0.0001
(0.0004)
-0.008
(0.006)
0 .049
(0.129)
0.041
(0.153)
Mean Dependent Var 9.46 0.07 0.309 10.54 70.19
Number of Observations 30,815 17,730 6070 4271 2744 30,815 17,730 6070 4271 2744
Pane B: Burbio All <57th 58th to 75th 75th to 90th >90th All <57th 58th to 75th 75th to 90th >90th
Share In-Person/Hybrid x T-10 to T-5 0.564
(0.873)
0.004
(0.006)
-0.058
(0.101)
-0.269
(0.807)
3.862
(3.164)
-0.016
(0.095)
-0.0001
(0.0002)
-0.025
(0.013)
0.114
(0.195)
-0.212
(0.170)
Share In-Person/Hybrid x T+2 to T+6 -0.886
(0.457)
-0.022
(0.018)
-0.110**
(0.057)
-1.312**
(0.582)
-3.302
(1.942)
-0.091
(0.084)
-0.0006
(0.0005)
-0.009
(0.009)
-0.572***
(0.190)
-0.250
(0.152)
Mean Dependent Var 6.39 0.05 0.21 29.41 87.13
Number of Observations 27,604 15,432 5,222 4496 2454 27,604 15,432 5,222 4496 2454

Figure 1- Covid-19 Hospitalizations Per 100k From Claims
Notes - Figure1(i) presents the trend in hospitalizations per 100K from Change Healthcare claims data. Figure 1(ii)
presents the trend in hospitalizations per 100K from the CDC COVID-NET data. COVID-NET comprises 99
counties in the 14 states participating in the Emerging Infections Program (EIP) and the Influenza Hospitalization
Surveillance Project (IHSP). Participating states include: California, Colorado, Connecticut, Georgia, Iowa,
Maryland, Michigan, Minnesota, New Mexico, New York, Ohio, Oregon, Tennessee, and Utah. COVID-NET
covers approximately 10 percent of the U.S. population. For population representation from each state in COVID-
NET see: https://www.cdc.gov/coronavirus/2019-ncov/covid-data/covid-net/purpose-
methods.html#:~:text=COVID%2DNET%20coverage&text=Participating%20states%20include%3A%20California
%2C%20Colorado,percent%20of%20the%20U.S.%20population. Figure 1 (iii) presents trends in hospitalizations
per 100k from data released by the Department of Health and Human Services on Dec 7th, 2020. The data is a
nationwide dataset of the number of admissions for covid-19 confirmed and suspected cases at the facility level. The
HHS data published begins on week 31 of 2002 (week of July 31st) and is updated daily. The term “suspected” is
defined as a person who is being managed as though he/she has COVID19 because of signs and symptoms
suggestive of COVID-19 as described by CDC’s Guidance but does not have a laboratory positive COVID19 test
result. This may include patients who have not been tested or those with pending test results. The count may also
include patients with negative test results but whom continue to show signs/symptoms suggestive of COVID-19.
Change Health Claims COVID-NET CDC
HHS Data Released Dec 7th, 2020
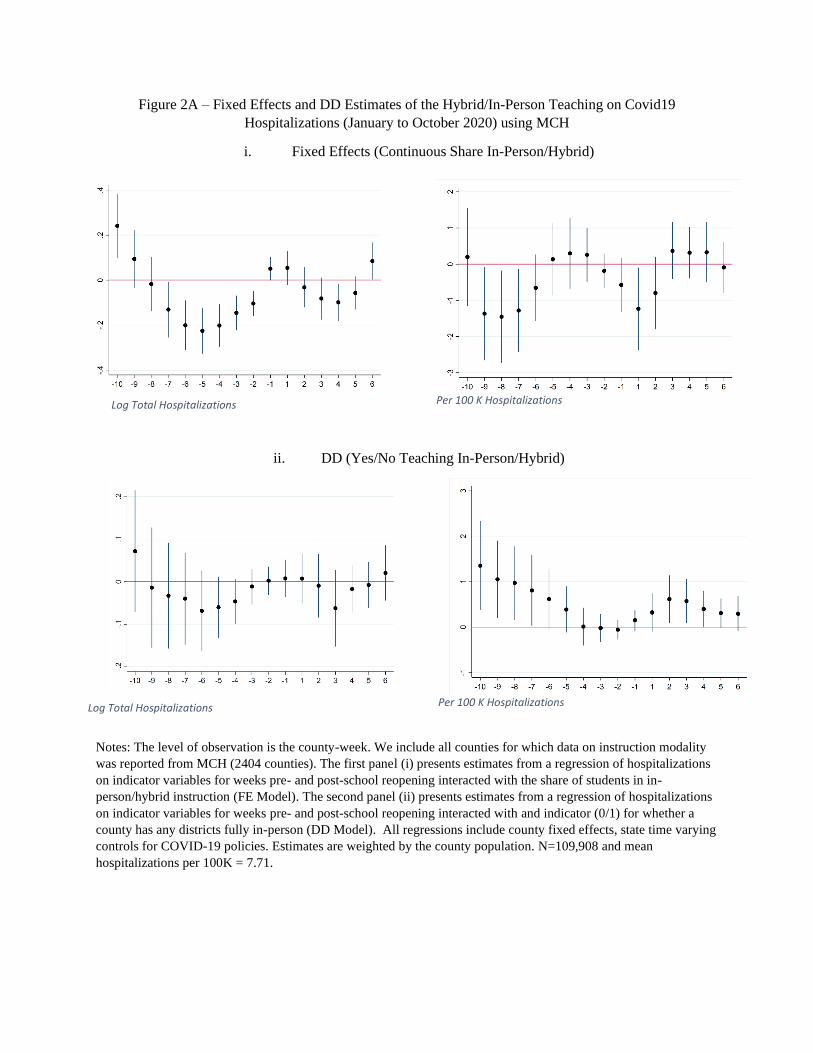
Figure 2A – Fixed Effects and DD Estimates of the Hybrid/In-Person Teaching on Covid19
Hospitalizations (January to October 2020) using MCH
i. Fixed Effects (Continuous Share In-Person/Hybrid)
ii. DD (Yes/No Teaching In-Person/Hybrid)
Notes: The level of observation is the county-week. We include all counties for which data on instruction modality
was reported from MCH (2404 counties). The first panel (i) presents estimates from a regression of hospitalizations
on indicator variables for weeks pre- and post-school reopening interacted with the share of students in in-
person/hybrid instruction (FE Model). The second panel (ii) presents estimates from a regression of hospitalizations
on indicator variables for weeks pre- and post-school reopening interacted with and indicator (0/1) for whether a
county has any districts fully in-person (DD Model). All regressions include county fixed effects, state time varying
controls for COVID-19 policies. Estimates are weighted by the county population. N=109,908 and mean
hospitalizations per 100K = 7.71.
Log Total Hospitalizations Per 100 K Hospitalizations
Log Total Hospitalizations Per 100 K Hospitalizations

Figure 2B – Fixed Effects and DD Estimates of the Hybrid/In-Person Teaching on Covid19
Hospitalizations (January to October 2020) using Burbio
(i) Fixed Effects (Continuous Share In-Person/Hybrid)
(ii) DD (Yes/No Teaching In-Person/Hybrid)
Notes – See notes to Figure 2A. This table is the same except for the use of the Burbio data. N=103,415 and mean
hospitalizations per 100K=6.69.
Log Total Hospitalizations
Log Total Hospitalizations
Per 100 K Hospitalizations
Per 100 K Hospitalizations

Figure 3A– Reduced Form Event Study Coefficients for the effect of Teacher Union Collective
Bargaining and Meet and Confer on Log Total Covid19 Hospitalizations (MCH)
(i) Collective Bargaining
(ii) Meet and Confer
Notes The unit of observation is the county-week. The estimates are from a regression of log hospitalizations/per
100k hospitalizations on indicator variables for 10 weeks pre through 6 weeks post school reopening, where we
allow the effect to differ by whether the county has collective bargaining or meet and confer unions. All regressions
include county fixed effects, calendar week fixed effects and controls for state time varying COVID-19 policies.
Standard errors are clustered by county. First, we show estimates for all counties which instruction modality
information. Second, we present estimates for counties in the bottom 57th percentile, 58th to 75th percentile, 75th to
90th and 90th plus of baseline log hospitalizations (March 2020 to July 2020).

Figure 3B– Reduced Form Event Study Coefficients for the effect of Teacher Union Collective
Bargaining and Meet and Confer on Per 100k Covid19 Hospitalizations (MCH)
(i) Collective Bargaining
(ii) Meet and Confer
Notes - See notes to Figure 3A. This table is the same except for the use of hospitalizations per 100k. Sample means
are reported in Tables 7A and 7B

Figure 3C– Reduced Form Event Study Coefficients for the effect of Teacher Union Collective Bargaining and Meet
and Confer on Log Total Covid19 Hospitalizations (Burbio)
(i) Collective Bargaining
(ii) Meet and Confer
Notes - See notes to Figure 3A. This table is the same except for the use of Burbio data. Sample means are reported
in Tables 7A and 7B
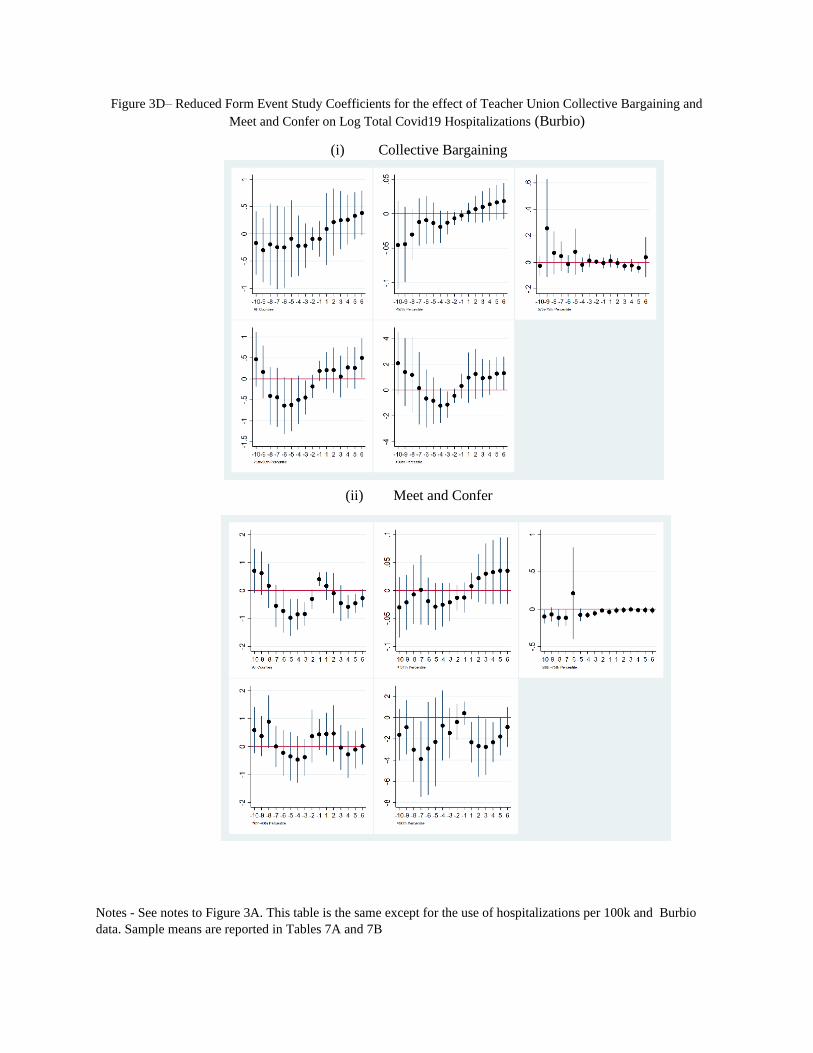
Figure 3D– Reduced Form Event Study Coefficients for the effect of Teacher Union Collective Bargaining and
Meet and Confer on Log Total Covid19 Hospitalizations (Burbio)
(i) Collective Bargaining
(ii) Meet and Confer
Notes - See notes to Figure 3A. This table is the same except for the use of hospitalizations per 100k and Burbio
data. Sample means are reported in Tables 7A and 7B

Figure 4A– IV-Event Study Coefficients for the effect of Share hybrid/in-person on Log Total Covid19
Hospitalizations (MCH)
Notes - The unit of observation is the county-week. The figure presents IV coefficients for 10 weeks pre
through 6 weeks post school reopening. The first stage is estimated from a one period county level model
of share in hybrid/in person on share of teachers in collective bargaining and share of teachers in meet and
confer unions, and state fixed effects (see first stage in Table 3). Accordingly, the second stage estimates
the effect of predicted share of students in hybrid/in person X post-school reopening periods on
hospitalizations, county fixed effects, calendar week fixed effects and controls for state time varying
COVID-19 policies. Standard errors are clustered by county and obtained for the aggregate effect using
block bootstrap (500 replications). We present estimates for 5 samples. First, we show estimates for all
1807 counties which have union information, hospitalizations data, and share of students in hybrid/in
person learning. Second, we present estimates for counties in the bottom 57th percentile, 58th to 75th
percentile, 75th to 90th and 90th plus of baseline log hospitalizations (March 2020 to July 2020). **
indicates 0.01 < p-value <=0.05, *** indicates 0.001< p-value <=0.01
.
<57th Percentile 58th to 75th Percentile
76th to 90th Percentile > 90th percentile

Figure 4B– IV -Event Study Coefficients for the effect of Share hybrid / In-person on Per 100K Covid19
Hospitalizations (MCH)
76th to 90th Percentile
Notes – See notes to Figure 4A. These are the same except Figure 3B uses Per 100K as the outcome
variable. ** indicates 0.01 < p-value <=0.05, *** indicates 0.01<= p-value <0.001.
<57th Percentile 58th to 75th Percentile
> 90th percentile

Figure 4C: IV-Event Study Coefficients for the Effect of Share Hybrid/In-person on Log Total
Hospitalizations (Burbio)
Notes: See notes to Figure 4A. Figure 4C is the same except this figure uses the burbio data. ** indicates
0.01 < p-value <=0.05, *** indicates 0.01<= p-value <0.001.
<57th Percentile <58th to 75th Percentile
76th to 90th percentile >90th percentile
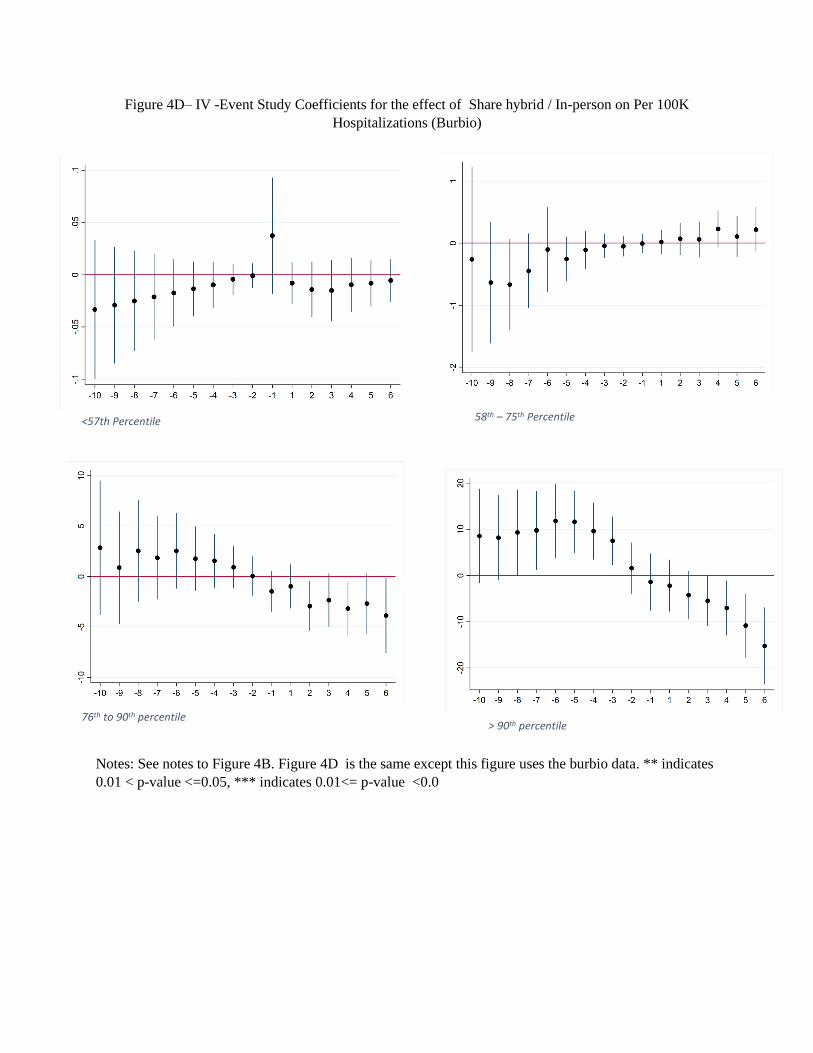
Figure 4D– IV -Event Study Coefficients for the effect of Share hybrid / In-person on Per 100K
Hospitalizations (Burbio)
Notes: See notes to Figure 4B. Figure 4D is the same except this figure uses the burbio data. ** indicates
0.01 < p-value <=0.05, *** indicates 0.01<= p-value <0.0
<57th Percentile 58th – 75th Percentile
76th to 90th percentile > 90th percentile

Appendix Table 1- School Reopening Mode Transition Matrix
Notes: This table shows the percent of districts that started school in the mode show in the left
column (time t) and how this compared to their mode as of October 10 (t+1).
Hybrid (Oct.10) On Premises (Oct.10) Online Only (Oct.10) Other (Oct.10)
Hybrid
(Start school year)
37.47% 8.61% 5.41% 1.68%
On Premises
(Start school year)
7.27% 11.48% 1.47% 0.40%
Online Only
(Start school year)
6.98% 1.65% 15.33% 0.29%
Other
(Start school year)
1.15% 0.25% 0.29% 0.26%

Appendix Table 2 - Propensity Score Matching Difference in Differences Estimates of the
Hybrid/In-Person Teaching on Covid19 Hospitalizations (January to October 2020) Log vs
Inverse Hyperbolic Sine Function
Notes – See notes to Table 6. This model is the same except we transform the dependent variable using Log (Y+ 1)
and using the inverse hyperbolic sine function to compare. ** indicates 0.01 < p-value <=0.05, *** indicates
0.01<= p-value <0.001.
Inverse Hyperbolic Sine
Function
Log (Y+1)
Panel A. All Counties MCH Burbio MCH Burbio
Share In-Person/Hybrid x T-10 to T-5 -0.072 0.016 -0.063 0.012
(0.037) (0.024) (0.035) (0.024)
Share In-Person/Hybrid x T+2 to T+6 0.001 -0.006 -0.019 -0.005
(0.027) (0.019) (0.028) (0.016)
Number of Observations 51,274 59,452 51,274 59,452
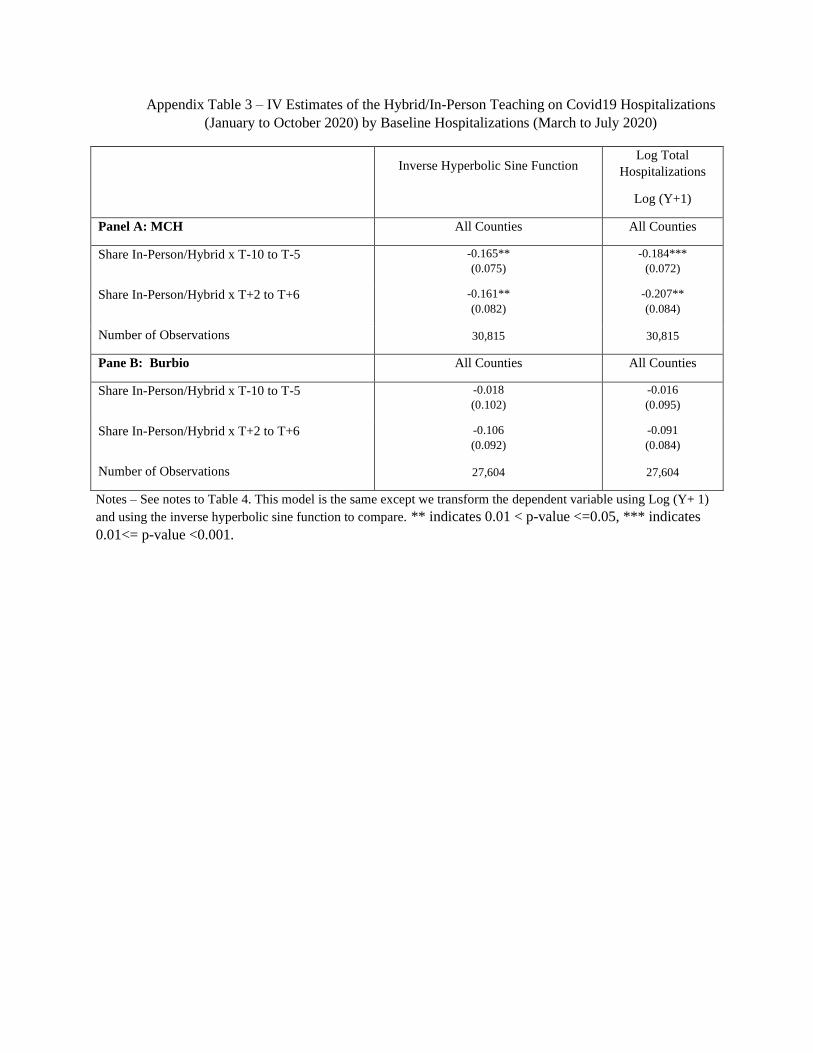
Appendix Table 3 – IV Estimates of the Hybrid/In-Person Teaching on Covid19 Hospitalizations
(January to October 2020) by Baseline Hospitalizations (March to July 2020)
Notes – See notes to Table 4. This model is the same except we transform the dependent variable using Log (Y+ 1)
and using the inverse hyperbolic sine function to compare. ** indicates 0.01 < p-value <=0.05, *** indicates
0.01<= p-value <0.001.
Inverse Hyperbolic Sine Function
Log Total
Hospitalizations
Log (Y+1)
Panel A: MCH All Counties All Counties
Share In-Person/Hybrid x T-10 to T-5 -0.165**
(0.075)
-0.184***
(0.072)
Share In-Person/Hybrid x T+2 to T+6 -0.161**
(0.082)
-0.207**
(0.084)
Number of Observations 30,815 30,815
Pane B: Burbio All Counties All Counties
Share In-Person/Hybrid x T-10 to T-5 -0.018
(0.102)
-0.016
(0.095)
Share In-Person/Hybrid x T+2 to T+6 -0.106
(0.092)
-0.091
(0.084)
Number of Observations 27,604 27,604

Appendix Table 4- Propensity Score Matching Difference in Differences Estimates of the
Hybrid/In-Person Teaching on Covid19 Hospitalizations (January to October 2020) with Controls
for College Opening Modality and Time
Notes – See notes to Table 6. Here we compare the model in table 6 to another model where we add time varying
controls for hybrid/In-Person college reopening in the county . ** indicates 0.01 < p-value <=0.05, ***
indicates 0.01<= p-value <0.001.
Panel A: MCH Per 100K
Hospitalizations
Per 100K
Hospitalizations
Log Total
Hospitalizations
Log Total
Hospitalizations
Share In-Person/Hybrid x T-10 to T-5 -0.078
(0.252)
0.053
(0.253)
-0.063
(0.035)
-0.083*
(0.033)
Share In-Person/Hybrid x T+2 to T+6 0.295
(0.187)
0.258
(0.149)
-0.019
(0.028)
-0.020
(0.027)
Mean Dependent Var 7.24 7.24
Controls for Hybrid/In- person College
Reopening
NO YES NO YES
Number of Observations 51,274 51,274 51,274 51,274
Pane B: Burbio
Share In-Person/Hybrid x T-10 to T-5 -0.250
(0.229)
-0.083
(0.178)
0.012
(0.024)
0.005
(0.020)
Share In-Person/Hybrid x T+2 to T+6 0.133
(0.114)
0.073
(0.097)
-0.005
(0.016)
-0.006
(0.018)
Mean Dependent Var 9.79 7.24
Controls for Hybrid/In- person College
Reopening
NO YES NO YES
Number of Observations 59,452 59,452 59,452 59,452

Appendix Table 5- Effect of K-12 Teacher Union Power on College Reopening Modality
Notes – The level of observation is the county. The table reports estimate from a regression of whether a
county has a college that opened with in-person/hybrid instruction on on two measures of K-12 teacher
unionization (see notes to Table 2 for details). Hybrid/in-person is defined as zero if the county does not
have a college or does not have a college that offered in-person/hybrid instruction. ** indicates 0.01 < p-
value <=0.05, *** indicates 0.01<= p-value <0.001.
College Hybrid /In Person
Share of Collective Bargaining Union -0.037
(0.071)
Share of Meet and Confer Union -0.041
(0.103)
F-statistic for Joint Significance 0.850
Mean Dep Variable 0.180
Number of Obsv. (counties) 1809
adj. R-sq 0.07

Appendix Table 6 – IV Estimates of the Hybrid/In-Person Teaching on Covid19 Hospitalizations (January to October 2020) by Baseline
Hospitalizations (March to July 2020) with Controls for College Opening Modality and Time
Notes – See notes to Table 4. Here we compare the model in table 4 to another model where we add time varying controls for hybrid/In-Person college reopening
in the county. ** indicates 0.01 < p-value <=0.05, *** indicates 0.01<= p-value <0.001.
Panel A: MCH Per 100K
Hospitalizations
Per 100K
Hospitalizations
Log Total
Hospitalizations
Log Total
Hospitalizations
Share In-Person/Hybrid x T-10 to T-5 -0.180
(0.687)
0.607
(0.680)
-0.184***
(0.072)
-0.165**
(0.076)
Share In-Person/Hybrid x T+2 to T+6 0.329
(0.539)
0.268
(0.534)
-0.207**
(0.084)
-0.187**
(0.084)
Mean Dependent Var 9.46 9.46
Controls for Hybrid/In- person College Reopening NO YES NO YES
Number of Observations 30,815 30,815 30,815 30,815
Pane B: Burbio All All
Share In-Person/Hybrid x T-10 to T-5 0.564
(0.873)
0.372
(0.946)
-0.016
(0.095)
0.265*
(0.104)
Share In-Person/Hybrid x T+2 to T+6 -0.886
(0.457)
-0.883
(0.589_
-0.091
(0.084)
-0.131
(0.081)
Mean Dependent Var 6.39 6.39
Controls for Hybrid/In- person College Reopening NO YES NO YES
Number of Observations 27,604 27,604 27,604 27,604

Appendix Table 7- Propensity Score Matching Difference in Differences Estimates of the Hybrid/In-Person Teaching on Covid19
Hospitalizations (January to October 2020)
Notes – See notes to Table 6. This model is the same except we add estimates from a Poisson model. ** indicates 0.01 < p-value <=0.05, *** indicates
0.01<= p-value <0.001.
Per 100 K
Log Total
Hospitalizations
Poisson Model
Panel A. All Counties MCH Burbio MCH Burbio MCH Burbio
Share In-Person/Hybrid x T-10 to T-5 -0.078 -0.250 -0.063 0.012 0.058 -0.042
(0.252) (0.229) (0.035) (0.024) (0.042) (0.045)
Share In-Person/Hybrid x T+2 to T+6 0.295 0.133 -0.019 -0.005 0.042 0.008
(0.187) (0.114) (0.028) (0.016) (0.065) (0.040)
Mean Dependent Variable 7.24 9.79 3.61 3.44
Number of Observations 51,274 59,452 51,274 59,452 51,274 59,452

Appendix Table 8 – IV Estimates of the Hybrid/In-Person Teaching on Covid19 Hospitalizations (January to October 2020) by Baseline
Hospitalizations (March to July 2020)
Notes – See notes to Table 8. Here we compare the model in table 4 to another model where we add time varying controls for hybrid/In-Person college reopening
in the county . ** indicates 0.01 < p-value <=0.05, *** indicates 0.01<= p-value <0.001.
Panel A: MCH Per 100K
Hospitalizations
Log Total
Hospitalizations
Poisson Model
Total Hospitalizations
Share In-Person/Hybrid x T-10 to T-5 -0.180
(0.687)
-0.184***
(0.072)
0.152
(0.180)
Share In-Person/Hybrid x T+2 to T+6 0.329
(0.539)
-0.207**
(0.084)
0.143
(0.230)
Mean Dependent Var 9.46 4.12
Number of Observations 30,815 30,815 30,815
Pane B: Burbio All All
Share In-Person/Hybrid x T-10 to T-5 0.564
(0.873)
-0.016
(0.095)
0.589***
(0.176)
Share In-Person/Hybrid x T+2 to T+6 -0.886
(0.457)
-0.091
(0.084)
-0.010
(0.220)
Mean Dependent Var 6.39 4.14
Number of Observations 27,604 27,604 27,604
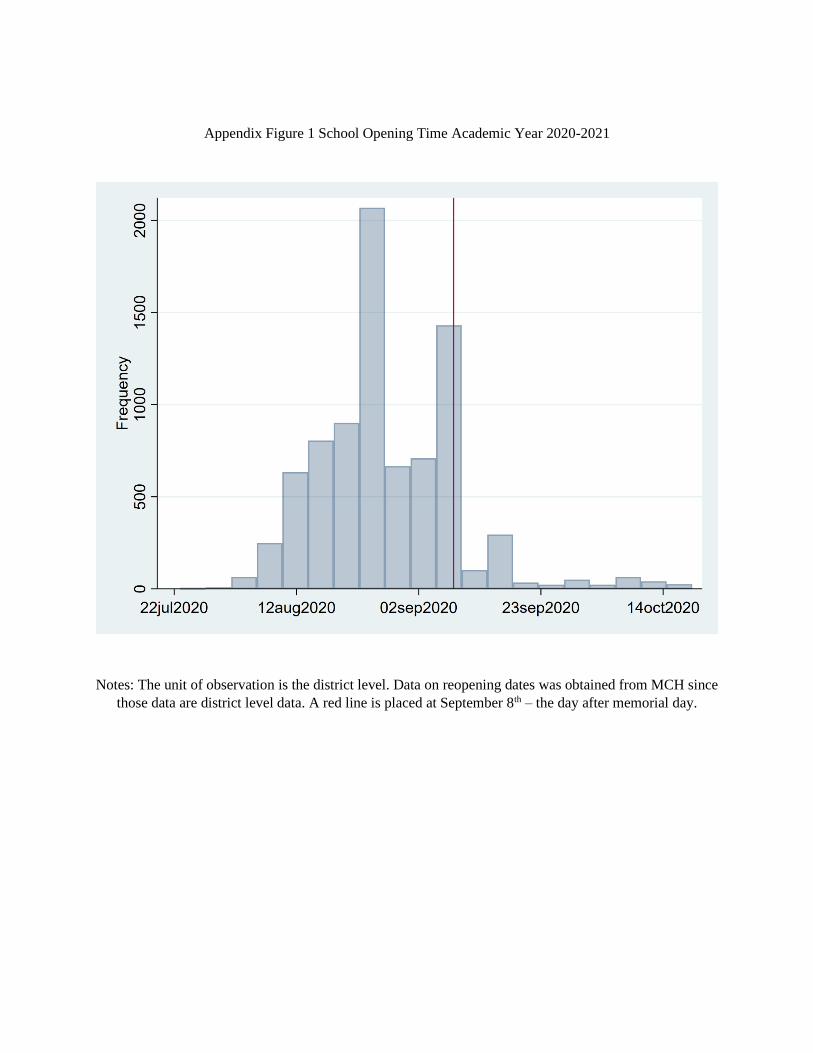
Appendix Figure 1 School Opening Time Academic Year 2020-2021
Notes: The unit of observation is the district level. Data on reopening dates was obtained from MCH since
those data are district level data. A red line is placed at September 8th – the day after memorial day.

Appendix Figure 2- Average Covid-19 Hospitalizations Per 100k Prior to Schools’ Reopening (March to
July 2020) and Teacher Union Presence
Notes: The unit of observation is the county. Appendix Figure 1(i) presents the baseline (Feb to July
2020) hospitalization per 100k rate in a county on the y-axis and the share of collective bargaining in the
county at baseline on the x-axis. Similarly, Appendix Figure 1(ii) presents the baseline (Feb to July 2020)
hospitalization per 100k rate in a county on the y-axis and the share of meet and confer in the county at
baseline on the x-axis.

Appendix Figure 3- Mobility and Teacher Union Presence Over Time
Notes: The unit of observation is the week. The vertical line indicates the week of March 13th when the
Covid-19 federal emergency declaration was implemented. Appendix Figure 1(i) presents the average Dex
mobility index (from PlaceIQ) on the y-axis and the calendar-week on the x-axis. We present one trend line
for counties with more than 50 percent in collective bargaining unions and counties with less than 50 percent
in collective bargaining unions. Appendix Figure 1(ii) is analogous, except focusing on meet and confer.
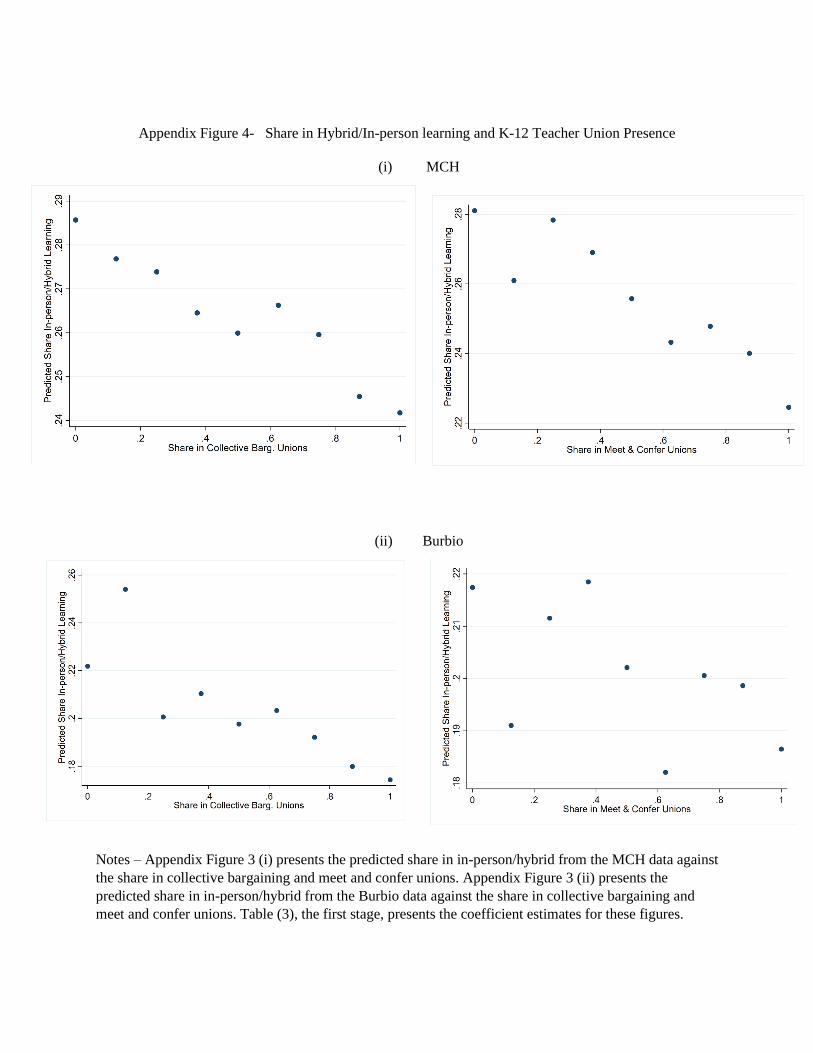
Appendix Figure 4- Share in Hybrid/In-person learning and K-12 Teacher Union Presence
(i) MCH
(ii) Burbio
Notes – Appendix Figure 3 (i) presents the predicted share in in-person/hybrid from the MCH data against
the share in collective bargaining and meet and confer unions. Appendix Figure 3 (ii) presents the
predicted share in in-person/hybrid from the Burbio data against the share in collective bargaining and
meet and confer unions. Table (3), the first stage, presents the coefficient estimates for these figures.

Appendix Figure 5A (i) DD Estimates of the Hybrid/In-Person Teaching on Log Total Covid19
Hospitalizations (January to October 2020) using MCH by Baseline Hospitalizations
<57th Percentile 58th to 75th Percentile
76th to 90th Percentile > 90th Percentile

Appendix Figure 5B (ii) DD Estimates of the Hybrid/In-Person Teaching on Per 100 K Covid19
Hospitalizations (January to October 2020) using MCH by Baseline Hospitalizations
<57th Percentile <58th to 75th Percentile
76th to 9 0th Percentile > 90th Percentile

Appendix Figure 5C (i) –DD Estimates of the Hybrid/In-Person Teaching on Log Total Covid19
Hospitalizations (January to October 2020) using Burbio by Baseline Hospitalizations
<57th Percentile 56th to 75th Percentile
76th to 90th Percentile >9 0th Percentile
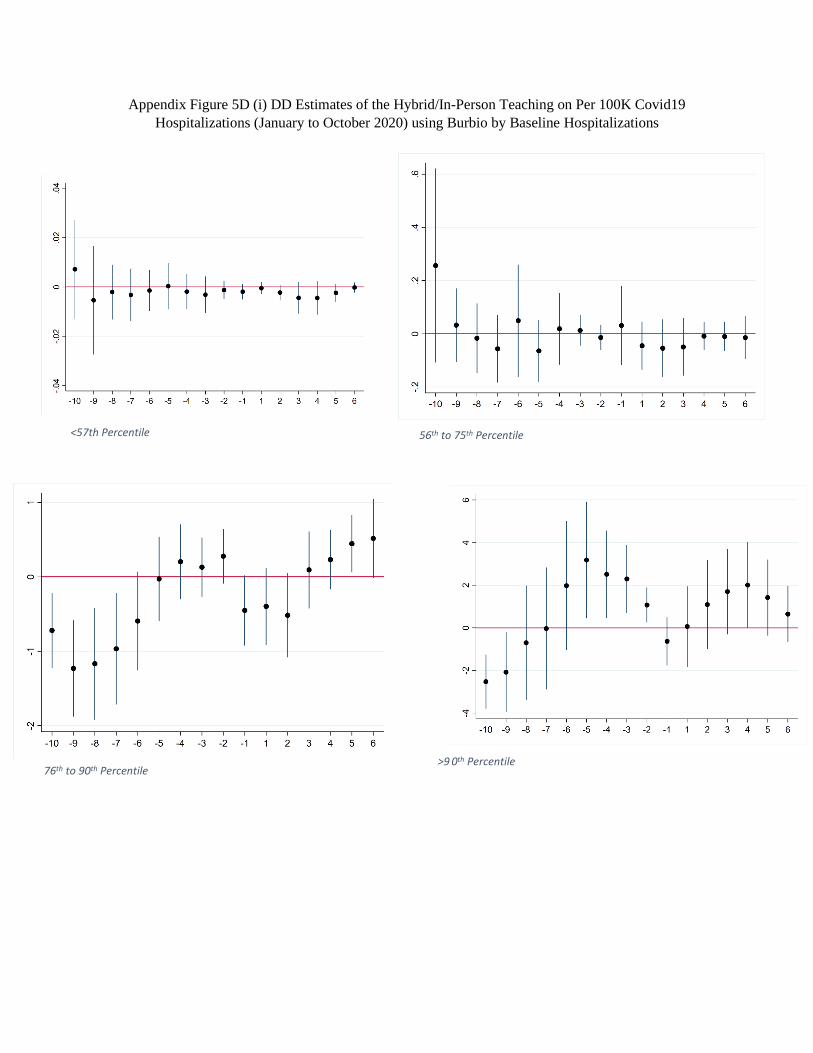
Appendix Figure 5D (i) DD Estimates of the Hybrid/In-Person Teaching on Per 100K Covid19
Hospitalizations (January to October 2020) using Burbio by Baseline Hospitalizations
<57th Percentile 56th to 75th Percentile
76th to 90th Percentile >9 0th Percentile

Appendix Figure 6A – Fixed Effects and DD Estimates of the Hybrid/In-Person Teaching on Covid19
Hospitalizations (January to October 2020) using MCH and Including only the IV Sample of Counties
i. Fixed Effects (Continuous Share In-Person/Hybrid)
ii. DD (Yes/No Teaching In-Person/Hybrid)
Notes: The level of observation is the county-week. We include all counties for which data on instruction modality
was reported from MCH (2,404 counties). The first panel (i) presents estimates from a regression of hospitalizations
on indicator variables for weeks pre- and post-school reopening interacted with the share of students in in-
person/hybrid instruction(FE Model). The second panel (ii) presents estimates from a regression of hospitalizations
on indicator variables for weeks pre and post school reopening interacted with and indicator for whether a county
had any students attending fully in-person (DD Model). All regressions include county fixed effects, state time
varying controls for covid19 policies. Estimates are weighted by the county population.
N=76,725 and mean hospitalizations per 100k=6.87
Log Total Hospitalizations Per 100 K Hospitalizations
Log Total Hospitalizations Per 100 K Hospitalizations

Appendix Figure 6B – Fixed Effects and DD Estimates of the Hybrid/In-Person Teaching on Covid19
Hospitalizations (January to October 2020) using Burbio and Including only the IV sample of counties
(ii) Fixed Effects (Continuous Share In-Person/Hybrid)
(iii) DD (Yes/No Teaching In-Person/Hybrid)
Notes – See notes to Appendix Figure 4A. Appendix Figure 4B is the same except for using Burbio data. N= 69,766
and mean hospitalizations per 100k=6.12
Log Total Hospitalizations
Log Total Hospitalizations
Per 100 K Hospitalizations
Per 100 K Hospitalizations

Appendix Figure 7- State Policies over Time
Notes – the level of observation is the calendar week level. The figure spans early March (week 10) to
later October (week 43). We graph the share of states that enacted stay at home orders, closed and then
re-opened restaurants, closed and then re-opened non-essential business, resumed religious gatherings
after the March 13th federal emergency declaration, and mandated masks.

Appendix Figure 8- DD Estimates of the Hybrid/In-Person Teaching on Log Total Covid19
Hospitalizations (January to October 2020) using MCH by Baseline Hospitalizations and HHS data
<50th percentile 51st – 75th percentile
76th -90th percentile >90th percentile

Appendix Figure 9 - DD Estimates of the Hybrid/In-Person Teaching on Per 100 K Covid19
Hospitalizations (January to October 2020) using MCH by Baseline Hospitalizations and HHS data
<50th percentile 51st – 75th percentile
76th -90th percentile >90th percentile

Appendix Figure 10- DD Estimates of the Hybrid/In-Person Teaching on Log Total Covid19
Hospitalizations (January to October 2020) using Burbio by Baseline Hospitalizations and HHS data
<50th percentile 51st – 75th percentile
76th -90th percentile >90th percentile

Appendix Figure 11- DD Estimates of the Hybrid/In-Person Teaching on Per 100 K Covid19
Hospitalizations (January to October 2020) using Burbio by Baseline Hospitalizations and HHS data
<50th percentile 51st – 75th percentile
76th -90th percentile >90th percentile

Appendix Figure 12- IV-Event Study Coefficients for the effect of Share hybrid/in-person on Log Total
Covid19 Hospitalizations using MCH and HHS data
<50th percentile 51st – 75th percentile
76th -90th >90th percentile

Appendix Figure 13- IV-Event Study Coefficients for the effect of Share hybrid/in-person on Per 100K
Covid19 Hospitalizations using MCH and HHS data
<50th percentile 51st – 75th percentile
76th -90th percentile >90th percentile

Appendix Figure 14- IV-Event Study Coefficients for the effect of Share hybrid/in-person on Log Total
Covid19 Hospitalizations using Burbio and HHS data
<50th percentile 51st – 75th percentile
76th- 90th percentile >90th percentile

Appendix Figure 15- IV-Event Study Coefficients for the effect of Share hybrid/in-person on Per 100K
Covid19 Hospitalizations using Burbio and HHS data
<50th percentile 51st -75th percentile
>90th percentile 76th -90th percentile