The Effects of Replacing Sugars with Agave Nectar … · while agave nectar’s glycemic index...
15
The Effects of Replacing Sugars with Agave Nectar in Snickerdoodle Bars Sarah Muhammad and Paola Washington-Reyes December 1 st , 2014 NUTR 453 Abstract: Due to the fact that agave nectar has a lower glycemic index than both granulated and light brown sugar, it would be a desirable sugar substitute for those who have glucose sensitivities. The experiment was meant to prove that there would be no difference in taste, texture, color, and moisture by replacing granulated sugar or light brown sugar for agave nectar in snickerdoodle bars. Based on subjective and objective data, there was a difference in each of the previously mentioned dependent variables. A recipe for snickerdoodle bars was obtained from an Internet website, which included both granulated sugar and light brown sugar. The experiment included two variables, one that had agave nectar instead of granulated sugar and the other which had agave nectar instead of brown sugar. Following the results, there appears to be a relationship between perceived texture and perceived taste. A desirable texture and a desirable taste usually create an overall determination of appeal. It also appears that a low water activity is related to an overall preference to the product. Further investigation is needed to make cause and effect relationships. Introduction: There has been little research done to determine the effects of agave nectar on the food quality of baked goods. Much of the limited research that is available on agave nectar states that the plant product has a lower glycemic index than many other sweeteners, making it favorable amongst populations who have to control and monitor their blood glucose levels, such as diabetics. The glycemic index for most granulated sugars and brown sugar lies around the range of the 60’s, while agave nectar’s glycemic index tends to fall below 30. There is a common misinterpretation that agave nectar is a low calorie and low carb food when in fact, that is not the case. Agave nectar has a high carbohydrate count per serving, that is still comparable to that of sugar, but this is due to the fact that the main saccharide in agave nectar is fructose. In addition, agave is said to be “1.4 to 1.6 times as sweet as sugar”, meaning that it can be used in smaller quantities than traditional sugars when serving recipe substitutes for sugars (Wall Street Journal, 2009). When consumed in moderate amounts, agave nectar can be nutritionally beneficial for those who need to closely monitor glucose levels. Maillard browning is a major chemical reaction that will occur during this experiment. In the instance of varying carbohydrate sources, the level of browning may vary between the different variables due to the reaction of different simple carbohydrates with amino acids; (traditional granulated sugar typically being composed of 50% glucose, 50% fructose and agave nectar being predominantly fructose). Understanding this reaction may have an impact on how appearance of the product is perceived, as well as the texture (The Science of Food and Cooking). This experiment looks at the effect of agave nectar on the quality of a baked good as a sugar substitute. Agave nectar has somewhat of a similar consistency to that of honey, albeit being a bit less viscous than honey in texture (All About Agave). Measurement of objective variables (texture, moisture and color) will be compared to the subjective methods (taste and perceived
Transcript of The Effects of Replacing Sugars with Agave Nectar … · while agave nectar’s glycemic index...
The Effects of Replacing Sugars with Agave Nectar in Snickerdoodle Bars
Sarah Muhammad and Paola Washington-Reyes December 1st, 2014
NUTR 453 Abstract: Due to the fact that agave nectar has a lower glycemic index than both granulated and light brown sugar, it would be a desirable sugar substitute for those who have glucose sensitivities. The experiment was meant to prove that there would be no difference in taste, texture, color, and moisture by replacing granulated sugar or light brown sugar for agave nectar in snickerdoodle bars. Based on subjective and objective data, there was a difference in each of the previously mentioned dependent variables. A recipe for snickerdoodle bars was obtained from an Internet website, which included both granulated sugar and light brown sugar. The experiment included two variables, one that had agave nectar instead of granulated sugar and the other which had agave nectar instead of brown sugar. Following the results, there appears to be a relationship between perceived texture and perceived taste. A desirable texture and a desirable taste usually create an overall determination of appeal. It also appears that a low water activity is related to an overall preference to the product. Further investigation is needed to make cause and effect relationships. Introduction: There has been little research done to determine the effects of agave nectar on the food quality of baked goods. Much of the limited research that is available on agave nectar states that the plant product has a lower glycemic index than many other sweeteners, making it favorable amongst populations who have to control and monitor their blood glucose levels, such as diabetics. The glycemic index for most granulated sugars and brown sugar lies around the range of the 60’s, while agave nectar’s glycemic index tends to fall below 30. There is a common misinterpretation that agave nectar is a low calorie and low carb food when in fact, that is not the case. Agave nectar has a high carbohydrate count per serving, that is still comparable to that of sugar, but this is due to the fact that the main saccharide in agave nectar is fructose. In addition, agave is said to be “1.4 to 1.6 times as sweet as sugar”, meaning that it can be used in smaller quantities than traditional sugars when serving recipe substitutes for sugars (Wall Street Journal, 2009). When consumed in moderate amounts, agave nectar can be nutritionally beneficial for those who need to closely monitor glucose levels. Maillard browning is a major chemical reaction that will occur during this experiment. In the instance of varying carbohydrate sources, the level of browning may vary between the different variables due to the reaction of different simple carbohydrates with amino acids; (traditional granulated sugar typically being composed of 50% glucose, 50% fructose and agave nectar being predominantly fructose). Understanding this reaction may have an impact on how appearance of the product is perceived, as well as the texture (The Science of Food and Cooking). This experiment looks at the effect of agave nectar on the quality of a baked good as a sugar substitute. Agave nectar has somewhat of a similar consistency to that of honey, albeit being a bit less viscous than honey in texture (All About Agave). Measurement of objective variables (texture, moisture and color) will be compared to the subjective methods (taste and perceived

texture), in order to create a more nutritious and desirable product. Subjective methods that were used include the hedonic scale and paired preference. Sixteen individuals were asked their opinions regarding their perception of the product and their overall preference. Random numbers were assigned to each variable group. The control, variable 1, and variable 2 were given random numbers so that the subjects could not tell the difference. The control group was the normal recipe with granulated sugar and light brown sugar. Variable 1 contained granulated sugar and agave nectar. Variable 2 contained light brown sugar and agave nectar. For each variable, 1 cup of regular sugar was replaced with 2/3 cup of agave nectar. The independent variable in this study is the type and amount of sugar added. The dependent variables are the calculated and perceived measurements of taste, texture, moisture and color.
Methods: one control recipe (no agave nectar) and 2 variables (with agave nectar) The materials needed for the procedure of this project include the following: 1 can of nonstick cooking spray 3 teaspoons pure vanilla extract 1 cup granulated sugar 2 cups dark-brown sugar 2 cups agave nectar 3 cups of butter (sticks) 6 eggs 1½ teaspoons baking soda 1 ½ teaspoons salt 1 ½ teaspoons cinnamon 7 cups all-purpose flour 3- 13x9 inch metal or glass baking pans 1 set of measuring spoons 1 set dry measuring cups 1-1C liquid measuring cup Rubber scraper Plastic spoon Butter knife
The recipe for snickerdoodle bars is as follows: 2 sticks (1 cup) unsalted butter 1 cup dark-brown sugar 1/2 cup granulated sugar 1/2 teaspoon baking soda 1/2 teaspoon cinnamon 1/2 teaspoon salt 2 large eggs 1 teaspoon pure vanilla extract 2 ¼ cups all-purpose flour 1 teaspoon cinnamon-sugar, to sprinkle on top The ingredients expressed in metric units are as follows: Unsalted butter 236.58g Dark-brown sugar 236.58g Granulated sugar 118.29g Baking soda 2.5g Cinnamon 2.5g Salt 2.5g Eggs 120g Pure vanilla extract 5g All-purpose flour 532.32g
*These recipe measurements above will be used for the control group. For the first variable group, the 236.59g (1 cup) of dark brown sugar will be replaced with 473.18g (2/3 cup) of agave nectar. For the second variable group, the 118.29g (1/2 cup) of granulated sugar will be replaced with 78.86g (1/3 cup) of agave nectar. The idea is that 2/3 cup of agave nectar is equal to 1 cup of sugar due to relative sweetness (Domino, 2011).
Procedure:
Preheat oven to 350°. Take out a nonstick 13-by-9-inch metal baking pan and set aside. Cream butter and sugars with an electric mixer at high speed until fluffy. Add baking soda, cinnamon and salt, then mix at low speed to blend. Add eggs and vanilla extract and beat at medium until just incorporated. Add flour and mix on low speed until blended. Scrape dough into pan, smoothing it in an even layer. Bake until lightly golden and set in center, about 30 minutes. Transfer pan to a rack, and if desired, sprinkle cinnamon-sugar over warm bars, and then let cool completely. Or dust cooled bars with confectioners' sugar. Cut into 40 bars. Objective Testing: The three different variables will be tested for differences in color, moisture and texture with the Hunter colorimeter, water activity system and Brookfield viscometer in STON 227, respectively. The Hunter colorimeter will give a set of three values; L, a, and b, that measures the depth and intensity of color of each of the variables measured. This gives insight into the appearance and desirability of the final product of each variable that goes along with the subjective evaluation and results. The colorimeter runs on a computer program in in the lab and a sample of each variable is placed on a dish for the computer program to run evaluations of color that mimic human perception of color. These tests for each variable are ran three times and the final values are averaged. The water activity system measures the moisture of the sample by placing a small amount (finger pinch) of each variable on a separate dish that fits into the closed apparatus of the system and calculates the moisture levels of each. The drawer for the sample dishes are placed in by opening drawer and then closing and turning knob from “open/load” to “read”. This apparatus needs 15 to 60 minutes to warm up and the dishes cannot be more than half full or the data cannot be recorded. The measures can be recorded once the values for moisture and temperature on the reader are stabilized with 0.0001 apart within typically 5 minutes. These recordings are taken three times for each variable and averaged. Lastly, for the Brookfield viscometer, the program is computer operated and the probe is meant to penetrate the product just enough to measure the overall texture. The texture is measured based on grams of force need for probe penetration. One sample of each variable is measure by placing each one on a dish and setting up a quick test run on the texture analyzer for values. The measures are taken three times, letting the probe penetrate in unpenetrated but close spots to the penetration in the previous trial for consistency in results and the values are averaged. Subjective Testing: The three variables (control, variable 1, variable 2) were assigned numbers; 731, 524, and 849, respectively. They were set out on three different plates with assigned numbers attached. They were evaluated for texture and taste rankings on a 9-point hedonic scale, with 1 being least favorable and 9 being most favorable. They were graded on a rank order test from 1 to 3 with 1 being the most desirable sample and 3 being the least desirable. The subjects were allowed to fill out their results on the tables provided on a laptop for easier data recording.

SAMPLE SCORECARD Hedonic Scale
Mark with an “X” which number 1-9 applies more closely with how you experienced the food texture and taste. There will be a table to fill out for each variable.
Score Rating Texture Taste 9- I like extremely 8- I like very much 7- I like moderately 6- I like slightly 5- I neither like nor dislike 4- I dislike slightly 3- I dislike moderately 2- I dislike very much 1- I dislike extremely
Rank Order Rank the samples in order of preference. 1 being the one you like most and 3 being the one you like least.
524_________
849_________ 731_________
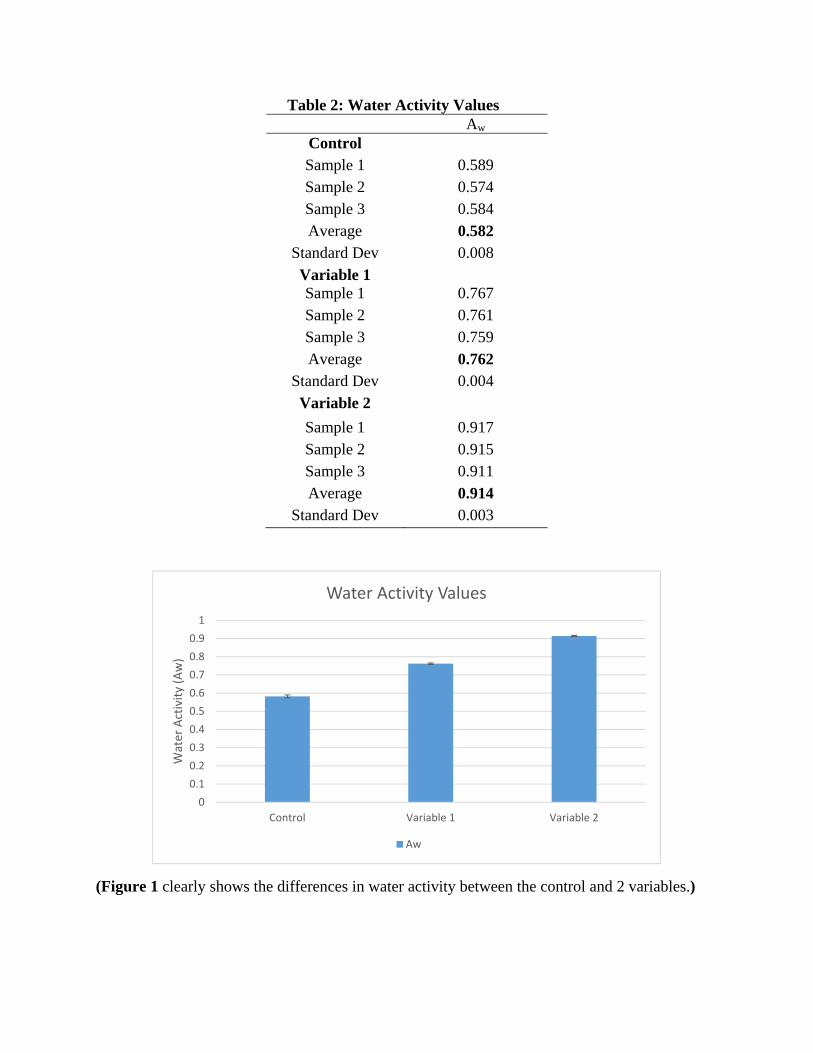
Discussion: Overall, the null hypothesis was disproved, by evidence of varying objective and subject testings results. The addition of agave nectar in replace of a sugar for each of the variables proved a significant difference in taste, texture, moisture level and likability as compared with the control recipe. In order to control confounding variables, only the agave nectar was substituted for one sugar in each variable recipe, while leaving the other the same; therefore the amount of granulated sugar in variable one did not change while the brown sugar was replaced by agave nectar and vice versa for variable 2. The baking procedure was also left the same because the replacement measurements for the agave are usually supposed to be proportional to that of the sugar that it was replacing and therefore, all three variables should baked with the same level of doneness at the same temperatures and times. Texture: The texture of each the control and the variables was probably the most interesting of the results provided. With results from the water activity system and the texture analyzer, we see that replacing the sugars of the product greatly affected texture, moisture and thus desirability. For the control recipe, both granulated and brown sugar are used and for the texture analyzer results, the average value was 1.8g, compared to variable 1 with 1.85g and variable 2 with 22.56g (figure 2). These results cannot be interpreted with the best understanding because the results for variable 2 are so skewed from assumed scientific error. However, it could be assumed that normal results would show that the texture analyzer results for the control value would greater than that of the two variables because it uses two dry ingredients for sugars vs. agave nectar being a liquid sugar and providing a more cakey texture overall and a less brownie like type of the control. The results for the hedonic scale for texture showed that test subjects prefer the traditional recipe, probably attributed to this difference in brownie like texture vs the more cakey texture of variables being more desirable for a “bar” dessert (table 4). The results from the water activity system provide a much better insight into the understanding of texture and palatability. With the average moisture levels of the control, variable 1 and variable 2 being 0.589, 0.767 and 0.917, respectively, it is clear that the varying sugars play a firm role in the moisture content (figure 1). The utilization of two dry sugars provide less moisture to the control group. For variable 1, the water activity levels increase due to the addition of the liquid sugar, agave. For variable 2, they increase even more, because more dry sugar (granulated) is replaced with agave nectar and the higher moisture levels of brown sugar are able to contribute to the water activity as well. Overall, the level of water activity through the addition of agave nectar contritbuting the moisture of the product impacted texture and desirability. Color: The color of the each product was analyzed with the Hunter colorimeter. For the L, a, b values, the L value represents the lightness of the product, the a represents red to green hues and the b represents yellow to blue hues. For the results, variable 2 has higher L values, with an average of 33.53 compared to the control and variable 1 with average values of 26.89 and 28.99, respectively (table 1). These results are interesting because with the replacement of brown sugar in variable 1, one would expect it have a lighter product than variable 2, which has brown sugar. It does make sense overall that both variables had higher L values than the control because the cakey texture provided by agave nectar and being baked for the same amount of time at the same temperature as the control, the product was naturally lighter. If the variables were baked at
higher temperatures for longer times, they more than likely would have had lower L values and would have made for a darker product. Taste: The hedonic scale from 1 to 9 was used to evaluate subjects’ interpretation of taste. The results for this were as expected. The average control and variable 2 rankings, 7.938 and 6.875, respectively, were higher in taste than that of variable 1, which was 6.482 (figure 4). This may be attributed to the replacement of brown sugar with agave nectar in variable 1, providing a less rich and intense flavor. The addition of brown sugar to any recipe is to provide more moisture and a richer flavor than granulated sugar can alone. The intensity of flavor in that of agave nectar is not as strong as brown sugar and therefore it may have provided a less desirable taste than the control and variable 2. Sources for error: There are a few sources for error in this project. First, the results from objective testings, specifically with the texture analyzer may have been miscalculated using the software provided. With the texture analyzer results for variable 2 being much higher than expected compared to the control and variable 1, the results could not be compared and interpreted very well regarding texture interpretations of overall subjective results and instead, there had to be a bigger reliance on the results from the water activity system. Second, the three variables were not all baked at the same time due to only have 2 group members and trying to work for efficiency of time. Had they have been baked together, the texture may have differed slightly. Furthermore, a decrease in liquids, such as oils were not taken into account in an attempt to avoid confounding variables but this could have played a part in the moisture levels of the variables being much higher than the control and the cakey texture. Lastly, for some of the objective evaluations, different samples of each variable were used for some testings, such as for the water activity system and the colorimeter, which could have provided very different results for each trial because a corner piece of a baked good would have less water activity than a center piece and it may also be darker compared to a center piece. To avoid this source of error while being able to provide uniformity of samples for each variable, the samples tested did not vary greatly in texture or color from one another. Take Home Message: The experiment measured the effect of using agave nectar as a sugar substitute and the null hypothesis was incorrect. On average subjects seemed to like the control group the best and texture seems to be related to perceived taste. It appears that low water activity results in a more desirable product. Though agave nectar may have nutritional benefits that make it more appealing than conventional sugars, a specific recipe may need to be derived for agave nectar as the main sugar in baked goods in order to make sure that it is not only nutritionally beneficial, but desirable to consume.

Results: Objective results
Table 1: Colorimeter Values
L a b
Control Sample 1 29 13.07 17.94 Sample 2 26.39 13.97 19.99 Sample 3 25.59 14.5 21.78 Average 26.89 13.845 19.9
Standard Dev 1.78 0.723 1.92
Variable 1 Sample 1 29.14 14.43 24.59 Sample 2 28.45 14.41 24.88 Sample 3 29.4 14.96 25.79 Average 28.99 14.6 25.09
Standard Dev 0.491 0.312 0.626
Variable 2 Sample 1 37.91 6.76 8.53 Sample 2 33.16 10.8 14.3 Sample 3 29.53 13.51 20.87 Average 33.53 10.36 14.57
Standard Dev 4.202 3.397 6.174
0
0.1
0.2
0.3
0.4
0.5
0.6
0.7
0.8
0.9
1
Control Variable 1 Variable 2
Water Activity (Aw)
Water Activity Values
Aw
Table 2: Water Activity Values
(Figure 1 clearly shows the differences in water activity between the control and 2 variables.)
Aw Control Sample 1 0.589 Sample 2 0.574 Sample 3 0.584 Average 0.582
Standard Dev 0.008
Variable 1 Sample 1 0.767 Sample 2 0.761 Sample 3 0.759 Average 0.762
Standard Dev 0.004
Variable 2
Sample 1 0.917 Sample 2 0.915 Sample 3 0.911 Average 0.914
Standard Dev 0.003
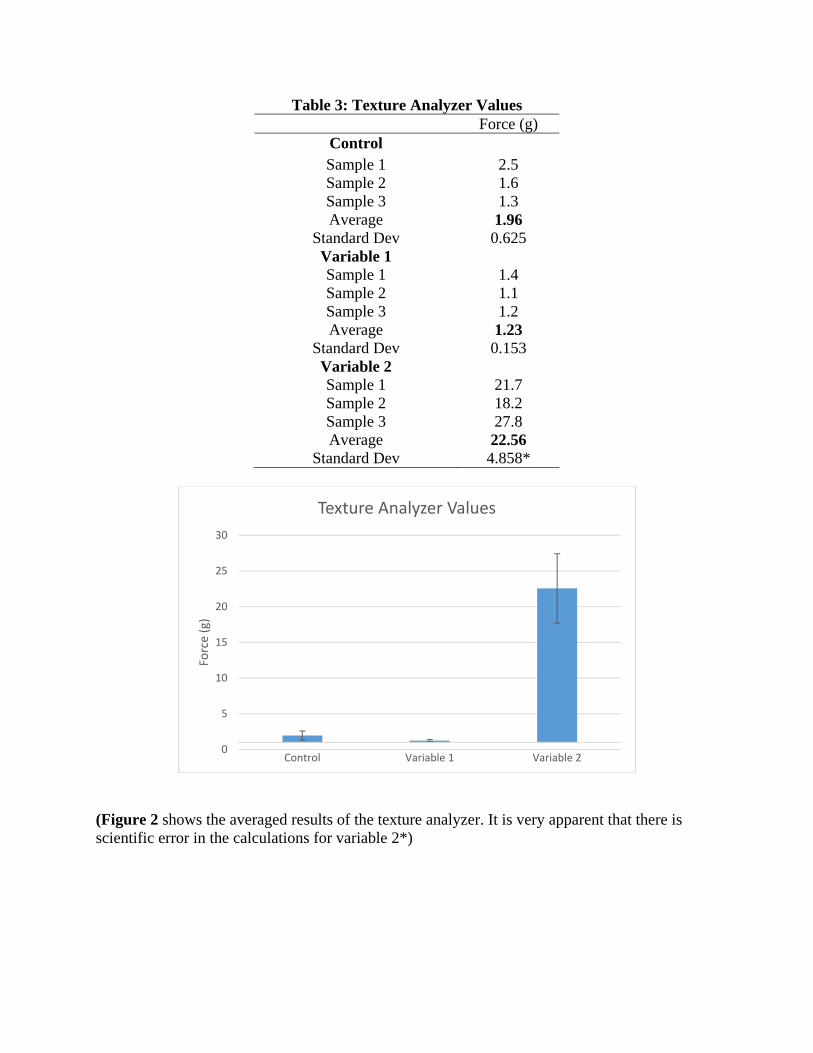
Table 3: Texture Analyzer Values Force (g)
Control Sample 1 2.5 Sample 2 1.6 Sample 3 1.3 Average 1.96
Standard Dev 0.625 Variable 1 Sample 1 1.4 Sample 2 1.1 Sample 3 1.2 Average 1.23
Standard Dev 0.153 Variable 2 Sample 1 21.7 Sample 2 18.2 Sample 3 27.8 Average 22.56
Standard Dev 4.858*
(Figure 2 shows the averaged results of the texture analyzer. It is very apparent that there is scientific error in the calculations for variable 2*)
0
5
10
15
20
25
30
Control Variable 1 Variable 2
Force (g)
Texture Analyzer Values

0
1
2
3
4
5
6
7
8
9
10
Control Variable 1 Variable 2
Hed
onic Scale Averages
Texture Desirability
Subjective Results Table 4: 9-point hedonic scale for texture preferences (9=most desirable, 1= least) desirable)
(Figur
e 3 represents the averages of texture desirability for the control and variable groups. It is clear that the control and variable 2 are closely similar in texture likeability compared to variable 1.)
Subjects Control: 731 Variable 1: 524 Variable 2: 849 1 9 6 8 2 4 4 6 3 9 5 7 4 6 7 9 5 9 5 8 6 9 5 8 7 8 6 5 8 6 5 6 9 4 6 5 10 9 5 6 11 9 7 6 12 5 8 6 13 2 7 9 14 8 5 6 15 9 6 5 16 3 7 9 Avg.: 6.813 Avg.: 5.875 Avg.: 6.813
Subjects Control: 731 Variable 1: 524 Variable 2: 849 1 9 6 8 2 8 7 3 3 9 5 7 4 8 7 9 5 9 5 8 6 9 5 8 7 8 8 3 8 9 8 8 9 6 6 7 10 9 8 8 11 9 7 6 12 4 8 6 13 6 5 8 14 9 5 7 15 9 9 5 16 6 4 9

Table 5: 9-point hedonic scale for taste prefer
ences (9=most desirable, 1= least desirable)
(Figure 4 represents the averages of taste desirability for the control group. It is apparent that the subjects on average preferred the control to the variables for taste)
Table 6: Overall likeability ranking-(most desirable (1) to least desirable (3))
0
1
2
3
4
5
6
7
8
9
10
Control Variable 1 Variable 2
Hed
onic Scale Averages
Taste Desirability
Avg.: 7.938 Avg.: 6.438 Avg.: 6.875
Subjects Control: 731 Variable 1: 524 Variable 2: 849

(Figure 5 represents overall average desirability of the control group and two variables. The control was ranked the highest amongst the three.)
References
Myrecipes.com. 2005. Snickerdoodle Bars. Available from: http://www.myrecipes.com/recipe/snickerdoodle-bars-10000001875126/. Accessed 2014 September 30.
The Wall Street Journal. 2009. Agave Syrup May Not Be So Simple. Available from: http://online.wsj.com/news/articles/SB10001424052748704335904574497622806733800?mg=rren64-wsj&url=http%3A%2F%2Fonline.wsj.com%2Farticle%2FSB10001424052748704335904574491000142405274.html. Accessed 2014 September 24.
All About Agave. Where Does Agave Nectar Come From? Available from: http://www.allaboutagave.com/index.php. Accessed 2014 September 21.
The science of Food and Cooking. Why Foods Browns. Available from: http://www.edinformatics.com/math_science/science_of_cooking/maillard_reaction.htm. Accessed 2014 September 24.
0
0.5
1
1.5
2
2.5
3
Co
Average Rankings
1 1 3 2 2 3 2 1 3 1 2 3 4 3 2 1 5 1 3 2 6 1 3 2 7 1 2 3 8 1 3 2 9 3 2 1 10 1 3 2 11 1 2 3 12 3 1 2 13 3 2 1 14 1 3 2 15 1 2 3 16 3 2 1 Avg.: 1.75 Avg.: 2.31 Avg.: 1.94
Frequently Asked Questions. 2011. Domino. Available from: http://www.dominosugar.com/products/agave/cooking-with-agave-nectar.html. Accessed 2014 November 3.
Phillips Katherine M., Carlsen Monica H., Blomhoff Rune. 2008. Total Antioxidant Content of Alternatives to Refined Sugar. J ADA. 109(1): 64-71
Appendix. Visuals of the control and variable products after baking
Figure 1- Control (731)

Figure 2- Variable 1 (524)
Figure 3- Variable 2 (849)